Embed Size (px)
Citation preview
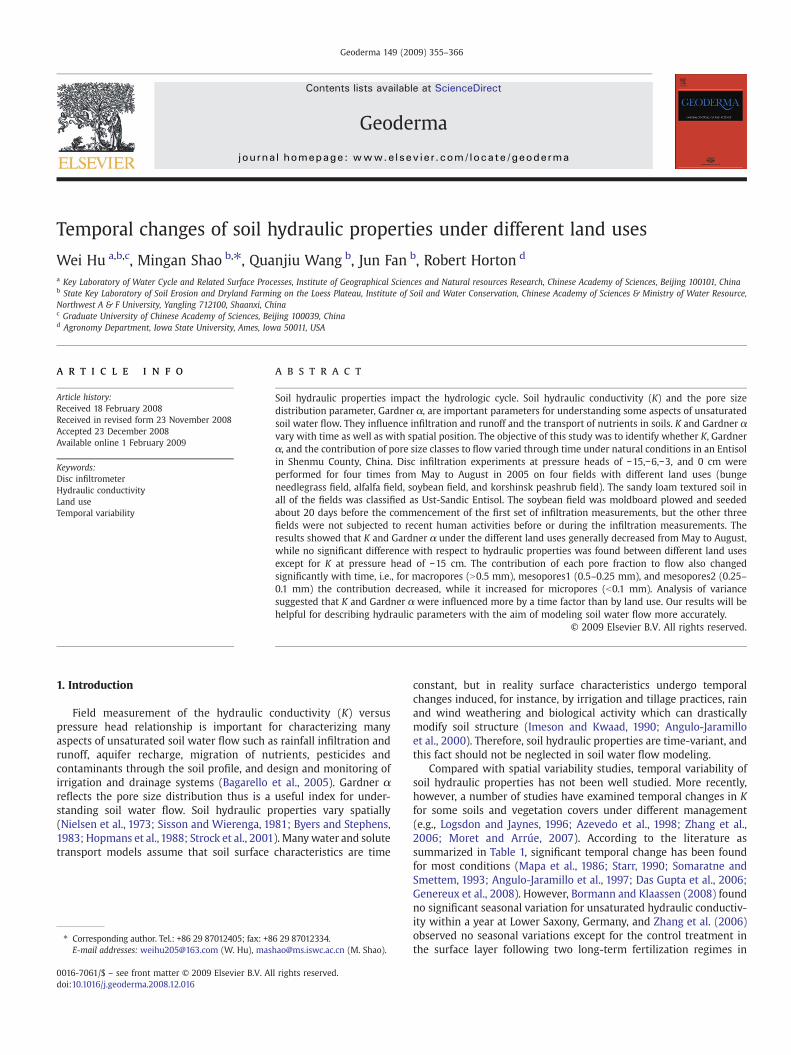
Geoderma 149 (2009) 355–366
Contents lists available at ScienceDirect
Geoderma
j ourna l homepage: www.e lsev ie r.com/ locate /geoderma
Temporal changes of soil hydraulic properties under different land uses
Wei Hu a,b,c, Mingan Shao b,⁎, Quanjiu Wang b, Jun Fan b, Robert Horton d
a Key Laboratory of Water Cycle and Related Surface Processes, Institute of Geographical Sciences and Natural resources Research, Chinese Academy of Sciences, Beijing 100101, Chinab State Key Laboratory of Soil Erosion and Dryland Farming on the Loess Plateau, Institute of Soil and Water Conservation, Chinese Academy of Sciences & Ministry of Water Resource,Northwest A & F University, Yangling 712100, Shaanxi, Chinac Graduate University of Chinese Academy of Sciences, Beijing 100039, Chinad Agronomy Department, Iowa State University, Ames, Iowa 50011, USA
⁎ Corresponding author. Tel.: +86 29 87012405; fax: +8E-mail addresses: [email protected] (W. Hu), mas
0016-7061/$ – see front matter © 2009 Elsevier B.V. Aldoi:10.1016/j.geoderma.2008.12.016
a b s t r a c t
a r t i c l e i n f oArticle history:
Soil hydraulic properties im Received 18 February 2008Received in revised form 23 November 2008Accepted 23 December 2008Available online 1 February 2009Keywords:Disc infiltrometerHydraulic conductivityLand useTemporal variability
pact the hydrologic cycle. Soil hydraulic conductivity (K) and the pore sizedistribution parameter, Gardner α, are important parameters for understanding some aspects of unsaturatedsoil water flow. They influence infiltration and runoff and the transport of nutrients in soils. K and Gardner αvary with time as well as with spatial position. The objective of this study was to identify whether K, Gardnerα, and the contribution of pore size classes to flow varied through time under natural conditions in an Entisolin Shenmu County, China. Disc infiltration experiments at pressure heads of −15,−6,−3, and 0 cm wereperformed for four times from May to August in 2005 on four fields with different land uses (bungeneedlegrass field, alfalfa field, soybean field, and korshinsk peashrub field). The sandy loam textured soil inall of the fields was classified as Ust-Sandic Entisol. The soybean field was moldboard plowed and seededabout 20 days before the commencement of the first set of infiltration measurements, but the other threefields were not subjected to recent human activities before or during the infiltration measurements. Theresults showed that K and Gardner α under the different land uses generally decreased from May to August,while no significant difference with respect to hydraulic properties was found between different land usesexcept for K at pressure head of −15 cm. The contribution of each pore fraction to flow also changedsignificantly with time, i.e., for macropores (N0.5 mm), mesopores1 (0.5–0.25 mm), and mesopores2 (0.25–0.1 mm) the contribution decreased, while it increased for micropores (b0.1 mm). Analysis of variancesuggested that K and Gardner α were influenced more by a time factor than by land use. Our results will behelpful for describing hydraulic parameters with the aim of modeling soil water flow more accurately.
© 2009 Elsevier B.V. All rights reserved.
1. Introduction
Field measurement of the hydraulic conductivity (K) versuspressure head relationship is important for characterizing manyaspects of unsaturated soil water flow such as rainfall infiltration andrunoff, aquifer recharge, migration of nutrients, pesticides andcontaminants through the soil profile, and design and monitoring ofirrigation and drainage systems (Bagarello et al., 2005). Gardner αreflects the pore size distribution thus is a useful index for under-standing soil water flow. Soil hydraulic properties vary spatially(Nielsen et al., 1973; Sisson and Wierenga, 1981; Byers and Stephens,1983; Hopmans et al., 1988; Strock et al., 2001). Many water and solutetransport models assume that soil surface characteristics are time
6 29 [email protected] (M. Shao).
l rights reserved.
constant, but in reality surface characteristics undergo temporalchanges induced, for instance, by irrigation and tillage practices, rainand wind weathering and biological activity which can drasticallymodify soil structure (Imeson and Kwaad, 1990; Angulo-Jaramilloet al., 2000). Therefore, soil hydraulic properties are time-variant, andthis fact should not be neglected in soil water flow modeling.
Compared with spatial variability studies, temporal variability ofsoil hydraulic properties has not been well studied. More recently,however, a number of studies have examined temporal changes in Kfor some soils and vegetation covers under different management(e.g., Logsdon and Jaynes, 1996; Azevedo et al., 1998; Zhang et al.,2006; Moret and Arrúe, 2007). According to the literature assummarized in Table 1, significant temporal change has been foundfor most conditions (Mapa et al., 1986; Starr, 1990; Somaratne andSmettem, 1993; Angulo-Jaramillo et al., 1997; Das Gupta et al., 2006;Genereux et al., 2008). However, Bormann and Klaassen (2008) foundno significant seasonal variation for unsaturated hydraulic conductiv-ity within a year at Lower Saxony, Germany, and Zhang et al. (2006)observed no seasonal variations except for the control treatment inthe surface layer following two long-term fertilization regimes in

Table 1Summary of temporal changes of hydraulic conductivity
Site Soil Study depth Sampling frequency Surface cover/land use
Managementtreatmenta
Measurementtechniqueb
Temporal changeb References
Oahu, HI A typic torrox and avertic haplustoll
Surface Measurements madefollowing successivewetting/drying cycle
Sugarcane MP, Drip irrigation Simplified drainage fluxmethod
K near saturation decreased 100-foldwith wetting and drying after tillage
Mapa et al.(1986)
Maryland, USA A Delanco silt loam Surface Eight sets in a growingseason
Corn, rye CT and PT Double-ring-typeinfiltrometer
Systematic changes (early season),constant(mid-season), increase(post-season)
Starr (1990)
South Dakota, USA A well drained Beadleand a poorly drainedWorthing
Surface One sets for each oftwo years
Corn, soybean MP,CP,RT1,NT continuouscorn and corn/soybeanrotations
Constant head An increase in Ks of RT and NTsystems in Beadle soil and an increasein Ks in the Worthing soil in year 3compared with year 2
Khakural et al.(1992)
Kapunda, SouthAustralia
Alfisol with sandy loamtextured
Surface Two sets at pre-seedingand post-harvest
Wheat CT, DD Tension infiltrometer Significant drop of K at −20 ratherthan −40 mm under simulatedraindrop impact
Somaratne andSmettem (1993)
South-easternAustralia
Red-brown earths(palexeralfs), a redearth (haploxeralf)
Surface Four or five sets in eachgrowing period of 3 years
Wheat, field peas DD,CT Tension infiltrometer K varied significantly through thegrowing season, with general trendof decrease then increase withthe turning point of tillering period
Murphy et al.(1993)
Iowa, USA Canisteo silty clay loam Surface Seven sets in 1990,threeand seven sets for NT andCP, respectively in 1991
Corn CP, NT Single-ring infiltrometer Kept constant for NT and TRK andUNT positions for CP, infiltration ratesincreased steadily at BPIR and OPIRpositions for CP
Prieksat et al.(1994)
Iowa, USA Fine loam Surface Four sets during one anda half growing seasons
Corn-soybeanrotation
Cultivation Automated ponded andtension infiltrometer
Post-cultivation blate-seasonN pre-diskbpost-disk except for K at −150 mm
Logsdon andJaynes (1996)
Jokioinen andMouhijärvi, Finland
A clay and an organicsoil and a loam soil
0–0.21 m, 0.21–0.41 m, 0.41–0.55 m
One set made after9 years of compaction
Spring cereals Compaction with one orfour pass or no compaction
Constant head Ks decreased by 60–98% in 0.4–0.55 munder the effects of compaction after9 years
Alakukku (1996)
Coria del Rio, Spain,Côte Saint André,France
A sandy soil (Xerochrept),a heterogeneous, stony,and sandy soil (Alfisol)
Surface Two sets at plantemergence and priorto harvest
Maize CT and irrigation (furrowand gun irrigation)
Tension infiltrometer Significant decrease for sandy soil andno significant decrease for stony soil
Angulo-Jaramilloet al. (1997)
Iowa, USA Nicollet loam,a fine-loamy, mixed,mesic Aquic Hapludoll
Surface and0.15 m depth
Three sets during agrowing season (7,8,9)
Corn NT with and withoutcultivation
Tension infiltrometer For cultivated: surface K kept constantthen increased
Azevedo et al.(1998)
For uncultivated plots: surface Kincreased
356W.H
uet
al./Geoderm
a149
(2009)355
–366

Southern Italy Vertic soil with sandyclay textured
0.2 m and 0.4 m Sampling monthly orlonger interval during2 years
Vegetable Ploughed, untilled Single ring infiltrometer Ks increased after ploughing, suchincrement decreased with time
Ciollaro andLamaddalena(1998)
New South Wales,Australia
Red Kandosol Surface Eight sets from June toOctober
Wheat, lupins,triticale
Main: CT, RT2, DD Sub: lime CSIRO disc permeameter Ks: decreased first and then increased Suwardji andEberbach (1998)K at −40 mm: decreased
Northwestern France Loam Surface Three sets in a year Maize Cultivation, wheelcompation
Tension infiltrometer K decreased during a year at all tensions Heddadj andGascuel-Odoux(1999)
Shaanxi, China Eumorthic Anthrosolswith Siltloam textured
0–5 cm Four sets in one year Winter wheat,summer maize
C, NPK, MNPK Ks: Constant head No seasonal variations except for thecontrol treatment in the surface layer
Zhang et al.(2006)10–15 cm Ku: Hot air
Shaanxi, China Calcareous loam 0–20 cm, 20–40 cm
One sets for eachvegetation restorationstage
Different coverfor differentstages
NO Constant head Ks generally increased with vegetationrecovery time
Li and Shao(2006)
Texas, USA Clay-dominatedbiporous Vertisol
Surface Twelve sets during a21-mo period
Bermuda grassand bunchgrass
NO Tension infiltrometer Strong temporal variation, hydraulicconductivities close to saturation werepositively correlated with antecedentmoisture conditions
Das Gupta et al.(2006)
Zaragoza, NE Spain Fine-loamy, mixedthermic XerollicCalciorthid
1–10 cm Four sets in one year Long-fallowphase
CT, RT1, NT Tension infiltrometer Tillage significantly increased K, soilreconsolidation following post-tillagerains reduced K
Moret and Arrúe(2007)
Lower Saxony,Germany
Podzol and Stagnosol Topsoil(15–25 cm) subsoil(40–60 cm)
Four sets within a year Grassland, crops(maize) andforest
Grass cut, tillage Ks: Constant head No significant seasonal difference of Ksfor topsoil at the 5% probability, nosignificant seasonal variation for Ku
Bormann andKlaassen (2008)Ku: Ku-pF apparatus
Denmark Sandy loam soil Four layer(0–60 cm)
Three sets correspondingto 1, 8, and 32 monthsafter ploughing
Barley, wheat,grass
Cultivation ICW Ks in the vertical and the horizontaldirections generally decreased with time
Petersen et al.(2008)Laboratory permeameter
(constant and fallinghead combined)
North Carolina, USA Ultisols (81%) andInceptisols (13%) forthat watershed
0–36 cm Seven sets within onemonth
NO NO Field permeameter Significant temporal change Genereux et al.(2008)
Pennsylvania, USA Glenelg, Hagerstown,Joanna, and Morrison
Surface Four sets during Mayand October from 2004to 2006
Woodland,cropland,pasture, urban
NO Tension infiltrometer A higher K in May than in October forcropland, pasture, and urban
Zhou et al.(2008)
a MP=moldboard plow; CT=conventional tillage; PT=plough tillage; CP=chisel plow; RT1=ridge till; NT=no tillage; DD=direct drilling; RT2=reduced tillage; C=control without any fertilizer; NPK=applications of chemical fertilizer;MNPK=application of chemical fertilizer plus dairy manure.
b K=hydraulic conductivity; Ks=saturated hydraulic conductivity; Ku=unsaturated hydraulic conductivity; TRK=center of a trafficked interrow; UNT=center of an untrafficked interrow; BPIR=between corn plants in a row; OPIR=directlyover the base of a plant in a row.
357W.H
uet
al./Geoderm
a149
(2009)355
–366

Table 2General soil characteristics of the top 5 cm soil layer for four land use
Land use Particle size (%) Organic mattercontent (g kg−1)b0.002 mm 0.002–
0.02 mm0.02–1 mm
Bunge needlegrass field 5 18 77 5.8Alfalfa field 6 21 73 5.2Soybean field 4 18 78 4.2Korshinsk peashrub field 3 16 81 4.7
358 W. Hu et al. / Geoderma 149 (2009) 355–366
China. Most previous studies focused on fields closely associated withhuman practices such as tillage, irrigation, and fertilization. The typeof land use involved was generally farmland during one certaingrowing season. In addition, although significant temporal changes ofhydraulic conductivities were found inmany places, conflicting resultswere obtained. With time elapse, either decrease (Mapa et al., 1986;Alakukku, 1996), increase (Khakural et al., 1992; Ciollaro andLamaddalena, 1998), no systematic change (Starr, 1990; Logsdon andJaynes, 1996) or no changes (Zhang et al., 2006; Bormann andKlaassen, 2008) of K were reported. Therefore, more data are neededon the temporal change of K on soils with different environmentalbackground, especially under natural conditions with different landuses.
On the Loess Plateau in China, hydrological and soil erosionmodeling is very important because of the frequent occurrence ofserious soil erosion. Therefore, soil hydraulic properties not only inspace but also in time are necessary because of the sensitivity of soilerosion models to soil hydraulic properties (Merz and Plate, 1997;Herbst and Diekkrüger, 2002).
Field evidence identifies the existence of macropores hencepreferential flow in soils (Larson and Jarvis, 1999). In a given soil,the temporal change of hydraulic conductivity tend to be followedmainly by the changes of soil structure as affected by biologicalactivities (Suwardji and Eberbach, 1998), soil settlement (Petersenet al., 2008), soil and erosion processes (Genereux et al., 2008), andcompaction (Alakukku, 1996). Simultaneously, the contribution ofpore size classes to water flow may change accordingly. Obviously,knowledge of changing pore class contributions to water flow withtime would better facilitate the understanding of underlying reasonsfor temporal changes in K. Unfortunately, most studies concerningtemporal changes of K did not refer to the pore size contribution towater flow in soil when they presented explanations for the temporalchanges of K.
Tension infiltrometers are widely used for measuring near-saturated K in the field (Perroux and White, 1988). Compared withother methods, the disc infiltrometer method is simple to use, andit consistently provides reliable values of K at known locations inorder to characterize relatively larger areas (Reynolds, 1993). Inaddition, the tension infiltrometer technique holds considerablepromise as a means of measuring K at various pressure heads nearsaturation hence characterizing water transmission in soil macro-pores and mesopores.
A large number of techniques are available for analyzing discinfiltration data (White and Sully, 1987; Ankeny et al., 1988; Smettemand Clothier, 1989; Ankeny et al., 1991). Each method has its ownadvantages and disadvantages. Logsdon and Jaynes (1993) and Hussenand Warrick (1993) suggested that multi-tensions with nonlinearregression based on theWooding (1968) equation gave fast and stableresults, and did not give any negative values compared to othermethods. Furthermore, the nonlinear regression method does notrequire knowledge of soil moisture data. The method also determinesthe pore size distribution parameter. Therefore, multi-tension discinfiltration data analyzed with the nonlinear regression method areuseful for characterizing spatial and temporal variability of soilhydraulic properties.
The objectives of this study were, (1) to analyze temporal changesof K and Gardner α for different types of land use, (2) to identify thepossible concomitant change of relative contribution to flow for eachclass of pore size, including macropores (N0.5 mm in diameter),mesopores1 (0.5–0.25 mm), mesopores2 (0.25–0.1 mm), and micro-pores (b0.1 mm). The study focused on four land uses, needlegrass(Stipa bungeana Trin.), korshinsk peashrub (Caragana Korshinskiikom.), alfalfa (Medicago sativa L.), and soybean (Glycine max(Linn.)Merr.). In each field, disc infiltration measurements with multi-pressure heads of 0, −3, −6, and −15 cm were obtained at four timesfrom May to August in 2005.
2. Materials and methods
2.1. Field site description
This study was conducted at Liudaogou watershed located inShenmu County, Shaanxi Province, China (longitude 110°21′ to110°23′ E and latitude 38°46′ to 38°51′ N). This area has a deep (upto 100 m) loess layer, which originated during the Quaternary period.The dominant soil (cultivated loessial soil), is a Ust-Sandic Entisol,which is loess-derived and therefore easily eroded (Tang et al., 1993).The soil particle size and organicmatter content of the top 5 cm for thefour land uses are given in Table 2. Particle size distributions for thefields of bunge needlegrass, alfalfa, soybean, and korshinsk peashrubwere similar, with 3–6% of particles less than 0.002 mm, 16–21% ofparticles between 0.002 and 0.02 mm, and 73–81% of particles largerthan 0.02 mm. Soil at these sites was classified as sandy loamaccording to the international standard. Soil organic matter contentwas 5.8 g kg−1 (bunge needlegrass field), 5.2 g kg−1 (alfalfa field), 4.2 gkg−1 (soybean field), and 4.7 g kg−1 (korshinsk peashrub field),respectively. Mean annual precipitation for Liudaogou watershed is437 mm, nearly half of which is received from June to September. Thepotential evapotranspiration is 785 mm, with a mean aridity index of1.8 and annual temperature of 8.4 °C, belonging to moderate–temperate and semi-arid zones. The rainfall and mean daily airtemperature during the infiltration period are shown in Fig. 1.
On a hilltop with about 1° slope, disc infiltration measurementswere made on fields with four different land uses. The area for eachfield was about 100 m2. The criteria for selecting these four fieldswere the close spatial arrangement of the fields and the types of landuses represented in the fields. Therefore, all of the fields were closelyspaced with the korshinsk peashrub, being the most distant, 30 maway from the others. Each field has its own dominant species asdescribed above. Bunge needlegrass is a perennial herb, which caneasily invade an alfalfa field after the aging and degradation ofalfalfa. For this particular bunge needlegrass field, the alfalfa had agrowth duration of 20 years and it had been totally replaced. Alfalfais a perennial plant grown for livestock feed. For the alfalfa field, thealfalfa had a growth duration of 3 years, and it was the dominantspecies for this field. The soybean field had been moldboard plowedto a depth of about 20 cm just before being planted in early May2005. During the disc infiltration measurement period, soybeanunderwent planting to fruit-bearing, with vegetation coverageranging from 5%–70%. Korshinsk peashrub, being a dominantperennial shrub species in the ecosystem of the Korshinsk peashrubfield, had a growth duration of 20 years. Vegetation coverage ofbunge needlegrass, Korshinsk peashrub, and alfalfa for the infiltra-tion period was about 45%, 60%, and 70%, respectively. It should benoted that for bunge needlegrass field, Korshinsk peashrub field, andalfalfa field, management activities were adopted only at the seeding(moldboard plow and alfalfa seeding)or planting (korshinsk peash-rub planting with no tillage) period followed by alfalfa cutoff one ortwo times a year by a local farmer. In the year 2005, alfalfa was notcut until the completion of our infiltration measurement. Therefore,three of the fields were less affected by human activity than was thesoybean field.

Fig. 1. Precipitation and mean daily air temperature during the infiltration measurement period. Also marked is the first date of each infiltration measurement set.
359W. Hu et al. / Geoderma 149 (2009) 355–366
2.2. Sampling and measurements
Considering the possibility of hydraulic properties changing due torainfall and plant development, four sets of disc infiltration measure-ments were made in each land use field during May to August 2005.Each measurement set was completed within four days, taking oneday for each land use field. Measurement dates for the bungeneedlegrass field were May 23, June 12, July 6, and August 25,respectively. Measurement dates for the other fields lagged orderlywith the sequence of alfalfa, soybean, and korshinsk peashrub.
For each date and land use, six replicate sequences of infiltrationrates were performed. At each infiltration location, a disc infiltrometersimilar to those described by Ankeny et al. (1988) (50 mm radius witha reservoir tube radius of 1.7 cm) was used to determine infiltrationunder different applied pressure heads in the ascending sequence(−15, −6, −3, 0 cm).
The six measurement locations were spaced in a grid pattern,2×3 with 5 m apart for each pair of neighboring points, within anarea of 50 m2, and the exact infiltration sites were located on baresoil surfaces between the associated dominant vegetation. For thefirst set of infiltration measurements, preparation of an unsmearedcleared soil surface was achieved by using a knife and removing the1–2 mm depth of loose soil. The bare soil was covered with a cloth(with 20 um mesh), and a fine layer (about 1 mm) of sand (about100 um grain size) was placed on the cloth to ensure good hydrauliccontact between the disc and the soil. After the first infiltration setwas completed, the sand layer and cloth were gently removed. Eachinfiltration site was surrounded by a top-open wire netting (adiameter of 40 cm and a height of 20 cm) by inserting it to a depth of2 cm. The following infiltration measurements were made at thesame locations to avoid spatial variability. The same infiltrationprocedure was repeated for each following set of infiltrationmeasurements except there was no need again to prepare anunsmeared cleared soil surface. For each infiltration measurement,cumulative infiltration was recorded every one minute until steadyinfiltration occurred. The non-linear regression method (Logsdonand Jaynes, 1993) based upon the theoretical analysis of the 3Dquasi-steady- state water flux under the infiltrometer (Wooding,1968) was used to calculate soil K and Gardner α. The fittingequation can be written as:
Qx hf� �
πR2 = Ks exp αhð Þ + 4Ks exp αhð Þ½ �πRα
ð1Þ
where, Qx(hf) is the steady infiltration rate (L3 T−1) under pressurehead of hf (-cm), R is the radius of the disc infiltrometer (L), α is theGardner constant which characterizes soil pore size distribution (L−1),and Ks is the saturated hydraulic conductivity (L T−1).
With Ks and α, hydraulic conductivity K(hf) under another pressurehead hf can be derived by the Gardner exponential function writtenas:
K hf� �
= Ks exp αhð Þ ð2Þ
For the purposes of this paper, K at applied pressure heads of −15,−6, −3, 0 cm are written as K15, K6, K3, Ks, and the dates for fourmeasurement sets are expressed as May, June, July, and August.
According to capillary theory, infiltration at pressure heads of −3,−6, and −15 cm of water will exclude pores of equivalent radiusgreater than 0.5, 0.25 and 0.1 mm, respectively, from the flow process.Therefore, four classes of pore ranges were defined: pores withequivalent radius greater than 0.5 mm (macropores), between 0.5 and0.25mm (mesopores 1), between 0.25 and 0.1mm (mesopores 2), andsmaller than 0.1 mm (micropores).The contribution of each pore classto the total infiltration flow, φ(%)can be expressed as (Watson andLuxmoore, 1986):
ui kð Þ = K hf� �
−K hf−1� �
Ks×100; f = 1; N ;n ð3Þ
where n is the number of measurements performed in a sequence, hthe pressure head (L), K(hf) and K(hf −1) the hydraulic conductivities(L T−1) obtained for two consecutive pressure heads, and Ks thesaturated hydraulic conductivity (L T−1).
During the infiltration periods, bulk density and initial volumetricsoil moisture for the surface 6 cm layer was determined for eachmeasurement location, and the exact position for every measure-ment was selected within 50 cm away from the center of the discinfiltration position where no obvious disturbance occurred. Bulkdensity was determined gravimetrically for the top 5 cm layer, andinitial volumetric soil moisture was measured by FDR with probelength of 6 cm (Frequency Domain Reflectometry, relative error wasless than 5% with field calibration). Following infiltration measure-ments surface soil samples (5 cm long and 5 cm diameter) werecollected from adjacent sites. Samples were air-dried beforelaboratory analysis. Soil particle size analysis was performed with aMasterSizer 2000 laser particle size analyzer produced by Malvern.

Fig. 2. Initial soil water content of the top 6 cm soil layer for each infiltration measurement set.
360 W. Hu et al. / Geoderma 149 (2009) 355–366
Soil organic matter content was determined using the potassiumdichromate method.
For the present study, analysis of variance (ANOVA) and Post HocTests (using LSD when equal variance occurred and Tamhane's T2when equal variance did not occur) was used to analyze the differenceof hydraulic properties among different land uses and times. Multi-variate analysis was adopted to identify the relative contributions ofland use and time to K and Gardner α. Statistical software used wasSPSS 13.0.
3. Results
3.1. Temporal changes of basic soil properties
Initial soil moisture and bulk density may influence waterinfiltration rates, hence K and Gardner α. It is important to understandthese basic properties within different land use areas and measure-ment dates. Figs. 2 and 3 show initial surface volumetric water contentand soil dry bulk density, respectively. No obvious trends existed forwater content. For the soybean field after tillage, the soil graduallycompacted due to natural reconsolidation by gravity and raindropimpact. Thus, the soil bulk density of the soybean field increasedduring the study. The changes in bulk density during the infiltration
Fig. 3. Dry bulk density of top 5 cm soil laye
period for the other three land uses may be attributed to the spatialvariability between different sampling locations. For initial soilmoisture, the differences amongmeasurement dates can be attributedto the combined influence of spatial variability and rainfall.
3.2. Soil hydraulic conductivity and Gardner α for different types of landuse
Q–Qplots indicated that normal distributions could describe data setsof K and Gardner α(data not shown). Therefore, no data transformationswere necessary before performing statistical analyses. Table 3 sum-marizes the statistical parameters of the data sets of K and Gardner α forvarious land uses. For each land use, K decreased with decreasingpressure head. Average Ks, K3, K6, K15 of land use and time ranged from1.7 to 9.9×10⁻² cm min−1, 1.6 to 7.8×10⁻² cm min−1, 1.4 to 6.2×10⁻² cmmin−1,1.0 to 3.6×10⁻² cmmin−1, respectively. The coefficient of variation(CV) was related to the spatial variability of the hydraulic properties. Forall of the hydraulic conductivities considered, the CV ranged from 8.5% to55.4%, indicating weak tomoderate variability at the field scale. For mostof the measurement sets, the K variability tended to decrease withdecreasing pressure heads. The Gardner α ranged from 3.0 to 7.7 cm−1,and it showed weak to moderate variability (with CV of 11.1% to 59.0%).For all of the land uses, average K for all the measurement data sets
r for each infiltration measurement set.

Table 3Hydraulic conductivity and Gardner α for different land uses at different times
Bunge needlegrass field Alfalfa field Soybean field Korshinsk peashrub field
Ave Max Min CV% Ave Max Min CV% Ave Max Min CV% Ave Max Min CV%
MayKs 6.2 6.8 5.3 9.9 6.6 11.1 2.3 55.4 6.8 8.9 4.6 31.9 6.5 8.0 4.8 24.3K3 5.4 6.1 4.8 9.8 5.5 8.7 2.2 50.3 5.7 7.3 4.0 29.6 5.6 6.5 4.3 20.3K6 3.3 5.6 4.6 8.6 4.6 6.4 1.9 45.0 4.4 5.9 3.0 29.8 4.3 5.2 3.1 25.4K15 3.6 4.1 3.3 10.7 2.8 4.4 1.4 43.7 2.4 3.2 1.6 28.0 2.3 2.8 1.6 27.2α 3.8 4.5 3.3 13.5 5.3 7.9 2.4 43.0 5.7 6.9 5.0 15.2 5.1 6.6 3.7 28.8
JuneKs 6.0 7.9 4.1 24.3 7.3 10.0 4.7 27.5 6.5 7.5 5.8 9.1 9.9 12.9 6.3 22.6K3 5.3 6.7 3.8 22.5 6.3 7.9 4.2 22.6 5.3 6.0 4.8 8.6 7.8 9.7 5.1 20.4K6 4.7 5.8 3.5 20.9 5.4 6.9 3.9 19.5 4.3 4.9 3.9 8.5 6.2 7.3 4.1 18.8K15 3.4 4.1 2.5 18.3 3.6 4.5 2.5 21.0 2.3 2.6 1.9 11.3 3.1 3.7 2.2 17.5α 3.8 5.3 2.5 25.8 4.7 9.2 3.1 47.5 5.3 8.0 5.9 11.1 7.7 9.5 6.7 14.2
JulyKs 5.1 6.5 2.9 27.4 5.2 8.1 2.7 37.6 3.5 5.4 1.7 36.8 5.5 7.2 3.9 21.8K3 4.5 5.6 2.6 25.4 4.6 7.1 2.5 34.4 3.1 4.7 1.6 35.3 4.7 6.1 3.4 20.1K6 3.9 4.9 2.4 23.7 4.1 6.3 2.4 31.9 2.8 4.2 1.5 33.8 4.1 5.2 2.9 18.6K15 2.7 3.3 1.8 20.3 2.9 4.3 2.0 28.7 2.0 2.9 1.2 29.2 2.6 3.2 1.9 16.3α 3.1 6.0 3.1 27.2 3.7 7.3 2.1 52.4 3.4 4.1 2.2 20.6 4.9 6.2 3.8 18.3
AugKs 2.4 4.0 1.3 44.6 3.4 4.1 2.6 16.2 3.1 4.6 1.6 36.1 1.7 3.5 0.9 52.1K3 2.1 3.3 1.2 42.0 3.1 3.6 2.4 17.4 2.8 4.1 1.5 33.3 1.6 3.0 0.9 47.1K6 1.9 2.8 1.1 39.5 2.8 3.3 2.1 20.0 2.5 3.6 1.5 30.5 1.4 2.6 0.9 42.1K15 1.4 1.7 0.8 32.6 2.0 2.6 1.0 30.2 1.9 2.5 1.3 22.6 1.0 1.6 0.8 28.7α 3.0 6.1 3.1 22.7 3.7 7.8 2.1 59.0 3.1 4.7 1.6 35.7 3.0 5.2 1.3 47.9
361W. Hu et al. / Geoderma 149 (2009) 355–366
increasedbynomore than2 times aspressureheads increased from−3 to0 cm. This increasewasmuch less than the increases previously reportedbyothers (e.g., Clothier andSmettem,1990;Mohantyet al.,1997;Cameriaet al., 2003). This relatively small increase suggested that soilmacroporeswere few in number or were poorly connected in our study areas.
In order to explore the possible impacts of land use on K andGardner α, all four measurement sets were pooled together for eachland use, and then a one way ANOVA was performed. Fig. 4 showsmean K and Gardner α for the different land uses. Visually, somedifferences in K and Gardner α existed among the different land uses.However, ANOVA analysis showed that statistically significantdifferences only existed for K15 (significance level was 0.034). Resultsof Post Hoc Tests showed that significant differences only existedbetween the alfalfa field and the soybean field for K15 (significancelevel was 0.024). These analyses indicate that land use did not havesignificant impact on K and Gardner α in this study area.
Fig. 4. Comparison of soil hydraulic conductivity and Gardner α u
3.3. Temporal changes of soil hydraulic conductivity and Gardner α fordifferent land uses
Fig. 5 presents measured K and Gardner α values with time for thedifferent land uses. Except for the phenomenon that K was larger inJune than May for the alfalfa field and the korshinsk peashrub field,the trend of K was a general decrease from May to August. The largerthe pressure head, the more significant the trend for K. Generally,from May to August, K decreased with a factor of 1.3 to 2.2 for thesoybean field, a factor of 1.4 to 1.9 for the alfalfa field, a factor of 2.3 to2.6 for the bunge needlegrass field, and a factor of 2.3 to 3.8 for thekorshinsk peashrub field. A one way ANOVA showed that time had astatistically significant impact on K at a level b0.001 for all of the landuses except K15 of the soybean field.
Except in the korshinsk peashrub field from May to June, Gardnerα showed a slight decrease from May to August for the land uses. An
nder different types of land use (standard error is indicated).

Fig. 5. Temporal changes of soil hydraulic conductivity and Gardner α under different land uses (vertical bars represent standard error).
362 W. Hu et al. / Geoderma 149 (2009) 355–366
ANOVA showed that this change was also significant (significantlevel=0.001), indicating that the differences in K between larger andsmaller pressure heads lessened with a decrease in macropores. Thedecrease of Gardner α with time was in accord with the finding that
Fig. 6. Temporal changes of soil hydraulic conductivity and Gardner α when the data of allhydraulic property bars with the same letter do not show significant differences for Pb0.05
the decrease in saturated hydraulic conductivity was more markedthan the decrease for unsaturated hydraulic conductivity.
Because no significant difference in Gardner α and hydraulicconductivity except K15 existed among the different land uses, each K
of the land uses were pooled together. Vertical bars represent standard error. For each.

Table 4Tests of between-subjects effects with two factors of land use and time (shown in part)
Source Dependentvariable
Type III sum ofsquares
df Meansquare
F Sig.
Time Ks 0.03 3 0.010 33.407 0.000K3 0.019 3 0.006 36.359 0.000K6 0.012 3 0.004 36.280 0.000K15 0.003 3 0.001 23.575 0.000α 0.007 3 0.002 9.099 0.000
Land use Ks 0.002 3 0.001 2.200 0.095K3 0.001 3 0.000 2.008 0.119K6 0.001 3 0.000 2.141 0.102K15 0.001 3 0.000 5.391 0.002α 0.002 3 0.001 2.104 0.106
363W. Hu et al. / Geoderma 149 (2009) 355–366
and Gardner α was pooled together for each measurement set toanalyze the temporal changes of them. Themean values and their PostHoc Tests are shown in Fig. 6. For the hydraulic conductivities, exceptfor May to June for all tensions considered and June to July for the−15 cm pressure head, they all showed significant differences. For theGardner α, except for May to June and July to August, significantdifferences could also be found for all other pairs in the data set.
3.4. Relative influence of space and time on soil hydraulic conductivityand Gardner α
We have analyzed the effects of land use and time on K andGardner α. In order to evaluate the relative contributions of these twofactors on them, a multivariate analysis was performed. Significantdifferences only existed for K15 with respect to land use (Table 4).
Fig. 7. Temporal changes of contribution of each pore class to flow
However, time significantly affected all of the hydraulic conductivitiesand Gardner α. This indicated that soil hydraulic conductivities andGardner α at the study locationwere more influenced by time than byland use.
3.5. Temporal changes of contribution of each pore class to flow
Temporal changes of Kmay be mainly related to the changes in soilpore volume and geometry. Correspondingly, the contribution of eachpore class to flow may also change with time. Fig. 7 shows thetemporal changes of the contribution of four pore classes, includingmacropores (N0.5 mm), mesopores 1 (0.5–0.25 mm), mesopores2(0.25–0.1 mm), and micropores (b0.1 mm), to soil water flow for thefour land uses. For all of the land uses, the average relative proportionof the four pore classes to flow was 1(macropores): 1(mesopores1): 2(mesopores2): 4(micropores). This means that for our study area, thetotal water flow in macropores and mesopores was relatively small,accounting for only half of the total flow. With elapse of time, thetrend of proportional pore class contributions behaved similarly for allof the land uses, i.e., the contribution of macropores and mesoporesgenerally decreased, while the contribution of micropores generallyincreased. Fig. 8 shows the changes of contribution of pore sizes whenthe data for different land uses were pooled together for eachmeasurement date. On average, during the measurement period, thecontribution of macropores, mesopores1, mesopores2 monotonouslydecreased from 14.7% to 9.3%, 16.0% to 8.9%, and 28.0% to 19.9%,respectively, with the exception that the contribution of macroporesincreased slightly formMay to June. The contribution of micropores toflow monotonously increased from 41.3% to 61.9%. Post Hoc Testsshowed that except for two pairs of neighbormeasurement dates, May
for different land uses (vertical bars represent standard error).
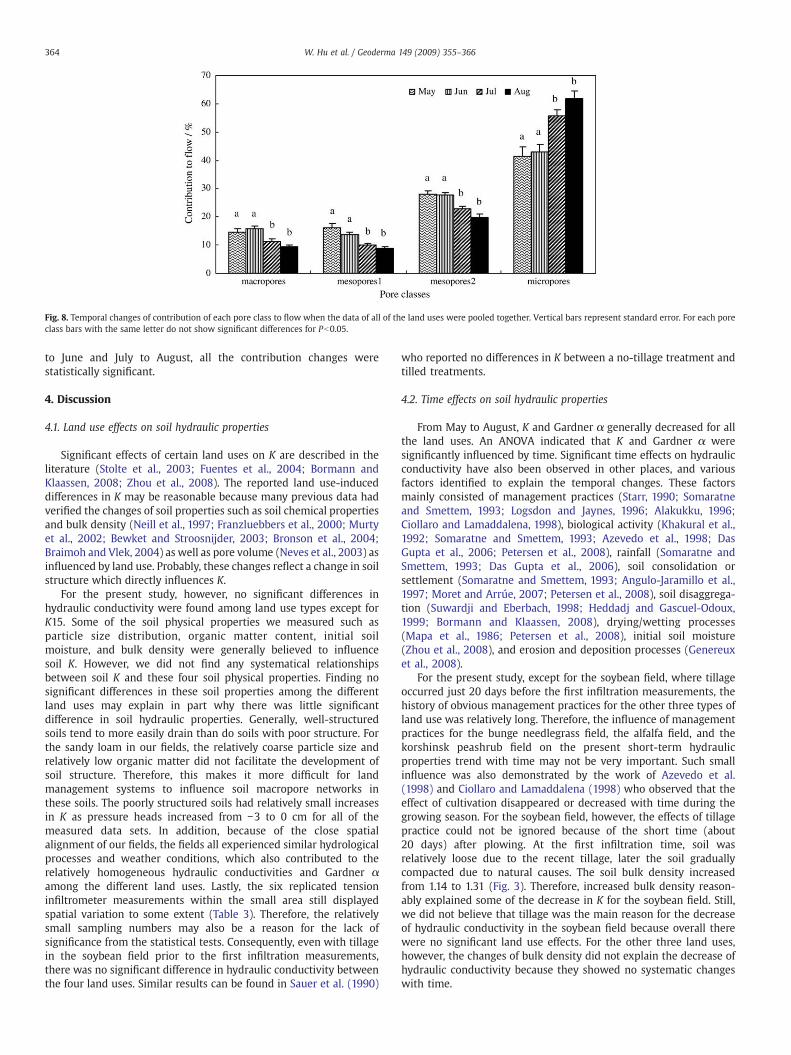
Fig. 8. Temporal changes of contribution of each pore class to flow when the data of all of the land uses were pooled together. Vertical bars represent standard error. For each poreclass bars with the same letter do not show significant differences for Pb0.05.
364 W. Hu et al. / Geoderma 149 (2009) 355–366
to June and July to August, all the contribution changes werestatistically significant.
4. Discussion
4.1. Land use effects on soil hydraulic properties
Significant effects of certain land uses on K are described in theliterature (Stolte et al., 2003; Fuentes et al., 2004; Bormann andKlaassen, 2008; Zhou et al., 2008). The reported land use-induceddifferences in K may be reasonable because many previous data hadverified the changes of soil properties such as soil chemical propertiesand bulk density (Neill et al., 1997; Franzluebbers et al., 2000; Murtyet al., 2002; Bewket and Stroosnijder, 2003; Bronson et al., 2004;Braimoh and Vlek, 2004) as well as pore volume (Neves et al., 2003) asinfluenced by land use. Probably, these changes reflect a change in soilstructure which directly influences K.
For the present study, however, no significant differences inhydraulic conductivity were found among land use types except forK15. Some of the soil physical properties we measured such asparticle size distribution, organic matter content, initial soilmoisture, and bulk density were generally believed to influencesoil K. However, we did not find any systematical relationshipsbetween soil K and these four soil physical properties. Finding nosignificant differences in these soil properties among the differentland uses may explain in part why there was little significantdifference in soil hydraulic properties. Generally, well-structuredsoils tend to more easily drain than do soils with poor structure. Forthe sandy loam in our fields, the relatively coarse particle size andrelatively low organic matter did not facilitate the development ofsoil structure. Therefore, this makes it more difficult for landmanagement systems to influence soil macropore networks inthese soils. The poorly structured soils had relatively small increasesin K as pressure heads increased from −3 to 0 cm for all of themeasured data sets. In addition, because of the close spatialalignment of our fields, the fields all experienced similar hydrologicalprocesses and weather conditions, which also contributed to therelatively homogeneous hydraulic conductivities and Gardner αamong the different land uses. Lastly, the six replicated tensioninfiltrometer measurements within the small area still displayedspatial variation to some extent (Table 3). Therefore, the relativelysmall sampling numbers may also be a reason for the lack ofsignificance from the statistical tests. Consequently, even with tillagein the soybean field prior to the first infiltration measurements,there was no significant difference in hydraulic conductivity betweenthe four land uses. Similar results can be found in Sauer et al. (1990)
who reported no differences in K between a no-tillage treatment andtilled treatments.
4.2. Time effects on soil hydraulic properties
From May to August, K and Gardner α generally decreased for allthe land uses. An ANOVA indicated that K and Gardner α weresignificantly influenced by time. Significant time effects on hydraulicconductivity have also been observed in other places, and variousfactors identified to explain the temporal changes. These factorsmainly consisted of management practices (Starr, 1990; Somaratneand Smettem, 1993; Logsdon and Jaynes, 1996; Alakukku, 1996;Ciollaro and Lamaddalena, 1998), biological activity (Khakural et al.,1992; Somaratne and Smettem, 1993; Azevedo et al., 1998; DasGupta et al., 2006; Petersen et al., 2008), rainfall (Somaratne andSmettem, 1993; Das Gupta et al., 2006), soil consolidation orsettlement (Somaratne and Smettem, 1993; Angulo-Jaramillo et al.,1997; Moret and Arrúe, 2007; Petersen et al., 2008), soil disaggrega-tion (Suwardji and Eberbach, 1998; Heddadj and Gascuel-Odoux,1999; Bormann and Klaassen, 2008), drying/wetting processes(Mapa et al., 1986; Petersen et al., 2008), initial soil moisture(Zhou et al., 2008), and erosion and deposition processes (Genereuxet al., 2008).
For the present study, except for the soybean field, where tillageoccurred just 20 days before the first infiltration measurements, thehistory of obvious management practices for the other three types ofland use was relatively long. Therefore, the influence of managementpractices for the bunge needlegrass field, the alfalfa field, and thekorshinsk peashrub field on the present short-term hydraulicproperties trend with time may not be very important. Such smallinfluence was also demonstrated by the work of Azevedo et al.(1998) and Ciollaro and Lamaddalena (1998) who observed that theeffect of cultivation disappeared or decreased with time during thegrowing season. For the soybean field, however, the effects of tillagepractice could not be ignored because of the short time (about20 days) after plowing. At the first infiltration time, soil wasrelatively loose due to the recent tillage, later the soil graduallycompacted due to natural causes. The soil bulk density increasedfrom 1.14 to 1.31 (Fig. 3). Therefore, increased bulk density reason-ably explained some of the decrease in K for the soybean field. Still,we did not believe that tillage was the main reason for the decreaseof hydraulic conductivity in the soybean field because overall therewere no significant land use effects. For the other three land uses,however, the changes of bulk density did not explain the decrease ofhydraulic conductivity because they showed no systematic changeswith time.

365W. Hu et al. / Geoderma 149 (2009) 355–366
Initial soil moisture has been linked to temporal changes in K(Zhou et al., 2008). For this study, soil moisture could not be the mainreason for the decrease of hydraulic conductivity since no significantcorrelation existed for soil moisture and hydraulic conductivity.However, the larger K in June compared with May for the soybeanfield and the korshinsk peashrub field may have been due to someextent to the drier initial soil moisture in June.
The viscosity of water decreases as temperature increases(Suwardji and Eberbach, 1998). It is unlikely that the significantdecrease in K with time as observed in the present study is due to thechange of soil temperature, because the mean daily air temperatureduring our infiltration except for July to August generally increased,18.5 °C, 22.8 °C, 26.5 °C, and 21.1 °C for May, June, July, and August,respectively (Fig. 1).
The fields were little affected by human activities, especiallyduring the infiltration period. Therefore, changes in arrangement ofsoil particles and pore structure caused by natural rainfall may be themain reason for the decreasing values of hydraulic properties. Undernatural rainfall events, surface soil can seal due to raindrop impact.Fine soil particles tend to be easily scattered by rain drop splashbecause of poor structure and aggregate instability, and the particlescan be transported by infiltratingwater and clog some soil macroporesor mesopores. Such changes were reported by Moret and Arrúe(2007). This effect can be demonstrated well by a decreasing ofcontribution of macropores and mesopores to flow with time (Figs. 7and 8).
Some differences in the magnitude of decrease in hydraulicconductivity existed for the four land uses (with a factor of 1.3 to 2.2for the soybean field, a factor of 1.4 to 1.9 for the alfalfa field, a factor of2.3 to 2.6 for the bunge needlegrass field, and a factor of 2.3 to 3.8 forthe korshinsk peashrub field), This seemed to contrast with thefinding that there were no land use effects on hydraulic conductivity.However, this may really relate to the different magnitude of decreasefor different stages. As can be seen from Figs. 5 and 6, all of thedecrease for various land uses were non-linear with time, and for agiven land use, the numerical value of K cannot be the largest orsmallest for all the measurement sets. This may also reflect that theland use effect was time-dependent. Therefore, the seeming para-doxical results of having no significant land use effects, and havingsome differences in the magnitude of hydraulic conductivity decreaseover time for the different land uses are reasonable.
5. Conclusions
Soil hydraulic properties are important for many aspects ofunsaturated soil water flow. They vary with space and time, and areexpected to differ between land uses due to differences in soilstructure. In this paper, four types of land use (bunge needlegrassfield, alfalfa field, soybean field, and korshinsk peashrub field) werestudied. Four sets of disc infiltration measurements were obtained inorder to examine the temporal changes of K, Gardner α, and thecontribution of pore size classes to flow.
The results showed that land use only significantly influenced Kat a pressure head of –15 cm. From May to August, K generallydecreased by a factor of 1.3 to 2.2 for the soybean field, a factor of1.4 to 1.9 for the alfalfa field, a factor of 2.3 to 2.6 for bungeneedlegrass field, and a factor of 2.3 to3.8 for the korshinskpeashrub field. The larger the pressure head, the more significantthe trend for K, which corresponded well with the decrease ofGardner α with time. Compared with land use, K and Gardner αwere influenced much more by time.
Generally, the contribution of macropores (N0.5 mm), mesopores1(0.5–0.25 mm), and mesopores2 (0.25–0.1 mm) to flow decreased,while that of micropores (b0.1 mm) increased from May to August.
The general monotonic decrease of K observed for this time periodis not sustainable and should not be extrapolated to a relatively long
time period. Our observational period was during the rainy season,and surface soil structure was affected by the raindrops. Over a longtime period, soil may undergo processes favorable to the developmentof soil structure. In this situation, K should increase. In addition, sixreplicates may be a limitation to the present study. Therefore, datawith more replicates are needed to focus on the temporal changes ofsoil hydraulic properties at a longer time scale.
Acknowledgements
The study was financially supported by the “Innovative Team”
program of Chinese Academy of Sciences, the “Hundred TalentsProgram ” of the Chinese Academy of Sciences, and the NationalNatural Sciences Foundation of China (Grant numbers of 90502006and 50479063). The comments from the two anonymous reviewerswere greatly appreciated.
References
Alakukku, L., 1996. Persistence of soil compaction due to high axle load traffic. II. Long-term effects on the properties of fine-textured and organic soils. Soil & TillageResearch 37, 223–238.
Angulo-Jaramillo, R., Moreno, F., Clothier, B.E., Thony, J.L., Vachaud, G., Fernandez-Boy,E., Cayuela, J.A., 1997. Seasonal variation of hydraulic properties of soils measuredusing a tension disk infiltrometer. Soil Science Society of America Journal 61, 27–32.
Angulo-Jaramillo, R., Vandervaere, J.P., Roulier, S., Thony, J.L., Gaudet, J.P., Vauclin, M.,2000. Field measurement of soil surface hydraulic properties by disc and ringinfiltrometers: a review and recent developments. Soil & Tillage Research 55, 1–29.
Ankeny, M.D., Kaspar, T.C., Horton, R., 1988. Design for an automated tensioninfiltrometer. Soil Science Society of America Journal 52, 893–896.
Ankeny, M.D., Ahmed, M., Kaspar, T.C., Horton, R., 1991. Simple field method fordetermining unsaturated hydraulic conductivity. Soil Science Society of AmericaJournal 55, 467–470.
Azevedo, A.S., Kanwar, R.S., Horton, R., 1998. Effect of cultivation on hydraulic propertiesof an Iowa soil using tension infiltrometers. Soil Science 163, 22–29.
Bagarello, V., Castellini, M., Iovino, M., 2005. Influence of the pressure head sequence onthe soil hydraulic conductivity determined with tension infiltrometer. AppliedEngineering in Agriculture 21 (3), 383–391.
Bewket, W., Stroosnijder, L., 2003. Effects of agroecological land use succession on soilproperties in Chemoga watershed, Blue Nile basin, Ethiopia. Geoderma 111 (1),85–98.
Bormann, H., Klaassen, K., 2008. Seasonal and land use dependent variability of soilhydraulic and soil hydrological properties of two northern German soils. Geoderma145, 295–302.
Braimoh, A.K., Vlek, P.L.G., 2004. The impact of land-cover change on soil properties inNorthern Ghana. Land Degradation & Development 15, 65–74.
Bronson, K.F., Zobeck, T.M., Chua, T.T., Acosta-Martinez, V., van Pelt, R.S., Booker, J.D.,2004. Carbon and nitrogen pools of southern high plains cropland and grasslandsoils. Soil Science Society of America Journal 68 (5), 1695–1704.
Byers, E., Stephens, D.B., 1983. Statistical and stochastic analysis of hydraulicconductivity and particle size in a fluvial sand. Soil Science Society of AmericaJournal 47, 1072–1080.
Cameria, M.R., Fernando, R.M., Pereira, L.S., 2003. Soil macropore dynamics affected bytillage and irrigation for a silty loam alluvial soil in southern Portugal. Soil & TillageResearch 70, 131–140.
Ciollaro, G., Lamaddalena, N.,1998. Effect of tillage on the hydraulic properties of a verticsoil. Journal of Agricultural Engineering Research 71, 147–155.
Clothier, B.E., Smettem, K.R.J., 1990. Combining laboratory and field measurements todefine the hydraulic properties of soil. Soil Science Society of America Journal 54,299–304.
Das Gupta, S., Mohanty, B.P., Köhne, J.M., 2006. Soil hydraulic conductivities and theirspatial and temporal variations in a vertisol. Soil Science Society of America Journal70, 1872–1881.
Franzluebbers, A.J., Stuedemann, J.A., Schomberg, H.H., Wilkinson, S.R., 2000. Soilorganic C and N pools under long-term pasture management in the SouthernPiedmont USA. Soil Biology and Biochemistry 32 (4), 469–478.
Fuentes, J.P., Flury, M., Bezdicek, D.F., 2004. Hydraulic properties in a silt loam soil undernatural prairie, conventional till, and no-till. Soil Science Society of America Journal68, 1679–1688.
Genereux, D.P., Leahy, S., Mitasova, H., Kennedy, C.D., Corbett, D.R., 2008. Spatial andtemporal variability of streambed hydraulic conductivity in West Bear Creek, NorthCarolina, USA. Journal of Hydrology 358 (3–4), 332–353.
Heddadj, D., Gascuel-Odoux, C., 1999. Topographic and seasonal variations ofunsaturated hydraulic conductivity as measured by tension disc infiltrometers atthe field scale. European Journal of Soil Science 50, 275–283.
Herbst, M., Diekkrüger, B., 2002. The influence of the spatial structure of soil propertiesonwater balance modeling in amicroscale catchment. Physics and Chemistry of theEarth 27, 701–710.
Hopmans, J.W., Schukking, H., Torfs, P.J.J.F., 1988. Two-dimensional steady stateunsaturated water flow in heterogeneous soils with autocorrelated soil hydraulicproperties. Water Resources Research 24, 2005–2017.

366 W. Hu et al. / Geoderma 149 (2009) 355–366
Hussen, A.A., Warrick, A.W., 1993. Alternative analyses of hydraulic data from the disctension infiltrometers. Water Resources Research 29, 4103–4108.
Imeson, A.C., Kwaad, F.J.P.M., 1990. The response of tilled soils to wetting by rainfall andthe dynamic character of soil erodibility. In: Boardman, J., Foster, I.D.L., Dearing, J.A.(Eds.), Soil erosion on agricultural land. John Wiley and Sons.
Khakural, B.R., Lemme, G.D., Schumacher, T.E., Lindstrom, M.J., 1992. Effects of tillagesystems and landscape on soil. Soil & Tillage Research 25, 43–52.
Larson, M., Jarvis, N., 1999. Evaluation of a dual porosity model to predict field scalesolute transport in a macroporous soil. Journal of Hydrology 215, 153–171.
Li, Y.Y., Shao, M.A., 2006. Change of soil physical properties under long-term naturalvegetation restoration in the Loess Plateau of China. Journal of Arid Environments64, 77–96.
Logsdon, S.D., Jaynes, D.B., 1993. Methodology for determining hydraulic conductivitywith tension infiltrometers. Soil Science Society of America Journal 57, 1426–1431.
Logsdon, S.D., Jaynes, D.B., 1996. Spatial variability of hydraulic conductivity in acultivated field at different times. Soil Science Society of America Journal 60,703–709.
Mapa, R.B., Green, R.E., Santo, L., 1986. Temporal variability of soil hydraulic propertieswith wetting and drying subsequent to tillage. Soil Science Society of AmericaJournal 50, 1133–1138.
Merz, B., Plate, E.J., 1997. An analysis of the effects of spatial variability of soil and soilmoisture on runoff. Water Resources Research 33 (12), 2909–2922.
Mohanty, B.P., Bowman, R.S., Hendrickx, J.M.H., van Genuchten, M.Th., 1997. Newpiecewise-continuous hydraulic functions for modeling preferential flow in anintermittent flood-irrigated field. Water Resources Research 33, 2049–2063.
Moret, D., Arrúe, J.L., 2007. Dynamics of soil hydraulic properties during fallow asaffected by tillage. Soil & Tillage Research 96, 103–113.
Murphy, B.W., Koen, T.B., Jones, B.A., Huxedurp, L.M., 1993. Temporal variation ofhydraulic properties for some soils with fragile structure. Australian Journal of SoilResearch 31, 179–197.
Murty, D., Kirschbaum, M.U.F., McMurtie, R.E., McGilvray, H., 2002. Does conversion offorest to agricultural land change soil carbon and nitrogen? A review of theliterature. Global Change Biology 8, 105–123.
Neill, C., Melillo, J.M., Steudler, P.A., Cerri, C.C., de Moraes, J.F.L., Piccolo, M.C., Brito, M.,1997. Soil carbon and nitrogen stocks following forest clearing for pasture in thesouth-western Brazilian Amazon. Ecological Applications 7 (4), 1216–1225.
Neves, C.S.V.J., Feller, C., Guimaraes, M.F., Medina, C.C., Tavares Filho, J., Fortier, M., 2003.Soil bulk density of homogeneous morphological units identified by the croppingprofile method in clayey oxisols in Brazil. Soil & Tillage Research 71 (2), 109–119.
Nielsen, D.R., Biggar, J.W., Erh, K.T., 1973. Spatial variability of field-measured soil-waterproperties. Hilgardia 42 (7), 215–259.
Perroux, K.M., White, I., 1988. Designs for disc permeameters. Soil Science Society ofAmerica Journal 52, 1205–1215.
Petersen, C.T., Trautner, A., Hansen, S., 2008. Spatio-temporal variation of anisotropy ofsaturated hydraulic conductivity in a tilled sandy loam soil. Soil & Tillage Research100 (1–2), 108–113.
Prieksat, M.A., Kaspar, T.C., Ankeny, M.D., 1994. Positional and temporal changes inponded infiltration in a corn field. Soil Science Society of America Journal 58,181–184.
Reynolds, W.D., 1993. Unsaturated hydraulic conductivity: field measurement. In:Carter, M.R. (Ed.), Soil Sampling and Methods of Analysis. Lewis Publishers, BocaRaton, Fla., pp. 633–644.
Sauer, T.J., Clothier, B.E., Daniel, T.C., 1990. Surface measurements of the hydraulicproperties of a tilled and untilled soil. Soil & Tillage Research 15, 359–369.
Sisson, J.B., Wierenga, P.J., 1981. Spatial variability of steady-state infiltration rates as astochastic process. Soil Science Society of America Journal 45, 699–704.
Smettem, K.R.J., Clothier, B.E., 1989. Measuring unsaturated sorptivity and hydraulicconductivity using multiple disc permeameters. Soil Science 40, 563–568.
Somaratne, N.M., Smettem, K.R.J., 1993. Effect of cultivation and raindrop impact on thesurface hydraulic properties of an Alfsol under wheat. Soil & Tillage Research 26,115–125.
Starr, J.L., 1990. Spatial and temporal variation of ponded infiltration. Soil ScienceSociety of America Journal 54, 629–636.
Stolte, J., van Venrooij, B., Zhang, G., Trouwborst, K.O., Liu, G., Ritsema, C.J., Hessel, R.,2003. Land-use induced spatial heterogeneity of soil hydraulic properties on theLoess Plateau in China. Catena 54, 59–75.
Strock, J.S., Cassel, D.K., Gumpertz, M.L., 2001. Spatial variability of water and bromidetransport through variably saturated soil blocks. Soil Science Society of AmericaJournal 65, 1607–1617.
Suwardji, P., Eberbach, P.L., 1998. Seasonal changes of physical properties of an OxicPaleustalf (Red Kandosol) after 16 years of direct drilling or conventionalcultivation. Soil & Tillage Research 49, 65–77.
Tang, K.L., Hou, Q.C., Wang, B.K., Zhang, P.C., 1993. The environment background andadministration way of wind-water erosion crisscross region and Shenmu experi-mental area on the Loess Plateau. Memoir of NISWC, Academia Sinica and Ministryof Water Conservation, vol. 18, pp. 2–15.
Watson, K., Luxmoore, R., 1986. Estimating macroporosity in a forest watershed by useof a tension infiltrometer. Soil Science Society of America Journal 50, 578–582.
White, I., Sully, M.J., 1987. Macroscopic and microscopic capillary length and time scalesfrom field infiltration. Water Resources Research 23, 1514–1522.
Wooding, R.A., 1968. Steady infiltration from a circular shallow circular pond. WaterResources Research 4, 1259–1273.
Zhang, S.L., Yang, X.Y., Wiss, M., Grip, H., Lövdahl, L., 2006. Changes in physicalproperties of a loess soil in China following two long-term fertilization regimes.Geoderma 136, 579–587.
Zhou, X., Lin, H.S., White, E.A., 2008. Surface soil hydraulic properties in four soil seriesunder different land uses and their temporal changes. Catena 73, 180–188.