Embed Size (px)
Citation preview
Temporal and spatial variability of
Great Lakes ice cover, 1973-2010
Jia Wang
NOAA Great Lakes Environmental Research Laboratory, Ann Arbor, Michigan USA
Contributors/Collaborators:
Xuezhi Bai, Haoguo Hu, CILER, University of Michigan Ann Arbor
Anne Clites, Marie Colton, Brent Lofgren (GLERL)
The State of Lake Michigan,
Michigan City, Sep. 26-28 2011
Support from GLRI is acknowledged
Outline
I. Background/Motivation
II. Data
III. Results: Interannual variability, seasonal
cycle, trend, spatial and temporal change,
and periodicity
IV. ENSO and NAO/AO interference
V. Summary

I. Motivation
Great Lakes are complex, ―mini climate system‖ including
--regional climate/atmosphere,
--hydrosphere/
hydrodynamics,
--cryosphere (lake ice),
--biosphere/aquatic ecosystems, and
--land processes
(hydrology, coastal erosion)

Great Lakes watershed, with spatial
change in depth, orientation

Background
• Great Lakes Ice cover affects regional economy, ecosystem and water balance
• Ice cover has large inter-annual variability. In 1979, it was 95% and 11% in 2002.
Max in 1979 95% Max in 2002 11%
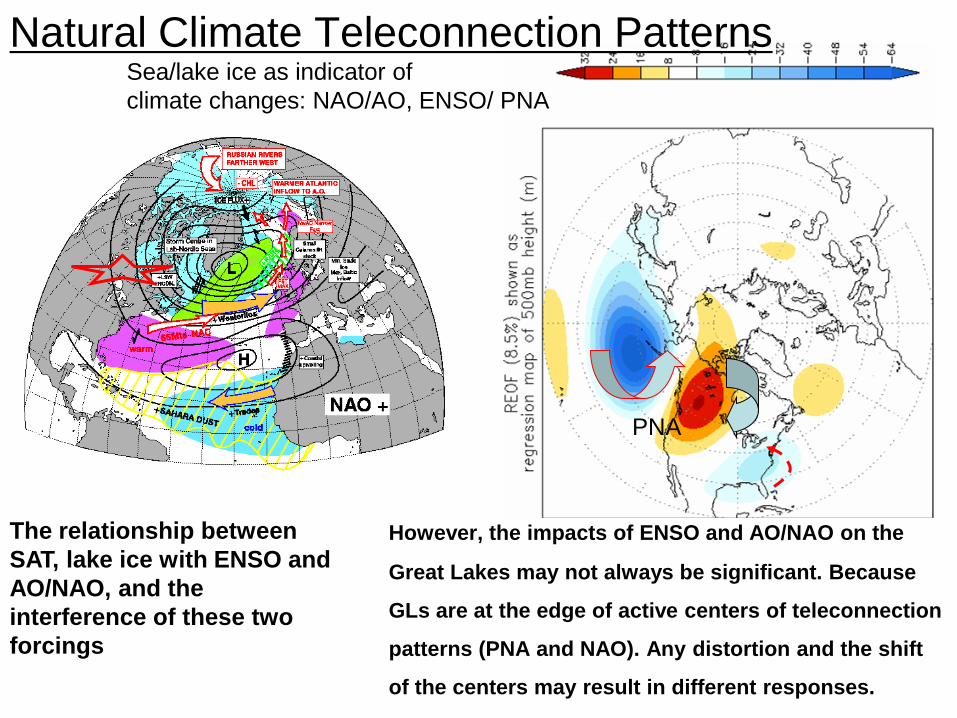
However, the impacts of ENSO and AO/NAO on the
Great Lakes may not always be significant. Because
GLs are at the edge of active centers of teleconnection
patterns (PNA and NAO). Any distortion and the shift
of the centers may result in different responses.
The relationship between
SAT, lake ice with ENSO and
AO/NAO, and the
interference of these two
forcings
PNA
Natural Climate Teleconnection Patterns Sea/lake ice as indicator of
climate changes: NAO/AO, ENSO/ PNA
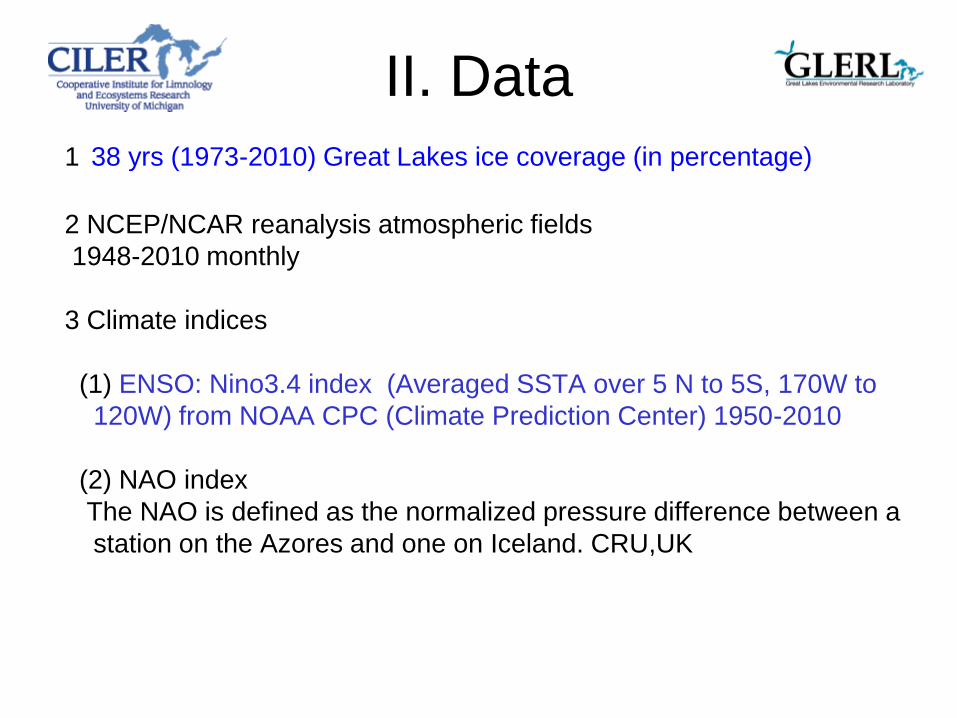
II. Data
1 38 yrs (1973-2010) Great Lakes ice coverage (in percentage)
2 NCEP/NCAR reanalysis atmospheric fields
1948-2010 monthly
3 Climate indices
(1) ENSO: Nino3.4 index (Averaged SSTA over 5 N to 5S, 170W to
120W) from NOAA CPC (Climate Prediction Center) 1950-2010
(2) NAO index
The NAO is defined as the normalized pressure difference between a
station on the Azores and one on Iceland. CRU,UK

Based on the following research
papers
Wang, J., X. Bai, G. Leshkevich, M. Colton, A. Clites, and B.
Lofgren, 2010: Severe Great Lakes ice cover in winter 2008/09:
Contribution of AO and ENSO, AGU EOS, 91 (5), 41-42.
Wang, J., X. Bai, H. Hu, A. Clites, M. Colton, and B. Lofgren,
2011. Temporal and spatial variability of Great Lakes ice cover,
1973-2010. J. Clim., (in press)
Bai, X., J. Wang, C. Sellinger, A. Clites, R. Assel, 2010. The
impacts of ENSO and AO on the interannual variability of Great
Lakes ice cover (accepted to JGR)

III. Results: Interannual variability: Great Lakes Ice cover in 2008/09 winter reached the 2003 level! (weekly ice
area in km**2)

Seasonal cycle
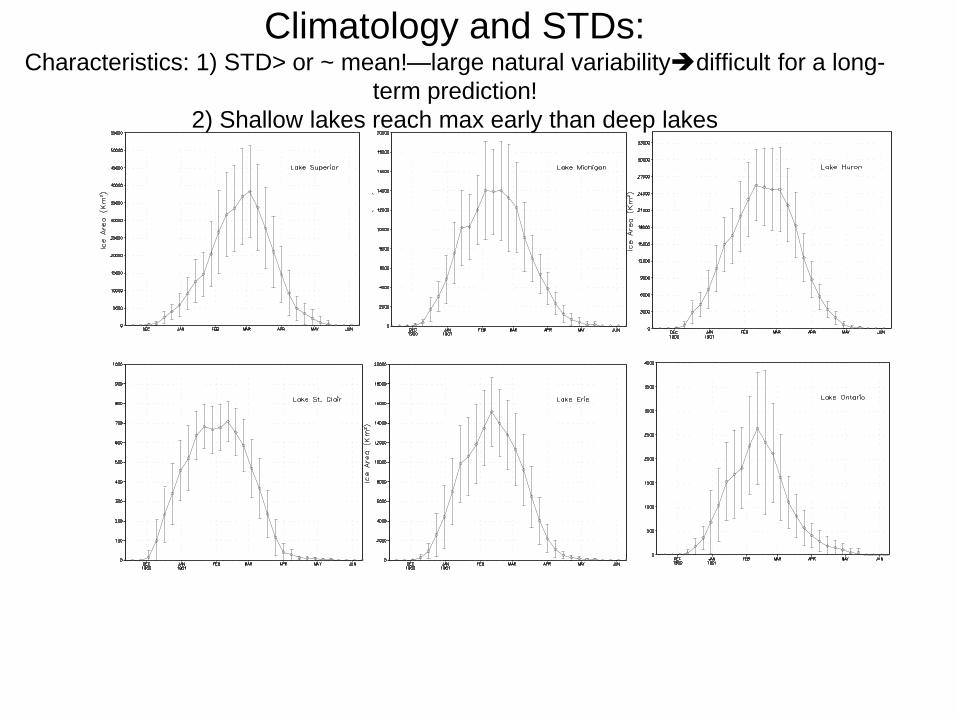
Climatology and STDs: Characteristics: 1) STD> or ~ mean!—large natural variabilitydifficult for a long-
term prediction!
2) Shallow lakes reach max early than deep lakes
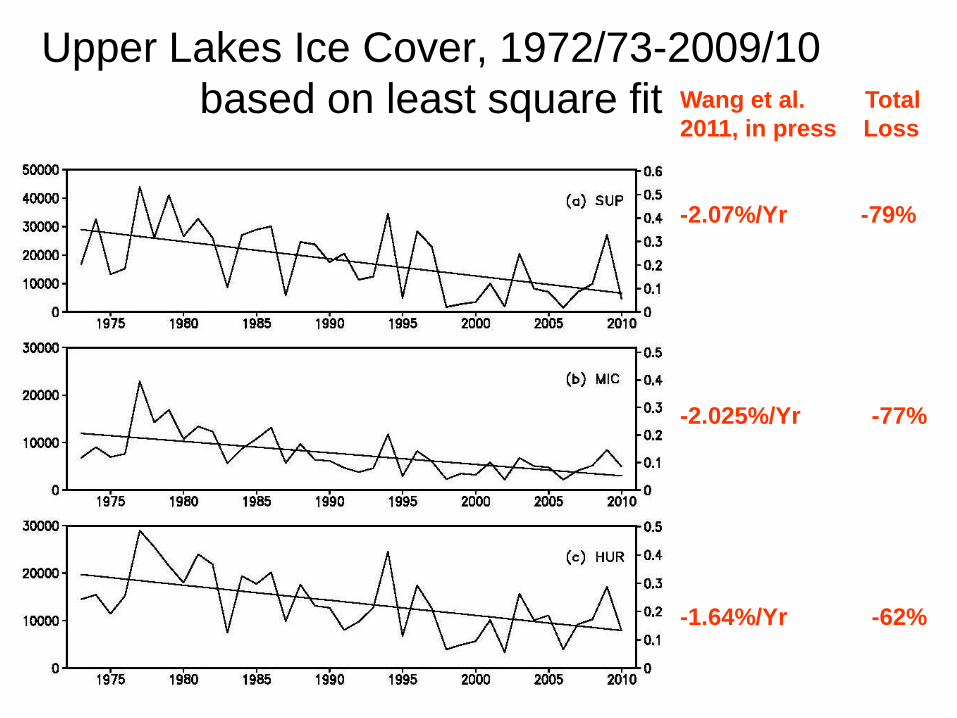
Upper Lakes Ice Cover, 1972/73-2009/10
based on least square fit Wang et al. Total
2011, in press Loss
-2.07%/Yr -79%
-2.025%/Yr -77%
-1.64%/Yr -62%

Lower Lakes Ice Cover, 1972/73-2009/10
Wang et al. Total
2011, in press Loss
--0.962%/Yr -37%
--1.303%/Yr -50%
--2.328%/Yr -88%
--1.862/Yr -71%
-79 -77 -62
50 -88 -71

Why? Warming trend! Upper GLs: 0.6C/Decade; Lower GLs: 0.4C/Decade
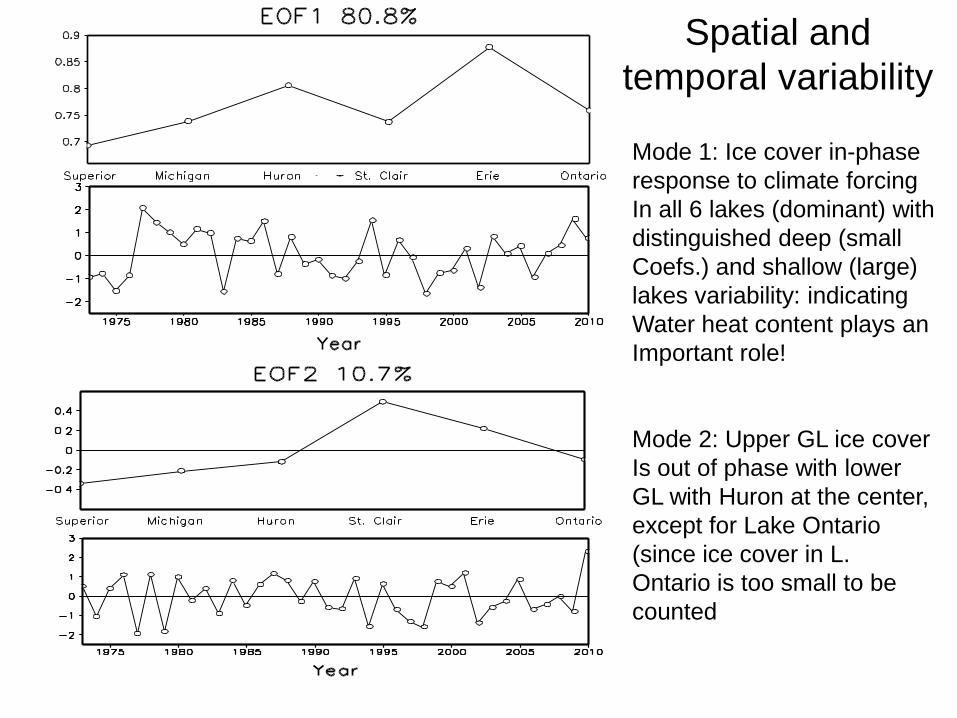
Spatial and
temporal variability
Mode 1: Ice cover in-phase
response to climate forcing
In all 6 lakes (dominant) with
distinguished deep (small
Coefs.) and shallow (large)
lakes variability: indicating
Water heat content plays an
Important role!
Mode 2: Upper GL ice cover
Is out of phase with lower
GL with Huron at the center,
except for Lake Ontario
(since ice cover in L.
Ontario is too small to be
counted
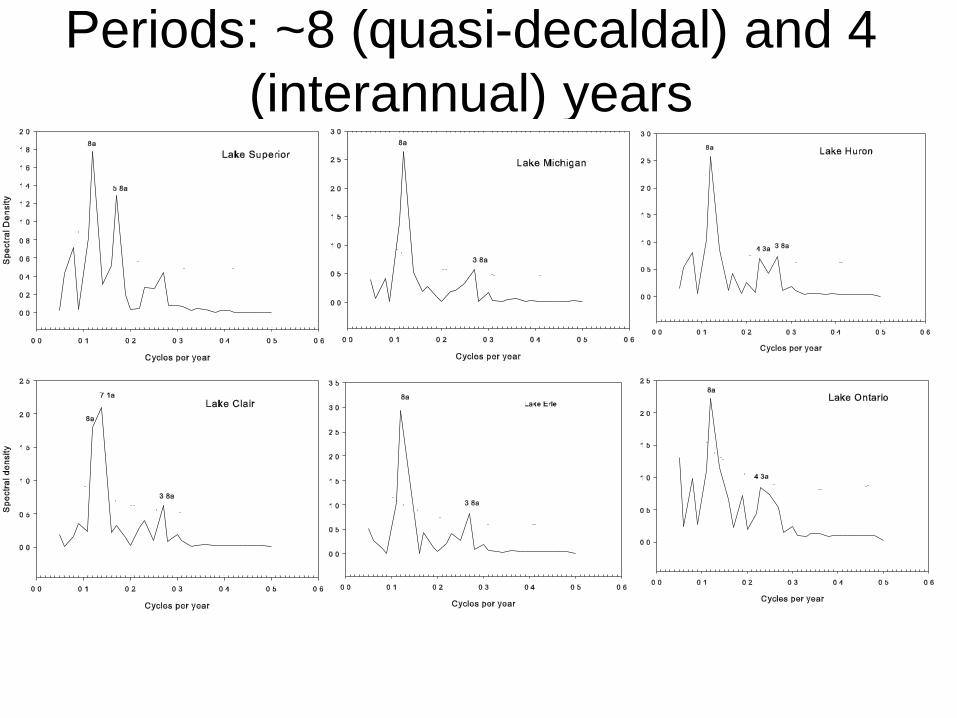
Periods: ~8 (quasi-decaldal) and 4
(interannual) years
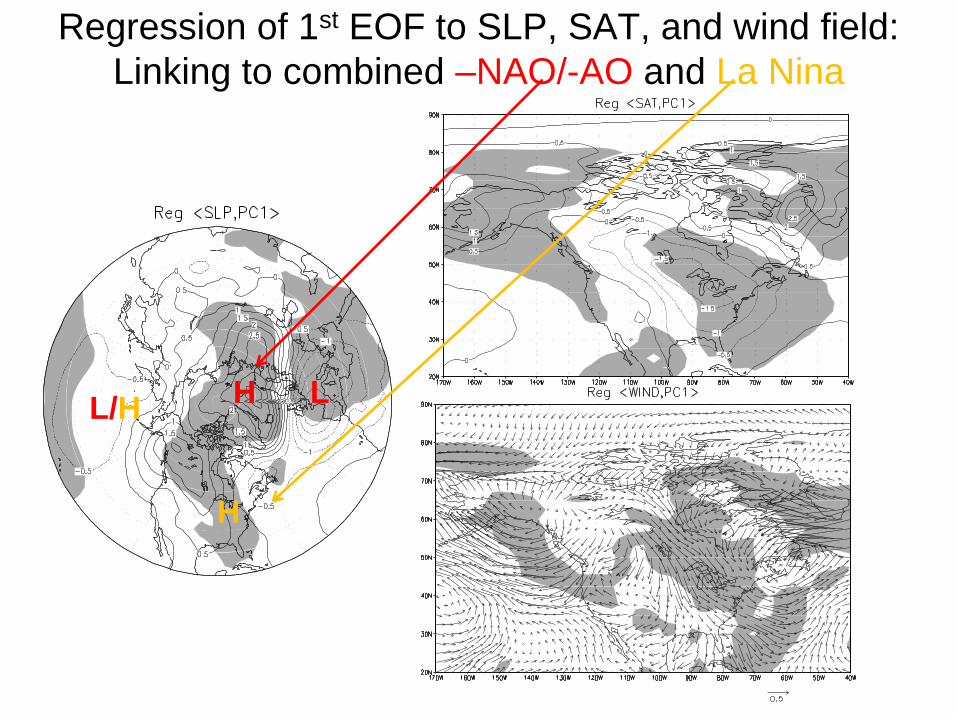
Regression of 1st EOF to SLP, SAT, and wind field:
Linking to combined –NAO/-AO and La Nina
H L L/H
H
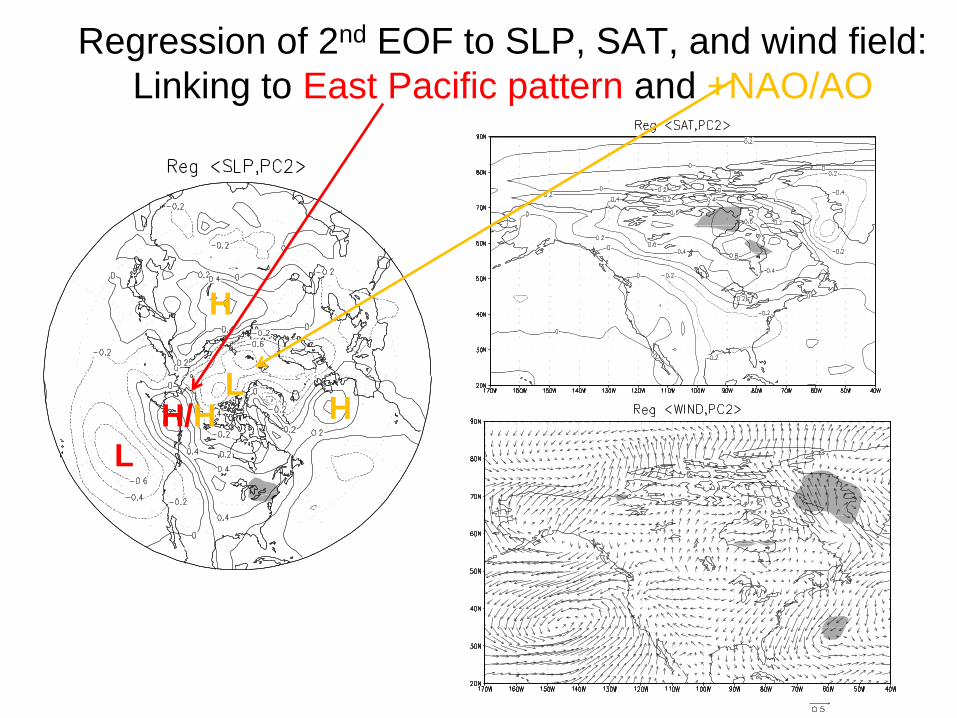
Regression of 2nd EOF to SLP, SAT, and wind field:
Linking to East Pacific pattern and +NAO/AO
H/H
L
H L
H
IV. Interference and combined
effects of ENSO and AO

Lake ice signature of NAO/AO and ENSO
• North Atlantic Oscillation (NAO)
(Arctic Oscillation)
Pacific North America Pattern
(El Nino/La Nina, ENSO)
Ice and NAO:
Linear relationship
Ice and ENSO:
Nonlinear and asymmetric
relationship
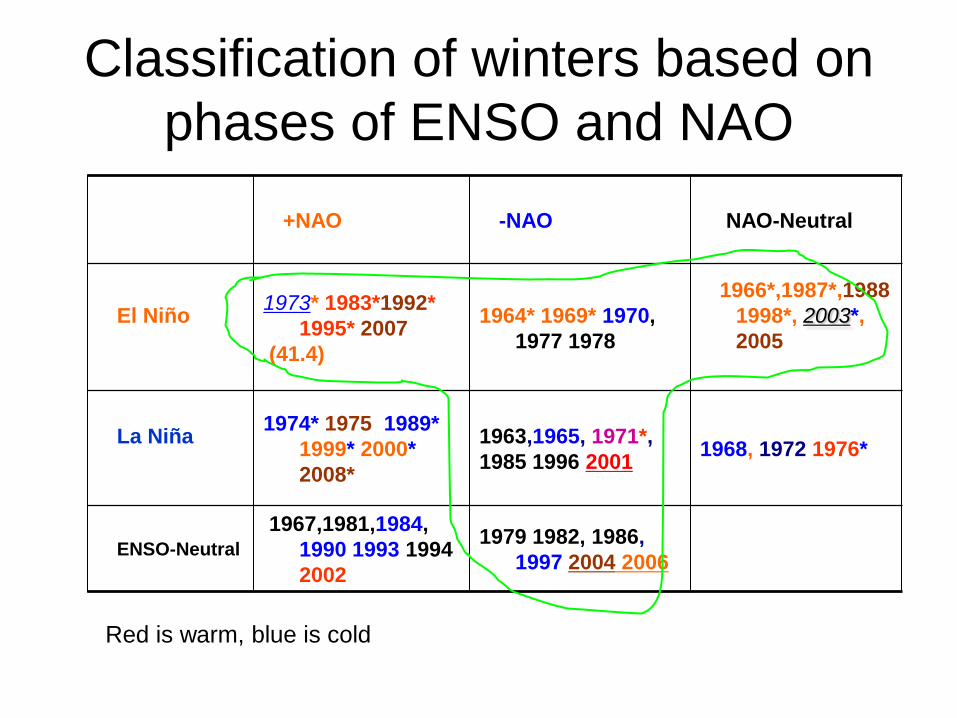
Classification of winters based on
phases of ENSO and NAO
+NAO
-NAO
NAO-Neutral
El Niño
1973* 1983*1992*
1995* 2007
(41.4)
1964* 1969* 1970,
1977 1978
1966*,1987*,1988
1998*, 2003*,
2005
La Niña
1974* 1975 1989*
1999* 2000*
2008*
1963,1965, 1971*,
1985 1996 2001 1968, 1972 1976*
ENSO-Neutral
1967,1981,1984,
1990 1993 1994
2002
1979 1982, 1986,
1997 2004 2006
Red is warm, blue is cold
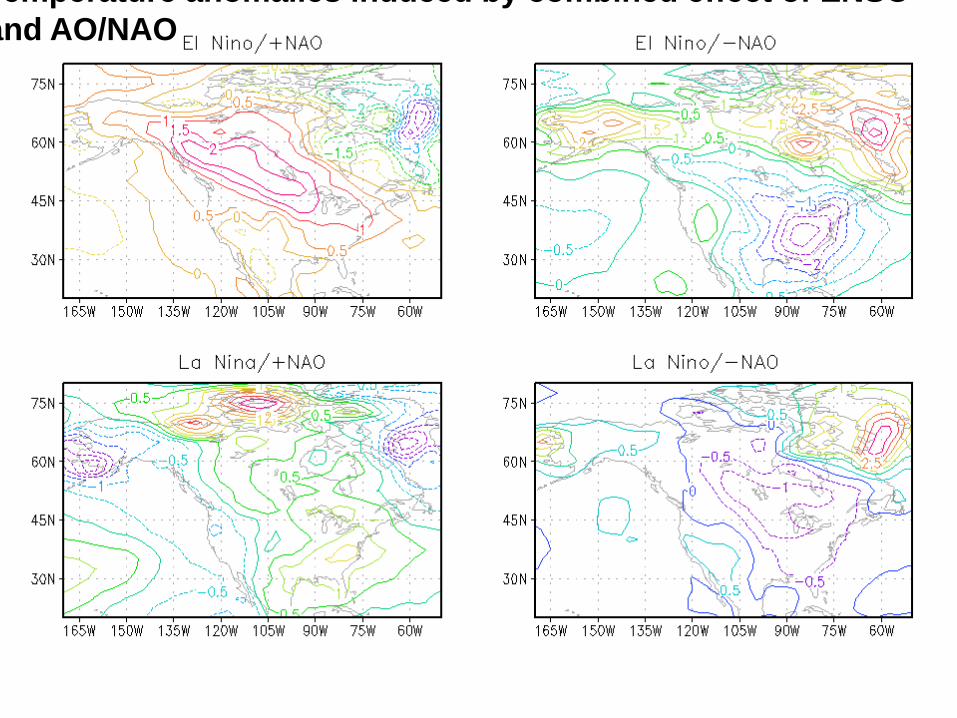
Temperature anomalies induced by combined effect of ENSO
and AO/NAO
V. Summary
1 Both ENSO and AO/NAO have impacts on the Great Lakes ice
cover.
a) El Nino events were often associated with less than normal Ice
cover. La Nina events do not have significant impacts.
b) -NAO events were associated with more ice cover.
2 The interference of effects of ENSO and NAO complicates the
relationships, which should be considered when make predictions
of ice cover.

Combined effects of ENSO and NAO/AO
+AO/NAO
(warm)
-AO/NAO
(cold)
El Nino
(warm)
Extremely warm
1973,1983,1992,1995,20
07
Normal (to cold)
1966,1969
La Nina
(cold at weak;
but warm at
strong)
Normal
1975 1976 1989 2000
2008
Cold during weak La
Nina);
Normal to warm
during strong La Nina,
ex. 2010/11)
1965 1985 2001

Summary (cont.)
3 Lake ice seasonal cycle has large STDs whose magnitudes are larger or equivalent to the seasonal mean, indicating a large natural variability and a poor long-term (>1 month to 1 year) predictability
4. Lake ice has strong quasi-decadal (~8 years) and weak interannual (~4 years) variability
5. Lake ice in all lakes respond to climate forcing/change at the same phase (80.8%), but with spatial variability between deep and shallow lakes , while the out-of-phase change in lake ice (10.7%) is between the Upper and Lower GLs with Huron as a central lake
6. Lake ice variability shows natural (interannual to quasi-decadal) and anthropogenic (trend) changes. Overall Great Lake ice loss in the past 40 years is -71%, ranging from -35% (St. Clair) to -88% (Ontario).
Questions?
• Jia Wang: [email protected]
• Support: Great Lakes Restoration Initiative
(GLRI) from EPA/NOAA on Theme
Climate for Decision Making (Heather
Stirratt)