Embed Size (px)
Citation preview
Louisiana State UniversityLSU Digital Commons
LSU Master's Theses Graduate School
2007
Spatial and temporal variability of tropical stormand hurricane strikes in the Bahamas, and theGreater and Lesser AntillesAlexa Jo AndrewsLouisiana State University and Agricultural and Mechanical College, [email protected]
Follow this and additional works at: https://digitalcommons.lsu.edu/gradschool_theses
Part of the Social and Behavioral Sciences Commons
This Thesis is brought to you for free and open access by the Graduate School at LSU Digital Commons. It has been accepted for inclusion in LSUMaster's Theses by an authorized graduate school editor of LSU Digital Commons. For more information, please contact [email protected].
Recommended CitationAndrews, Alexa Jo, "Spatial and temporal variability of tropical storm and hurricane strikes in the Bahamas, and the Greater and LesserAntilles" (2007). LSU Master's Theses. 3558.https://digitalcommons.lsu.edu/gradschool_theses/3558
SPATIAL AND TEMPORAL VARIABILITY OF TROPICAL STORM AND HURRICANE STRIKES IN THE BAHAMAS, AND THE GREATER AND LESSER ANTILLES
A Thesis
Submitted to the Graduate Faculty of the Louisiana State University and
Agricultural and Mechanical College in partial fulfillment of the
requirements for the degree of Master of Science
in
The Department of Geography and Anthropology
by Alexa Jo Andrews
B.S., Louisiana State University, 2004 December, 2007

ii
Table of Contents
List of Tables......................................................................................................................... iii List of Figures........................................................................................................................ iv Abstract..................................................................................................................................vi Chapter 1. Introduction and Literature Review....................................................................1 1.1 Introduction ......................................................................................................1 1.2 Objectives .........................................................................................................3 1.3 Literature Review .............................................................................................4 Chapter 2. Methods ..............................................................................................................8 2.1 Study Area and Hurricane Data........................................................................8 2.2 Methods ............................................................................................................9 2.3 Return Period Methodology .............................................................................13 Chapter 3. Return Period Analysis .......................................................................................14 3.1 Temporal Analysis............................................................................................14 3.2 Spatiotemporal Analysis of Strikes ..................................................................20 3.3 Tropical Storm and Hurricane Return Periods .................................................27 Chapter 4. Influences on Hurricane Strikes..........................................................................33 4.1 El Niño—Southern Oscillation.........................................................................33 4.2 Global Warming ...............................................................................................41 Chapter 5. Summary and Conclusions .................................................................................47 5.1 Review: Objectives, Methods, and Study Area...............................................47 5.2 Objective One—Time Series and Storm Landfall Characteristics...................48 5.3 Objective Two—Calculate Return Periods ......................................................49 5.4 Objective Three—Explanation of Results........................................................50 5.5 Future Research ................................................................................................52 References .............................................................................................................................53 Appendix A. Tropical Cyclone Strikes for Twenty-Six Caribbean Locations—Year, Storm Type, Storm Name (Alphabetical Order by Country) ...........................................................56 Appendix B. Storm Tracks in the Caribbean for the One Hundred Six Year Dataset .........69 Vita ........................................................................................................................................73
iii
List of Tables
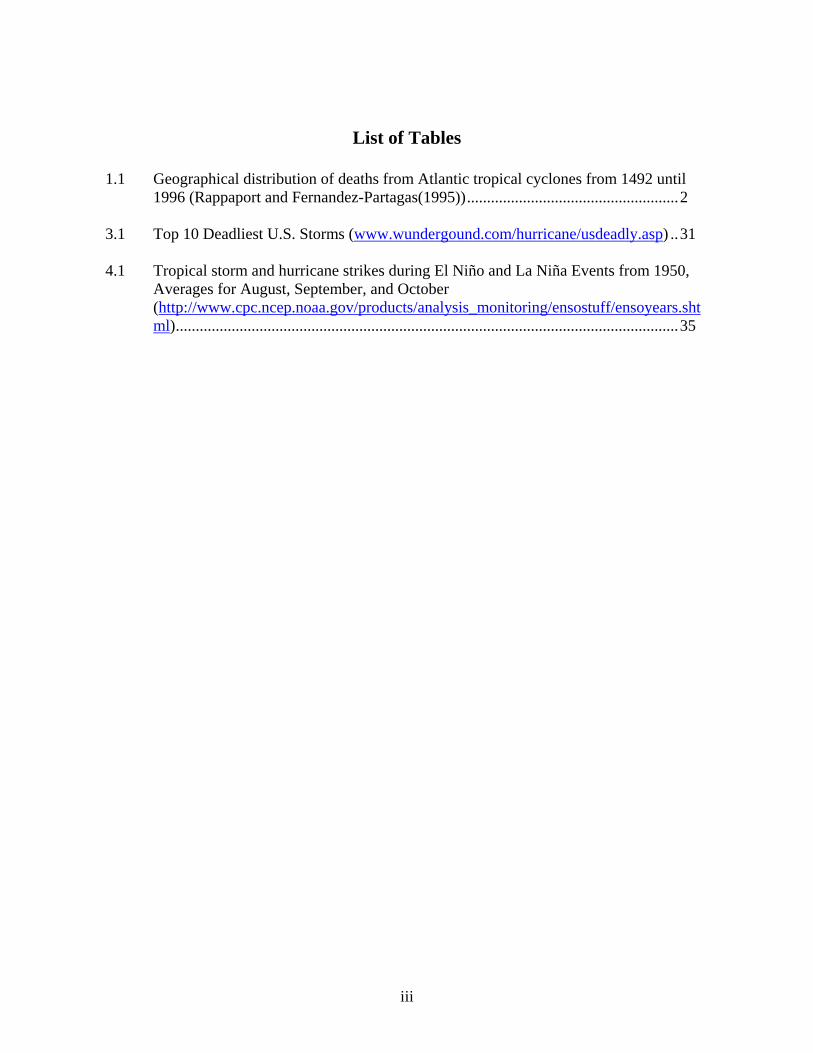
1.1 Geographical distribution of deaths from Atlantic tropical cyclones from 1492 until
1996 (Rappaport and Fernandez-Partagas(1995)).....................................................2 3.1 Top 10 Deadliest U.S. Storms (www.wundergound.com/hurricane/usdeadly.asp) ..31 4.1 Tropical storm and hurricane strikes during El Niño and La Niña Events from 1950,
Averages for August, September, and October (http://www.cpc.ncep.noaa.gov/products/analysis_monitoring/ensostuff/ensoyears.shtml)..............................................................................................................................35
iv
List of Figures
1.1 Spatiotemporal distribution of tropical storm and hurricane strikes from Texas to Maine. Modified from Keim et al. (2007). ...............................................................5
2.1 Twenty-six locations chosen throughout the Caribbean Sea for analysis of hurricane
strikes.........................................................................................................................9 2.2 Hurricane Strike Model demonstrates the wind swath for major hurricanes (categories
3-5), minor hurricanes (categories 1-2), and tropical storms. The direction of the motion of the storm is displayed in this figure. Source: Muller and Stone (2001) .11
2.3 Changing technology in tropical storm and hurricane data observation techniques in
the Atlantic Basin. Source: Neumann et al. (1993, p. 14) .......................................13 3.1 Total number of tropical storms/hurricanes striking over 106 years for twenty-six
chosen locations in the Caribbean Region.................................................................14 3.2 Tropical storm and hurricane strikes associated with the Atlantic Multidecadal
Oscillation (AMO) sea surface temperature value departures from the normal, from 1949 through 2006 (http://www.cdc.noaa.gov/Correlations /amon.us.data).............15
3.3 Galveston Hurricane track, 1915. Source: Hurrevac Program ................................17 3.4 Lake Okeechobee Hurricane track, 1928. Source: Hurrevac Program....................17 3.5 Hurricane David track, 1979. Source: Hurrevac Program ......................................18 3.6 Hurricane Ivan track, 2004. Source: Hurrevac Program .........................................19 3.7 Tropical Storm Number One track, 1905. Source: Hurrevac Program ...................20 3.8 Spatiotemporal distribution of all tropical storm and hurricane strikes for twenty-six
locations throughout the Caribbean Region ..............................................................23 3.9 Spatial distribution of return periods for twenty-six locations over a one hundred six
year time period.........................................................................................................28 4.1 Tropical storm and hurricane tracks, 1957. Source: Hurrevac Program .................36 4.2 Tropical storm and hurricane tracks, 1972. Source: Hurrevac Program ..................37 4.3 Tropical storm and hurricane tracks, 1982-1983. Source: Hurrevac Program........37 4.4 Tropical storm and hurricane tracks, 1997. Source: Hurrevac Program ..................38 4.5 Tropical storm and hurricane tracks, 1909. Source: Hurrevac Program ..................39

v
4.6 Tropical storm and hurricane tracks, 1916. Source: Hurrevac Program ..................39 4.7 Tropical storm and hurricane tracks, 1933. Source: Hurrevac Program ..................40 4.8 Tropical storm and hurricane tracks, 1949. Source: Hurrevac Program ..................41

vi
Abstract
Coastal cities throughout the Caribbean Sea are evaluated to determine the
geographical distributions of landfalling tropical storms and hurricanes. A strike model is
used to measure tropical storm and hurricane force winds. Twenty-six specific locations in
the Caribbean are studied over a time period of over one hundred years from 1901 until 2006.
The Caribbean Sea geographically covers a small area of the world; however, this analysis
demonstrates the wide variability of the frequency of tropical storms and hurricane strikes in
this region.
The southernmost portions of the Caribbean, for example Oranjestad, Aruba and
Willemstad, Curacao, generally experience lower frequencies of strikes with a major
hurricane return period of over 100 years in Oranjestad and Willemstad. Futhermore,
Willemstad never experienced a major hurricane strike in the time period. Analyses of the
northern parts of the Caribbean including Nassau, Bahamas, Nueva Gerona, Cuba, and
Jamaica are locations that experience numerous instances of tropical storm and hurricane
landfalls.
Temporal variability is apparent and fluctuates greatly in different regions of the
Caribbean Sea. Locations that experience higher frequencies of tropical storm strikes tend to
have return periods of two to five years. Other areas with less frequent landfalls have return
periods of up to fifteen years. For severe hurricanes, the range is from ten year return periods
at Nassau, Bahamas to over 100 years at sites to the south in the study region.
Specific events of landfalling tropical storms and hurricanes, or lack there of, are
directly related to La Niña and El Niño events. The 1933 active hurricane season coincides
with a significantly strong La Niña event. Less active hurricane seasons often take place
during stronger El Niño years.

1
Chapter 1: Introduction and Literature Review
1.1 Introduction
Tropical cyclone and hurricane strike frequencies have been studied for numerous
years with many different objectives. Most importantly, studying past strikes of tropical
storms and hurricanes can provide insight on the future frequency of these storms (Jagger et
al. 2001). Past research focused on areas such as the United States (Keim et al. 2004),
including Hawaii (Chu and Wang 1998); however, little can be found regarding the islands of
the Caribbean Sea. All locations affected by tropical storms and hurricanes are important to
research; yet, areas such as the United States and the Caribbean seem especially vulnerable
with increasing population, tourism, and coastal development (Lyons 2004). Although the
islands of the Caribbean are considerably smaller than countries such as the United States, it
is important not to disregard this area for many reasons, including hazard mitigation and
emergency planning (Jagger et al. 2001).
The Caribbean region can be defined as the area encompassing three main island
chains: the Eastern tip of the Yucatán Peninsula in Mexico, the southeastern portion of
Florida, the Bahamas, the Greater Antilles, the Lesser Antilles, including the Leeward and
Windward Islands, and finally the Netherlands Antilles (http://uk.encarta.msn.com). Islands
throughout the Caribbean region repeatedly experience tropical cyclone activity every
summer and autumn between June and November, when sea surface temperatures are
sufficiently high enough to support hurricane formation. Countless storms never affect land;
however, the Caribbean Islands are often severely affected by striking storms, especially
during the peak months from mid-August through early-October (Smith 1999). Tropical
storms and hurricanes begin as tropical waves that form over the Atlantic Ocean, often off the
coast of Africa. The waves coming off the coast of Africa initially begin as thunderstorms
2
that eventually become cyclonic in nature (Keim et al. 2004). These systems are steered
toward the west/northwest by the easterly trade winds, which could eventually result in a
strike on any of the islands located in the Caribbean Region (Kimball and Mulekar 2004).
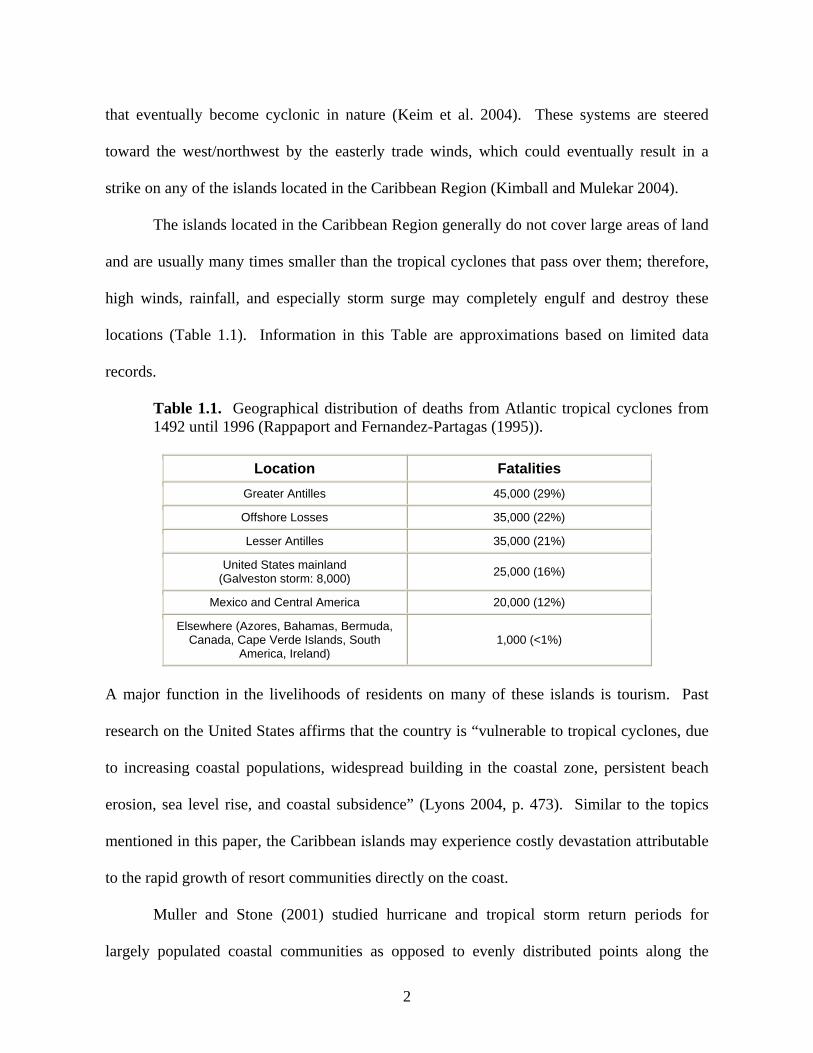
The islands located in the Caribbean Region generally do not cover large areas of land
and are usually many times smaller than the tropical cyclones that pass over them; therefore,
high winds, rainfall, and especially storm surge may completely engulf and destroy these
locations (Table 1.1). Information in this Table are approximations based on limited data
records.
Table 1.1. Geographical distribution of deaths from Atlantic tropical cyclones from 1492 until 1996 (Rappaport and Fernandez-Partagas (1995)).
Location Fatalities Greater Antilles 45,000 (29%)
Offshore Losses 35,000 (22%)
Lesser Antilles 35,000 (21%)
United States mainland (Galveston storm: 8,000) 25,000 (16%)
Mexico and Central America 20,000 (12%)
Elsewhere (Azores, Bahamas, Bermuda, Canada, Cape Verde Islands, South
America, Ireland) 1,000 (<1%)
A major function in the livelihoods of residents on many of these islands is tourism. Past
research on the United States affirms that the country is “vulnerable to tropical cyclones, due
to increasing coastal populations, widespread building in the coastal zone, persistent beach
erosion, sea level rise, and coastal subsidence” (Lyons 2004, p. 473). Similar to the topics
mentioned in this paper, the Caribbean islands may experience costly devastation attributable
to the rapid growth of resort communities directly on the coast.
Muller and Stone (2001) studied hurricane and tropical storm return periods for
largely populated coastal communities as opposed to evenly distributed points along the

3
United States East Coast to the Gulf Coast. Results from this research show that the average
return period for major hurricanes ranges from twenty to 100 years for points ranging from
South Padre Island, Texas to Cape Hatteras, North Carolina. Along with research by Muller
and Stone (2001), other studies have been completed on tropical cyclones in the United
States. Simpson and Lawrence (1971) conducted research on the United States Gulf Coast
and East Coast by segments; Elsner and Kara (1999) researched counties along the United
States East Coasts. Hurricane return period research has been typically focused on segments
of the United States, leaving the islands of the Caribbean untouched.
1.2 Objectives
Little research has been conducted in the past on hurricane and tropical storm strikes
on Caribbean Islands. This thesis examines the climatology of past strikes of tropical storms
and hurricanes in the Caribbean Region over the past 106 years, specifically the largely
populated coastal cities on islands including the Bahamas, Jamaica, Cuba, Puerto Rico, the
Virgin Islands, and the Windward and Leeward Islands extending to Aruba. Twenty-six
islands throughout the Caribbean Region were chosen for this study to determine tropical
storm and hurricane return periods. The primary objectives are:
1) To produce a time series of historical tropical storm or hurricane strikes at each
particular location chosen in the Caribbean Region and characteristics of the storm
at the time of strike (i.e. Category of storm, winds, etc.).
2) To calculate the annual return periods of tropical storms, minor hurricanes, and
major hurricanes for each of the locations chosen for the study.
3) To provide possible explanations of the results determined in this study.

4
1.3 Literature Review
Various studies have been conducted on the frequency of striking hurricanes for areas
all over the world; however, the Caribbean Islands have not often been included among these
studies. For example, in a study by Smith (1999), East Coast hurricanes were researched to
determine frequency and intensity of storms over a series of ninety-nine years and to analyze
whether storms are increasing in frequency. Smith’s research determined that, after a slow
period of hurricane formation in the 1970’s, the frequency of hurricanes is increasing again
(Smith 1999). Tropical cyclone return periods for Hawaii have been determined to improve
disaster preparedness and for future building purposes (Chu and Wang 1998). In this study,
hurricane data were gathered from the National Hurricane Center for the years 1949 through
1995. While strong storms are deemed rare in proximity to Hawaii, this study proved that the
average annual occurrence rate of hurricanes for the vicinity of Hawaii is about 13.9 years.
Results from this study will hopefully be useful in disaster planning concerning mitigation for
these areas. A return period of 137 years was calculated for major hurricanes in the vicinity
of Hawaii and results also showed return periods ranging from 59 to twelve for weaker-scale
hurricanes (Chu and Wang 1998). Hurricane frequency and strike variability in the North
Atlantic Basin and the Gulf of Mexico were researched to discover trends in coastal storms
(Keim et al. 2004). Results of this study showed some areas that experience recurring strikes
as opposed to those that are affected once every so often. The climatology of tropical
cyclones originating in the Atlantic was studied to examine the annual cycle of tropical
activity (Landsea 1993). This study revealed that damage from hurricane and tropical cyclone
activity is steadily increasing along with the population boom in coastal areas of the United
States. Keim et al. (2007) produced a study entitled “Return Periods of Tropical Storm and

5
Hurricane Strikes from Texas to Maine” (Figure 1.1) This thesis is a continuation of the work by Keim et al. regarding tropical storms and hurricanes in the United States.
Figure 1.1. Spatiotemporal distribution of tropical storm and hurricane strikes from Texas to Maine. Modified from Keim et al. (2007).

6
Larson et al. (2005) focused on the climatology and interannual variability of striking
tropical cyclones in the United States and Mexico, but only touches on the Caribbean. In this
paper, research was conducted on different influences on tropical cyclones, including El Niño
and La Niña in which results show that La Niña events usually produced an increase in
tropical activity in the Atlantic basin, and with opposite results for El Niño events. Areas in
the Caribbean, though, are mentioned in Landsea et al.’s (1999) analysis on Atlantic Basin
hurricanes and the effects on the storms from fluctuations in the climate. This research
determined that tropical cyclone intensity and frequency are directly impacted by variations in
the El Niño-Southern Oscillation for both the United States coast and the Caribbean (Landsea
et al. 1999). Additionally, it can be determined in this study and in research conducted by
Goldenberg et al. (2001) that the Caribbean Sea generally experiences increased hurricane
activity during periods of warmer sea surface temperatures (SST’s) as a result of variations in
the Atlantic Multi-decadal Oscillation (Goldenberg et al. 2001).
Many factors contribute to the location of the formation and landfall of tropical storms
and hurricanes, including El Niño/Southern Oscillation (Pielke, Jr. and Landsea 1999) and the
possibility of global climate change (Balling, Jr. and Cerveny 2003). In La Niña conditions,
sea surface temperatures are cooler along the coast of South America, which may result in
increased tropical cyclone activity within the Atlantic Ocean by creating a favorable upper air
environment for storm formation and development (Larson et al. 2005). These conditions,
along with heightened activity of tropical cyclones in this area, may have a significant effect
on the islands of the Caribbean (Goldenberg et al. 2001). In contrast, El Niño conditions
typically result in warm phases off the coast of South America which, in turn, produce an
increased amount of vertical wind shear in the Atlantic and Caribbean resulting in fewer
tropical storms and hurricanes (Landsea et al. 1999).

7
The idea of global warming as a contributor to the increased numbers of tropical storm
and hurricane development is introduced in many papers researching increases in storm
formation. Pielke and Landsea (1998) investigated whether human-induced climate change
contributes to enhanced weather-related impacts on society, including hurricanes and tropical
storms. This research concluded that an increase in storm-related damage and destruction is
most likely a result of societal changes, considering population, building cost increases, and
enhanced assets. Pielke at al. (2006) point out that no documented correlation between
tropical cyclones’ behavior (i.e. rainfall, sea level, and storm surge) and global warming has
been established. In contrast, research conducted by Emanuel (2005), examines global
hurricane activity and its positive relationship with the increasing global climate. Societal
changes resulting in increased destruction from weather events is brought up again in
Changnon (2003). In this study, after assessing loss from previous hazardous events the
author concludes that changes in society provide enhanced vulnerability to destruction from
storms. In opposition, Anthes et al. (2006) state that climate change will in fact impact
tropical cyclone characteristics. They conclude that global warming has a direct impact on
sea surface temperatures, which will in fact affect tropical storms and hurricanes (Anthes et
al. 2006). Webster et al. (2005) examines the idea that hurricanes are directly correlated with
consistently increasing sea surface temperatures. Although he determined that discrepancies
in hurricane statistics from year to year are too prevalent to conclude a trend is taking place,
his conclusion states that an overall increasing trend in hurricane frequency and intensity is
inevitable (Webster et al., 2005). Curry et al. (2006), note that past increases in tropical
cyclone activity is directly correlated with increases in sea surface temperatures. Also, it is
determined that greenhouse warming is increasing the intensity of tropical cyclones (Curry
2006).
8
Chapter 2: Methods
2.1 Study Area and Hurricane Data
Previous research on annual tropical storm and hurricane return periods have been
conducted on the United States, including studies by Muller and Stone (2001) and Keim et al.
(2007). Simpson and Lawrence (1971) analyzed the Gulf and East Coasts where hurricane
strikes were determined based on equally distributed 50 mile segments of coastal areas.
However, points along the United States coast chosen by Muller and Stone (2001, p. 951) are
distributed based on “well-known coastal cities, seaports, and beach resorts, and they are not
equally spaced along the coastline.” The concept of this thesis will be analogous to the
methods of Muller and Stone (2001), and Keim et al. (2007) in determining the location of
storm strike and the effects of the land in its path.
The Caribbean Islands cover an area of 1,553,016 square kilometers of the Caribbean
Sea and are inhabited by over thirty million people, not including millions of tourists that
vacation there (KEWL 2006). Locations in the Caribbean Region are extremely popular
tourist destinations and are often frequented by people from all over the world, often during
hurricane season that falls during summer when traveling is easier.
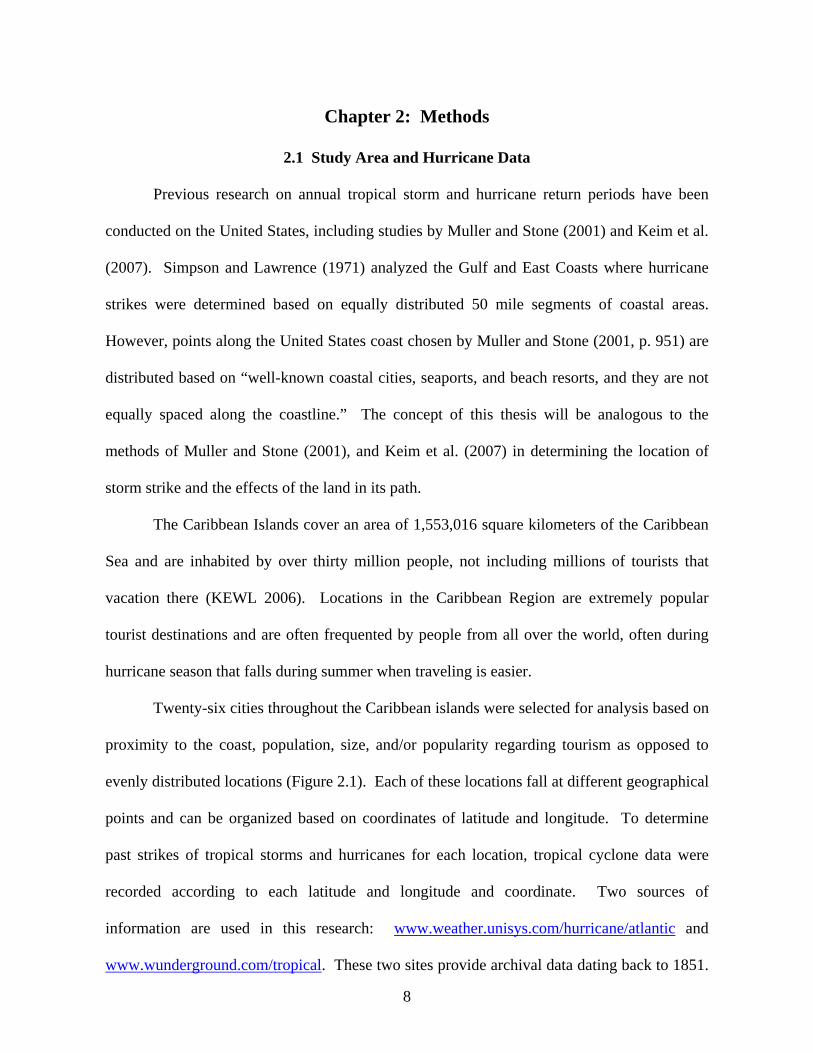
Twenty-six cities throughout the Caribbean islands were selected for analysis based on
proximity to the coast, population, size, and/or popularity regarding tourism as opposed to
evenly distributed locations (Figure 2.1). Each of these locations fall at different geographical
points and can be organized based on coordinates of latitude and longitude. To determine
past strikes of tropical storms and hurricanes for each location, tropical cyclone data were
recorded according to each latitude and longitude and coordinate. Two sources of
information are used in this research: www.weather.unisys.com/hurricane/atlantic and
www.wunderground.com/tropical. These two sites provide archival data dating back to 1851.

9
From either of these two sources, a map of the tracks of tropical storms and hurricanes can be
found along with the coordinates of the paths that the storms followed. Tropical storm and
hurricane paths vary throughout hurricane season; however, most tropical cyclones begin as
easterly tropical waves in the eastern Atlantic (Kimball and Mulekar 2004). Trade winds
blowing in the same direction steer these storms toward the west/west-northwest, in the
general direction of the Caribbean Sea. It is possible for storms to form in the Caribbean
Region, usually later in the season, as well as the Gulf of Mexico, earlier in the season.
Figure 2.1. Twenty-six locations chosen throughout the Caribbean Region for analysis of hurricane strikes.
2.2 Methods
Tropical storms and hurricanes are both included in this study and all storms can have
an extreme range of sizes and intensities (Lodge and McDowell 1991). Major hurricanes
have caused severe destruction in the Caribbean in the past, such as Hurricane Charley in
10
Cuba or Hurricane Ivan in Jamaica and Grand Cayman (Franklin et al. 2006). Less intense
tropical storms, though often times smaller in scale than hurricanes, may sometimes cause
devastating floods throughout the Caribbean Islands (Franklin et al. 2006). Tropical storms
have winds between thirty-eight and seventy-four miles per hour (61 to 119 km per hour)
while hurricanes are categorized on the Saffir-Simpson Scale and have sustained winds from
seventy-five miles per hour (121 km per hour) to wind speeds of over 155 miles (249 km per
hour) per hour. However, these storms can vary immensely in size—the eye of a hurricane is
twenty miles (thirty-two km) wide on average, but may be significantly greater in a major
category three, four, or five hurricane (Smith 1999). The radius of a tropical cyclone, which
also regularly varies, can be defined by the “location and area of threshold wind speed”
(Larson et al. 2005, p. 1248). Hurricane Bertha, for example, struck the United States as a
category 2 hurricane; however, its radius of winds measured 186 miles (300 km) and the
storm caused widespread damage (Kimball and Mulekar 2004). Hurricane Bret, in contrast,
was a category 4 hurricane whose wind radius measured only eighty-seven miles (140 km)
producing less extreme damage over a less populated area in the southern portion of Texas
(Kimball and Mulekar 2004). Variations in magnitude similar to these situations must be
taken into consideration when measuring wind speeds of tropical storms and hurricanes at
times of strike. Not only may storm size vary, the right-front quadrant of any approaching
tropical storm or hurricane characteristically contains the strongest winds and surge;
therefore, resulting in winds extending farther to the right of the storm as opposed to the left
(Muller and Stone 2001).
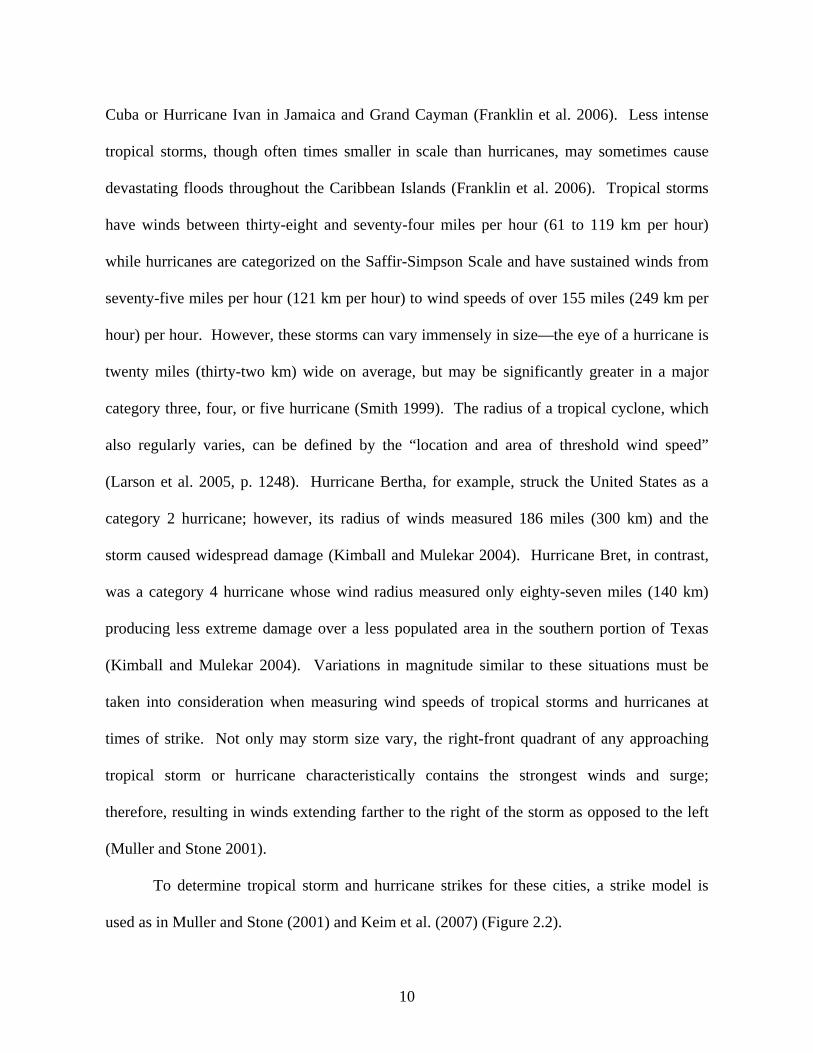
To determine tropical storm and hurricane strikes for these cities, a strike model is
used as in Muller and Stone (2001) and Keim et al. (2007) (Figure 2.2).

11
Figure 2.2 Hurricane Strike Model demonstrates the wind swath for major hurricanes (categories 3-5), minor hurricanes (categories 1-2), and tropical storms. The direction of the motion of the storm is displayed in this figure. Source: Muller and Stone (2001).
The strike model is used because the variability in storm sizes is not adequately measured and
documented (Keim et al. 2007). As a result, proximity to the storm track plays a role in the
type of strike that is recorded for any location. For example, if a category 4 hurricane passes
through the Caribbean near Kingston, Jamaica, Negril may only experience category 1
strength winds and surges. The method used by Keim et al. (2007), and by Muller and Stone
(2001), is based on the size of a storm from its radius, which may be “defined by the location
and area of threshold wind speed” that varies widely and is not necessarily proportional to
tropical cyclone intensity and its forward moving direction (Larson et al. 2005, p. 1248). The
strongest wind speeds and surges are typically felt in the front, right quadrant of a tropical
storm or hurricane (Muller and Stone 2001). Therefore, during a tropical storm, the effects of
tropical storm force winds are assumed to be felt 50 miles (80 km) to the right of the center

12
and only 25 miles (40 km) to the left. For example, Georgetown, Bahamas may experience
tropical storm force winds; however, Nassau may not experience any winds that reach tropical
storm strength. During a minor hurricane, categories one or two, hurricane force winds and
surges are assumed to be felt 50 miles (80 km) to the right of the center and 25 miles (forty
km) to the left. As well, tropical storm force winds are assumed to be felt an additional 50
miles (80 km) to the right and 25 miles (40 km) to the left. Finally, a major hurricane,
categories three, four, or five, may result in category three or higher force winds and surges
50 miles (80 km) to the right of the center and 25 miles (40 km) to the left. Minor hurricane
force winds are assumed to be felt an additional 50 miles (80 km) to the right and 25 miles (40
km) to the left, and tropical storm force winds an extra 50 miles (80 km) to the right and 25
(40 km) to the left (Muller and Stone 2001). Based on the assumption that all storms are
nearly the same, a measurement of tropical storm and hurricane wind speed size can be
accomplished with this model, which was applied to each of the study locations throughout
the Caribbean Region for tropical storm and hurricane tracks over the last century or so, from
1901 to 2006.
Using this model, all tropical cyclones were catalogued, from 1901 to 2006 (Appendix
A). In Appendix A, the twenty-six locations included in this study are in alphabetical order
according to country. During the past 106 years, 236 tropical storms, hurricanes, and major
hurricanes struck one or more of the twenty-six Caribbean cities in this study. Of those 236
tropical storms 108 hurricanes struck one or more of these cities; of the 108 hurricanes, forty-
five of these storms struck as a major hurricane. Tropical storm and hurricane observation
platforms have transformed greatly since the early 1900s (Figure 2.3). While technological
advances have taken place in recent years, records should still be significantly accurate for
landfalling tropical storms and hurricanes.

13
Figure 2.3. Changing technology in tropical storm and hurricane data observation techniques in the Atlantic Basin. Source: Neumann et al. (1993, p. 14).
2.3 Return Period Methodology
A return period can be defined as “the average period in which an event is expected to
recur once” (Chu and Wang 1998) and in this case refers to one particular coastal location on
an island in the Caribbean Region. Historical tropical storm and hurricane data were collected
for each of the twenty-six chosen cities throughout the Caribbean Region, over the past 106
years. Using the Hurricane Strike Model, each storm strike over this period of time was
analyzed to determine the strength of winds at a specific location. Based on these
conclusions, return periods were calculated for each city chosen in the Caribbean Region
according to the number of years in the dataset and the number of strikes for the particular
location. Calculations were determined for all strikes including tropical storms, minor
hurricanes, and major hurricanes.

14
Chapter 3: Return Period Analysis
3.1 Temporal Analysis
Because of the consistently warm sea surface temperatures during the months of
hurricane season in the Atlantic Ocean and the Caribbean Sea, these waters are typically
where the formation of tropical storms and cyclones begin (Landsea et al. 1999). In analyzing
the 106 years of storm data, 236 tropical storms and/or hurricanes struck one or more of the
twenty-six locations in this study (Figure 3.1).
Figure 3.1. Total number of tropical storms/hurricanes striking over 106 years for twenty-six chosen locations in the Caribbean Region.
The waters of the Caribbean Region cover an extensive latitude and longitude range, from
12.1°N to 25°N and 61°W to 82.8°W therefore allowing tropical storms and hurricanes ample
time to form and grow into intense storms as shown in the tropical storm and hurricane paths
in Appendix B (Kimball and Mulekar 2004). The Caribbean Sea, in conjunction with the
North Atlantic ocean, experiences fluctuations in sea surface temperatures on an annual basis.
In the annual cycle, sea surface temperatures peak around September 10, on the average,
which is close to the mid-point of the hurricane season. However, sea surface temperatures in
Tropical Storm and Hurricane Landfalls
0
2
4
6
8
10
12
1901
1905
1909
1913
1917
1921
1925
1929
1933
1937
1941
1945
1949
1953
1957
1961
1965
1969
1973
1977
1981
1985
1989
1993
1997
2001
2005
Year
Car
ibbe
an L
andf
all
15
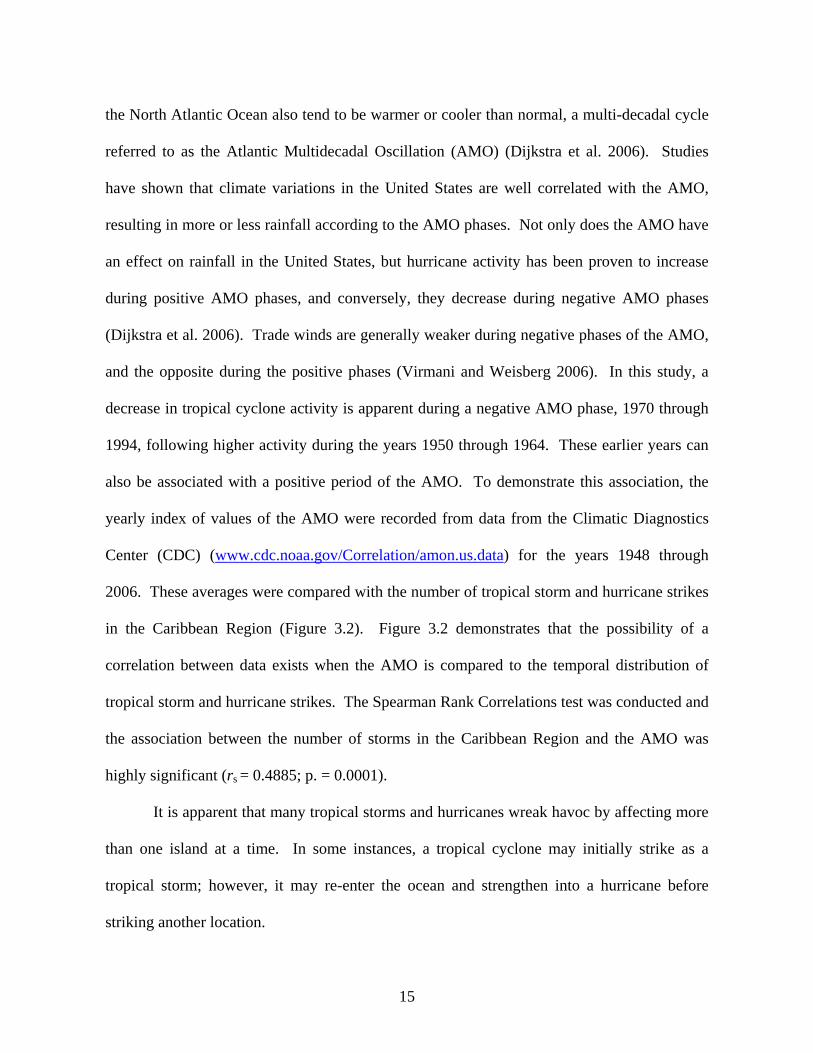
the North Atlantic Ocean also tend to be warmer or cooler than normal, a multi-decadal cycle
referred to as the Atlantic Multidecadal Oscillation (AMO) (Dijkstra et al. 2006). Studies
have shown that climate variations in the United States are well correlated with the AMO,
resulting in more or less rainfall according to the AMO phases. Not only does the AMO have
an effect on rainfall in the United States, but hurricane activity has been proven to increase
during positive AMO phases, and conversely, they decrease during negative AMO phases
(Dijkstra et al. 2006). Trade winds are generally weaker during negative phases of the AMO,
and the opposite during the positive phases (Virmani and Weisberg 2006). In this study, a
decrease in tropical cyclone activity is apparent during a negative AMO phase, 1970 through
1994, following higher activity during the years 1950 through 1964. These earlier years can
also be associated with a positive period of the AMO. To demonstrate this association, the
yearly index of values of the AMO were recorded from data from the Climatic Diagnostics
Center (CDC) (www.cdc.noaa.gov/Correlation/amon.us.data) for the years 1948 through
2006. These averages were compared with the number of tropical storm and hurricane strikes
in the Caribbean Region (Figure 3.2). Figure 3.2 demonstrates that the possibility of a
correlation between data exists when the AMO is compared to the temporal distribution of
tropical storm and hurricane strikes. The Spearman Rank Correlations test was conducted and
the association between the number of storms in the Caribbean Region and the AMO was
highly significant (rs = 0.4885; p. = 0.0001).
It is apparent that many tropical storms and hurricanes wreak havoc by affecting more
than one island at a time. In some instances, a tropical cyclone may initially strike as a
tropical storm; however, it may re-enter the ocean and strengthen into a hurricane before
striking another location.
16
Atlantic Multi Decadal Oscillation (AMO) and Tropical Storm Strikes (1948 through 2006)
0
1
2
3
4
5
6
1949 1954 1959 1964 1969 1974 1979 1984 1989 1994 1999 2004
Year
Car
ibbe
an S
trik
es
-0.5
-0.4
-0.3
-0.2
-0.1
0
0.1
0.2
0.3
0.4
0.5
AM
O V
alue
s
Figure 3.2. Tropical storm and hurricane strikes associated with the Atlantic Multidecadal Oscillation (AMO) sea surface temperature value departures from the normal, from 1949 through 2006 (http://www.cdc.noaa.gov/Correlations /amon.us.data).
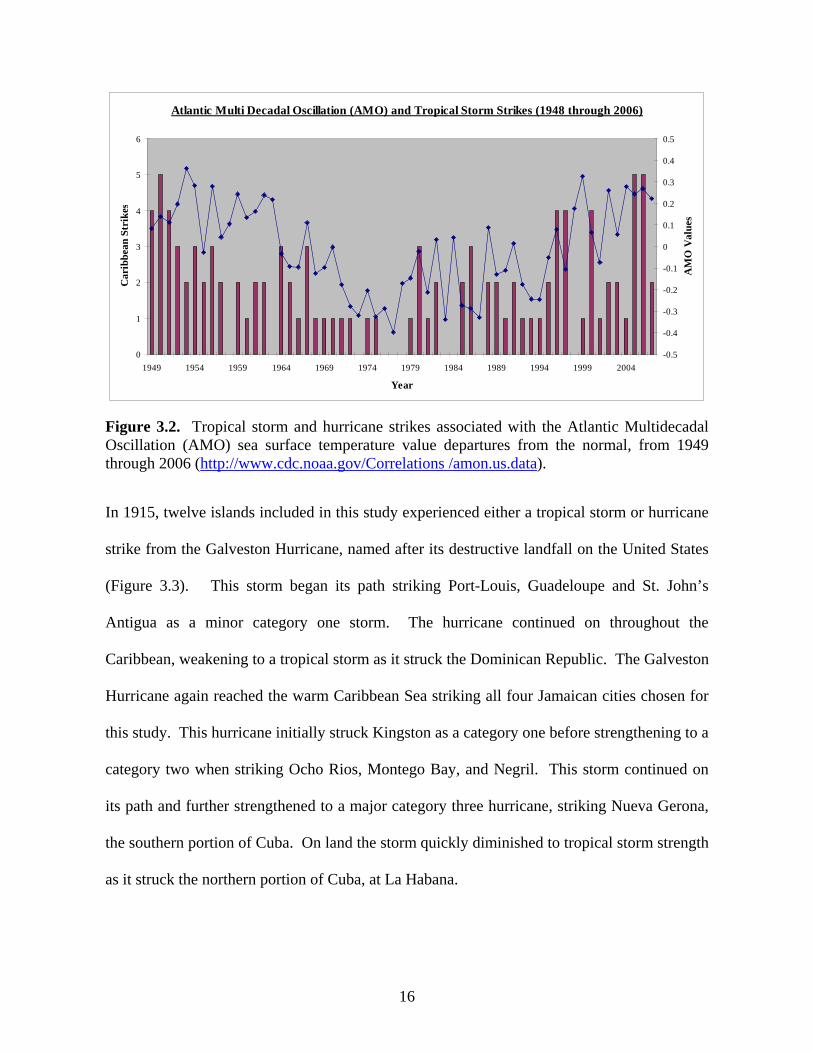
In 1915, twelve islands included in this study experienced either a tropical storm or hurricane
strike from the Galveston Hurricane, named after its destructive landfall on the United States
(Figure 3.3). This storm began its path striking Port-Louis, Guadeloupe and St. John’s
Antigua as a minor category one storm. The hurricane continued on throughout the
Caribbean, weakening to a tropical storm as it struck the Dominican Republic. The Galveston
Hurricane again reached the warm Caribbean Sea striking all four Jamaican cities chosen for
this study. This hurricane initially struck Kingston as a category one before strengthening to a
category two when striking Ocho Rios, Montego Bay, and Negril. This storm continued on
its path and further strengthened to a major category three hurricane, striking Nueva Gerona,
the southern portion of Cuba. On land the storm quickly diminished to tropical storm strength
as it struck the northern portion of Cuba, at La Habana.
17
Figure 3.3. Galveston Hurricane track, 1915. Source: Hurrevac Program.
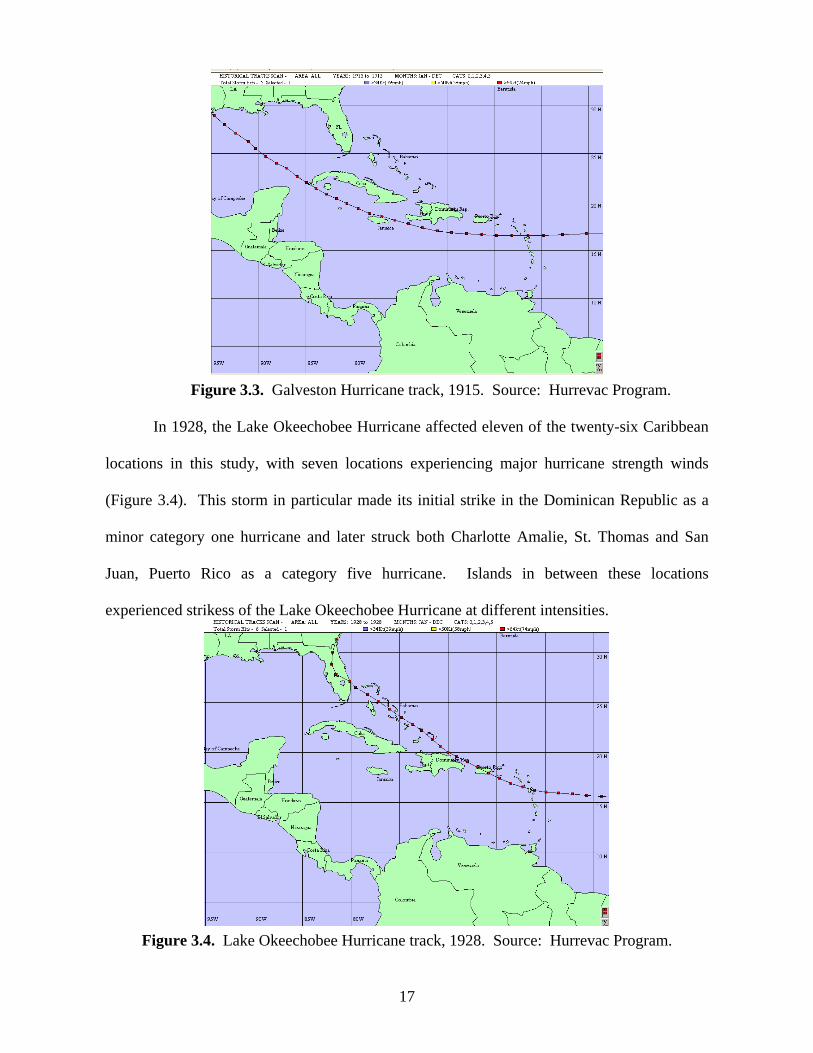
In 1928, the Lake Okeechobee Hurricane affected eleven of the twenty-six Caribbean
locations in this study, with seven locations experiencing major hurricane strength winds
(Figure 3.4). This storm in particular made its initial strike in the Dominican Republic as a
minor category one hurricane and later struck both Charlotte Amalie, St. Thomas and San
Juan, Puerto Rico as a category five hurricane. Islands in between these locations
experienced strikess of the Lake Okeechobee Hurricane at different intensities.
Figure 3.4. Lake Okeechobee Hurricane track, 1928. Source: Hurrevac Program.
18
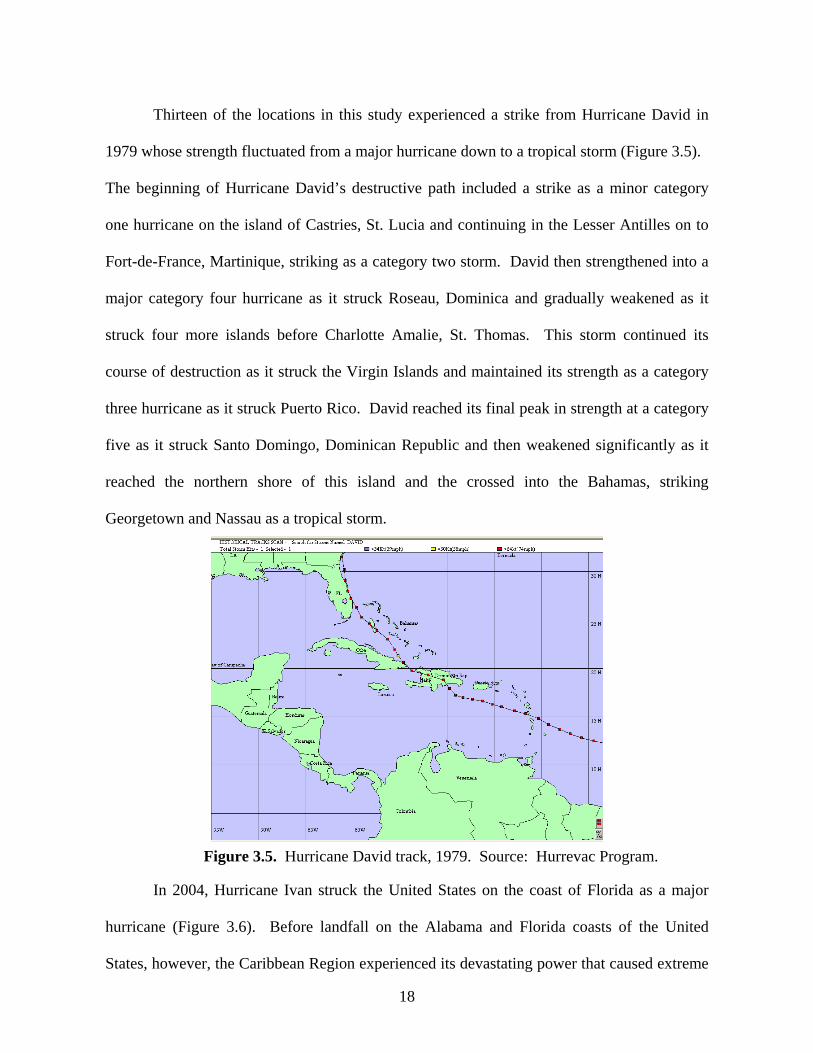
Thirteen of the locations in this study experienced a strike from Hurricane David in
1979 whose strength fluctuated from a major hurricane down to a tropical storm (Figure 3.5).
The beginning of Hurricane David’s destructive path included a strike as a minor category
one hurricane on the island of Castries, St. Lucia and continuing in the Lesser Antilles on to
Fort-de-France, Martinique, striking as a category two storm. David then strengthened into a
major category four hurricane as it struck Roseau, Dominica and gradually weakened as it
struck four more islands before Charlotte Amalie, St. Thomas. This storm continued its
course of destruction as it struck the Virgin Islands and maintained its strength as a category
three hurricane as it struck Puerto Rico. David reached its final peak in strength at a category
five as it struck Santo Domingo, Dominican Republic and then weakened significantly as it
reached the northern shore of this island and the crossed into the Bahamas, striking
Georgetown and Nassau as a tropical storm.
Figure 3.5. Hurricane David track, 1979. Source: Hurrevac Program.
In 2004, Hurricane Ivan struck the United States on the coast of Florida as a major
hurricane (Figure 3.6). Before landfall on the Alabama and Florida coasts of the United
States, however, the Caribbean Region experienced its devastating power that caused extreme

19
damage in Jamaica and Grand Cayman (Franklin et al. 2006). Hurricane Ivan struck twelve
different locations out of the twenty-six Caribbean areas in this study. Unlike many of the
other storms that struck the Caribbean islands within this time frame, Ivan initially passed
further south than the usual storm path. Ivan struck the island of Grenada as a major
hurricane, category three, and remained on a westward path. The storm weakened after
landfall, and passed Martinique as a tropical storm before striking Oranjestad, Aruba as a
category one storm. As the storm made a northward turn, the warm sea surface temperatures
enabled it to strengthen before it made struck Jamaica and Grand Cayman as a major storm,
Cuba as a minor hurricane, and onto the United States. The storm moved on, increasing again
in strength lasting a record ten total days as a major hurricane (Franklin et al. 2006).
Figure 3.6. Hurricane Ivan track, 2004. Source: Hurrevac Program.
In contrast to the above mentioned multi-striking storms, numerous tropical storms
and hurricanes affected only one location in their paths. In 1905, St. George’s, Grenada was
struck by Tropical Storm Number One (Figure 3.7). This was the sole island to experience
this particular storm. The only affected area in this study by Hurricane Easy in 1950 was
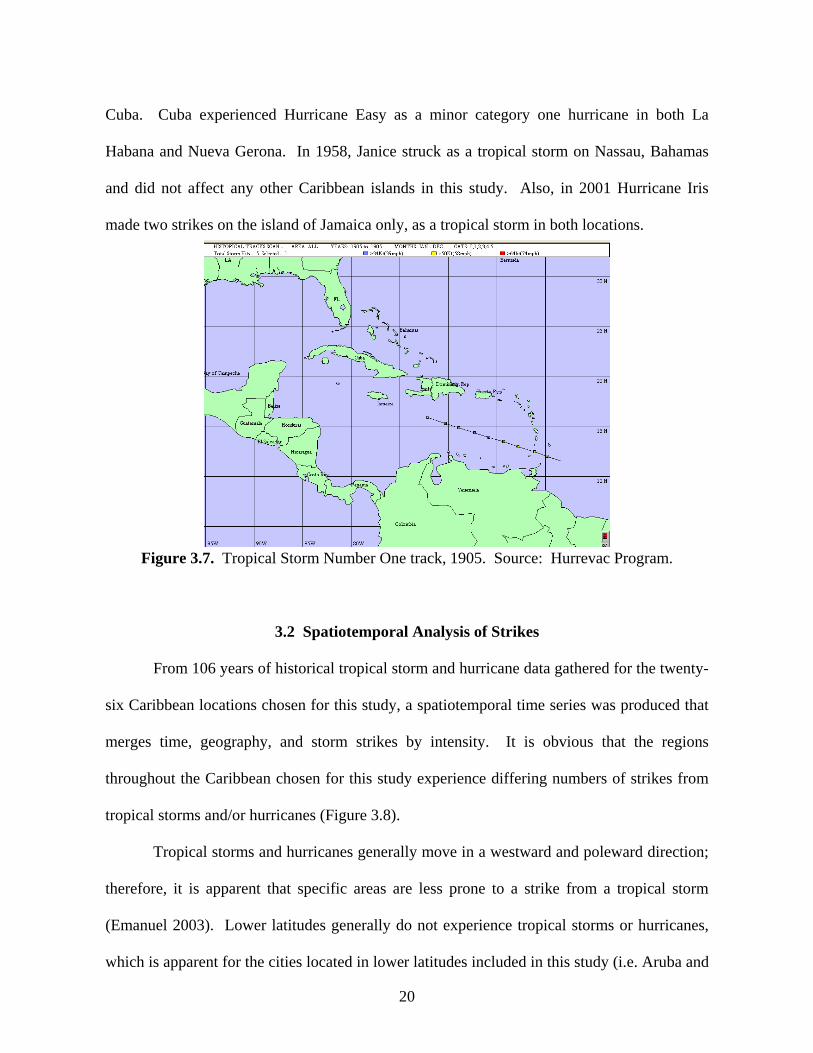
20
Cuba. Cuba experienced Hurricane Easy as a minor category one hurricane in both La
Habana and Nueva Gerona. In 1958, Janice struck as a tropical storm on Nassau, Bahamas
and did not affect any other Caribbean islands in this study. Also, in 2001 Hurricane Iris
made two strikes on the island of Jamaica only, as a tropical storm in both locations.
Figure 3.7. Tropical Storm Number One track, 1905. Source: Hurrevac Program.
3.2 Spatiotemporal Analysis of Strikes
From 106 years of historical tropical storm and hurricane data gathered for the twenty-
six Caribbean locations chosen for this study, a spatiotemporal time series was produced that
merges time, geography, and storm strikes by intensity. It is obvious that the regions
throughout the Caribbean chosen for this study experience differing numbers of strikes from
tropical storms and/or hurricanes (Figure 3.8).
Tropical storms and hurricanes generally move in a westward and poleward direction;
therefore, it is apparent that specific areas are less prone to a strike from a tropical storm
(Emanuel 2003). Lower latitudes generally do not experience tropical storms or hurricanes,
which is apparent for the cities located in lower latitudes included in this study (i.e. Aruba and

21
Curacao). Cities located at higher latitudes within the study region experienced much higher
numbers of striking tropical storms and hurricanes.
Comparisons in the spatiotemporal aspect of tropical storm and hurricane strikes may
be made between Figure 3.8 from this study and the Time Series (Figure 4) from Keim et al.
(2007). Both time series analyses display a significant amount of storms during the mid
1920s through the early 1930s. Keim et al. (2007) shows clusters of the storms during this
time making landfall mostly on the coast of Florida and around the Gulf Coast. During the
same time period, this study shows major clusters around the northern part of the Caribbean
Region on islands such as the Bahamas and the northernmost islands of the Lesser Antilles
(i.e. Puerto Rico and St. Thomas). One conclusion that could be determined from this
comparison is that most storms in the 1920s and 1930s that struck these specific regions of the
Caribbean continued on to the southern portion of the United States.
In comparing these two figures, one aspect stands out during the 1940s (Figure 1.1).
Keim et al. (2007) also shows these years to be considerably active, while this study’s time
series shows a lull in tropical storm and hurricane activity. A small cluster can be seen for
this time period, with storms again striking around the Bahamas and Cuba; however, this
cluster quickly fades as the Caribbean geography extends further southward. Storms during
this time period could have possibly passed through the Bahamas or further north before
making landfall on Florida’s coast, as seen in the study by Keim et al. (2007). In the 1950s,
this study’s time series figure shows a decrease in strike frequency. The same decrease is
apparent in Keim et al.; however, clusters have moved toward the eastern coast of the United
States. A significant decrease in striking tropical storms and hurricanes occurs during the
1960s and 1970s in both studies, with activity not significantly increasing until the 1990s,
22
most likely related to negative AMO conditions. This increase is apparent throughout the rest
of both studies, through 2006, as the AMO shifted to positive (Keim et al. 2007).
Beginning with the northernmost cities of this study in the Greater Antilles, Nassau
and Georgetown, Bahamas, tropical storm and hurricane activity is at its highest. Nassau
alone experienced forty-two storm strikes over the past 106 years, while Georgetown
experienced thirty-four. Seventeen major hurricanes struck the Bahamas during this time
period—ten of which struck Nassau, which is the greatest of all twenty-six locations
examined. The majority of these major hurricanes striking Nassau occurred during the 1920s
and 1930s.
In Cuba, the cities La Habana, Nueva Gerona, and Santiago de Cuba are examined.
All three locations experienced high frequencies of tropical storm and hurricane strikes over
the 106 year dataset, with the bulk of storms striking before 1960. The lowest frequencies are
found at Santiago de Cuba with twenty-five total storms. Nueva Gerona, the westernmost city
examined in Cuba experienced the highest numbers of strikes out of all Caribbean locations,
including forty-three total storms along with seven major hurricanes. Hurricane Charley
struck La Habana in 2004 as a major category three hurricane as well as Hurricane Number 5
in 1910 and Hurricane Number 10 in 1926.
South of Cuba lies Georgetown, Grand Cayman, a significantly smaller island when
compared to Cuba. Georgetown experienced thirty-seven total storms over the 106 year
dataset with, surprisingly, only one major hurricane. Hurricane Ivan struck Georgetown,
Grand Cayman, in 2004, causing catastrophic damage to the island (Franklin et al. 2006). The
remaining tropical storms and hurricanes that struck this island also occurred before 1960.
The four locations included in this study on the island of Jamaica (Kingston, Montego
Bay, Negril, and Ocho Rios) experienced an average of twenty-four total storm strikes, mostly

23
Figure 3.8. Spatiotemporal distribution of all tropical storm and hurricane strikes for twenty-six locations throughout the
Caribbean Region.

24
before 1950 and after 2000. Note that each city on the island may be affected by the same
passing hurricane. Further east of Grand Cayman and Cuba is the large island of Hispanola—
consisting of Haiti and the Dominican Republic, along with the tiny island of the Turks and
Caicos. Port-Au-Prince, Haiti, the westernmost location chosen for this study in this
particular location in the Caribbean Region, experienced similar circumstances over the past
hundred years as did Cuba, with a total of thirty tropical storm and hurricane strikes on the
island. However, an increase in storms is apparent for this location between the years 1950
and 1960. Eighteen of the storms that struck here were tropical storms, while four made
struck as major hurricanes. Storm strikes on Santo Domingo, Dominican Republic were also
similar to the numbers from Port-Au-Prince; however, a slight increase in total minor
hurricane strikes was recorded at this location. Santo Domingo experienced a majority of
storm strikes before 1940; however, an increase is apparent in the 1960s. On the tiny island
of the Turks and Caicos, Grand Turk experienced thirty-three total storms with six being
major hurricanes. Five of the six major hurricanes that struck this location occurred before
1961. The final location within the Greater Antilles is San Juan, Puerto Rico. Results for
total tropical storm and hurricane strikes on this island continue the trend of high numbers of
total storms with thirty-one overall, including six major hurricanes. Overall, the Greater
Antilles experienced a large portion of the tropical storms and hurricanes that formed and/or
traveled throughout the Caribbean Sea. All cities within this area each experienced no less
than nineteen total tropical storm or hurricane strikes. Many of the total numbers of storms
that struck specific islands included strikes from major hurricanes, yet many more included
tropical storm strikes.
Gradual changes in the distribution of tropical storm and hurricane strikes occurred on
the islands making up the Lesser Antilles. The Virgin Islands, which includes some of the
25
most popular tourist locations in the Caribbean Region, make up the northernmost portion of
the Lesser Antilles for this particular study. Charlotte Amalie, St. Thomas lies directly east of
Puerto Rico and experienced a total of thirty-five total tropical storms and hurricanes over the
106 year dataset. Of these thirty-five storms, eighteen made struck on St. Thomas as tropical
storms, fourteen were minor hurricanes, and three made struck as major hurricanes. One of
these major storms made struck in 1928 at this location, in the midst of a cluster of striking
storms between 1920 and 1933. Eventually named for its landfall on the Florida coast of the
United States, the Lake Okeechobee Hurricane struck Charlotte Amalie in 1928 as a severe
category five hurricane before moving on to San Juan, Puerto Rico. Further east lies Marigot,
St. Martin whose tropical storm and hurricane strike record is the third highest, below Nueva
Gerona, Cuba and Nassau, Bahamas. Thirty-eight total storms struck the island of St. Martin
during this time period with five of these being major storms. In 1950 Hurricane Donna made
struck Marigot as a category three hurricane, followed by Hurricane Hugo in 1989 and
Hurricane Lenny in 1999, both striking as category three storms. The Valley, Anguilla and
Basseterre, St. Kitts/Nevis experienced somewhat similar results for total striking storms at
thirty and thirty-one respectively. While both locations’ records include ten minor hurricanes,
small differences are apparent with six major hurricanes for Anguilla and five for St.
Kitts/Nevis. Tropical storm strikes also differ in this area in that fourteen struck Anguilla and
sixteen on St. Kitts/Nevis. In 1995, for example Hurricane Luis struck The Valley as a major
category four hurricane; however, weakened as it struck Basseterre as a minor category two
storm. Continuing into the Lesser Antilles, St. John’s, Antigua and Port Louis, Guadeloupe
are both cities that have high records of striking tropical storms and hurricanes; however,
gradually decreasing further southward (i.e. St. John’s experienced six more total storms than
Port Louis, further south in the Lesser Antilles). These five locations, Marigot, The Valley,

26
Basseterre, St. John’s, and Port-Louis, all experienced a significant portion of striking tropical
storms between 1920 and 1933, with an increase in the 1990s. Roseau, Dominica experienced
a total of twenty-six hurricanes and tropical storm strikes, only two of which were major
hurricanes. These two storms struck in 1964 and 1979, respectively. Similarly, Fort-de-
France, Martinique had a record of twenty-eight total tropical storm and hurricane strikes with
only one being a major hurricane. The sole major hurricane that struck Martinique was
category three Hurricane Allen in 1980, while Dominica was affected by both category three
Cleo in 1964 and category four David in 1979. Castries, St. Lucia and St. George’s, Grenada
are the final islands for this study that are located in the Lesser Antilles. St. Lucia,
significantly north of Grenada, experienced a total of twenty-six tropical storm and hurricane
strikes. However, Grenada’s record included only seventeen total storms. Although Grenada
was affected by a lesser number of storms as compared to St. Lucia, three of the storms were
classified as major hurricanes. St. Lucia only experienced one major hurricane, category four
Hurricane Allen in 1980.
Two additional islands in the extreme southern portion of the Caribbean Region are
also included in this study: Willemstad, Curacao and Oranjestad, Aruba. Located south of
most tropical storm and hurricane tracks, both locations experienced the smallest number of
total storm strikes with only seven in Curacao and eleven in Aruba. Out of these storms, not
one major hurricane struck Willemstad, while only one struck Oranjestad since 1901. Before
striking and causing complete destruction in the Greater Antilles, Hurricane Ivan struck Aruba
as a major category four hurricane in 2004. Before its strengthening and strike on Aruba,
Ivan struck Willemstad as a category one hurricane, the only other hurricane striking this
island in 106 years other than Hurricane Joan in 1988 which was also a category one storm.

27
3.3 Tropical Storm and Hurricane Return Periods
For the 106 year dataset, including the years 1901 through 2006, return periods for
tropical storm and hurricane strikes were calculated. The goal in calculating a set return
period is to determine the average period in which a storm of a certain magnitude is expected
to recur once (Chu and Wang 1998). In the future, these data may offer insight on the
“chances” of strikes in future hurricane seasons (Muller and Stone 2001). While these
calculations provide a useful tool to compare past data, the return periods should not be
considered predictions of future strikes (Muller and Stone 2001). Return periods calculated
for the twenty-six Caribbean cities chosen in this study demonstrate a range of intervals in
which a strike is expected, beginning with the northernmost islands of the study (Figure 3.9).
Return periods for each island’s total tropical storms and hurricanes together
are fairly evenly distributed. No island exceeds a return period greater than fifteen years for
all striking storms with most locations not exceeding five years; however, variations grow
widely as storms become more specific in terms of minor or major hurricanes. Return period
calculations for striking tropical storms includes all storms striking a particular location,
including minor and major hurricanes. The average return period for tropical storms for all
twenty-six islands in the study is four years. Return periods for the northernmost islands such
as Nassau, Bahamas, are as low as two years while islands in the extreme southern portions of
the study area reach up to a fifteen year return periods for a tropical storm or hurricane strike.
These southern regions include areas such as Curacao and Aruba, where tropical storm and
hurricane strikes are minimal. Seven islands have an average return period of four years for
all tropical storm and hurricane strikes, including Santiago de Cuba, Roseau, Kingston,
Montego Bay, Negril, Ocho Rios, and Castries.
28
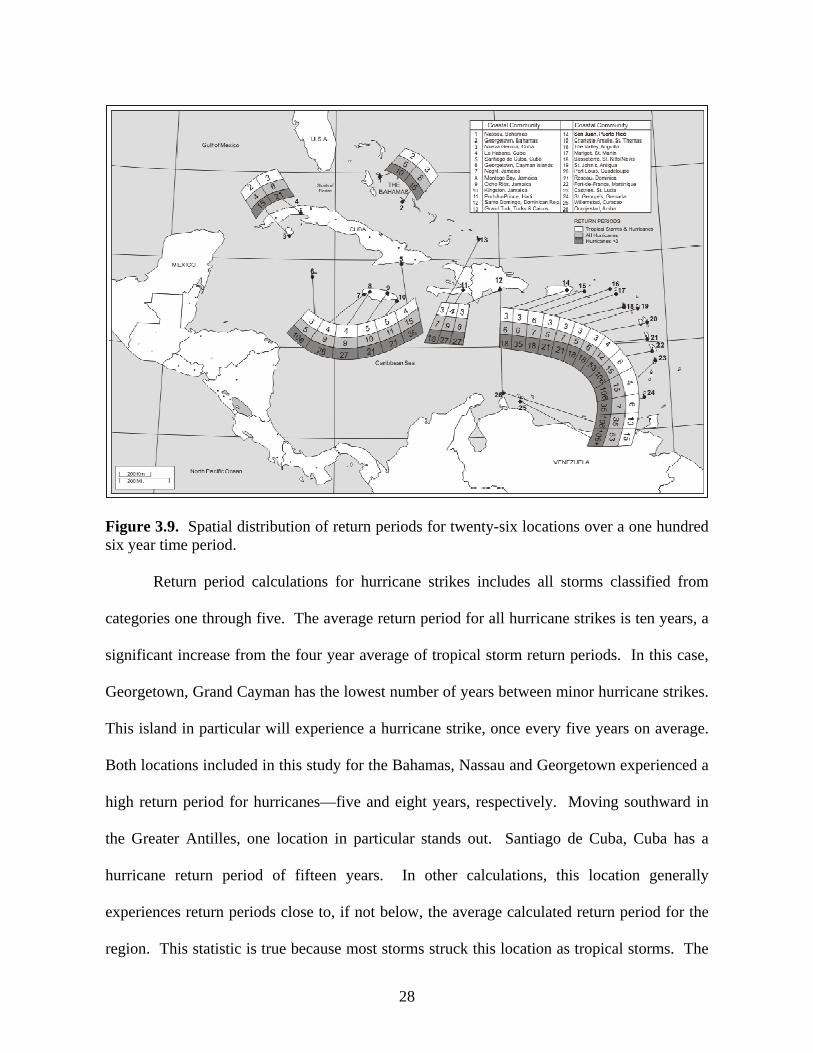
Figure 3.9. Spatial distribution of return periods for twenty-six locations over a one hundred six year time period. Return period calculations for hurricane strikes includes all storms classified from
categories one through five. The average return period for all hurricane strikes is ten years, a
significant increase from the four year average of tropical storm return periods. In this case,
Georgetown, Grand Cayman has the lowest number of years between minor hurricane strikes.
This island in particular will experience a hurricane strike, once every five years on average.
Both locations included in this study for the Bahamas, Nassau and Georgetown experienced a
high return period for hurricanes—five and eight years, respectively. Moving southward in
the Greater Antilles, one location in particular stands out. Santiago de Cuba, Cuba has a
hurricane return period of fifteen years. In other calculations, this location generally
experiences return periods close to, if not below, the average calculated return period for the
region. This statistic is true because most storms struck this location as tropical storms. The
29
minor hurricane return periods for both Montego Bay and Negril, Jamaica are eight years;
however, Ocho Rios and Kingston’s return periods are slightly higher—nine and ten years,
respectively. Marigot and St. John are both locations that will experience a hurricane once
every four or five years. Hurricane return period durations increase at more southward
islands. Martinique and St. Lucia are both islands with hurricane return periods of fifteen
years or greater. Curacao and Aruba, though, remain as the islands with return periods
indicating the rareness of the storms, with fifty-three years between a striking hurricane for
Curacao and thirty-five years between hurricane strikes for Aruba.
The largest return period calculations are for major hurricanes, categories three, four,
and five. Major hurricanes obviously had the fewest numbers of total strikes. The average
return period of major hurricane strikes for the twenty-six locations in this study is thirty-six
years, excluding Willemstad, Curacao which did not experience a major tropical storm in this
time period. As was the case for tropical storm return periods, Nassau, Bahamas, experienced
the most major hurricane strikes. Consequently, the return period of major hurricanes for
Nassau, Bahamas is only ten years. As the geography of islands moves southward, return
periods for major hurricanes increases for most cites. Cuba will experience a major hurricane
every fifteen to thirty-five years, based on calculations from all three Cuban cities included in
this study. Santiago de Cuba experienced the least number of major hurricane strikes on the
island, resulting in a return period of thirty-five years. Surprisingly, Georgetown, Grand
Cayman experienced only one major hurricane strike within the 106 year dataset. Hurricane
Ivan struck this island in 2004, giving this location a 106 year return period for major
hurricanes. Two cities in Jamaica will experience a major hurricane every twenty-one
years—Kingston and Ocho Rios, while the major hurricane return periods in Negril and
Montego Bay is twenty-six years. Moving southward towards Haiti and the Dominican
30
Republic, return periods for major hurricanes basically remain the same. Haiti’s return period
calculations are the same as Negril and Montego Bay, Jamaica, as well as the Dominican
Republic with a return period of twenty-six years for major hurricanes. Santo Domingo,
Dominican Republic experienced four major hurricanes within the 106 year dataset:
Hurricane Number Two in 1930, Hurricane Inez in 1966, Hurricane Beulah in 1967, and
Hurricane David in 1979. Return periods of major hurricanes continue to fluctuate
throughout the Caribbean islands, with a significant decrease to the south of the Dominican
Republic. Both Grand Turk and San Juan will experience a storm of this magnitude every
seventeen years, while further southeast, St. Thomas will only experience a major hurricane
every thirty-five years. A decrease in occurrence rates is evident once again in more south
islands such as St. Martin, Anguilla, St. Kitts, Antigua, and Guadeloupe. These islands’
major hurricane return periods range from seventeen to twenty-one years. This steady range
of return periods is interrupted further south in the Lesser Antilles. Fort-de-France,
Martinique has a 106 year return period for major hurricanes, after experiencing Hurricane
Allen in 1980 as a category three storm. St. Lucia also has a major hurricane return period of
106 years after experiencing only one major hurricane in the 106 year dataset. A slight
decrease in return periods is evident for St. George’s Grenada at thirty-five years; however, a
severe increase occurs at Willemstad, Curacao which did not experience a major hurricane
strike anytime between 1901 and 2006. The return period of major hurricanes at this location
can be classified as 106 plus years. Aruba, as the southwestern most island in the dataset, will
only experience a major hurricane every 106 years.
Many of the tropical storms and hurricanes that struck in the Caribbean Region moved
on to cause deadly destruction on the United States (Table 3.1).

31
Table 3.1. Top 10 Deadliest U.S. Storms (www.wunderground.com/hurricane/usdeadly.asp).
Rank Name Year Category Deaths Strikes in Greater/Lesser
Antilles 1 Great Galveston
Hurricane (TX) 1900 4 8000
2 FL (Lake Okeechobee)
1928 4 2500 X
3 Katrina (LA/MS/FL/GA/AL)
2005 3 1350 X
4 Cheniere Caminanda (LA)
1893 4 1100-1400
5 Sea Islands (SC/GA)
1893 3 1000-2000
6 GA/SC
1881 2 700
7 Great Labor Day Hurricane (FL Keys)
1935 5 408 X
8 Last Island (LA)
1856 4 400
9 Audrey (SW LA/N TX)
1957 4 390
10 LA (Grand Isle)
1909 4 350 X
The Lake Okeechobee Hurricane in 1928 affected eleven of the twenty-six Caribbean
locations in this study before making landfall in the United States as a category four
hurricane. Before its final landfall in the United States, this storm affected both Bahamian
locations in this study as a major hurricane. Hurricane Katrina caused devastation on the Gulf
Coast of the United States; however, it began its path in the Caribbean striking the Bahamas
as well as the Cayman Islands as a tropical storm. Similar to Hurricane Katrina, the Great
Labor Day Hurricane in 1935 also struck both locations of the Bahamas chosen for this study,
as a tropical storm. Hurricane Audrey, however, did not affect any islands in the Caribbean
Region before making landfall in the United States. The Grand Isle, LA Hurricane in 1909
affected three Caribbean locations included in this study: Cayman Islands, Jamaica, and
32
Cuba. Only three cities within these countries experienced a strike from this storm, ranging
from a tropical storm to a category one hurricane.

33
Chapter 4: Influences on Hurricane Strikes
4.1 El Niño—Southern Oscillation
One major factor that influences tropical storm activity throughout the world is the El
Niño—Southern Oscillation (ENSO) pattern. As defined by Trenberth (1997), El Niño
(Spanish for the “boy Christ child”) was the designated name for the warm, southerly-moving
current along the coast of South America near Peru which often occurred during the
Christmas season. This process is best described as a fluctuation in the normal occurrences in
the ocean-atmospheric structure every few years (Landsea et al. 1999). Although the change
in ocean temperature is noticeable in one specific area of the world, climate is affected
globally. Within the ENSO, two specific extremes may occur; El Niño and La Niña. A broad
description of an El Niño event is the occurrence of warmer than average sea surface
temperatures in the Pacific Ocean (Pielke and Landsea 1999). The irregularity in temperature
is recognized when sea surface temperatures have reached 0.5ºC (32.9ºF) greater than the
average, for six successive months (Bove et al. 1998). This pronounced activity, in turn,
produces increased vertical wind shear in the prominent region for tropical storm and
hurricane formation, and disturbs the formation and duration of these storms (Landsea et al.
1999). With an increase in vertical wind shear, conditions become hostile for tropical storm
formation (Keim et al. 2004). Studies have determined that the probability of a tropical storm
or hurricane strike is lessened during an El Niño event, particularly during stronger phases of
the cycle (Lyons 2004). An overall 10% decrease in the number of tropical storm and
hurricane formations is likely during an El Niño event in the Atlantic region, and only 20% of
all storms will actually make landfall (Larson et al. 2005). It is often perceived that only the
Atlantic Ocean is strongly affected by this process; however, other regions of the world may
experience significant changes in the formation of tropical storms. A strong El Niño event

34
has been proven to decrease landfalling tropical storms and hurricanes along the coast of
South China (Liu and Chan 2003). Trenberth (1997) states that El Niño and La Niña events
generally last one year, 50% of all years can be designated either an El Niño or a La Niña
event.
In contrast, a La Niña event occurs when sea surface temperatures are consistently
below average for at least six consecutive months (Bove et al. 1998). Unlike El Niño
conditions, La Niña is typically associated with a decrease in vertical wind shear in the
Atlantic Basin, therefore allowing tropical storm formation as well as significant growth in
the storms (Bove et al. 1998). Muller and Stone (2001) reveal an increase in hurricanes
during past La Niña seasons, along with the opposite results during El Niño conditions.
Larson et al. (2005) determines that a 15% increase in tropical storm and hurricane formation
is likely, on average, during a La Niña event. Additionally, almost one-third of all tropical
storms and hurricanes formed during these conditions will make landfall (Larson et al. 2005).
With significant increases in tropical storm and hurricane formation, it is inferred that a La
Niña event will generate extensively more damage than experienced during El Niño (Keim et
al. 2004).
Strong El Niño events recorded in history are reflected in the Caribbean Region
hurricane recurrence research in this thesis. Specific years in which intense El Niño events
occurred are easily compared to the lack of tropical storm and hurricane strikes for certain
time periods in the 106 year dataset included in this research (Table 4.1). In Table 4.1, a
slight difference is apparent in the averages numbers of tropical storm and hurricane numbers.
The averages for tropical storms, hurricanes, and major hurricanes are all slightly lower
during El Niño events than those averages found for the La Niña events. To determine
whether or not the frequencies between El Niño and La Niña events are statistically different,
35
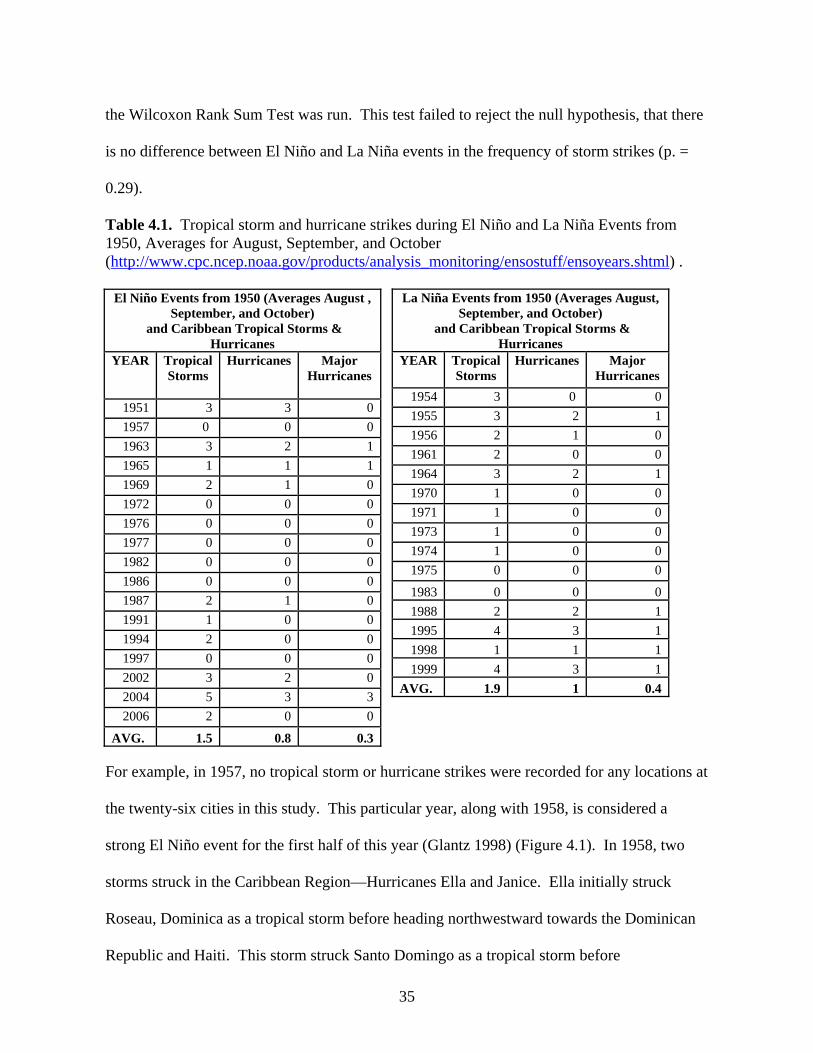
the Wilcoxon Rank Sum Test was run. This test failed to reject the null hypothesis, that there
is no difference between El Niño and La Niña events in the frequency of storm strikes (p. =
0.29).
Table 4.1. Tropical storm and hurricane strikes during El Niño and La Niña Events from 1950, Averages for August, September, and October (http://www.cpc.ncep.noaa.gov/products/analysis_monitoring/ensostuff/ensoyears.shtml) .
La Niña Events from 1950 (Averages August, September, and October)
and Caribbean Tropical Storms & Hurricanes
YEAR Tropical Storms
Hurricanes Major Hurricanes
1954 3 0 01955 3 2 11956 2 1 01961 2 0 01964 3 2 11970 1 0 01971 1 0 01973 1 0 01974 1 0 01975 0 0 0
1983 0 0 01988 2 2 11995 4 3 11998 1 1 11999 4 3 1
AVG. 1.9 1 0.4
For example, in 1957, no tropical storm or hurricane strikes were recorded for any locations at
the twenty-six cities in this study. This particular year, along with 1958, is considered a
strong El Niño event for the first half of this year (Glantz 1998) (Figure 4.1). In 1958, two
storms struck in the Caribbean Region—Hurricanes Ella and Janice. Ella initially struck
Roseau, Dominica as a tropical storm before heading northwestward towards the Dominican
Republic and Haiti. This storm struck Santo Domingo as a tropical storm before
El Niño Events from 1950 (Averages August , September, and October)
and Caribbean Tropical Storms & Hurricanes
YEAR Tropical Storms
Hurricanes Major Hurricanes
1951 3 3 01957 0 0 01963 3 2 11965 1 1 11969 2 1 01972 0 0 01976 0 0 01977 0 0 01982 0 0 01986 0 0 01987 2 1 01991 1 0 01994 2 0 01997 0 0 02002 3 2 02004 5 3 32006 2 0 0
AVG. 1.5 0.8 0.3
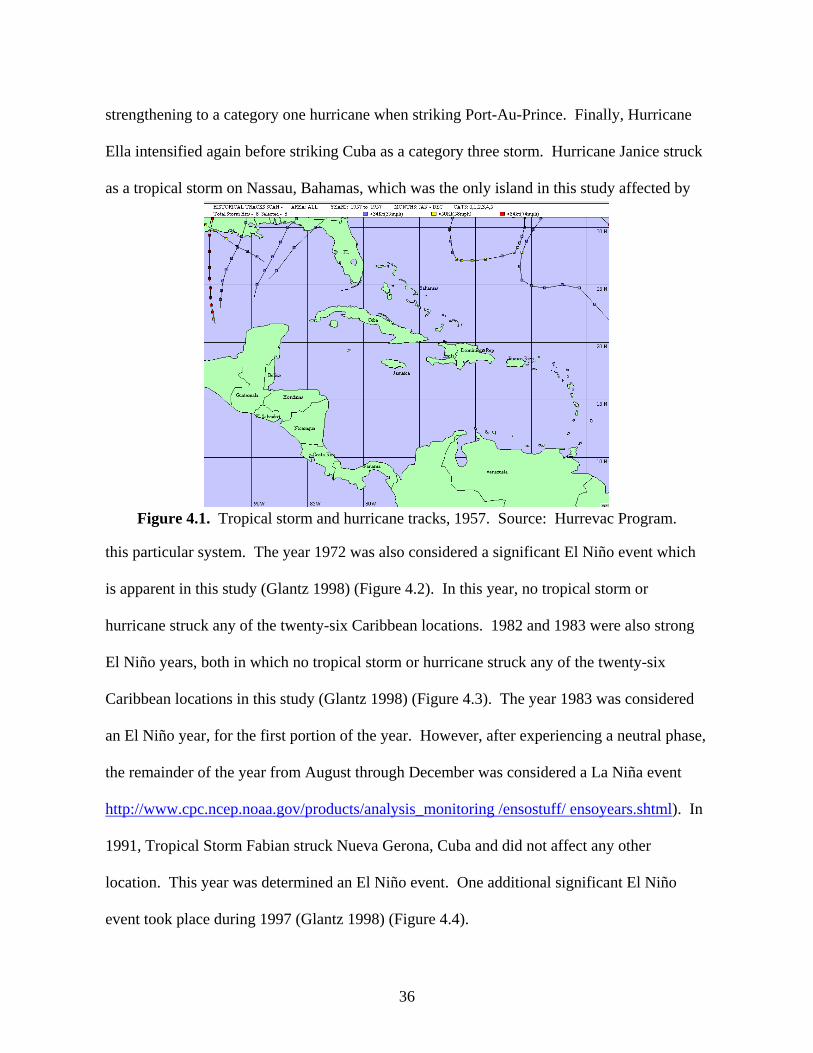
36
strengthening to a category one hurricane when striking Port-Au-Prince. Finally, Hurricane
Ella intensified again before striking Cuba as a category three storm. Hurricane Janice struck
as a tropical storm on Nassau, Bahamas, which was the only island in this study affected by
Figure 4.1. Tropical storm and hurricane tracks, 1957. Source: Hurrevac Program.
this particular system. The year 1972 was also considered a significant El Niño event which
is apparent in this study (Glantz 1998) (Figure 4.2). In this year, no tropical storm or
hurricane struck any of the twenty-six Caribbean locations. 1982 and 1983 were also strong
El Niño years, both in which no tropical storm or hurricane struck any of the twenty-six
Caribbean locations in this study (Glantz 1998) (Figure 4.3). The year 1983 was considered
an El Niño year, for the first portion of the year. However, after experiencing a neutral phase,
the remainder of the year from August through December was considered a La Niña event
http://www.cpc.ncep.noaa.gov/products/analysis_monitoring /ensostuff/ ensoyears.shtml). In
1991, Tropical Storm Fabian struck Nueva Gerona, Cuba and did not affect any other
location. This year was determined an El Niño event. One additional significant El Niño
event took place during 1997 (Glantz 1998) (Figure 4.4).

37
Figure 4.2. Tropical storm and hurricane tracks, 1972. Source: Hurrevac Program.
Figure 4.3. Tropical storm and hurricane tracks, 1982-1983. Source: Hurrevac Program.
During this year, no storms affected the Caribbean locations in this study. Hurricane
Erika came close to striking the Caribbean islands; however, the storm re-curved toward the
north-northeast.

38
Figure 4.4. Tropical storm and hurricane tracks, 1997. Source: Hurrevac Program.
Similar to specific El Niño years, increases in hurricane activity during significant La
Niña events are apparent in this research. The year 1909 was considered a moderate La Niña
event on record (Glantz 1998) (Figure 4.5). Five storms struck that year, at the twenty-six
locations in this study. Hurricane Number Six struck eight different locations in the
Caribbean Region, including Antigua, Cuba, Dominican Republic, Haiti, Puerto Rico, St.
Kitts/Nevis, and St. Thomas. This storm’s peak strike strength in the Caribbean Region was a
category two hurricane striking Nueva Gerona, Cuba. Other storms during 1909’s La Niña
event included the Velasco Hurricane, Tropical Storm Number Five, the Grand Isle
Hurricane, Hurricane Number Ten, and Hurricane Number Eleven. Also considered a
significant La Niña event was 1916, in which six storms affected areas within the twenty-six
Caribbean locations in this study (Glantz 1998) (Figure 4.6). During August, one of the peak
months of hurricane season, Hurricane Number Four formed in the Atlantic Ocean. Eight
Caribbean islands were affected by this storm, which first struck Castries, St. Lucia as a
category one hurricane. This storm’s next strike occurred at Fort de France, Martinique, after
it strengthened into a category two hurricane. Some slight weakening took place before the
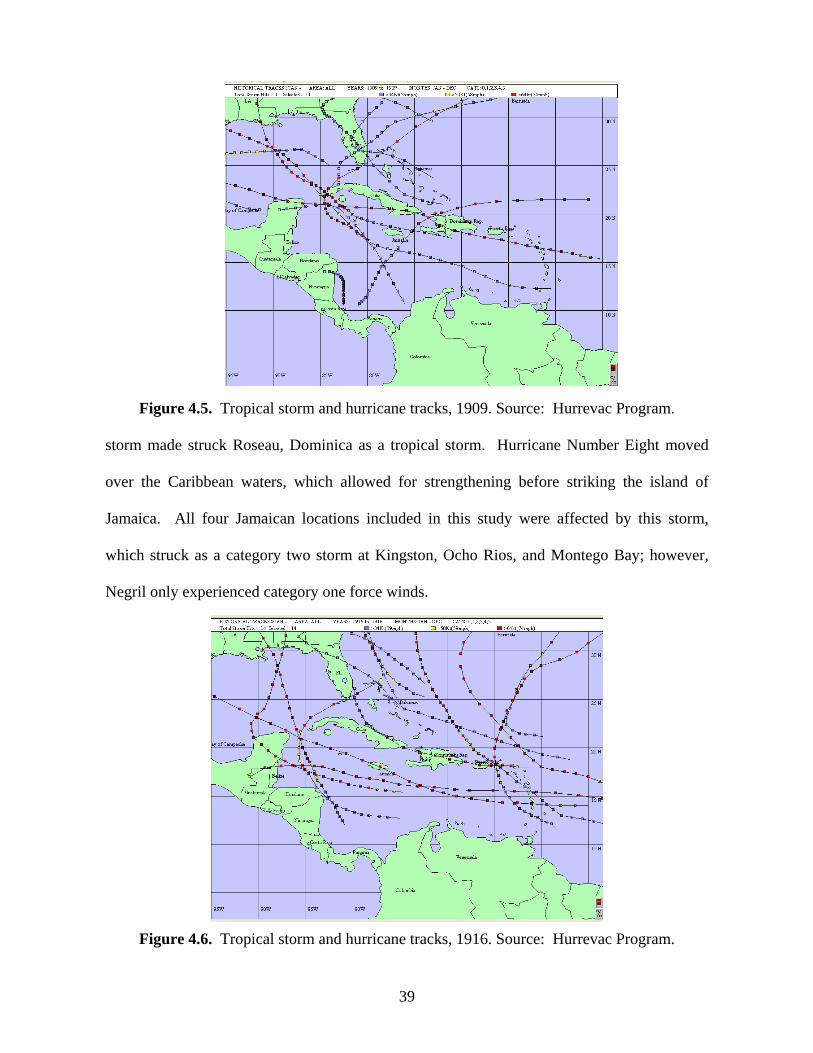
39
Figure 4.5. Tropical storm and hurricane tracks, 1909. Source: Hurrevac Program.
storm made struck Roseau, Dominica as a tropical storm. Hurricane Number Eight moved
over the Caribbean waters, which allowed for strengthening before striking the island of
Jamaica. All four Jamaican locations included in this study were affected by this storm,
which struck as a category two storm at Kingston, Ocho Rios, and Montego Bay; however,
Negril only experienced category one force winds.
Figure 4.6. Tropical storm and hurricane tracks, 1916. Source: Hurrevac Program.
40
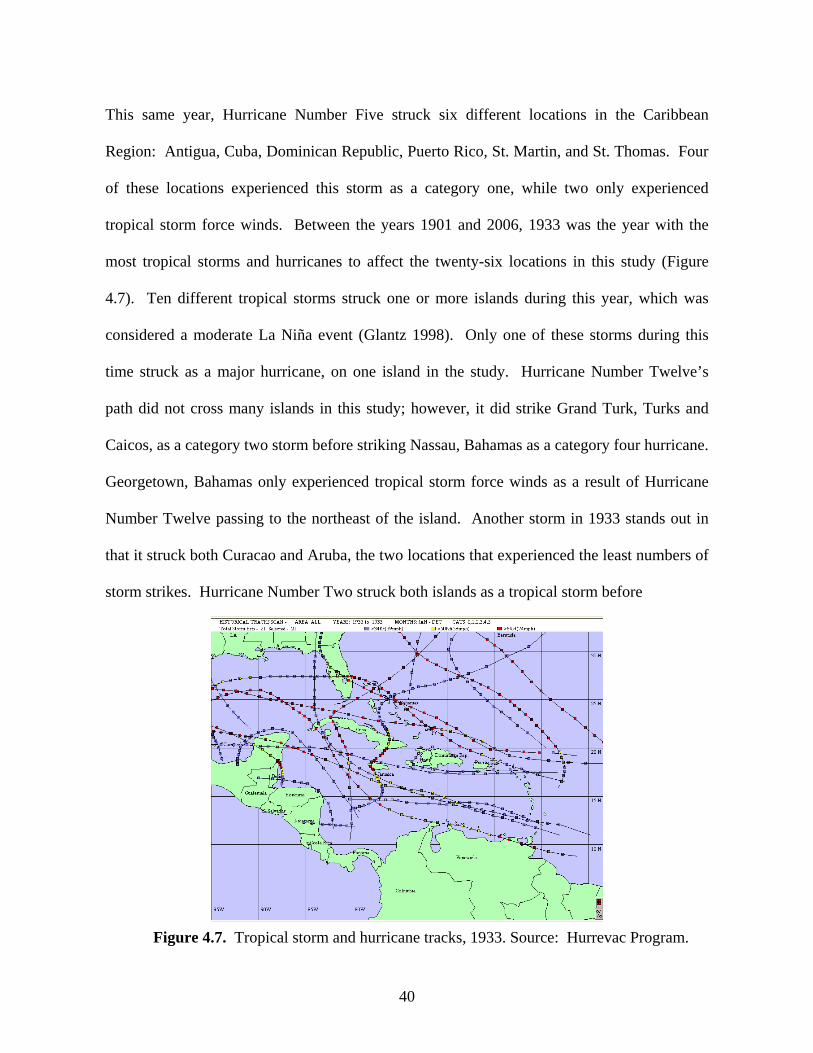
This same year, Hurricane Number Five struck six different locations in the Caribbean
Region: Antigua, Cuba, Dominican Republic, Puerto Rico, St. Martin, and St. Thomas. Four
of these locations experienced this storm as a category one, while two only experienced
tropical storm force winds. Between the years 1901 and 2006, 1933 was the year with the
most tropical storms and hurricanes to affect the twenty-six locations in this study (Figure
4.7). Ten different tropical storms struck one or more islands during this year, which was
considered a moderate La Niña event (Glantz 1998). Only one of these storms during this
time struck as a major hurricane, on one island in the study. Hurricane Number Twelve’s
path did not cross many islands in this study; however, it did strike Grand Turk, Turks and
Caicos, as a category two storm before striking Nassau, Bahamas as a category four hurricane.
Georgetown, Bahamas only experienced tropical storm force winds as a result of Hurricane
Number Twelve passing to the northeast of the island. Another storm in 1933 stands out in
that it struck both Curacao and Aruba, the two locations that experienced the least numbers of
storm strikes. Hurricane Number Two struck both islands as a tropical storm before
Figure 4.7. Tropical storm and hurricane tracks, 1933. Source: Hurrevac Program.

41
strengthening, moving northward, and striking both Nueva Gerona, Cuba and Georgetown,
Cayman Islands. Hurricane Number Nineteen, the third to last storm of this particular season,
struck only one island in this study—Jamaica. This storm struck both Montego Bay and
Negril as a category two storm, and only affected Ocho Rios with tropical storm force winds.
Only four locations in this study, all located in the middle portion of the Lesser Antilles, were
not affected by a tropical storm or hurricane during 1933. These locations include the islands
of Dominica, Guadeloupe, Martinique, and St. Lucia. Other significant La Niña events are
apparent in this study, including 1949 when five storms struck one or more of the Caribbean
locations in this study (Figure 4.8).
Figure 4.8. Tropical storm and hurricane tracks, 1949. Source: Hurrevac Program.
4.2 Global Warming
Tropical storm and hurricane strike frequencies have been studied for numerous years
with many different objectives. Most importantly, studying the past strikes of tropical storms
and hurricanes can provide insight into the future frequency of these storms and perhaps aid
cities in future preparations for all tropical storms (Jagger et al. 2001). All locations affected
by tropical storms and hurricanes are important in this type of research; however, areas such
42
as the United States and the Caribbean Region seem especially vulnerable with constant
increases in population, tourism, and coastal building (Lyons 2004). Numerous studies have
been conducted to determine the causes and implications of increased hurricane activity
experienced in recent years over the Caribbean Sea and the Gulf of Mexico. However,
differences in opinion have resulted in dynamic debates throughout the world regarding this
topic (Webster et al. 2005). The notion of global warming affecting hurricane frequency and
intensity is the focus of Webster’s paper. Three different aspects of the effects of global
warming on hurricanes have been included in other research: sea surface temperature change,
increased coastal populations, and human-induced change through means of emitting
greenhouse gases. In the future, though, research in this area may not only aide hurricane
forecasters in predicting future hurricane strikes, but may also be important in the emergency
management sector for hazard mitigation and emergency planning as well as providing a
means for protecting the environment (Jagger et al. 2001).
Tropical storms and hurricanes most often form in ocean regions where sea surface
temperatures reach over 26º C (78.8 º F); however, oceans vary in temperature over time
(Trenberth 2005). It is not determined, though, to what extent ocean temperature changes
affect the make-up of a tropical storm or hurricane (Cione and Uhlhorn 2003). Multidecadal
cycles in tropical storms are influenced by these fluctuations in sea surface temperatures;
however, these cycles may not be the sole influence on tropical storm and hurricane formation
(Goldenberg et al. 2001). In some instances, an increase in sea surface temperatures has led
to a pronounced increase in tropical activity (Franklin et al. 2006). Many studies focus on the
insinuation that global warming impacts sea surface temperatures, consequentially impacting
the formation of tropical storms and hurricanes. For example, it is mentioned in Landsea et
al. (1999) that prior research portrayed that a “greenhouse-warmed climate” produces an

43
increase in sea surface temperatures. This information, though, does not provide direction in
determining potential changes in the frequency of tropical storms and hurricanes (Landsea et
al. 1999). Studies of sea surface temperatures and trends, regarding tropical storms and
hurricanes, were also mentioned by Webster et al. (2005) in that no trends are significant
when compared to the influence attributed to interannual variability. However, various
research concentrates solely on the Atlantic regions, where only 12% of the world’s tropical
storms form, and do not account for typhoons in the Pacific Ocean region (Schiermeier 2005).
Typhoons in the Pacific react differently to changes in sea surface temperature than tropical
storms and hurricanes in the Atlantic region (Schiermerier 2005). In a study conducted that
simulated a human-induced warmer climate, research determined an increase in hurricane
activity is possible due to higher sea surface temperatures (Knutson et al. 1998).
In the ongoing deliberation of whether global warming has an effect on the increase of
sea surface temperatures, numerous debates have emerged. One author questioned another’s
research which stated that human-induced climate change “has the potential for slightly
increasing the intensity of tropical storms and hurricanes through warming of sea surface
temperatures” (Landsea 2005, p. E-11). Landsea (2005) states that the time series to be
included in a study of this magnitude must cover a more extensive period of time to be
sufficient. Arguments included that hurricane activity is less intense than that of the mid
1900s and that there is no evidence of a connection between hurricane activity and global
warming (Landsea 2005). On the other side of the debate, though, a warmer, moister globally
warmed world would result in increased hurricane activity along with a direct impact on sea
surface temperatures (Anthes et al. 2006). If sea surface temperatures are proven to affect
tropical storm and hurricane frequency and/or intensity, it is insignificant relative to natural
variability in the cycle of hurricane formation (Pielke et al. 2006).

44
As many researchers attempt to determine whether global warming has an effect on
hurricanes, the perception of an increase in the destruction caused by hurricanes is a recurring
concept. The notion is apparent that as global warming will increase the frequency and
intensity of hurricanes, hence greater destruction would ensue. When statements are made
regarding the differences in hurricane destruction today as opposed to fifty years ago,
population patterns and demographics must be taken into consideration (Pielke and Landsea
1998). One simple answer is true in this regard—hurricanes cause more damage along the
coast today than in the past because there is a larger population in these regions, along with a
significantly larger amount of expensive structures (Pielke and Landsea 1998). Societies in
all areas of the world, especially coastal regions such as the Caribbean, where tourism is often
the lead industry, are increasingly vulnerable to the destruction of a hurricane strike. Not only
are populations along the coast constantly growing, but high property values cause hurricane
damage to be more costly (Anthes et al. 2006). Changnon (2003) showed that increased
losses sustained from a passing hurricane are to be blamed on societal changes, not global
warming. Society has become more vulnerable to these types of situations, and people
continue to relocate in hazard-prone areas. With tourism as a major part of the much of the
Caribbean’s economy, locations along the coastal regions have experienced a vast expansion
of population as well as an increase in the infrastructure of these areas (Pielke et al. 2006).
Before direct statements can be made regarding the impact of global warming on hurricanes,
increased destruction in largely populated coastal areas must be taken into consideration.
Uncertainties are apparent as to whether global warming increases hurricane frequency and
intensity. However, the continual growth of population in coastal areas allows for potential
devastation if the particular region lies in the path of tropical storm or hurricane.

45
“Greenhouse gas-induced climate warming could affect hurricanes in a number of
ways, including changing their intensity, frequency, and locations of occurrence” (Knutson et
al. 1998 p. 1018). With global warming debates becoming more intense among researchers,
one general idea can be agreed upon: greenhouse gases are most certainly increasing (Balling
and Cerveny 2003). This increase in the amount of greenhouse gases may, in turn, cause a
warming of the climate. If the climate is persistently warmed, an increase in sea surface
temperatures is probable (Landsea et al. 1999). Researchers have analyzed data to determine
if there is a direct correlation between increased greenhouse gas emissions and hurricane
intensity and frequency. Trenberth (2005) states that a trend is apparent over the past thirty-
five years in the extratropical North Atlantic, in that the increasing of sea surface temperatures
is directly caused by global warming which can be attributed to human action. However, he
believes that there is no evidence that human-induced climate change has affected the number
of hurricanes or where they strike. Other research contributes to the conception of increasing
sea surface temperatures as a result of human activity. Anthes et al. (2006) states that the
recently observed increases in ocean temperature are projected to continue as greenhouse gas
emissions persist.
Assessing the opposite side of the debate on global warming’s effect on hurricanes;
some research has found no relationship between the two. In association with the natural
variability in the cycle of tropical storms and hurricanes, research shows that an increase in
hurricane activity as a result of human-induced global warming, if any, is insignificant when
compared to that of the natural cycle of variability in tropical storm formation, frequency, and
intensity (Pielke et al. 2006). Pielke et al. (2006) mentions that previous studies show no
evidence implying that an atmosphere affected by greenhouse gas emissions will produce
major changes in the locations of tropical storms and hurricanes. Research suggests that
46
tropical storm changes in intensity and frequency are influenced exclusively by multi-decadal
variations, with no considerable trends attribute to global warming (Balling and Cerveny
2003).
In analyzing the return periods of tropical storms and hurricanes in the Caribbean
Region, a trend should be apparent in the most recent years of the dataset if global warming
was a contributing factor in tropical storm and hurricane activity. However, the time period in
this study with the most significant tropical storm and hurricane strikes are during the 1920s
and early 1930s. A small lapse in tropical storm and hurricane strikes took place in the late
1930s and early1940s, before another increase in the late 1940s and throughout the 1950s.
Tropical storm and hurricane activity slowly picked up in the 1990s through 2006; however,
numbers are far from those experienced in the late 1920s, early 1930s. If global warming
were a factor in the frequency and intensity of tropical storms and hurricanes, a major
increase in the number of storm strikes would be expected in this study.
47
Chapter 5: Summary and Conclusions
This chapter provides a brief summary of the objectives as well as the conclusions of
this thesis. All objectives will be reviewed along with its subsequent results and conclusions.
Possible future research topics will also be discussed within this chapter.
5.1 Review: Objectives, Methods, and Study Area
Islands throughout the Caribbean Region repeatedly experience tropical storm activity
every summer and autumn between June and November and are often severely affected by the
these storms’ strikes. Consequently, this thesis examines the climatology of past strikes of
tropical storms and hurricanes in the Caribbean Region over the past 106 years, specifically
the largely populated coastal cities on islands including the Bahamas, Jamaica, Cuba, Puerto
Rico, the Virgin Islands, and the Windward and Leeward Islands extending to Aruba. The
principal objectives of this study are:
1) To produce a time series of historical tropical storm or hurricane strikes at each
island chosen in the Caribbean Region and characteristics of the storm at the time of
strike (i.e. Category of storm, winds, etc.).
2) To calculate the annual return periods of tropical storms, minor hurricanes, and
major hurricanes for each of the locations chosen for the study.
3) To provide possible explanations of the results determined in this study.
The extent of this research covers twenty-six islands throughout the Caribbean
Region, determined by largely populated cities, or the coastal cities that experience significant
numbers of tourists each year. Data were collected on past tropical storm and hurricane
strikes for each location over the past 106 years (1901 through 2006). A Hurricane Strike
Model is used to determine tropical storm and hurricane strikes within the cities, because the
variability of each storm size is not adequately measured and documented (Keim et al. 2007).

48
Using this model, each storm strike over this period of time was analyzed to determine the
strength of winds at a specific location. Based on these conclusions, return periods were
calculated for each city chosen in the Caribbean Region according to the number of years in
the dataset and the number of strikes for the particular location. After determining the return
periods of all tropical storms during the specified time period, an analysis of possible causes
of storm frequency and/or intensity including the notion of El Niño—Southern Oscillation
and global warming.
5.2 Objective One—Time Series and Storm Strike Characteristics
The first objective was to produce a time series of historical tropical storm or
hurricane strikes at each island chosen in the Caribbean Region and characteristics of the
storm at the time of strike (i.e. Category of storm, winds, etc.). Twenty-six cities located
throughout the islands of the Caribbean were chosen for this study, to determine how many
tropical storms and hurricanes struck there. Tropical storm data includes 106 years, from
1901 through 2006.
All tropical storm and hurricane data were mapped for each location chosen for this
study based on the strength of the storm, including tropical storms, minor hurricanes
(categories one and two), and major hurricanes (categories three, four, and five). Once all
storms were catalogued, return period calculations were made for each location based on the
number of storms that struck and the number of years in the study.
The distribution of striking tropical storms and hurricanes by year provides insight on
the active years, possibly due to La Niña, within the 106 year dataset as compared to the
inactive years, possibly a result of El Niño conditions (Landsea et al. 1999). Results show
the spatial characteristics of striking tropical storms in that extreme southern portions of the
Caribbean are affected the least by passing tropical storms and hurricanes. Moving northward
49
into the Lesser Antilles, tropical storm and hurricane strike activity increases significantly as
well as into the Greater Antilles northwestward. A significant number of tropical storm and
hurricane strikes are apparent in the early portion of the 106 year dataset, with fluctuations
throughout the remaining years. The islands in the Caribbean Region experienced numerous
tropical storm and hurricane strikes during the late 1920s and early 1930s, especially around
the Bahamas and both the Greater and Lesser Antilles. The late 1950s and early 1960s were
another time period in which numerous tropical storms and hurricanes struck in the Caribbean
Region. Finally, a significant increase in tropical storm strikes is apparent in the 1990s and
early 2000s. The majority of storms during this time did not strike the Bahamas—the bulk of
the storms striking in the 1990s were located in the Lesser Antilles, while the Greater Antilles
were the focal points for the early 2000s.
5.3 Objective Two—Calculate Return Periods
The second objective was to calculate the annual return periods of tropical storms,
hurricanes, and major hurricanes for each of the locations chosen for the study. Historical
tropical storm and hurricane data were collected for each of the twenty-six cities throughout
the Caribbean Region, over the past 106 years. Using the Hurricane Strike Model, each storm
strike over this period of time was analyzed to determine the strength of winds at a specific
location. Based on these conclusions, return periods were calculated for each city in the
Caribbean Region according to the number of years in the dataset and the number of strikes
for the particular location. Calculations were determined for all strikes including tropical
storms, hurricanes, and major hurricanes.
Coinciding with the spatial distribution and number of striking tropical storms and
hurricanes, return periods for each island vary within this study. Tropical storm and hurricane
return periods range from two years in Cuba to fifteen years in Curacao, the island that
50
experienced the least number of storm strikes. The average tropical storm return period for all
storms and all points in the region is four years. The regional average return period for
hurricanes is eleven years, with the highest calculation being fifty-two years for Willemstad,
Curacao and the lowest at four years for Nueva Gerona, Cuba. Finally, the regional average
return period for major hurricane strikes is thirty-six years. Nassau, Bahamas experienced the
highest number of striking major hurricanes; therefore the return period of major hurricanes at
this location is only ten years. In contrast, though, to Nassau is Willemstad, Curacao, a
location not struck by a major hurricane in the past 106 years. The return period of a storm of
this strength is 106 years plus.
5.4 Objective Three—Explanation of Results
Objective number three was to provide possible explanations of the results determined
in this study. Numerous studies have been conducted to determine the causes and
implications of increased hurricane activity experienced in recent years in the Caribbean Sea
and the Gulf of Mexico. Two topics in particular are discussed in this thesis: El Niño/La
Niña and global warming.
Tropical activity can be highly influenced throughout the world by the El Niño—
Southern Oscillation (ENSO) pattern. This process may be described as a fluctuation in the
normal occurrences in the ocean-atmospheric structure every few years in the tropical Pacific
(Landsea et al. 1999). Two different situations may occur within this phase: El Niño, when
sea surface temperatures in the tropical Pacific Ocean are warmer than normal, or La Niña,
when sea surface temperatures in the tropical Pacific Ocean are cooler than normal.
Decreased hurricane activity is often associated with the El Niño phase, due to increased
vertical wind shear, while increased tropical activity is often experienced during the La Niña
phase. Significant El Niño and La Niña phases in history are apparent in this thesis where
51
certain years are associated with either decreased tropical storm or hurricane strikes or years
where strikes are numerous.
Three different aspects of the effects of global warming on hurricanes have been
included in other research: sea surface temperature change, increased coastal populations,
and human-induced change through means of emitting greenhouse gases. Many studies
suggest that global warming impacts sea surface temperatures, consequentially impacting the
formation of tropical storms and hurricanes. Debates arise on whether global warming will
contribute to increases in sea surface temperatures or if the temperatures fluctuate based on a
natural cycle. However, if sea surface temperatures are proven to affect tropical storm and
hurricane frequency and/or intensity, it is insignificant relative to natural variability in the
cycle of hurricane formation (Pielke et al. 2006). When statements are made regarding the
differences in hurricane destruction today as opposed to fifty years ago, population patterns
and demographics must be taken into consideration (Pielke and Landsea 1998). The continual
growth of population in coastal areas allows for the potential of massive destruction if the
particular region lies in the path of a tropical storm or hurricane. Some research has
determined that human-induced climate change “has the potential for slightly increasing the
intensity of tropical cyclones through warming of sea surface temperatures” (Landsea 2005).
Greenhouse gases are certainly increasing (Balling and Cerveny 2003); however, there is no
evidence that human-induced climate change has affected the number of hurricanes or where
they strike (Trenberth 2005). A peak in tropical storm and hurricane strikes was determined
in this study, in the 1930’s. However, after this time period, a significant decrease in storm
strikes took place until an increase began in the early 1990’s. The increase of tropical storm
activity in the Caribbean Region within the past three to four years could be an implication of
increased sea surface temperatures, correlated with increasing population, resulting in
52
increased greenhouse gas emissions. While some researchers believe that global warming has
a significant impact on the frequency and intensity of tropical storms and hurricanes, this
study shows no apparent trend. While tropical storm and hurricane strike frequency increases
around the year 2000, numbers are not comparable to those experienced in the earlier portion
of the dataset.
5.5 Future Research
Research on tropical storm and hurricane recurrences may be continued with each
passing hurricane season. Additional islands may be included in future research to increase
the study area as well as adding additional years. Research on this topic is necessary to
increase standards in preparedness as well as hazard mitigation planning.
A more specific focus on the causes and implications of tropical storm and hurricane
strikes is an important research topic. Global warming and the El Niño—Southern Oscillation
phase were not the focus of this thesis; however, additional research on these topics would be
useful. Comparisons may be made between Caribbean storms and other areas of the world
that experience tropical storms and hurricanes.
Another possibility would be to determine return periods of striking tropical storms
and hurricane in other areas of the world, such as China, Japan, and the western coast of
Mexico. Comparisons could also be made in research such as this with areas like the
Caribbean Region and the Gulf of Mexico. Any research that contributes to the understanding
of tropical storm strikes would benefit scientists as well as those that live in coastal areas that
frequently experience destruction from these storms.

53
References
Anthes, R.A. et al. 2006. Hurricanes and Global Warming—Potential Linkages and Consequences. Bulletin of the American Meteorological Society, 87: 623-628. Balling, Jr., R.C. and R.S. Cerveny. 2003. Analysis of the Duration, Seasonal Timing, and Location of North Atlantic Tropical Cyclones: 1950-2002. Geophysical Research Letters, 30(24): 2253. Blake, E.S. et al. 2007. The Deadliest, Costliest, and Most Intense United States Tropical
Cyclones from 1851 to 2006 (And Other Frequently Requested Hurricane Facts). NOAA Technical Memorandum NWS TPC-5 <http://www.wunderground.com/hurricane/usdeadly.asp>.
Bove, M.C. et al. 1998. Effect of El Niño on U.S. Landfalling Hurricanes, Revisited. Bulletin of the American Meteorological Society, 79(11): 2477-2482. “Caribbean (Region).” 2007. Microsoft Encarta Online Encyclopedia. http://uk.encarta.msn.com . Changnon, S. A. 2003. Shifting Economic Impacts from Weather Extremes in the United
States: A Result of Societal Changes, Not Global Warming. Natural Hazards, 29: 273-290.
Chu, P. and J. Wang. 1998. Modeling Return Periods of Tropical Cyclone Intensities in the Vicinity of Hawaii. Journal of Applied Meteorology, 37: 951-960. Climatic Diagnostics Center. “Linear Correlations in Atmospheric Seasonal/Monthly
Averages.” http://www.cdc.noaa.gov/Correlation/ . “Cold and Warm Episodes By Season.”
http://www.cpc.ncep.noaa.gov/products/analysis_monitoring/ ensostuff/ensoyears.shtml .
Curry, J.A. et al. 2006. Mixing Politics and Science in Testing the Hypothesis That Greenhouse Warming is Causing a Global Increase in Hurricane Intensity. Bulletin of the American Meteorological Society, 87(8): 1025-1037. Dijkstra, H.A. et al. 2006. On the Physics of the Atlantic Multidecadal Oscillation. Ocean Dynamics, 56: 36-50. Emanuel, K. 2003. Tropical Cyclones. Annual Review of Earth and Planetary Sciences, 31: 75-104. Emanuel, K. 2005. Emanuel Replies. Nature, 438(22/29): E13.
54
Elsner, J. and B. Kara. 1999. Hurricanes of the North Atlantic: Climate and Society. Oxford University Press, 488p. Franklin, J.L. et al. 2006. ANNUAL SUMMARY: Atlantic Hurricane Season of 2004. Monthly Weather Review, 134: 981-1025. Glantz, M.H. 1998. A La Niña Summit: A Review of the Causes and Consequences of
Cold Events. Environmental and Societal Impacts Group, NCAR: Boulder, Colorado. Goldenberg, S.B. et al. 2001. The Recent Increase in Atlantic Hurricane Activity: Causes and Implications. Science, 293(5529): 474-483. Hurrevac Program. Sea Island Software, Inc. Jagger, T. et al. 2001. A Dynamic Probability Model of Hurricane Winds in Coastal
Counties of the United States. Journal of Applied Meteorology, 40: 853-863. Keim, B.D. and K.D. Robbins. 2006. Occurrence Dates of North Atlantic Tropical Storms and Hurricanes: 2005 in Perspective. Geophysical Research Letters, 33: L21706. Keim, B.D. et al. 2004. Spatial and Temporal Variability of Coastal Storms in the North
Atlantic Basin. International Journal of Marine Geology, 210: 7-15. Keim, B.D. et al. 2007. Return Periods of Tropical Storm and Hurricane Strikes from Texas
to Maine. Journal of Climate. Kids Enjoying the World of Learning (KEWL), “Caribbean Statistics,”
<http://www.caribbeanedu.com/kewl/almanac/almanac10.asp > (10 Oct 2006). Kimball, S.K. and M.S. Mulekar. 2004. A 15-Year Climatology of North Atlantic Tropical Cyclones. Part I: Size Parameters. Journal of Climate, 17: 3555-3567. Landsea, C.W. 1993. A Climatology of Intense (or Major) Atlantic Hurricanes. Monthly Weather Review, 121: 1703-1713. Landsea, C.W. 2005. Hurricanes and Global Warming. Nature, 438(22/29): E11-E12. Landsea et al. 1999. Atlantic Basin Hurricanes: Indices of Climatic Changes. Climatic Change, 42: 89-129. Larson, J. et al. 2005. Characteristics of Landfalling Tropical Cyclones in the United States and Mexico: Climatology and Interannual Variability. Journal of Climate, 18:
1247-1262. Liu, K.S. and J.C.L. Chan. 2003. Climatological Characteristics and Seasonal Forecasting of Tropical Cyclones Making Landfall along the South China Coast.
55
Monthly Weather Review, 131: 1650-1662. Lodge, D.J. and W.H. McDowell. 1991. Summary of Ecosystem-Level Effects of Caribbean
Hurricanes. Biotropica, 23(4a): 373-378. Lyons, S. 2004. U.S. Tropical Cyclone Landfall Variability: 1950-2002. American
Meteorological Society, 19: 473-480. Muller, R.A. and G.W. Stone. 2001. A Climatology of Tropical Storm and Hurricane Strikes to Enhance Vulnerability Prediction for the Southeast U.S. Coast. Journal Of Coastal Research, 17(4): 949-956. Neumann, C.J. et al. 1993. Tropical Cyclones of the North Atlantic Ocean, 1871-1992.
National Climatic Data Center in Cooperation with the National Hurricane Center, p. 193.
Null, J. Historic Oceanic Niño Index (ONI) and El Niño Winter and Spring Impacts on the
United States Weather Patterns. <http://ggweather.com/enso/oni.htm> (2004). Pielke, Jr., R.A. and C.N. Landsea. 1999. La Niña, El Niño, and Atlantic Hurricane Damages in the United States. Weather and Forecasting, 80(10): 2027-2033. Pielke at al. 2006. Reply to “Hurricanes and Global Warming—Potential Linkages and Consequences.” Bulletin of the American Meteorological Society, 87(5): 628-631. Rappaport, E.N. and J. Fernandez-Partagas. 1995. The Deadliest Atlantic Tropical Cyclones, 1492-1996. NOAA Technical Memorandum NWS-NHC-47. [Updated: J. Beven. 1997.] Simpson, R.H. and M. Lawrence. 1971. Atlantic Hurricane Frequencies Along the U.S. Coastline. NOAA Technical Memorandum NWS-SR-58, 14. Smith, E. 1999. Atlantic and East Coast Hurricanes 1900-98: A Frequency and Intensity Study for the Twenty-First Century. Bulletin of the American Meteorological Society, 80(12): 2717-2720. Trenberth, K.E. 1997. The Definition of El Niño. Bulletin of the American Meteorological Society, 78(12): 2771-2777. Virmani, J.I. and R.H. Weisberg. 2006. The 2005 Hurricane Season: An Echo of the Past or
a Harbinger of the Future? Geophysical Research Letters, 33: L05707. Webster et al. 2005. Changes in Tropical Cyclone Number, Duration, and Intensity in a Warming Environment. Science, 309: 1844-1846.

56
Appendix A: Tropical Cyclone Strikes for Twenty-Six Caribbean Locations—Year, Storm Type, Storm Name
(Alphabetical Order by Country)
The Valley, Anguilla 18.1°, 63.1° 1901 TS 7 1906 H2 4 1908 TS 1 1916 H1 5 1916 TS 12 1922 H2 2 1924 H1 3 1928 H3 Lake Okeechobee 1931 H1 6 1932 H3 7 1933 TS 16 1938 TS 1 1943 TS 2 1947 TS 9 1949 TS 2 1950 H1 Dog 1953 TS Edna 1954 TS Alice 1955 TS Hilda 1960 H4 Donna 1966 H1 Faith 1979 TS Claudette 1979 TS Frederic 1989 H3 Hugo 1995 H4 Luis 1995 TS Marilyn 1996 H1 Bertha 1998 H1 Georges 1999 H1 Jose 1999 H3 Lenny
St. John's, Antigua 17.1°, 61.5° 1901 TS 7 1906 H2 4 1908 TS 8 1909 H1 6 1910 H1 3 1915 H1 Galveston 1922 H1 2 1924 H1 3 1928 H3 Lake Okeechobee 1930 H1 2 1932 H1 7 1932 TS 10 1933 TS 3 1933 TS 5 1933 TS 16 1934 TS 7 1950 H2 Baker 1950 H2 Dog 1954 TS Alice 1960 H3 Donna 1963 TS Helena 1964 H3 Cleo 1966 TS Faith 1966 H2 Inez 1979 H2 David 1979 TS Frederic 1989 H4 Hugo 1990 H1 Klaus 1995 TS Iris 1995 H4 Luis 1995 TS Marilyn 1996 H1 Bertha 1998 H3 Georges 1999 H2 Jose 1999 TS Lenny 2000 H1 Debby 2006 TS Chris
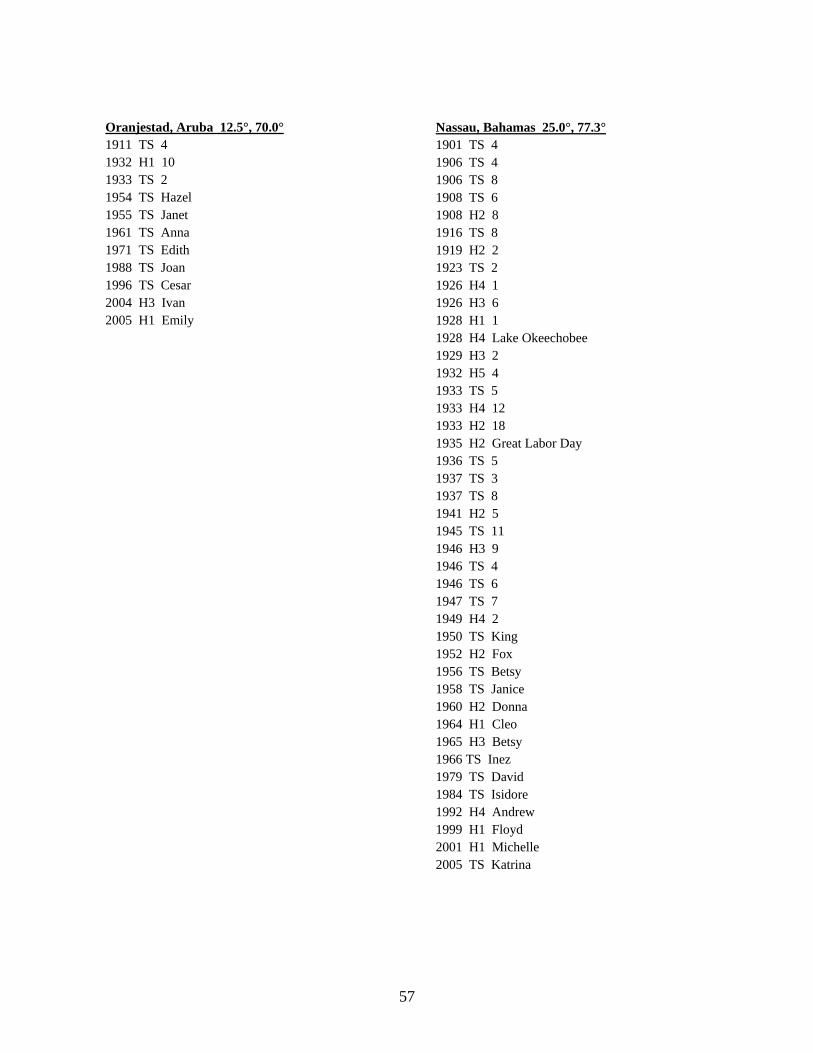
57
Nassau, Bahamas 25.0°, 77.3° 1901 TS 4 1906 TS 4 1906 TS 8 1908 TS 6 1908 H2 8 1916 TS 8 1919 H2 2 1923 TS 2 1926 H4 1 1926 H3 6 1928 H1 1 1928 H4 Lake Okeechobee 1929 H3 2 1932 H5 4 1933 TS 5 1933 H4 12 1933 H2 18 1935 H2 Great Labor Day 1936 TS 5 1937 TS 3 1937 TS 8 1941 H2 5 1945 TS 11 1946 H3 9 1946 TS 4 1946 TS 6 1947 TS 7 1949 H4 2 1950 TS King 1952 H2 Fox 1956 TS Betsy 1958 TS Janice 1960 H2 Donna 1964 H1 Cleo 1965 H3 Betsy 1966 TS Inez 1979 TS David 1984 TS Isidore 1992 H4 Andrew 1999 H1 Floyd 2001 H1 Michelle 2005 TS Katrina
Oranjestad, Aruba 12.5°, 70.0° 1911 TS 4 1932 H1 10 1933 TS 2 1954 TS Hazel 1955 TS Janet 1961 TS Anna 1971 TS Edith 1988 TS Joan 1996 TS Cesar 2004 H3 Ivan 2005 H1 Emily
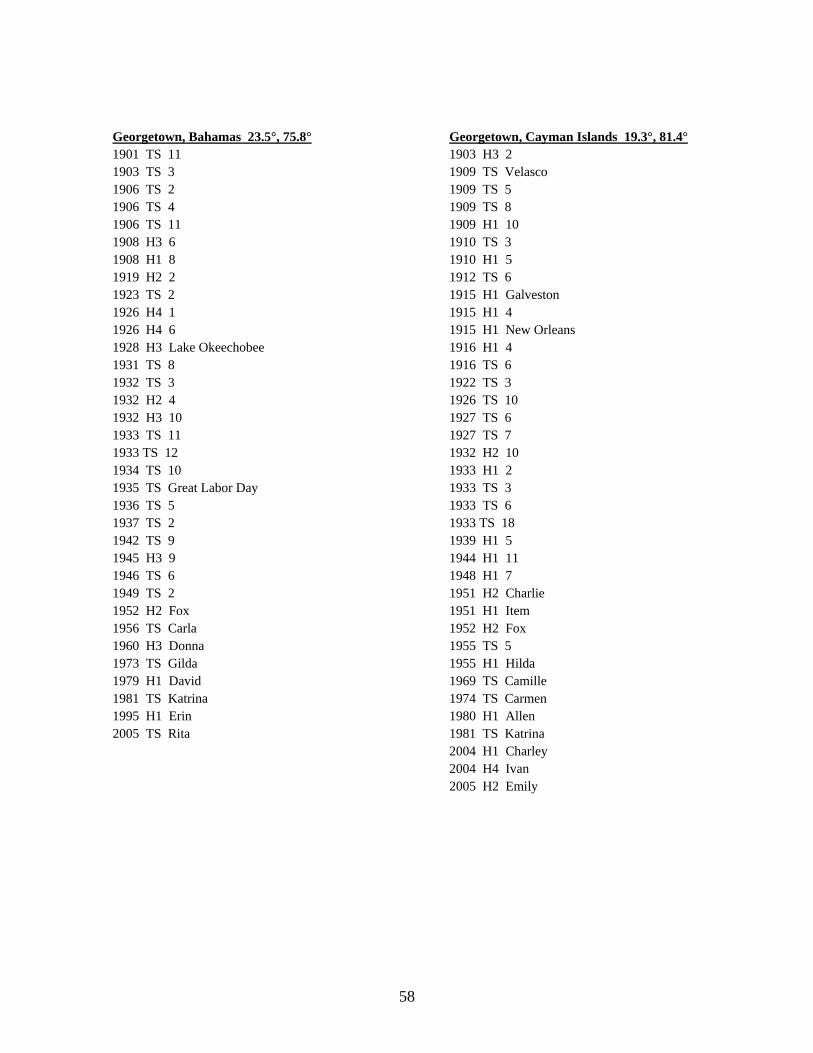
58
Georgetown, Bahamas 23.5°, 75.8° 1901 TS 11 1903 TS 3 1906 TS 2 1906 TS 4 1906 TS 11 1908 H3 6 1908 H1 8 1919 H2 2 1923 TS 2 1926 H4 1 1926 H4 6 1928 H3 Lake Okeechobee 1931 TS 8 1932 TS 3 1932 H2 4 1932 H3 10 1933 TS 11 1933 TS 12 1934 TS 10 1935 TS Great Labor Day 1936 TS 5 1937 TS 2 1942 TS 9 1945 H3 9 1946 TS 6 1949 TS 2 1952 H2 Fox 1956 TS Carla 1960 H3 Donna 1973 TS Gilda 1979 H1 David 1981 TS Katrina 1995 H1 Erin 2005 TS Rita
Georgetown, Cayman Islands 19.3°, 81.4° 1903 H3 2 1909 TS Velasco 1909 TS 5 1909 TS 8 1909 H1 10 1910 TS 3 1910 H1 5 1912 TS 6 1915 H1 Galveston 1915 H1 4 1915 H1 New Orleans 1916 H1 4 1916 TS 6 1922 TS 3 1926 TS 10 1927 TS 6 1927 TS 7 1932 H2 10 1933 H1 2 1933 TS 3 1933 TS 6 1933 TS 18 1939 H1 5 1944 H1 11 1948 H1 7 1951 H2 Charlie 1951 H1 Item 1952 H2 Fox 1955 TS 5 1955 H1 Hilda 1969 TS Camille 1974 TS Carmen 1980 H1 Allen 1981 TS Katrina 2004 H1 Charley 2004 H4 Ivan 2005 H2 Emily

59
La Habana, Cuba 23.1°, 82.4° 1902 TS 1 1906 H2 8 1909 H2 19 1910 H3 5 1915 TS Galveston 1915 TS 4 1917 H2 3 1919 H2 2 1924 TS 7 1926 H3 10 1930 TS 2 1933 H1 11 1933 H2 18 1944 H3 11 1945 TS 7 1946 H2 5 1948 H2 7 1948 H4 8 1950 H1 Easy 1964 H2 Isbell 1966 H2 Alma 1968 TS Gladys 1969 TS Camille 1979 TS Frederic 1985 TS Elena 1985 H1 Kate 1987 TS Floyd 1996 TS Lili 1999 TS Irene 2002 TS Lili 2004 H3 Charley 2004 H1 Ivan 2005 H1 Dennis 2005 TS Rita
Nueva Gerona, Cuba 21.8°, 82.8° 1901 TS 2 1901 H1 7 1902 TS 1 1903 H1 2 1906 H3 8 1906 TS 11 1909 H2 9 1909 H1 8 1909 H1 10 1910 TS 3 1910 H3 5 1915 H3 Galveston 1915 H1 4 1915 TS New Orleans 1917 H3 3 1922 TS 3 1926 H3 10 1933 H1 2 1933 TS 6 1944 H3 11 1945 TS 7 1946 H1 5 1947 TS 6 1948 TS 7 1948 H2 8 1950 TS Baker 1950 H1 Easy 1952 TS Fox 1953 TS Alice 1953 TS 3 1955 TS 5 1966 H2 Alma 1968 H1 Gladys 1969 H2 Camille 1979 TS Frederic 1980 H4 Allen 1991 TS Fabian 1996 H1 Lili 1999 TS Irene 2001 H2 Michelle 2002 H2 Isidore 2002 H2 Lili 2004 H2 Ivan
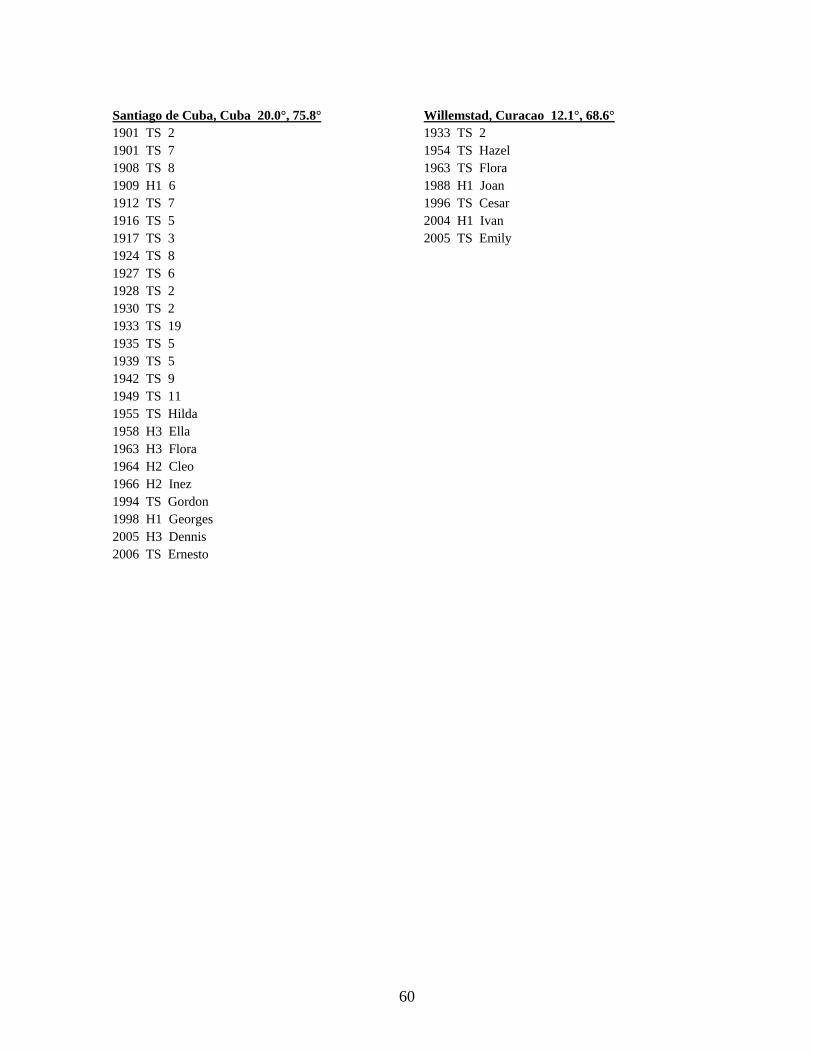
60
Santiago de Cuba, Cuba 20.0°, 75.8° 1901 TS 2 1901 TS 7 1908 TS 8 1909 H1 6 1912 TS 7 1916 TS 5 1917 TS 3 1924 TS 8 1927 TS 6 1928 TS 2 1930 TS 2 1933 TS 19 1935 TS 5 1939 TS 5 1942 TS 9 1949 TS 11 1955 TS Hilda 1958 H3 Ella 1963 H3 Flora 1964 H2 Cleo 1966 H2 Inez 1994 TS Gordon 1998 H1 Georges 2005 H3 Dennis 2006 TS Ernesto
Willemstad, Curacao 12.1°, 68.6° 1933 TS 2 1954 TS Hazel 1963 TS Flora 1988 H1 Joan 1996 TS Cesar 2004 H1 Ivan 2005 TS Emily

61
Santo Domingo, Dominican Republic 18.5°, 69.9° 1901 TS 7 1903 TS 2 1909 H1 6 1910 TS 3 1915 TS Galveston 1916 TS 5 1918 TS 5 1921 H1 3 1928 TS 1 1928 H1 Lake Okeechobee 1930 H4 2 1931 TS 6 1932 TS 1 1932 H1 7 1933 TS 16 1945 TS 3 1949 H1 9 1952 TS Charlie 1958 TS Ella 1963 H1 Edith 1963 TS Flora 1964 H2 Cleo 1966 H3 Inez 1967 H3 Beulah 1979 H5 David 1979 TS Frederic 1980 H2 Allen 1985 TS Isabel 1987 H2 Emily 1998 H2 Georges 2003 TS Odette
Roseau, Dominica 15.3°, 61.4° 1901 TS 3 1903 H2 2 1908 TS 8 1910 TS 1 1916 TS 2 1916 TS 4 1916 H1 6 1918 TS 5 1924 TS 2 1926 TS 1 1930 H1 2 1931 TS 4 1945 TS 3 1950 TS Baker 1951 TS Charlie 1956 TS Betsy 1958 TS Ella 1960 TS Abby 1963 H1 Edith 1964 H3 Cleo 1966 H1 Inez 1979 H4 David 1980 H2 Allen 1988 TS Gilbert 1989 H2 Hugo 1995 H1 Marilyn
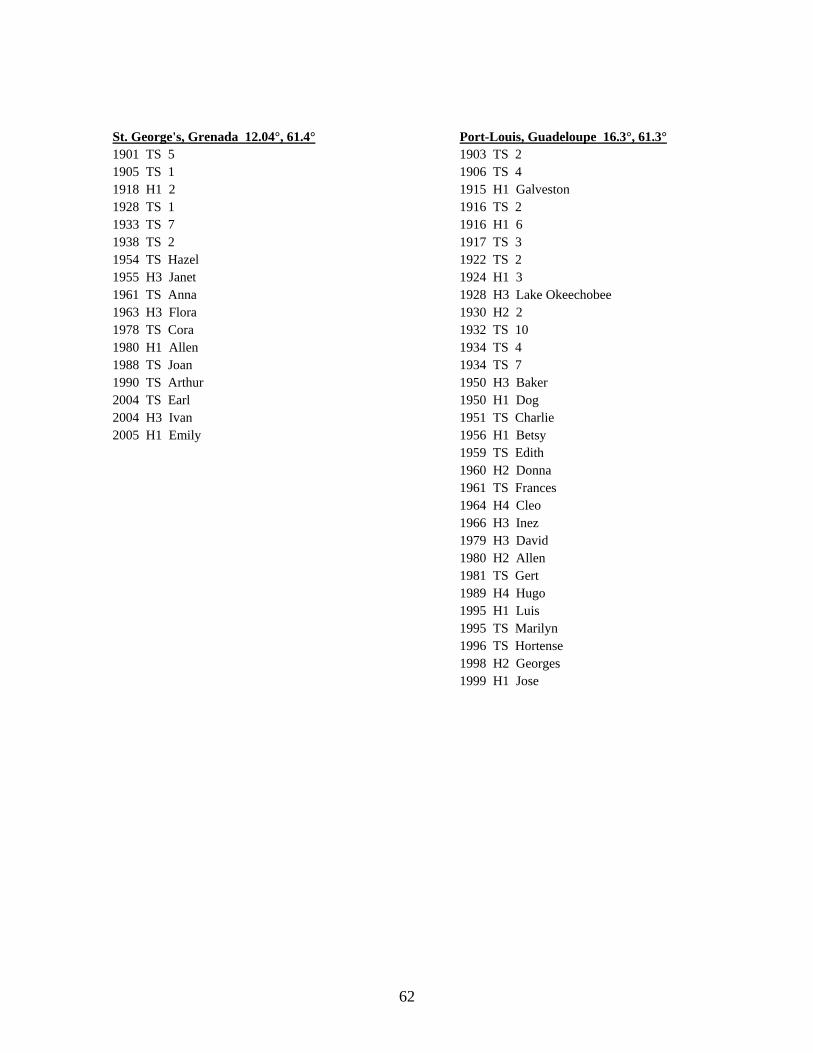
62
St. George's, Grenada 12.04°, 61.4° 1901 TS 5 1905 TS 1 1918 H1 2 1928 TS 1 1933 TS 7 1938 TS 2 1954 TS Hazel 1955 H3 Janet 1961 TS Anna 1963 H3 Flora 1978 TS Cora 1980 H1 Allen 1988 TS Joan 1990 TS Arthur 2004 TS Earl 2004 H3 Ivan 2005 H1 Emily
Port-Louis, Guadeloupe 16.3°, 61.3° 1903 TS 2 1906 TS 4 1915 H1 Galveston 1916 TS 2 1916 H1 6 1917 TS 3 1922 TS 2 1924 H1 3 1928 H3 Lake Okeechobee 1930 H2 2 1932 TS 10 1934 TS 4 1934 TS 7 1950 H3 Baker 1950 H1 Dog 1951 TS Charlie 1956 H1 Betsy 1959 TS Edith 1960 H2 Donna 1961 TS Frances 1964 H4 Cleo 1966 H3 Inez 1979 H3 David 1980 H2 Allen 1981 TS Gert 1989 H4 Hugo 1995 H1 Luis 1995 TS Marilyn 1996 TS Hortense 1998 H2 Georges 1999 H1 Jose

63
Port-Au-Prince, Haiti 18.5°, 72.3° 1901 TS 7 1903 H1 2 1908 H1 8 1909 H1 6 1909 TS 11 1910 TS 3 1915 H1 Galveston 1917 TS 3 1928 TS 2 1931 TS 6 1932 TS 7 1933 TS 16 1938 TS 8 1944 H1 4 1948 TS 1 1949 TS 9 1954 TS Hazel 1955 TS Hilda 1958 H1 Ella 1958 TS Gerda 1963 H3 Flora 1964 H4 Cleo 1966 H3 Inez 1967 TS Beulah 1979 H1 David 1980 H4 Allen 1987 TS Emily 1988 H1 Gilbert 1998 TS Georges 2005 TS Alpha
Kingston, Jamaica 17.0°, 76.8° 1901 TS 2 1903 H3 2 1909 TS 11 1910 H1 3 1915 H1 Galveston 1916 H2 4 1917 TS 3 1928 TS 3 1931 TS 6 1932 TS 7 1933 TS 3 1934 TS 10 1938 TS 2 1942 TS 4 1944 H3 4 1951 H1 Charlie 1974 TS Carmen 1980 H4 Allen 1988 H3 Gilbert 1994 TS Gordon 2001 TS Iris 2004 H3 Ivan 2005 H1 Dennis

64
Negril, Jamaica 18.3°, 78.3° 1903 H3 2 1904 TS 1 1909 TS 8 1910 TS 3 1912 H3 7 1912 TS 7 1915 H2 Galveston 1916 H1 4 1928 TS 3 1931 TS 6 1932 TS 7 1933 TS 3 1933 H2 19 1935 H2 4 1938 TS 2 1944 H1 4 1947 TS 6 1948 TS 7 1949 TS 11 1951 H1 Charlie 1974 TS Carmen 1980 H2 Allen 1988 H3 Gilbert 2002 TS Isidore 2004 H4 Ivan 2005 H3 Emily
Montego Bay, Jamaica 18.5°, 77.9° 1901 TS 2 1903 H3 2 1904 TS 1 1910 H1 3 1912 H2 7 1915 H2 Galveston 1916 H2 4 1928 TS 3 1931 TS 6 1932 TS 7 1933 TS 3 1933 H2 19 1934 TS 10 1935 H1 4 1939 TS 5 1944 H1 4 1949 TS 11 1951 TS Charlie 1980 H4 Allen 1988 H3 Gilbert 2002 TS Lili 2004 TS Charley 2004 H4 Ivan 2005 H2 Emily
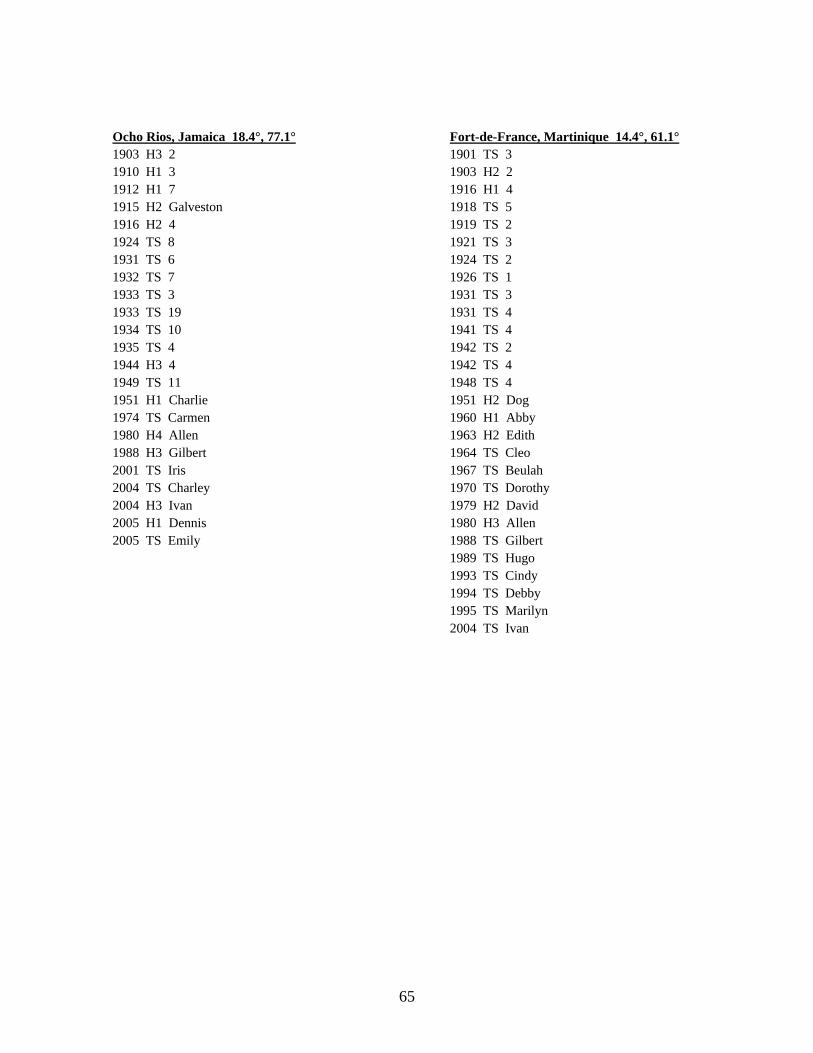
65
Ocho Rios, Jamaica 18.4°, 77.1° 1903 H3 2 1910 H1 3 1912 H1 7 1915 H2 Galveston 1916 H2 4 1924 TS 8 1931 TS 6 1932 TS 7 1933 TS 3 1933 TS 19 1934 TS 10 1935 TS 4 1944 H3 4 1949 TS 11 1951 H1 Charlie 1974 TS Carmen 1980 H4 Allen 1988 H3 Gilbert 2001 TS Iris 2004 TS Charley 2004 H3 Ivan 2005 H1 Dennis 2005 TS Emily
Fort-de-France, Martinique 14.4°, 61.1° 1901 TS 3 1903 H2 2 1916 H1 4 1918 TS 5 1919 TS 2 1921 TS 3 1924 TS 2 1926 TS 1 1931 TS 3 1931 TS 4 1941 TS 4 1942 TS 2 1942 TS 4 1948 TS 4 1951 H2 Dog 1960 H1 Abby 1963 H2 Edith 1964 TS Cleo 1967 TS Beulah 1970 TS Dorothy 1979 H2 David 1980 H3 Allen 1988 TS Gilbert 1989 TS Hugo 1993 TS Cindy 1994 TS Debby 1995 TS Marilyn 2004 TS Ivan
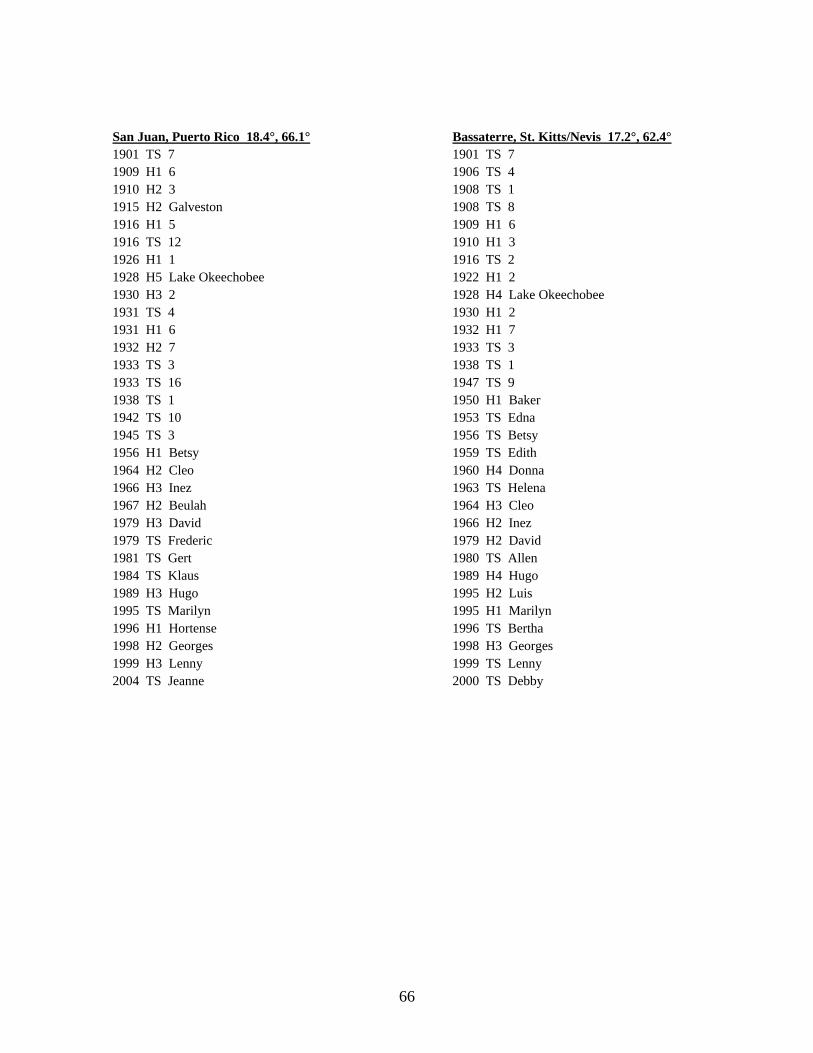
66
San Juan, Puerto Rico 18.4°, 66.1° 1901 TS 7 1909 H1 6 1910 H2 3 1915 H2 Galveston 1916 H1 5 1916 TS 12 1926 H1 1 1928 H5 Lake Okeechobee 1930 H3 2 1931 TS 4 1931 H1 6 1932 H2 7 1933 TS 3 1933 TS 16 1938 TS 1 1942 TS 10 1945 TS 3 1956 H1 Betsy 1964 H2 Cleo 1966 H3 Inez 1967 H2 Beulah 1979 H3 David 1979 TS Frederic 1981 TS Gert 1984 TS Klaus 1989 H3 Hugo 1995 TS Marilyn 1996 H1 Hortense 1998 H2 Georges 1999 H3 Lenny 2004 TS Jeanne
Bassaterre, St. Kitts/Nevis 17.2°, 62.4° 1901 TS 7 1906 TS 4 1908 TS 1 1908 TS 8 1909 H1 6 1910 H1 3 1916 TS 2 1922 H1 2 1928 H4 Lake Okeechobee 1930 H1 2 1932 H1 7 1933 TS 3 1938 TS 1 1947 TS 9 1950 H1 Baker 1953 TS Edna 1956 TS Betsy 1959 TS Edith 1960 H4 Donna 1963 TS Helena 1964 H3 Cleo 1966 H2 Inez 1979 H2 David 1980 TS Allen 1989 H4 Hugo 1995 H2 Luis 1995 H1 Marilyn 1996 TS Bertha 1998 H3 Georges 1999 TS Lenny 2000 TS Debby

67
Castries, St. Lucia 14.0°, 61.0° 1901 TS 3 1903 H2 2 1916 H1 4 1918 TS 5 1919 TS 2 1921 TS 3 1924 TS 2 1931 TS 3 1931 TS 4 1941 TS 4 1942 TS 2 1942 TS 4 1943 TS 9 1948 TS 4 1949 TS 3 1960 H1 Abby 1963 H2 Edith 1964 H2 Cleo 1967 TS Beulah 1970 TS Dorothy 1979 H1 David 1980 H4 Allen 1988 TS Gilbert 1993 TS Cindy 1994 TS Debby 2004 TS Ivan
Marigot, St. Martin 18.4°, 63.5° 1901 TS 7 1906 H2 4 1908 H1 1 1908 TS 6 1910 TS 3 1916 H1 5 1916 TS 12 1922 H2 2 1924 H1 3 1926 TS Great Miami 1928 H3 Lake Okeechobee 1930 TS 2 1931 H2 6 1932 H3 7 1933 TS 5 1938 TS 1 1940 TS 3 1943 TS 2 1945 TS 9 1947 TS 9 1949 TS 2 1950 H2 Dog 1953 TS Edna 1955 TS Hilda 1960 H4 Donna 1964 H1 Cleo 1966 H1 Faith 1966 H2 Inez 1979 TS Claudette 1979 H1 David 1989 H3 Hugo 1990 TS Klaus 1996 H1 Bertha 1998 H1 Georges 1999 H1 Jose 1999 H3 Lenny 2000 H1 Debby 2004 H1 Frances
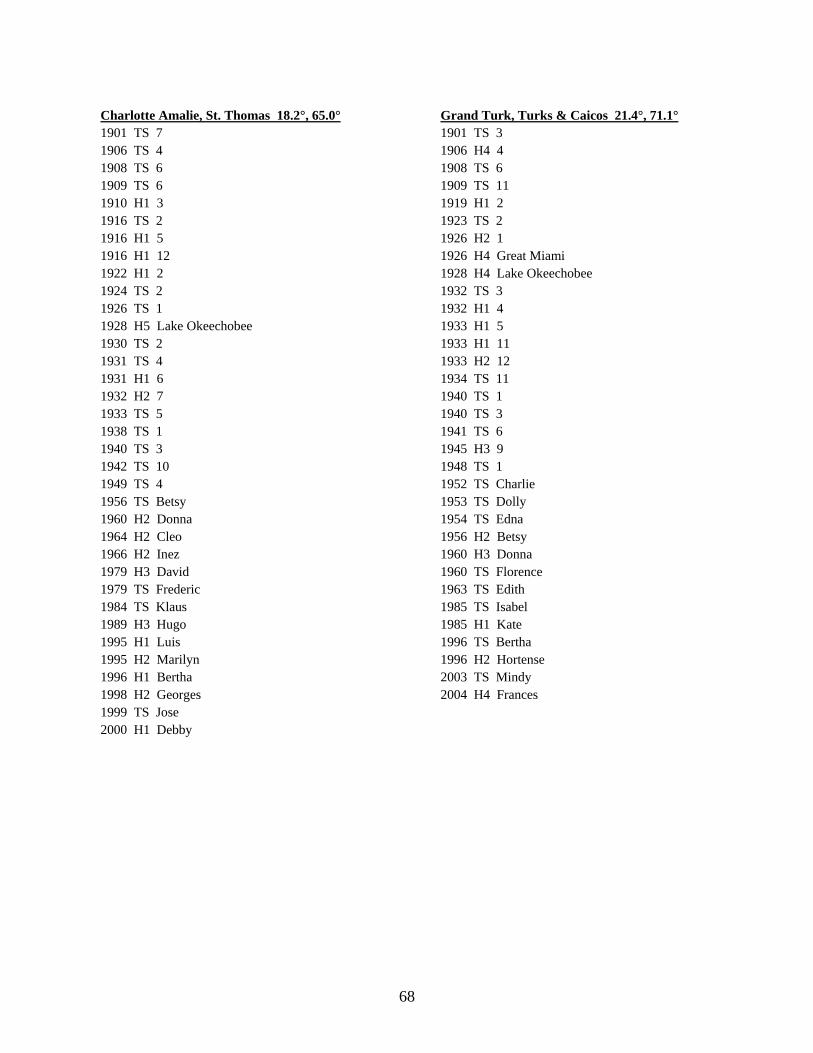
68
Charlotte Amalie, St. Thomas 18.2°, 65.0° 1901 TS 7 1906 TS 4 1908 TS 6 1909 TS 6 1910 H1 3 1916 TS 2 1916 H1 5 1916 H1 12 1922 H1 2 1924 TS 2 1926 TS 1 1928 H5 Lake Okeechobee 1930 TS 2 1931 TS 4 1931 H1 6 1932 H2 7 1933 TS 5 1938 TS 1 1940 TS 3 1942 TS 10 1949 TS 4 1956 TS Betsy 1960 H2 Donna 1964 H2 Cleo 1966 H2 Inez 1979 H3 David 1979 TS Frederic 1984 TS Klaus 1989 H3 Hugo 1995 H1 Luis 1995 H2 Marilyn 1996 H1 Bertha 1998 H2 Georges 1999 TS Jose 2000 H1 Debby
Grand Turk, Turks & Caicos 21.4°, 71.1° 1901 TS 3 1906 H4 4 1908 TS 6 1909 TS 11 1919 H1 2 1923 TS 2 1926 H2 1 1926 H4 Great Miami 1928 H4 Lake Okeechobee 1932 TS 3 1932 H1 4 1933 H1 5 1933 H1 11 1933 H2 12 1934 TS 11 1940 TS 1 1940 TS 3 1941 TS 6 1945 H3 9 1948 TS 1 1952 TS Charlie 1953 TS Dolly 1954 TS Edna 1956 H2 Betsy 1960 H3 Donna 1960 TS Florence 1963 TS Edith 1985 TS Isabel 1985 H1 Kate 1996 TS Bertha 1996 H2 Hortense 2003 TS Mindy 2004 H4 Frances

69
Appendix B: Storm Tracks in the Caribbean for the One Hundred Six Year Dataset (1901 through 2006)
Tropical Storm Tracks: 1901 through 1951
Tropical Storm Tracks: 1952 through 2006

70
Category 1 Storm Tracks
Category 2 Storm Tracks
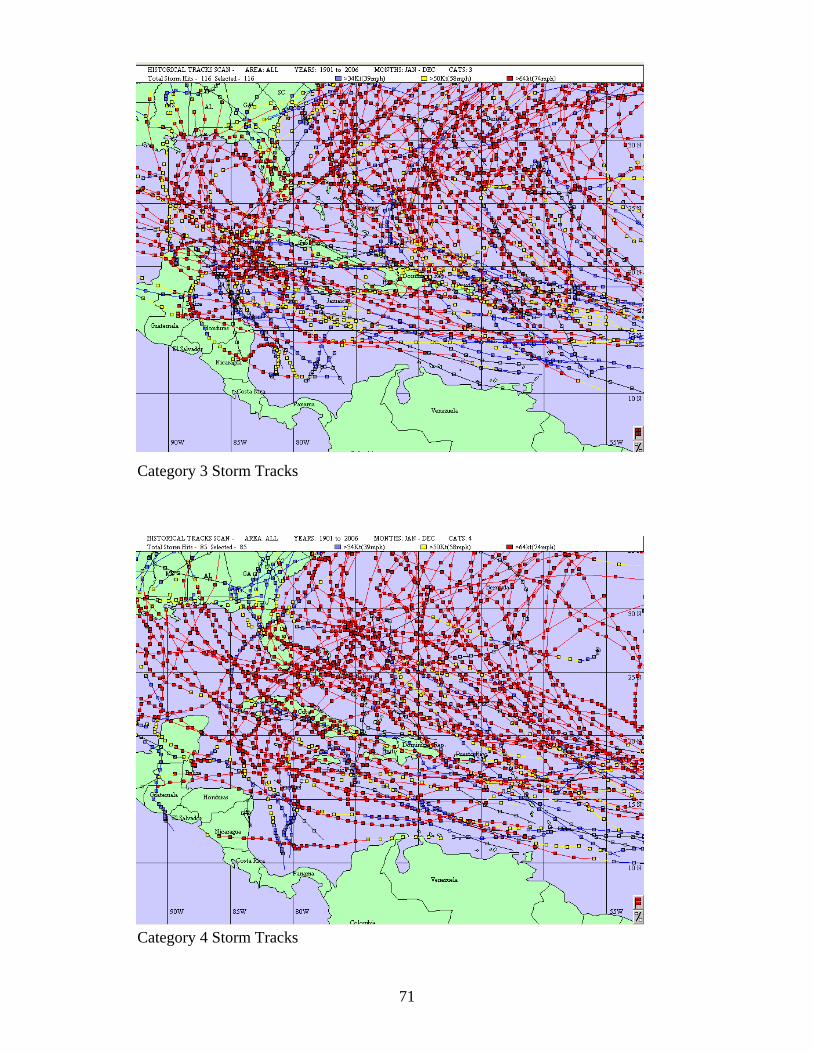
71
Category 3 Storm Tracks
Category 4 Storm Tracks
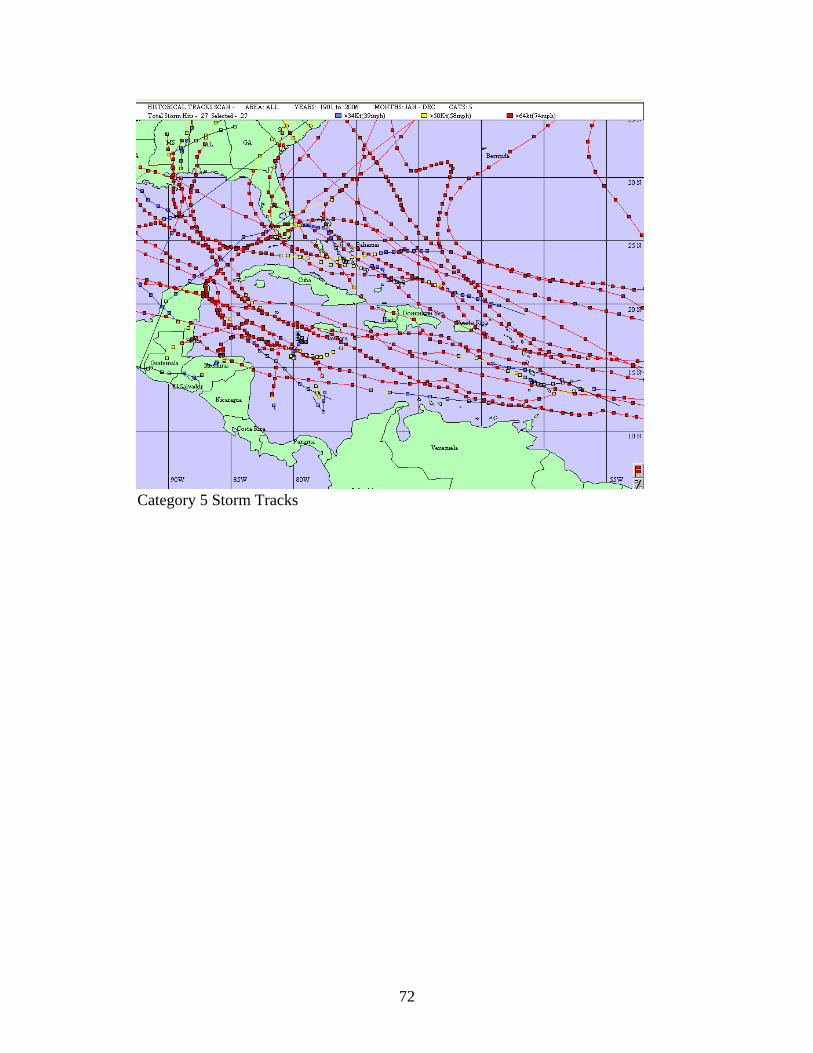
72
Category 5 Storm Tracks
73
Vita
Alexa (“Lexie”) Jo Andrews is a native of Baton Rouge. She began her studies at
Louisiana State University in August of 2000 before earning her Bachelor of Science degree
in geography in 2004. In 2005, Lexie began her pursuit of a Master of Science degree in
geography with an emphasis in climatology. After graduation, she hopes to continue her
career in the field of emergency management.