Embed Size (px)
Citation preview

(TESTING)
ACCREDITATION
N°1-0144
scope available
on www.COFRAC.fr
ADRIA DEVELOPPEMENT Creac’h Gwen - F. 29196 QUIMPER Cedex Tél. (33) 02.98.10.18.18 - Fax (33) 02.98.10.18.99
[email protected] http://www.adria.tm.fr
ASSOCIATION LOI DE 1901 - N° SIRET 306 964 271 00036 - N° EXISTENCE 53290006329 - N°TVA FR45306964271
NF VALIDATION
Validation of alternative analytical methods
Application in food microbiology
Summary Report Validation study according to EN ISO 16140-2:2016
TEMPO EB (Certificate number: BIO 12/21 - 12/06) for the enumeration of Enterobacteriaceae in a broad
range of food and pet foods
Quantitative method
Expert Laboratory: ADRIA Développement
ZA Creac’h Gwen
29196 Quimper Cedex (France)
For: bioMérieux
376 Chemin de l’Orme
69280 Marcy l’Etoile (France)
This report consists of 50 pages, including 7 appendices.
Only copies including the totality of this report are authorised.
Competencies of the laboratory are certified by COFRAC accreditation for the
analyses marked with the symbol.
Version 0
22 January 2019.

bioMérieux
ADRIA Développement 2/50 22 January 2019
Summary Report (Version 0)
TEMPO EB
1 INTRODUCTION ________________________________________________ 4
2 METHODS DESCRIPTION ________________________________________ 4
2.1 Alternative method ______________________________________________ 4
2.1.1 Principle ________________________________________________________ 4
2.1.2 Protocol ________________________________________________________ 4
2.1.3 Restrictions______________________________________________________ 5
2.2 Reference method _______________________________________________ 5
2.3 Protocols applied during the initial validation and the renewal study _____ 5
3 INITIAL VALIDATION, EXTENSION/RENEWAL STUDIES: RESULTS _____ 5
3.1 Method comparison study ________________________________________ 5
3.1.1 Relative trueness _________________________________________________ 6
3.1.2 Accuracy profile study ____________________________________________ 15
3.1.3 Quantification limits (LOQ) _________________________________________ 18
3.1.4 Inclusivity and exclusivity studies ____________________________________ 19
3.1.5 Practicability ____________________________________________________ 20
3.2 Inter-laboratory study organisation and results ______________________ 21
3.2.1 Study organisation _______________________________________________ 21
3.2.2 Experimental parameters controls ___________________________________ 22
3.2.3 Logistic conditions _______________________________________________ 22
3.2.4 Result analysis __________________________________________________ 23
3.2.5 Calculation and interpretation ______________________________________ 25
4 GENERAL CONCLUSION _______________________________________ 27
Appendix 1 – Flow diagram of the alternative method: TEMPO EB ___________________________________ 29
Appendix 2 – Flow diagram of the reference method ______________________________________________ 30
Appendix 3 – Artificial contaminations of samples ________________________________________________ 32
Appendix 4 - Relative trueness study: raw data ___________________________________________________ 33
Appendix 5 - Accuracy profile study: raw data ____________________________________________________ 41
Appendix 6 – Quantification limits (LOQ): raw data________________________________________________ 47
Appendix 7 – Inclusivity / Exclusivity: raw data ___________________________________________________ 48

bioMérieux
ADRIA Développement 3/50 22 January 2019
Summary Report (Version 0)
TEMPO EB
Quality Assurance documents related to this study can be consulted upon request
from bioMérieux.
The technical protocol and the result interpretation were realised according to the EN
ISO 16140-2:2016 and the AFNOR technical rules (Revision 6).
Validation protocols EN ISO 16140-2 (June 2016) : Microbiology of the food
chain - Method validation
Part 1: Vocabulary
Part 2: Protocol for the validation of alternative
(proprietary) methods against a reference method
AFNOR Technical Rules (Revision n° 6)
Reference method - ISO 21528-2:2004 - Microbiology of food and
animal feeding stuffs - Horizontal methods for
detection and enumeration of Enterobacteriaceae -
Part 2: Colony-count method
- ISO 21528-2:2017 - Microbiology of the food chain -
Horizontal method for detection and enumeration of
Enterobacteriaceae - Part 2: Colony-count
technique
Alternative method TEMPO® EB
Scope Broad range of food
Pet foods
Certification organization AFNOR Certification (http://nf-validation.afnor.org/)
Analyses performed according to the COFRAC accreditation

bioMérieux
ADRIA Développement 4/50 22 January 2019
Summary Report (Version 0)
TEMPO EB
1 INTRODUCTION
The TEMPO® EB method was validated in December 2006 (certificate
number BIO 12/21 – 12/06), for a broad range of food and pet foods.
Renewal studies were performed in 2010, 2014. The renewal was performed
in December 2018 according to the ISO16140-2 (2016).
2 METHODS DESCRIPTION
2.1 Alternative method
2.1.1 Principle
TEMPO® system is an automated method associating an innovative card
with an adapted medium to ensure rapid enumeration of several quality
indicators.
The TEMPO® EB test consists of a vial of culture medium and a card, which
are specific to this test. The culture medium is inoculated with the sample to
be tested and homogeneously transferred by the TEMPO® Filler into the card
containing 48 wells of three different volumes. The TEMPO® Filler seals the
card in order to avoid any risk of contamination during subsequent handling.
The culture medium contains fluorescent pH indicator which, when its pH is
neutral, emits a signal detected by the TEMPO Reader. During incubation,
the Enterobacteriaceae present in the card assimilate the nutrients in the
culture medium, resulting in a decrease of pH and the extinction of the
fluorescent signal.
Depending on the number and size of the positive wells, the TEMPO® system
deduces the number of Enterobacteriaceae present in the original sample
according to a calculation based on the MPN (Most Probable Number)
method. Card reading, interpretation and reporting are managed by the
TEMPO® system after 22 h incubation at 35°C. TEMPO® EB method allows
Enterobacteriaceae enumeration.
2.1.2 Protocol
The flow diagram of the alternative method is provided in Appendix 1.

bioMérieux
ADRIA Développement 5/50 22 January 2019
Summary Report (Version 0)
TEMPO EB
2.1.3 Restrictions
There is no restriction for use.
2.2 Reference method
The standard method used for the initial validation and 2010 and 2014
renewal studies was the ISO 21528-2 (2004): Microbiology of food and
animal feeding stuffs -Horizontal methods for the detection and enumeration
of Enterobacteriaceae - Part 2: Colony-count method.
For the renewal study performed in 2018, the reference method was the ISO
21528-2 (2017): Microbiology of the food chain - Horizontal method for
detection and enumeration of Enterobacteriaceae - Part 2: Colony-count
technique.
The modifications between the two versions are considered as minor and
have no impact on the previous data
The protocols of the methods are given in Appendix 2.
2.3 Protocols applied during the initial validation and the renewal
study
The shortest incubation time was tested: 22 h at 35°C ± 1°C.
3 INITIAL VALIDATION, EXTENSION/RENEWAL STUDIES:
RESULTS
3.1 Method comparison study
The method comparison study is a study performed by the expert laboratory to
compare the alternative method with the reference method.
The study was carried out on a diversity of samples and strains
representative of agri-food products. This does not constitute an exhaustive
list of the different matrices included in the scope.
For any comment on the alternative method, please contact AFNOR
Certification at http://nf-validation.afnor.org/contact-2/.
Analysis performed according to the COFRAC accreditation
bioMérieux
ADRIA Développement 6/50 22 January 2019
Summary Report (Version 0)
TEMPO EB
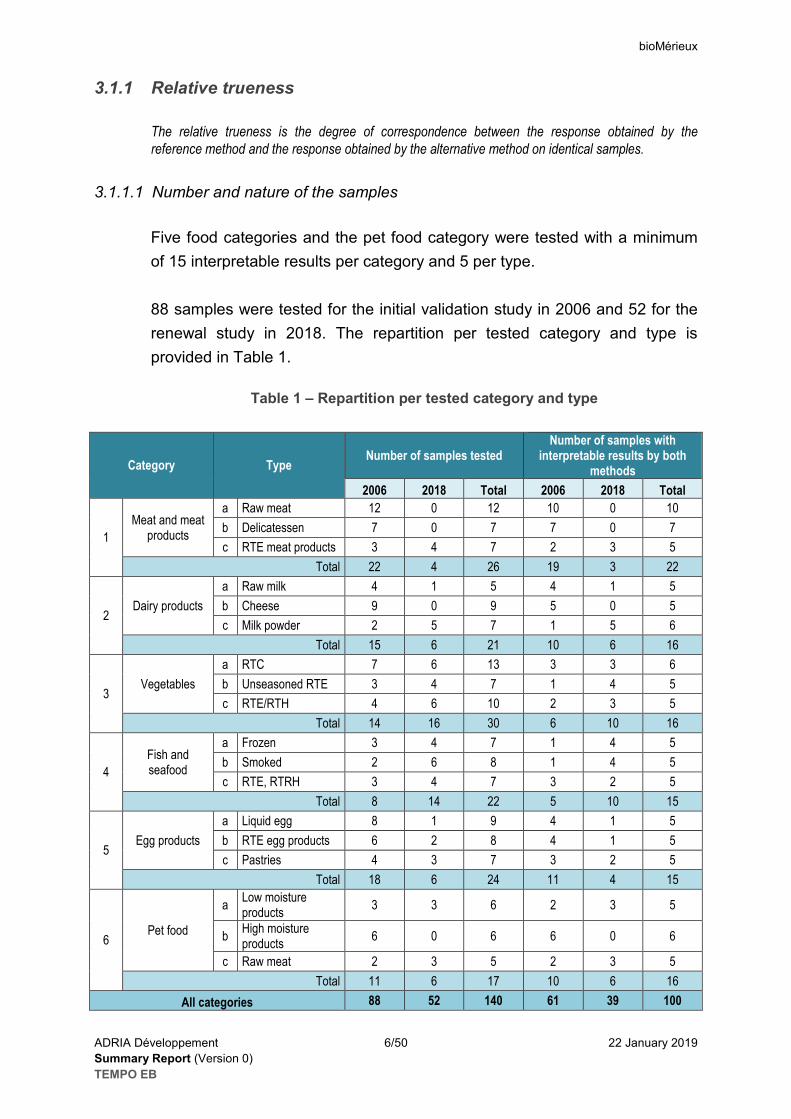
3.1.1 Relative trueness
The relative trueness is the degree of correspondence between the response obtained by the
reference method and the response obtained by the alternative method on identical samples.
3.1.1.1 Number and nature of the samples
Five food categories and the pet food category were tested with a minimum
of 15 interpretable results per category and 5 per type.
88 samples were tested for the initial validation study in 2006 and 52 for the
renewal study in 2018. The repartition per tested category and type is
provided in Table 1.
Table 1 – Repartition per tested category and type
Category Type Number of samples tested
Number of samples with interpretable results by both
methods
2006 2018 Total 2006 2018 Total
1
Meat and meat products
a Raw meat 12 0 12 10 0 10
b Delicatessen 7 0 7 7 0 7
c RTE meat products 3 4 7 2 3 5
Total 22 4 26 19 3 22
2 Dairy products
a Raw milk 4 1 5 4 1 5
b Cheese 9 0 9 5 0 5
c Milk powder 2 5 7 1 5 6
Total 15 6 21 10 6 16
3 Vegetables
a RTC 7 6 13 3 3 6
b Unseasoned RTE 3 4 7 1 4 5
c RTE/RTH 4 6 10 2 3 5
Total 14 16 30 6 10 16
4
Fish and seafood
a Frozen 3 4 7 1 4 5
b Smoked 2 6 8 1 4 5
c RTE, RTRH 3 4 7 3 2 5
Total 8 14 22 5 10 15
5 Egg products
a Liquid egg 8 1 9 4 1 5
b RTE egg products 6 2 8 4 1 5
c Pastries 4 3 7 3 2 5
Total 18 6 24 11 4 15
6 Pet food
a Low moisture products
3 3 6 2 3 5
b High moisture products
6 0 6 6 0 6
c Raw meat 2 3 5 2 3 5
Total 11 6 17 10 6 16
All categories 88 52 140 61 39 100

bioMérieux
ADRIA Développement 7/50 22 January 2019
Summary Report (Version 0)
TEMPO EB
Combining all the categories, 140 samples were analysed, leading to
100 exploitable results.
3.1.1.2 Artificial and natural contamination of the samples
15 samples were artificially contaminated using seeding or spiking protocol;
14 gave interpretable results. The inoculated strains and the injury protocols
applied are provided in Appendix 3.
100 samples gave interpretable results by both methods.
86 samples giving interpretable results by both methods were naturally
contaminated.
86 % of the samples were naturally contaminated.
3.1.1.3 Raw data
The raw data are provided in Appendix 4.
The samples were analyzed by the reference and the alternative methods in
order to have 15 interpretable results per category, and 5 interpretable
results per tested type.
The data are classified in four categories (See Table 2):
- Interpretable results with the reference and the alternative methods;
- Results with less than 4 colonies per plate with the reference and/or the
alternative method (indicated with “*” in the data) in order to have a more
precise result. These results were not included in the calculation.
- Results below or above the quantification limit: according to the ISO
16140-2:2016, if any result (either reference or alternative method) is
below the quantification limit, the data should be plotted using a
substituted value of 1 log10 units less than the observed value in case of a
lower than value. Similarly, any value greater than the upper limit should
be amended by adding 1 log unit more. These results are not included in
the calculations but also appear on the graphs.
- Samples with no result (ND) (plates impossible to enumerate due to high
background microflora).

bioMérieux
ADRIA Développement 8/50 22 January 2019
Summary Report (Version 0)
TEMPO EB
Table 2 - Classification of the data
Category Type Number of samples tested
Number of interpretable
results by both
methods
Number of samples with no
result (ND)
Number of samples with < 4 CFU/ plate
Number of samples with
<1 CFU or >300 CFU/
plate
1
Meat and meat
products
a Raw meat 12 10 2 0 0
b Delicatessen 7 7 0 0 0
c RTE meat products 7 5 1 0 1
Total 26 22 3 0 1
2
Dairy products
a Raw milk 5 5 0 0 0
b Cheese 9 5 3 0 1
c Milk powder 7 6 0 1 0
Total 21 16 3 1 1
3 Vegetables
a RTC 13 6 0 1 6
b Unseasoned RTE 7 5 1 1 0
c RTE/RTH 10 5 1 0 4
Total 30 16 2 2 10
4
Fish and seafood
a Frozen 7 5 0 0 2
b Smoked 8 5 0 1 2
c RTE, RTRH 7 5 0 0 2
Total 22 15 0 1 6
5
Egg products
a Liquid egg 9 5 1 0 3
b RTE egg products 8 5 0 0 3
c Pastries 7 5 0 1 1
Total 24 15 1 1 7
6 Pet food
a Low moisture products 6 5 0 0 1
b High moisture products 6 6 0 0 0
c Raw meat 5 5 0 0 0
Total 17 16 0 0 1
All categories 140 100 9 5 26
The samples, which were not used in the calculations, are provided in
Table 3.
Note that the 9 (ND) samples were obtained with the reference method.

bioMérieux
ADRIA Développement 9/50 22 January 2019
Summary Report (Version 0)
TEMPO EB
Table 3 - Samples which were not used in the calculations
Sample
N° Product
Reference method : ISO 21528-2
Alternative method : TEMPO EB
Category Type
565 Raw meat ND >5,69 1 a
566 Raw meat ND >5,69 1 a
595 RTRH meat product (pork) ND >5,69 1 c
6694 RTRH meat product (shepherd's pie) <1,00 <1,00 1 c
727 Cheese ND 5,57 2 b
825 Cheese 6,11 >5,69 2 b
847 Cheese ND >5,69 2 b
1001 Milk powder 2,70 * 3,15 2 c
848 Cheese ND >5,69 2 b
627 Brussels sprouts 1,30* 1,65 3 a
631 Fried vegetables <1,00 <2,00 3 a
1014 Diced tomatoes <2,00 1,51 3 a
1085 Mix vegetables <2,00 <1,00 3 a
6864 Frozen sliced leeks <1,00 <1,00 3 a
6865 Frozen carrots <1,00 <1,00 3 a
7083 Frozen spring vegetables <1,00 <1,00 3 a
844 Sliced carrots 1,40 * 1,65 3 b
877 Unseasoned sliced carrots ND >5,69 3 b
561 Spinach with bechamel ND >5,69 3 c
1084 RTE salad <2,00 <1,00 3 c
6871 RTE salad (macedoine) <1,00 <1,00 3 c
7078 Marinated artichoke heart <1,00 <1,00 3 c
7224 RTE salad (cucumber) <1,00 <1,00 3 c
946 Fish <1,00 <1,00 4 a
1083 Tuna >6,18 >5,69 4 a
846 Smoked salmon 1,40 * 1,43 4 b
6867 Smoked fish fillets <1,00 <1,00 4 b
6869 Smoked salmon <1,00 <1,00 4 b
6690 Cooked mussels meat 1,85 <1,00 4 c
6695 RTE salad (smoked salmon) <1,00 <1,00 4 c
728 Liquid egg ND >5,69 5 a
890 White liquid egg 1,60 <1,00 5 a
948 Liquid egg >7,18 >5,69 5 a
950 Yellow liquid egg >7,18 >5,69 5 a
949 Tortilla >7,18 >5,69 5 b
1012 Scrambled eggs 5,33 >5,69 5 b
6870 Tortilla <1,00 <1,00 5 b
889 Almond cream 1,54* 1,52 5 c
6700 Pastry 6,48 >6,69 5 c
888 Bird seeds <1,00 <1,00 6 a
ND: samples with non-determined result (high background microflora)
*: samples with less than 4 colonies on the plate
Analyses performed according to the COFRAC accreditation

bioMérieux
ADRIA Développement 10/50 22 January 2019
Summary Report (Version 0)
TEMPO EB
3.1.1.4 Statistical interpretation
The calculations are provided in Erreur ! Source du renvoi introuvable..
The obtained data were analyzed using the scatter plot. The graphs are
provided with the line of identity (y = x).
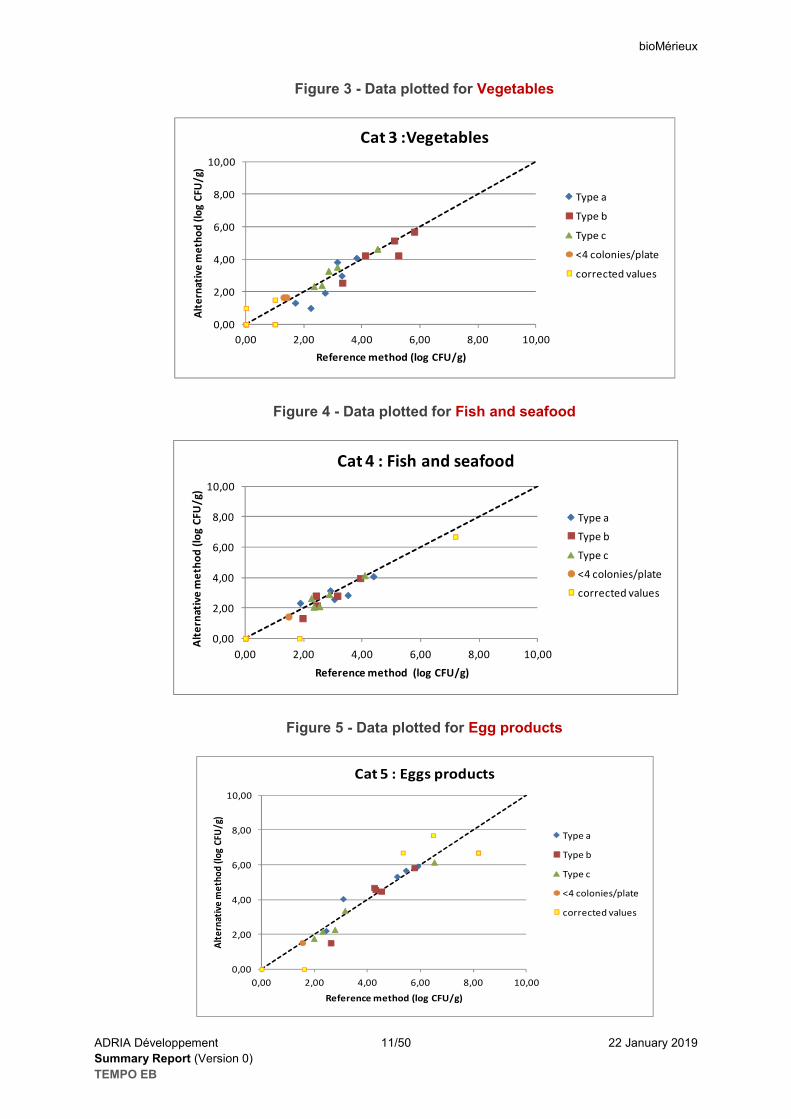
The Figures 1 to 6 show the data plotted for each individual category.
The Figure 7 shows the data plotted for all the products.
Figure 1 - Data plotted for the Meat and meat products
Figure 2 - Data plotted for Dairy products
0,00
2,00
4,00
6,00
8,00
10,00
0,00 2,00 4,00 6,00 8,00 10,00
Alt
ern
ati
ve
me
tho
d (
log
CF
U/
g)
Reference method (log CFU/g)
Cat 1 : Meat and meat products
Type a
Type b
Type c
<4 colonies/plate
corrected values
0,00
2,00
4,00
6,00
8,00
10,00
0,00 2,00 4,00 6,00 8,00 10,00
Alt
ern
ati
ve
me
tho
d (
log
CF
U/
g)
Reference method (log CFU/g)
Cat 2 :Dairy products
Type a
Type b
Type c
<4 colonies/plate
corrected values
bioMérieux
ADRIA Développement 11/50 22 January 2019
Summary Report (Version 0)
TEMPO EB
Figure 3 - Data plotted for Vegetables
Figure 4 - Data plotted for Fish and seafood
Figure 5 - Data plotted for Egg products
0,00
2,00
4,00
6,00
8,00
10,00
0,00 2,00 4,00 6,00 8,00 10,00
Alt
ern
ativ
e m
eth
od
(lo
g C
FU/g
)
Reference method (log CFU/g)
Cat 3 :Vegetables
Type a
Type b
Type c
<4 colonies/plate
corrected values
0,00
2,00
4,00
6,00
8,00
10,00
0,00 2,00 4,00 6,00 8,00 10,00
Alt
ern
ati
ve
me
tho
d (
log
CF
U/
g)
Reference method (log CFU/g)
Cat 4 : Fish and seafood
Type a
Type b
Type c
<4 colonies/plate
corrected values
0,00
2,00
4,00
6,00
8,00
10,00
0,00 2,00 4,00 6,00 8,00 10,00
Alt
ern
ativ
e m
eth
od
(lo
g C
FU/g
)
Reference method (log CFU/g)
Cat 5 : Eggs products
Type a
Type b
Type c
<4 colonies/plate
corrected values

bioMérieux
ADRIA Développement 12/50 22 January 2019
Summary Report (Version 0)
TEMPO EB
Figure 6 - Data plotted for Pet food
Figure 7 - Data plotted for all the products
The calculated values for Average difference and Standard deviation
differences per category are provided in Table 4.
Table 4 - Calculated values
Category Number of samples with
interpretable results �� SD
Lower limit (95%)
Upper limit (95%)
1 Meat and meat products 22 -0,02 0,45 0,97 0,94
2 Dairy products 16 0,21 0,17 -0,14 0,56
3 Vegetables 16 -0,18 0,54 -1,38 1,02
4 Fish and seafood 15 -0,12 0,36 -0,95 0,71
5 Egg products 15 -0,01 0,47 -1,05 1,02
6 Pet food 16 0,05 0,17 -0,32 0,42
All categories 100 -0,01 0,40 -0,81 0,79
��: Average difference SD: Standard deviation of differences
0,00
2,00
4,00
6,00
8,00
10,00
0,00 2,00 4,00 6,00 8,00 10,00
Alt
ern
ativ
e m
eth
od
(lo
g C
FU
/g
)
Reference method (log CFU/g)
Cat 6 : Pet food
Type a
Type b
Type c
<4 colonies/plate
corrected values
0,00
2,00
4,00
6,00
8,00
10,00
0,00 2,00 4,00 6,00 8,00 10,00
Alt
ern
ativ
e m
eth
od
(lo
g C
FU/g
)
Reference method (log CFU/g)
All categoriesCat1
Cat 2
Cat 3
Cat 4
Cat 5
Cat 6
Corrected values
bioMérieux
ADRIA Développement 13/50 22 January 2019
Summary Report (Version 0)
TEMPO EB
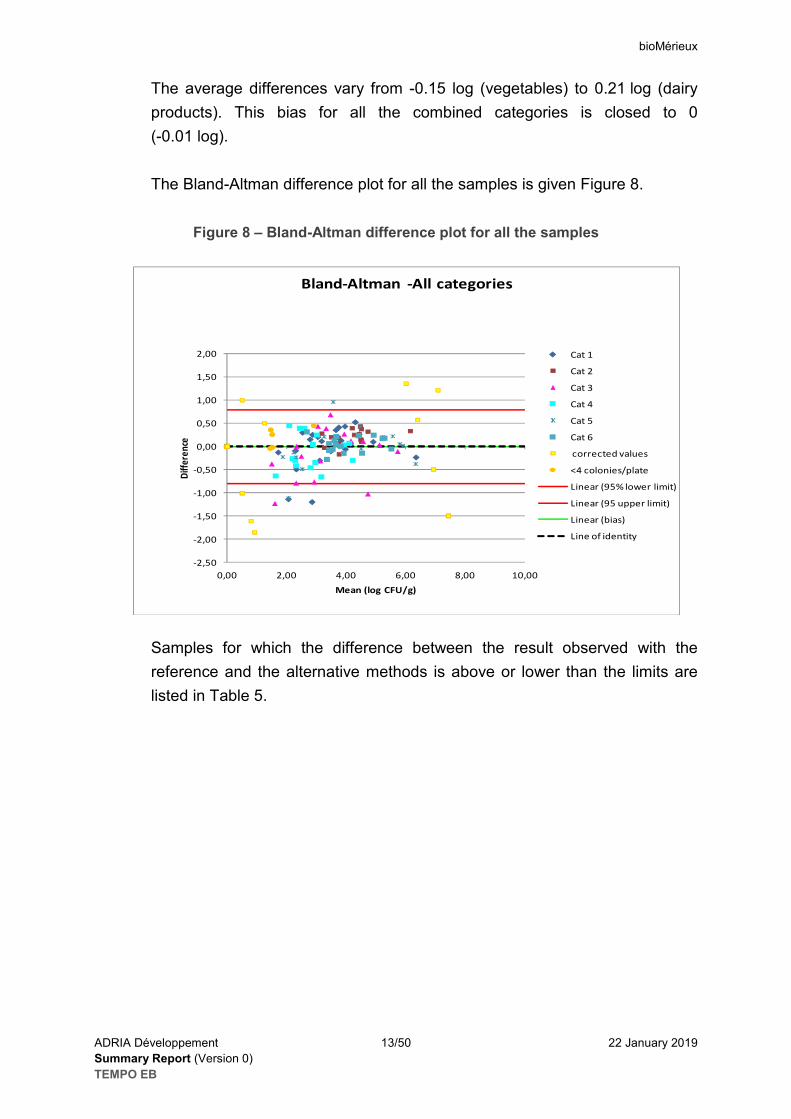
The average differences vary from -0.15 log (vegetables) to 0.21 log (dairy
products). This bias for all the combined categories is closed to 0
(-0.01 log).
The Bland-Altman difference plot for all the samples is given Figure 8.
Figure 8 – Bland-Altman difference plot for all the samples
Samples for which the difference between the result observed with the
reference and the alternative methods is above or lower than the limits are
listed in Table 5.
-2,50
-2,00
-1,50
-1,00
-0,50
0,00
0,50
1,00
1,50
2,00
0,00 2,00 4,00 6,00 8,00 10,00
Dif
fere
nce
Mean (log CFU/g)
Bland-Altman -All categories
Cat 1
Cat 2
Cat 3
Cat 4
Cat 5
Cat 6
corrected values
<4 colonies/plate
Linear (95% lower limit)
Linear (95 upper limit)
Linear (bias)
Line of identity

bioMérieux
ADRIA Développement 14/50 22 January 2019
Summary Report (Version 0)
TEMPO EB
Table 5 - Analysis of the data out of the confidence limits
Values in green: differences in favour of the alternative method Values in red: differences in favour of the reference method LCL: Lower confidence limit UCL: Upper confidence limit
Corrected value
Classification of the data
Cat
ego
ry
Typ
e Sample N°
Product Reference method
Alternative method
Values before correction (reference
and/or alternative) Mea
n
Dif
fere
nce
LCL and UCL
Interpretable results by
both methods
1
c
6684 RTRH meat product (chicken)
3,45 2,26 / 2,85 -1,19
-0,81/ 0,79
1 c 6686 Cooked roast chicken
2,62 1,49 / 2,06 -1,13
3 a 630 Zucchini 2,23 1,00 / 1,62 -1,23
3 b 7084 Grated carrots 5,26 4,23 / 4,74 -1,02
5 b 7082 Mayonnaise 2,61 1,51 / 2,06 -1,11
5 a 6698 Whole liquid egg product
3,08 4,04 / 3,56 0,96
< or > the quantification
limit
3 a 1085 Mix vegetable 1,00 0,00 1,00 0,50 -1,00
3 c 1084 RTE salad 1,00 0,00 2,00/1,00 0,50 -1,00
4 c 6690 Cooked mussels meat
1,85 0,00 1,00 0,92 -1,85
5 a 890 Liquid egg white 1,60 0,00 1,00 0,80 -1,60
5 a 948 Liquid egg 8,18 6,69 7,18/5,69 7,44 -1,49
5 a 950 Liquid egg yolk 8,18 6,69 7,18/5,69 7,44 -1,49
5 b 949 Tortilla 8,18 6,69 7,18/5,69 7,44 -1,49
3 a 631 Fried vegetables 0,00 1,00 1,00/2,00 0,50 1,00
5 b 1012 Scrambled eggs 5,33 6,69 5,69 6,01 1,36
5 c 6700 Pastry 6,48 7,69 6,69 7,08 1,21
3.1.1.5 Discordant results
16 values are outside of the confidence limits at 95%; their repartition is given
in Table 6.
Some of these samples are out of confidence limits due to the shifted range
of enumeration, by the use of different dilution rates between methods.
However, the results of these samples are consistent with both methods.

bioMérieux
ADRIA Développement 15/50 22 January 2019
Summary Report (Version 0)
TEMPO EB
Table 6 - Repartition of the samples outside of the 95 % confidence limits
Number of samples
Interpretable results by both methods
< LCL 5
> UCL 1
Total 6
< or > the quantification limit
< LCL 7
> UCL 3
Total 9
Total < LCL 12
Total >UCL 4
Total 16
The number of samples below the LCL is higher than the number of samples
above the UCL but note that the bias between both tested methods is closed
to 0 (- 0.01 log).
3.1.1.6 Conclusion
The relative trueness of the alternative method is satisfying.
The alternative method is equivalent to the reference method.
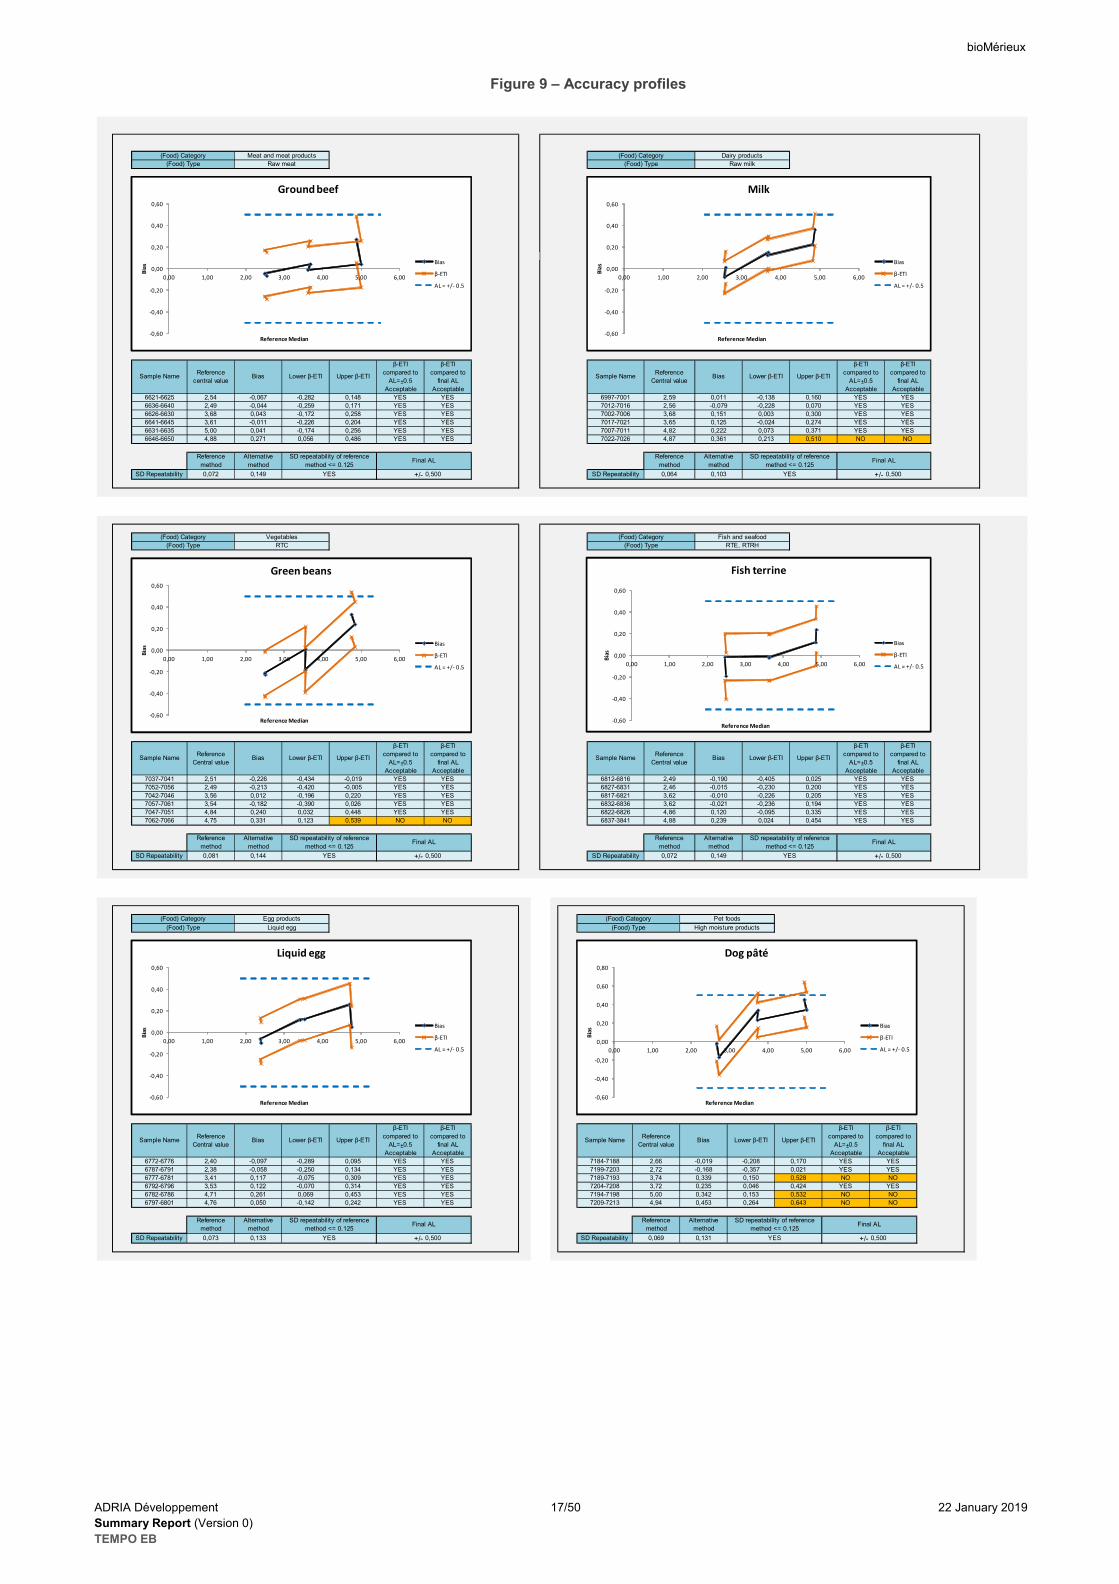
3.1.2 Accuracy profile study
The accuracy profile is a graphical representation of the capacity of measurement of the quantitative
method, obtained by combining acceptability intervals and β-expectation tolerance intervals, both
reported to different levels of the reference value.
3.1.2.1 Matrices
Six matrices were tested. A minimum of one type per category, and therefore
2 different batches, was selected, using 6 samples per type. 2 samples are
contaminated at a low level, 2 at intermediate level, 2 at a high level. For
each sample, 5 replicates (5 different test portions) were tested. The tested
categories, types, matrix and inoculated strains are provided in Table 7.

bioMérieux
ADRIA Développement 16/50 22 January 2019
Summary Report (Version 0)
TEMPO EB
Table 7 - Categories, types and matrices
Category Type Product Inoculated strain Origin Inoculation
level (CFU/g)
Meat and meat products Raw meat Ground beef
Enterobacter cloacae 128
Ground beef
3.102 3.104 1.105
Dairy products Raw milk Milk Escherichia coli 94 Cheese
Vegetables RTC Green beans
Escherichia hermani Ad457
Spinach
Fish and seafood RTE, RTRH
Fish terrine
Citrobacter freundii 24
Seafood cocktail
Egg products Liquid egg Liquid egg
Klebsiella pneumoniae 92
Pastry
Pet foods High moisture products
Dog pâté
Hafnia alvei 124 Pork liver
3.1.2.2 Calculation and interpretation
The raw data are provided in Appendix 5. The statistical results and the
accuracy profiles are provided Figure 9.
The calculations were done using the AP Calculation Tool MCS (Clause
6-1-3-3 calculation and interpretation of accuracy profile study)
ver 2027-01-2015 available on http://standards.iso.org/iso/16140
The accuracy profiles are comprised within the Acceptability Limits fixed at ±
0.5 log for ground beef, fish terrine, and liquid egg.
bioMérieux
ADRIA Développement 17/50 22 January 2019
Summary Report (Version 0)
TEMPO EB
Figure 9 – Accuracy profiles
Sample NameReference
central valueBias Lower β-ETI Upper β-ETI
β-ETI
compared to
AL=±0.5
Acceptable
β-ETI
compared to
final AL
Acceptable
Sample NameReference
Central valueBias Lower β-ETI Upper β-ETI
β-ETI
compared to
AL=±0.5
Acceptable
β-ETI
compared to
final AL
Acceptable
6621-6625 2,54 -0,067 -0,282 0,148 YES YES 6997-7001 2,59 0,011 -0,138 0,160 YES YES
6636-6640 2,49 -0,044 -0,259 0,171 YES YES 7012-7016 2,56 -0,079 -0,228 0,070 YES YES
6626-6630 3,68 0,043 -0,172 0,258 YES YES 7002-7006 3,68 0,151 0,003 0,300 YES YES
6641-6645 3,61 -0,011 -0,226 0,204 YES YES 7017-7021 3,65 0,125 -0,024 0,274 YES YES
6631-6635 5,00 0,041 -0,174 0,256 YES YES 7007-7011 4,82 0,222 0,073 0,371 YES YES
6646-6650 4,88 0,271 0,056 0,486 YES YES 7022-7026 4,87 0,361 0,213 0,510 NO NO
Reference
method
Alternative
method
Reference
method
Alternative
method
SD Repeatability 0,072 0,149 +/- 0,500 SD Repeatability 0,064 0,103 +/- 0,500
SD repeatability of reference
method <= 0.125
YES
SD repeatability of reference
method <= 0.125
YES
Final AL Final AL
(Food) Category Meat and meat products
(Food) Type Raw meat
(Food) Category
(Food) Type
Dairy products
Raw milk
-0,60
-0,40
-0,20
0,00
0,20
0,40
0,60
0,00 1,00 2,00 3,00 4,00 5,00 6,00
Bia
s
Reference Median
Ground beef
Bias
β-ETI
AL = +/- 0.5
-0,60
-0,40
-0,20
0,00
0,20
0,40
0,60
0,00 1,00 2,00 3,00 4,00 5,00 6,00
Bia
s
Reference Median
Milk
Bias
β-ETI
AL = +/- 0.5
Sample NameReference
Central valueBias Lower β-ETI Upper β-ETI
β-ETI
compared to
AL=±0.5
Acceptable
β-ETI
compared to
final AL
Acceptable
Sample NameReference
Central valueBias Lower β-ETI Upper β-ETI
β-ETI
compared to
AL=±0.5
Acceptable
β-ETI
compared to
final AL
Acceptable
7037-7041 2,51 -0,226 -0,434 -0,019 YES YES 6812-6816 2,49 -0,190 -0,405 0,025 YES YES
7052-7056 2,49 -0,213 -0,420 -0,005 YES YES 6827-6831 2,46 -0,015 -0,230 0,200 YES YES
7042-7046 3,56 0,012 -0,196 0,220 YES YES 6817-6821 3,62 -0,010 -0,226 0,205 YES YES
7057-7061 3,54 -0,182 -0,390 0,026 YES YES 6832-6836 3,62 -0,021 -0,236 0,194 YES YES
7047-7051 4,84 0,240 0,032 0,448 YES YES 6822-6826 4,86 0,120 -0,095 0,335 YES YES
7062-7066 4,75 0,331 0,123 0,539 NO NO 6837-3841 4,88 0,239 0,024 0,454 YES YES
Reference
method
Alternative
method
Reference
method
Alternative
method
SD Repeatability 0,081 0,144 +/- 0,500 SD Repeatability 0,072 0,149 +/- 0,500
SD repeatability of reference
method <= 0.125
YES
(Food) Type RTC
SD repeatability of reference
method <= 0.125Final AL Final AL
(Food) Category
YES
Vegetables(Food) Category
(Food) Type
Fish and seafood
RTE, RTRH
-0,60
-0,40
-0,20
0,00
0,20
0,40
0,60
0,00 1,00 2,00 3,00 4,00 5,00 6,00
Bia
s
Reference Median
Fish terrine
Bias
β-ETI
AL = +/- 0.5
-0,60
-0,40
-0,20
0,00
0,20
0,40
0,60
0,00 1,00 2,00 3,00 4,00 5,00 6,00
Bia
s
Reference Median
Green beans
Bias
β-ETI
AL = +/- 0.5
é
Sample NameReference
Central valueBias Lower β-ETI Upper β-ETI
β-ETI
compared to
AL=±0.5
Acceptable
β-ETI
compared to
final AL
Acceptable
6772-6776 2,40 -0,097 -0,289 0,095 YES YES
6787-6791 2,38 -0,058 -0,250 0,134 YES YES
6777-6781 3,41 0,117 -0,075 0,309 YES YES
6792-6796 3,53 0,122 -0,070 0,314 YES YES
6782-6786 4,71 0,261 0,069 0,453 YES YES
6797-6801 4,76 0,050 -0,142 0,242 YES YES
Reference
method
Alternative
method
SD Repeatability 0,073 0,133 +/- 0,500
Egg products
Liquid egg
(Food) Category
(Food) Type
SD repeatability of reference
method <= 0.125Final AL
YES
-0,60
-0,40
-0,20
0,00
0,20
0,40
0,60
0,00 1,00 2,00 3,00 4,00 5,00 6,00
Bia
s
Reference Median
Liquid egg
Bias
β-ETI
AL = +/- 0.5
é
Sample NameReference
Central valueBias Lower β-ETI Upper β-ETI
β-ETI
compared to
AL=±0.5
Acceptable
β-ETI
compared to
final AL
Acceptable
7184-7188 2,66 -0,019 -0,208 0,170 YES YES
7199-7203 2,72 -0,168 -0,357 0,021 YES YES
7189-7193 3,74 0,339 0,150 0,528 NO NO
7204-7208 3,72 0,235 0,046 0,424 YES YES
7194-7198 5,00 0,342 0,153 0,532 NO NO
7209-7213 4,94 0,453 0,264 0,643 NO NO
Reference
method
Alternative
method
SD Repeatability 0,069 0,131 +/- 0,500
(Food) Category Pet foods
Final AL
High moisture products
SD repeatability of reference
method <= 0.125
YES
(Food) Type
-0,60
-0,40
-0,20
0,00
0,20
0,40
0,60
0,80
0,00 1,00 2,00 3,00 4,00 5,00 6,00
Bia
s
Reference Median
Dog pâté
Bias
β-ETI
AL = +/- 0.5

bioMérieux
ADRIA Développement 18/50 22 January 2019
Summary Report (Version 0)
TEMPO EB
The accuracy profiles are outside the Acceptability Limit for:
- Milk: 1 batch for the higher inoculation level:
Upper β.ETI = 0.510,
- Green bean: 1 batch for the higher inoculation level:
Upper β.ETI = 0.539,
- Dog pâté: 1 batch for the medium inoculation level:
Upper β.ETI = 0.528
2 batches for the high inoculation level:
Upper β.ETI = 0.532 and 0.643.
3.1.2.3 Conclusion
The observed profiles are in most of the cases comprised within the
Acceptability Limit fixed at ± 0.5 log.
3.1.3 Quantification limits (LOQ)
The limit of Quantification (LOQ) is the lowest analyte concentration that can be quantified with an
acceptable level of precision and trueness under the conditions of the test.
The LOQ was determined as is it needed for the instrumental methods which
are related to the growth of the microorganism.
3.1.3.1 Experimental design
Blank samples were tested for each category. These blank samples were
used to verify the limit of quantification of the alternative method. 10 test
portions from the same sample were analysed. The same food type matrices
than those tested in the accuracy profile were used.
3.1.3.2 Calculation and interpretation
The threshold standard deviation S0 was calculated as followed:
n
j
jyy
ns
1
2
0 )(1
1

bioMérieux
ADRIA Développement 19/50 22 January 2019
Summary Report (Version 0)
TEMPO EB
where:
n = the total number of test portions used
yj = the log transformed result of test portion j
y = the average log transformed result of all test portions
The limit of quantification is calculated as LOQ = 10 so.
3.1.3.3 Results
Raw data and calculation are provided in Appendix 6. The results are
summarized in Table 8.
Table 8 - Quantification limits per tested matrix
Matrix S0 LOQ
Ground beef 0 0
Milk 0 0
Green beans 0 0
Fish terrine 0 0
Liquid egg 0 0
Dog pâté 0 0
3.1.4 Inclusivity and exclusivity studies
The inclusivity study is a study involving pure target strains to be detected or enumerated by the
alternative method.
The exclusivity study is a study involving pure non-target strains, which can be potentially cross-
reactive, but are not expected to be detected or enumerated by the alternative method.
For the initial validation (2006), 31 target strains and 21 non-target strains
were tested in duplicate on PCA, VRBG and with the TEMPO EB method.
19 additional target strains and 9 non-target strains were tested in 2018 once
on PCA, VRBG and with the TEMPO EB method.
The raw data are provided in Appendix 7.
bioMérieux
ADRIA Développement 20/50 22 January 2019
Summary Report (Version 0)
TEMPO EB
Inclusivity
Same results were observed by both methods for 48 strains. For 2 strains,
differences were observed:
- Citrobacter diversus CIP 8594 was not able to grow on VRBG plates but
was enumerated by the TEMPO EB method.
- Rhanella aqualitis 69 was not enumerated by both methods.
Exclusivity
Among the 30 non-target strains tested, 27 strains were not enumerated with
the TEMPO EB method and 25 strains were not able to grow on VRBG
plates.
3 strains were enumerated by both methods: Stenotrophomonas maltophilia
CIP 6077, Stenotrophomonas maltophilia 112 and Plesiomonas shigelloïdes
Ad673.
2 strains were enumerated only on VRBG plates but showed non
characteristic colonies: Acinetobacter baumanii Ad1090 and Pandoraea sp.
Ad1882.
The TEMPO EB method is as specific and selective as the reference
method.
3.1.5 Practicability
The alternative method practicability was evaluated according to the AFNOR
criteria relative to method comparison study.
Storage conditions,
shelf-life and modalities of
utilisation after first use
The storage temperatures are between 2 and 25°C (room temperature
before analysis) depending on the materials and the reagents.
Time to result Steps Reference method Alternative method
Sample analysis Day 0 Day 0
Enumeration Day 1 Day 1
Confirmation Day 3 /
Common step with the
reference method Preparation of the initial suspension
The results are obtained in one day with the TEMPO EB method while 3 days
are required for the ISO 21528-2 method if colonies are present on the
VRBG plates.

bioMérieux
ADRIA Développement 21/50 22 January 2019
Summary Report (Version 0)
TEMPO EB
3.2 Inter-laboratory study organisation and results
The inter-laboratory study is a study performed by multiple laboratories testing
identical samples at the same time, the results of which are used to estimate
alternative-method performance parameters.
3.2.1 Study organisation
12 laboratories participated to this study in 2006. Detailed instructions were
sent to the collaborators by the expert laboratory.
Pasteurised half-skimmed milk was inoculated with Escherichia coli 94 strain,
isolated from dairy product.
The inoculation levels targeted were:
- level 0: <10 CFU/ml,
- level 1: 100 – 1 000 CFU/ml,
- level 2: 1 000 – 10 000 CFU/ml,
- level 3: 10 000 – 100 000 CFU/ml.
Each laboratory received eight flasks of 25 ml sample, i.e. two flasks per
inoculation level. Furthermore, one non-inoculated sample was added to the
package for total viable count (NF ISO 4833 method).
Blind samples were placed in isothermal boxes and delivered to the different
laboratories. A probe was added to the package in order to register the
temperature profile during the delivery. Samples were shipped in 24 h to
laboratories. Sample temperature should be lower or equal to 8°C during
delivery, and between 0°C - 8°C at receipt.
The collaborators and the expert laboratory performed the analyses with the
alternative and reference methods.

bioMérieux
ADRIA Développement 22/50 22 January 2019
Summary Report (Version 0)
TEMPO EB
3.2.2 Experimental parameters controls
3.2.2.1 Sample stability
In order to evaluate the Escherichia coli 94 strain behaviour during transport,
bacterial counts were done at different time, i.e. inoculation time, after 24 h
and 48 h of storage at 2°C. Results are reported in Table 9.
Table 9 - Escherichia coli 94 count with the ISO 21528-2 method
(in log CFU/ml)
Level 1 Level 2 Level 3
Duplicate 1 Duplicate 2 Duplicate 1 Duplicate 2 Duplicate 1 Duplicate 2
Day 0 100 140 900 850 9 300 7 500
Day 1 100 70 740 570 8 800 7 700
Day 2 70 60 750 750 7 800 5 900
No evolution of the strain was observed after 48 h storage at 5°C ± 3°C.
3.2.3 Logistic conditions
The temperatures measured at reception by the Labs, the temperatures
registered by the thermo-probe, and the receipt dates are given in Table 10.
Table 10 - Sample temperatures at receipt
Laboratories Measured temperature
on receipt (°C) Date of sample arrival
Temperature measured
by the probe (°C)
A 3.0 26/09/06 09h10 2.0
B 14.0 27/09/06 09h50 12.0
C 3.1 26/09/06 10h15 0.5
D 1.0 26/09/06 09h00 0.5
E 3.6 26/09/06 08h15 0.0
F 1.0 26/09/06 08h00 0.5
G 1.1 26/09/06 09h30 0.5
H 13.2 27/09/06 11h00 13.5
I 15.1 27/09/06 10h00 14.0
J 17.8 27/09/06 15h30 16.5
K 13.2 26/09/06 13H30 4.5
L This laboratory did not participate to the study.
M 3.7 26/09/06 11h00 1.5

bioMérieux
ADRIA Développement 23/50 22 January 2019
Summary Report (Version 0)
TEMPO EB
The packages were received on 06/09/26 by 8 laboratories: labs A, C, D, E,
F, G, K and M. The lab K measured a temperature of 13.2°C at receipt while
the temperature measured by the probe was 4.5°C.
Four labs received the packages on 06/09/27, with temperature at receipt
higher than 8.4°C: labs B, H, I and J.
Growth simulations of the E. coli 94 strain were realised with the
Sym’Previus1 software, according to:
- The pH, temperature and aw cardinal values of E. coli strains from the
SYM’PREVIUS database,
- The milk physico-chemical parameters (pH and aw)
- The temperature checked by the probe.
For the lab H, the temperature was higher than 8.4°C during a short time.
The simulation shows a low bacterial growth, lower than 0.15 Log CFU/g.
The lab H data were thus taken into account in the statistical interpretations.
3.2.4 Result analysis
3.2.4.1 Results obtained by the expert Lab.
The results obtained by the expert Lab. are the following (See Table 11).
Table 11 – Results obtained by the expert Lab. (log CFU/ml)
Level Reference method Alternative method
L0 < 1 / < 1 < 1 / < 1
L1 1.91 / 1.81 1.77 / 2.15
L2 2.75 / 2.74 3.04 / 2.91
L3 3.88 / 3.88 4.08 / 3.96
1 http://www.symprevius.net

bioMérieux
ADRIA Développement 24/50 22 January 2019
Summary Report (Version 0)
TEMPO EB
3.2.4.2 Results obtained by the collaborators
Mesophilic aerobic microflora
The mesophilic aerobic microflora was done on the matrix with ISO 4833
method. The results varied from < 10 to 6 CFU/ml.
Enterobacteriaceae enumeration
A summary of the test results is given in Table 12 (CFU/ml) and Table 13 (log
CFU/ml).
Table 12 - Summary of data (CFU/ml)
Lab.
Level 0 Level 1 Level 2 Level 3
Reference
method
Alternative
method
Reference
method
Alternative
method
Reference
method
Alternative
method
Reference
method
Alternative
method
A <10 <10 <10 <10 110 75 45 86 710 740 730 930 9000 7900 15000 6800
C <10 <10 <10 <10 85 80 59 10 840 790 730 390 9100 9200 6800 11000
D <10 <10 <10 <10 75 65 83 120 600 540 710 640 9500 8100 11000 11000
E <10 <10 <10 <10 65 40 68 83 570 500 520 810 7400 7800 9100 9100
F <10 <10 <10 <10 80 120 <10 100 820 910 530 950 8400 7600 12000 6700
G <10 <10 <10 <10 120 65 89 57 810 820 360 810 9600 9200 6000 6000
H <10 <10 <10 <10 65 80 57 83 660 1000 480 400 8000 6100 6000 6800
K <10 <10 <10 <10 90 150 200 140 1200 1200 2100 1300 14000 12000 30000 15000
M <10 <10 <10 <10 140 110 59 86 810 930 1400 1100 10000 8300 11000 12000
Table 13 - Summary of data (log CFU/ml)
Lab.
Level 0 Level 1 Level 2 Level 3
Reference
method
Alternative
method
Reference
method
Alternative
method
Reference
method
Alternative
method
Reference
method
Alternative
method
A / / / / 2,041 1,875 1,653 1,934 2,851 2,869 2,863 2,968 3,954 3,898 4,176 3,833
C / / / / 1,929 1,903 1,771 1,000 2,924 2,898 2,863 2,591 3,959 3,964 3,833 4,041
D / / / / 1,875 1,813 1,919 2,079 2,778 2,732 2,851 2,806 3,978 3,908 4,041 4,041
E / / / / 1,813 1,602 1,833 1,919 2,756 2,699 2,716 2,908 3,869 3,892 3,959 3,959
F / / / / 1,903 2,079 <1,00 2,000 2,914 2,959 2,724 2,978 3,924 3,881 4,079 3,826
G / / / / 2,079 1,813 1,949 1,756 2,908 2,914 2,556 2,908 3,982 3,964 3,778 3,778
H / / / / 1,813 1,903 1,756 1,919 2,820 3,000 2,681 2,602 3,903 3,785 3,778 3,833
K / / / / 1,954 2,176 2,301 2,146 3,079 3,079 3,322 3,114 4,146 4,079 4,477 4,176
M / / / / 2,146 2,041 1,771 1,934 2,908 2,968 3,146 3,041 4,000 3,919 4,041 4,079

bioMérieux
ADRIA Développement 25/50 22 January 2019
Summary Report (Version 0)
TEMPO EB
3.2.5 Calculation and interpretation
3.2.5.1 Visual linearity checking
The figure 10 shows the data points after log10 transformation. The visual
inspection shows that the alternative method gives results, which are
proportional to those of the reference method. The data are distributed
closely to the first bisecting lines with a slope equal to 1.
For level 1, the results from Lab F can’t be taken into account as no colony
was enumerated for one sample. Only 8 data sets are thus available for this
inoculation level. Figure 10 - Visual linearity checking
3.2.5.2 Accuracy profile calculation
Statistical calculations were done according to the Excel spreadsheet
available on http://standards.iso.org/ISO/16140. A summary of the statistical
test is provided in Table 14.
1,000
2,000
3,000
4,000
5,000
6,000
1,000 2,000 3,000 4,000 5,000 6,000
Lo
g (
Alt
ern
ati
ve
)
Log (Reference)
Visual linearity checking

bioMérieux
ADRIA Développement 26/50 22 January 2019
Summary Report (Version 0)
TEMPO EB
Table 14 - Summary of statistical tests
Accuracy profile 0,5
Study Name TEMPO EB Date 2006 Coordinator ADRIA Développement FAUX
Tolerance probability (beta) 80% 80% 80%
Acceptability limit in log (lambda) 0,50 0,50 0,50
Alternative method Reference method Levels Low Medium High Low Medium High
Target value 1,924 2,892 3,945
Number of participants (K) 8 9 9 8 9 9
Average for alternative method 1,853 2,869 3,985 1,924 2,892 3,945
Repeatability standard deviation (sr) 0,227 0,144 0,133 0,116 0,050 0,045
Between-labs standard deviation (sL) 0,170 0,153 0,129 0,093 0,098 0,069
Reproducibility standard deviation (sR) 0,283 0,210 0,186 0,149 0,110 0,082
Corrected number of dof 12,683 12,608 13,120 12,384 9,813 10,721
Coverage factor 1,408 1,409 1,404
Interpolated Student t 1,352 1,353 1,350
Tolerance interval standard deviation 0,2949 0,2188 0,1933
Lower TI limit 1,454 2,573 3,724
Upper TI limit 2,251 3,165 4,246 Bias -0,071 -0,023 0,040
Relative Lower TI limit (beta = 80%) -0,470 -0,319 -0,221 FAUX
Relative Upper TI limit (beta = 80%) 0,328 0,273 0,301 FAUX
Lower Acceptability Limit -0,50 -0,50 -0,50
Upper Acceptability Limit 0,50 0,50 0,50
New acceptability limits may be based on reference method pooled variance
Pooled repro standard dev of reference 0,117
These values are collected in a graphical representation together with the
acceptability limits (AL). This representation is given Figure 11.
Figure 11 - Accuracy profile
-0,6
-0,4
-0,2
0,0
0,2
0,4
0,6
1,5 2,0 2,5 3,0 3,5 4,0 4,5
Accura
cy (
diffe
rence o
f L
og)
Levels Log(cfu/g)
Bias Relative Lower TI limit (beta = 80%)
Relative Upper TI limit (beta = 80%) Lower Acceptability Limit
Upper Acceptability Limit
Application of clause 6.2.3
Step 8: If any of the values for the β-ETI
fall outside the acceptability limits,
calculate the pooled average
reproducibility standard deviation of
the reference method. Step 9: Calculate new

bioMérieux
ADRIA Développement 27/50 22 January 2019
Summary Report (Version 0)
TEMPO EB
It is observed that for all the levels, the tolerance interval limits of the
alternative method are within the acceptable limits of ± 0.5 log.
The results obtained with the alternative method are not statically different
than those obtained with the reference method.
3.2.5.3 Conclusion
The alternative method is equivalent to the reference method.
4 GENERAL CONCLUSION
The observed data and interpretation confirm the performances of the
alternative method:
- 140 samples were tested in the relative trueness study, providing
100 interpretable results by both methods which clearly satisfied the
required criteria for quantitative method comparison per ISO 16140-
2:2016.
- The observed profiles are in most of the cases comprised within the
Acceptability Limit fixed at ± 0.5 Log CFU/g in the EN ISO 16140-
2:2016.
- The inclusivity and exclusivity testing shows satisfying results.
- The results are obtained in one day with the TEMPO EB method while
3 days are required for the ISO 21528-2 method if colonies are
present on the VRBG plates.
- The quality assurance parameters were verified (strain stability,
logistic conditions, analyses), confirming that the inter-laboratory
study was conducted in appropriate conditions.
- The data interpretations were done according to the EN ISO 16140-
2:2016. For the three contamination levels, the alternative method is
accepted as equivalent to the reference method.

bioMérieux
ADRIA Développement 28/50 22 January 2019
Summary Report (Version 0)
TEMPO EB
Based on the results obtained for the method comparison study and
the inter-laboratory study, the alternative method is considered
equivalent to the reference method.
Quimper, 22 January 2019
Sarah PERON
Technical Study Manager
Validation of Alternative methods
Food Safety & Quality
Maryse RANNOU
Project Manager
Validation of Alternative methods
Food Safety & Quality
I hereby attest to the validation of the results of the analyses carried out under the COFRAC accreditation.
I hereby attest to the validation of the verification of the conformity of the report (opinion and interpretation).

bioMérieux
ADRIA Développement 29/50 22 January 2019
Summary Report (Version 0)
TEMPO EB
Appendix 1 – Flow diagram of the alternative method: TEMPO EB
Sample 1/10 dilution in a TEMPO® stomacher bag
Diluent: peptone-salt
1/4000 Dilution 1/400 Dilution 1/40 Dilution
3.9 ml distilled water 3.9 ml distilled water 3 ml distilled water
+ + +
0.1 ml suspension 1/100 0.1 ml suspension 1/10 1 ml suspension 1/10
in a TEMPO® EB vial
Incubation: 22 h - 27 h at 35°C 1°C
Reading
The 1/40 dilution allows 10 to 49 000 cfu/g enumeration
The 1/400 dilution allows 100 to 490 000 cfu/g enumeration
The 1/4000 dilution allows 1 000 to 4 900 000 cfu/g enumeration.
bioMérieux
ADRIA Développement 30/50 22 January 2019
Summary Report (Version 0)
TEMPO EB
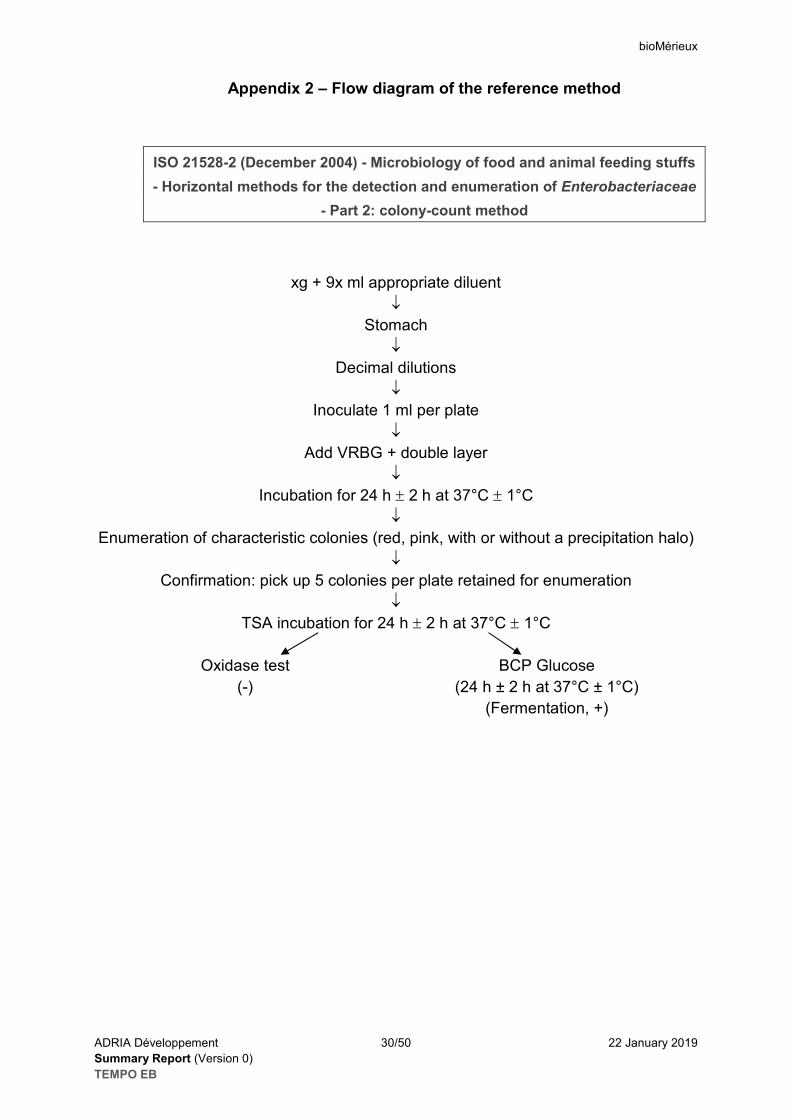
Appendix 2 – Flow diagram of the reference method
ISO 21528-2 (December 2004) - Microbiology of food and animal feeding stuffs
- Horizontal methods for the detection and enumeration of Enterobacteriaceae
- Part 2: colony-count method
xg + 9x ml appropriate diluent
Stomach
Decimal dilutions
Inoculate 1 ml per plate
Add VRBG + double layer
Incubation for 24 h 2 h at 37°C 1°C
Enumeration of characteristic colonies (red, pink, with or without a precipitation halo)
Confirmation: pick up 5 colonies per plate retained for enumeration
TSA incubation for 24 h 2 h at 37°C 1°C
Oxidase test BCP Glucose
(-) (24 h ± 2 h at 37°C ± 1°C)
(Fermentation, +)

bioMérieux
ADRIA Développement 31/50 22 January 2019
Summary Report (Version 0)
TEMPO EB
ISO 21528-2 (June 2017) - Microbiology of the food chain - Horizontal method
for detection and enumeration of Enterobacteriaceae - Part 2: Colony-count
technique
xg + 9x ml appropriate diluent
Stomach
Decimal dilutions
Inoculate 1 ml per plate
Add VRBG + double layer
Incubation for 24 h 2 h at 37°C 1°C
Enumeration of characteristic colonies (red, pink, with or without a precipitation halo)
Confirmation: pick up 5 colonies per plate retained for enumeration
TSA incubation for 24 h 2 h at 37°C 1°C
Oxidase test OF Glucose
(-) (24 h ± 2 h at 37°C ± 1°C)
(Fermentation, +)

bioMérieux
ADRIA Développement 32/50 22 January 2019
Summary Report (Version 0)
TEMPO EB
Appendix 3 – Artificial contaminations of samples
Year of analysis
N° Sample French name product English name product
Artificial contaminations
Cat
ego
ry
typ
e
Strain Origin Injury protocol Injury
measurement
2018 7077 Choux-fleurs surgelés
Frozen cauliflower Klebsiella pneumoniae 139 Vegetables Seeding 48h at 3±2°C / 3 a
2018 7078 Cœurs d'artichauts marinés
Marinated artichoke heart
Escherichia hermannii Ad457
Vegetables Seeding 48h at 3±2°C / 3 c
2018 7079 Filets de maquereaux fumés
Smoked fish fillets Enterobacter cloacae Ad230
Fish Seeding 48h at 3±2°C / 4 b
2018 7080 Filets de harengs fumés
Smoked fish fillets Enterobacter cloacae Ad230
Fish Seeding 48h at 3±2°C / 4 b
2018 7081 Truite fumée Smoked salmon Citrobacter braakii Ad2701 Seafood Seeding 48h at 3±2°C / 4 b
2018 7082 Mayonnaise fraiche Mayonnaise Citrobacter freundii Ad1326 Egg product Seeding 48h at 3±2°C / 5 b
2018 7225 Gratin de choux fleurs
RTRH cauliflower gratin
Serratia ficaria 113 Vegetables Seeding 48h at 3±2°C / 3 c
2018 7226 Petits pois surgelés Frozen peas Pantoea agglomerans 117 Vegetables Seeding 48h at 3±2°C / 3 a
2018 7248 Poudre de lait écrémé Skim milk powder Escherichia coli Ad1422 Dairy product HT 5 min 56°C 0,6 2 c
2018 7249 Poudre de lait demi écrémé
Half skim milk powder
Escherichia coli Ad1422 Dairy product HT 5 min 56°C 0,6 2 c
2018 7250 Poudre de lait (calcium)
Milk powder Escherichia coli Ad1422 Dairy product HT 5 min 56°C 0,6 2 c
2018 7251 Croquettes pour chiens
Low moisture dog food
Enterobacter aerogenes Ad889
Feed product HT 5 min 56°C 1,0 6 a
2018 7252 Croquettes pour chats
Low moisture cat food
Enterobacter aerogenes Ad889
Feed product HT 5 min 56°C 1,0 6 a
2018 8539 Poudre de lait écrémé Milk powder Cronobacter sakazakii Ad916
Milk powder HT 5 min 56°C 0,9 2 c
2018 8540 Poudre de lait demi écrémé
Milk powder Cronobacter sakazakii Ad916
Milk powder HT 5 min 56°C 0,9 2 c
bioMérieux
ADRIA Développement 33/50 22 January 2019
Summary Report (Version 0)
TEMPO EB
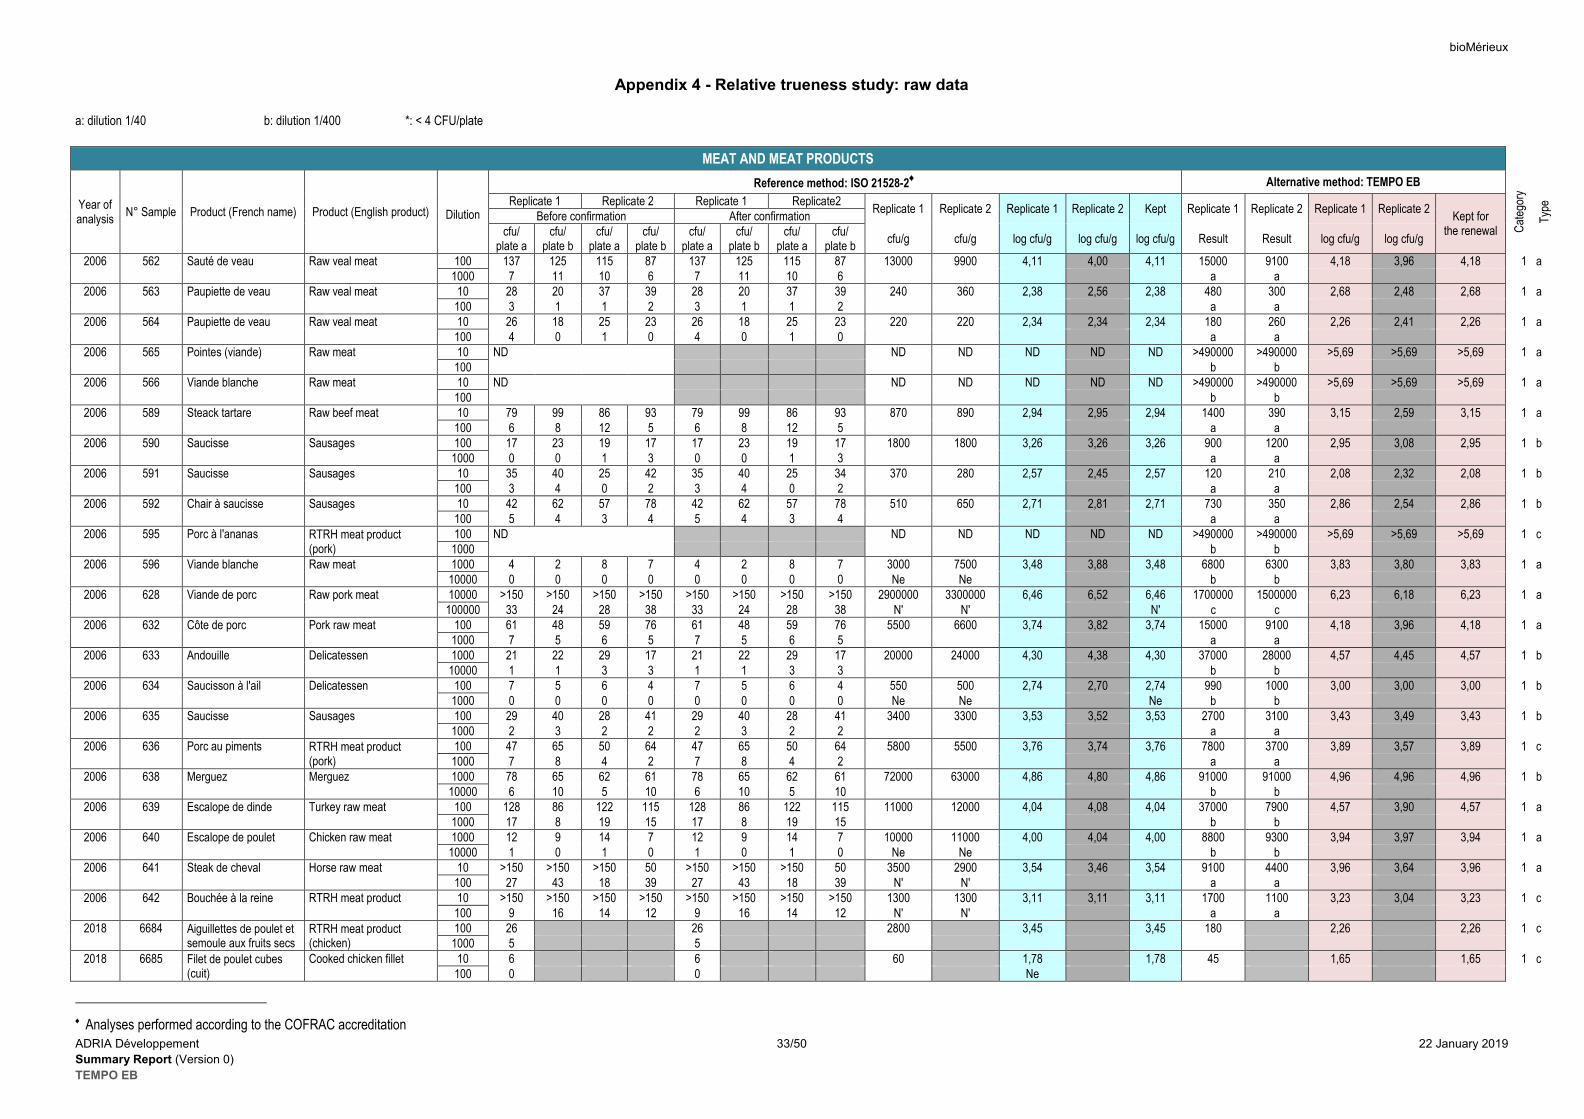
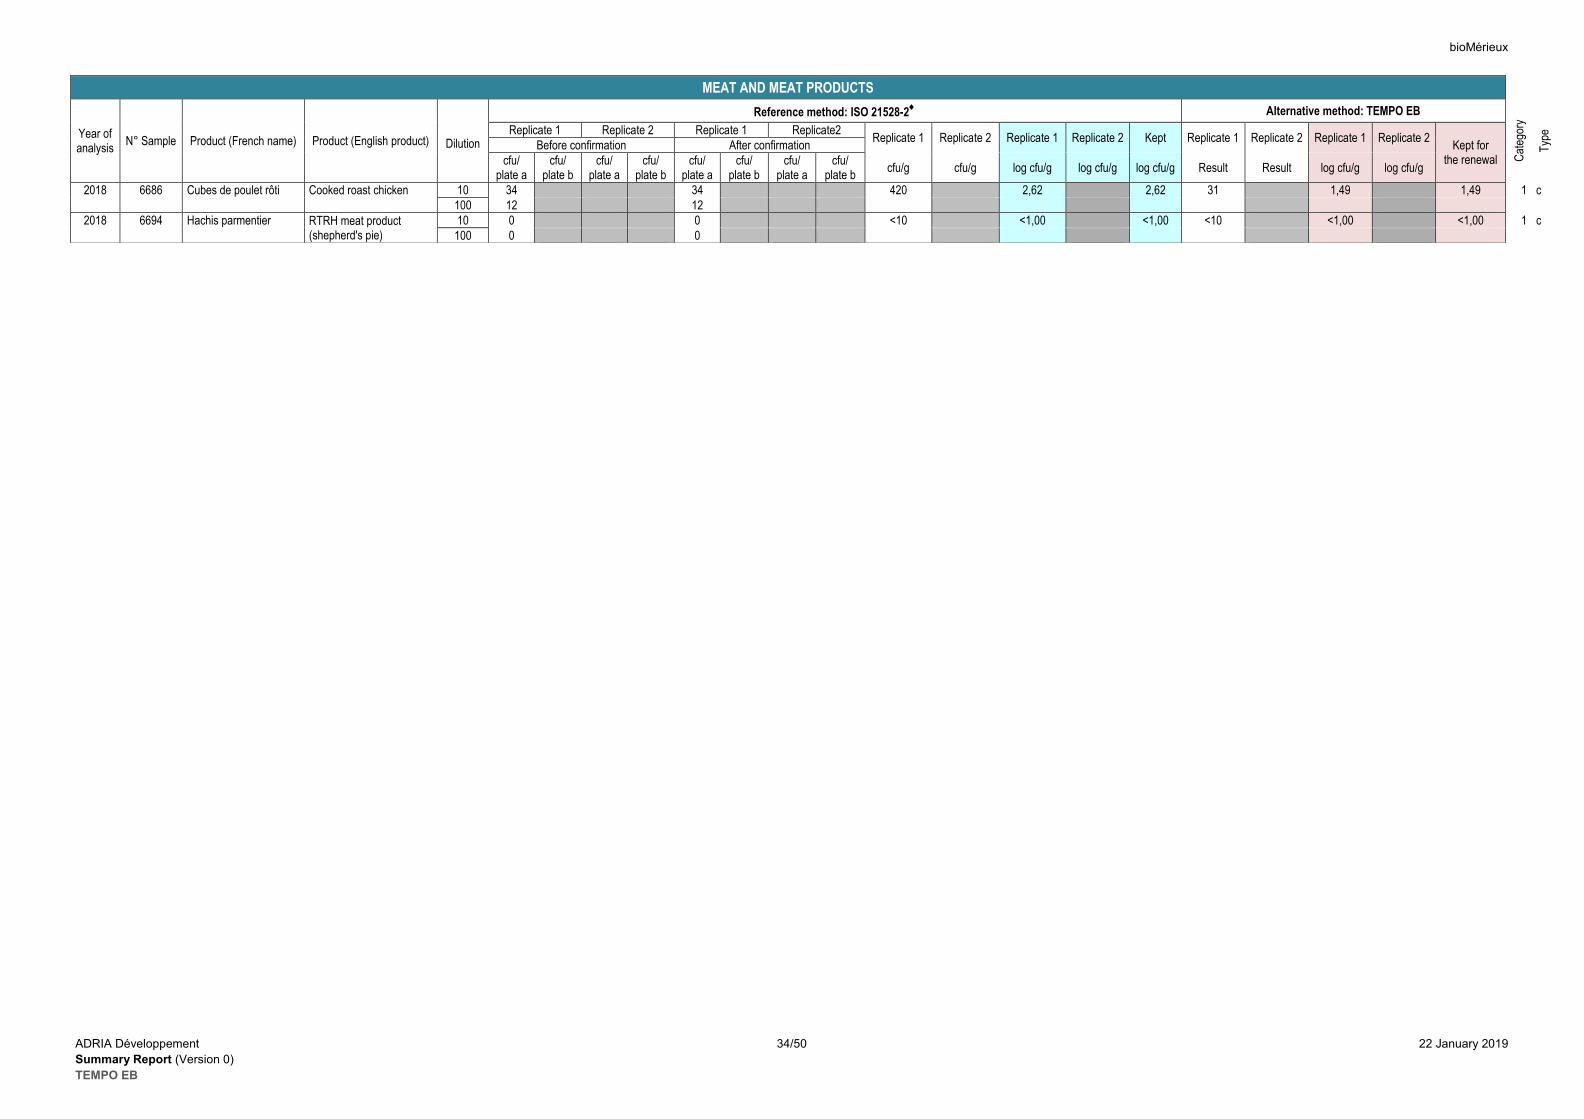
Appendix 4 - Relative trueness study: raw data a: dilution 1/40 b: dilution 1/400 *: < 4 CFU/plate
MEAT AND MEAT PRODUCTS
Year of analysis
N° Sample Product (French name) Product (English product) Dilution
Reference method: ISO 21528-2
Alternative method: TEMPO EB
Cat
egor
y
Typ
e Replicate 1 Replicate 2 Replicate 1 Replicate2 Replicate 1 Replicate 2 Replicate 1 Replicate 2 Kept Replicate 1 Replicate 2 Replicate 1 Replicate 2
Kept for the renewal
Before confirmation After confirmation
cfu/ plate a
cfu/ plate b
cfu/ plate a
cfu/ plate b
cfu/ plate a
cfu/ plate b
cfu/ plate a
cfu/ plate b
cfu/g cfu/g log cfu/g log cfu/g log cfu/g Result Result log cfu/g log cfu/g
2006 562 Sauté de veau Raw veal meat 100 137 125 115 87 137 125 115 87 13000 9900 4,11 4,00 4,11 15000 9100 4,18 3,96 4,18 1 a
1000 7 11 10 6 7 11 10 6 a a
2006 563 Paupiette de veau Raw veal meat 10 28 20 37 39 28 20 37 39 240 360 2,38 2,56 2,38 480 300 2,68 2,48 2,68 1 a
100 3 1 1 2 3 1 1 2 a a
2006 564 Paupiette de veau Raw veal meat 10 26 18 25 23 26 18 25 23 220 220 2,34 2,34 2,34 180 260 2,26 2,41 2,26 1 a
100 4 0 1 0 4 0 1 0 a a
2006 565 Pointes (viande) Raw meat 10 ND ND ND ND ND ND >490000 >490000 >5,69 >5,69 >5,69 1 a
100 b b
2006 566 Viande blanche Raw meat 10 ND ND ND ND ND ND >490000 >490000 >5,69 >5,69 >5,69 1 a
100 b b
2006 589 Steack tartare Raw beef meat 10 79 99 86 93 79 99 86 93 870 890 2,94 2,95 2,94 1400 390 3,15 2,59 3,15 1 a
100 6 8 12 5 6 8 12 5 a a
2006 590 Saucisse Sausages 100 17 23 19 17 17 23 19 17 1800 1800 3,26 3,26 3,26 900 1200 2,95 3,08 2,95 1 b
1000 0 0 1 3 0 0 1 3 a a
2006 591 Saucisse Sausages 10 35 40 25 42 35 40 25 34 370 280 2,57 2,45 2,57 120 210 2,08 2,32 2,08 1 b
100 3 4 0 2 3 4 0 2 a a
2006 592 Chair à saucisse Sausages 10 42 62 57 78 42 62 57 78 510 650 2,71 2,81 2,71 730 350 2,86 2,54 2,86 1 b
100 5 4 3 4 5 4 3 4 a a
2006 595 Porc à l'ananas RTRH meat product (pork)
100 ND ND ND ND ND ND >490000 >490000 >5,69 >5,69 >5,69 1 c
1000 b b
2006 596 Viande blanche Raw meat 1000 4 2 8 7 4 2 8 7 3000 7500 3,48 3,88 3,48 6800 6300 3,83 3,80 3,83 1 a
10000 0 0 0 0 0 0 0 0 Ne Ne b b
2006 628 Viande de porc Raw pork meat 10000 >150 >150 >150 >150 >150 >150 >150 >150 2900000 3300000 6,46 6,52 6,46 1700000 1500000 6,23 6,18 6,23 1 a
100000 33 24 28 38 33 24 28 38 N' N' N' c c
2006 632 Côte de porc Pork raw meat 100 61 48 59 76 61 48 59 76 5500 6600 3,74 3,82 3,74 15000 9100 4,18 3,96 4,18 1 a
1000 7 5 6 5 7 5 6 5 a a
2006 633 Andouille Delicatessen 1000 21 22 29 17 21 22 29 17 20000 24000 4,30 4,38 4,30 37000 28000 4,57 4,45 4,57 1 b
10000 1 1 3 3 1 1 3 3 b b
2006 634 Saucisson à l'ail Delicatessen 100 7 5 6 4 7 5 6 4 550 500 2,74 2,70 2,74 990 1000 3,00 3,00 3,00 1 b
1000 0 0 0 0 0 0 0 0 Ne Ne Ne b b
2006 635 Saucisse Sausages 100 29 40 28 41 29 40 28 41 3400 3300 3,53 3,52 3,53 2700 3100 3,43 3,49 3,43 1 b
1000 2 3 2 2 2 3 2 2 a a
2006 636 Porc au piments RTRH meat product (pork)
100 47 65 50 64 47 65 50 64 5800 5500 3,76 3,74 3,76 7800 3700 3,89 3,57 3,89 1 c
1000 7 8 4 2 7 8 4 2 a a
2006 638 Merguez Merguez 1000 78 65 62 61 78 65 62 61 72000 63000 4,86 4,80 4,86 91000 91000 4,96 4,96 4,96 1 b
10000 6 10 5 10 6 10 5 10 b b
2006 639 Escalope de dinde Turkey raw meat 100 128 86 122 115 128 86 122 115 11000 12000 4,04 4,08 4,04 37000 7900 4,57 3,90 4,57 1 a
1000 17 8 19 15 17 8 19 15 b b
2006 640 Escalope de poulet Chicken raw meat 1000 12 9 14 7 12 9 14 7 10000 11000 4,00 4,04 4,00 8800 9300 3,94 3,97 3,94 1 a
10000 1 0 1 0 1 0 1 0 Ne Ne b b
2006 641 Steak de cheval Horse raw meat 10 >150 >150 >150 50 >150 >150 >150 50 3500 2900 3,54 3,46 3,54 9100 4400 3,96 3,64 3,96 1 a
100 27 43 18 39 27 43 18 39 N' N' a a
2006 642 Bouchée à la reine RTRH meat product 10 >150 >150 >150 >150 >150 >150 >150 >150 1300 1300 3,11 3,11 3,11 1700 1100 3,23 3,04 3,23 1 c
100 9 16 14 12 9 16 14 12 N' N' a a
2018 6684 Aiguillettes de poulet et semoule aux fruits secs
RTRH meat product (chicken)
100 26 26 2800 3,45 3,45 180 2,26 2,26 1 c
1000 5 5
2018 6685 Filet de poulet cubes (cuit)
Cooked chicken fillet 10 6 6 60 1,78 1,78 45 1,65 1,65 1 c
100 0 0 Ne
Analyses performed according to the COFRAC accreditation
bioMérieux
ADRIA Développement 34/50 22 January 2019
Summary Report (Version 0)
TEMPO EB
MEAT AND MEAT PRODUCTS
Year of analysis
N° Sample Product (French name) Product (English product) Dilution
Reference method: ISO 21528-2
Alternative method: TEMPO EB
Cat
egor
y
Typ
e Replicate 1 Replicate 2 Replicate 1 Replicate2 Replicate 1 Replicate 2 Replicate 1 Replicate 2 Kept Replicate 1 Replicate 2 Replicate 1 Replicate 2
Kept for the renewal
Before confirmation After confirmation
cfu/ plate a
cfu/ plate b
cfu/ plate a
cfu/ plate b
cfu/ plate a
cfu/ plate b
cfu/ plate a
cfu/ plate b
cfu/g cfu/g log cfu/g log cfu/g log cfu/g Result Result log cfu/g log cfu/g
2018 6686 Cubes de poulet rôti Cooked roast chicken 10 34 34 420 2,62 2,62 31 1,49 1,49 1 c
100 12 12
2018 6694 Hachis parmentier RTRH meat product (shepherd's pie)
10 0 0 <10 <1,00 <1,00 <10 <1,00 <1,00 1 c
100 0
0

bioMérieux
ADRIA Développement 35/50 22 January 2019
Summary Report (Version 0)
TEMPO EB
DAIRY PRODUCTS
Year of analysis
N° Sample Product (French name) Product (English product) Dilution
Reference method: ISO 21528-2
Alternative method: TEMPO EB
Cat
egor
y
Typ
e Replicate 1 Replicate 2 Replicate 1 Replicate2 Replicate 1 Replicate 2 Replicate 1 Replicate 2 Kept Replicate 1 Replicate 2 Replicate 1 Replicate 2
Kept for the renewal
Before confirmation After confirmation
cfu/ plate a
cfu/ plate b
cfu/ plate a
cfu/ plate b
cfu/ plate a
cfu/ plate b
cfu/ plate a
cfu/ plate b
cfu/g cfu/g log cfu/g log cfu/g log cfu/g Result Result log cfu/g log cfu/g
2006 725 Lait cru Raw milk 100 >150 >150 >150 >150 >150 >150 >150 >150 26000 24000 4,41 4,38 4,41 37000 30000 4,57 4,48 4,57 2 a
1000 29 22 25 22 29 22 25 22 N' N' a a
2006 726 Rocamadour Cheese 100 22 29 25 27 22 29 25 27 2500 2600 3,40 3,41 3,40 4000 2200 3,60 3,34 3,60 2 b
1000 0 4 4 1 0 4 4 1 a a
2006 727 Mozarella Cheese 100 >150 >150 >150 >150 ND ND ND ND ND 370000 370000 5,57 5,57 5,57 2 b
1000 >150 >150 >150 >150 b b
2006 824 Lait cru Raw milk 100 15 23 17 16 15 23 17 16 1900 1600 3,28 3,20 3,28 1800 1800 3,26 3,26 3,26 2 a
1000 2 2 2 0 2 2 2 0 a a
2006 825 Mozarella Cheese 1000 >150 >150 >150 >150 >150 >150 >150 >150 1300000 1000000 6,11 6,00 6,11 >490000 >490000 >5,69 >5,69 >5,69 2 b
10000 1137 132 90 118 137 132 90 118 N' N' b b
2006 842 Lait cru Raw milk 10000 99 85 110 75 99 85 110 75 970000 970000 5,99 5,99 5,99 2100000 2500000 6,32 6,40 6,32 2 a
100000 13 16 15 13 13 16 15 13 c c
2006 847 Crottin de chèvre Cheese 10000 >150 >150 >150 >150 ND ND ND ND ND >4900000 >4900000 >5,69 >5,69 >5,69 2 b
100000 >150 >150 >150 >150 c c
2006 848 Crottin de chèvre Cheese 10000 >150 >150 >150 >150 ND ND ND ND ND >4900000 >4900000 >5,69 >5,69 >5,69 2 b
100000 >150 >150 >150 >150 c c
2006 879 Crottin de chèvre Cheese 100 137 150 165 139 137 150 165 139 14000 15000 4,15 4,18 4,15 25000 21000 4,40 4,32 4,40 2 b
1000 8 11 13 9 8 11 13 9 a a
2006 880 Lait cru Raw milk 1000 30 26 39 19 30 26 39 19 27000 30000 4,43 4,48 4,43 37000 37000 4,57 4,57 4,57 2 a
10000 2 1 6 3 2 1 6 3 a a 2
2006 1000 Poudre de lait Milk powder 1000 8 6 10 12 8 6 10 12 7000 11000 3,85 4,04 3,85 4800 4000 3,68 3,60 3,68 2 c
10000 0 0 0 1 0 0 0 0 Ne Ne Ne b b 2
2006 1001 Poudre de lait Milk powder 1000 1 0 2 2 1 0 1 0 500 500 2,70* 2,70* 2,70* 1400 2100 3,15 3,32 3,15 2 c
10000 0 0 0 0 0 0 0 0
b c
2006 1002 Leerdamer Cheese 1000 36 21 31 21 36 21 31 21 29000 28000 4,46 4,45 4,46 37000 60000 4,57 4,78 4,57 2 b
10000 5 2 7 2 5 2 7 2 b b
2006 1003 Camembert Cheese 1000 35 32 40 37 35 32 40 37 37000 37000 4,57 4,57 4,57 78000 60000 4,89 4,78 4,89 2 b
10000 6 8 3 1 6 8 3 1 b b
2006 1006 Reblochon Cheese 1000 26 13 22 14 26 13 22 14 21000 19000 4,32 4,28 4,32 50000 24000 4,70 4,38 4,70 2 b
10000 4 4 1 4 4 4 1 4 b b
2018 6863 Lait cru fermier Raw milk 1000 20 20 18000 4,26 4,26 49000 4,69 4,69 2 a
10000 0 0
2018 7248 Poudre de lait écrémé
Skim milk powder 10 118 118 1100 3,04 3,04 2100 3,32 3,32 2 c
100 7 7
2018 7249 Poudre de lait demi écrémé
Half skim milk powder 1000 19 19 20000 4,30 4,30 37000 4,57 4,57 2 c
10000 3 3
2018 7250 Poudre de lait (calcium)
Milk powder 100 98 98 10000 4,00 4,00 25000 4,40 4,40 2 c
1000 13 13
2018 8539 Poudre de lait écrémé Milk powder 100 44 44 4300 3,63 3,63 6700 3,83 3,83 2 c
1000 3 3
2018 5840 Poudre de lait demi écrémé
Milk powder 100 53 53 5100 3,71 3,71 6000 3,78 3,78 2 c
1000 3 3
Analyses performed according to the COFRAC accreditation

bioMérieux
ADRIA Développement 36/50 22 January 2019
Summary Report (Version 0)
TEMPO EB
VEGETABLES
Year of analysis
N° Sample Product (French name) Product (English product) Dilution
Reference method: ISO 21528-2
Alternative method: TEMPO EB
Cat
egor
y
Typ
e Replicate 1 Replicate 2 Replicate 1 Replicate2 Replicate 1 Replicate 2 Replicate 1 Replicate 2 Kept Replicate 1 Replicate 2 Replicate 1 Replicate 2
Kept for the renewal
Before confirmation After confirmation
cfu/ plate a
cfu/ plate b
cfu/ plate a
cfu/ plate b
cfu/ plate a
cfu/ plate b
cfu/ plate a
cfu/ plate b
cfu/g cfu/g log cfu/g log cfu/g log cfu/g Result Result log cfu/g log cfu/g
2006 561 Epinards à la béchamel Spinach with bechamel 100 ND ND ND ND ND ND >490000 >490000 >5,69 >5,69 >5,69 3 c
1000 b b
2006 593 Piémontaise RTE salad 10 29 52 50 50 29 52 50 50 410 510 2,61 2,71 2,61 250 300 2,40 2,48 2,40 3 c
100 6 4 4 8 6 4 4 8 a a
2006 627 Choux bruxelles Brussels sprouts 10 3 1 0 0 3 1 0 0 20 <10 1,30* <1,00 1,30* 45 44 1,65 1,64 1,65 3 a
100 0 0 0 0 0 0 0 0 a a
2006 629 Haricots verts Green beans 10 38 70 37 70 38 70 37 70 530 530 2,72 2,72 2,72 86 100 1,93 2,00 1,93 3 a
100 2 6 4 5 2 6 4 5 a a
2006 630 Courgettes Zucchini 10 20 17 20 15 20 17 20 15 170 160 2,23 2,20 2,23 10 <10 1,00 <1,00 1,00 3 a
100 1 0 0 1 1 0 0 1 a a
2006 631 Poêlée légumes champignons
Fried vegetables 10 0 0 0 0 0 0 0 0 <10 <10 <1,00 <1,00 <1,00 <100 <100 <2,00 <2,00 <2,00 3 a
100 0 0 0 0 0 0 0 0 b b
2006 844 Carottes rapées Sliced carrots 10 2 3 3 4 2 3 3 4 25 35 1,40* 1,54* 1,40* 45 120 1,65 2,08 1,65 3 b
100 0 0 0 0 0 0 0 0
a a
2006 845 Céleri rémoulade RTE salad (celery) 1000 36 31 31 40 36 31 31 40 34000 39000 4,53 4,59 4,53 43000 55000 4,63 4,74 4,63 3 c
10000 4 4 7 7 4 4 7 7 b a
2006 877 Carottes rapées Unseasoned sliced carrots 10000 >150 >150 >150 >150 ND ND ND ND ND >4900000 >4900000 >5,69 >5,69 >5,69 3 b
100000 >150 >150 >150 >150 c c
2006 878 Chou rouge Red cabbage 10000 80 73 123 74 80 44 123 74 630000 950000 5,80 5,98 5,80 490000 550000 5,69 5,74 5,69 3 b
100000 11 5 9 6 9 5 7 6 b c
2006 947 Julienne de légumes Sliced vegetables 100 16 25 27 16 16 25 27 16 2000 2200 3,30 3,34 3,30 970 1100 2,99 3,04 2,99 3 a
1000 2 2 2 3 2 2 2 3 a a
2006 1014 Tomates en dés Diced tomatoes 100 <100 <100 <100 <100 <100 <100 <100 <100 <100 <100 <2,00 <2,00 <2,00 32 <10 1,51 <1,00 1,51 3 a
1000 <1000 <1000 <1000 <1000 <1000 <1000 <1000 <1000 a a
2006 1084 Salade provençale RTE salad 100 <100 <100 <100 <100 <100 <100 <100 <100 <100 <100 <2,00 <2,00 <2,00 <10 <10 <1,00 <1,00 <1,00 3 c
1000 <1000 <1000 <1000 <1000 <1000 <1000 <1000 <1000 a a
2006 1085 Macédoine de légumes Mix vegetables 100 <100 <100 <100 <100 <100 <100 <100 <100 <100 <100 <2,00 <2,00 <2,00 <10 <10 <1,00 <1,00 <1,00 3 a
1000 <1000 <1000 <1000 <1000 <1000 <1000 <1000 <1000 a a
2018 6687 Epinards à la crème Creamed spinach 10 23 23 220 2,34 2,34 220 2,34 2,34 3 c
100 1 1
2018 6688 Ciboulette Chive 100 22 22 2100 3,32 3,32 360 2,56 2,56 3 b
1000 1 1
2018 6689 Purée de pomme de terre
Mashed potatoes 100 7 7 700 2,85 2,85 1900 3,28 3,28 3 c
1000 2 2 Ne Ne
2018 6864 Emincés de poireaux surgelés
Frozen sliced leeks 10 0 0 <10 <1,00 <1,00 <10 <1,00 <1,00 3 a
100 0 0
2018 6865 Duo de carottes surgelées
Frozen carrots 10 0 0 <10 <1,00 <1,00 <10 <1,00 <1,00 3 a
100 0 0
2018 6866 Poêlée de trois légumes surgelée
Frozen fried vegetables 10 5 5 50 1,70 1,70 21 1,32 1,32 3 a
100 0 0 Ne Ne
2018 6871 Macédoine aux légumes
RTE salad (macedoine) 10 0 0 <10 <1,00 <1,00 <10 <1,00 <1,00 3 c
100 0 0
2018 7077 Choux-fleurs surgelés Frozen cauliflower 100 62 62 6500 3,81 3,81 12000 4,08 4,08 3 a
1000 10 10
2018 7078 Cœurs d'artichauts marinés
Marinated artichoke heart 10 0 0 <10 <1,00 <1,00 <10 <1,00 <1,00 3 c
100 0 0
2018 7083 Printanière de légumes surgelée
Frozen spring vegetables 10 0 0 <10 <1,00 <1,00 <10 <1,00 <1,00 3 a
100 0 0
2018 7084 Carottes râpées Grated carrots 10000 20 20 180000 5,26 5,26 17000 4,23 4,23 3 b
100000 0 0
2018 7085 Mélange de crudités (salade, carotte, chou)
Unseasoned RTE vegetables
1000 129 129 130000 5,11 5,11 140000 5,15 5,15 3 b
10000 11 11
Analyses performed according to the COFRAC accreditation

bioMérieux
ADRIA Développement 37/50 22 January 2019
Summary Report (Version 0)
TEMPO EB
VEGETABLES
Year of analysis
N° Sample Product (French name) Product (English product) Dilution
Reference method: ISO 21528-2
Alternative method: TEMPO EB
Cat
egor
y
Typ
e Replicate 1 Replicate 2 Replicate 1 Replicate2 Replicate 1 Replicate 2 Replicate 1 Replicate 2 Kept Replicate 1 Replicate 2 Replicate 1 Replicate 2
Kept for the renewal
Before confirmation After confirmation
cfu/ plate a
cfu/ plate b
cfu/ plate a
cfu/ plate b
cfu/ plate a
cfu/ plate b
cfu/ plate a
cfu/ plate b
cfu/g cfu/g log cfu/g log cfu/g log cfu/g Result Result log cfu/g log cfu/g
2018 7086 Mélange de crudités (chou, carotte, céleri)
Unseasoned RTE vegetables
100 135 135 13000 4,11 4,11 17000 4,23 4,23 3 b
1000 10 10
2018 7224 Concombre au fromage blanc
RTE salad (cucumber) 10 0 0 <10 <1,00 <1,00 <10 <1,00 <1,00 3 c
100 0 0
2018 7225 Gratin de choux fleurs
RTRH cauliflower gratin 100 15 15 1400 3,15 3,15 3400 3,53 3,53 3 c
1000 0 0
2018 7226 Petits pois surgelés Frozen peas 10 134 134 1400 3,15 3,15 6700 3,83 3,83 3 a
100 23 23

bioMérieux
ADRIA Développement 38/50 22 January 2019
Summary Report (Version 0)
TEMPO EB
FISH AND SEAFOOD
Year of analysis
N° Sample Product (French name) Product (English product) Dilution
Reference method: ISO 21528-2
Alternative method: TEMPO EB
Cat
egor
y
Typ
e Replicate 1 Replicate 2 Replicate 1 Replicate2 Replicate 1 Replicate 2 Replicate 1 Replicate 2 Kept Replicate 1 Replicate 2 Replicate 1 Replicate 2
Kept for the renewal
Before confirmation After confirmation
cfu/ plate a
cfu/ plate b
cfu/ plate a
cfu/ plate b
cfu/ plate a
cfu/ plate b
cfu/ plate a
cfu/ plate b
cfu/g cfu/g log cfu/g log cfu/g log cfu/g Result Result log cfu/g log cfu/g
2006 637 Gambas aux légumes RTRH seafood product (prawns)
100 116 122 86 99 116 122 86 99 12000 9300 4,08 3,97 4,08 14000 95000 4,15 4,98 4,15 4 c
1000 13 9 11 8 13 9 11 8 b c
2006 843 Terrine de saumon Salmon terrine 10 26 20 16 20 26 20 16 20 220 200 2,34 2,30 2,34 120 200 2,08 2,30 2,08 4 c
100 1 1 4 4 1 1 4 4 a a
2006 846 Saumon fumé Smoked salmon 10 3 2 5 1 3 2 5 1 25 30 1,40* 1,48* 1,48* <10 27 <1 1,43 1,43 4 b
100 0 0 0 0 0 0 0 0
a a
2006 886 Terrine de poisson Fish terrine 10 19 19 20 12 19 19 20 12 180 160 2,26 2,20 2,26 440 330 2,64 2,52 2,64 4 c
100 1 1 2 2 1 1 2 2 b a
2006 944 Saumon fumé Smoked salmon 100 103 64 99 86 103 64 99 86 8500 9000 3,93 3,95 3,93 9100 7800 3,96 3,89 3,96 4 b
1000 13 8 5 9 13 8 5 9 a a
2006 945 Cocktail de fruits de mer
Seafood cocktail 10 7 8 5 2 7 8 5 2 75 35 1,88 1,54 1,88 210 330 2,32 2,52 2,32 4 a
100 0 4 0 0 0 4 0 0 Ne Ne b a
2006 946 Loup de mer Fish 10 0 0 0 0 0 0 0 0 <10 <10 <1,00 <1,00 <1,00 <10 <10 <1,00 <1,00 <1,00 4 a
100 0 0 0 0 0 0 0 0 a a
2006 1083 Thon Tuna 1000 >150 >150 >150 >150 >150 >150 >150 >150 >1500000 >1500000 >6,18 >6,18 >6,18 >490000 >490000 >5,69 >5,69 >5,69 4 a
10000 >150 >150 >150 >150 >150 >150 >150 >150 b b
2018 6690 Chair de moules cuites Cooked mussels meat 10 7 7 70 1,85 1,85 <10 <1,00 <1,00 4 c
100 0 0 Ne
2018 6691 Saumon sauvage congelé
Frozen wild salmon 10 117 117 1100 3,04 3,04 380 2,58 2,58 4 a
100 7 7
2018 6692 Tranche de colin poêlé Fried fish 10 35 35 340 2,53 2,53 130 2,11 2,11 4 c
100 2 2
2018 6693 Petit poisson pâné Breaded fish 10 76 76 740 2,87 2,87 810 2,91 2,91 4 c
100 5 5
2018 6695 Salade de lentilles au saumon fumé
RTE salad (smoked salmon)
10 0 0 <10 <1,00 <1,00 <10 <1,00 <1,00 4 c
100 0 0
2018 6696 Merlu Raw fish 100 32 32 3200 3,51 3,51 700 2,85 2,85 4 a
1000 3 3
2018 6697 Filet de plie Raw fish fillet 1000 25 25 24000 4,38 4,38 12000 4,08 4,08 4 a
10000 1 1
2018 6867 Filets de harengs fumés
Smoked fish fillets 10 0 0 <10 <1,00 <1,00 <10 <1,00 <1,00 4 b
100 0 0
2018 6868 Haddock fumé Smoked fish 10 10 10 91 1,96 1,96 21 1,32 1,32 4 b
100 0 0
2018 6869 Saumon fumé Smoked salmon 10 0 0 <10 <1,00 <1,00 <10 <1,00 <1,00 4 b
100 0 0
2018 7079 Filets de maquereaux fumés
Smoked fish fillets 10 29 29 280 2,45 2,45 140 2,15 2,15 4 b
100 2 2
2018 7080 Filets de harengs fumés
Smoked fish fillets 100 13 13 1400 3,15 3,15 630 2,80 2,80 4 b
1000 2 2
2018 7081 Truite fumée Smoked salmon 10 28 28 260 2,41 2,41 630 2,80 2,80 4 b
100 0 0
2018 7087 Filet de tacaud Raw fish fillet 100 20 8 800 2,90 2,90 1400 3,15 3,15 4 a
1000 1 1 Ne Ne
Analyses performed according to the COFRAC accreditation

bioMérieux
ADRIA Développement 39/50 22 January 2019
Summary Report (Version 0)
TEMPO EB
EGG PRODUCTS
Year of analysis
N° Sample Product (French name) Product (English product) Dilution
Reference method: ISO 21528-2
Alternative method: TEMPO EB
Cat
egor
y
Typ
e Replicate 1 Replicate 2 Replicate 1 Replicate2 Replicate 1 Replicate 2 Replicate 1 Replicate 2 Kept Replicate 1 Replicate 2 Replicate 1 Replicate 2
Kept for the renewal
Before confirmation After confirmation
cfu/ plate a
cfu/ plate b
cfu/ plate a
cfu/ plate b
cfu/ plate a
cfu/ plate b
cfu/ plate a
cfu/ plate b
cfu/g cfu/g log cfu/g log cfu/g log cfu/g Result Result log cfu/g log cfu/g
2006 587 Baba au rhum Pastry 10 8 11 12 13 8 11 12 13 95 120 1,98 2,08 1,98 57 86 1,76 1,93 1,76 5 c
100 0 1 1 0 0 1 1 0 Ne Ne a a
2006 588 Meringue au chocolat Chocolate meringue 10 50 67 50 53 50 67 50 53 580 510 2,76 2,71 2,76 190 270 2,28 2,43 2,28 5 c
100 2 8 2 6 2 8 2 6 a a
2006 728 Coule d'œuf Liquid egg 1000 >150 >150 >150 >150 ND ND ND ND ND >490000 >490000 >5,69 >5,69 >5,69 5 a
10000 >150 >150 >150 >150 b b
2006 826 Gâteau Russe Pastry 10 18 20 24 22 18 20 24 22 200 220 2,30 2,34 2,30 150 140 2,18 2,15 2,18 5 c
100 3 2 2 1 3 2 2 1 a a
2006 827 Coule d'œuf Liquid egg 10 26 27 28 19 26 27 28 19 270 230 2,43 2,36 2,43 160 150 2,20 2,18 2,20 5 a
100 5 1 2 1 5 1 2 1 a a
2006 889 Crème d'amande Almond cream 10 8 6 9 3 3 4 5 2 35 35 1,54* 1,54* 1,54* 33 33 1,52 1,52 1,52 5 c
100 1 1 0 1 0 0 0 0 a a
2006 890 Blanc d'œuf White liquid egg 10 5 5 0 2 3 5 0 1 40 5 1,60 0,70* 1,60 <10 10 <1,00 1,00 <1,00 5 a
100 0 0 0 0 0 0 0 0 Ne Ne a a
2006 948 Coule d'œuf Liquid egg 10000 >150 >150 >150 >150 >150 >150 >150 >150 >15000000 >15000000 >7,18 >7,18 >7,18 >490000 >490000 >5,69 >5,69 >5,69 5 a
100000 >150 >150 >150 >150 >150 >150 >150 >150 b b
2006 949 Omelette Tortilla 10000 >150 >150 >150 >150 >150 >150 >150 >150 >15000000 >15000000 >7,18 >7,18 >7,18 >490000 >490000 >5,69 >5,69 >5,69 5 b
100000 >150 >150 >150 >150 >150 >150 >150 >150 b b
2006 950 Jaune d'œuf Yellow liquid egg 10000 >150 >150 >150 >150 >150 >150 >150 >150 >15000000 >15000000 >7,18 >7,18 >7,18 >490000 >490000 >5,69 >5,69 >5,69 5 a
100000 >150 >150 >150 >150 >150 >150 >150 >150 b b
2006 1007 Coule d'œuf Liquid egg 10000 18 44 58 37 11 44 58 22 280000 380000 5,45 5,58 5,45 470000 680000 5,67 5,83 5,67 5 a
100000 3 4 2 2 3 4 2 1 c c
2006 1008 Jaune d'œuf Yellow liquid egg 10000 77 67 113 90 77 67 113 90 780000 1000000 5,89 6,00 5,89 820000 1200000 5,91 6,08 5,91 5 a
100000 16 11 7 11 16 11 6 11 c c
2006 1009 Omelette aux champignons
Mushroom tortilla 10000 67 53 60 48 67 53 60 48 590000 550000 5,77 5,74 5,77 670000 370000 5,83 5,57 5,83 5 b
100000 6 3 9 5 6 3 9 3 c c
2006 1012 Œufs brouillés Scrambled eggs 1000 >150 >150 >150 >150 >150 >150 >150 >150 215000 160000 5,33 5,20 5,33 >490000 >490000 >5,69 >5,69 >5,69 5 b
10000 26 17 22 10 26 17 22 10 N' N' b b
2006 1013 Blanc d'œuf White liquid egg 1000 129 128 154 116 129 128 92 116 130000 100000 5,11 5,00 5,11 210000 250000 5,32 5,40 5,32 5 a
10000 14 12 19 5 14 12 19 3 b b
2006 1086 Omelette sans sel Tortilla 1000 15 19 44 27 15 19 44 27 18000 33000 4,26 4,52 4,26 49000 17000 4,69 4,23 4,69 5 b
10000 4 1 2 1 4 1 0 1 a a
2006 1087 Omelette bio Tortilla 1000 40 35 43 32 40 28 34 19 33000 26000 4,52 4,41 4,52 30000 49000 4,48 4,69 4,48 5 b
10000 3 2 5 1 3 2 3 1 a a
2006 1088 Œufs brouillés Scrambled eggs 1000 32 23 44 38 19 23 44 38 20000 39000 4,30 4,59 4,30 37000 37000 4,57 4,57 4,57 5 b
10000 1 1 3 1 1 1 2 1 b b
2018 6698 Coule d'œuf liquide Liquid egg product 10 125 125 1200 3,08 3,08 11000 4,04 4,04 5 a
100 9 9
2018 6699 Crème mousseline Cream pastry 10 142 142 1400 3,15 3,15 2300 3,36 3,36 5 c
100 10 10
2018 6700 Eclair à la crème aux fraises
Pastry 100000 32 32 3000000 6,48 6,48 >4900000 >6,69 >6,69 5 c
1000000 1 1
2018 6870 Tortilla Tortilla 10 0 0 <10 <1,00 <1,00 <10 <1,00 <1,00 5 b
100 0 0
2018 6872 Eclair à la crème aux fraises
Pastry 100000 30 30 3300000 6,52 6,52 1400000 6,15 6,15 5 c
1000000 6 6
2018 7082 Mayonnaise fraiche Mayonnaise 10 42 42 410 2,61 2,61 32 1,51 1,51 5 b
100 3 3
Analyses performed according to the COFRAC accreditation
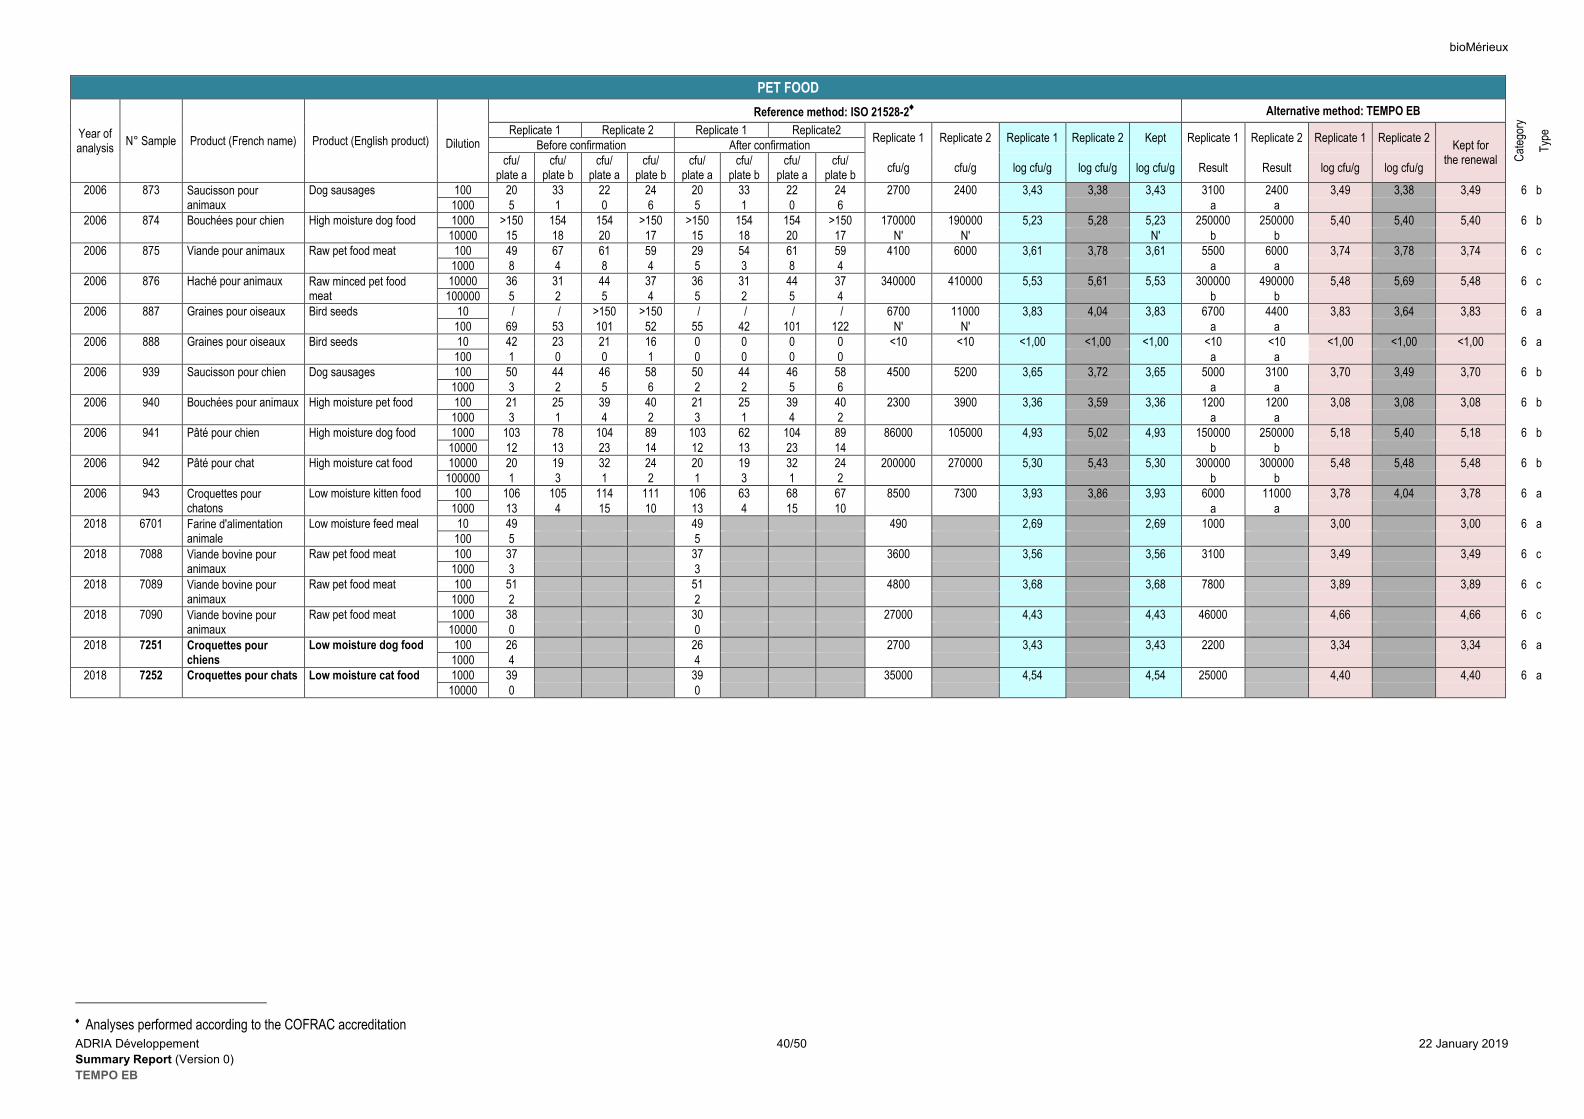
bioMérieux
ADRIA Développement 40/50 22 January 2019
Summary Report (Version 0)
TEMPO EB
PET FOOD
Year of analysis
N° Sample Product (French name) Product (English product) Dilution
Reference method: ISO 21528-2
Alternative method: TEMPO EB
Cat
egor
y
Typ
e Replicate 1 Replicate 2 Replicate 1 Replicate2 Replicate 1 Replicate 2 Replicate 1 Replicate 2 Kept Replicate 1 Replicate 2 Replicate 1 Replicate 2
Kept for the renewal
Before confirmation After confirmation
cfu/ plate a
cfu/ plate b
cfu/ plate a
cfu/ plate b
cfu/ plate a
cfu/ plate b
cfu/ plate a
cfu/ plate b
cfu/g cfu/g log cfu/g log cfu/g log cfu/g Result Result log cfu/g log cfu/g
2006 873 Saucisson pour animaux
Dog sausages 100 20 33 22 24 20 33 22 24 2700 2400 3,43 3,38 3,43 3100 2400 3,49 3,38 3,49 6 b
1000 5 1 0 6 5 1 0 6 a a
2006 874 Bouchées pour chien High moisture dog food 1000 >150 154 154 >150 >150 154 154 >150 170000 190000 5,23 5,28 5,23 250000 250000 5,40 5,40 5,40 6 b
10000 15 18 20 17 15 18 20 17 N' N' N' b b
2006 875 Viande pour animaux Raw pet food meat 100 49 67 61 59 29 54 61 59 4100 6000 3,61 3,78 3,61 5500 6000 3,74 3,78 3,74 6 c
1000 8 4 8 4 5 3 8 4 a a
2006 876 Haché pour animaux Raw minced pet food meat
10000 36 31 44 37 36 31 44 37 340000 410000 5,53 5,61 5,53 300000 490000 5,48 5,69 5,48 6 c
100000 5 2 5 4 5 2 5 4 b b
2006 887 Graines pour oiseaux Bird seeds 10 / / >150 >150 / / / / 6700 11000 3,83 4,04 3,83 6700 4400 3,83 3,64 3,83 6 a
100 69 53 101 52 55 42 101 122 N' N' a a
2006 888 Graines pour oiseaux Bird seeds 10 42 23 21 16 0 0 0 0 <10 <10 <1,00 <1,00 <1,00 <10 <10 <1,00 <1,00 <1,00 6 a
100 1 0 0 1 0 0 0 0 a a
2006 939 Saucisson pour chien Dog sausages 100 50 44 46 58 50 44 46 58 4500 5200 3,65 3,72 3,65 5000 3100 3,70 3,49 3,70 6 b
1000 3 2 5 6 2 2 5 6 a a
2006 940 Bouchées pour animaux High moisture pet food 100 21 25 39 40 21 25 39 40 2300 3900 3,36 3,59 3,36 1200 1200 3,08 3,08 3,08 6 b
1000 3 1 4 2 3 1 4 2 a a
2006 941 Pâté pour chien High moisture dog food 1000 103 78 104 89 103 62 104 89 86000 105000 4,93 5,02 4,93 150000 250000 5,18 5,40 5,18 6 b
10000 12 13 23 14 12 13 23 14 b b
2006 942 Pâté pour chat High moisture cat food 10000 20 19 32 24 20 19 32 24 200000 270000 5,30 5,43 5,30 300000 300000 5,48 5,48 5,48 6 b
100000 1 3 1 2 1 3 1 2 b b
2006 943 Croquettes pour chatons
Low moisture kitten food 100 106 105 114 111 106 63 68 67 8500 7300 3,93 3,86 3,93 6000 11000 3,78 4,04 3,78 6 a
1000 13 4 15 10 13 4 15 10 a a
2018 6701 Farine d'alimentation animale
Low moisture feed meal 10 49 49 490 2,69 2,69 1000 3,00 3,00 6 a
100 5 5
2018 7088 Viande bovine pour animaux
Raw pet food meat 100 37 37 3600 3,56 3,56 3100 3,49 3,49 6 c
1000 3 3
2018 7089 Viande bovine pour animaux
Raw pet food meat 100 51 51 4800 3,68 3,68 7800 3,89 3,89 6 c
1000 2 2
2018 7090 Viande bovine pour animaux
Raw pet food meat 1000 38 30 27000 4,43 4,43 46000 4,66 4,66 6 c
10000 0 0
2018 7251 Croquettes pour chiens
Low moisture dog food 100 26 26 2700 3,43 3,43 2200 3,34 3,34 6 a
1000 4 4
2018 7252 Croquettes pour chats Low moisture cat food 1000 39 39 35000 4,54 4,54 25000 4,40 4,40 6 a
10000 0 0
Analyses performed according to the COFRAC accreditation

bioMérieux
ADRIA Développement 41/50 22 January 2019
Summary Report (Version 0)
TEMPO EB
Appendix 5 - Accuracy profile study: raw data
Matrix Strain Level Sample N° Reference method : ISO 21528-2
Alternative method : TEMPO EB 22h at 35°C
Dilution cfu/plate cfu/g log cfu/g cfu/g log cfu/g
Gro
un
d b
eef-
Bat
ch 1
A
erob
ic m
esoh
ilic
flora
: 8,
7.10
4 C
FU
/g
Ent
erob
acte
r cl
oaca
e 12
8
1
6621 10 38 360 2,56 230 2,36
100 1
6622 10 34 350 2,54 480 2,68
100 4
6623 10 41 380 2,58 300 2,48
100 1
6624 10 30 300 2,48 460 2,66
100 3
6625 10 34 310 2,49 230 2,36
100 0
2
6626 100 52 4800 3,68 5000 3,70
1000 1
6627 100 58 5900 3,77 5300 3,72
1000 7
6628 100 36 3400 3,53 11000 4,04
1000 1
6629 100 53 4800 3,68 4000 3,60
1000 0
6630 100 51 5100 3,71 7800 3,89
1000 5
3
6631 1000 99 100000 5,00 210000 5,32
10000 12
6632 1000 93 90000 4,95 150000 5,18
10000 6
6633 1000 103 100000 5,00 170000 5,23
10000 10
6634 1000 112 110000 5,04 120000 5,08
10000 8
6635 1000 71 75000 4,88 210000 5,32
10000 12
Gro
un
d b
eef-
Bat
ch 2
A
erob
ic m
esoh
ilic
flora
: 1,
6.10
4 C
FU
/g
Ent
erob
acte
r cl
oaca
e 12
8
1
6636 10 28 270 2,43 260 2,41
100 2
6637 10 32 310 2,49 260 2,41
100 2
6638 10 33 300 2,48 280 2,45
100 0
6639 10 42 430 2,63 280 2,45
100 5
6640 10 35 380 2,58 440 2,64
100 7
2
6641 100 41 4400 3,64 3700 3,57
1000 7
6642 100 52 5100 3,71 5500 3,74
1000 4
6643 100 43 4100 3,61 4000 3,60
1000 2
6644 100 36 3700 3,57 5200 3,72
1000 5
6645 100 39 3800 3,58 3400 3,53
1000 3
3
6646 1000 59 57000 4,76 120000 5,08
10000 4
6647 1000 74 73000 4,86 170000 5,23
10000 6
6648 1000 84 87000 4,94 150000 5,18
10000 12
6649 1000 97 95000 4,98 91000 4,96
10000 8
6650 1000 71 75000 4,88 150000 5,18
10000 12
Analyses performed according to the COFRAC accreditation

bioMérieux
ADRIA Développement 42/50 22 January 2019
Summary Report (Version 0)
TEMPO EB
Matrix Strain Level Sample N° Reference method: ISO 21528-2
Alternative method: TEMPO EB 22h at 35°C
Dilution cfu/plate cfu/g log cfu/g cfu/g log cfu/g M
ilk-B
atch
1
Aer
obic
mes
ohili
c flo
ra :
1,2.
103
CF
U/g
Esc
heric
hia
coli
94
1
6997 10 36 370 2,57 360 2,56
100 5
6998 10 40 400 2,60 400 2,60
100 4
6999 10 40 380 2,58 250 2,40
100 2
7000 10 41 390 2,59 460 2,66
100 2
7001 10 51 540 2,73 510 2,71
100 8
2
7002 100 38 3800 3,58 6800 3,83
1000 4
7003 100 51 4800 3,68 9100 3,96
1000 2
7004 100 56 5400 3,73 6800 3,83
1000 3
7005 100 41 3900 3,59 6000 3,78
1000 2
7006 100 53 5600 3,75 6800 3,83
1000 9
3
7007 1000 70 66000 4,82 120000 5,08
10000 3
7008 1000 61 66000 4,82 210000 5,32
10000 12
7009 1000 57 55000 4,74 170000 5,23
10000 4
7010 1000 103 100000 5,00 150000 5,18
10000 10
7011 1000 66 72000 4,86 150000 5,18
10000 13
Milk
-Bat
ch 2
A
erob
ic m
esoh
ilic
flora
: 2,
1.10
3 C
FU
/g
Esc
heric
hia
coli
94
1
7012 10 41 390 2,59 300 2,48
100 2
7013 10 33 340 2,53 440 2,64
100 4
7014 10 43 440 2,64 480 2,68
100 5
7015 10 36 360 2,56 280 2,45
100 3
7016 10 39 360 2,56 280 2,45
100 1
2
7017 100 42 4300 3,63 6000 3,78
1000 5
7018 100 44 4500 3,65 9100 3,96
1000 6
7019 100 46 4600 3,66 6000 3,78
1000 5
7020 100 41 4000 3,60 6800 3,83
1000 3
7021 100 47 4600 3,66 6000 3,78
1000 4
3
7022 1000 67 65000 4,81 250000 5,40
10000 5
7023 1000 81 84000 4,92 250000 5,40
10000 11
7024 1000 64 64000 4,81 250000 5,40
10000 6
7025 1000 73 75000 4,88 150000 5,18
10000 9
7026 1000 76 74000 4,87 150000 5,18
10000 5
Analyses performed according to the COFRAC accreditation

bioMérieux
ADRIA Développement 43/50 22 January 2019
Summary Report (Version 0)
TEMPO EB
Matrix Strain Level Sample N° Reference method:
ISO 21528-2
Alternative method:
TEMPO EB 22h at 35°C Dilution cfu/plate cfu/g log cfu/g cfu/g log cfu/g
Gre
en b
ean
s-B
atch
1
Aer
obic
mes
ohili
c flo
ra :
1,2.
103
CF
U/g
Esc
heric
hia
herm
anni
i Ad4
57
1
7037 10 30 280 2,45 210 2,32
100 1
7038 10 34 330 2,52 220 2,34
100 2
7039 10 21 200 2,30 170 2,23
100 1
7040 10 28 320 2,51 130 2,11
100 7
7041 10 39 360 2,56 190 2,28
100 1
2
7042 100 25 2500 3,40 3700 3,57
1000 2
7043 100 34 3500 3,54 5600 3,75
1000 5
7044 100 42 4100 3,61 2200 3,34
1000 3
7045 100 37 3600 3,56 4000 3,60
1000 3
7046 100 41 4000 3,60 1900 3,28
1000 3
3
7047 1000 45 44000 4,64 210000 5,32
10000 3
7048 1000 64 69000 4,84 170000 5,23
10000 12
7049 1000 53 52000 4,72 120000 5,08
10000 4
7050 1000 74 75000 4,88 250000 5,40
10000 9
7051 1000 70 72000 4,86 120000 5,08
10000 9
Gre
en b
ean
s-B
atch
2
Aer
obic
mes
ohili
c flo
ra :
2,9.
102
CF
U/g
Esc
heric
hia
herm
anni
i Ad4
57
1
7052 10 33 340 2,53 230 2,36
100 4
7053 10 37 350 2,54 210 2,32
100 1
7054 10 30 300 2,48 120 2,08
100 3
7055 10 20 210 2,32 120 2,08
100 3
7056 10 31 310 2,49 190 2,28
100 3
2
7057 100 35 3400 3,53 1400 3,15
1000 2
7058 100 35 3500 3,54 2300 3,36
1000 3
7059 100 37 3600 3,56 3900 3,59
1000 3
7060 100 31 3100 3,49 1600 3,20
1000 3
7061 100 33 3600 3,56 2400 3,38
1000 7
3
7062 1000 55 56000 4,75 120000 5,08
10000 7
7063 1000 57 58000 4,76 150000 5,18
10000 7
7064 1000 59 57000 4,76 68000 4,83
10000 4
7065 1000 49 51000 4,71 91000 4,96
10000 7
7066 1000 42 42000 4,62 120000 5,08
10000 4
Analyses performed according to the COFRAC accreditation

bioMérieux
ADRIA Développement 44/50 22 January 2019
Summary Report (Version 0)
TEMPO EB
Matrix Strain Level Sample N° Reference method:
ISO 21528-2 Alternative method:
TEMPO EB 22h at 35°C Dilution cfu/plate cfu/g log cfu/g cfu/g log cfu/g
Fis
h t
erri
ne-
Bat
ch 1
A
erob
ic m
esoh
ilic
flora
: 20
CF
U/g
Citr
obac
ter
freu
ndii
24
1
6812 10 32 310 2,49 140 2,15
100 2
6813 10 26 250 2,40 170 2,23
100 1
6814 10 32 310 2,49 280 2,45
100 2
6815 10 33 310 2,49 330 2,52
100 1
6816 10 32 310 2,49 200 2,30
100 2
2
6817 100 33 3400 3,53 3700 3,57
1000 4
6818 100 43 4100 3,61 6700 3,83
1000 2
6819 100 51 5400 3,73 4400 3,64
1000 8
6820 100 44 4200 3,62 4100 3,61
1000 2
6821 100 51 5000 3,70 4000 3,60
1000 4
3
6822 1000 96 94000 4,97 150000 5,18
10000 7
6823 1000 68 69000 4,84 150000 5,18
10000 8
6824 1000 75 74000 4,87 170000 5,23
10000 6
6825 1000 73 72000 4,86 110000 5,04
10000 6
6826 1000 56 59000 4,77 300000 5,48
10000 9
Fis
h t
erri
ne-
Bat
ch 2
A
erob
ic m
esoh
ilic
flora
: 20
CF
U/g
Citr
obac
ter
freu
ndii
24
1
6827 10 32 290 2,46 170 2,23
100 0
6828 10 41 420 2,62 280 2,45
100 5
6829 10 19 220 2,34 300 2,48
100 5
6830 10 33 320 2,51 390 2,59
100 2
6831 10 31 280 2,45 230 2,36
100 0
2
6832 100 42 4200 3,62 6800 3,83
1000 4
6833 100 34 3600 3,56 3400 3,53
1000 6
6834 100 36 3500 3,54 4500 3,65
1000 3
6835 100 46 4800 3,68 4000 3,60
1000 7
6836 100 51 4900 3,69 3700 3,57
1000 3
3
6837 1000 74 75000 4,88 91000 4,96
10000 8
6838 1000 62 61000 4,79 170000 5,23
10000 5
6839 1000 67 70000 4,85 150000 5,18
10000 10
6840 1000 80 80000 4,90 170000 5,23
10000 8
6841 1000 84 81000 4,91 210000 5,32
10000 5
Analyses performed according to the COFRAC accreditation

bioMérieux
ADRIA Développement 45/50 22 January 2019
Summary Report (Version 0)
TEMPO EB
Matrix Strain Level Sample N° Reference method:
ISO 21528-2 Alternative method:
TEMPO EB 22h at 35°C Dilution cfu/plate cfu/g log cfu/g cfu/g log cfu/g
Liq
uid
eg
g-B
atch
1
Aer
obic
mes
ohili
c flo
ra :
30 C
FU
/g
Kle
bsie
lla p
neum
onia
e 92
1
6772 10 25 270 2,43 200 2,30
100 5
6773 10 18 190 2,28 160 2,20
100 3
6774 10 16 160 2,20 200 2,30
100 1
6775 10 26 250 2,40 230 2,36
100 1
6776 10 25 250 2,40 220 2,34
100 2
2
6777 100 28 2600 3,41 3400 3,53
1000 1
6778 100 35 3600 3,56 2400 3,38
1000 5
6779 100 25 2500 3,40 2900 3,46
1000 2
6780 100 31 3300 3,52 4400 3,64
1000 5
6781 100 28 2500 3,40 4100 3,61
1000 0
3
6782 1000 51 51000 4,71 53000 4,72
10000 5
6783 1000 51 54000 4,73 150000 5,18
10000 8
6784 1000 48 49000 4,69 150000 5,18
10000 6
6785 1000 53 54000 4,73 120000 5,08
10000 6
6786 1000 47 46000 4,66 91000 4,96
10000 4
Liq
uid
eg
g-B
atch
2
Aer
obic
mes
ohili
c flo
ra :
200
CF
U/g
Kle
bsie
lla p
neum
onia
e 92
1
6787 10 15 170 2,23 280 2,45
100 4
6788 10 26 270 2,43 160 2,20
100 4
6789 10 23 240 2,38 190 2,28
100 3
6790 10 22 200 2,30 390 2,59
100 0
6791 10 26 260 2,41 210 2,32
100 3
2
6792 100 21 2400 3,38 4500 3,65
1000 5
6793 100 33 3400 3,53 5000 3,70
1000 4
6794 100 40 4300 3,63 3700 3,57
1000 7
6795 100 35 3500 3,54 2500 3,40
1000 3
6796 100 32 3200 3,51 7800 3,89
1000 3
3
6797 1000 58 57000 4,76 120000 5,08
10000 5
6798 1000 57 58000 4,76 120000 5,08
10000 7
6799 1000 53 58000 4,76 150000 5,18
10000 11
6800 1000 53 54000 4,73 55000 4,74
10000 6
6801 1000 51 50000 4,70 120000 5,08
10000 4
Analyses performed according to the COFRAC accreditation

bioMérieux
ADRIA Développement 46/50 22 January 2019
Summary Report (Version 0)
TEMPO EB
Matrix Strain Level Sample N° Reference method:
ISO 21528-2
Alternative method:
TEMPO EB 22h at 35°C Dilution cfu/plate cfu/g log cfu/g cfu/g log cfu/g
Do
g p
âté-
Bat
ch 1
A
erob
ic m
esoh
ilic
flora
: <
10 C
FU
/g
Haf
nia
alve
i 124
1
7184 10 48 460 2,66 360 2,56
100 2
7185 10 53 520 2,72 730 2,86
100 4
7186 10 41 430 2,63 560 2,75
100 6
7187 10 43 460 2,66 310 2,49
100 8
7188 10 46 460 2,66 440 2,64
100 5
2
7189 100 45 4700 3,67 12000 4,08
1000 7
7190 100 47 4800 3,68 15000 4,18
1000 6
7191 100 50 5500 3,74 6800 3,83
1000 10
7192 100 67 6400 3,81 7800 3,89
1000 3
7193 100 80 8200 3,91 12000 4,08
1000 10
3
7194 1000 102 100000 5,00 370000 5,57
10000 10
7195 1000 109 100000 5,00 170000 5,23
10000 5
7196 1000 105 100000 5,00 300000 5,48
10000 10
7197 1000 90 88000 4,94 190000 5,28
10000 7
7198 1000 112 110000 5,04 250000 5,40
10000 13
Do
g p
âté-
Bat
ch 2
A
erob
ic m
esoh
ilic
flora
: <
10 C
FU
/g
Haf
nia
alve
i 124
1
7199 10 56 580 2,76 440 2,64
100 8
7200 10 52 510 2,71 310 2,49
100 4
7201 10 41 420 2,62 360 2,56
100 5
7202 10 49 580 2,76 390 2,59
100 15
7203 10 54 530 2,72 220 2,34
100 4
2
7204 100 75 8000 3,90 9100 3,96
1000 13
7205 100 54 5300 3,72 9100 3,96
1000 4
7206 100 55 5600 3,75 9100 3,96
1000 7
7207 100 55 5200 3,72 7400 3,87
1000 2
7208 100 42 4200 3,62 5500 3,74
1000 4
3
7209 1000 85 88000 4,94 370000 5,57
10000 12
7210 1000 90 93000 4,97 210000 5,32
10000 12
7211 1000 93 93000 4,97 210000 5,32
10000 9
7212 1000 80 85000 4,93 210000 5,32
10000 13
7213 1000 71 69000 4,84 250000 5,40
10000 5
Analyses performed according to the COFRAC accreditation

bioMérieux
ADRIA Développement 47/50 22 January 2019
Summary Report (Version 0)
TEMPO EB
Appendix 6 – Quantification limits (LOQ): raw data
Sample N° Matrix Alternative method: TEMPO EB
Observed value Value for calculation Yi �� So LOQ 6651
Gro
und
beef
<10 10 1
1,08 0 0
6652 10 10 1 6653 <10 10 1 6654 <10 10 1 6655 33 33 1,52 6656 10 10 1 6657 <10 10 1 6658 10 10 1 6659 10 10 1 6660 21 21 1,32 7027
Milk
<10 10 1
1 0 0
7028 <10 10 1 7029 <10 10 1 7030 <10 10 1 7031 <10 10 1 7032 <10 10 1 7033 <10 10 1 7034 <10 10 1 7035 <10 10 1 7036 <10 10 1 7067
Gre
en b
eans
<10 10 1
1 0 0
7068 <10 10 1 7069 <10 10 1 7070 <10 10 1 7071 <10 10 1 7072 <10 10 1 7073 <10 10 1 7074 <10 10 1 7075 <10 10 1 7076 <10 10 1 6842
Fis
h te
rrin
e
<10 10 1
1 0 0
6843 <10 10 1 6844 <10 10 1 6845 <10 10 1 6846 <10 10 1 6847 <10 10 1 6848 <10 10 1 6849 <10 10 1 6850 <10 10 1 6851 <10 10 1 6802
Liqu
id e
gg
<10 10 1
1 0 0
6803 <10 10 1 6804 <10 10 1 6805 <10 10 1 6806 <10 10 1 6807 <10 10 1 6808 <10 10 1 6809 <10 10 1 6810 <10 10 1 6811 <10 10 1 7214
Dog
pât
é
<10 10 1
1 0 0
7215 <10 10 1 7216 <10 10 1 7217 <10 10 1 7218 <10 10 1 7219 <10 10 1 7220 <10 10 1 7221 <10 10 1 7222 <10 10 1 7223 <10 10 1

bioMérieux
ADRIA Développement 48/50 22 January 2019
Summary Report (Version 0)
TEMPO EB
Appendix 7 – Inclusivity / Exclusivity: raw data
INCLUSIVITY
Date of analysis
Strain Origin Dilution PCA VRBG
TEMPO EB CFU/plate CFU/plate
2006 1 Buttiaux agrestis 115 Turnip -6 19/22 -7 17/31 2/1
2006 2 Cirobacter diversus 38 -6 60/37 -7 50/60 6/13
2006 3 Citrobacter freundii 53 Bean -6 21/12 -7 10/11 8/8
2006 4 Citrobacter freundii CIP 5732 -6 41/37 -7 40/34 12/5
2006 5 Edwarsiella tarda CIP 7861 -6 21/34 -7 25/20 15/19
2006 6 Enterobacter agglomerans 11 Cheese -6 24/16 -7 23/16 13/8
2006 7 Enterobacter amnigenus 52 Bean -6 2/3 -7 8/4 4/4
2006 8 Enterobacter cloacae Adria 10 Raw milk -6 17/14 -7 6/4 13/10
2006 9 Enterobacter sakazakii D7 Poultry -6 91/110 -7 64/43 58/46
2006 10 Escherichia coli CIP54117 -6 12/37 -7 77/98 9/8
2006 11 Escherichia hermanii 395 Raw material meat product
-6 6/9 -7 >300/>300 24/22
2006 12 Escherichia vulneris 127 Raw milk -6 37/31 -7 >300/>300 14/10
2006 13 Ewingella americana 71 Frozen vegetable -6 47/37 -7 107/137 7/3
2006 14 Hafnia alvei Adria 168 Mechanically deboned meat
-6 16/19 -7 70/72 11/14
2006 15 Klebsiella oxytoca CIP 7932 - -6 18/16 -7 83/88 14/14
2006 16 Klebsiella pneumoniae CIP 8291
- -6 20/14 -7 100/90 6/6
2006 17 Kluyvera ascorbota CIP 8295 - -6 34/15 -7 >300/>300 36/45
2006 18 Morganella morganii CIP A236 - -6 78/41 -7 124/120 40/35
2006 19 Proteus mirabilis Adria 54 Mechanically deboned meat
-6 53/34 -7 92/88 9/6
2006 20 Proteus vulgaris Adria 43 Pork -6 11/8 -7 83/56 6/6
2006 21 Providencia rettgeri Adria 112 Egg white -6 39/41 -7 98/81 36/31
2006 22 Providencia stuartii 46 Poult leg -6 34/53 -7 92/75 15/37
2006 23 Rhanella aquatilis 69 Shell
-6 <1/<1
-7 3/3
23 µcol<0,5mm/
18 µcol<0,5mm
2006 24 Salmonella enteritidis CIP 8297
- -6 78/120 -7 >300/>300 65/105
2006 25 Salmonella typhimurium CIP 5858
- -6 60/91 -7 103/103 57/26

bioMérieux
ADRIA Développement 49/50 22 January 2019
Summary Report (Version 0)
TEMPO EB
INCLUSIVITY Date of
analysis Strain Origin Dilution
PCA VRBG TEMPO EB
CFU/plate CFU/plate
2006 26 Serratia liquefaciens Adria 5 Egg products -6 210/150 -7 >300/>300 86/86
2006 27 Shigella flexneri CIP 8248 - -6 47/40 -7 140/138 31/28
2006 28 Shigella sonnei CIP 8249 - -6 120/40 -7 100/123 32/27
2006 29 Yersinia enterocolitica CIP 8027
- -6 55/110 -7 111/113 6/8
2006 30 Pectobacterium(Erwinia) carotovora CIP 8283
Vegetables -6 10/30 -7 40/30 20/10
2006 31 Citrobacter diversus CIP 8294 - -6 16/6 -7 15/24 <1/<1
2018 32 Citrobacter braakii Ad833 Beef trim -6 >300 >150 370 -7 53 32 31
2018 33 Citrobacter youngae Ad1372 Water -6 >300 >150 1100 -7 58 57 57
2018 34 Cronobacter sakazakii Ad2412 Milk powder -6 >300 >150 600 -7 57 54 56
2018 35 Cronobacter malonaticus DSM18702
Milk powder -6 163 61 22 -7 18 4 2,1
2018 36 Enterobacter aerogenes Ad2569
Cheese -6 183 >150 190 -7 22 18 7,3
2018 37 Enterobacter hormaechei Ad990
Butter -6 >300 >150 440 -7 71 44 57
2018 38 Escherichia coli Ad1915 Poultry meat -6 >300 >150 780 -7 75 87 64
2018 39 Escherichia fergusonii Ad1381 Tap water -6 >300 >150 310 -7 55 27 57
2018 40 Escherichia vulneris 134 Pork liver -6 51 27 7,1 -7 8 0 <1,0
2018 41 Hafnia alvei Adria 130 Cheese -6 >300 >150 53 -7 54 52 2,1
2018 42 Kluyvera intermedia 60 Vegetables -6 71 69 3,2 -7 10 8 <1,0
2018 43 Lelliottia amnigena 126 Ground beef -6 >300 >150 780 -7 66 60 73
2018 44 Pantoea agglomerans A00L065
Cheese -6 >300 >150 500 -7 41 38 50
2018 45 Proteus vulgaris Adria 56 Food product -6 160 >150 310 -7 11 15 24
2018 46 Providencia stuartii Ad1575 River water -6 >300 >150 680 -7 53 48 57
2018 47 Salmonella Anatum Ad2727 Seafood -6 >300 >150 600 -7 73 59 71
2018 48 Serratia fonticola Ad1696 Salmon
-4 64 >150 220 -5 6 39 16 -6 1 2 1 -7 0 0 <1,0
2018 49 Serratia liquefaciens Adria 26 Egg product -6 151 36 21 -7 13 4 1
2018 50 Yersinia enterocolitica Ad1028 Speck -6 241 >150 90 -7 34 38 8,6

bioMérieux
ADRIA Développement 50/50 22 January 2019
Summary Report (Version 0)
TEMPO EB
EXCLUSIVITY Date of analysis
Strain Origin Dilu- tion
PCA Dilut- ion
VRBG Dilu- tion
TEMPO EB CFU/plate CFU/plate
2006 1 Acinetobacter spp Adria 46-2 Chicken -7 5/11 -7 <1/<1 -6 <1/<1 2006 2 Aerococcus vividens Ad 184 Liquid egg -7 5/1 -7 <1/<1 -6 <1/<1
2006 3 Aeromonas hydrophila CIP 5750
/ -7 16/28 -7 <1/<1 -6 <1/<1
2006 4 Aeromonas sobria CIP 7433 / -5 3/2 -4 <1/<1 -3 <1/<1 2006 5 Bacillus circulans ATCC 4513 / -5 >300/>300 -4 <1/<1 -3 <1/<1
2006 6 Enterococcus durans Ad 181 Pasteurized liquid egg
-7 28/29 -7 <1/<1 -6 <1/<1
2006 7 Enterococcus faecalis ATCC 29212
/ -7 46/33 -7 <1/<1 -6 <1/<1
2006 8 Flavobacterium indologenes 26
Liquid egg -7 16/15 -7 <1/<1 -6 <1/<1
2006 9 Josenia denitrificans 55134 Beef blood -7 1/1 -7 <1/<1 -6 <1/<1 2006 10 Kurthia zopfii 7621 / -7 32/18 -7 <1/<1 -6 <1/<1
2006 11 Lactobacillus lactis ATCC 11454
/ -7 4/2 -7 <1/<1 -6 <1/<1
2006 12 Lactobacillus plantarum CIP A159
/ -7 1/2 -7 <1/<1 -6 <1/<1
2006 13 Moraxella 51 Poultry -5 >300/>300 -4 <1/<1 -3 <1/<1
2006 14 Photobacterium phosphoreum
Cod -7 57/44 -7 <1/<1 -6 <1/<1
2006 15 Pseudomonas aeruginosa CIP A22
/ -5 >300/>300 -4 <1/<1 -3 <1/<1
2006 16 Pseudomonas fluorescens CIP 5690
/ -7 6/2 -7 <1/<1 -6 <1/<1
2006 17 Pseudomonas putida Adria 8 Liquid egg -5 25/27 -4 <1/<1 -3 <1/<1
2006 18 Staphylococcus aureus CIP 658
/ -7 28/30 -7 <1/<1 -6 <1/<1
2006 19 Staphylococcus epidermidis Ad150
Ground beef -7 9/5 -7 <1/<1 -6 <1/<1
2006 20 Stenotrophomonas maltophilia CIP 6077
/ -7 37/50 -7 7/20 -6 34/24
2006 21 Stenotrophomonasmaltophilia 112
Vegetables -7 30/42 -7 18/17 -6 45/34
2018 22 Acinetobacter baumanii Ad1090
Feeding stuff -6 154 -3 NC(19) -6 <1 -7 15 -4 NC(6) -4 <1
2018 23 Carnobacterium viridans ATCCBAA36
/ -6 35 -3 0 -3 <1 -7 5 -4 0 -4 <1
2018 24 Agrobacterium tumefasciens Ad1550
Water -6 44 -3 0 -3 <1 -7 1 -4 0 -4 <1
2018 25 Arcobacter butzleri Ad1881 Poultry environment
-6 284 -3 0 -3 <1 -7 25 -4 0 -4 <1
2018 26 Gluconobacter oxydans Ad997
Sweetened drink
-6 152 -3 0 -3 <1 -7 23 -4 0 -4 <1
2018 27 Plesiomonas shigelloïdes Ad673
Fish -6 40 -4 >150 -3 3000 -7 3 -5 >150 -4 910
2018 28 Pandoraea sp. Ad1882 Slaughterhouse -6 <300 -3 NC(30) -3 <1 -7 34 -4 NC(4) -4 <1
2018 29 Flavobacterium hydratis Ad1323
Whole egg -6 165 -3 0 -3 <1 -7 14 -4 0 -4 <1
2018 30 Burkholderia sp. Ad2003 Slaughterhouse -6 42 -1 0 -1 <1
-7 4 -2 0 -2 <1
NC: non characteristic colony