Embed Size (px)
Citation preview
Improving modelling of complex geometries in novel materials using 3D imaging
Llion Evans1,2, Lee Margetts2, Peter D Lee3, Celia Butler4, Elizabeth Surrey1 1Culham Centre for Fusion Energy, Culham Science Centre, Abingdon, Oxon, OX14 3DB, UK
2School of Mechanical, Aerospace and Civil Engineering, University of Manchester, Manchester, M13 9PL, UK
3School of Materials, University of Manchester, Oxford Road, Manchester, M13 9PL, UK 4Synopsys, Bradninch Hall, Castle Street, Exeter, EX4 3PL, UK
Abstract
Finite element methods’ (FEM) modelling of materials with complex microstructures is typically achieved by homogenisation and applying effective material properties. This work investigated the use of a technique whereby 3D X-ray tomography images of such materials are converted directly into image-based FEM (IBFEM) models. In this instance IBFEM was used to model graphite foam on the micro-scale. The application was as a functional layer within a heat exchange component for a fusion energy device. IBFEM accounts for anisotropy in performance by considering the geometry and the properties of the parent material, i.e. carbon, rather than those of the bulk material. Results from the IBFEM model were compared with a standard homogenised model and showed a strong level of agreement, thus validating the technique’s implementation. The added benefits of the IBFEM model are; improved accuracy due to modelling on the micro-scale; ability to interrogate results to an increased spatial resolution; no requirement to experimentally measure bulk material properties of novel anisotropic materials.

Introduction
Components designed to be used within the nuclear sector (both fission and fusion) are required to withstand challenging environments. Depending on the component’s function they may be exposed to a number of demands such as high levels of radiation, temperature, pressure etc. [1]. Future generation nuclear power plants aim to increase output and efficiency over their predecessors, a by-product of which is even more extreme physical operating conditions [2]. In addition to improving engineering concepts; a number of novel materials are proposed which have properties tailored for the specific requirements, these fall into structural [1] and functional [3] categories. In order to achieve their functional specification these materials are often highly anisotropic and have complex geometries. Such materials include; foams [4], high entropy alloys [5], MAX phase-materials [6], composites [7], functionally graded materials [8] and nano-grained materials [9].
When including complex materials in computer aided design (CAD) based finite element method (FEM) models, the usual procedure is to use global average material properties [10]. In reality, macroscopic performance can be dominated by micro-features not included in CAD based models [11] leading to uncertainty in estimating performance. In many applications, this means large safety margins are imposed before new design concepts can be accepted. Improved accuracy in predicting outcomes will reduce this requirement, and thus yield improved confidence in designs for greater reliability and efficiency [12].
Figure 1: (a) Schematic of a fusion device [13], (b) the divertor region [14], (c) photograph of divertor monoblock (tungsten armour around CuCrZr cooling pipe)
which is subject to high heat flux and particle erosion.
In the most common fusion power device, the tokamak, helium, the waste product of the fusion reaction is removed at the divertor by directing plasma along magnetic field lines to strike the divertor target plates. In normal operation this region will experience thermal loads of around 10 MW•m-2, as the plasma particle kinetic energy is deposited over the target region [15]. To absorb this energy whilst remaining within operational temperature limits, the divertor often includes active cooling through pipes (built of CuCrZr) protected by tungsten (W) armour monoblocks [16]. Figure 1 shows the location of the divertor region within a tokamak and an example monoblock [13], [14]. The armour is bonded to the pipe to maintain thermal conduction, but a large thermal expansion
16.4 m
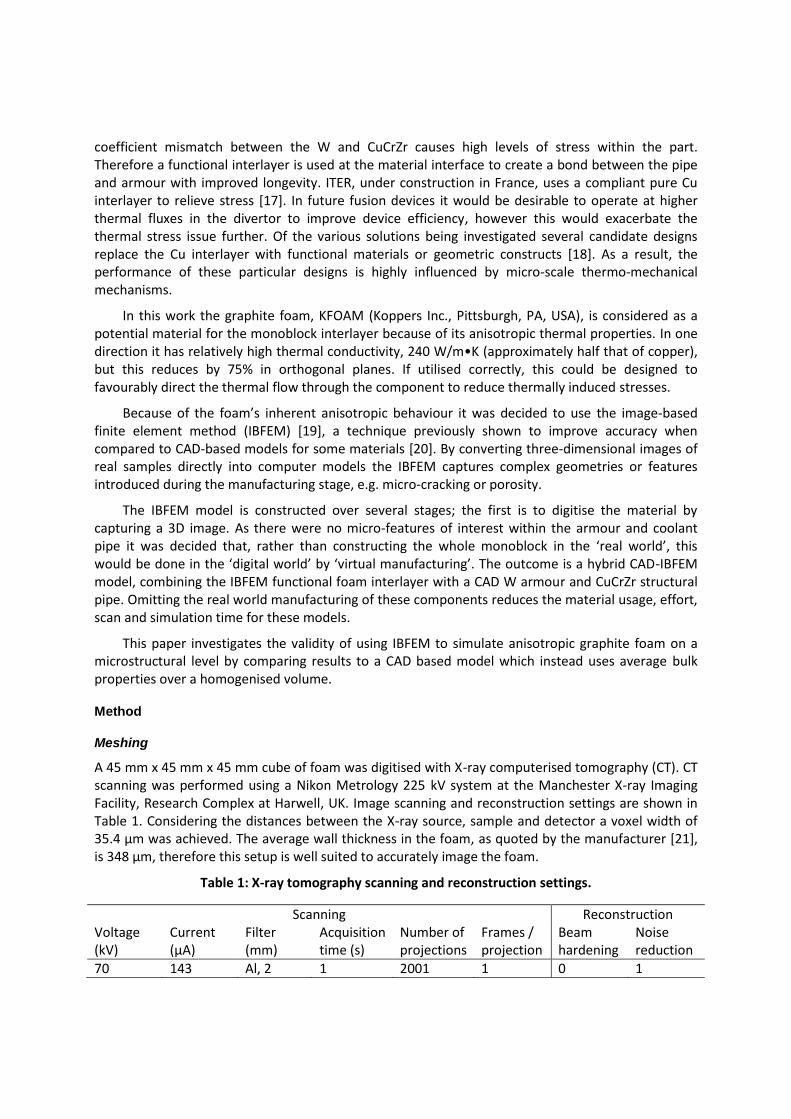
coefficient mismatch between the W and CuCrZr causes high levels of stress within the part. Therefore a functional interlayer is used at the material interface to create a bond between the pipe and armour with improved longevity. ITER, under construction in France, uses a compliant pure Cu interlayer to relieve stress [17]. In future fusion devices it would be desirable to operate at higher thermal fluxes in the divertor to improve device efficiency, however this would exacerbate the thermal stress issue further. Of the various solutions being investigated several candidate designs replace the Cu interlayer with functional materials or geometric constructs [18]. As a result, the performance of these particular designs is highly influenced by micro-scale thermo-mechanical mechanisms.
In this work the graphite foam, KFOAM (Koppers Inc., Pittsburgh, PA, USA), is considered as a potential material for the monoblock interlayer because of its anisotropic thermal properties. In one direction it has relatively high thermal conductivity, 240 W/m•K (approximately half that of copper), but this reduces by 75% in orthogonal planes. If utilised correctly, this could be designed to favourably direct the thermal flow through the component to reduce thermally induced stresses.
Because of the foam’s inherent anisotropic behaviour it was decided to use the image-based finite element method (IBFEM) [19], a technique previously shown to improve accuracy when compared to CAD-based models for some materials [20]. By converting three-dimensional images of real samples directly into computer models the IBFEM captures complex geometries or features introduced during the manufacturing stage, e.g. micro-cracking or porosity.
The IBFEM model is constructed over several stages; the first is to digitise the material by capturing a 3D image. As there were no micro-features of interest within the armour and coolant pipe it was decided that, rather than constructing the whole monoblock in the ‘real world’, this would be done in the ‘digital world’ by ‘virtual manufacturing’. The outcome is a hybrid CAD-IBFEM model, combining the IBFEM functional foam interlayer with a CAD W armour and CuCrZr structural pipe. Omitting the real world manufacturing of these components reduces the material usage, effort, scan and simulation time for these models.
This paper investigates the validity of using IBFEM to simulate anisotropic graphite foam on a microstructural level by comparing results to a CAD based model which instead uses average bulk properties over a homogenised volume.
Method
Meshing
A 45 mm x 45 mm x 45 mm cube of foam was digitised with X-ray computerised tomography (CT). CT scanning was performed using a Nikon Metrology 225 kV system at the Manchester X-ray Imaging Facility, Research Complex at Harwell, UK. Image scanning and reconstruction settings are shown in Table 1. Considering the distances between the X-ray source, sample and detector a voxel width of 35.4 μm was achieved. The average wall thickness in the foam, as quoted by the manufacturer [21], is 348 μm, therefore this setup is well suited to accurately image the foam.
Table 1: X-ray tomography scanning and reconstruction settings.
Scanning Reconstruction Voltage (kV)
Current (µA)
Filter (mm)
Acquisition time (s)
Number of projections
Frames / projection
Beam hardening
Noise reduction
70 143 Al, 2 1 2001 1 0 1

CT data output essentially consists of a series of 2D slices consisting of greyscale pixels, e.g. Figure 2. Each slice has a thickness attributed to it; often the thickness is equal to the width and height of the 2D pixel, thus a 3D pixel (voxel) is formed. When the slices are stacked together these represent a 3D volume. Before being able to create an FE mesh the data must go through a ‘segmentation’ process to define which regions or ranges of greyscale values belong to the various materials. The Simpleware suite of programmes, version 7 (Simpleware Ltd., Exeter, Devon, UK) was used for this purpose to define both foam and porous phases. After segmentation, a ring shaped interlayer section (inner diameter = 12 mm, thickness = 1 mm) was virtually cut out of the digital foam cube and joined to CAD versions of the outer armour (22 mm x 22 mm x 4 mm, central bore with 14 mm diameter bore) and coolant pipe (inner diameter = 10 mm, thickness = 1 mm) to produce a micro-scale accurate virtual monoblock, as shown in Figure 3.
Figure 2: X-ray tomography slice of graphite foam.
Figure 3: Virtual manufacturing workflow (L) graphite foam interlayer digitally cut from cube, (C) & (R) CAD pipe and armour added, respectively.
45 mm
Graphite foam
Pores
Sample bag
Sample holder
- W - C - CuCrZr
Using Simpleware, the virtual monoblock was converted into a tetrahedral element FEM mesh with sufficiently fine resolution in order to retain the microstructural detail, as shown in Figure 4. Within the Simpleware software the smart mesh refinement algorithm ‘+FE Free’ was used. Whilst discretising the surfaces and volumes, this algorithm will use larger elements where possible whilst retaining geometric detail within set error limits. Reducing the total number of elements decreases the computational expense. Through trial and error, a coarseness setting level of -25 was found to produce a desirable balance between mesh ‘quality’ and number of elements. Details on the resulting mesh quality can be found in the following results section.
Three variants of the model were constructed to compare the CAD and IBFEM interlayers:
- CADanisotropic: manufacturer’s anisotropic material properties [21].
- CADisotropic: isotropic material properties (average of graphite orientations [22])
- IBFEM: isotropic material properties (average of graphite orientations [22])
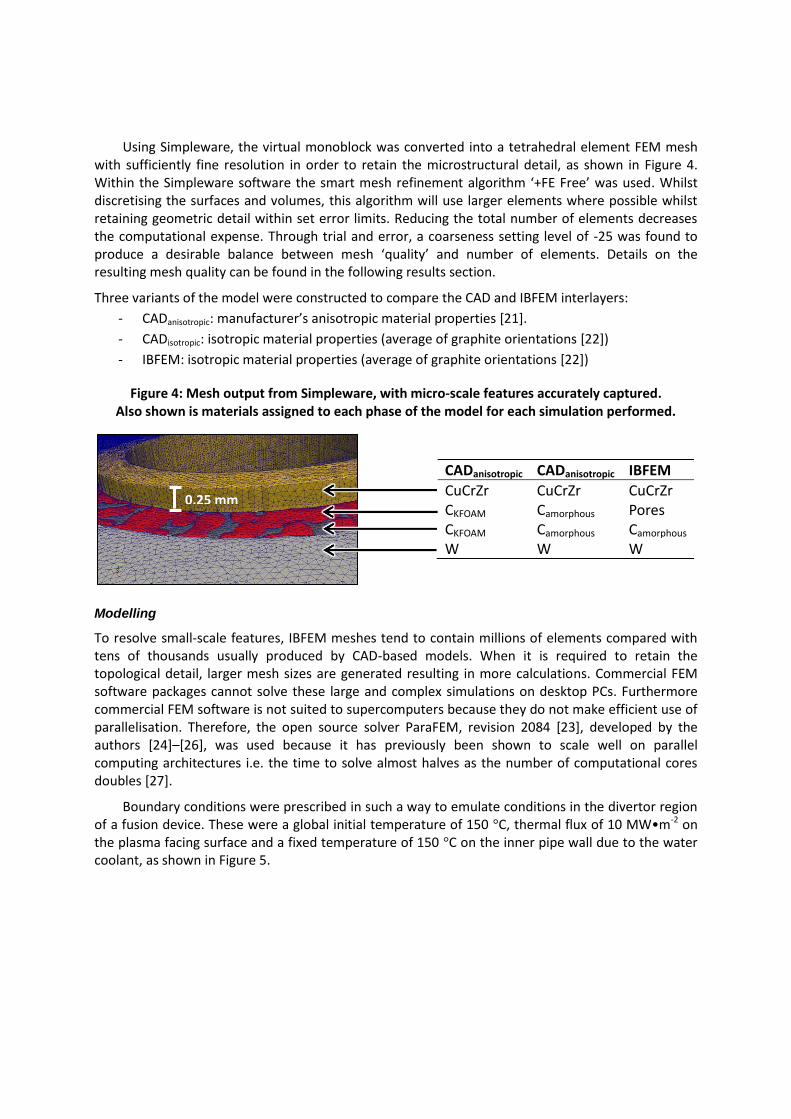
Figure 4: Mesh output from Simpleware, with micro-scale features accurately captured. Also shown is materials assigned to each phase of the model for each simulation performed.
Modelling
To resolve small-scale features, IBFEM meshes tend to contain millions of elements compared with tens of thousands usually produced by CAD-based models. When it is required to retain the topological detail, larger mesh sizes are generated resulting in more calculations. Commercial FEM software packages cannot solve these large and complex simulations on desktop PCs. Furthermore commercial FEM software is not suited to supercomputers because they do not make efficient use of parallelisation. Therefore, the open source solver ParaFEM, revision 2084 [23], developed by the authors [24]–[26], was used because it has previously been shown to scale well on parallel computing architectures i.e. the time to solve almost halves as the number of computational cores doubles [27].
Boundary conditions were prescribed in such a way to emulate conditions in the divertor region of a fusion device. These were a global initial temperature of 150 °C, thermal flux of 10 MW•m-2 on the plasma facing surface and a fixed temperature of 150 °C on the inner pipe wall due to the water coolant, as shown in Figure 5.
CADanisotropic CADanisotropic IBFEM
CuCrZr CuCrZr CuCrZr CKFOAM Camorphous Pores CKFOAM Camorphous Camorphous W W W
0.25 mm

Figure 5: Boundary conditions used to simulate conditions in the divertor region of a fusion device.
Heat flow through the model was solved transiently to investigate the time required to achieve a steady state temperature. The Crank-Nicolson time-stepping method was used (i.e. using an equal combination of the forward and backward Euler methods) with an iterative solver tolerance of 1.0 x 10⁻⁶. For increased temporal resolution during periods of high gradients (i.e. near the start of the simulation) a variable time step size was used. Details of how the time step size was varied can be found in Table 2.
Table 2: Time stepping scheme for the simulation.
Solution step Time step interval (s) Number of steps
1 0.000001 100 2 0.00001 190 3 0.0001 180 4 0.001 180 5 0.01 180 6 0.1 30 7 0.5 10
The FEM for the CADanisotropic model was carried out according to standard FEM practice, i.e. the foam layer is homogenised to a solid volume with average material properties applied. The material properties used were those measured experimentally by the material manufacturer, see Table 3.
Rather than homogenising, IBFEM modelling represents each distinct phase separately. For the foam this comprises graphite and porous regions. For these materials it was decided to obtain their material properties from literature values [22], representing the pores as air. In addition to the anisotropy of the foam microstructure, graphite is a highly anisotropic material by nature. Its thermal conductivities are 1950 W/m•K and 5.7 W/m•K parallel (∥) and perpendicular (⊥) to the layer planes, respectively. Because of the foam’s complex geometry, an assumption was made that the thermal path from thermal source to sink would, on average, pass equally through the different orientations of graphite. Therefore, it was decided to apply a thermal conductivity averaged from the orientations
T = 150 °C
T0 = 150 °C
- Armour
- Interlayer
- Coolant pipe
4 mm
(i.e. 977.85 W/m•K). This would ensure that influence on the IBFEM model results would be purely from the foam microstructures and not anisotropic properties.
In addition to these, a third simulation, CADisotropic, was performed using the same material properties for graphite from the IBFEM model but applied to the homogenised CAD interlayer. This was to create a comparative isotropic baseline to test the sensitivity of the model to changes in thermal conductivity of the interlayer. The values for all the material properties used are shown in Table 3.
For consistency and to remove any potential influence of mesh dependency all models used the same mesh geometry i.e. nodal coordinates and element structure. To homogenise the interlayer, the CAD models applied the same material properties to both foam and porous phases. The three variations in assignment of materials to model phases are as labelled in Figure 4.
Table 3: Material properties used for modelling.
Thermal conductivity Density Specific heat
Kx
(W/m•K)
Ky
(W/m•K)
Kz
(W/m•K)
ρ
(kg/m3)
cp
(J/kg•K)
W 159.70 159.70 159.70 19279 134
CuCrZr 339.00 339.00 339.00 8840 386
Pores* 0.02638 0.02638 0.02638 1.1610 1007
C: CADanisotropic 240.00 240.00 64.000 675 964
C: CADisotropic+ 977.85 977.85 977.85 2200 709
C: IBFEM+ 977.85 977.85 977.85 2200 709
*IBFEM model only. +Thermal conductivity calculated as average from different orientations of graphite as found in
literature [22].
Results
Meshing
Table 4 gives the dimensions of each part of the monoblock and the calculated volume from these dimensions. Also included is a measure of the voxels assigned to each part from the hybrid CAD-IBFEM image, and thus the equivalent segmented volume. The two sets of values are comparable; the volume of the inner CuCrZr pipe is identical however there is a difference in both the armour and interlayer volumes. This is due to data smoothing operations performed at the armour-interlayer interface which have caused an overall change in outer diameter of the interlayer. Smoothing operations are necessary because the data is discretised into cuboids (voxels) which are being used to represent curved surfaces. The voxels for this image are cubes with a side length of 35.4 μm, therefore incorrectly determining the interlayer or armour dimensions by one voxel would result in a volumetric change of 3.1 mm3 or 23 mm3, respectively. From the variation in expected and resultant volumes it can be calculated that the interlayer outer diameter is 13.87 mm rather than 14 mm. For this work, this level of divergence from design is not of importance as the main aim is to compare the results for the various simulations (which have the same dimensions). If the results were to be used

to inform decisions on performance of the part the interface would be redefined in Simpleware and the simulations performed again.
Table 4: Dimensions and expected volume of each monoblock section according to design. OD = outer diameter, ID = inner diameter, l = length
Dimensions (mm)
Geometric Volume (mm³)
Voxel count Segmented Volume (mm³)
W Cuboid with pipe bore (22 x 22 x 4) – (ID = 14, l = 4)
1320 31384394 1390
CuCrZr Pipe OD = 12, ID = 10, l = 4.5
156 6941170 156
Interlayer (foam + pores)
Pipe OD = 14, ID = 12, l = 4
163
- Foam 813705 36 - Pores 3417120 115 Total 1639 42556389 1697
Once meshed the volume of the parts can be checked again for further dimensional changes from the original data introduced at the meshing stage, this is shown in Table 5. The agreement here between volumes for the segmented image and FE mesh is very good, any differences are negligible. Further analysis of the sections is parts, here the resultant surface area was measured and the ratio between volume and area calculated. As expected, this ratio is lowest for the armour and highest for the foam interlayer due to its fine microstructure. These results demonstrate that microstructural detail in the foam have been retained during the meshing procedure.
Table 5: Statistical analysis of FE mesh output from CT image.
Element count
Volume (mm³)
Surface area (mm²)
Ratio (area/volume)
W 2646130 1390 1220 0.9
CuCrZr 785241 157 386 2.5
Pores 2451773 115 838 7.3
Foam 1042211 34 611 18.0
Total 6925355 1697
Important to the validity of any results calculated by FE is the ‘quality’ of the elements that make up the mesh i.e. how closely they match the ideal geometry of an equal sided tetrahedron or hexahedron. If elements are highly distorted they are known to impact calculations, often overpredicting stiffness or resistivity in mechanical or thermal models, respectively. Table 6 lists the results for various methods of measuring mesh ‘quality’ for each of the monoblock materials. The measures used are well-known metrics. Briefly, in respective order, they measure; the normalised in-sphere radius to circumsphere radius ratio; ratio of longest to shortest edge length; non-regularity of element; how close to equilateral the element is; ratio between element volume and ideal element volume; information on volume, shape and orientation of cell. As expected, due to its highly unstructured geometry, the foam section contains the lowest quality mesh of the four materials.

Despite this, the overall mesh can be considered of adequate quality for FE purposes. For increased confidence in the FE results a mesh dependency sensitivity analysis could be conducted.
Table 6: Mean values for mesh quality measurement parameters.
Ideal value W CuCrZr Pores Foam
In-out aspect ratio 1 0.7 0.8 0.8 0.7
Edge length aspect ratio 1 1.8 1.7 1.7 2.0
Angular skew 0 0.4 0.4 0.4 0.5
Volume skew 0 0.5 0.3 0.4 0.5
Shape factor 1 0.5 0.7 0.6 0.5
Jacobian 1 0.5 0.6 0.6 0.5
Modelling
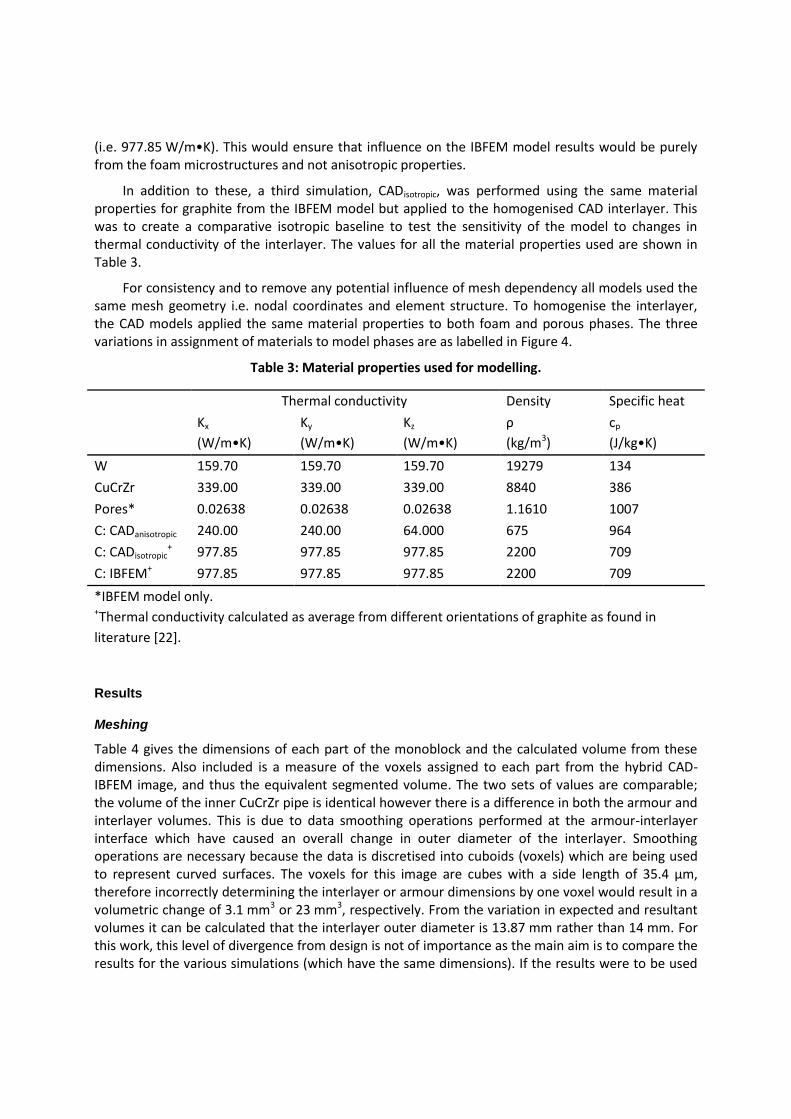
Figure 6 shows a comparison front view of the temperature on the surface of the monoblock once steady state had been reached for the three simulations performed (CADanisotropic, CADisotropic and IBFEM). The second row of images is focussed closer on the material interface region with temperature bounds rescaled to show additional information. Despite only providing qualitative data, it is helpful to visualise the temperature contours resultant from the thermal flux applied to the plasma facing surface and heat sink in the coolant pipe. From these images it can be seen that (a) and (c) have similar peak temperatures on the plasma facing surface whereas the temperatures on the same surface in (b) are lower. Despite the previous similarity, the location at which the temperature reaches 200 °C on the sides of the monoblocks is different for each simulation; in order of highest to lowest - (b), (a) and (c). That is to say, the thermal gradient along that surface differs for each model. Considering the distance from the maximum temperatures to the point at which temperature reaches 200 °C, the thermal gradients for the CADanisotropic, CADisotropic and IBFEM models in respective order are 42,900, 42,200 and 37,600 °C/m. This is of significance because higher thermal gradients indicate higher thermally induced stresses due to non-uniform thermal expansion.
Another significant visual difference is the thermal gradient across the armour-interlayer-pipe interfaces. The CADanisotropic model, shown in (a) has a steep gradient from the low temperature of the pipe to the higher temperature of the armour whereas the transition in the CADanisotropic model, shown in (b), is more gradual. The IBFEM model has a highly non-uniform transition over the material interface region, with visible localised ‘hot spots’. The non-uniformity and non-symmetry observed in the IBFEM model (not seen in either CAD model) would have been introduced by the non-uniform geometries included when modelling the foam on the microstructural level.
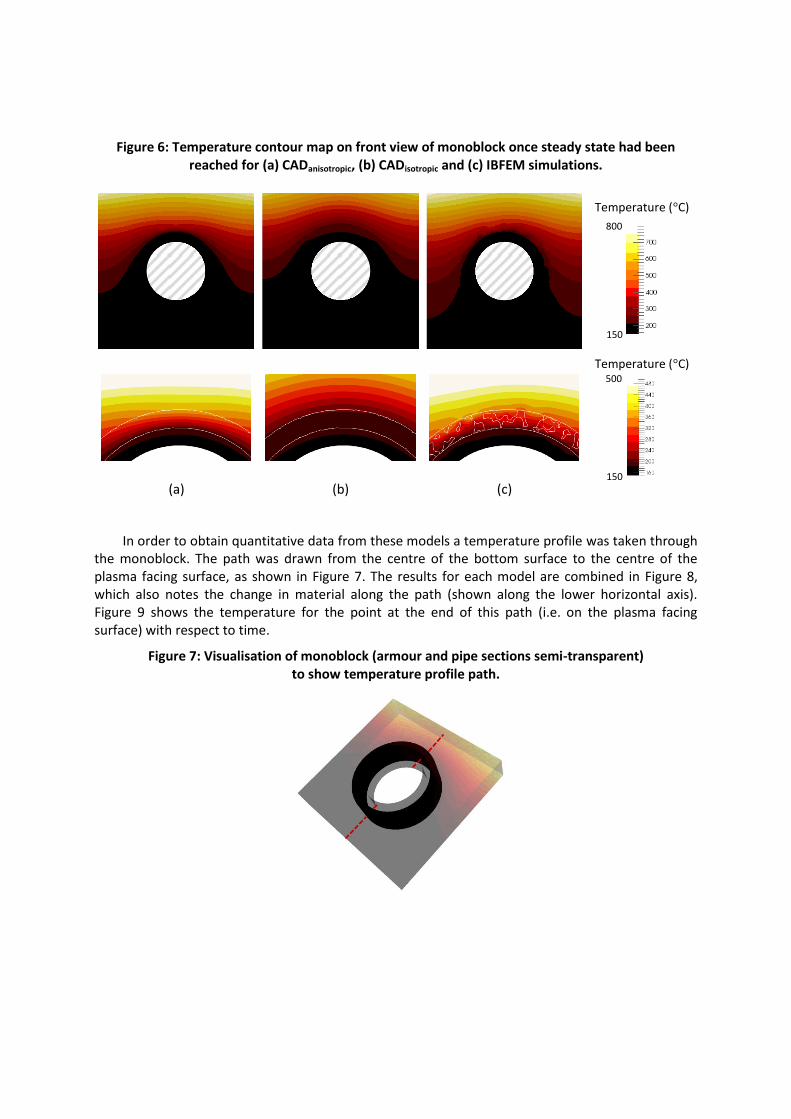
Figure 6: Temperature contour map on front view of monoblock once steady state had been reached for (a) CADanisotropic, (b) CADisotropic and (c) IBFEM simulations.
Temperature (°C)
Temperature (°C)
(a) (b) (c)
In order to obtain quantitative data from these models a temperature profile was taken through the monoblock. The path was drawn from the centre of the bottom surface to the centre of the plasma facing surface, as shown in Figure 7. The results for each model are combined in Figure 8, which also notes the change in material along the path (shown along the lower horizontal axis). Figure 9 shows the temperature for the point at the end of this path (i.e. on the plasma facing surface) with respect to time.
Figure 7: Visualisation of monoblock (armour and pipe sections semi-transparent) to show temperature profile path.
150
800
150
500

Figure 8: Temperature profile along path shown in Figure 7 for all three models (also denoting material section along the lower horizontal axis).
Figure 9: Temperature rise with respect to time at the centre of the plasma facing surface (i.e. end point of profile path in Figure 8)
0
100
200
300
400
500
600
700
0 1 2 3 4 5
Tem
pe
ratu
re (
°C)
Time (s)
CAD_anisotropicCAD_isotropicIBFEM
0
100
200
300
400
500
600
700
0 10 20
Tem
pe
ratu
re (°C
)
Distance (mm)
CAD_anisotropic
CAD_isotropic
IBFEM
- Armour
- Interlayer
- Coolant pipe
Figure 8 and Figure 9 show that the maximum temperature for the CADisotropic model is significantly lower than that of the CADanisotropic or IBFEM models. This is due to the interlayer section between the pipe and the plasma facing surface. Here, the thermal gradient is significantly lower than the other two models. Therefore, despite a similar gradient through the armour region, the plasma facing surface experiences a maximum temperature of 539 °C rather than 673 °C for the CADanisotropic and IBFEM models, a difference of 20 %. Rhe CADisotropic model doesn’t take into consideration the anisotropy of graphite or the foam microstructure, therefore it can be concluded that using the material properties for amorphous carbon for a solid interlayer overestimates the thermal conductivity. Although the results for the CADisotropic are not an accurate representation of the foam interlayer, they are a useful baseline for comparison of other results.
The CADanisotropic and IBFEM models show a strong level of agreement despite using vastly different approaches to represent material properties for the interlayer. That is, the CADanisotropic values are for bulk foam properties as measured experimentally and the IBFEM values are theoretical based on combining properties for carbon with the foam microstructure. When considering the few observable differences between the two models; there is a small difference in temperature on the bottom surface of the monoblock, 154 °C and 167 °C for the CADanisotropic and IBFEM models respectively. The main difference is the temperature profile through the interlayer region; the profile for the IBFEM model fluctuates significantly due to passing through foam and porous phases whereas it is continuous for the homogenised CADanisotropic model. Finally, there is a minor difference in the profile with respect to time, shown in Figure 9, which will be contributed to by the variation in specific heat capacity values.
The level of agreement shown here demonstrates the validity of the novel IBFEM approach with respect to the widely accepted method of homogenising complex microstructures. In addition to demonstrating its validity, this study highlights some of IBFEM’s key benefits.
- Using literature values for material properties and microstructure alone it was possible to predict the performance of the foam without prior knowledge of its bulk performance and without measuring those experimentally. If foam with a new microstructure was produced it would be possible to model it accurately from X-ray CT data without the need to perform a time consuming range of thermo-mechanical testing. This could be a powerful tool for rapid development of new functional materials.
- The CADanisotropic model gives a geometrically ideal, and therefore symmetrical, result which may be globally valid but does not provide localised information within the foam. The IBFEM model may be interrogated at smaller scales to investigate local fluctuations resulting from the microstructure which could potentially be significant to the part’s structural integrity. Developments underway will allow modelling of the structural integrity at an even finer scale by using a multiscale cellular automata – finite element approach [28].
- Finally, the simulation results show good agreement; differences observed are due to the increased microscale accuracy inherent in the IBFEM model. In scenarios such as this, where microstructure dominates performance, additional confidence in predicting performance from a ‘digital twin’ model of a real part may be of significant operational value if the design is approaching safety limits. In this example CAD analysis may have deemed the part to have unacceptably high thermal gradients; whereas by considering microstructure, IBFEM showed them to have been overestimated.

Conclusions
This work investigated creating an image-based finite element methods model from X-ray computed tomography data of a functional material (graphite foam) on a microstructural level. The functional material was used as part of a heat exchange component, termed monoblock, for a fusion energy device. The other parts of the component were drawn using CAD, thus a hybrid CAD-IBFEM model was created.
To test the validity of the CAD-IBFEM model its results were compared to two standard CAD models of the same component where the microstructures in the functional material region were homogenised and average material properties assigned. The first CAD model used the manufacturer’s anisotropic material properties for the graphite foam which were measured experimentally [21]. For a baseline comparison, the second CAD model used isotropic values for amorphous carbon found in literature [22], the same material properties assigned to the foam in the IBFEM model.
It was found that the IBFEM model was in good agreement with the CAD version which used the manufacturer’s properties. As expected, the isotropic CAD model’s results differed significantly because it made no consideration of the anisotropic effects of graphite or the foam microstructure. This demonstrated that despite having no prior knowledge of the bulk performance of the foam, faithfully modelling the material on the microstructural level yielded results comparable to homogenisation techniques. The advantage of the IBFEM technique is that, in addition to having been shown to increase modelling accuracy for such materials, the model can be interrogated on a more localised level to provide potentially critical additional information.
Although IBFEM has been used in the context of fusion engineering in this work, it could be used in a broad range of applications, particularly where materials with complex behaviours are used and bulk performance may not be easily measured. Ultimately, it is envisaged that IBFEM could be developed for quality assurance on production lines to gain confidence in component integrity, thus either increasing fabrication yields or reducing engineering reserve factors.
Acknowledgements
This work has been carried out within the framework of the EUROfusion Consortium and has received funding from the Euratom research and training programme 2014-2018 under grant agreement No 633053 and from the RCUK Energy Programme [grant number EP/I501045]. To obtain further information on the data and models underlying this paper please contact [email protected]. The views and opinions expressed herein do not necessarily reflect those of the European Commission. This work made use the HPC resources of The Hartree Centre (project fusionFEM) made available within the Distributed European Computing Initiative (DECI-12) by the PRACE-2IP, receiving funding from the European Community’s Seventh Framework Programme (FP7/2007-2013) under grant agreement RI-283493. Additionally, the authors would like to thank the Manchester X-ray Imaging Facility for use of tomography equipment, which was funded in part by the EPSRC (grants EP/F007906/1, EP/F001452/1 and EP/I02249X/1).
References
[1] S. J. Zinkle and J. T. Busby, “Structural materials for fission & fusion energy,” Mater. Today, vol. 12, no. 11, pp. 12–19, Nov. 2009.
[2] K. L. Murty and I. Charit, “Structural materials for Gen-IV nuclear reactors: Challenges and opportunities,” J. Nucl. Mater., vol. 383, no. 1–2, pp. 189–195, Dec. 2008.
[3] C. P. C. Wong, V. Chernov, A. Kimura, Y. Katoh, N. Morley, T. Muroga, K. W. Song, Y. C. Wu, and M. Zmitko, “ITER-Test blanket module functional materials,” J. Nucl. Mater., vol. 367, pp. 1287–1292, 2007.
[4] F. C. Difilippo, “Neutronics and thermal effects of graphite foams in the performance of nuclear energy systems,” Ann. Nucl. Energy, vol. 31, no. 2, pp. 135–149, 2004.
[5] J.-W. Yeh, “Recent progress in high-entropy alloys,” Ann. Chim. - Sci. des Matériaux, vol. 31, no. 6, pp. 633–648, 2006.
[6] D. W. Clark, S. J. Zinkle, M. K. Patel, and C. M. Parish, “High temperature ion irradiation effects in MAX phase ceramics,” Acta Mater., vol. 105, pp. 130–146, 2016.
[7] L. L. Snead, T. D. Burchell, and A. L. Qualls, “Strength of neutron-irradiated high-quality 3D carbon fiber composite,” J. Nucl. Mater., vol. 321, no. 2–3, pp. 165–169, Sep. 2003.
[8] G. N. Praveen and J. N. Reddy, “Nonlinear transient thermoelastic analysis of functionally graded ceramic-metal plates,” Int. J. Solids Struct., vol. 35, no. 33, pp. 4457–4476, Nov. 1998.
[9] I. J. Beyerlein, A. Caro, M. J. Demkowicz, N. A. Mara, A. Misra, and B. P. Uberuaga, “Radiation damage tolerant nanomaterials,” Mater. Today, vol. 16, no. 11, pp. 443–449, Nov. 2013.
[10] J. F. Bourgat, “Numerical experiments of the homogenization method,” in Computing Methods in Applied Sciences and Engineering, 1977, I, vol. 704, R. Glowinski, J. L. Lions, and I. Laboria, Eds. Springer Berlin Heidelberg, 1979, pp. 330–356.
[11] Ll. M. Evans, L. Margetts, V. Casalegno, F. Leonard, T. Lowe, P. D. Lee, M. Schmidt, and P. M. Mummery, “Thermal characterisation of ceramic/metal joining techniques for fusion applications using X-ray tomography,” Fusion Eng. Des., vol. 89, pp. 826–836, 2014.
[12] Ll. M. Evans, J. D. Arregui-Mena, P. M. Mummery, R. Akers, E. Surrey, A. Shterenlikht, M. Broggi, and L. Margetts, “Use of massively parallel computing to improve modelling accuracy within the nuclear sector,” Int. J. Multiphys., vol. 10, no. 2, Jun. 2016.
[13] “The virtual vessel – cutaway with plasma.” [Online]. Available: https://www.euro-fusion.org/2011/08/the-virtual-vessel/?view=gallery-11. [Accessed: 25-Jul-2016].
[14] “A blast of heat for ITER’s plasma-facing components.” [Online]. Available: http://www.iter.org/newsline/251/1436. [Accessed: 25-Jul-2016].
[15] A. S. Kukushkin, H. D. Pacher, V. Kotov, G. W. Pacher, and D. Reiter, “Finalizing the ITER divertor design: The key role of SOLPS modeling,” Fusion Eng. Des., vol. 86, no. 12, pp. 2865–2873, 2011.

[16] R. A. Pitts, A. Kukushkin, A. Loarte, A. Martin, M. Merola, C. E. Kessel, V. Komarov, and M. Shimada, “Status and physics basis of the ITER divertor,” Phys. Scr., vol. T138, no. T138, p. 014001, Dec. 2009.
[17] A. Herrmann, H. Greuner, M. Balden, and H. Bolt, “Design and evaluation of an optimized W/Cu interlayer for W monoblock components,” Fusion Eng. Des., vol. 86, no. 1, pp. 27–32, 2011.
[18] J. H. You, G. Mazzone, E. Visca, C. Bachmann, E. Autissier, T. Barrett, V. Cocilovo, F. Crescenzi, P. K. Domalapally, D. Dongiovanni, S. Entler, G. Federici, P. Frosi, M. Fursdon, H. Greuner, D. Hancock, D. Marzullo, S. McIntosh, A. V. Müller, M. T. Porfiri, G. Ramogida, J. Reiser, M. Richou, M. Rieth, A. Rydzy, R. Villari, and V. Widak, “Conceptual design studies for the European DEMO divertor: Rationale and first results,” Fusion Eng. Des., 2015.
[19] P. G. Young, T. B. H. Beresford-West, S. R. L. Coward, B. Notarberardino, B. Walker, and A. Abdul-Aziz, “An efficient approach to converting three-dimensional image data into highly accurate computational models.,” Philos. Trans. A. Math. Phys. Eng. Sci., vol. 366, no. 1878, pp. 3155–73, Sep. 2008.
[20] Ll. M. Evans, L. Margetts, V. Casalegno, L. Lever, J. Bushell, T. Lowe, A. Wallwork, P. Young, A. Lindemann, M. Schmidt, and P. Mummery, “Transient thermal finite element analysis of CFC–Cu ITER monoblock using X-ray tomography data,” Fusion Eng. Des., vol. 100, pp. 100–111, 2015.
[21] “KFOAM® | Koppers.” [Online]. Available: http://www.koppers.com/pages/kfoam. [Accessed: 26-Jul-2016].
[22] W. M. Haynes, CRC Handbook of Chemistry and Physics, 95th Edition. CRC Press, 2014.
[23] “ParaFEM / Code / [r2084].” [Online]. Available: https://sourceforge.net/p/parafem/code/2084/tree/ [Accessed: 26-Jul-2016].
[24] L. Margetts, “Parallel Finite Element Analysis,” PhD Thesis, University of Manchester, 2002.
[25] I. M. Smith, D. V. Griffiths, and L. Margetts, Programming the Finite Element Method, 5th ed. Chichester: Wiley, 2013.
[26] I. M. Smith and L. Margetts, “The convergence variability of parallel iterative solvers,” Eng. Comput., vol. 23, no. 2, pp. 154–165, Feb. 2006.
[27] Ll. M. Evans, L. Margetts, J. Bushell, T. Lowe, A. Wallwork, W. E. Windes, P. Young, and P. M. Mummery, “Parallel processing for time-dependent heat flow problems,” in NAFEMS World Congress, 2013.
[28] A. Shterenlikht and L. Margetts, “Three-dimensional cellular automata modelling of cleavage propagation across crystal boundaries in polycrystalline microstructures,” Proc. R. Soc. A Math. Phys. Eng. Sci., vol. 471, no. 2177, pp. 20150039–20150039, Apr. 2015.


![Alleviating the Mesh Burden in Computational Solid Mechanics · by SimpleWare [simpleware, Franc3d, Bouchard], automatic mesh generators are not sufficiently robust so that today](https://img.pdfslide.us/doc/110x75/5edddcf5ad6a402d666914e9/alleviating-the-mesh-burden-in-computational-solid-mechanics-by-simpleware-simpleware.jpg)