Embed Size (px)
Citation preview
Putnam County 2017
https://business.wvu.edu/centers/bureau‐of‐business‐and‐economic‐research
This publication compiles three sets of data. The first set comes from the U.S. Census Bureau's American Community Survey, which
includes data on selected Social, Economic, Housing, and Demographic characteristics. The second set is the labor force statistics from
the U.S. Bureau of Labor Statistics, which includes data on Total Labor Force, Total Employment, Unemployment, and Unemployment
Rate. The third set comes from the U.S. Bureau of Economic Analysis, which includes data on: Personal Income; Total Full‐Time and Part‐
Time Employment; Compensation by Industry; Regional Income and Expenses; Transfer Payments; and Farm Income and Expenses.
Data containing industry break‐down are presented in two sets. The first is presented in terms of the U.S. Standard Industrial
Classification system (SIC) and the second is in terms of the North American Industry Classification System (NAICS). The SIC data cover
the years from 1969 to 2000, while the NAICS data cover the years from 2001 to 2016.
2017 West Virginia County Data Profile
Putnam County
304.293. 7831; [email protected]
Bureau of Business and Economic Research
College of Business and Economics, West Virginia University
Post Office Box 6025, Morgantown, WV 26506
BEARFACTS ‐‐‐‐‐‐‐ ‐‐‐‐‐‐‐ ‐‐‐‐‐‐‐ ‐‐‐‐‐‐‐ ‐‐‐‐‐‐‐ ‐‐‐‐‐‐‐ 1
Selected Social Characteristics (2016) ‐‐‐‐‐‐‐ ‐‐‐‐‐‐‐ ‐‐‐‐‐‐‐ ‐‐‐‐‐‐‐ ‐‐‐‐‐‐‐ ‐‐‐‐‐‐‐ 3
Selected Economic Characteristics (2016) ‐‐‐‐‐‐‐ ‐‐‐‐‐‐‐ ‐‐‐‐‐‐‐ ‐‐‐‐‐‐‐ ‐‐‐‐‐‐‐ ‐‐‐‐‐‐‐ 5
Selected Housing Characteristics (2016) ‐‐‐‐‐‐‐ ‐‐‐‐‐‐‐ ‐‐‐‐‐‐‐ ‐‐‐‐‐‐‐ ‐‐‐‐‐‐‐ ‐‐‐‐‐‐‐ 7
Demographic and Housing Estimates (2016) ‐‐‐‐‐‐‐ ‐‐‐‐‐‐‐ ‐‐‐‐‐‐‐ ‐‐‐‐‐‐‐ ‐‐‐‐‐‐‐ ‐‐‐‐‐‐‐ 9
Labor Force Statistics (1991‐2016) ‐‐‐‐‐‐‐ ‐‐‐‐‐‐‐ ‐‐‐‐‐‐‐ ‐‐‐‐‐‐‐ ‐‐‐‐‐‐‐ ‐‐‐‐‐‐‐ 10
Personal Income by Major Source and Earning by IndustryTable CA05 ‐ 1969‐2000 (SIC) ‐‐‐‐‐‐‐ ‐‐‐‐‐‐‐ ‐‐‐‐‐‐‐ ‐‐‐‐‐‐‐ ‐‐‐‐‐‐‐ ‐‐‐‐‐‐‐ 11
Table CA05N ‐ 2001‐2016 (NAICS) ‐‐‐‐‐‐‐ ‐‐‐‐‐‐‐ ‐‐‐‐‐‐‐ ‐‐‐‐‐‐‐ ‐‐‐‐‐‐‐ ‐‐‐‐‐‐‐ 32
Total Full‐Time and Part‐Time Employment by IndustryTable CA25 ‐ 1969‐2000 (SIC) ‐‐‐‐‐‐‐ ‐‐‐‐‐‐‐ ‐‐‐‐‐‐‐ ‐‐‐‐‐‐‐ ‐‐‐‐‐‐‐ ‐‐‐‐‐‐‐ 41
Table CA25N ‐ 2001‐2016 (NAICS) ‐‐‐‐‐‐‐ ‐‐‐‐‐‐‐ ‐‐‐‐‐‐‐ ‐‐‐‐‐‐‐ ‐‐‐‐‐‐‐ ‐‐‐‐‐‐‐ 46
Compensation by IndustryTable CA06N ‐ 2001‐2016 (NAICS) ‐‐‐‐‐‐‐ ‐‐‐‐‐‐‐ ‐‐‐‐‐‐‐ ‐‐‐‐‐‐‐ ‐‐‐‐‐‐‐ ‐‐‐‐‐‐‐ 49
Regional Income and ExpensesTable CA30 ‐ 1969‐2016 ‐‐‐‐‐‐‐ ‐‐‐‐‐‐‐ ‐‐‐‐‐‐‐ ‐‐‐‐‐‐‐ ‐‐‐‐‐‐‐ ‐‐‐‐‐‐‐ 58
Transfer PaymentsTable CA35 ‐ 1969‐2016 ‐‐‐‐‐‐‐ ‐‐‐‐‐‐‐ ‐‐‐‐‐‐‐ ‐‐‐‐‐‐‐ ‐‐‐‐‐‐‐ ‐‐‐‐‐‐‐ 66
Farm Income and ExpensesTable CA45 ‐ 1969‐2016 ‐‐‐‐‐‐‐ ‐‐‐‐‐‐‐ ‐‐‐‐‐‐‐ ‐‐‐‐‐‐‐ ‐‐‐‐‐‐‐ ‐‐‐‐‐‐‐ 74
Table of Contents
(i)
Putnam County
Putnam , West Virginia
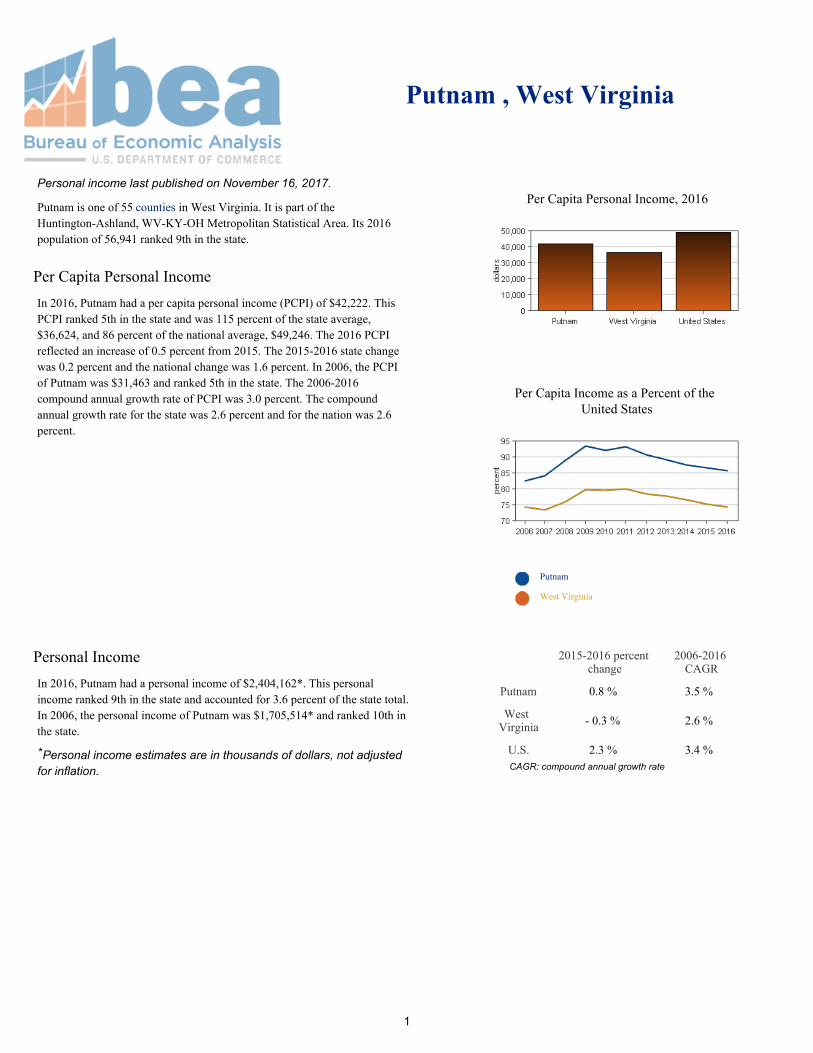
Personal income last published on November 16, 2017.
Putnam is one of 55 counties in West Virginia. It is part of theHuntington-Ashland, WV-KY-OH Metropolitan Statistical Area. Its 2016population of 56,941 ranked 9th in the state.
Per Capita Personal IncomeIn 2016, Putnam had a per capita personal income (PCPI) of $42,222. ThisPCPI ranked 5th in the state and was 115 percent of the state average,$36,624, and 86 percent of the national average, $49,246. The 2016 PCPIreflected an increase of 0.5 percent from 2015. The 2015-2016 state changewas 0.2 percent and the national change was 1.6 percent. In 2006, the PCPIof Putnam was $31,463 and ranked 5th in the state. The 2006-2016compound annual growth rate of PCPI was 3.0 percent. The compoundannual growth rate for the state was 2.6 percent and for the nation was 2.6percent.
Per Capita Personal Income, 2016
Per Capita Income as a Percent of theUnited States
Putnam
West Virginia
Personal IncomeIn 2016, Putnam had a personal income of $2,404,162*. This personalincome ranked 9th in the state and accounted for 3.6 percent of the state total.In 2006, the personal income of Putnam was $1,705,514* and ranked 10th inthe state.
*Personal income estimates are in thousands of dollars, not adjustedfor inflation.
2015-2016 percentchange
2006-2016CAGR
Putnam 0.8 % 3.5 %
WestVirginia - 0.3 % 2.6 %
U.S. 2.3 % 3.4 % CAGR: compound annual growth rate
1
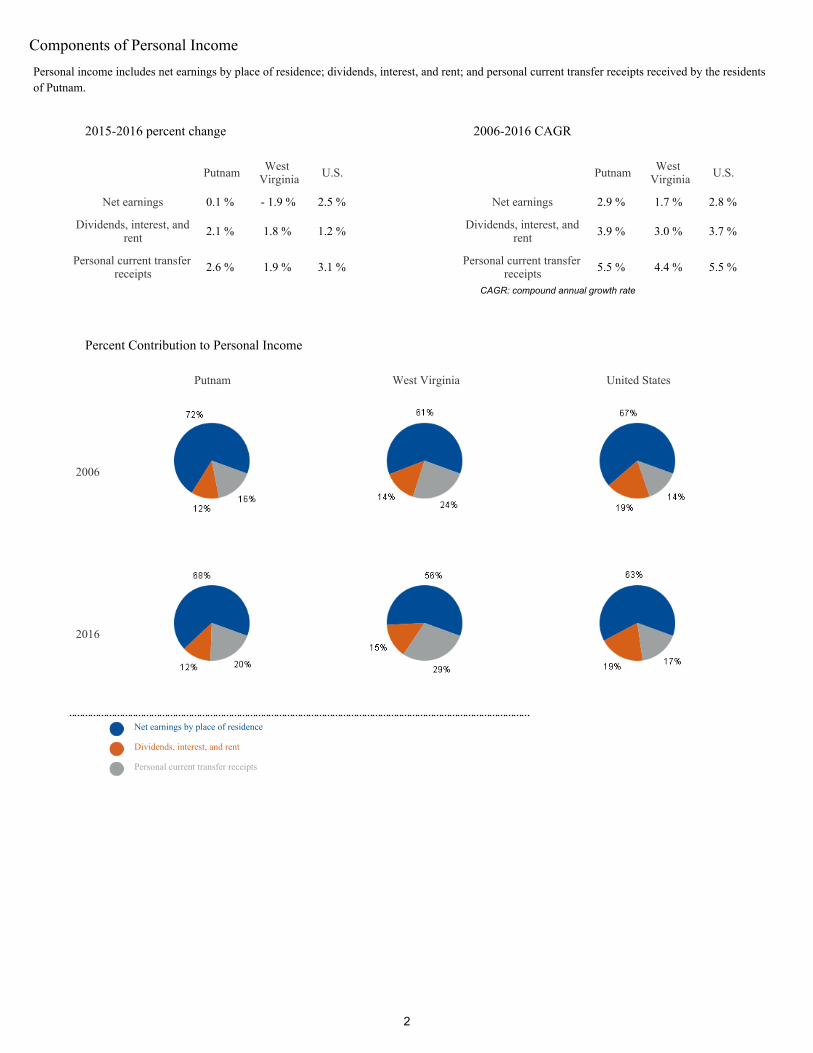
Components of Personal IncomePersonal income includes net earnings by place of residence; dividends, interest, and rent; and personal current transfer receipts received by the residentsof Putnam.
2015-2016 percent change
Putnam WestVirginia U.S.
Net earnings 0.1 % - 1.9 % 2.5 %
Dividends, interest, andrent 2.1 % 1.8 % 1.2 %
Personal current transferreceipts 2.6 % 1.9 % 3.1 %
2006-2016 CAGR
Putnam WestVirginia U.S.
Net earnings 2.9 % 1.7 % 2.8 %
Dividends, interest, andrent 3.9 % 3.0 % 3.7 %
Personal current transferreceipts 5.5 % 4.4 % 5.5 %
CAGR: compound annual growth rate
Percent Contribution to Personal Income
Putnam West Virginia United States
2006
2016
Net earnings by place of residence
Dividends, interest, and rent
Personal current transfer receipts
2
Putnam County
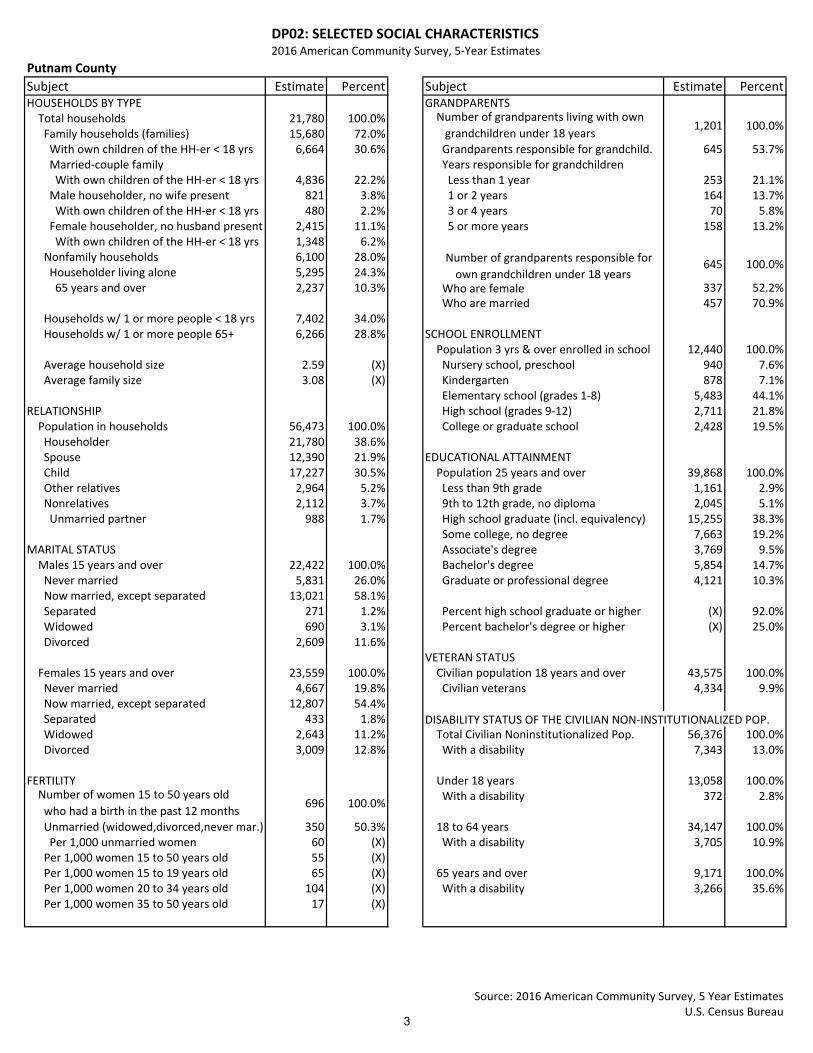
Subject Estimate Percent Subject Estimate PercentHOUSEHOLDS BY TYPE GRANDPARENTS Total households 21,780 100.0% Family households (families) 15,680 72.0% With own children of the HH‐er < 18 yrs 6,664 30.6% Grandparents responsible for grandchild. 645 53.7% Married‐couple family Years responsible for grandchildren With own children of the HH‐er < 18 yrs 4,836 22.2% Less than 1 year 253 21.1% Male householder, no wife present 821 3.8% 1 or 2 years 164 13.7% With own children of the HH‐er < 18 yrs 480 2.2% 3 or 4 years 70 5.8% Female householder, no husband present 2,415 11.1% 5 or more years 158 13.2% With own children of the HH‐er < 18 yrs 1,348 6.2% Nonfamily households 6,100 28.0% Householder living alone 5,295 24.3% 65 years and over 2,237 10.3% Who are female 337 52.2%
Who are married 457 70.9% Households w/ 1 or more people < 18 yrs 7,402 34.0% Households w/ 1 or more people 65+ 6,266 28.8% SCHOOL ENROLLMENT
Population 3 yrs & over enrolled in school 12,440 100.0% Average household size 2.59 (X) Nursery school, preschool 940 7.6% Average family size 3.08 (X) Kindergarten 878 7.1%
Elementary school (grades 1‐8) 5,483 44.1%RELATIONSHIP High school (grades 9‐12) 2,711 21.8% Population in households 56,473 100.0% College or graduate school 2,428 19.5% Householder 21,780 38.6% Spouse 12,390 21.9% EDUCATIONAL ATTAINMENT Child 17,227 30.5% Population 25 years and over 39,868 100.0% Other relatives 2,964 5.2% Less than 9th grade 1,161 2.9% Nonrelatives 2,112 3.7% 9th to 12th grade, no diploma 2,045 5.1% Unmarried partner 988 1.7% High school graduate (incl. equivalency) 15,255 38.3%
Some college, no degree 7,663 19.2%MARITAL STATUS Associate's degree 3,769 9.5% Males 15 years and over 22,422 100.0% Bachelor's degree 5,854 14.7% Never married 5,831 26.0% Graduate or professional degree 4,121 10.3% Now married, except separated 13,021 58.1% Separated 271 1.2% Percent high school graduate or higher (X) 92.0% Widowed 690 3.1% Percent bachelor's degree or higher (X) 25.0% Divorced 2,609 11.6%
VETERAN STATUS Females 15 years and over 23,559 100.0% Civilian population 18 years and over 43,575 100.0% Never married 4,667 19.8% Civilian veterans 4,334 9.9% Now married, except separated 12,807 54.4% Separated 433 1.8% DISABILITY STATUS OF THE CIVILIAN NON‐INSTITUTIONALIZED POP. Widowed 2,643 11.2% Total Civilian Noninstitutionalized Pop. 56,376 100.0% Divorced 3,009 12.8% With a disability 7,343 13.0%
FERTILITY Under 18 years 13,058 100.0% With a disability 372 2.8%
Unmarried (widowed,divorced,never mar.) 350 50.3% 18 to 64 years 34,147 100.0% Per 1,000 unmarried women 60 (X) With a disability 3,705 10.9% Per 1,000 women 15 to 50 years old 55 (X) Per 1,000 women 15 to 19 years old 65 (X) 65 years and over 9,171 100.0% Per 1,000 women 20 to 34 years old 104 (X) With a disability 3,266 35.6% Per 1,000 women 35 to 50 years old 17 (X)
Source: 2016 American Community Survey, 5 Year EstimatesU.S. Census Bureau
DP02: SELECTED SOCIAL CHARACTERISTICS2016 American Community Survey, 5‐Year Estimates
Number of grandparents living with own
grandchildren under 18 years1,201 100.0%
Number of grandparents responsible for
own grandchildren under 18 years645 100.0%
Number of women 15 to 50 years old
who had a birth in the past 12 months696 100.0%
3

Putnam County
Subject Estimate Percent Subject Estimate PercentRESIDENCE 1 YEAR AGO Other Indo‐European languages 245 0.5% Population 1 year and over 56,161 100.0% Speak English less than "very well" 25 0.0% Same house 52,179 92.9% Asian and Pacific Islander languages 205 0.4% Different house in the U.S. 3,885 6.9% Speak English less than "very well" 37 0.1% Same county 2,162 3.8% Other languages 68 0.1% Different county 1,723 3.1% Speak English less than "very well" 0 0.0% Same state 1,304 2.3% Different state 419 0.7% ANCESTRY Abroad 97 0.2% Total population 56,743 100.0%
American 10,536 18.6%PLACE OF BIRTH Arab 103 0.2% Total population 56,743 100.0% Czech 95 0.2% Native 56,114 98.9% Danish 11 0.0% Born in United States 56,015 98.7% Dutch 544 1.0% State of residence 46,593 82.1% English 5,489 9.7% Different state 9,422 16.6% French (except Basque) 812 1.4% Born in Puerto Rico, U.S. Islands., abroad 99 0.2% French Canadian 38 0.1% Foreign born 629 1.1% German 6,427 11.3%
Greek 106 0.2%U.S. CITIZENSHIP STATUS Hungarian 87 0.2% Foreign‐born population 629 100.0% Irish 5,111 9.0% Naturalized U.S. citizen 438 69.6% Italian 1,141 2.0% Not a U.S. citizen 191 30.4% Lithuanian 9 0.0%
Norwegian 29 0.1%YEAR OF ENTRY Polish 512 0.9% Population born outside the United States 728 728 Portuguese 0 0.0%
Russian 115 0.2% Native 99 100.0% Scotch‐Irish 980 1.7% Entered 2010 or later 0 0.0% Scottish 1,329 2.3% Entered before 2010 99 100.0% Slovak 59 0.1%
Subsaharan African 68 0.1% Foreign born 629 100.0% Swedish 148 0.3% Entered 2010 or later 78 12.4% Swiss 125 0.2% Entered before 2010 551 87.6% Ukrainian 26 0.0%
Welsh 187 0.3%WORLD REGION OF BIRTH OF FOREIGN BORN West Indian (excl. Hispanic origin groups) 0 0.0%
COMPUTERS AND INTERNET USE Europe 120 19.1% Total households (X) (X) Asia 394 62.6% With a computer (X) (X) Africa 15 2.4% With a broadband Internet subscription (X) (X) Oceania 0 0.0% Latin America 79 12.6% Northern America 21 3.3%
LANGUAGE SPOKEN AT HOME Population 5 years and over 53,378 100.0% English only 52,517 98.4% Language other than English 861 1.6% Speak English less than "very well" 130 0.2% Spanish 343 0.6% Speak English less than "very well" 68 0.1%
Source: 2016 American Community Survey, 5 Year EstimatesU.S. Census Bureau
Foreign‐born population, excluding
population born at sea629 100.0%
DP02: SELECTED SOCIAL CHARACTERISTICS (continued)2016 American Community Survey, 5‐Year Estimates
4
Putnam County
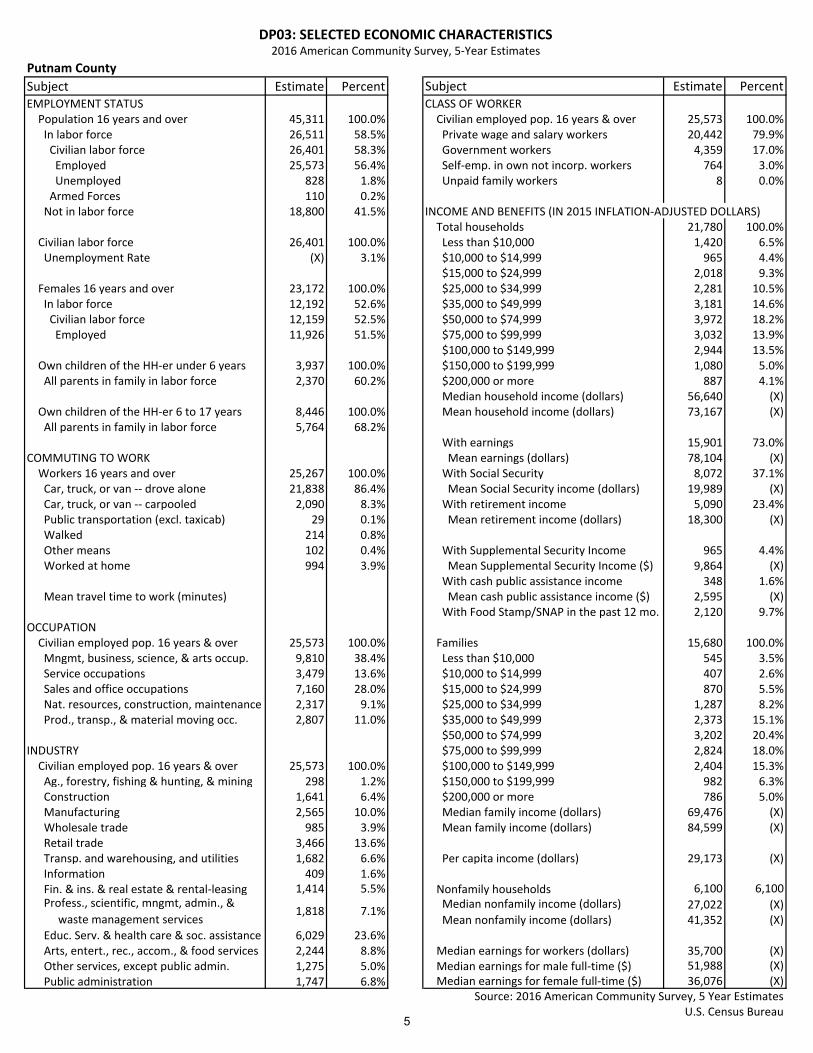
Subject Estimate Percent Subject Estimate PercentEMPLOYMENT STATUS CLASS OF WORKER Population 16 years and over 45,311 100.0% Civilian employed pop. 16 years & over 25,573 100.0% In labor force 26,511 58.5% Private wage and salary workers 20,442 79.9% Civilian labor force 26,401 58.3% Government workers 4,359 17.0% Employed 25,573 56.4% Self‐emp. in own not incorp. workers 764 3.0% Unemployed 828 1.8% Unpaid family workers 8 0.0% Armed Forces 110 0.2% Not in labor force 18,800 41.5% INCOME AND BENEFITS (IN 2015 INFLATION‐ADJUSTED DOLLARS)
Total households 21,780 100.0% Civilian labor force 26,401 100.0% Less than $10,000 1,420 6.5% Unemployment Rate (X) 3.1% $10,000 to $14,999 965 4.4%
$15,000 to $24,999 2,018 9.3% Females 16 years and over 23,172 100.0% $25,000 to $34,999 2,281 10.5% In labor force 12,192 52.6% $35,000 to $49,999 3,181 14.6% Civilian labor force 12,159 52.5% $50,000 to $74,999 3,972 18.2% Employed 11,926 51.5% $75,000 to $99,999 3,032 13.9%
$100,000 to $149,999 2,944 13.5% Own children of the HH‐er under 6 years 3,937 100.0% $150,000 to $199,999 1,080 5.0% All parents in family in labor force 2,370 60.2% $200,000 or more 887 4.1%
Median household income (dollars) 56,640 (X) Own children of the HH‐er 6 to 17 years 8,446 100.0% Mean household income (dollars) 73,167 (X) All parents in family in labor force 5,764 68.2%
With earnings 15,901 73.0%COMMUTING TO WORK Mean earnings (dollars) 78,104 (X) Workers 16 years and over 25,267 100.0% With Social Security 8,072 37.1% Car, truck, or van ‐‐ drove alone 21,838 86.4% Mean Social Security income (dollars) 19,989 (X) Car, truck, or van ‐‐ carpooled 2,090 8.3% With retirement income 5,090 23.4% Public transportation (excl. taxicab) 29 0.1% Mean retirement income (dollars) 18,300 (X) Walked 214 0.8% Other means 102 0.4% With Supplemental Security Income 965 4.4% Worked at home 994 3.9% Mean Supplemental Security Income ($) 9,864 (X)
With cash public assistance income 348 1.6% Mean travel time to work (minutes) Mean cash public assistance income ($) 2,595 (X)
With Food Stamp/SNAP in the past 12 mo. 2,120 9.7%OCCUPATION Civilian employed pop. 16 years & over 25,573 100.0% Families 15,680 100.0% Mngmt, business, science, & arts occup. 9,810 38.4% Less than $10,000 545 3.5% Service occupations 3,479 13.6% $10,000 to $14,999 407 2.6% Sales and office occupations 7,160 28.0% $15,000 to $24,999 870 5.5% Nat. resources, construction, maintenance 2,317 9.1% $25,000 to $34,999 1,287 8.2% Prod., transp., & material moving occ. 2,807 11.0% $35,000 to $49,999 2,373 15.1%
$50,000 to $74,999 3,202 20.4%INDUSTRY $75,000 to $99,999 2,824 18.0% Civilian employed pop. 16 years & over 25,573 100.0% $100,000 to $149,999 2,404 15.3% Ag., forestry, fishing & hunting, & mining 298 1.2% $150,000 to $199,999 982 6.3% Construction 1,641 6.4% $200,000 or more 786 5.0% Manufacturing 2,565 10.0% Median family income (dollars) 69,476 (X) Wholesale trade 985 3.9% Mean family income (dollars) 84,599 (X) Retail trade 3,466 13.6% Transp. and warehousing, and utilities 1,682 6.6% Per capita income (dollars) 29,173 (X) Information 409 1.6% Fin. & ins. & real estate & rental‐leasing 1,414 5.5% Nonfamily households 6,100 6,100
Median nonfamily income (dollars) 27,022 (X) Mean nonfamily income (dollars) 41,352 (X)
Educ. Serv. & health care & soc. assistance 6,029 23.6% Arts, entert., rec., accom., & food services 2,244 8.8% Median earnings for workers (dollars) 35,700 (X) Other services, except public admin. 1,275 5.0% Median earnings for male full‐time ($) 51,988 (X)
Public administration 1,747 6.8% Median earnings for female full‐time ($) 36,076 (X)Source: 2016 American Community Survey, 5 Year Estimates
U.S. Census Bureau
DP03: SELECTED ECONOMIC CHARACTERISTICS2016 American Community Survey, 5‐Year Estimates
Profess., scientific, mngmt, admin., &
waste management services1,818 7.1%
5
Putnam County
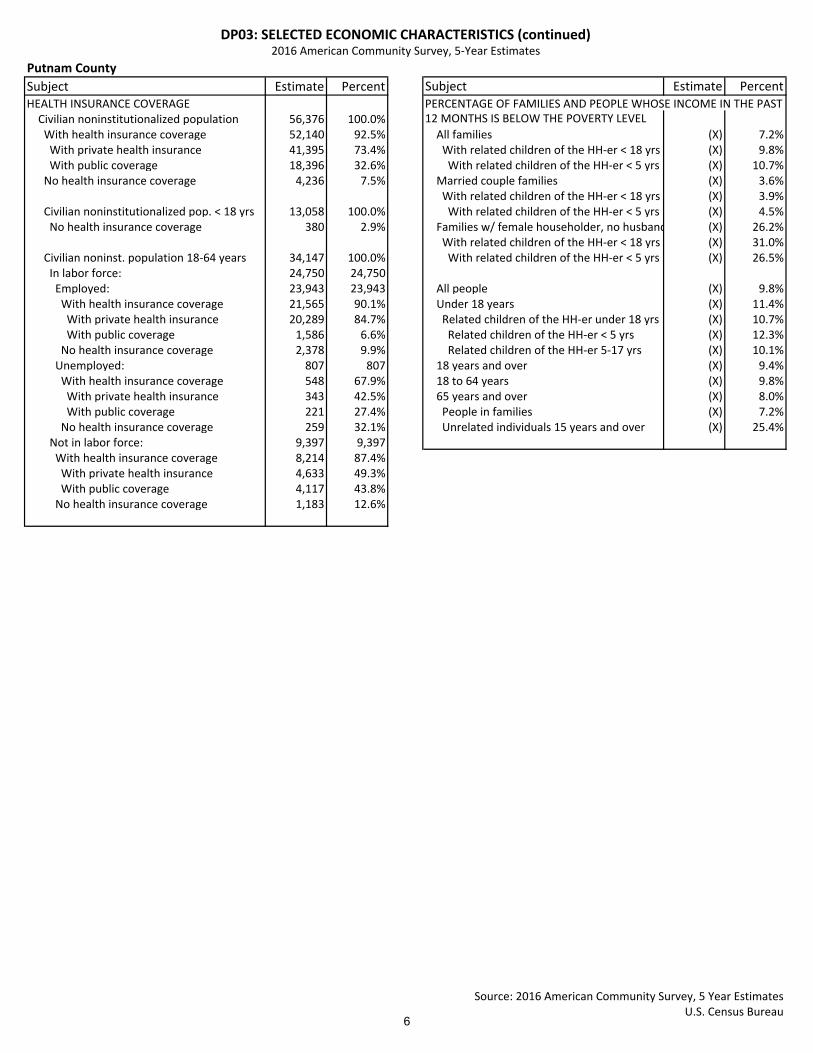
Subject Estimate Percent Subject Estimate PercentHEALTH INSURANCE COVERAGE PERCENTAGE OF FAMILIES AND PEOPLE WHOSE INCOME IN THE PAST Civilian noninstitutionalized population 56,376 100.0% 12 MONTHS IS BELOW THE POVERTY LEVEL
With health insurance coverage 52,140 92.5% All families (X) 7.2% With private health insurance 41,395 73.4% With related children of the HH‐er < 18 yrs (X) 9.8% With public coverage 18,396 32.6% With related children of the HH‐er < 5 yrs (X) 10.7% No health insurance coverage 4,236 7.5% Married couple families (X) 3.6%
With related children of the HH‐er < 18 yrs (X) 3.9% Civilian noninstitutionalized pop. < 18 yrs 13,058 100.0% With related children of the HH‐er < 5 yrs (X) 4.5% No health insurance coverage 380 2.9% Families w/ female householder, no husband (X) 26.2%
With related children of the HH‐er < 18 yrs (X) 31.0% Civilian noninst. population 18‐64 years 34,147 100.0% With related children of the HH‐er < 5 yrs (X) 26.5% In labor force: 24,750 24,750 Employed: 23,943 23,943 All people (X) 9.8% With health insurance coverage 21,565 90.1% Under 18 years (X) 11.4% With private health insurance 20,289 84.7% Related children of the HH‐er under 18 yrs (X) 10.7% With public coverage 1,586 6.6% Related children of the HH‐er < 5 yrs (X) 12.3% No health insurance coverage 2,378 9.9% Related children of the HH‐er 5‐17 yrs (X) 10.1% Unemployed: 807 807 18 years and over (X) 9.4% With health insurance coverage 548 67.9% 18 to 64 years (X) 9.8% With private health insurance 343 42.5% 65 years and over (X) 8.0% With public coverage 221 27.4% People in families (X) 7.2% No health insurance coverage 259 32.1% Unrelated individuals 15 years and over (X) 25.4% Not in labor force: 9,397 9,397 With health insurance coverage 8,214 87.4% With private health insurance 4,633 49.3% With public coverage 4,117 43.8% No health insurance coverage 1,183 12.6%
Source: 2016 American Community Survey, 5 Year EstimatesU.S. Census Bureau
DP03: SELECTED ECONOMIC CHARACTERISTICS (continued)2016 American Community Survey, 5‐Year Estimates
6
Putnam County
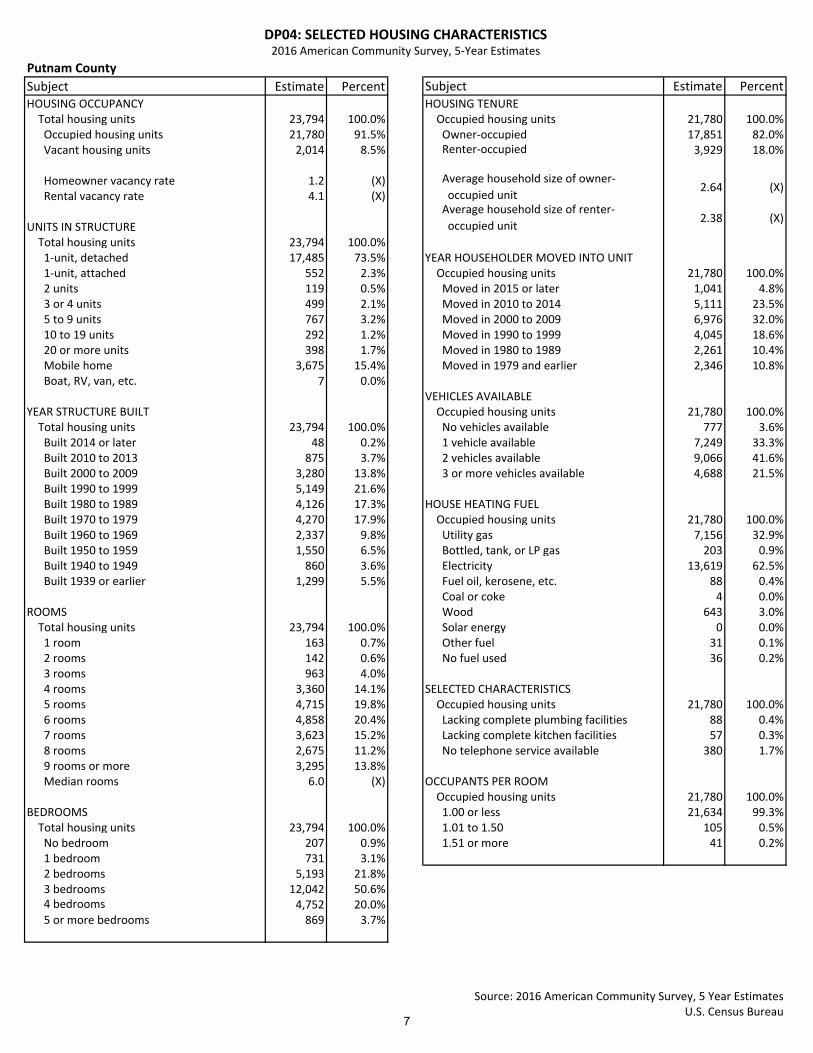
Subject Estimate Percent Subject Estimate PercentHOUSING OCCUPANCY HOUSING TENURE Total housing units 23,794 100.0% Occupied housing units 21,780 100.0% Occupied housing units 21,780 91.5% Owner‐occupied 17,851 82.0% Vacant housing units 2,014 8.5% Renter‐occupied 3,929 18.0%
Homeowner vacancy rate 1.2 (X) Rental vacancy rate 4.1 (X)
UNITS IN STRUCTURE Total housing units 23,794 100.0% 1‐unit, detached 17,485 73.5% YEAR HOUSEHOLDER MOVED INTO UNIT 1‐unit, attached 552 2.3% Occupied housing units 21,780 100.0% 2 units 119 0.5% Moved in 2015 or later 1,041 4.8% 3 or 4 units 499 2.1% Moved in 2010 to 2014 5,111 23.5% 5 to 9 units 767 3.2% Moved in 2000 to 2009 6,976 32.0% 10 to 19 units 292 1.2% Moved in 1990 to 1999 4,045 18.6% 20 or more units 398 1.7% Moved in 1980 to 1989 2,261 10.4% Mobile home 3,675 15.4% Moved in 1979 and earlier 2,346 10.8% Boat, RV, van, etc. 7 0.0%
VEHICLES AVAILABLEYEAR STRUCTURE BUILT Occupied housing units 21,780 100.0% Total housing units 23,794 100.0% No vehicles available 777 3.6% Built 2014 or later 48 0.2% 1 vehicle available 7,249 33.3% Built 2010 to 2013 875 3.7% 2 vehicles available 9,066 41.6% Built 2000 to 2009 3,280 13.8% 3 or more vehicles available 4,688 21.5% Built 1990 to 1999 5,149 21.6% Built 1980 to 1989 4,126 17.3% HOUSE HEATING FUEL Built 1970 to 1979 4,270 17.9% Occupied housing units 21,780 100.0% Built 1960 to 1969 2,337 9.8% Utility gas 7,156 32.9% Built 1950 to 1959 1,550 6.5% Bottled, tank, or LP gas 203 0.9% Built 1940 to 1949 860 3.6% Electricity 13,619 62.5% Built 1939 or earlier 1,299 5.5% Fuel oil, kerosene, etc. 88 0.4%
Coal or coke 4 0.0%ROOMS Wood 643 3.0% Total housing units 23,794 100.0% Solar energy 0 0.0% 1 room 163 0.7% Other fuel 31 0.1% 2 rooms 142 0.6% No fuel used 36 0.2% 3 rooms 963 4.0% 4 rooms 3,360 14.1% SELECTED CHARACTERISTICS 5 rooms 4,715 19.8% Occupied housing units 21,780 100.0% 6 rooms 4,858 20.4% Lacking complete plumbing facilities 88 0.4% 7 rooms 3,623 15.2% Lacking complete kitchen facilities 57 0.3% 8 rooms 2,675 11.2% No telephone service available 380 1.7% 9 rooms or more 3,295 13.8% Median rooms 6.0 (X) OCCUPANTS PER ROOM
Occupied housing units 21,780 100.0%BEDROOMS 1.00 or less 21,634 99.3% Total housing units 23,794 100.0% 1.01 to 1.50 105 0.5% No bedroom 207 0.9% 1.51 or more 41 0.2% 1 bedroom 731 3.1% 2 bedrooms 5,193 21.8% 3 bedrooms 12,042 50.6% 4 bedrooms 4,752 20.0% 5 or more bedrooms 869 3.7%
Source: 2016 American Community Survey, 5 Year EstimatesU.S. Census Bureau
DP04: SELECTED HOUSING CHARACTERISTICS2016 American Community Survey, 5‐Year Estimates
Average household size of owner‐
occupied unit2.64 (X)
Average household size of renter‐
occupied unit2.38 (X)
7
Putnam County
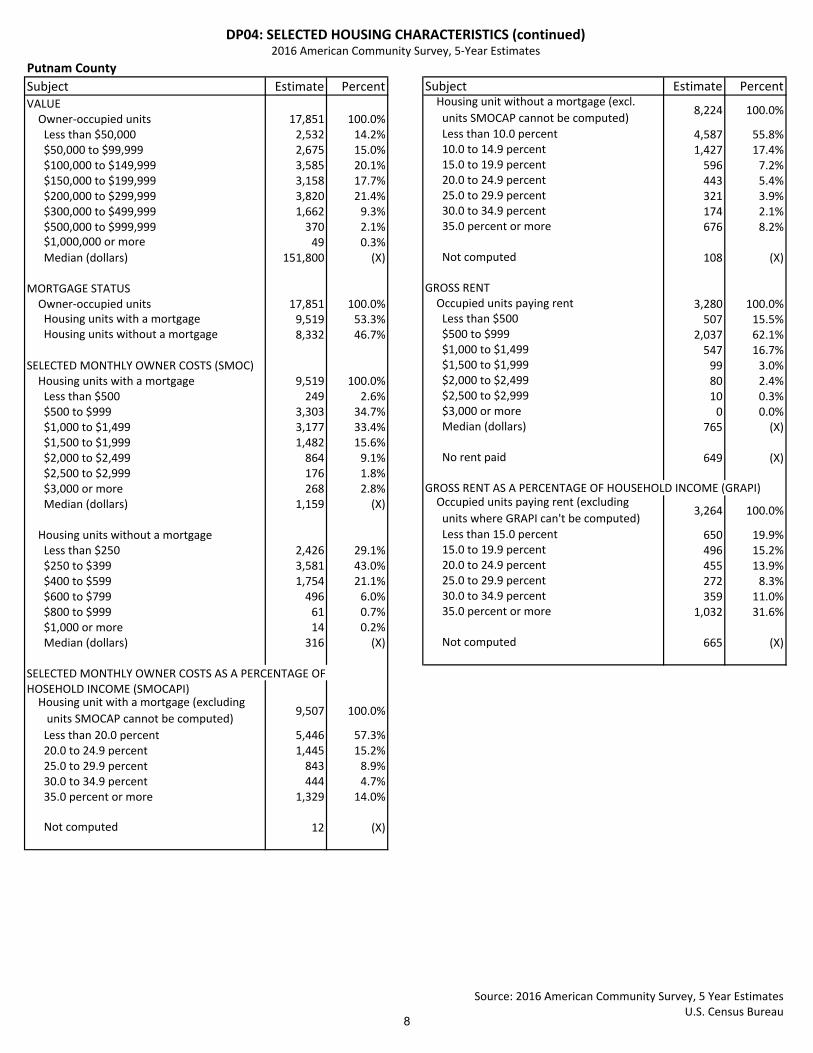
Subject Estimate Percent Subject Estimate PercentVALUE Owner‐occupied units 17,851 100.0% Less than $50,000 2,532 14.2% Less than 10.0 percent 4,587 55.8% $50,000 to $99,999 2,675 15.0% 10.0 to 14.9 percent 1,427 17.4% $100,000 to $149,999 3,585 20.1% 15.0 to 19.9 percent 596 7.2% $150,000 to $199,999 3,158 17.7% 20.0 to 24.9 percent 443 5.4% $200,000 to $299,999 3,820 21.4% 25.0 to 29.9 percent 321 3.9% $300,000 to $499,999 1,662 9.3% 30.0 to 34.9 percent 174 2.1% $500,000 to $999,999 370 2.1% 35.0 percent or more 676 8.2% $1,000,000 or more 49 0.3% Median (dollars) 151,800 (X) Not computed 108 (X)
MORTGAGE STATUS GROSS RENT
Owner‐occupied units 17,851 100.0% Occupied units paying rent 3,280 100.0% Housing units with a mortgage 9,519 53.3% Less than $500 507 15.5% Housing units without a mortgage 8,332 46.7% $500 to $999 2,037 62.1%
$1,000 to $1,499 547 16.7%SELECTED MONTHLY OWNER COSTS (SMOC) $1,500 to $1,999 99 3.0% Housing units with a mortgage 9,519 100.0% $2,000 to $2,499 80 2.4% Less than $500 249 2.6% $2,500 to $2,999 10 0.3% $500 to $999 3,303 34.7% $3,000 or more 0 0.0% $1,000 to $1,499 3,177 33.4% Median (dollars) 765 (X) $1,500 to $1,999 1,482 15.6% $2,000 to $2,499 864 9.1% No rent paid 649 (X) $2,500 to $2,999 176 1.8% $3,000 or more 268 2.8% GROSS RENT AS A PERCENTAGE OF HOUSEHOLD INCOME (GRAPI)
Median (dollars) 1,159 (X)
Housing units without a mortgage Less than 15.0 percent 650 19.9% Less than $250 2,426 29.1% 15.0 to 19.9 percent 496 15.2% $250 to $399 3,581 43.0% 20.0 to 24.9 percent 455 13.9% $400 to $599 1,754 21.1% 25.0 to 29.9 percent 272 8.3% $600 to $799 496 6.0% 30.0 to 34.9 percent 359 11.0% $800 to $999 61 0.7% 35.0 percent or more 1,032 31.6% $1,000 or more 14 0.2% Median (dollars) 316 (X) Not computed 665 (X)
SELECTED MONTHLY OWNER COSTS AS A PERCENTAGE OF HOSEHOLD INCOME (SMOCAPI)
Less than 20.0 percent 5,446 57.3% 20.0 to 24.9 percent 1,445 15.2% 25.0 to 29.9 percent 843 8.9% 30.0 to 34.9 percent 444 4.7% 35.0 percent or more 1,329 14.0%
Not computed 12 (X)
Source: 2016 American Community Survey, 5 Year EstimatesU.S. Census Bureau
8,224 100.0% Housing unit without a mortgage (excl.
units SMOCAP cannot be computed)
Occupied units paying rent (excluding
units where GRAPI can't be computed)3,264 100.0%
Housing unit with a mortgage (excluding
units SMOCAP cannot be computed)9,507 100.0%
DP04: SELECTED HOUSING CHARACTERISTICS (continued)2016 American Community Survey, 5‐Year Estimates
8
Putnam County
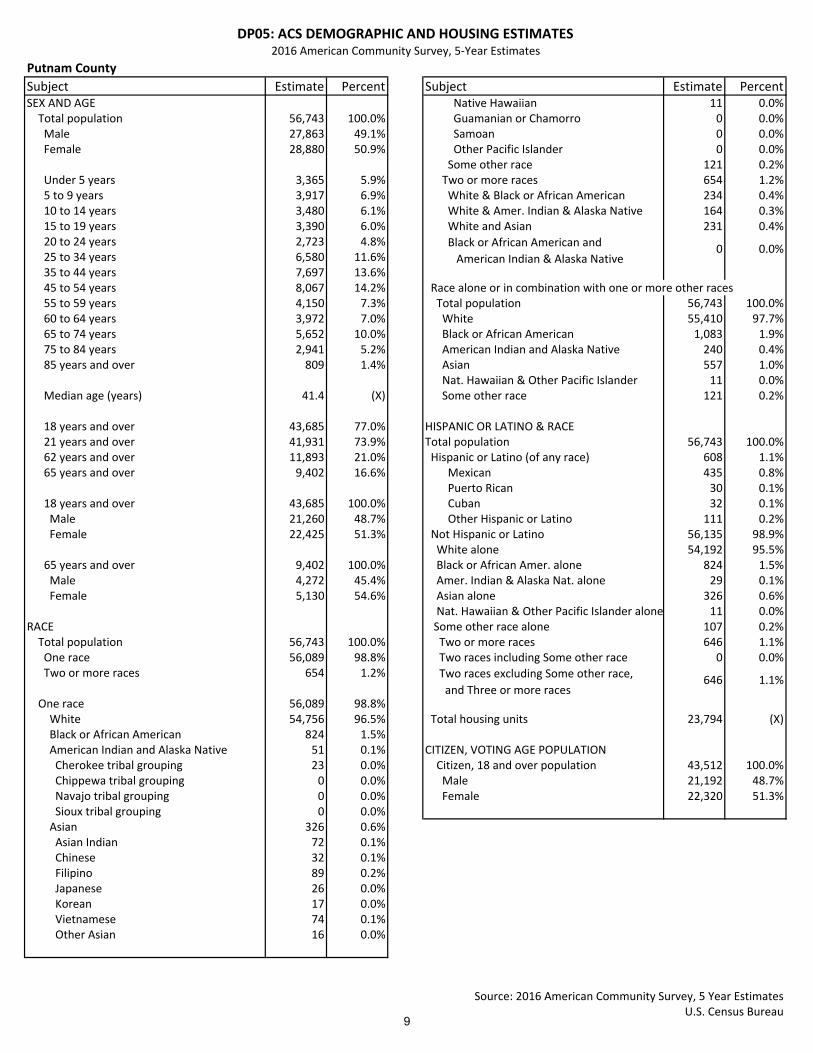
Subject Estimate Percent Subject Estimate PercentSEX AND AGE Native Hawaiian 11 0.0% Total population 56,743 100.0% Guamanian or Chamorro 0 0.0% Male 27,863 49.1% Samoan 0 0.0% Female 28,880 50.9% Other Pacific Islander 0 0.0%
Some other race 121 0.2% Under 5 years 3,365 5.9% Two or more races 654 1.2% 5 to 9 years 3,917 6.9% White & Black or African American 234 0.4% 10 to 14 years 3,480 6.1% White & Amer. Indian & Alaska Native 164 0.3% 15 to 19 years 3,390 6.0% White and Asian 231 0.4% 20 to 24 years 2,723 4.8% 25 to 34 years 6,580 11.6% 35 to 44 years 7,697 13.6% 45 to 54 years 8,067 14.2% Race alone or in combination with one or more other races 55 to 59 years 4,150 7.3% Total population 56,743 100.0% 60 to 64 years 3,972 7.0% White 55,410 97.7% 65 to 74 years 5,652 10.0% Black or African American 1,083 1.9% 75 to 84 years 2,941 5.2% American Indian and Alaska Native 240 0.4% 85 years and over 809 1.4% Asian 557 1.0%
Nat. Hawaiian & Other Pacific Islander 11 0.0% Median age (years) 41.4 (X) Some other race 121 0.2%
18 years and over 43,685 77.0% HISPANIC OR LATINO & RACE 21 years and over 41,931 73.9% Total population 56,743 100.0% 62 years and over 11,893 21.0% Hispanic or Latino (of any race) 608 1.1% 65 years and over 9,402 16.6% Mexican 435 0.8%
Puerto Rican 30 0.1% 18 years and over 43,685 100.0% Cuban 32 0.1% Male 21,260 48.7% Other Hispanic or Latino 111 0.2% Female 22,425 51.3% Not Hispanic or Latino 56,135 98.9%
White alone 54,192 95.5% 65 years and over 9,402 100.0% Black or African Amer. alone 824 1.5% Male 4,272 45.4% Amer. Indian & Alaska Nat. alone 29 0.1% Female 5,130 54.6% Asian alone 326 0.6%
Nat. Hawaiian & Other Pacific Islander alone 11 0.0%RACE Some other race alone 107 0.2% Total population 56,743 100.0% Two or more races 646 1.1% One race 56,089 98.8% Two races including Some other race 0 0.0% Two or more races 654 1.2%
One race 56,089 98.8% White 54,756 96.5% Total housing units 23,794 (X) Black or African American 824 1.5% American Indian and Alaska Native 51 0.1% CITIZEN, VOTING AGE POPULATION Cherokee tribal grouping 23 0.0% Citizen, 18 and over population 43,512 100.0% Chippewa tribal grouping 0 0.0% Male 21,192 48.7% Navajo tribal grouping 0 0.0% Female 22,320 51.3% Sioux tribal grouping 0 0.0% Asian 326 0.6% Asian Indian 72 0.1% Chinese 32 0.1% Filipino 89 0.2% Japanese 26 0.0% Korean 17 0.0% Vietnamese 74 0.1% Other Asian 16 0.0%
Source: 2016 American Community Survey, 5 Year EstimatesU.S. Census Bureau
Two races excluding Some other race,
and Three or more races646 1.1%
DP05: ACS DEMOGRAPHIC AND HOUSING ESTIMATES2016 American Community Survey, 5‐Year Estimates
Black or African American and
American Indian & Alaska Native0 0.0%
9

West Virginia UniversityBureau of Business and Economic Research
Labor Force Statistics
Putnam County, West Virginia, and the United StatesPutnam County 1991 1992 1993 1994 1995 1996 1997 1998 1999 2000 2001 2002 2003
Civilian Labor Force 21,095 21,678 22,627 23,512 23,991 24,810 25,544 26,236 27,397 26,217 26,243 26,113 25,740Employment 19,258 19,662 20,841 21,958 22,670 23,489 24,352 25,013 26,147 24,958 25,146 24,815 24,436Unemployment 1,837 2,016 1,786 1,554 1,321 1,321 1,192 1,223 1,250 1,259 1,097 1,298 1,304Unemployment Rate 8.7 9.3 7.9 6.6 5.5 5.3 4.7 4.7 4.6 4.8 4.2 5.0 5.1
Putnam County 2004 2005 2006 2007 2008 2009 2010 2011 2012 2013 2014 2015 2016Civilian Labor Force 26,080 26,468 27,138 27,468 27,977 27,921 26,390 26,290 26,373 25,947 25,922 25,562 25,593Employment 24,865 25,260 26,023 26,446 27,059 26,229 24,389 24,366 24,679 24,478 24,477 24,127 24,359Unemployment 1,215 1,208 1,115 1,022 918 1,692 2,001 1,924 1,694 1,469 1,445 1,435 1,234Unemployment Rate 4.7 4.6 4.1 3.7 3.3 6.1 7.6 7.3 6.4 5.7 5.6 5.6 4.8
West Virginia 1991 1992 1993 1994 1995 1996 1997 1998 1999 2000 2001 2002 2003Civilian Labor Force 776,738 778,882 779,810 782,507 784,567 795,409 796,507 795,145 804,343 809,063 809,128 799,998 786,552Employment 694,101 690,770 697,021 713,372 722,870 735,701 741,865 742,528 752,379 764,711 768,661 752,548 738,990Unemployment 82,637 88,112 82,789 69,135 61,697 59,708 54,642 52,617 51,964 44,352 40,467 47,450 47,562Unemployment Rate 10.6 11.3 10.6 8.8 7.9 7.5 6.9 6.6 6.5 5.5 5.0 5.9 6.0
West Virginia 2004 2005 2006 2007 2008 2009 2010 2011 2012 2013 2014 2015 2016Civilian Labor Force 783,658 790,982 806,168 811,160 812,905 814,027 811,125 807,021 807,917 798,173 788,956 783,223 783,470Employment 741,890 750,561 766,399 773,990 777,560 751,165 740,910 741,972 747,384 744,200 736,506 730,304 736,427Unemployment 41,768 40,421 39,769 37,170 35,345 62,862 70,215 65,049 60,533 53,973 52,450 52,919 47,043Unemployment Rate 5.3 5.1 4.9 4.6 4.3 7.7 8.7 8.1 7.5 6.8 6.6 6.8 6.0
United States 1991 1992 1993 1994 1995 1996 1997 1998 1999 2000 2001 2002 2003Civilian LF ('000) 126,346 128,105 129,200 131,056 132,304 133,943 136,297 137,673 139,368 142,583 143,734 144,863 146,510Employment ('000) 117,718 118,492 120,259 123,060 124,900 126,708 129,558 131,463 133,488 136,891 136,933 136,485 137,736Unemployment ('000) 8,628 9,613 8,940 7,996 7,404 7,236 6,739 6,210 5,880 5,692 6,801 8,378 8,774Unemployment Rate 6.8 7.5 6.9 6.1 5.6 5.4 4.9 4.5 4.2 4.0 4.7 5.8 6.0
United States 2004 2005 2006 2007 2008 2009 2010 2011 2012 2013 2014 2015 2016Civilian LF ('000) 147,401 149,320 151,428 153,124 154,287 154,142 153,889 153,617 154,975 155,389 155,922 157,130 159,187Employment ('000) 139,252 141,730 144,427 146,047 145,362 139,877 139,064 139,869 142,469 143,929 146,305 148,834 151,436Unemployment ('000) 8,149 7,591 7,001 7,078 8,924 14,265 14,825 13,747 12,506 11,460 9,617 8,296 7,751Unemployment Rate 5.5 5.1 4.6 4.6 5.8 9.3 9.6 8.9 8.1 7.4 6.2 5.3 4.9
Source: U.S. Bureau of Labor Statistics10
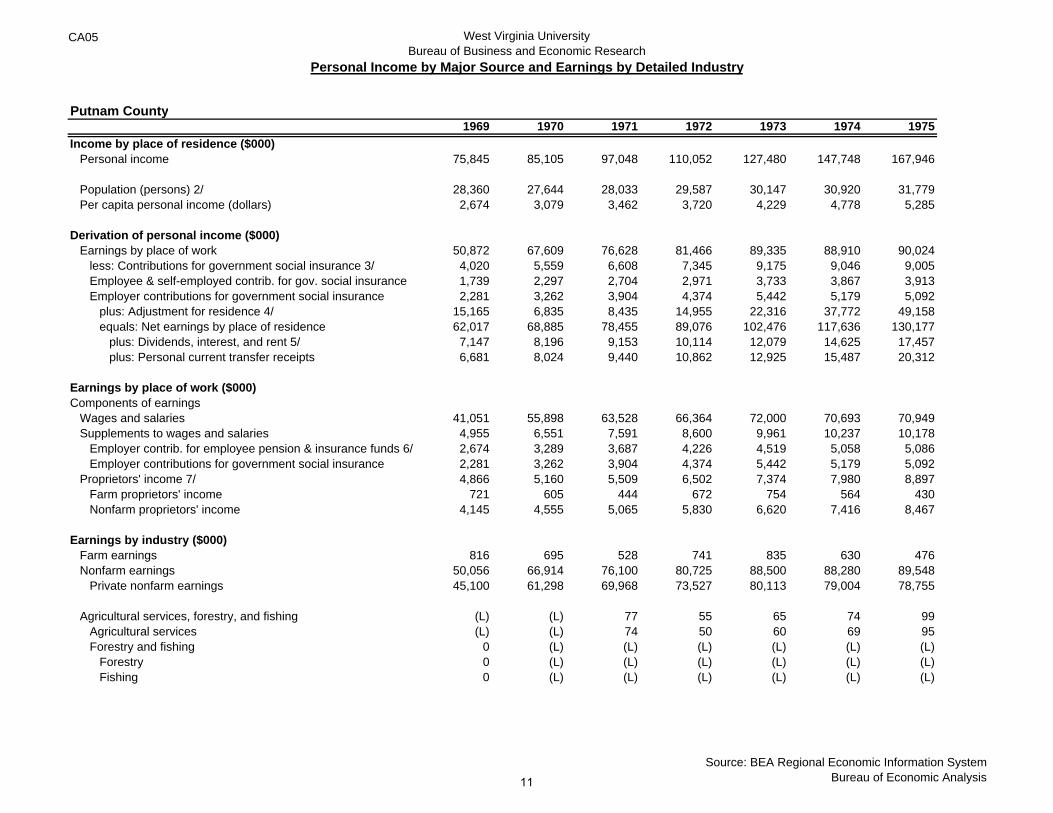
CA05 West Virginia UniversityBureau of Business and Economic Research
Personal Income by Major Source and Earnings by Detailed Industry
Putnam County1969 1970 1971 1972 1973 1974 1975
Income by place of residence ($000)Personal income 75,845 85,105 97,048 110,052 127,480 147,748 167,946
Population (persons) 2/ 28,360 27,644 28,033 29,587 30,147 30,920 31,779Per capita personal income (dollars) 2,674 3,079 3,462 3,720 4,229 4,778 5,285
Derivation of personal income ($000)Earnings by place of work 50,872 67,609 76,628 81,466 89,335 88,910 90,024
less: Contributions for government social insurance 3/ 4,020 5,559 6,608 7,345 9,175 9,046 9,005Employee & self-employed contrib. for gov. social insurance 1,739 2,297 2,704 2,971 3,733 3,867 3,913Employer contributions for government social insurance 2,281 3,262 3,904 4,374 5,442 5,179 5,092
plus: Adjustment for residence 4/ 15,165 6,835 8,435 14,955 22,316 37,772 49,158equals: Net earnings by place of residence 62,017 68,885 78,455 89,076 102,476 117,636 130,177
plus: Dividends, interest, and rent 5/ 7,147 8,196 9,153 10,114 12,079 14,625 17,457plus: Personal current transfer receipts 6,681 8,024 9,440 10,862 12,925 15,487 20,312
Earnings by place of work ($000)Components of earnings
Wages and salaries 41,051 55,898 63,528 66,364 72,000 70,693 70,949Supplements to wages and salaries 4,955 6,551 7,591 8,600 9,961 10,237 10,178
Employer contrib. for employee pension & insurance funds 6/ 2,674 3,289 3,687 4,226 4,519 5,058 5,086Employer contributions for government social insurance 2,281 3,262 3,904 4,374 5,442 5,179 5,092
Proprietors' income 7/ 4,866 5,160 5,509 6,502 7,374 7,980 8,897Farm proprietors' income 721 605 444 672 754 564 430Nonfarm proprietors' income 4,145 4,555 5,065 5,830 6,620 7,416 8,467
Earnings by industry ($000)Farm earnings 816 695 528 741 835 630 476Nonfarm earnings 50,056 66,914 76,100 80,725 88,500 88,280 89,548
Private nonfarm earnings 45,100 61,298 69,968 73,527 80,113 79,004 78,755
Agricultural services, forestry, and fishing (L) (L) 77 55 65 74 99Agricultural services (L) (L) 74 50 60 69 95Forestry and fishing 0 (L) (L) (L) (L) (L) (L)
Forestry 0 (L) (L) (L) (L) (L) (L)Fishing 0 (L) (L) (L) (L) (L) (L)
Source: BEA Regional Economic Information SystemBureau of Economic Analysis11

CA05 West Virginia UniversityBureau of Business and Economic Research
Personal Income by Major Source and Earnings by Detailed Industry
Putnam County1969 1970 1971 1972 1973 1974 1975
Mining 166 130 138 172 264 325 501Metal mining 0 0 0 0 0 0 0Coal mining 0 0 0 0 0 0 0Oil and gas extraction (D) (D) (D) (D) (D) (D) (D)Nonmetallic minerals, except fuels (D) (D) (D) (D) (D) (D) (D)
Construction 12,595 26,710 31,352 29,535 27,889 15,439 14,832General building contractors 3,579 4,681 4,781 4,655 3,774 3,812 4,790Heavy construction contractors 2,328 6,977 5,054 2,196 1,998 1,620 1,655Special trade contractors 6,688 15,052 21,517 22,684 22,117 10,007 8,387
Manufacturing 21,926 22,922 23,585 26,954 29,975 33,454 29,789Durable goods manufacturing 1,703 2,400 3,229 4,294 4,697 4,921 5,891
Lumber and wood products 251 294 345 270 290 271 0Furniture and fixtures 0 0 0 0 0 0 0Stone, clay, and glass products (D) (D) (D) (D) (D) (D) (D)Primary metal industries 0 0 0 0 0 0 0Fabricated metal products 580 816 999 1,517 1,948 2,100 2,955Industrial machinery and equipment (D) (D) (D) (D) (D) (D) (D)Electronic and other electric equipment (D) (D) (D) (D) (D) (D) (D)Motor vehicles and equipment 0 0 0 0 0 0 0Other transportation equipment (D) (D) (D) (D) (D) (D) (D)Instruments and related products 0 0 0 0 0 0 0Miscellaneous manufacturing industries 0 0 0 0 0 0 0Ordnance 8/ 0 0 0 0 0 0 (NA)
Nondurable goods manufacturing 20,223 20,522 20,356 22,660 25,278 28,533 23,898Food and kindred products (D) (D) (D) (D) (D) (D) (D)Tobacco products 0 0 0 0 0 0 0Textile mill products 0 0 0 0 0 0 0Apparel and other textile products 0 0 0 0 0 0 0Paper and allied products (D) (D) (D) (D) (D) (D) (D)Printing and publishing (L) (L) (L) (L) 83 138 126Chemicals and allied products 20,107 20,388 20,178 22,458 25,010 28,236 23,667Petroleum and coal products 0 0 0 0 0 0 0Rubber and miscellaneous plastics products 0 0 0 0 0 0 0Leather and leather products 0 0 0 0 0 0 0
Source: BEA Regional Economic Information SystemBureau of Economic Analysis12

CA05 West Virginia UniversityBureau of Business and Economic Research
Personal Income by Major Source and Earnings by Detailed Industry
Putnam County1969 1970 1971 1972 1973 1974 1975
Transportation and public utilities 3,239 3,125 5,163 5,968 7,010 12,123 11,259Railroad transportation 539 563 574 619 682 742 709Trucking and warehousing 1,796 1,083 1,319 1,340 1,367 4,136 3,621Water transportation (D) (D) (D) (D) (D) (D) (D)Other transportation (L) 50 (L) 78 91 156 148
Local and interurban passenger transit 0 0 0 0 0 0 0Transportation by air 0 0 0 0 0 0 0Pipelines, except natural gas 0 0 0 0 0 0 0Transportation services (L) 50 (L) 78 91 156 148
Communications (L) (L) 70 127 98 111 69Electric, gas, and sanitary services (D) (D) (D) (D) (D) (D) (D)
Wholesale trade 433 995 1,875 2,242 4,698 5,363 8,105Retail trade 3,379 3,778 4,064 4,618 6,045 7,000 8,182
Building materials and garden equipment 545 332 389 514 620 576 604General merchandise stores (D) (D) (D) (D) (D) (D) (D)Food stores (D) (D) (D) (D) (D) (D) (D)Automotive dealers and service stations 1,201 1,387 1,387 1,491 2,334 2,649 2,881Apparel and accessory stores 58 52 56 69 90 146 176Home furniture and furnishings stores (L) 86 122 222 344 344 541Eating and drinking places 640 721 961 812 716 699 800Miscellaneous retail 115 240 319 411 469 630 941
Finance, insurance, and real estate 553 535 579 880 703 1,099 1,559Depository and nondepository institutions 224 240 279 330 313 394 553Other finance, insurance, and real estate 329 295 300 550 390 705 1,006
Security and commodity brokers (L) (L) (L) (L) (L) (L) (L)Insurance carriers (D) (D) (D) (D) (D) (D) (D)Insurance agents, brokers, and services 192 205 218 294 212 195 255Real estate 95 58 (L) 199 96 75 (L)Combined real estate, insurance, etc. 9/ (D) (D) (D) (D) (D) (D) (D)Holding and other investment offices 0 0 0 0 0 309 605
Services 2,774 3,062 3,135 3,103 3,464 4,127 4,429Hotels and other lodging places (D) (D) (D) (D) (D) (D) (D)Personal services 652 678 867 657 678 787 843Private households 357 332 310 292 279 247 228Business services 101 136 144 153 220 550 285Automotive repair, services, and parking 98 162 216 330 327 303 334
Source: BEA Regional Economic Information SystemBureau of Economic Analysis13
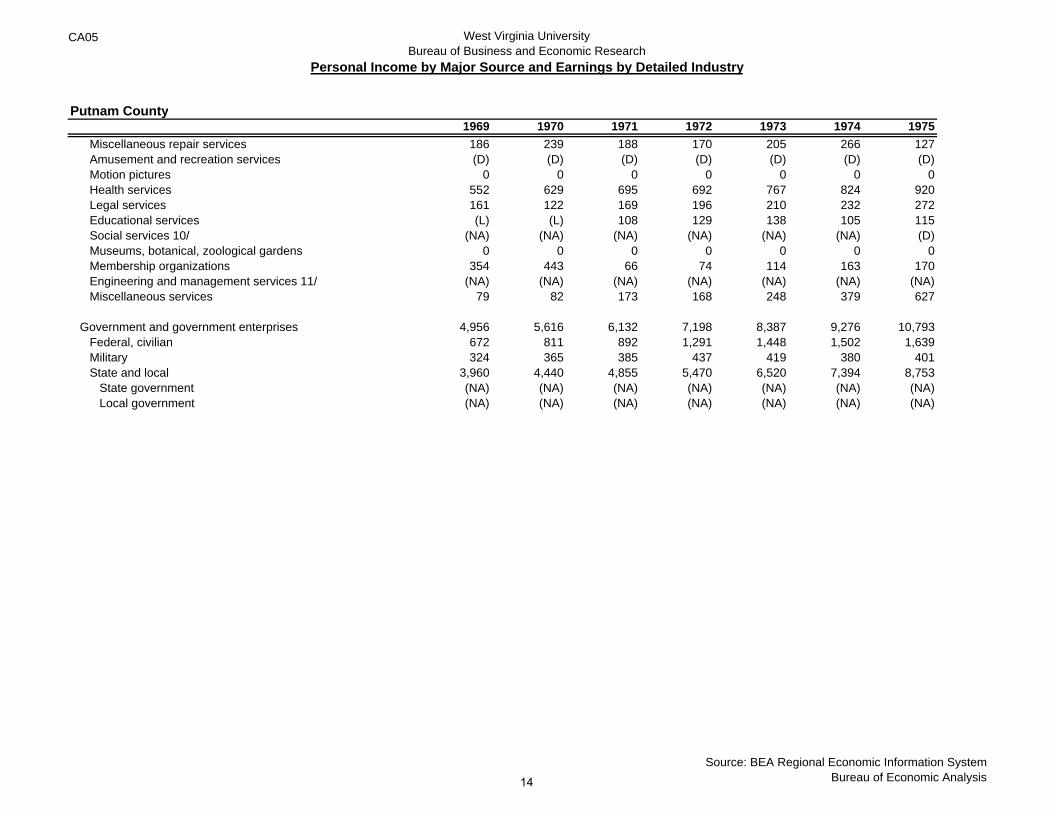
CA05 West Virginia UniversityBureau of Business and Economic Research
Personal Income by Major Source and Earnings by Detailed Industry
Putnam County1969 1970 1971 1972 1973 1974 1975
Miscellaneous repair services 186 239 188 170 205 266 127Amusement and recreation services (D) (D) (D) (D) (D) (D) (D)Motion pictures 0 0 0 0 0 0 0Health services 552 629 695 692 767 824 920Legal services 161 122 169 196 210 232 272Educational services (L) (L) 108 129 138 105 115Social services 10/ (NA) (NA) (NA) (NA) (NA) (NA) (D)Museums, botanical, zoological gardens 0 0 0 0 0 0 0Membership organizations 354 443 66 74 114 163 170Engineering and management services 11/ (NA) (NA) (NA) (NA) (NA) (NA) (NA)Miscellaneous services 79 82 173 168 248 379 627
Government and government enterprises 4,956 5,616 6,132 7,198 8,387 9,276 10,793Federal, civilian 672 811 892 1,291 1,448 1,502 1,639Military 324 365 385 437 419 380 401State and local 3,960 4,440 4,855 5,470 6,520 7,394 8,753
State government (NA) (NA) (NA) (NA) (NA) (NA) (NA)Local government (NA) (NA) (NA) (NA) (NA) (NA) (NA)
Source: BEA Regional Economic Information SystemBureau of Economic Analysis14

CA05 West Virginia UniversityBureau of Business and Economic Research
Personal Income by Major Source and Earnings by Detailed Industry
Putnam County
Income by place of residence ($000)Personal income
Population (persons) 2/Per capita personal income (dollars)
Derivation of personal income ($000)Earnings by place of work
less: Contributions for government social insurance 3/Employee & self-employed contrib. for gov. social insuranceEmployer contributions for government social insurance
plus: Adjustment for residence 4/equals: Net earnings by place of residence
plus: Dividends, interest, and rent 5/plus: Personal current transfer receipts
Earnings by place of work ($000)Components of earnings
Wages and salariesSupplements to wages and salaries
Employer contrib. for employee pension & insurance funds 6/Employer contributions for government social insurance
Proprietors' income 7/Farm proprietors' incomeNonfarm proprietors' income
Earnings by industry ($000)Farm earningsNonfarm earnings
Private nonfarm earnings
Agricultural services, forestry, and fishingAgricultural servicesForestry and fishing
ForestryFishing
1976 1977 1978 1979 1980 1981 1982
193,786 226,095 245,334 282,111 321,827 356,550 384,604
33,021 34,319 35,117 36,511 38,252 38,499 38,9385,869 6,588 6,986 7,727 8,413 9,261 9,877
106,202 127,934 119,331 131,542 145,316 168,535 182,44311,005 13,296 12,695 14,387 16,047 19,920 22,2754,604 5,431 5,168 5,964 6,735 8,513 9,5216,401 7,865 7,527 8,423 9,312 11,407 12,754
57,849 66,331 87,766 105,412 113,266 114,832 120,696153,046 180,969 194,402 222,567 242,535 263,447 280,86419,363 22,205 25,358 29,743 37,604 46,393 52,80621,377 22,921 25,574 29,801 41,688 46,710 50,934
84,092 102,300 93,716 103,224 115,012 135,229 147,38312,169 15,670 14,397 16,528 18,593 22,092 24,8485,768 7,805 6,870 8,105 9,281 10,685 12,0946,401 7,865 7,527 8,423 9,312 11,407 12,7549,941 9,964 11,218 11,790 11,711 11,214 10,212
324 -62 -182 -12 -164 -980 -1,6329,617 10,026 11,400 11,802 11,875 12,194 11,844
389 -4 -99 122 18 -764 -1,349105,813 127,938 119,430 131,420 145,298 169,299 183,79293,112 112,341 102,246 111,877 123,985 144,351 156,378
131 176 254 202 261 395 504124 169 235 183 244 395 496(L) (L) (L) (L) (L) 0 (L)(L) 0 0 0 0 0 0(L) (L) (L) (L) (L) 0 (L)
Source: BEA Regional Economic Information SystemBureau of Economic Analysis15

CA05 West Virginia UniversityBureau of Business and Economic Research
Personal Income by Major Source and Earnings by Detailed Industry
Putnam County
MiningMetal miningCoal miningOil and gas extractionNonmetallic minerals, except fuels
ConstructionGeneral building contractorsHeavy construction contractorsSpecial trade contractors
ManufacturingDurable goods manufacturing
Lumber and wood productsFurniture and fixturesStone, clay, and glass productsPrimary metal industriesFabricated metal productsIndustrial machinery and equipmentElectronic and other electric equipmentMotor vehicles and equipmentOther transportation equipmentInstruments and related productsMiscellaneous manufacturing industriesOrdnance 8/
Nondurable goods manufacturingFood and kindred productsTobacco productsTextile mill productsApparel and other textile productsPaper and allied productsPrinting and publishingChemicals and allied productsPetroleum and coal productsRubber and miscellaneous plastics productsLeather and leather products
1976 1977 1978 1979 1980 1981 1982566 578 486 345 624 1,784 941
0 0 0 0 0 0 00 0 0 0 0 0 (D)
(D) (D) (D) (D) (D) (D) 836(D) (D) (D) (D) (D) (D) (D)
20,148 27,367 22,136 19,186 15,197 11,781 14,1273,141 3,650 4,130 4,311 4,034 3,334 3,0201,691 1,026 1,597 1,876 2,626 1,303 1,327
15,316 22,691 16,409 12,999 8,537 7,144 9,780
31,565 37,668 25,925 29,246 34,152 41,275 44,4805,781 3,680 4,274 5,973 9,765 9,297 8,743
0 0 0 0 178 126 760 0 0 0 0 0 0
(D) (D) (D) (D) (D) (D) (D)0 0 0 0 0 0 0
3,377 1,010 1,353 1,997 4,882 5,146 4,306(D) (D) (D) (D) (D) (D) (D)(D) (D) (D) (D) (D) (D) (D)
0 0 0 0 0 0 (D)(D) (D) (D) (D) (D) (D) (D)
0 0 0 (L) 0 0 00 0 (L) (L) 0 0 0
(NA) (NA) (NA) (NA) (NA) (NA) (NA)
25,784 33,988 21,651 23,273 24,387 31,978 35,737(D) (D) (D) (D) (D) (D) (D)
0 0 0 0 0 0 00 0 0 0 0 0 00 0 0 0 0 0 0
(D) (D) (D) (D) (D) (D) (D)170 315 422 527 342 386 276
25,441 33,442 20,932 22,419 23,688 29,685 31,8780 0 0 0 0 0 1230 0 0 0 0 (L) 00 0 0 0 0 0 0
Source: BEA Regional Economic Information SystemBureau of Economic Analysis16

CA05 West Virginia UniversityBureau of Business and Economic Research
Personal Income by Major Source and Earnings by Detailed Industry
Putnam County
Transportation and public utilitiesRailroad transportationTrucking and warehousingWater transportationOther transportation
Local and interurban passenger transitTransportation by airPipelines, except natural gasTransportation services
CommunicationsElectric, gas, and sanitary services
Wholesale tradeRetail trade
Building materials and garden equipmentGeneral merchandise storesFood storesAutomotive dealers and service stationsApparel and accessory storesHome furniture and furnishings storesEating and drinking placesMiscellaneous retail
Finance, insurance, and real estateDepository and nondepository institutionsOther finance, insurance, and real estate
Security and commodity brokersInsurance carriersInsurance agents, brokers, and servicesReal estateCombined real estate, insurance, etc. 9/Holding and other investment offices
ServicesHotels and other lodging placesPersonal servicesPrivate householdsBusiness servicesAutomotive repair, services, and parking
1976 1977 1978 1979 1980 1981 198215,792 18,376 20,998 27,397 29,014 32,867 33,985
834 918 1,052 1,261 1,662 1,980 2,2864,659 5,048 6,049 8,369 7,440 8,314 6,886
(D) (D) (D) (D) (D) (D) (D)173 371 354 315 85 65 84
0 0 0 0 0 0 00 0 (L) (L) (L) (L) 00 0 0 0 0 0 0
173 371 356 316 84 66 84(L) 182 410 518 632 816 1,289(D) (D) (D) (D) (D) (D) (D)
7,771 8,802 10,306 11,777 14,125 17,944 20,6929,202 10,182 11,842 13,649 19,269 21,947 24,642
613 706 906 1,230 1,332 1,354 1,307(D) (D) (D) (D) (D) (D) 8,784(D) (D) (D) (D) (D) (D) 3,863
3,187 3,502 4,142 4,607 4,260 4,225 4,000197 225 223 238 238 327 233607 505 511 514 493 500 592947 1,340 1,592 1,925 2,479 3,466 4,270
1,109 1,176 1,255 1,388 1,333 1,643 1,593
2,104 2,587 2,931 2,226 2,144 2,071 1,887632 791 890 1,029 1,168 1,280 1,459
1,472 1,796 2,041 1,197 976 791 4280 0 (L) 0 0 (L) (D)
(D) (D) (D) (D) (D) (D) 199335 339 365 323 368 397 403267 462 673 694 452 228 -175(D) (D) (D) (D) (D) (D) (D)741 813 827 0 0 (L) 0
5,833 6,605 7,368 7,849 9,199 14,287 15,120(D) (D) (D) (D) (D) (D) (D)990 1,012 1,077 1,081 1,341 1,463 1,548242 242 244 218 212 208 202458 612 681 701 802 880 1,001359 350 459 398 605 591 578
Source: BEA Regional Economic Information SystemBureau of Economic Analysis17

CA05 West Virginia UniversityBureau of Business and Economic Research
Personal Income by Major Source and Earnings by Detailed Industry
Putnam County
Miscellaneous repair servicesAmusement and recreation servicesMotion picturesHealth servicesLegal servicesEducational servicesSocial services 10/Museums, botanical, zoological gardensMembership organizationsEngineering and management services 11/Miscellaneous services
Government and government enterprisesFederal, civilianMilitaryState and local
State governmentLocal government
1976 1977 1978 1979 1980 1981 1982178 363 391 436 506 617 600(D) (D) (D) (D) (D) (D) (D)
0 0 0 0 0 0 01,057 1,359 1,544 1,634 1,837 2,267 3,508
288 331 388 455 431 422 42399 109 119 128 127 137 122
(D) (D) (D) (D) (D) (D) 2170 0 0 0 0 0 0
399 621 896 1,107 1,400 1,554 1,457(NA) (NA) (NA) (NA) (NA) (NA) (NA)
1,173 917 709 861 1,097 5,197 4,615
12,701 15,597 17,184 19,543 21,313 24,948 27,4141,800 2,548 2,575 2,953 3,163 3,407 3,355
423 472 501 529 501 595 73910,478 12,577 14,108 16,061 17,649 20,946 23,320
(NA) (NA) (NA) 2,428 2,210 2,433 2,489(NA) (NA) (NA) 13,633 15,439 18,513 20,831
Source: BEA Regional Economic Information SystemBureau of Economic Analysis18
CA05 West Virginia UniversityBureau of Business and Economic Research
Personal Income by Major Source and Earnings by Detailed Industry
Putnam County
Income by place of residence ($000)Personal income
Population (persons) 2/Per capita personal income (dollars)
Derivation of personal income ($000)Earnings by place of work
less: Contributions for government social insurance 3/Employee & self-employed contrib. for gov. social insuranceEmployer contributions for government social insurance
plus: Adjustment for residence 4/equals: Net earnings by place of residence
plus: Dividends, interest, and rent 5/plus: Personal current transfer receipts
Earnings by place of work ($000)Components of earnings
Wages and salariesSupplements to wages and salaries
Employer contrib. for employee pension & insurance funds 6/Employer contributions for government social insurance
Proprietors' income 7/Farm proprietors' incomeNonfarm proprietors' income
Earnings by industry ($000)Farm earningsNonfarm earnings
Private nonfarm earnings
Agricultural services, forestry, and fishingAgricultural servicesForestry and fishing
ForestryFishing
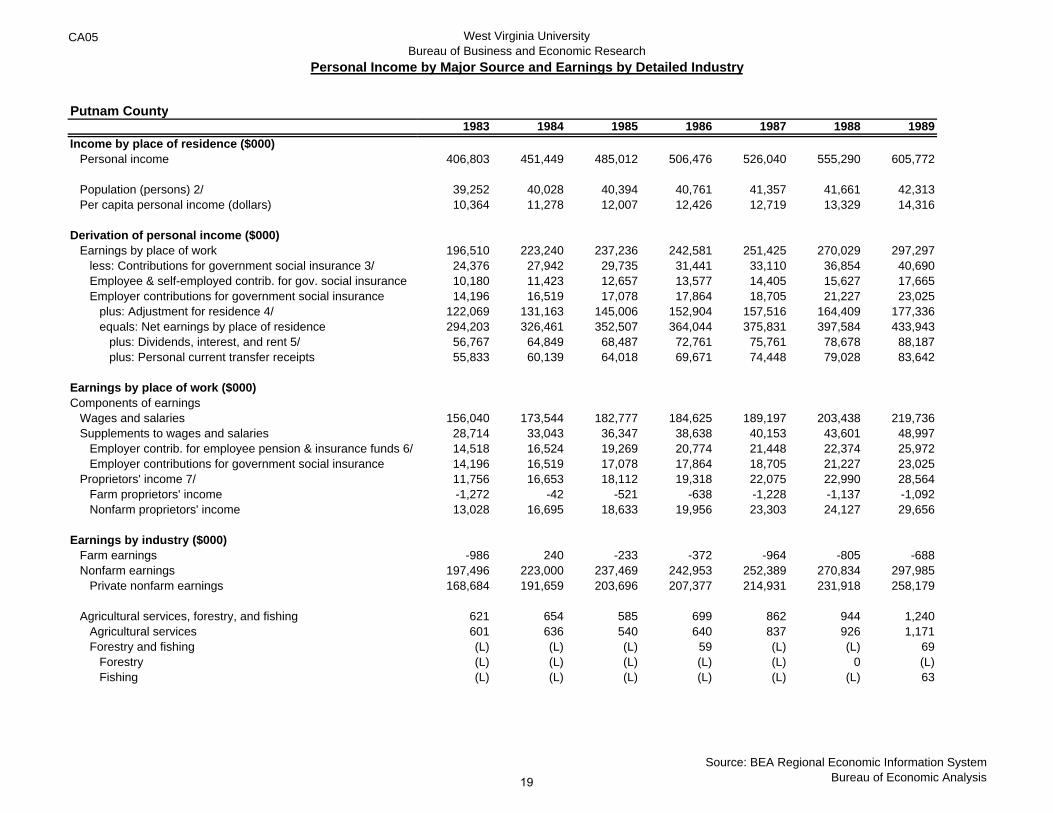
1983 1984 1985 1986 1987 1988 1989
406,803 451,449 485,012 506,476 526,040 555,290 605,772
39,252 40,028 40,394 40,761 41,357 41,661 42,31310,364 11,278 12,007 12,426 12,719 13,329 14,316
196,510 223,240 237,236 242,581 251,425 270,029 297,29724,376 27,942 29,735 31,441 33,110 36,854 40,69010,180 11,423 12,657 13,577 14,405 15,627 17,66514,196 16,519 17,078 17,864 18,705 21,227 23,025
122,069 131,163 145,006 152,904 157,516 164,409 177,336294,203 326,461 352,507 364,044 375,831 397,584 433,94356,767 64,849 68,487 72,761 75,761 78,678 88,18755,833 60,139 64,018 69,671 74,448 79,028 83,642
156,040 173,544 182,777 184,625 189,197 203,438 219,73628,714 33,043 36,347 38,638 40,153 43,601 48,99714,518 16,524 19,269 20,774 21,448 22,374 25,97214,196 16,519 17,078 17,864 18,705 21,227 23,02511,756 16,653 18,112 19,318 22,075 22,990 28,564-1,272 -42 -521 -638 -1,228 -1,137 -1,09213,028 16,695 18,633 19,956 23,303 24,127 29,656
-986 240 -233 -372 -964 -805 -688197,496 223,000 237,469 242,953 252,389 270,834 297,985168,684 191,659 203,696 207,377 214,931 231,918 258,179
621 654 585 699 862 944 1,240601 636 540 640 837 926 1,171(L) (L) (L) 59 (L) (L) 69(L) (L) (L) (L) (L) 0 (L)(L) (L) (L) (L) (L) (L) 63
Source: BEA Regional Economic Information SystemBureau of Economic Analysis19
CA05 West Virginia UniversityBureau of Business and Economic Research
Personal Income by Major Source and Earnings by Detailed Industry
Putnam County
MiningMetal miningCoal miningOil and gas extractionNonmetallic minerals, except fuels
ConstructionGeneral building contractorsHeavy construction contractorsSpecial trade contractors
ManufacturingDurable goods manufacturing
Lumber and wood productsFurniture and fixturesStone, clay, and glass productsPrimary metal industriesFabricated metal productsIndustrial machinery and equipmentElectronic and other electric equipmentMotor vehicles and equipmentOther transportation equipmentInstruments and related productsMiscellaneous manufacturing industriesOrdnance 8/
Nondurable goods manufacturingFood and kindred productsTobacco productsTextile mill productsApparel and other textile productsPaper and allied productsPrinting and publishingChemicals and allied productsPetroleum and coal productsRubber and miscellaneous plastics productsLeather and leather products
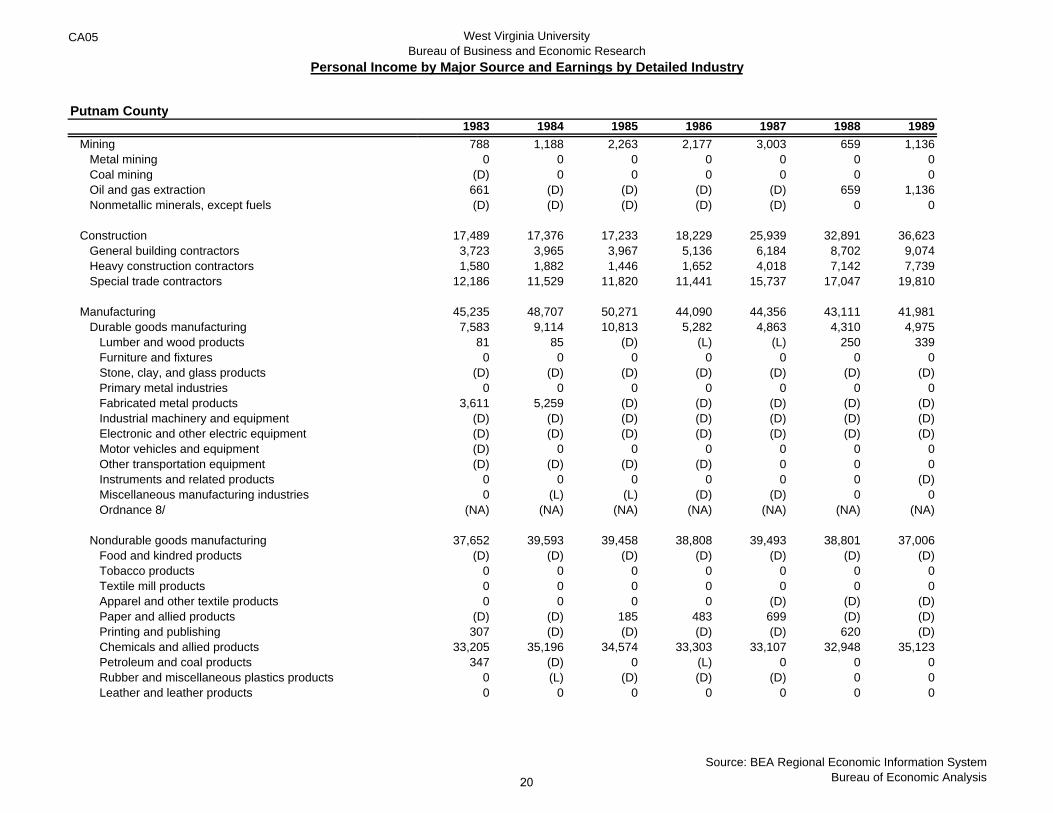
1983 1984 1985 1986 1987 1988 1989788 1,188 2,263 2,177 3,003 659 1,136
0 0 0 0 0 0 0(D) 0 0 0 0 0 0661 (D) (D) (D) (D) 659 1,136(D) (D) (D) (D) (D) 0 0
17,489 17,376 17,233 18,229 25,939 32,891 36,6233,723 3,965 3,967 5,136 6,184 8,702 9,0741,580 1,882 1,446 1,652 4,018 7,142 7,739
12,186 11,529 11,820 11,441 15,737 17,047 19,810
45,235 48,707 50,271 44,090 44,356 43,111 41,9817,583 9,114 10,813 5,282 4,863 4,310 4,975
81 85 (D) (L) (L) 250 3390 0 0 0 0 0 0
(D) (D) (D) (D) (D) (D) (D)0 0 0 0 0 0 0
3,611 5,259 (D) (D) (D) (D) (D)(D) (D) (D) (D) (D) (D) (D)(D) (D) (D) (D) (D) (D) (D)(D) 0 0 0 0 0 0(D) (D) (D) (D) 0 0 0
0 0 0 0 0 0 (D)0 (L) (L) (D) (D) 0 0
(NA) (NA) (NA) (NA) (NA) (NA) (NA)
37,652 39,593 39,458 38,808 39,493 38,801 37,006(D) (D) (D) (D) (D) (D) (D)
0 0 0 0 0 0 00 0 0 0 0 0 00 0 0 0 (D) (D) (D)
(D) (D) 185 483 699 (D) (D)307 (D) (D) (D) (D) 620 (D)
33,205 35,196 34,574 33,303 33,107 32,948 35,123347 (D) 0 (L) 0 0 0
0 (L) (D) (D) (D) 0 00 0 0 0 0 0 0
Source: BEA Regional Economic Information SystemBureau of Economic Analysis20
CA05 West Virginia UniversityBureau of Business and Economic Research
Personal Income by Major Source and Earnings by Detailed Industry
Putnam County
Transportation and public utilitiesRailroad transportationTrucking and warehousingWater transportationOther transportation
Local and interurban passenger transitTransportation by airPipelines, except natural gasTransportation services
CommunicationsElectric, gas, and sanitary services
Wholesale tradeRetail trade
Building materials and garden equipmentGeneral merchandise storesFood storesAutomotive dealers and service stationsApparel and accessory storesHome furniture and furnishings storesEating and drinking placesMiscellaneous retail
Finance, insurance, and real estateDepository and nondepository institutionsOther finance, insurance, and real estate
Security and commodity brokersInsurance carriersInsurance agents, brokers, and servicesReal estateCombined real estate, insurance, etc. 9/Holding and other investment offices
ServicesHotels and other lodging placesPersonal servicesPrivate householdsBusiness servicesAutomotive repair, services, and parking
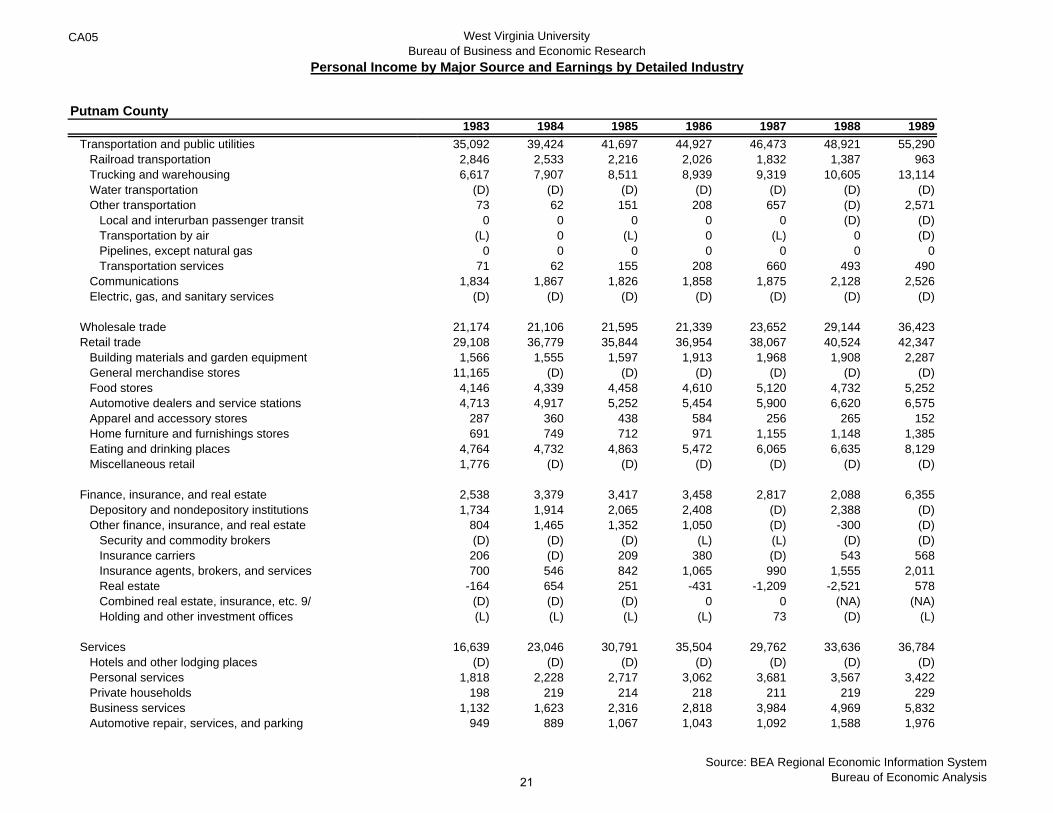
1983 1984 1985 1986 1987 1988 198935,092 39,424 41,697 44,927 46,473 48,921 55,2902,846 2,533 2,216 2,026 1,832 1,387 9636,617 7,907 8,511 8,939 9,319 10,605 13,114
(D) (D) (D) (D) (D) (D) (D)73 62 151 208 657 (D) 2,5710 0 0 0 0 (D) (D)
(L) 0 (L) 0 (L) 0 (D)0 0 0 0 0 0 0
71 62 155 208 660 493 4901,834 1,867 1,826 1,858 1,875 2,128 2,526
(D) (D) (D) (D) (D) (D) (D)
21,174 21,106 21,595 21,339 23,652 29,144 36,42329,108 36,779 35,844 36,954 38,067 40,524 42,3471,566 1,555 1,597 1,913 1,968 1,908 2,287
11,165 (D) (D) (D) (D) (D) (D)4,146 4,339 4,458 4,610 5,120 4,732 5,2524,713 4,917 5,252 5,454 5,900 6,620 6,575
287 360 438 584 256 265 152691 749 712 971 1,155 1,148 1,385
4,764 4,732 4,863 5,472 6,065 6,635 8,1291,776 (D) (D) (D) (D) (D) (D)
2,538 3,379 3,417 3,458 2,817 2,088 6,3551,734 1,914 2,065 2,408 (D) 2,388 (D)
804 1,465 1,352 1,050 (D) -300 (D)(D) (D) (D) (L) (L) (D) (D)206 (D) 209 380 (D) 543 568700 546 842 1,065 990 1,555 2,011
-164 654 251 -431 -1,209 -2,521 578(D) (D) (D) 0 0 (NA) (NA)(L) (L) (L) (L) 73 (D) (L)
16,639 23,046 30,791 35,504 29,762 33,636 36,784(D) (D) (D) (D) (D) (D) (D)
1,818 2,228 2,717 3,062 3,681 3,567 3,422198 219 214 218 211 219 229
1,132 1,623 2,316 2,818 3,984 4,969 5,832949 889 1,067 1,043 1,092 1,588 1,976
Source: BEA Regional Economic Information SystemBureau of Economic Analysis21
CA05 West Virginia UniversityBureau of Business and Economic Research
Personal Income by Major Source and Earnings by Detailed Industry
Putnam County
Miscellaneous repair servicesAmusement and recreation servicesMotion picturesHealth servicesLegal servicesEducational servicesSocial services 10/Museums, botanical, zoological gardensMembership organizationsEngineering and management services 11/Miscellaneous services
Government and government enterprisesFederal, civilianMilitaryState and local
State governmentLocal government
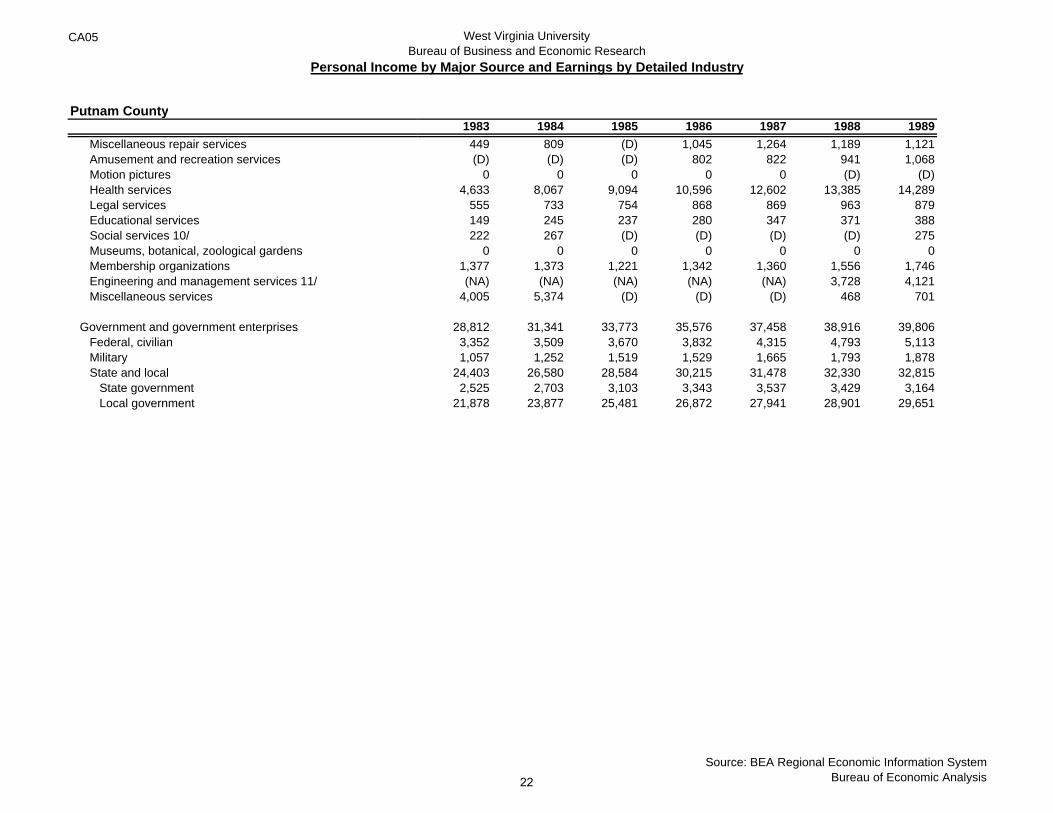
1983 1984 1985 1986 1987 1988 1989449 809 (D) 1,045 1,264 1,189 1,121(D) (D) (D) 802 822 941 1,068
0 0 0 0 0 (D) (D)4,633 8,067 9,094 10,596 12,602 13,385 14,289
555 733 754 868 869 963 879149 245 237 280 347 371 388222 267 (D) (D) (D) (D) 275
0 0 0 0 0 0 01,377 1,373 1,221 1,342 1,360 1,556 1,746(NA) (NA) (NA) (NA) (NA) 3,728 4,121
4,005 5,374 (D) (D) (D) 468 701
28,812 31,341 33,773 35,576 37,458 38,916 39,8063,352 3,509 3,670 3,832 4,315 4,793 5,1131,057 1,252 1,519 1,529 1,665 1,793 1,878
24,403 26,580 28,584 30,215 31,478 32,330 32,8152,525 2,703 3,103 3,343 3,537 3,429 3,164
21,878 23,877 25,481 26,872 27,941 28,901 29,651
Source: BEA Regional Economic Information SystemBureau of Economic Analysis22

CA05 West Virginia UniversityBureau of Business and Economic Research
Personal Income by Major Source and Earnings by Detailed Industry
Putnam County
Income by place of residence ($000)Personal income
Population (persons) 2/Per capita personal income (dollars)
Derivation of personal income ($000)Earnings by place of work
less: Contributions for government social insurance 3/Employee & self-employed contrib. for gov. social insuranceEmployer contributions for government social insurance
plus: Adjustment for residence 4/equals: Net earnings by place of residence
plus: Dividends, interest, and rent 5/plus: Personal current transfer receipts
Earnings by place of work ($000)Components of earnings
Wages and salariesSupplements to wages and salaries
Employer contrib. for employee pension & insurance funds 6/Employer contributions for government social insurance
Proprietors' income 7/Farm proprietors' incomeNonfarm proprietors' income
Earnings by industry ($000)Farm earningsNonfarm earnings
Private nonfarm earnings
Agricultural services, forestry, and fishingAgricultural servicesForestry and fishing
ForestryFishing
1990 1991 1992 1993 1994 1995 1996
661,618 710,309 812,743 870,476 922,489 975,654 1,052,211
43,005 44,157 45,183 46,425 47,611 48,397 49,07015,385 16,086 17,988 18,750 19,376 20,159 21,443
328,532 363,241 419,833 456,162 508,871 540,252 569,50846,254 52,047 58,940 66,745 75,035 80,544 85,20319,649 22,184 25,356 27,673 31,344 33,794 35,44226,605 29,863 33,584 39,072 43,691 46,750 49,761
193,602 197,362 226,139 237,499 237,578 250,500 275,961475,880 508,556 587,032 626,916 671,414 710,208 760,26696,043 99,078 105,107 112,582 120,915 126,342 138,67889,695 102,675 120,604 130,978 130,160 139,104 153,267
242,124 266,420 292,218 328,094 369,063 395,150 417,42955,824 63,225 72,963 83,676 93,295 96,612 102,08829,219 33,362 39,379 44,604 49,604 49,862 52,32726,605 29,863 33,584 39,072 43,691 46,750 49,76130,584 33,596 54,652 44,392 46,513 48,490 49,991
-231 -201 472 327 434 -263 -1,15130,815 33,797 54,180 44,065 46,079 48,753 51,142
289 341 1,043 925 1,010 362 -551328,243 362,900 418,790 455,237 507,861 539,890 570,059284,095 313,252 362,683 393,113 442,240 470,545 497,378
2,225 (D) 2,830 3,446 3,983 3,735 3,8592,185 (D) 2,780 3,421 3,956 3,724 3,849
(L) (L) 50 (L) (L) (L) (L)(L) (L) (L) 0 0 0 0(L) (L) (L) (L) (L) (L) (L)
Source: BEA Regional Economic Information SystemBureau of Economic Analysis23
CA05 West Virginia UniversityBureau of Business and Economic Research
Personal Income by Major Source and Earnings by Detailed Industry
Putnam County
MiningMetal miningCoal miningOil and gas extractionNonmetallic minerals, except fuels
ConstructionGeneral building contractorsHeavy construction contractorsSpecial trade contractors
ManufacturingDurable goods manufacturing
Lumber and wood productsFurniture and fixturesStone, clay, and glass productsPrimary metal industriesFabricated metal productsIndustrial machinery and equipmentElectronic and other electric equipmentMotor vehicles and equipmentOther transportation equipmentInstruments and related productsMiscellaneous manufacturing industriesOrdnance 8/
Nondurable goods manufacturingFood and kindred productsTobacco productsTextile mill productsApparel and other textile productsPaper and allied productsPrinting and publishingChemicals and allied productsPetroleum and coal productsRubber and miscellaneous plastics productsLeather and leather products
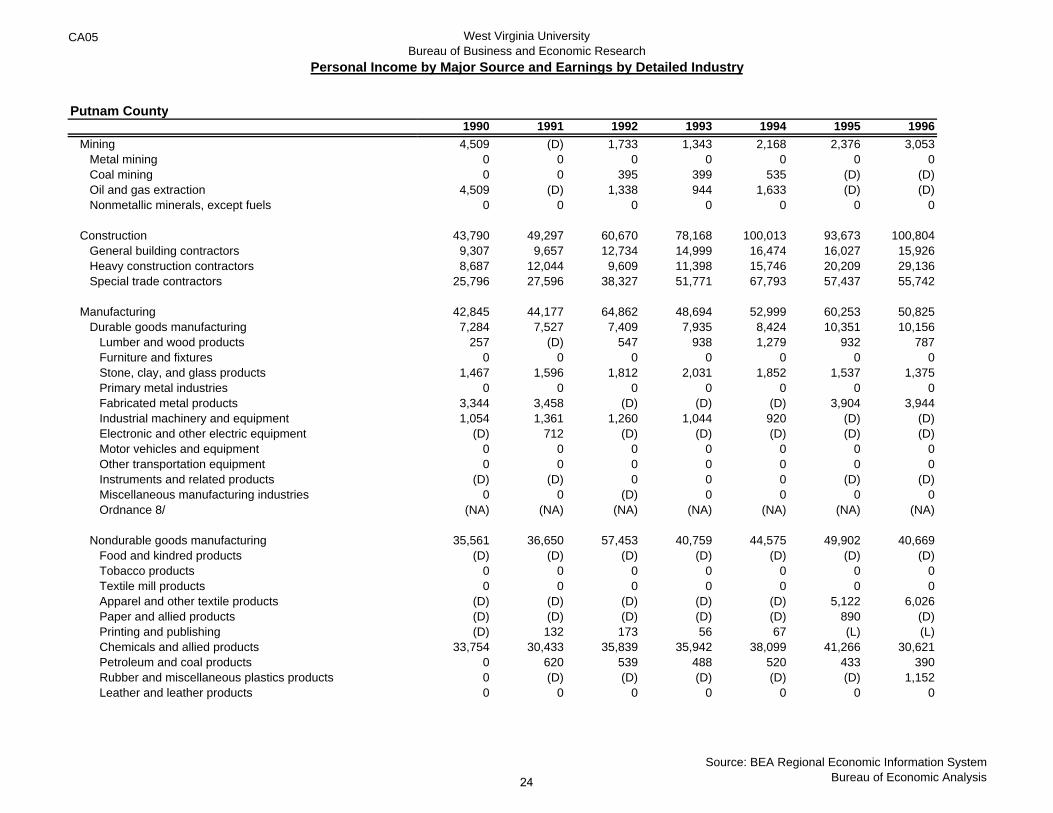
1990 1991 1992 1993 1994 1995 19964,509 (D) 1,733 1,343 2,168 2,376 3,053
0 0 0 0 0 0 00 0 395 399 535 (D) (D)
4,509 (D) 1,338 944 1,633 (D) (D)0 0 0 0 0 0 0
43,790 49,297 60,670 78,168 100,013 93,673 100,8049,307 9,657 12,734 14,999 16,474 16,027 15,9268,687 12,044 9,609 11,398 15,746 20,209 29,136
25,796 27,596 38,327 51,771 67,793 57,437 55,742
42,845 44,177 64,862 48,694 52,999 60,253 50,8257,284 7,527 7,409 7,935 8,424 10,351 10,156
257 (D) 547 938 1,279 932 7870 0 0 0 0 0 0
1,467 1,596 1,812 2,031 1,852 1,537 1,3750 0 0 0 0 0 0
3,344 3,458 (D) (D) (D) 3,904 3,9441,054 1,361 1,260 1,044 920 (D) (D)
(D) 712 (D) (D) (D) (D) (D)0 0 0 0 0 0 00 0 0 0 0 0 0
(D) (D) 0 0 0 (D) (D)0 0 (D) 0 0 0 0
(NA) (NA) (NA) (NA) (NA) (NA) (NA)
35,561 36,650 57,453 40,759 44,575 49,902 40,669(D) (D) (D) (D) (D) (D) (D)
0 0 0 0 0 0 00 0 0 0 0 0 0
(D) (D) (D) (D) (D) 5,122 6,026(D) (D) (D) (D) (D) 890 (D)(D) 132 173 56 67 (L) (L)
33,754 30,433 35,839 35,942 38,099 41,266 30,6210 620 539 488 520 433 3900 (D) (D) (D) (D) (D) 1,1520 0 0 0 0 0 0
Source: BEA Regional Economic Information SystemBureau of Economic Analysis24
CA05 West Virginia UniversityBureau of Business and Economic Research
Personal Income by Major Source and Earnings by Detailed Industry
Putnam County
Transportation and public utilitiesRailroad transportationTrucking and warehousingWater transportationOther transportation
Local and interurban passenger transitTransportation by airPipelines, except natural gasTransportation services
CommunicationsElectric, gas, and sanitary services
Wholesale tradeRetail trade
Building materials and garden equipmentGeneral merchandise storesFood storesAutomotive dealers and service stationsApparel and accessory storesHome furniture and furnishings storesEating and drinking placesMiscellaneous retail
Finance, insurance, and real estateDepository and nondepository institutionsOther finance, insurance, and real estate
Security and commodity brokersInsurance carriersInsurance agents, brokers, and servicesReal estateCombined real estate, insurance, etc. 9/Holding and other investment offices
ServicesHotels and other lodging placesPersonal servicesPrivate householdsBusiness servicesAutomotive repair, services, and parking
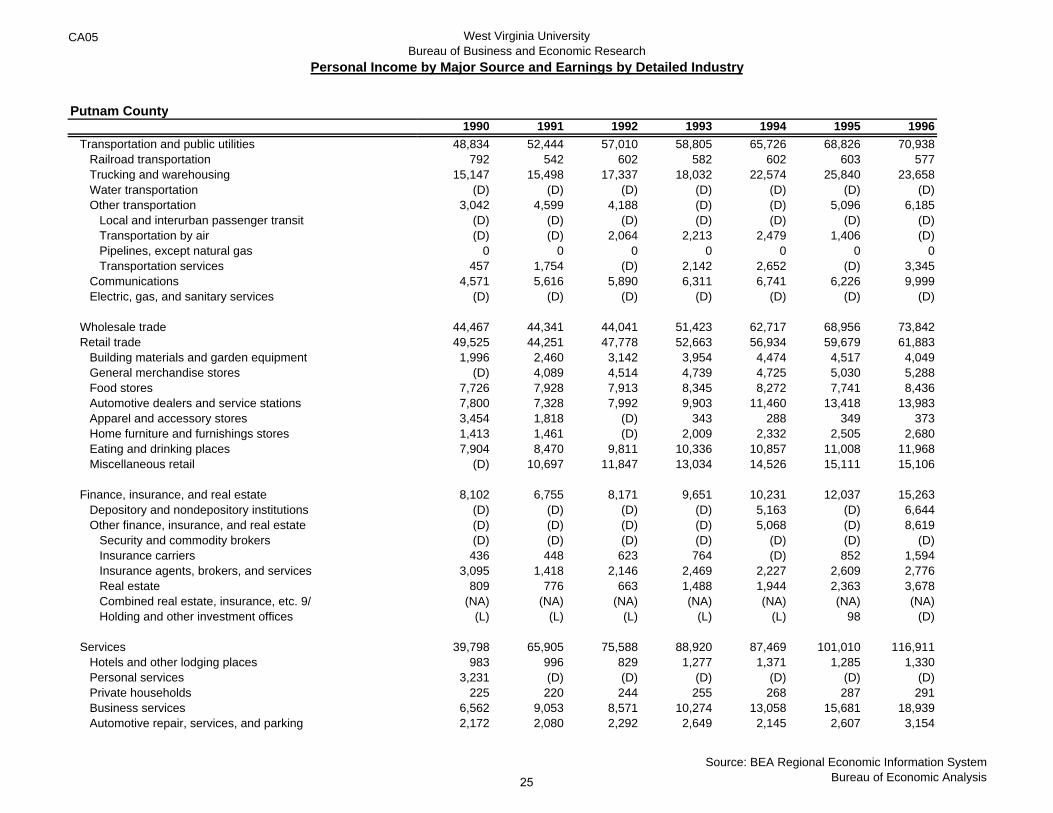
1990 1991 1992 1993 1994 1995 199648,834 52,444 57,010 58,805 65,726 68,826 70,938
792 542 602 582 602 603 57715,147 15,498 17,337 18,032 22,574 25,840 23,658
(D) (D) (D) (D) (D) (D) (D)3,042 4,599 4,188 (D) (D) 5,096 6,185
(D) (D) (D) (D) (D) (D) (D)(D) (D) 2,064 2,213 2,479 1,406 (D)
0 0 0 0 0 0 0457 1,754 (D) 2,142 2,652 (D) 3,345
4,571 5,616 5,890 6,311 6,741 6,226 9,999(D) (D) (D) (D) (D) (D) (D)
44,467 44,341 44,041 51,423 62,717 68,956 73,84249,525 44,251 47,778 52,663 56,934 59,679 61,8831,996 2,460 3,142 3,954 4,474 4,517 4,049
(D) 4,089 4,514 4,739 4,725 5,030 5,2887,726 7,928 7,913 8,345 8,272 7,741 8,4367,800 7,328 7,992 9,903 11,460 13,418 13,9833,454 1,818 (D) 343 288 349 3731,413 1,461 (D) 2,009 2,332 2,505 2,6807,904 8,470 9,811 10,336 10,857 11,008 11,968
(D) 10,697 11,847 13,034 14,526 15,111 15,106
8,102 6,755 8,171 9,651 10,231 12,037 15,263(D) (D) (D) (D) 5,163 (D) 6,644(D) (D) (D) (D) 5,068 (D) 8,619(D) (D) (D) (D) (D) (D) (D)436 448 623 764 (D) 852 1,594
3,095 1,418 2,146 2,469 2,227 2,609 2,776809 776 663 1,488 1,944 2,363 3,678
(NA) (NA) (NA) (NA) (NA) (NA) (NA)(L) (L) (L) (L) (L) 98 (D)
39,798 65,905 75,588 88,920 87,469 101,010 116,911983 996 829 1,277 1,371 1,285 1,330
3,231 (D) (D) (D) (D) (D) (D)225 220 244 255 268 287 291
6,562 9,053 8,571 10,274 13,058 15,681 18,9392,172 2,080 2,292 2,649 2,145 2,607 3,154
Source: BEA Regional Economic Information SystemBureau of Economic Analysis25
CA05 West Virginia UniversityBureau of Business and Economic Research
Personal Income by Major Source and Earnings by Detailed Industry
Putnam County
Miscellaneous repair servicesAmusement and recreation servicesMotion picturesHealth servicesLegal servicesEducational servicesSocial services 10/Museums, botanical, zoological gardensMembership organizationsEngineering and management services 11/Miscellaneous services
Government and government enterprisesFederal, civilianMilitaryState and local
State governmentLocal government
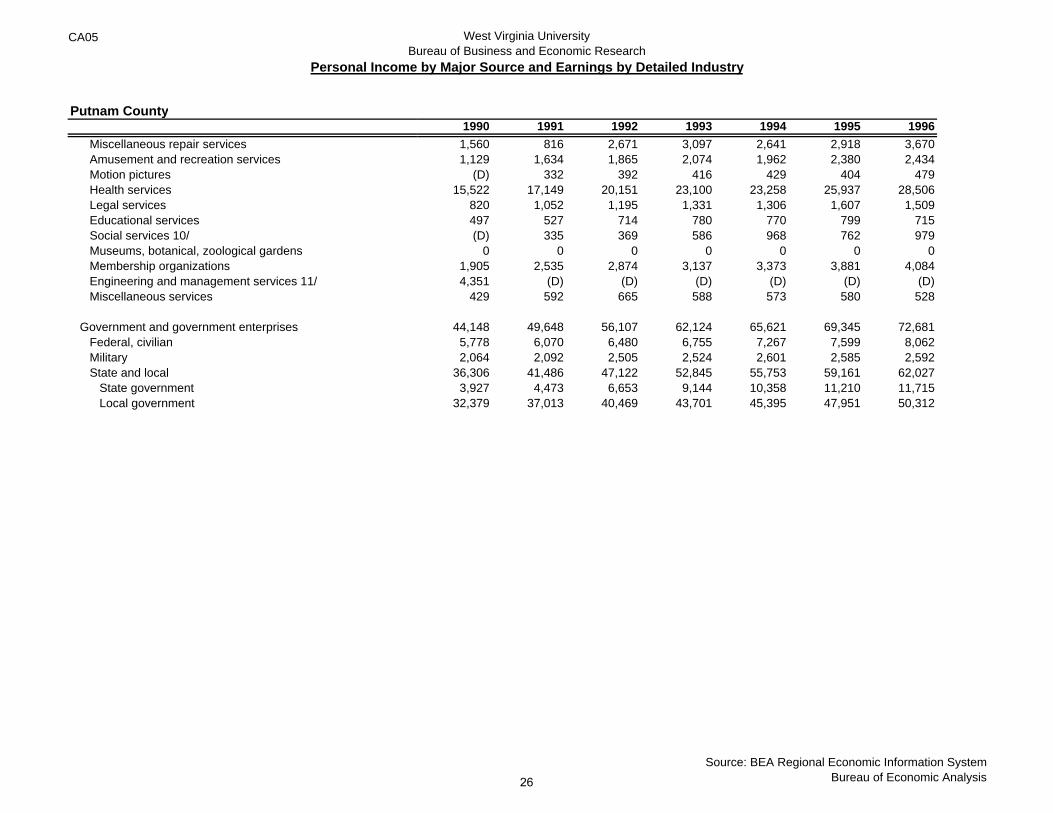
1990 1991 1992 1993 1994 1995 19961,560 816 2,671 3,097 2,641 2,918 3,6701,129 1,634 1,865 2,074 1,962 2,380 2,434
(D) 332 392 416 429 404 47915,522 17,149 20,151 23,100 23,258 25,937 28,506
820 1,052 1,195 1,331 1,306 1,607 1,509497 527 714 780 770 799 715(D) 335 369 586 968 762 979
0 0 0 0 0 0 01,905 2,535 2,874 3,137 3,373 3,881 4,0844,351 (D) (D) (D) (D) (D) (D)
429 592 665 588 573 580 528
44,148 49,648 56,107 62,124 65,621 69,345 72,6815,778 6,070 6,480 6,755 7,267 7,599 8,0622,064 2,092 2,505 2,524 2,601 2,585 2,592
36,306 41,486 47,122 52,845 55,753 59,161 62,0273,927 4,473 6,653 9,144 10,358 11,210 11,715
32,379 37,013 40,469 43,701 45,395 47,951 50,312
Source: BEA Regional Economic Information SystemBureau of Economic Analysis26
CA05 West Virginia UniversityBureau of Business and Economic Research
Personal Income by Major Source and Earnings by Detailed Industry
Putnam County
Income by place of residence ($000)Personal income
Population (persons) 2/Per capita personal income (dollars)
Derivation of personal income ($000)Earnings by place of work
less: Contributions for government social insurance 3/Employee & self-employed contrib. for gov. social insuranceEmployer contributions for government social insurance
plus: Adjustment for residence 4/equals: Net earnings by place of residence
plus: Dividends, interest, and rent 5/plus: Personal current transfer receipts
Earnings by place of work ($000)Components of earnings
Wages and salariesSupplements to wages and salaries
Employer contrib. for employee pension & insurance funds 6/Employer contributions for government social insurance
Proprietors' income 7/Farm proprietors' incomeNonfarm proprietors' income
Earnings by industry ($000)Farm earningsNonfarm earnings
Private nonfarm earnings
Agricultural services, forestry, and fishingAgricultural servicesForestry and fishing
ForestryFishing
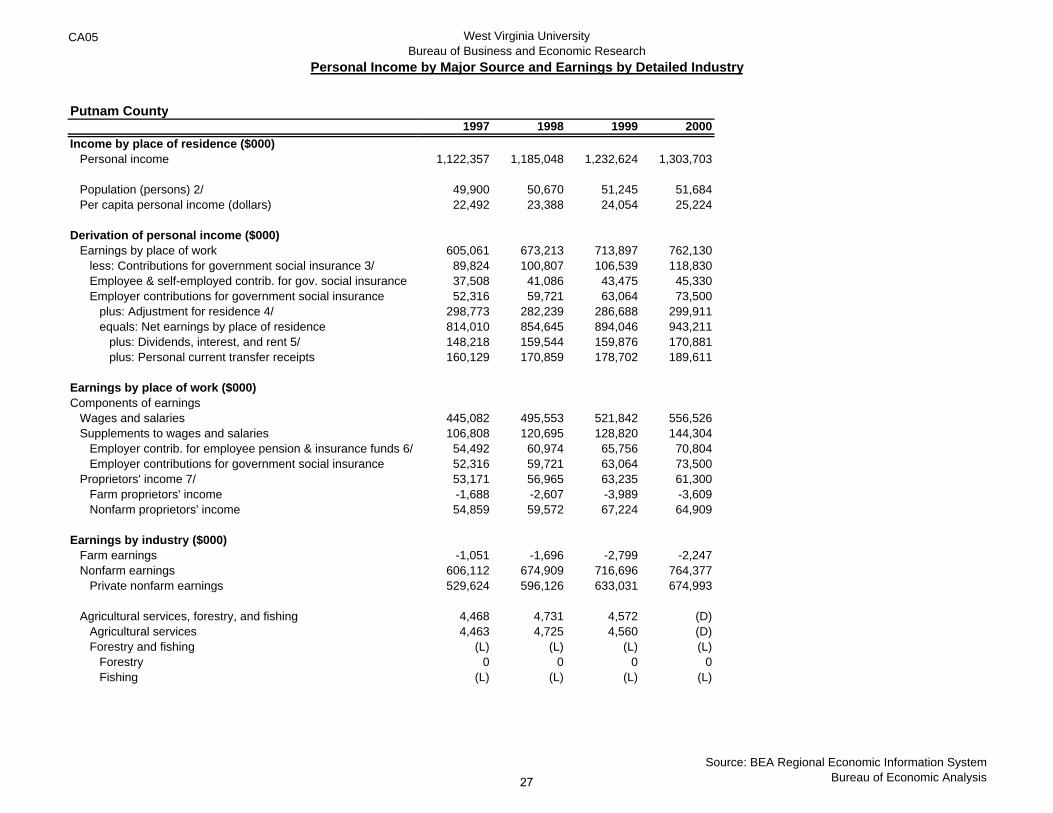
1997 1998 1999 2000
1,122,357 1,185,048 1,232,624 1,303,703
49,900 50,670 51,245 51,68422,492 23,388 24,054 25,224
605,061 673,213 713,897 762,13089,824 100,807 106,539 118,83037,508 41,086 43,475 45,33052,316 59,721 63,064 73,500
298,773 282,239 286,688 299,911814,010 854,645 894,046 943,211148,218 159,544 159,876 170,881160,129 170,859 178,702 189,611
445,082 495,553 521,842 556,526106,808 120,695 128,820 144,30454,492 60,974 65,756 70,80452,316 59,721 63,064 73,50053,171 56,965 63,235 61,300-1,688 -2,607 -3,989 -3,60954,859 59,572 67,224 64,909
-1,051 -1,696 -2,799 -2,247606,112 674,909 716,696 764,377529,624 596,126 633,031 674,993
4,468 4,731 4,572 (D)4,463 4,725 4,560 (D)
(L) (L) (L) (L)0 0 0 0
(L) (L) (L) (L)
Source: BEA Regional Economic Information SystemBureau of Economic Analysis27
CA05 West Virginia UniversityBureau of Business and Economic Research
Personal Income by Major Source and Earnings by Detailed Industry
Putnam County
MiningMetal miningCoal miningOil and gas extractionNonmetallic minerals, except fuels
ConstructionGeneral building contractorsHeavy construction contractorsSpecial trade contractors
ManufacturingDurable goods manufacturing
Lumber and wood productsFurniture and fixturesStone, clay, and glass productsPrimary metal industriesFabricated metal productsIndustrial machinery and equipmentElectronic and other electric equipmentMotor vehicles and equipmentOther transportation equipmentInstruments and related productsMiscellaneous manufacturing industriesOrdnance 8/
Nondurable goods manufacturingFood and kindred productsTobacco productsTextile mill productsApparel and other textile productsPaper and allied productsPrinting and publishingChemicals and allied productsPetroleum and coal productsRubber and miscellaneous plastics productsLeather and leather products
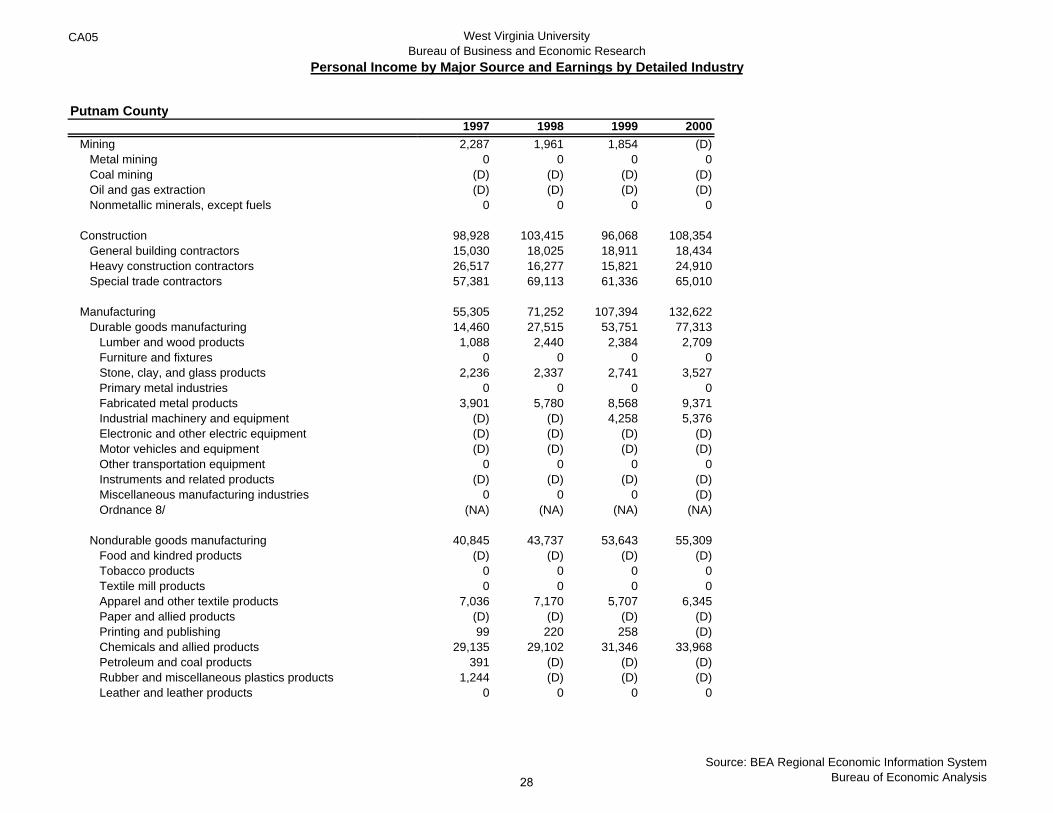
1997 1998 1999 20002,287 1,961 1,854 (D)
0 0 0 0(D) (D) (D) (D)(D) (D) (D) (D)
0 0 0 0
98,928 103,415 96,068 108,35415,030 18,025 18,911 18,43426,517 16,277 15,821 24,91057,381 69,113 61,336 65,010
55,305 71,252 107,394 132,62214,460 27,515 53,751 77,3131,088 2,440 2,384 2,709
0 0 0 02,236 2,337 2,741 3,527
0 0 0 03,901 5,780 8,568 9,371
(D) (D) 4,258 5,376(D) (D) (D) (D)(D) (D) (D) (D)
0 0 0 0(D) (D) (D) (D)
0 0 0 (D)(NA) (NA) (NA) (NA)
40,845 43,737 53,643 55,309(D) (D) (D) (D)
0 0 0 00 0 0 0
7,036 7,170 5,707 6,345(D) (D) (D) (D)99 220 258 (D)
29,135 29,102 31,346 33,968391 (D) (D) (D)
1,244 (D) (D) (D)0 0 0 0
Source: BEA Regional Economic Information SystemBureau of Economic Analysis28
CA05 West Virginia UniversityBureau of Business and Economic Research
Personal Income by Major Source and Earnings by Detailed Industry
Putnam County
Transportation and public utilitiesRailroad transportationTrucking and warehousingWater transportationOther transportation
Local and interurban passenger transitTransportation by airPipelines, except natural gasTransportation services
CommunicationsElectric, gas, and sanitary services
Wholesale tradeRetail trade
Building materials and garden equipmentGeneral merchandise storesFood storesAutomotive dealers and service stationsApparel and accessory storesHome furniture and furnishings storesEating and drinking placesMiscellaneous retail
Finance, insurance, and real estateDepository and nondepository institutionsOther finance, insurance, and real estate
Security and commodity brokersInsurance carriersInsurance agents, brokers, and servicesReal estateCombined real estate, insurance, etc. 9/Holding and other investment offices
ServicesHotels and other lodging placesPersonal servicesPrivate householdsBusiness servicesAutomotive repair, services, and parking
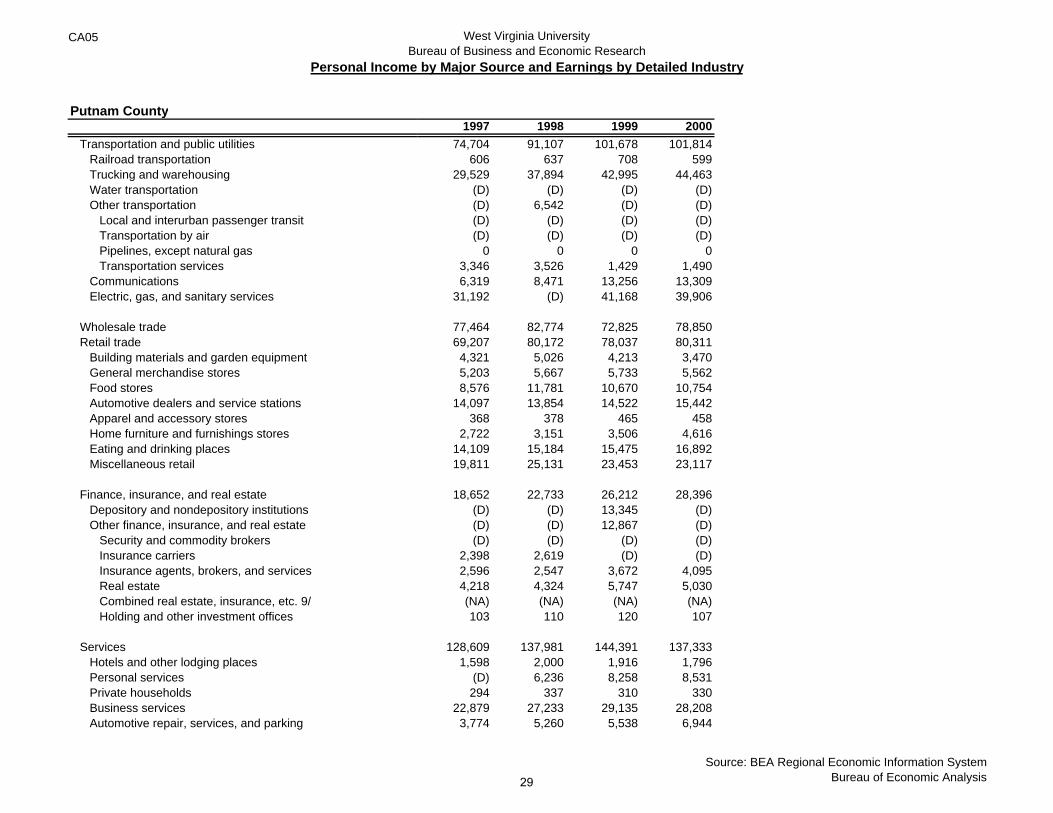
1997 1998 1999 200074,704 91,107 101,678 101,814
606 637 708 59929,529 37,894 42,995 44,463
(D) (D) (D) (D)(D) 6,542 (D) (D)(D) (D) (D) (D)(D) (D) (D) (D)
0 0 0 03,346 3,526 1,429 1,4906,319 8,471 13,256 13,309
31,192 (D) 41,168 39,906
77,464 82,774 72,825 78,85069,207 80,172 78,037 80,3114,321 5,026 4,213 3,4705,203 5,667 5,733 5,5628,576 11,781 10,670 10,754
14,097 13,854 14,522 15,442368 378 465 458
2,722 3,151 3,506 4,61614,109 15,184 15,475 16,89219,811 25,131 23,453 23,117
18,652 22,733 26,212 28,396(D) (D) 13,345 (D)(D) (D) 12,867 (D)(D) (D) (D) (D)
2,398 2,619 (D) (D)2,596 2,547 3,672 4,0954,218 4,324 5,747 5,030(NA) (NA) (NA) (NA)103 110 120 107
128,609 137,981 144,391 137,3331,598 2,000 1,916 1,796
(D) 6,236 8,258 8,531294 337 310 330
22,879 27,233 29,135 28,2083,774 5,260 5,538 6,944
Source: BEA Regional Economic Information SystemBureau of Economic Analysis29
CA05 West Virginia UniversityBureau of Business and Economic Research
Personal Income by Major Source and Earnings by Detailed Industry
Putnam County
Miscellaneous repair servicesAmusement and recreation servicesMotion picturesHealth servicesLegal servicesEducational servicesSocial services 10/Museums, botanical, zoological gardensMembership organizationsEngineering and management services 11/Miscellaneous services
Government and government enterprisesFederal, civilianMilitaryState and local
State governmentLocal government
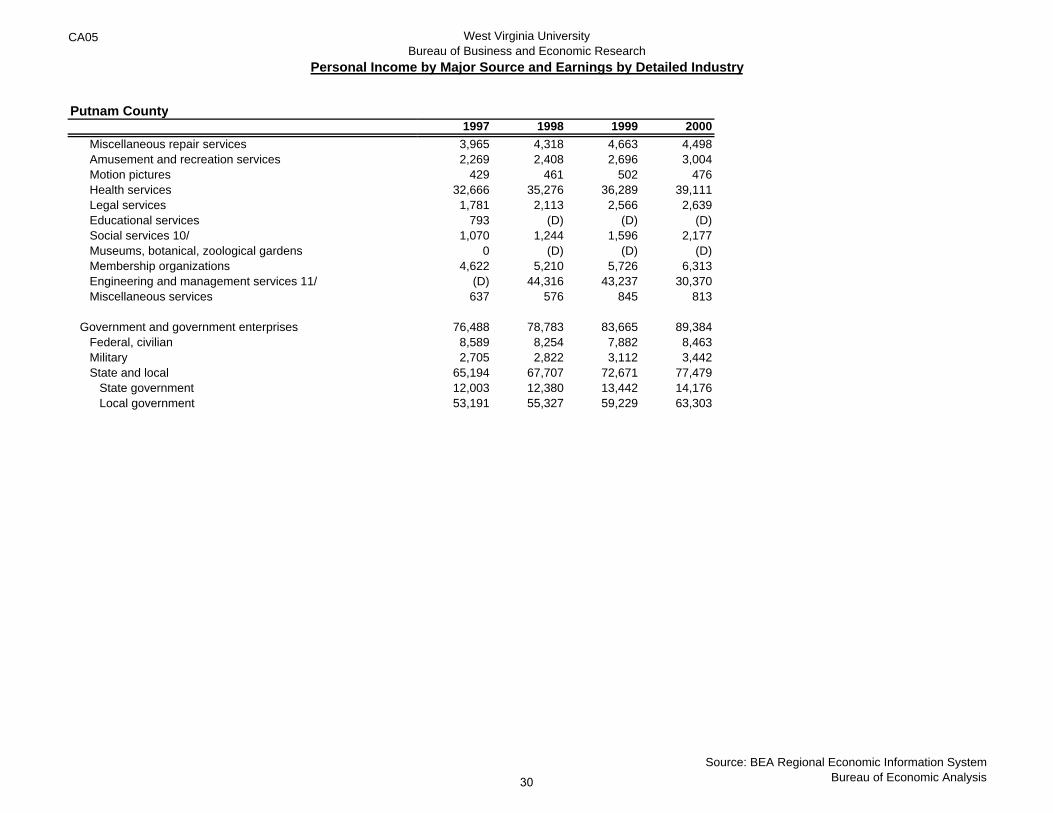
1997 1998 1999 20003,965 4,318 4,663 4,4982,269 2,408 2,696 3,004
429 461 502 47632,666 35,276 36,289 39,1111,781 2,113 2,566 2,639
793 (D) (D) (D)1,070 1,244 1,596 2,177
0 (D) (D) (D)4,622 5,210 5,726 6,313
(D) 44,316 43,237 30,370637 576 845 813
76,488 78,783 83,665 89,3848,589 8,254 7,882 8,4632,705 2,822 3,112 3,442
65,194 67,707 72,671 77,47912,003 12,380 13,442 14,17653,191 55,327 59,229 63,303
Source: BEA Regional Economic Information SystemBureau of Economic Analysis30
CA05 Footnotes
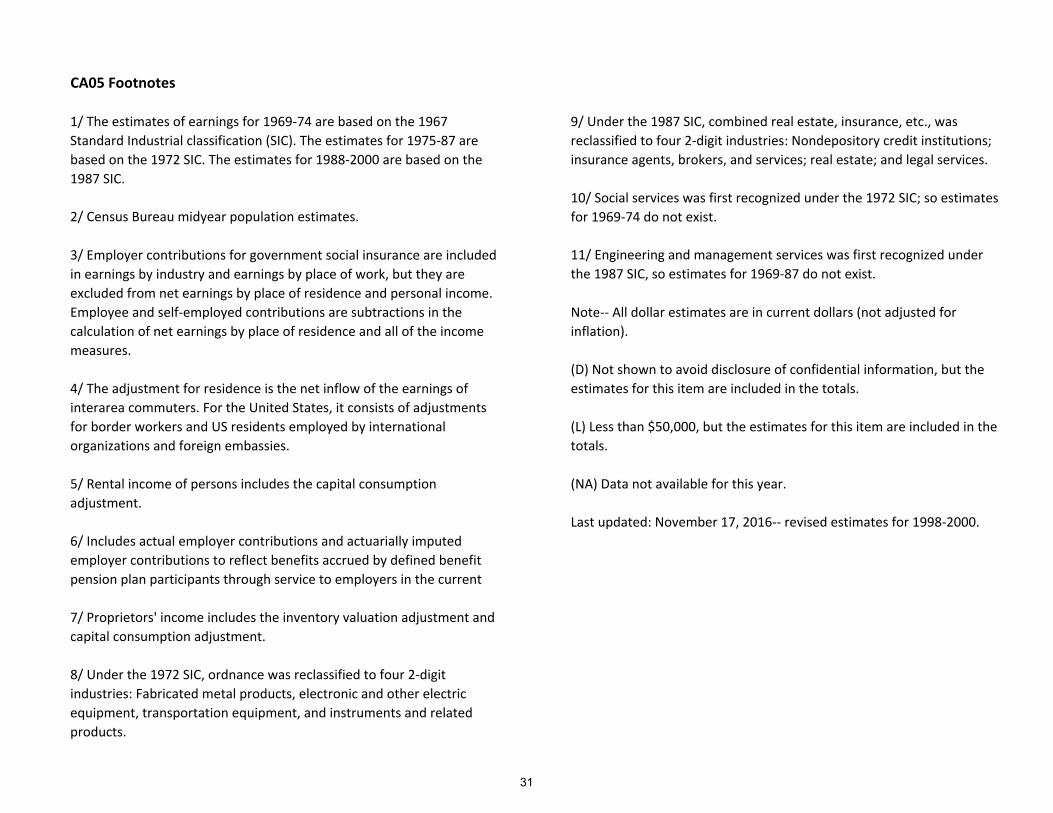
2/ Census Bureau midyear population estimates.
(NA) Data not available for this year.
Last updated: November 17, 2016‐‐ revised estimates for 1998‐2000.
7/ Proprietors' income includes the inventory valuation adjustment and
capital consumption adjustment.
8/ Under the 1972 SIC, ordnance was reclassified to four 2‐digit
industries: Fabricated metal products, electronic and other electric
equipment, transportation equipment, and instruments and related
products.
9/ Under the 1987 SIC, combined real estate, insurance, etc., was
reclassified to four 2‐digit industries: Nondepository credit institutions;
insurance agents, brokers, and services; real estate; and legal services.
1/ The estimates of earnings for 1969‐74 are based on the 1967
Standard Industrial classification (SIC). The estimates for 1975‐87 are
based on the 1972 SIC. The estimates for 1988‐2000 are based on the
1987 SIC.
3/ Employer contributions for government social insurance are included
in earnings by industry and earnings by place of work, but they are
excluded from net earnings by place of residence and personal income.
Employee and self‐employed contributions are subtractions in the
calculation of net earnings by place of residence and all of the income
measures.
4/ The adjustment for residence is the net inflow of the earnings of
interarea commuters. For the United States, it consists of adjustments
for border workers and US residents employed by international
organizations and foreign embassies.
5/ Rental income of persons includes the capital consumption
adjustment.
6/ Includes actual employer contributions and actuarially imputed
employer contributions to reflect benefits accrued by defined benefit
pension plan participants through service to employers in the current
10/ Social services was first recognized under the 1972 SIC; so estimates
for 1969‐74 do not exist.
11/ Engineering and management services was first recognized under
the 1987 SIC, so estimates for 1969‐87 do not exist.
Note‐‐ All dollar estimates are in current dollars (not adjusted for
inflation).
(D) Not shown to avoid disclosure of confidential information, but the
estimates for this item are included in the totals.
(L) Less than $50,000, but the estimates for this item are included in the
totals.
31
CA05N West Virginia UniversityBureau of Business and Economic Research
Personal Income by Major Source and Earnings by Detailed Industry
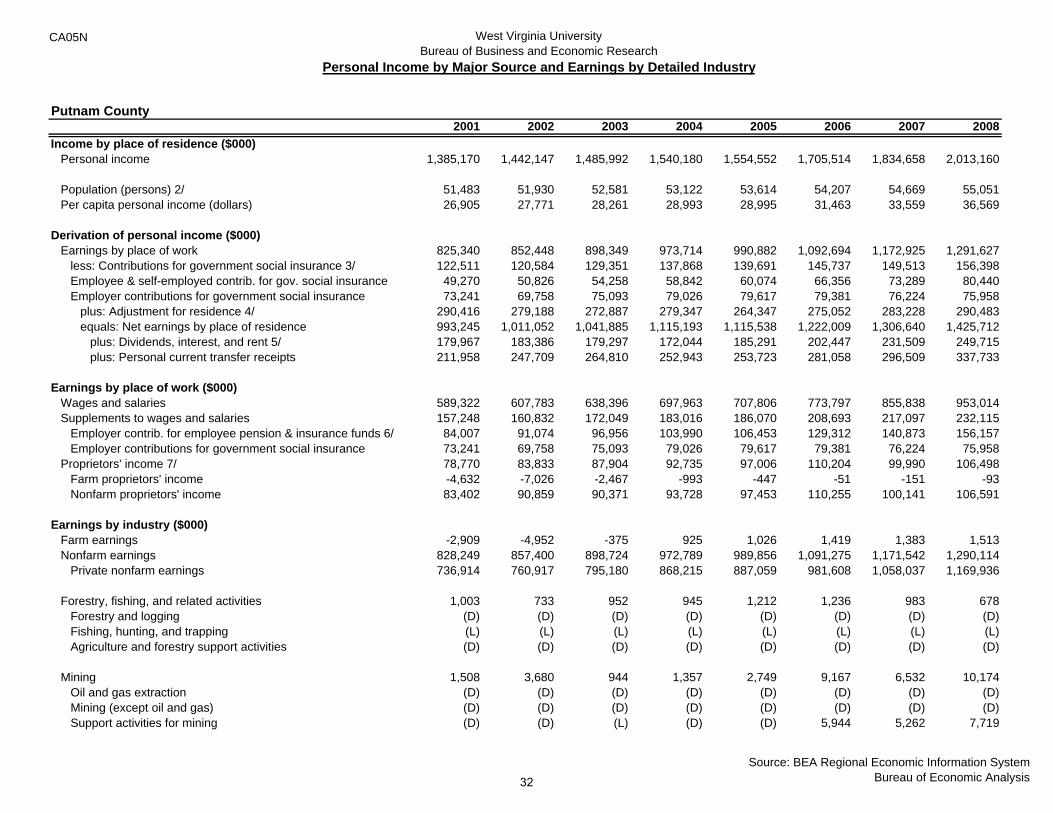
Putnam County2001 2002 2003 2004 2005 2006 2007 2008
Income by place of residence ($000)Personal income 1,385,170 1,442,147 1,485,992 1,540,180 1,554,552 1,705,514 1,834,658 2,013,160
Population (persons) 2/ 51,483 51,930 52,581 53,122 53,614 54,207 54,669 55,051Per capita personal income (dollars) 26,905 27,771 28,261 28,993 28,995 31,463 33,559 36,569
Derivation of personal income ($000)Earnings by place of work 825,340 852,448 898,349 973,714 990,882 1,092,694 1,172,925 1,291,627
less: Contributions for government social insurance 3/ 122,511 120,584 129,351 137,868 139,691 145,737 149,513 156,398Employee & self-employed contrib. for gov. social insurance 49,270 50,826 54,258 58,842 60,074 66,356 73,289 80,440Employer contributions for government social insurance 73,241 69,758 75,093 79,026 79,617 79,381 76,224 75,958
plus: Adjustment for residence 4/ 290,416 279,188 272,887 279,347 264,347 275,052 283,228 290,483equals: Net earnings by place of residence 993,245 1,011,052 1,041,885 1,115,193 1,115,538 1,222,009 1,306,640 1,425,712
plus: Dividends, interest, and rent 5/ 179,967 183,386 179,297 172,044 185,291 202,447 231,509 249,715plus: Personal current transfer receipts 211,958 247,709 264,810 252,943 253,723 281,058 296,509 337,733
Earnings by place of work ($000)Wages and salaries 589,322 607,783 638,396 697,963 707,806 773,797 855,838 953,014Supplements to wages and salaries 157,248 160,832 172,049 183,016 186,070 208,693 217,097 232,115
Employer contrib. for employee pension & insurance funds 6/ 84,007 91,074 96,956 103,990 106,453 129,312 140,873 156,157Employer contributions for government social insurance 73,241 69,758 75,093 79,026 79,617 79,381 76,224 75,958
Proprietors' income 7/ 78,770 83,833 87,904 92,735 97,006 110,204 99,990 106,498Farm proprietors' income -4,632 -7,026 -2,467 -993 -447 -51 -151 -93Nonfarm proprietors' income 83,402 90,859 90,371 93,728 97,453 110,255 100,141 106,591
Earnings by industry ($000)Farm earnings -2,909 -4,952 -375 925 1,026 1,419 1,383 1,513Nonfarm earnings 828,249 857,400 898,724 972,789 989,856 1,091,275 1,171,542 1,290,114
Private nonfarm earnings 736,914 760,917 795,180 868,215 887,059 981,608 1,058,037 1,169,936
Forestry, fishing, and related activities 1,003 733 952 945 1,212 1,236 983 678Forestry and logging (D) (D) (D) (D) (D) (D) (D) (D)Fishing, hunting, and trapping (L) (L) (L) (L) (L) (L) (L) (L)Agriculture and forestry support activities (D) (D) (D) (D) (D) (D) (D) (D)
Mining 1,508 3,680 944 1,357 2,749 9,167 6,532 10,174Oil and gas extraction (D) (D) (D) (D) (D) (D) (D) (D)Mining (except oil and gas) (D) (D) (D) (D) (D) (D) (D) (D)Support activities for mining (D) (D) (L) (D) (D) 5,944 5,262 7,719
Source: BEA Regional Economic Information SystemBureau of Economic Analysis32
CA05N West Virginia UniversityBureau of Business and Economic Research
Personal Income by Major Source and Earnings by Detailed Industry
Putnam County2001 2002 2003 2004 2005 2006 2007 2008
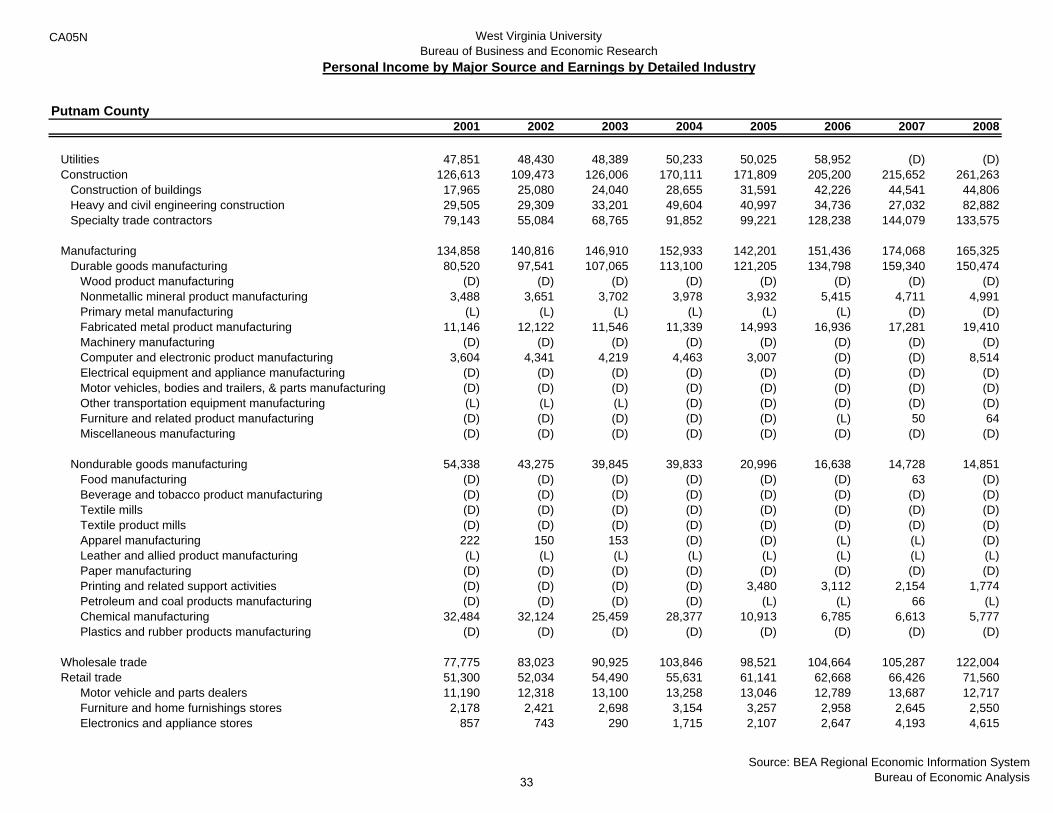
Utilities 47,851 48,430 48,389 50,233 50,025 58,952 (D) (D)Construction 126,613 109,473 126,006 170,111 171,809 205,200 215,652 261,263
Construction of buildings 17,965 25,080 24,040 28,655 31,591 42,226 44,541 44,806Heavy and civil engineering construction 29,505 29,309 33,201 49,604 40,997 34,736 27,032 82,882Specialty trade contractors 79,143 55,084 68,765 91,852 99,221 128,238 144,079 133,575
Manufacturing 134,858 140,816 146,910 152,933 142,201 151,436 174,068 165,325Durable goods manufacturing 80,520 97,541 107,065 113,100 121,205 134,798 159,340 150,474
Wood product manufacturing (D) (D) (D) (D) (D) (D) (D) (D)Nonmetallic mineral product manufacturing 3,488 3,651 3,702 3,978 3,932 5,415 4,711 4,991Primary metal manufacturing (L) (L) (L) (L) (L) (L) (D) (D)Fabricated metal product manufacturing 11,146 12,122 11,546 11,339 14,993 16,936 17,281 19,410Machinery manufacturing (D) (D) (D) (D) (D) (D) (D) (D)Computer and electronic product manufacturing 3,604 4,341 4,219 4,463 3,007 (D) (D) 8,514Electrical equipment and appliance manufacturing (D) (D) (D) (D) (D) (D) (D) (D)Motor vehicles, bodies and trailers, & parts manufacturing (D) (D) (D) (D) (D) (D) (D) (D)Other transportation equipment manufacturing (L) (L) (L) (D) (D) (D) (D) (D)Furniture and related product manufacturing (D) (D) (D) (D) (D) (L) 50 64Miscellaneous manufacturing (D) (D) (D) (D) (D) (D) (D) (D)
Nondurable goods manufacturing 54,338 43,275 39,845 39,833 20,996 16,638 14,728 14,851Food manufacturing (D) (D) (D) (D) (D) (D) 63 (D)Beverage and tobacco product manufacturing (D) (D) (D) (D) (D) (D) (D) (D)Textile mills (D) (D) (D) (D) (D) (D) (D) (D)Textile product mills (D) (D) (D) (D) (D) (D) (D) (D)Apparel manufacturing 222 150 153 (D) (D) (L) (L) (D)Leather and allied product manufacturing (L) (L) (L) (L) (L) (L) (L) (L)Paper manufacturing (D) (D) (D) (D) (D) (D) (D) (D)Printing and related support activities (D) (D) (D) (D) 3,480 3,112 2,154 1,774Petroleum and coal products manufacturing (D) (D) (D) (D) (L) (L) 66 (L)Chemical manufacturing 32,484 32,124 25,459 28,377 10,913 6,785 6,613 5,777Plastics and rubber products manufacturing (D) (D) (D) (D) (D) (D) (D) (D)
Wholesale trade 77,775 83,023 90,925 103,846 98,521 104,664 105,287 122,004Retail trade 51,300 52,034 54,490 55,631 61,141 62,668 66,426 71,560
Motor vehicle and parts dealers 11,190 12,318 13,100 13,258 13,046 12,789 13,687 12,717Furniture and home furnishings stores 2,178 2,421 2,698 3,154 3,257 2,958 2,645 2,550Electronics and appliance stores 857 743 290 1,715 2,107 2,647 4,193 4,615
Source: BEA Regional Economic Information SystemBureau of Economic Analysis33
CA05N West Virginia UniversityBureau of Business and Economic Research
Personal Income by Major Source and Earnings by Detailed Industry
Putnam County2001 2002 2003 2004 2005 2006 2007 2008
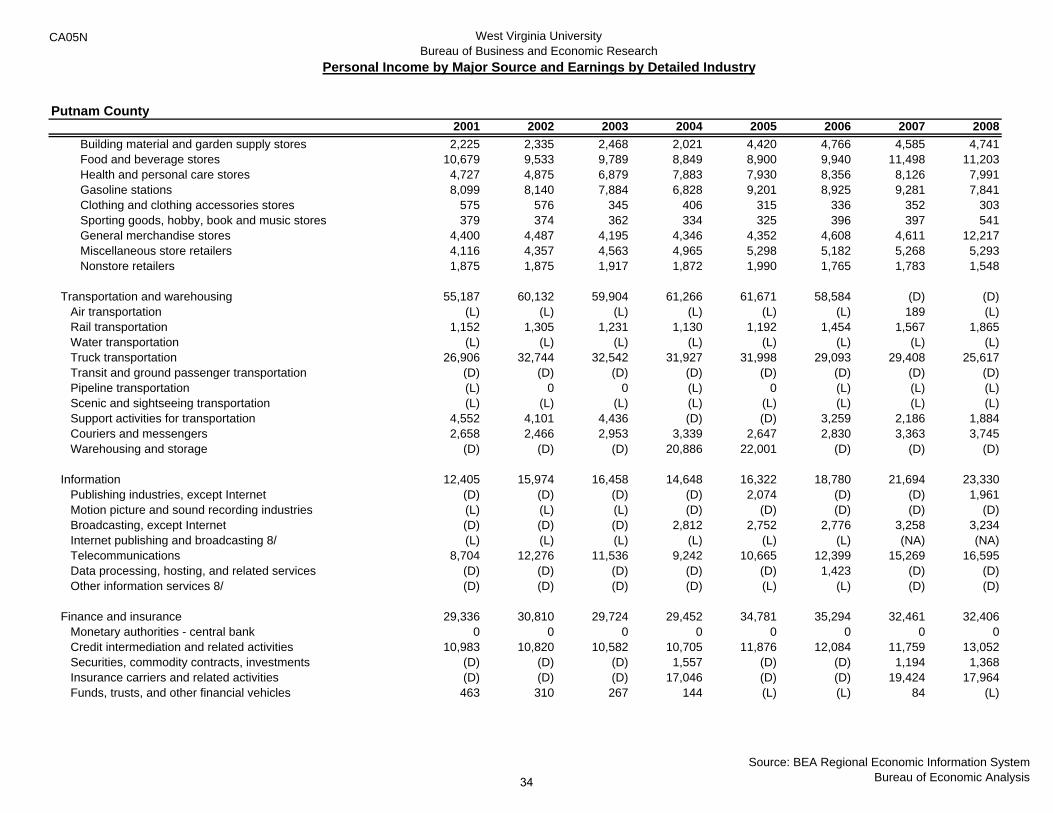
Building material and garden supply stores 2,225 2,335 2,468 2,021 4,420 4,766 4,585 4,741Food and beverage stores 10,679 9,533 9,789 8,849 8,900 9,940 11,498 11,203Health and personal care stores 4,727 4,875 6,879 7,883 7,930 8,356 8,126 7,991Gasoline stations 8,099 8,140 7,884 6,828 9,201 8,925 9,281 7,841Clothing and clothing accessories stores 575 576 345 406 315 336 352 303Sporting goods, hobby, book and music stores 379 374 362 334 325 396 397 541General merchandise stores 4,400 4,487 4,195 4,346 4,352 4,608 4,611 12,217Miscellaneous store retailers 4,116 4,357 4,563 4,965 5,298 5,182 5,268 5,293Nonstore retailers 1,875 1,875 1,917 1,872 1,990 1,765 1,783 1,548
Transportation and warehousing 55,187 60,132 59,904 61,266 61,671 58,584 (D) (D)Air transportation (L) (L) (L) (L) (L) (L) 189 (L)Rail transportation 1,152 1,305 1,231 1,130 1,192 1,454 1,567 1,865Water transportation (L) (L) (L) (L) (L) (L) (L) (L)Truck transportation 26,906 32,744 32,542 31,927 31,998 29,093 29,408 25,617Transit and ground passenger transportation (D) (D) (D) (D) (D) (D) (D) (D)Pipeline transportation (L) 0 0 (L) 0 (L) (L) (L)Scenic and sightseeing transportation (L) (L) (L) (L) (L) (L) (L) (L)Support activities for transportation 4,552 4,101 4,436 (D) (D) 3,259 2,186 1,884Couriers and messengers 2,658 2,466 2,953 3,339 2,647 2,830 3,363 3,745Warehousing and storage (D) (D) (D) 20,886 22,001 (D) (D) (D)
Information 12,405 15,974 16,458 14,648 16,322 18,780 21,694 23,330Publishing industries, except Internet (D) (D) (D) (D) 2,074 (D) (D) 1,961Motion picture and sound recording industries (L) (L) (L) (D) (D) (D) (D) (D)Broadcasting, except Internet (D) (D) (D) 2,812 2,752 2,776 3,258 3,234Internet publishing and broadcasting 8/ (L) (L) (L) (L) (L) (L) (NA) (NA)Telecommunications 8,704 12,276 11,536 9,242 10,665 12,399 15,269 16,595Data processing, hosting, and related services (D) (D) (D) (D) (D) 1,423 (D) (D)Other information services 8/ (D) (D) (D) (D) (L) (L) (D) (D)
Finance and insurance 29,336 30,810 29,724 29,452 34,781 35,294 32,461 32,406Monetary authorities - central bank 0 0 0 0 0 0 0 0Credit intermediation and related activities 10,983 10,820 10,582 10,705 11,876 12,084 11,759 13,052Securities, commodity contracts, investments (D) (D) (D) 1,557 (D) (D) 1,194 1,368Insurance carriers and related activities (D) (D) (D) 17,046 (D) (D) 19,424 17,964Funds, trusts, and other financial vehicles 463 310 267 144 (L) (L) 84 (L)
Source: BEA Regional Economic Information SystemBureau of Economic Analysis34
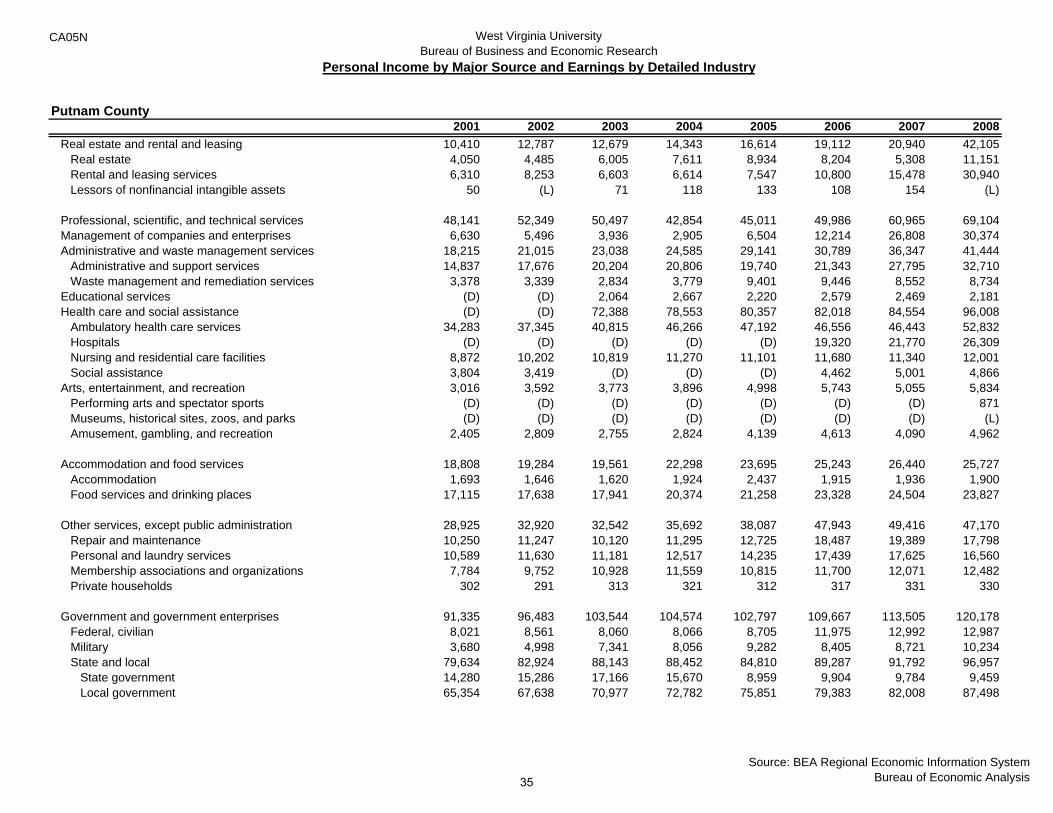
CA05N West Virginia UniversityBureau of Business and Economic Research
Personal Income by Major Source and Earnings by Detailed Industry
Putnam County2001 2002 2003 2004 2005 2006 2007 2008
Real estate and rental and leasing 10,410 12,787 12,679 14,343 16,614 19,112 20,940 42,105Real estate 4,050 4,485 6,005 7,611 8,934 8,204 5,308 11,151Rental and leasing services 6,310 8,253 6,603 6,614 7,547 10,800 15,478 30,940Lessors of nonfinancial intangible assets 50 (L) 71 118 133 108 154 (L)
Professional, scientific, and technical services 48,141 52,349 50,497 42,854 45,011 49,986 60,965 69,104Management of companies and enterprises 6,630 5,496 3,936 2,905 6,504 12,214 26,808 30,374Administrative and waste management services 18,215 21,015 23,038 24,585 29,141 30,789 36,347 41,444
Administrative and support services 14,837 17,676 20,204 20,806 19,740 21,343 27,795 32,710Waste management and remediation services 3,378 3,339 2,834 3,779 9,401 9,446 8,552 8,734
Educational services (D) (D) 2,064 2,667 2,220 2,579 2,469 2,181Health care and social assistance (D) (D) 72,388 78,553 80,357 82,018 84,554 96,008
Ambulatory health care services 34,283 37,345 40,815 46,266 47,192 46,556 46,443 52,832Hospitals (D) (D) (D) (D) (D) 19,320 21,770 26,309Nursing and residential care facilities 8,872 10,202 10,819 11,270 11,101 11,680 11,340 12,001Social assistance 3,804 3,419 (D) (D) (D) 4,462 5,001 4,866
Arts, entertainment, and recreation 3,016 3,592 3,773 3,896 4,998 5,743 5,055 5,834Performing arts and spectator sports (D) (D) (D) (D) (D) (D) (D) 871Museums, historical sites, zoos, and parks (D) (D) (D) (D) (D) (D) (D) (L)Amusement, gambling, and recreation 2,405 2,809 2,755 2,824 4,139 4,613 4,090 4,962
Accommodation and food services 18,808 19,284 19,561 22,298 23,695 25,243 26,440 25,727Accommodation 1,693 1,646 1,620 1,924 2,437 1,915 1,936 1,900Food services and drinking places 17,115 17,638 17,941 20,374 21,258 23,328 24,504 23,827
Other services, except public administration 28,925 32,920 32,542 35,692 38,087 47,943 49,416 47,170Repair and maintenance 10,250 11,247 10,120 11,295 12,725 18,487 19,389 17,798Personal and laundry services 10,589 11,630 11,181 12,517 14,235 17,439 17,625 16,560Membership associations and organizations 7,784 9,752 10,928 11,559 10,815 11,700 12,071 12,482Private households 302 291 313 321 312 317 331 330
Government and government enterprises 91,335 96,483 103,544 104,574 102,797 109,667 113,505 120,178Federal, civilian 8,021 8,561 8,060 8,066 8,705 11,975 12,992 12,987Military 3,680 4,998 7,341 8,056 9,282 8,405 8,721 10,234State and local 79,634 82,924 88,143 88,452 84,810 89,287 91,792 96,957
State government 14,280 15,286 17,166 15,670 8,959 9,904 9,784 9,459Local government 65,354 67,638 70,977 72,782 75,851 79,383 82,008 87,498
Source: BEA Regional Economic Information SystemBureau of Economic Analysis35

CA05N West Virginia UniversityBureau of Business and Economic Research
Personal Income by Major Source and Earnings by Detailed Industry
Putnam County
Income by place of residence ($000)Personal income
Population (persons) 2/Per capita personal income (dollars)
Derivation of personal income ($000)Earnings by place of work
less: Contributions for government social insurance 3/Employee & self-employed contrib. for gov. social insuranceEmployer contributions for government social insurance
plus: Adjustment for residence 4/equals: Net earnings by place of residence
plus: Dividends, interest, and rent 5/plus: Personal current transfer receipts
Earnings by place of work ($000)Wages and salariesSupplements to wages and salaries
Employer contrib. for employee pension & insurance funds 6/Employer contributions for government social insurance
Proprietors' income 7/Farm proprietors' incomeNonfarm proprietors' income
Earnings by industry ($000)Farm earningsNonfarm earnings
Private nonfarm earnings
Forestry, fishing, and related activitiesForestry and loggingFishing, hunting, and trappingAgriculture and forestry support activities
MiningOil and gas extractionMining (except oil and gas)Support activities for mining
2009 2010 2011 2012 2013 2014 2015 2016
2,034,301 2,065,802 2,220,335 2,271,123 2,245,703 2,315,956 2,385,131 2,404,162
55,178 55,649 56,078 56,531 56,597 56,845 56,799 56,94136,868 37,122 39,594 40,175 39,679 40,742 41,992 42,222
1,229,900 1,229,871 1,304,573 1,350,329 1,365,549 1,388,508 1,440,782 1,482,084149,923 152,309 138,654 148,772 168,804 175,594 183,796 190,94378,522 79,089 66,376 68,110 87,571 91,199 95,468 99,84171,401 73,220 72,278 80,662 81,233 84,395 88,328 91,102
327,134 355,818 370,258 367,414 348,392 365,055 366,841 333,5551,407,111 1,433,380 1,536,177 1,568,971 1,545,137 1,577,969 1,623,827 1,624,696
249,796 233,650 276,852 284,611 273,295 293,252 291,771 297,871377,394 398,772 407,306 417,541 427,271 444,735 469,533 481,595
910,576 908,573 966,693 996,654 1,010,883 1,032,990 1,075,647 1,111,910217,261 214,229 219,533 240,792 245,278 237,928 246,502 249,708145,860 141,009 147,255 160,130 164,045 153,533 158,174 158,60671,401 73,220 72,278 80,662 81,233 84,395 88,328 91,102
102,063 107,069 118,347 112,883 109,388 117,590 118,633 120,466-93 -106 -69 -156 -79 -62 -37 -15
102,156 107,175 118,416 113,039 109,467 117,652 118,670 120,481
1,598 1,701 1,614 2,660 2,740 2,959 2,513 2,9151,228,302 1,228,170 1,302,959 1,347,669 1,362,809 1,385,549 1,438,269 1,479,1691,098,119 1,095,979 1,173,348 1,211,266 1,227,729 1,247,003 1,296,926 1,335,110
570 800 603 985 1,159 1,461 1,372 1,360(D) (D) (D) (D) (D) (D) (D) (D)(L) (L) (L) (L) (L) (L) (L) (L)(D) (D) (D) (D) (D) (D) (D) (D)
38,030 5,407 2,623 5,899 5,428 4,387 5,641 3,803(D) (D) (D) (D) (D) (D) (D) (D)(D) (D) 247 (D) (D) 375 (D) (D)
37,876 (D) (D) 4,377 3,620 (D) 3,451 (D)
Source: BEA Regional Economic Information SystemBureau of Economic Analysis36

CA05N West Virginia UniversityBureau of Business and Economic Research
Personal Income by Major Source and Earnings by Detailed Industry
Putnam County
UtilitiesConstruction
Construction of buildingsHeavy and civil engineering constructionSpecialty trade contractors
ManufacturingDurable goods manufacturing
Wood product manufacturingNonmetallic mineral product manufacturingPrimary metal manufacturingFabricated metal product manufacturingMachinery manufacturingComputer and electronic product manufacturingElectrical equipment and appliance manufacturingMotor vehicles, bodies and trailers, & parts manufacturingOther transportation equipment manufacturingFurniture and related product manufacturingMiscellaneous manufacturing
Nondurable goods manufacturingFood manufacturingBeverage and tobacco product manufacturingTextile millsTextile product millsApparel manufacturingLeather and allied product manufacturingPaper manufacturingPrinting and related support activitiesPetroleum and coal products manufacturingChemical manufacturingPlastics and rubber products manufacturing
Wholesale tradeRetail trade
Motor vehicle and parts dealersFurniture and home furnishings storesElectronics and appliance stores
2009 2010 2011 2012 2013 2014 2015 2016
(D) 62,237 73,024 64,913 70,581 69,336 (D) (D)172,218 190,521 160,840 233,231 235,621 225,500 235,230 238,09731,633 30,197 31,036 37,256 42,837 37,691 35,108 33,06226,095 29,978 41,317 95,651 74,715 75,568 90,549 96,265
114,490 130,346 88,487 100,324 118,069 112,241 109,573 108,770
152,453 143,907 149,002 164,312 169,540 174,997 188,662 200,659139,264 130,120 133,813 149,094 155,363 160,143 173,613 186,627
(D) (D) (D) (D) (D) (D) (D) (D)4,690 3,258 3,821 3,798 6,566 3,685 3,293 3,480
(L) (L) -236 -224 (L) -113 -210 (L)22,548 19,134 22,889 22,708 19,002 20,743 22,866 25,683
(D) (D) (D) (D) (D) (D) (D) (D)8,649 9,350 9,685 (D) (D) (D) (D) (D)
(D) (D) (D) (D) (D) (D) (D) (D)(D) (D) (D) (D) (D) (D) 132,362 142,248(D) (D) (L) (L) 828 821 892 891(L) (L) (L) (L) (L) (L) 155 178(D) (D) (D) (D) (D) (D) (D) (D)
13,189 13,787 15,189 15,218 14,177 14,854 15,049 14,032(D) (D) (D) (D) (D) (D) (D) (D)(D) (D) (D) (D) (D) (D) (D) (D)(D) (D) (D) (D) (D) (D) (D) (D)(D) (L) (L) (D) (D) (D) (D) (D)(D) (D) (D) (L) (L) (L) (L) (L)(L) (L) (L) (L) (L) (L) (L) (L)(D) (D) (D) (D) (D) (D) (D) (D)
1,170 1,011 (D) (D) (D) (D) (D) (D)(L) (L) 60 589 62 (L) 180 112
5,365 5,358 6,572 6,496 5,953 5,866 6,018 5,877(D) (D) (D) (D) (D) (D) (D) (D)
123,861 117,612 131,275 145,540 133,023 134,391 146,537 140,92472,791 74,521 79,065 74,719 80,447 83,365 81,415 90,45611,698 12,136 12,785 13,002 14,292 14,222 14,839 15,4432,286 2,121 2,058 1,957 2,124 2,084 2,154 2,3015,612 6,179 6,686 5,275 5,567 5,924 7,199 7,172
Source: BEA Regional Economic Information SystemBureau of Economic Analysis37

CA05N West Virginia UniversityBureau of Business and Economic Research
Personal Income by Major Source and Earnings by Detailed Industry
Putnam County
Building material and garden supply storesFood and beverage storesHealth and personal care storesGasoline stationsClothing and clothing accessories storesSporting goods, hobby, book and music storesGeneral merchandise storesMiscellaneous store retailersNonstore retailers
Transportation and warehousingAir transportationRail transportationWater transportationTruck transportationTransit and ground passenger transportationPipeline transportationScenic and sightseeing transportationSupport activities for transportationCouriers and messengersWarehousing and storage
InformationPublishing industries, except InternetMotion picture and sound recording industriesBroadcasting, except InternetInternet publishing and broadcasting 8/TelecommunicationsData processing, hosting, and related servicesOther information services 8/
Finance and insuranceMonetary authorities - central bankCredit intermediation and related activitiesSecurities, commodity contracts, investmentsInsurance carriers and related activitiesFunds, trusts, and other financial vehicles
2009 2010 2011 2012 2013 2014 2015 20164,847 4,874 5,551 5,688 5,838 5,763 6,181 6,194
12,421 12,739 12,507 9,954 11,439 12,867 6,953 14,0948,095 8,913 9,722 10,232 10,655 11,418 11,782 12,1447,609 8,796 9,716 9,669 10,420 10,742 11,088 11,807
370 420 1,631 1,577 1,756 1,959 2,193 2,208648 758 642 704 865 798 744 663
13,895 13,232 13,352 13,115 13,405 12,963 14,009 14,2763,632 2,618 2,728 2,144 2,627 3,000 2,886 3,0271,678 1,735 1,687 1,402 1,459 1,625 1,387 1,127
(D) 44,920 50,475 67,259 64,269 69,239 (D) (D)(D) (D) (D) (D) (L) (L) (L) (L)
2,039 1,854 2,132 2,182 2,033 2,348 2,300 2,252(L) 0 (L) (L) (L) (L) (L) (L)
21,969 22,707 27,920 31,546 30,879 34,343 33,214 35,57789 (D) 79 96 (D) (D) (D) (D)(L) (L) (L) 125 60 122 (L) (L)(L) 0 0 (L) (L) (L) (L) (L)
1,601 1,360 (D) (D) (D) (D) 1,741 2,0504,224 4,358 4,719 5,028 4,852 3,198 3,773 4,107
(D) 14,531 13,938 26,476 24,858 26,840 22,399 23,634
23,897 28,034 28,688 20,812 16,628 17,293 18,870 14,1351,552 1,433 1,291 1,173 (D) (D) (D) (D)
(D) (D) (D) (D) (D) (D) (D) (D)491 645 (D) (D) (D) (D) (D) (D)
(NA) (NA) (NA) (NA) (NA) (NA) (NA) (NA)19,244 24,444 26,183 17,776 13,370 13,947 15,517 10,739
(D) (D) (D) (D) (L) (L) (L) (L)(D) (L) (L) (D) (D) (D) (D) (D)
31,618 33,838 34,059 35,604 38,253 40,543 40,645 44,0290 0 0 0 0 0 0 0
13,363 14,351 14,404 14,192 14,474 14,803 15,495 15,3271,836 2,346 2,743 3,159 3,310 4,864 3,962 (D)
16,418 17,133 16,903 18,203 20,403 20,848 21,179 20,424(L) (L) (L) 50 66 (L) (L) (D)
Source: BEA Regional Economic Information SystemBureau of Economic Analysis38
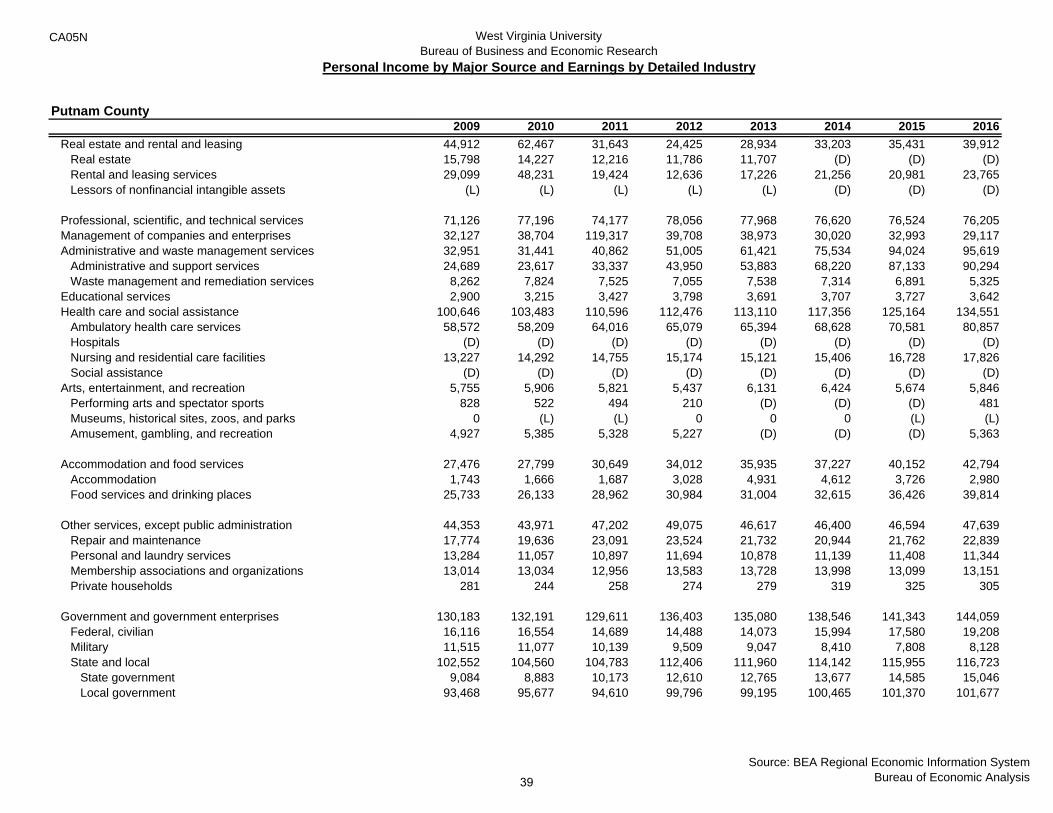
CA05N West Virginia UniversityBureau of Business and Economic Research
Personal Income by Major Source and Earnings by Detailed Industry
Putnam County
Real estate and rental and leasingReal estateRental and leasing servicesLessors of nonfinancial intangible assets
Professional, scientific, and technical servicesManagement of companies and enterprisesAdministrative and waste management services
Administrative and support servicesWaste management and remediation services
Educational servicesHealth care and social assistance
Ambulatory health care servicesHospitalsNursing and residential care facilitiesSocial assistance
Arts, entertainment, and recreationPerforming arts and spectator sportsMuseums, historical sites, zoos, and parksAmusement, gambling, and recreation
Accommodation and food servicesAccommodationFood services and drinking places
Other services, except public administrationRepair and maintenancePersonal and laundry servicesMembership associations and organizationsPrivate households
Government and government enterprisesFederal, civilianMilitaryState and local
State governmentLocal government
2009 2010 2011 2012 2013 2014 2015 201644,912 62,467 31,643 24,425 28,934 33,203 35,431 39,91215,798 14,227 12,216 11,786 11,707 (D) (D) (D)29,099 48,231 19,424 12,636 17,226 21,256 20,981 23,765
(L) (L) (L) (L) (L) (D) (D) (D)
71,126 77,196 74,177 78,056 77,968 76,620 76,524 76,20532,127 38,704 119,317 39,708 38,973 30,020 32,993 29,11732,951 31,441 40,862 51,005 61,421 75,534 94,024 95,61924,689 23,617 33,337 43,950 53,883 68,220 87,133 90,2948,262 7,824 7,525 7,055 7,538 7,314 6,891 5,3252,900 3,215 3,427 3,798 3,691 3,707 3,727 3,642
100,646 103,483 110,596 112,476 113,110 117,356 125,164 134,55158,572 58,209 64,016 65,079 65,394 68,628 70,581 80,857
(D) (D) (D) (D) (D) (D) (D) (D)13,227 14,292 14,755 15,174 15,121 15,406 16,728 17,826
(D) (D) (D) (D) (D) (D) (D) (D)5,755 5,906 5,821 5,437 6,131 6,424 5,674 5,846
828 522 494 210 (D) (D) (D) 4810 (L) (L) 0 0 0 (L) (L)
4,927 5,385 5,328 5,227 (D) (D) (D) 5,363
27,476 27,799 30,649 34,012 35,935 37,227 40,152 42,7941,743 1,666 1,687 3,028 4,931 4,612 3,726 2,980
25,733 26,133 28,962 30,984 31,004 32,615 36,426 39,814
44,353 43,971 47,202 49,075 46,617 46,400 46,594 47,63917,774 19,636 23,091 23,524 21,732 20,944 21,762 22,83913,284 11,057 10,897 11,694 10,878 11,139 11,408 11,34413,014 13,034 12,956 13,583 13,728 13,998 13,099 13,151
281 244 258 274 279 319 325 305
130,183 132,191 129,611 136,403 135,080 138,546 141,343 144,05916,116 16,554 14,689 14,488 14,073 15,994 17,580 19,20811,515 11,077 10,139 9,509 9,047 8,410 7,808 8,128
102,552 104,560 104,783 112,406 111,960 114,142 115,955 116,7239,084 8,883 10,173 12,610 12,765 13,677 14,585 15,046
93,468 95,677 94,610 99,796 99,195 100,465 101,370 101,677
Source: BEA Regional Economic Information SystemBureau of Economic Analysis39
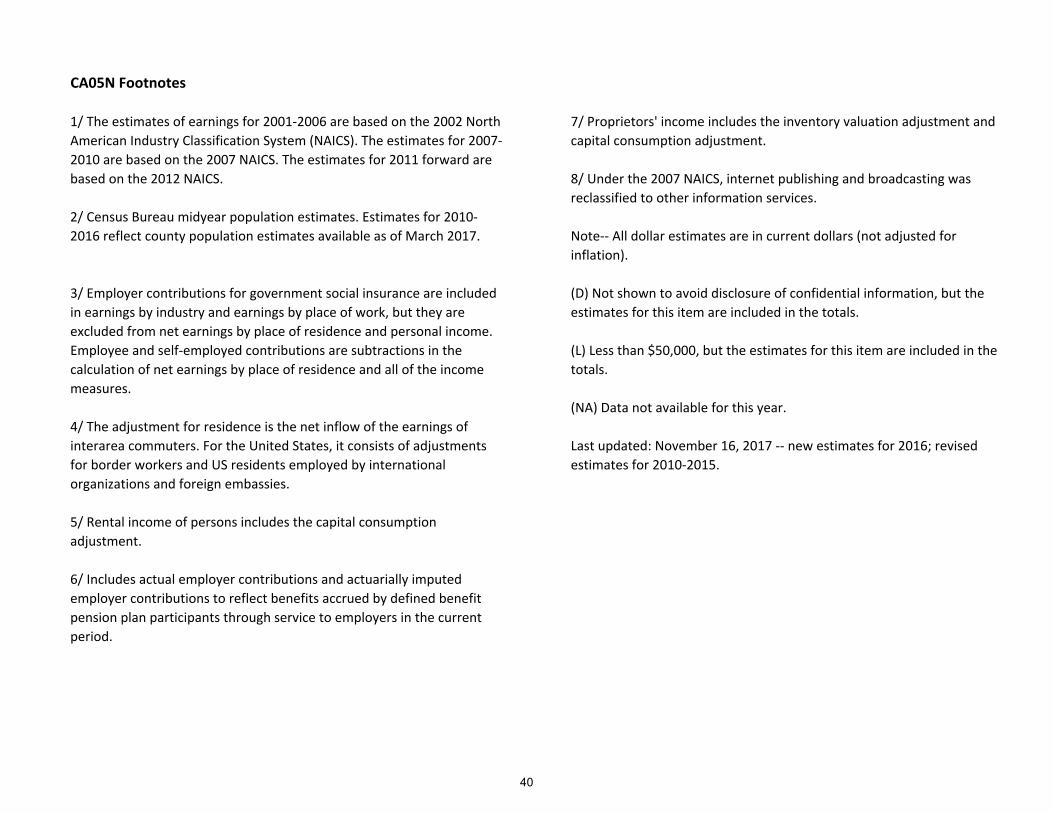
CA05N Footnotes
5/ Rental income of persons includes the capital consumption
adjustment.
6/ Includes actual employer contributions and actuarially imputed
employer contributions to reflect benefits accrued by defined benefit
pension plan participants through service to employers in the current
period.
Last updated: November 16, 2017 ‐‐ new estimates for 2016; revised
estimates for 2010‐2015.
3/ Employer contributions for government social insurance are included
in earnings by industry and earnings by place of work, but they are
excluded from net earnings by place of residence and personal income.
Employee and self‐employed contributions are subtractions in the
calculation of net earnings by place of residence and all of the income
measures.
4/ The adjustment for residence is the net inflow of the earnings of
interarea commuters. For the United States, it consists of adjustments
for border workers and US residents employed by international
organizations and foreign embassies.
(L) Less than $50,000, but the estimates for this item are included in the
totals.
(NA) Data not available for this year.
7/ Proprietors' income includes the inventory valuation adjustment and
capital consumption adjustment.
8/ Under the 2007 NAICS, internet publishing and broadcasting was
reclassified to other information services.
Note‐‐ All dollar estimates are in current dollars (not adjusted for
inflation).
(D) Not shown to avoid disclosure of confidential information, but the
estimates for this item are included in the totals.
1/ The estimates of earnings for 2001‐2006 are based on the 2002 North
American Industry Classification System (NAICS). The estimates for 2007‐
2010 are based on the 2007 NAICS. The estimates for 2011 forward are
based on the 2012 NAICS.
2/ Census Bureau midyear population estimates. Estimates for 2010‐
2016 reflect county population estimates available as of March 2017.
40
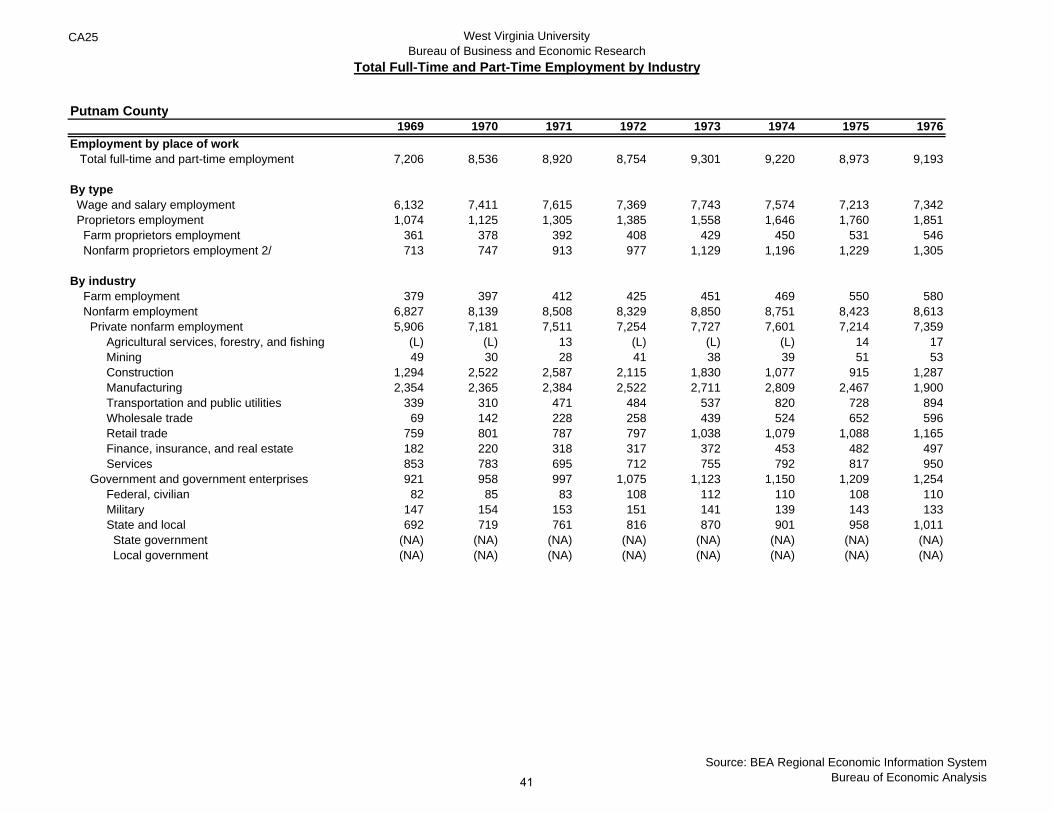
CA25 West Virginia UniversityBureau of Business and Economic Research
Total Full-Time and Part-Time Employment by Industry
Putnam County1969 1970 1971 1972 1973 1974 1975 1976
Employment by place of workTotal full-time and part-time employment 7,206 8,536 8,920 8,754 9,301 9,220 8,973 9,193
By type Wage and salary employment 6,132 7,411 7,615 7,369 7,743 7,574 7,213 7,342 Proprietors employment 1,074 1,125 1,305 1,385 1,558 1,646 1,760 1,851 Farm proprietors employment 361 378 392 408 429 450 531 546 Nonfarm proprietors employment 2/ 713 747 913 977 1,129 1,196 1,229 1,305
By industry Farm employment 379 397 412 425 451 469 550 580 Nonfarm employment 6,827 8,139 8,508 8,329 8,850 8,751 8,423 8,613 Private nonfarm employment 5,906 7,181 7,511 7,254 7,727 7,601 7,214 7,359
Agricultural services, forestry, and fishing (L) (L) 13 (L) (L) (L) 14 17 Mining 49 30 28 41 38 39 51 53 Construction 1,294 2,522 2,587 2,115 1,830 1,077 915 1,287 Manufacturing 2,354 2,365 2,384 2,522 2,711 2,809 2,467 1,900 Transportation and public utilities 339 310 471 484 537 820 728 894 Wholesale trade 69 142 228 258 439 524 652 596 Retail trade 759 801 787 797 1,038 1,079 1,088 1,165 Finance, insurance, and real estate 182 220 318 317 372 453 482 497 Services 853 783 695 712 755 792 817 950
Government and government enterprises 921 958 997 1,075 1,123 1,150 1,209 1,254 Federal, civilian 82 85 83 108 112 110 108 110 Military 147 154 153 151 141 139 143 133 State and local 692 719 761 816 870 901 958 1,011 State government (NA) (NA) (NA) (NA) (NA) (NA) (NA) (NA) Local government (NA) (NA) (NA) (NA) (NA) (NA) (NA) (NA)
Source: BEA Regional Economic Information SystemBureau of Economic Analysis41
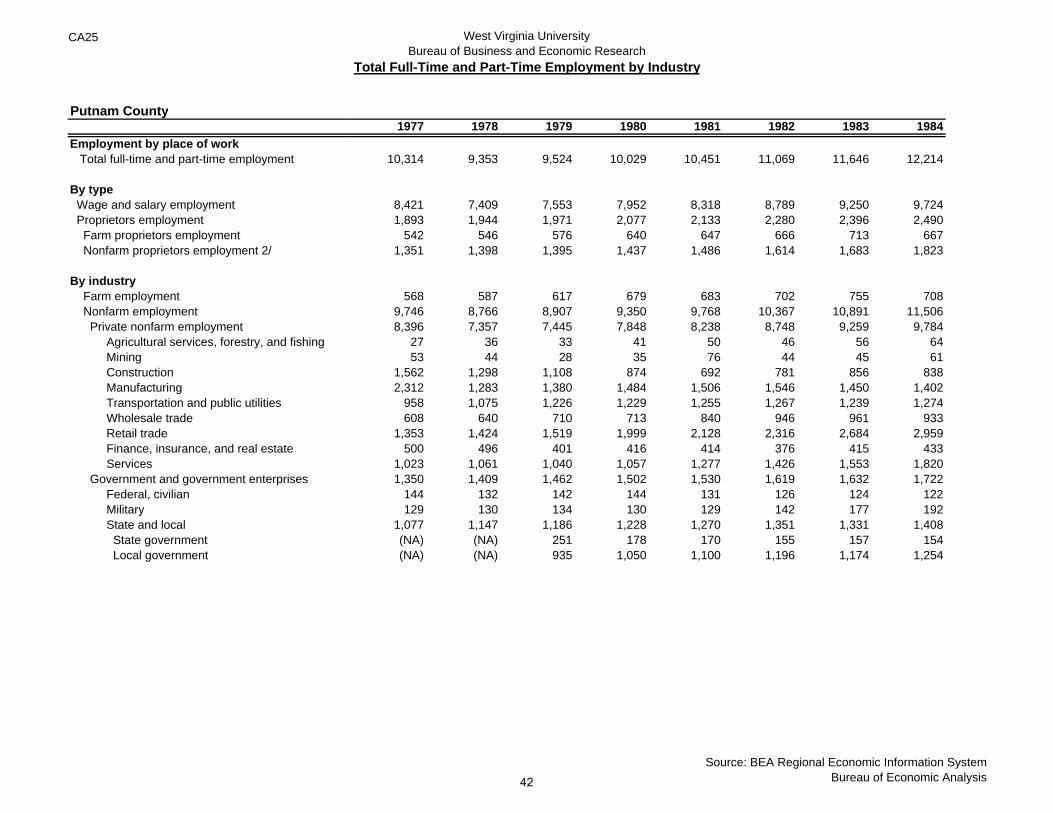
CA25 West Virginia UniversityBureau of Business and Economic Research
Total Full-Time and Part-Time Employment by Industry
Putnam County
Employment by place of workTotal full-time and part-time employment
By type Wage and salary employment Proprietors employment Farm proprietors employment Nonfarm proprietors employment 2/
By industry Farm employment Nonfarm employment Private nonfarm employment
Agricultural services, forestry, and fishing Mining Construction Manufacturing Transportation and public utilities Wholesale trade Retail trade Finance, insurance, and real estate Services
Government and government enterprises Federal, civilian Military State and local State government Local government
1977 1978 1979 1980 1981 1982 1983 1984
10,314 9,353 9,524 10,029 10,451 11,069 11,646 12,214
8,421 7,409 7,553 7,952 8,318 8,789 9,250 9,7241,893 1,944 1,971 2,077 2,133 2,280 2,396 2,490
542 546 576 640 647 666 713 6671,351 1,398 1,395 1,437 1,486 1,614 1,683 1,823
568 587 617 679 683 702 755 7089,746 8,766 8,907 9,350 9,768 10,367 10,891 11,5068,396 7,357 7,445 7,848 8,238 8,748 9,259 9,784
27 36 33 41 50 46 56 6453 44 28 35 76 44 45 61
1,562 1,298 1,108 874 692 781 856 8382,312 1,283 1,380 1,484 1,506 1,546 1,450 1,402
958 1,075 1,226 1,229 1,255 1,267 1,239 1,274608 640 710 713 840 946 961 933
1,353 1,424 1,519 1,999 2,128 2,316 2,684 2,959500 496 401 416 414 376 415 433
1,023 1,061 1,040 1,057 1,277 1,426 1,553 1,8201,350 1,409 1,462 1,502 1,530 1,619 1,632 1,722
144 132 142 144 131 126 124 122129 130 134 130 129 142 177 192
1,077 1,147 1,186 1,228 1,270 1,351 1,331 1,408(NA) (NA) 251 178 170 155 157 154(NA) (NA) 935 1,050 1,100 1,196 1,174 1,254
Source: BEA Regional Economic Information SystemBureau of Economic Analysis42
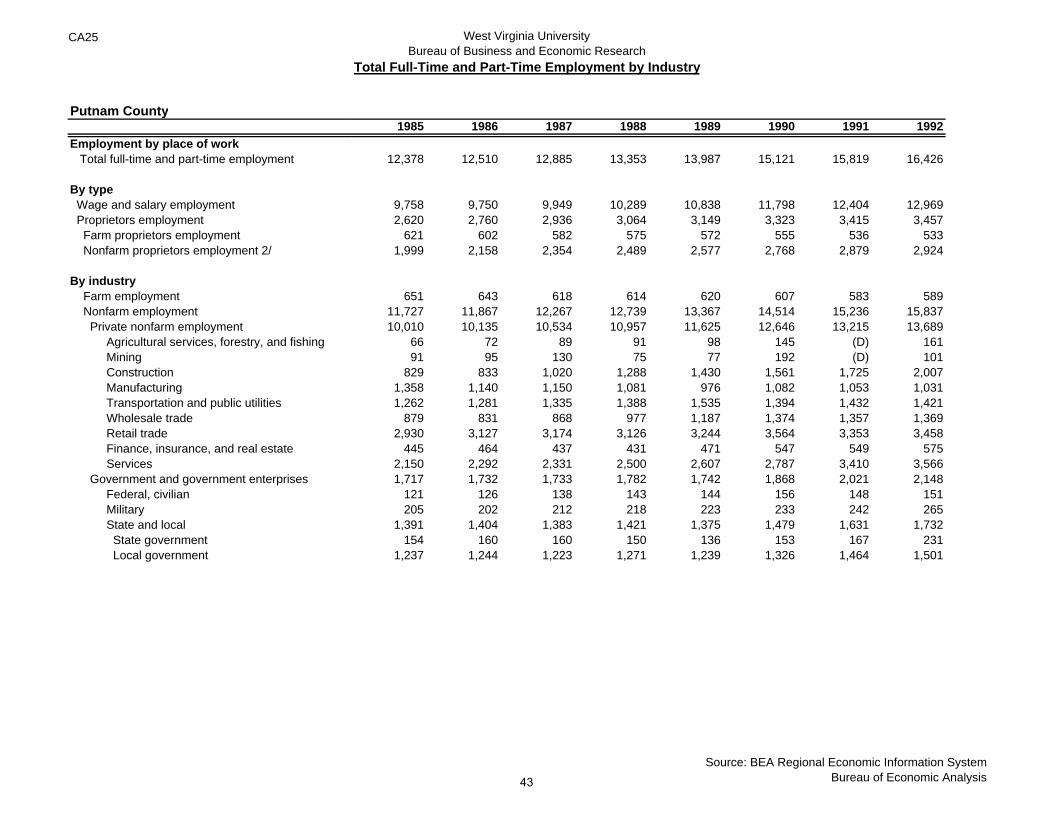
CA25 West Virginia UniversityBureau of Business and Economic Research
Total Full-Time and Part-Time Employment by Industry
Putnam County
Employment by place of workTotal full-time and part-time employment
By type Wage and salary employment Proprietors employment Farm proprietors employment Nonfarm proprietors employment 2/
By industry Farm employment Nonfarm employment Private nonfarm employment
Agricultural services, forestry, and fishing Mining Construction Manufacturing Transportation and public utilities Wholesale trade Retail trade Finance, insurance, and real estate Services
Government and government enterprises Federal, civilian Military State and local State government Local government
1985 1986 1987 1988 1989 1990 1991 1992
12,378 12,510 12,885 13,353 13,987 15,121 15,819 16,426
9,758 9,750 9,949 10,289 10,838 11,798 12,404 12,9692,620 2,760 2,936 3,064 3,149 3,323 3,415 3,457
621 602 582 575 572 555 536 5331,999 2,158 2,354 2,489 2,577 2,768 2,879 2,924
651 643 618 614 620 607 583 58911,727 11,867 12,267 12,739 13,367 14,514 15,236 15,83710,010 10,135 10,534 10,957 11,625 12,646 13,215 13,689
66 72 89 91 98 145 (D) 16191 95 130 75 77 192 (D) 101
829 833 1,020 1,288 1,430 1,561 1,725 2,0071,358 1,140 1,150 1,081 976 1,082 1,053 1,0311,262 1,281 1,335 1,388 1,535 1,394 1,432 1,421
879 831 868 977 1,187 1,374 1,357 1,3692,930 3,127 3,174 3,126 3,244 3,564 3,353 3,458
445 464 437 431 471 547 549 5752,150 2,292 2,331 2,500 2,607 2,787 3,410 3,5661,717 1,732 1,733 1,782 1,742 1,868 2,021 2,148
121 126 138 143 144 156 148 151205 202 212 218 223 233 242 265
1,391 1,404 1,383 1,421 1,375 1,479 1,631 1,732154 160 160 150 136 153 167 231
1,237 1,244 1,223 1,271 1,239 1,326 1,464 1,501
Source: BEA Regional Economic Information SystemBureau of Economic Analysis43
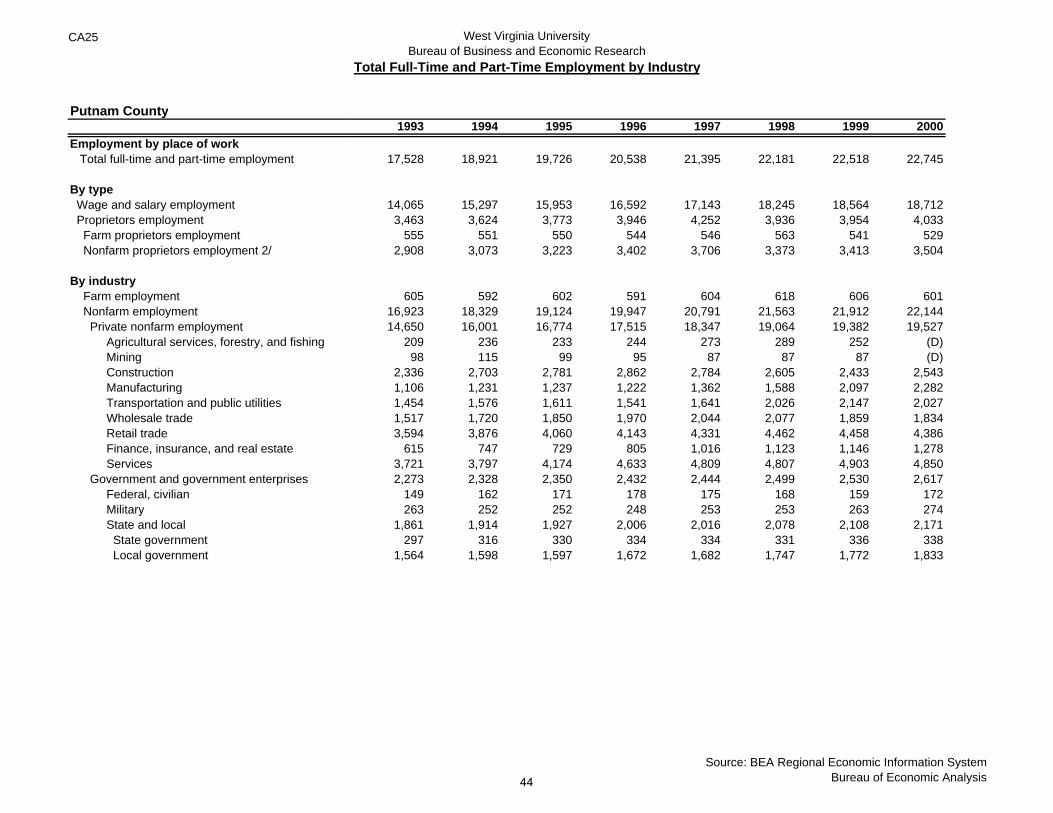
CA25 West Virginia UniversityBureau of Business and Economic Research
Total Full-Time and Part-Time Employment by Industry
Putnam County
Employment by place of workTotal full-time and part-time employment
By type Wage and salary employment Proprietors employment Farm proprietors employment Nonfarm proprietors employment 2/
By industry Farm employment Nonfarm employment Private nonfarm employment
Agricultural services, forestry, and fishing Mining Construction Manufacturing Transportation and public utilities Wholesale trade Retail trade Finance, insurance, and real estate Services
Government and government enterprises Federal, civilian Military State and local State government Local government
1993 1994 1995 1996 1997 1998 1999 2000
17,528 18,921 19,726 20,538 21,395 22,181 22,518 22,745
14,065 15,297 15,953 16,592 17,143 18,245 18,564 18,7123,463 3,624 3,773 3,946 4,252 3,936 3,954 4,033
555 551 550 544 546 563 541 5292,908 3,073 3,223 3,402 3,706 3,373 3,413 3,504
605 592 602 591 604 618 606 60116,923 18,329 19,124 19,947 20,791 21,563 21,912 22,14414,650 16,001 16,774 17,515 18,347 19,064 19,382 19,527
209 236 233 244 273 289 252 (D)98 115 99 95 87 87 87 (D)
2,336 2,703 2,781 2,862 2,784 2,605 2,433 2,5431,106 1,231 1,237 1,222 1,362 1,588 2,097 2,2821,454 1,576 1,611 1,541 1,641 2,026 2,147 2,0271,517 1,720 1,850 1,970 2,044 2,077 1,859 1,8343,594 3,876 4,060 4,143 4,331 4,462 4,458 4,386
615 747 729 805 1,016 1,123 1,146 1,2783,721 3,797 4,174 4,633 4,809 4,807 4,903 4,8502,273 2,328 2,350 2,432 2,444 2,499 2,530 2,617
149 162 171 178 175 168 159 172263 252 252 248 253 253 263 274
1,861 1,914 1,927 2,006 2,016 2,078 2,108 2,171297 316 330 334 334 331 336 338
1,564 1,598 1,597 1,672 1,682 1,747 1,772 1,833
Source: BEA Regional Economic Information SystemBureau of Economic Analysis44
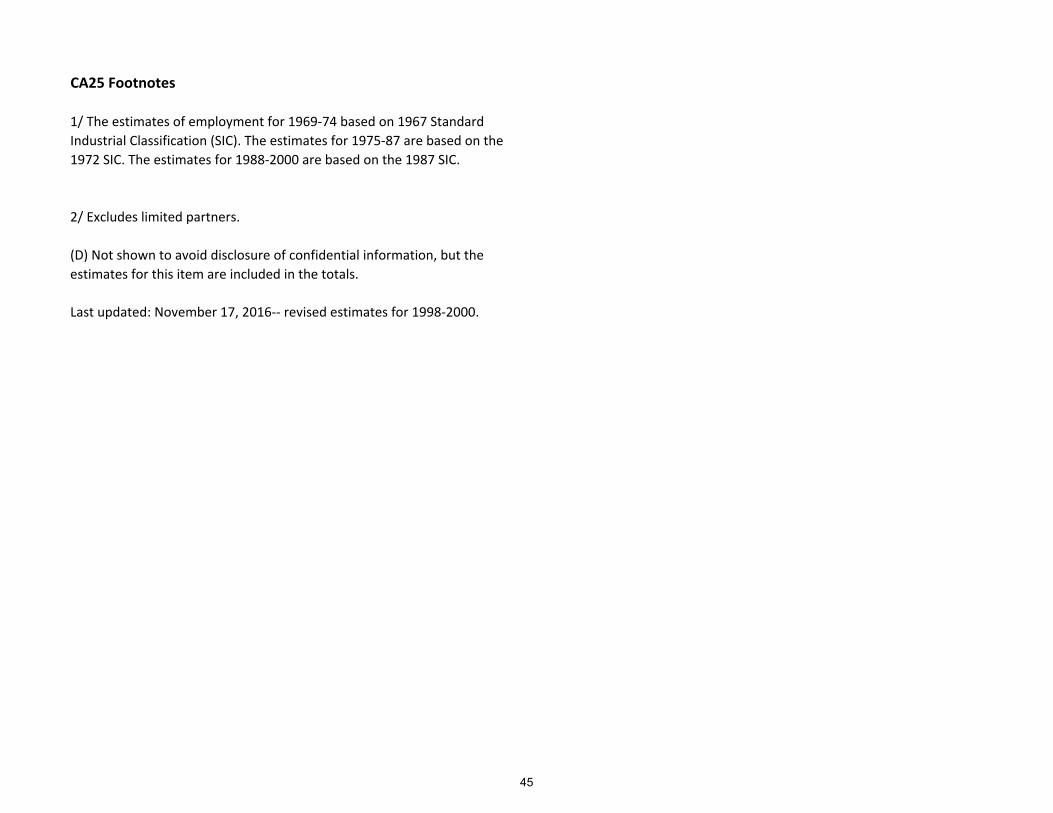
CA25 Footnotes
Last updated: November 17, 2016‐‐ revised estimates for 1998‐2000.
1/ The estimates of employment for 1969‐74 based on 1967 Standard
Industrial Classification (SIC). The estimates for 1975‐87 are based on the
1972 SIC. The estimates for 1988‐2000 are based on the 1987 SIC.
2/ Excludes limited partners.
(D) Not shown to avoid disclosure of confidential information, but the
estimates for this item are included in the totals.
45

CA25N West Virginia UniversityBureau of Business and Economic Research
Total Full-Time and Part-Time Employment by Industry
Putnam County2001 2002 2003 2004 2005 2006 2007 2008
Employment by place of workTotal employment 23,208 23,079 23,541 24,240 24,322 25,102 26,332 27,729
By type Wage and salary employment 18,975 18,783 19,129 19,726 19,599 20,180 21,106 22,555 Proprietors employment 4,233 4,296 4,412 4,514 4,723 4,922 5,226 5,174 Farm proprietors employment 531 485 488 487 500 511 578 555 Nonfarm proprietors employment 2/ 3,702 3,811 3,924 4,027 4,223 4,411 4,648 4,619
By industry Farm employment 616 576 581 558 541 539 593 580 Nonfarm employment 22,592 22,503 22,960 23,682 23,781 24,563 25,739 27,149 Private nonfarm employment 20,037 19,847 20,302 21,053 21,261 21,951 23,098 24,483
Forestry, fishing, and related activities 43 41 37 37 41 50 48 42 Mining 97 113 75 78 98 163 178 246 Utilities 622 618 616 601 596 611 (D) (D) Construction 2,745 2,522 2,775 3,399 3,395 3,573 3,742 4,211 Manufacturing 2,302 2,202 2,162 2,049 1,982 2,062 2,178 2,221 Wholesale trade 1,704 1,732 1,837 1,967 1,749 1,810 1,780 1,900 Retail trade 2,656 2,646 2,682 2,631 2,733 2,715 2,756 2,902 Transportation and warehousing 1,471 1,527 1,446 1,404 1,391 1,288 (D) (D) Information 254 280 291 251 339 357 422 440 Finance and insurance 702 682 711 744 818 807 864 938 Real estate and rental and leasing 654 678 690 733 841 892 964 1,092 Professional, scientific, & technical services 1,242 1,255 1,268 1,227 1,190 1,239 1,359 1,383 Management of companies & enterprises 100 84 71 48 56 129 249 303 Administrative & waste management services 816 826 861 848 929 973 1,186 1,276 Educational services (D) (D) 155 172 162 185 193 172 Health care and social assistance (D) (D) 1,693 1,764 1,777 1,827 1,932 2,093 Arts, entertainment, and recreation 282 298 290 307 397 440 414 432 Accommodation and food services 1,441 1,400 1,395 1,488 1,501 1,493 1,543 1,541 Other services, except public administration 1,127 1,195 1,247 1,305 1,266 1,337 1,357 1,343
Government and government enterprises 2,555 2,656 2,658 2,629 2,520 2,612 2,641 2,666 Federal, civilian 150 153 140 129 136 177 189 187 Military 278 279 281 283 277 272 277 291 State and local 2,127 2,224 2,237 2,217 2,107 2,163 2,175 2,188 State government 330 342 362 332 214 232 228 213 Local government 1,797 1,882 1,875 1,885 1,893 1,931 1,947 1,975
Source: BEA Regional Economic Information SystemBureau of Economic Analysis46
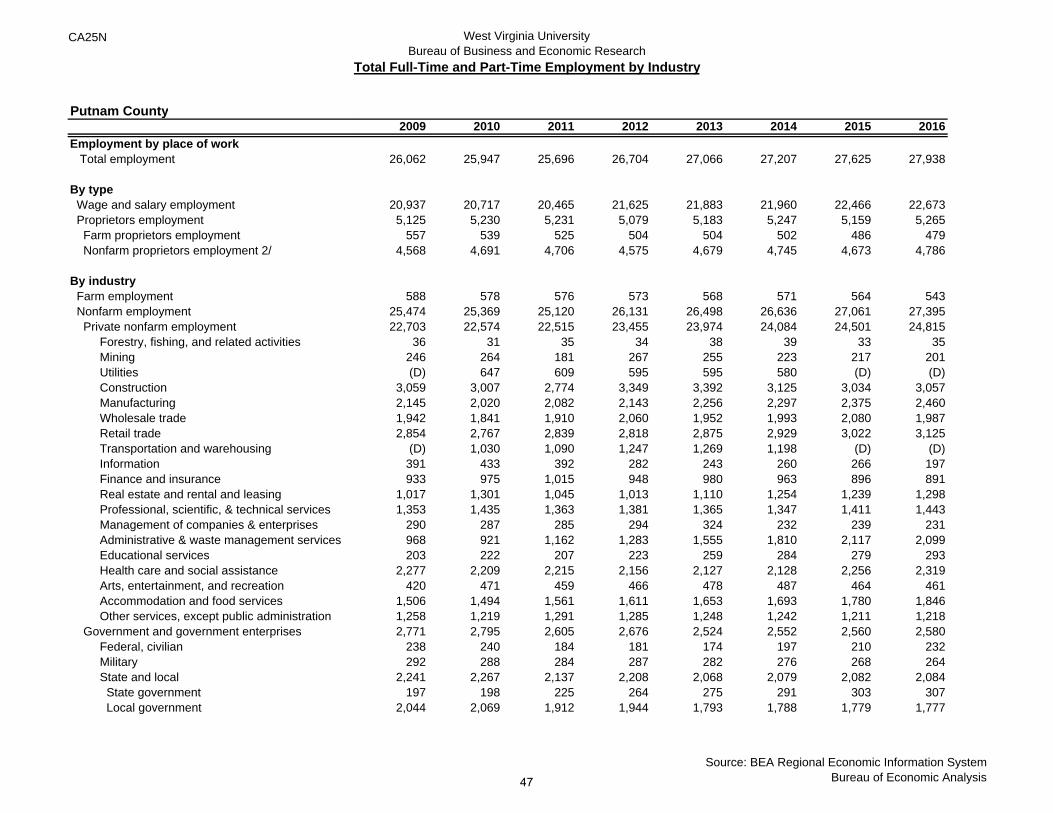
CA25N West Virginia UniversityBureau of Business and Economic Research
Total Full-Time and Part-Time Employment by Industry
Putnam County
Employment by place of workTotal employment
By type Wage and salary employment Proprietors employment Farm proprietors employment Nonfarm proprietors employment 2/
By industry Farm employment Nonfarm employment Private nonfarm employment
Forestry, fishing, and related activities Mining Utilities Construction Manufacturing Wholesale trade Retail trade Transportation and warehousing Information Finance and insurance Real estate and rental and leasing Professional, scientific, & technical services Management of companies & enterprises Administrative & waste management services Educational services Health care and social assistance Arts, entertainment, and recreation Accommodation and food services Other services, except public administration
Government and government enterprises Federal, civilian Military State and local State government Local government
2009 2010 2011 2012 2013 2014 2015 2016
26,062 25,947 25,696 26,704 27,066 27,207 27,625 27,938
20,937 20,717 20,465 21,625 21,883 21,960 22,466 22,6735,125 5,230 5,231 5,079 5,183 5,247 5,159 5,265
557 539 525 504 504 502 486 4794,568 4,691 4,706 4,575 4,679 4,745 4,673 4,786
588 578 576 573 568 571 564 54325,474 25,369 25,120 26,131 26,498 26,636 27,061 27,39522,703 22,574 22,515 23,455 23,974 24,084 24,501 24,815
36 31 35 34 38 39 33 35246 264 181 267 255 223 217 201(D) 647 609 595 595 580 (D) (D)
3,059 3,007 2,774 3,349 3,392 3,125 3,034 3,0572,145 2,020 2,082 2,143 2,256 2,297 2,375 2,4601,942 1,841 1,910 2,060 1,952 1,993 2,080 1,9872,854 2,767 2,839 2,818 2,875 2,929 3,022 3,125
(D) 1,030 1,090 1,247 1,269 1,198 (D) (D)391 433 392 282 243 260 266 197933 975 1,015 948 980 963 896 891
1,017 1,301 1,045 1,013 1,110 1,254 1,239 1,2981,353 1,435 1,363 1,381 1,365 1,347 1,411 1,443
290 287 285 294 324 232 239 231968 921 1,162 1,283 1,555 1,810 2,117 2,099203 222 207 223 259 284 279 293
2,277 2,209 2,215 2,156 2,127 2,128 2,256 2,319420 471 459 466 478 487 464 461
1,506 1,494 1,561 1,611 1,653 1,693 1,780 1,8461,258 1,219 1,291 1,285 1,248 1,242 1,211 1,2182,771 2,795 2,605 2,676 2,524 2,552 2,560 2,580
238 240 184 181 174 197 210 232292 288 284 287 282 276 268 264
2,241 2,267 2,137 2,208 2,068 2,079 2,082 2,084197 198 225 264 275 291 303 307
2,044 2,069 1,912 1,944 1,793 1,788 1,779 1,777
Source: BEA Regional Economic Information SystemBureau of Economic Analysis47
CA25N Footnotes
1/ The estimates of employment for 2001‐2006 are based on the 2002
North American Industry Classification System (NAICS). The estimates for
2007‐2010 are based on the 2007 NAICS. The estimates for 2011 forward
are based on the 2012 NAICS.
2/ Excludes limited partners.
(D) Not shown to avoid disclosure of confidential information, but the
estimates for this item are included in the totals.
Last updated: November 16, 2017 ‐‐ new estimates for 2016; revised
estimates for 2014‐2015.
48

CA06N West Virginia UniversityBureau of Business and Economic Research
Compensation by Industry (Thousands of Dollars)
Putnam County2001 2002 2003 2004 2005 2006 2007 2008
Compensation of employees ($000) 1/ 746,570 768,615 810,445 880,979 893,876 982,490 1,072,935 1,185,129
Wages and salaries 589,322 607,783 638,396 697,963 707,806 773,797 855,838 953,014 Supplements to wages and salaries 157,248 160,832 172,049 183,016 186,070 208,693 217,097 232,115 Employer contrib. for employee pension & insurance funds 2/ 84,007 91,074 96,956 103,990 106,453 129,312 140,873 156,157 Employer contributions for government social insurance 73,241 69,758 75,093 79,026 79,617 79,381 76,224 75,958
Average compensation per job (dollars) 3/ 39,345 40,921 42,367 44,661 45,608 48,686 50,836 52,544
Compensation of Employees by Industry ($000) Farm compensation 1,723 2,074 2,092 1,918 1,473 1,470 1,534 1,606 Nonfarm compensation 744,847 766,541 808,353 879,061 892,403 981,020 1,071,401 1,183,523 Private nonfarm compensation 653,512 670,058 704,809 774,487 789,606 871,353 957,896 1,063,345 Forestry, fishing, and related activities 377 135 186 226 296 486 432 211 Forestry and logging (D) (D) (D) (D) (D) (D) (D) (D) Fishing, hunting, and trapping 0 0 0 0 0 0 0 0 Agriculture and forestry support activities (D) (D) (D) (D) (D) (D) (D) (D)
Mining 1,092 3,238 743 1,126 2,128 7,020 7,545 10,764 Oil and gas extraction (D) (D) (D) (D) (D) (D) (D) (D) Mining (except oil and gas) (D) (D) (D) (D) (D) (D) (D) (D) Support activities for mining (D) (D) 0 (D) (D) 5,848 5,631 7,891
Utilities 48,403 49,206 48,859 50,377 50,644 59,404 (D) (D) Construction 116,525 98,706 113,209 155,668 156,080 185,293 200,485 247,239 Construction of buildings 14,549 21,252 19,104 23,287 25,773 35,548 39,250 38,925 Heavy and civil engineering construction 29,196 28,938 32,871 49,337 40,665 34,213 26,731 82,721 Specialty trade contractors 72,780 48,516 61,234 83,044 89,642 115,532 134,504 125,593
Manufacturing 134,420 140,335 146,473 152,644 141,745 151,011 173,306 164,913 Durable goods manufacturing 80,414 97,427 106,964 113,120 121,125 134,565 159,068 150,173 Wood product manufacturing (D) (D) (D) (D) (D) (D) (D) (D) Nonmetallic mineral product manufacturing 3,454 3,619 3,696 3,984 3,946 5,427 4,732 4,931 Primary metal manufacturing 0 0 0 0 0 0 (D) (D) Fabricated metal product manufacturing 11,140 12,117 11,521 11,335 14,952 16,876 17,250 19,378 Machinery manufacturing (D) (D) (D) (D) (D) (D) (D) (D) Computer and electronic product manufacturing 3,618 4,352 4,281 4,468 3,039 (D) (D) 8,506 Electrical equipment and appliance manufacturing (D) (D) (D) (D) (D) (D) (D) (D) Motor vehicles, bodies & trailers, & parts manufacturing (D) (D) (D) (D) (D) (D) (D) (D)
Source: BEA Regional Economic Information SystemBureau of Economic Analysis49
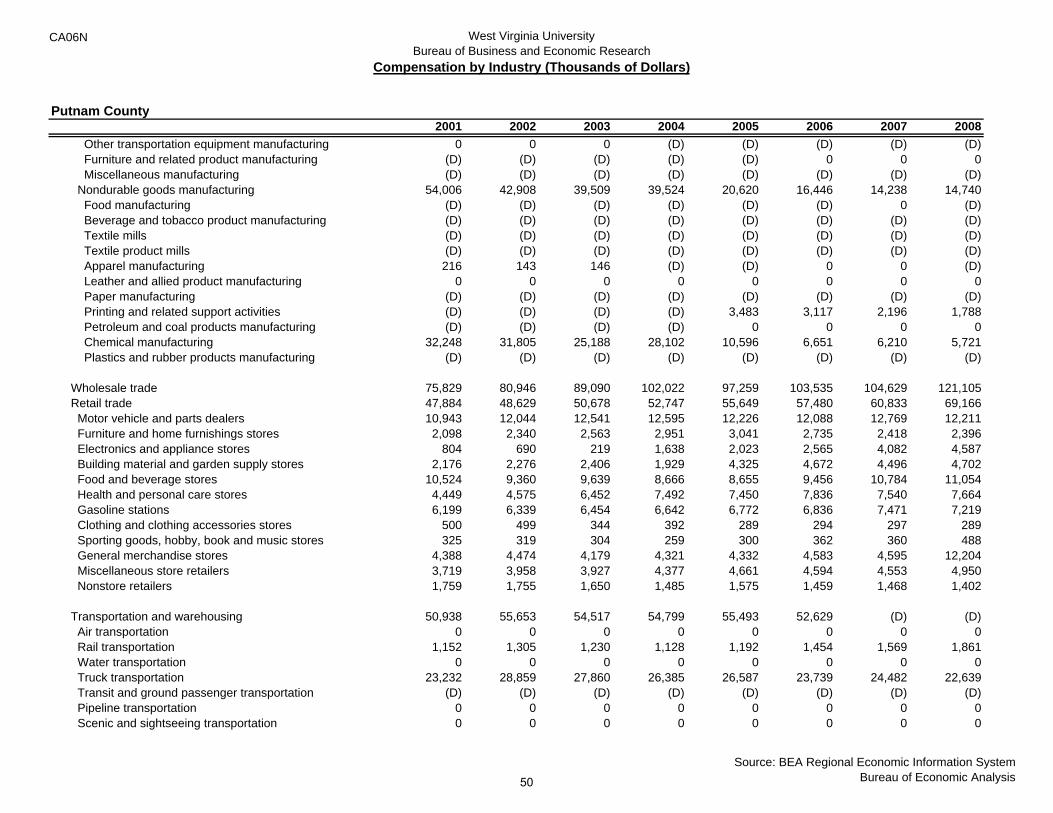
CA06N West Virginia UniversityBureau of Business and Economic Research
Compensation by Industry (Thousands of Dollars)
Putnam County2001 2002 2003 2004 2005 2006 2007 2008
Other transportation equipment manufacturing 0 0 0 (D) (D) (D) (D) (D) Furniture and related product manufacturing (D) (D) (D) (D) (D) 0 0 0 Miscellaneous manufacturing (D) (D) (D) (D) (D) (D) (D) (D) Nondurable goods manufacturing 54,006 42,908 39,509 39,524 20,620 16,446 14,238 14,740 Food manufacturing (D) (D) (D) (D) (D) (D) 0 (D) Beverage and tobacco product manufacturing (D) (D) (D) (D) (D) (D) (D) (D) Textile mills (D) (D) (D) (D) (D) (D) (D) (D) Textile product mills (D) (D) (D) (D) (D) (D) (D) (D) Apparel manufacturing 216 143 146 (D) (D) 0 0 (D) Leather and allied product manufacturing 0 0 0 0 0 0 0 0 Paper manufacturing (D) (D) (D) (D) (D) (D) (D) (D) Printing and related support activities (D) (D) (D) (D) 3,483 3,117 2,196 1,788 Petroleum and coal products manufacturing (D) (D) (D) (D) 0 0 0 0 Chemical manufacturing 32,248 31,805 25,188 28,102 10,596 6,651 6,210 5,721 Plastics and rubber products manufacturing (D) (D) (D) (D) (D) (D) (D) (D)
Wholesale trade 75,829 80,946 89,090 102,022 97,259 103,535 104,629 121,105 Retail trade 47,884 48,629 50,678 52,747 55,649 57,480 60,833 69,166 Motor vehicle and parts dealers 10,943 12,044 12,541 12,595 12,226 12,088 12,769 12,211 Furniture and home furnishings stores 2,098 2,340 2,563 2,951 3,041 2,735 2,418 2,396 Electronics and appliance stores 804 690 219 1,638 2,023 2,565 4,082 4,587 Building material and garden supply stores 2,176 2,276 2,406 1,929 4,325 4,672 4,496 4,702 Food and beverage stores 10,524 9,360 9,639 8,666 8,655 9,456 10,784 11,054 Health and personal care stores 4,449 4,575 6,452 7,492 7,450 7,836 7,540 7,664 Gasoline stations 6,199 6,339 6,454 6,642 6,772 6,836 7,471 7,219 Clothing and clothing accessories stores 500 499 344 392 289 294 297 289 Sporting goods, hobby, book and music stores 325 319 304 259 300 362 360 488 General merchandise stores 4,388 4,474 4,179 4,321 4,332 4,583 4,595 12,204 Miscellaneous store retailers 3,719 3,958 3,927 4,377 4,661 4,594 4,553 4,950 Nonstore retailers 1,759 1,755 1,650 1,485 1,575 1,459 1,468 1,402
Transportation and warehousing 50,938 55,653 54,517 54,799 55,493 52,629 (D) (D) Air transportation 0 0 0 0 0 0 0 0 Rail transportation 1,152 1,305 1,230 1,128 1,192 1,454 1,569 1,861 Water transportation 0 0 0 0 0 0 0 0 Truck transportation 23,232 28,859 27,860 26,385 26,587 23,739 24,482 22,639 Transit and ground passenger transportation (D) (D) (D) (D) (D) (D) (D) (D) Pipeline transportation 0 0 0 0 0 0 0 0 Scenic and sightseeing transportation 0 0 0 0 0 0 0 0
Source: BEA Regional Economic Information SystemBureau of Economic Analysis50

CA06N West Virginia UniversityBureau of Business and Economic Research
Compensation by Industry (Thousands of Dollars)
Putnam County2001 2002 2003 2004 2005 2006 2007 2008
Support activities for transportation 4,072 3,603 3,922 (D) (D) 2,893 1,805 1,542 Couriers and messengers 2,660 2,468 2,930 3,307 2,615 2,796 3,337 3,609 Warehousing and storage (D) (D) (D) 20,880 21,994 (D) (D) (D)
Information 12,255 15,802 16,309 14,481 16,149 18,751 21,243 23,014 Publishing industries, except Internet (D) (D) (D) (D) 2,068 (D) (D) 1,942 Motion picture and sound recording industries 0 0 0 (D) (D) (D) (D) (D) Broadcasting, except Internet (D) (D) (D) 2,641 2,538 2,738 2,810 2,949 Internet publishing and broadcasting 4/ 0 0 0 0 0 0 (NA) (NA) Telecommunications 8,711 12,281 11,542 9,269 10,730 12,415 15,312 16,611 Data processing, hosting, and related services (D) (D) (D) (D) (D) 1,422 (D) (D) Other information services 4/ (D) (D) (D) (D) 0 0 (D) (D)
Finance and insurance 18,366 18,305 20,034 23,958 29,235 30,065 28,379 29,786 Monetary authorities - central bank 0 0 0 0 0 0 0 0 Credit intermediation and related activities 10,138 9,913 9,957 10,499 11,703 11,975 11,682 12,942 Securities, commodity contracts, investments (D) (D) (D) 1,466 (D) (D) 1,199 1,486 Insurance carriers and related activities (D) (D) (D) 11,993 (D) (D) 15,498 15,358 Funds, trusts, and other financial vehicles 0 0 0 0 0 0 0 0
Real estate and rental and leasing 7,577 9,885 9,332 10,029 11,151 12,994 15,590 27,177 Real estate 1,618 1,984 2,930 3,575 4,371 3,697 2,492 2,428 Rental and leasing services 5,959 7,901 6,402 6,454 6,780 9,297 13,098 24,749 Lessors of nonfinancial intangible assets 0 0 0 0 0 0 0 0
Professional, scientific, and technical services 40,295 44,374 42,441 33,647 36,430 40,778 49,549 52,016 Management of companies and enterprises 6,630 5,496 3,936 2,905 6,504 12,214 27,084 30,557 Administrative and waste management services 12,785 15,163 17,252 19,654 25,767 27,802 33,587 38,650 Administrative and support services 9,630 12,057 14,642 16,096 16,514 18,450 25,113 30,025 Waste management and remediation services 3,155 3,106 2,610 3,558 9,253 9,352 8,474 8,625
Educational services (D) (D) 1,558 2,037 1,606 1,925 1,901 1,632 Health care and social assistance (D) (D) 48,661 52,385 55,164 57,113 60,567 69,993 Ambulatory health care services 15,541 16,794 20,241 23,537 24,847 24,660 25,132 29,535 Hospitals (D) (D) (D) (D) (D) 19,052 21,540 26,004 Nursing and residential care facilities 8,413 9,732 10,286 10,521 10,593 11,208 10,980 11,553 Social assistance 1,599 1,029 (D) (D) (D) 2,193 2,915 2,901
Arts, entertainment, and recreation 2,607 3,137 3,068 3,504 4,752 5,351 4,682 5,379
Source: BEA Regional Economic Information SystemBureau of Economic Analysis51
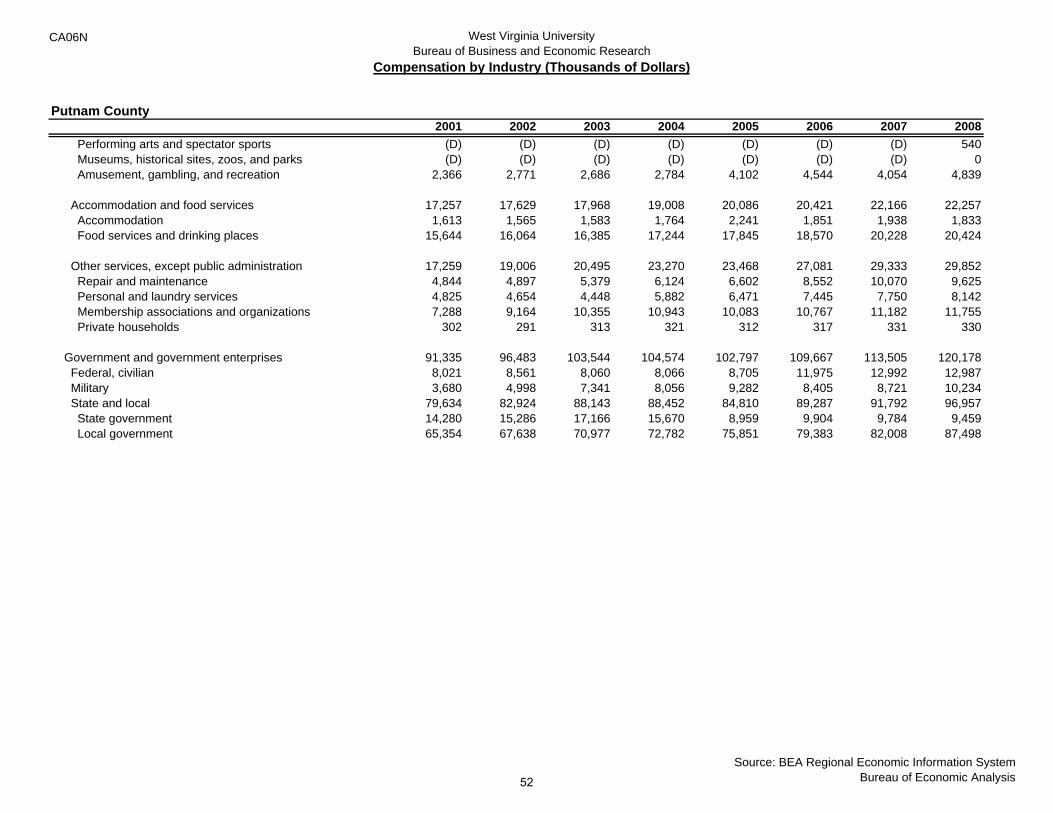
CA06N West Virginia UniversityBureau of Business and Economic Research
Compensation by Industry (Thousands of Dollars)
Putnam County2001 2002 2003 2004 2005 2006 2007 2008
Performing arts and spectator sports (D) (D) (D) (D) (D) (D) (D) 540 Museums, historical sites, zoos, and parks (D) (D) (D) (D) (D) (D) (D) 0 Amusement, gambling, and recreation 2,366 2,771 2,686 2,784 4,102 4,544 4,054 4,839
Accommodation and food services 17,257 17,629 17,968 19,008 20,086 20,421 22,166 22,257 Accommodation 1,613 1,565 1,583 1,764 2,241 1,851 1,938 1,833 Food services and drinking places 15,644 16,064 16,385 17,244 17,845 18,570 20,228 20,424
Other services, except public administration 17,259 19,006 20,495 23,270 23,468 27,081 29,333 29,852 Repair and maintenance 4,844 4,897 5,379 6,124 6,602 8,552 10,070 9,625 Personal and laundry services 4,825 4,654 4,448 5,882 6,471 7,445 7,750 8,142 Membership associations and organizations 7,288 9,164 10,355 10,943 10,083 10,767 11,182 11,755 Private households 302 291 313 321 312 317 331 330
Government and government enterprises 91,335 96,483 103,544 104,574 102,797 109,667 113,505 120,178 Federal, civilian 8,021 8,561 8,060 8,066 8,705 11,975 12,992 12,987 Military 3,680 4,998 7,341 8,056 9,282 8,405 8,721 10,234 State and local 79,634 82,924 88,143 88,452 84,810 89,287 91,792 96,957 State government 14,280 15,286 17,166 15,670 8,959 9,904 9,784 9,459 Local government 65,354 67,638 70,977 72,782 75,851 79,383 82,008 87,498
Source: BEA Regional Economic Information SystemBureau of Economic Analysis52
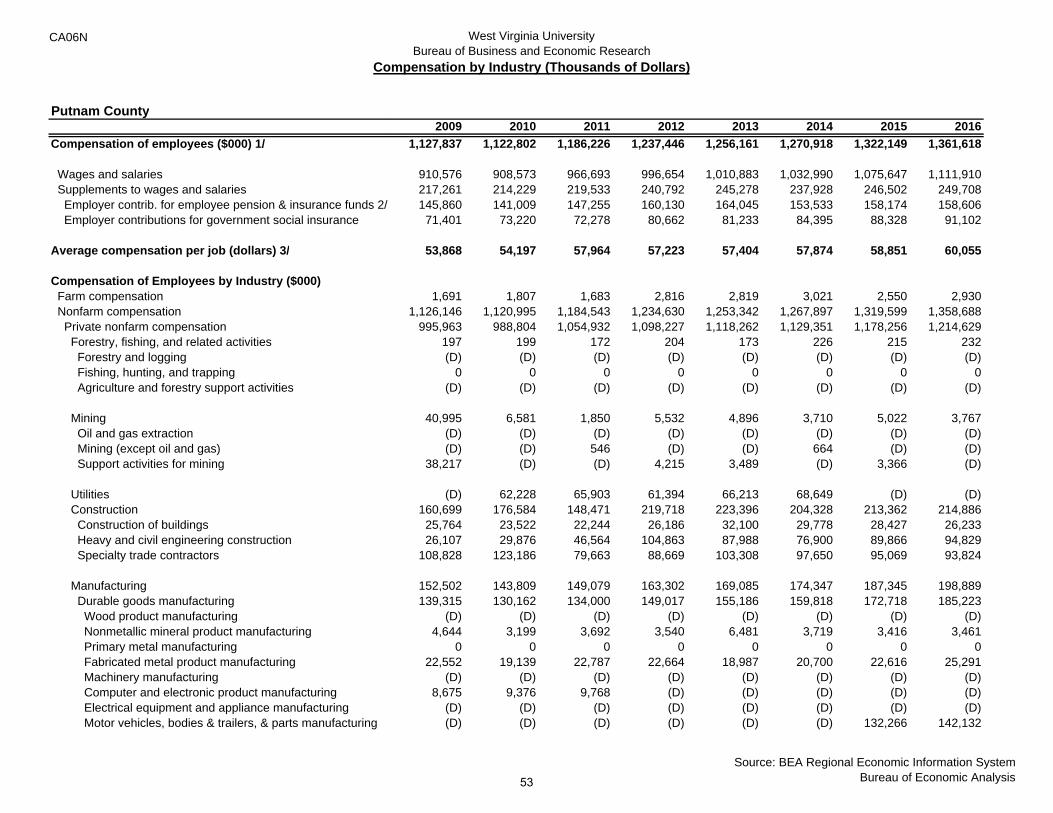
CA06N West Virginia UniversityBureau of Business and Economic Research
Compensation by Industry (Thousands of Dollars)
Putnam County
Compensation of employees ($000) 1/
Wages and salaries Supplements to wages and salaries Employer contrib. for employee pension & insurance funds 2/ Employer contributions for government social insurance
Average compensation per job (dollars) 3/
Compensation of Employees by Industry ($000) Farm compensation Nonfarm compensation Private nonfarm compensation Forestry, fishing, and related activities Forestry and logging Fishing, hunting, and trapping Agriculture and forestry support activities
Mining Oil and gas extraction Mining (except oil and gas) Support activities for mining
Utilities Construction Construction of buildings Heavy and civil engineering construction Specialty trade contractors
Manufacturing Durable goods manufacturing Wood product manufacturing Nonmetallic mineral product manufacturing Primary metal manufacturing Fabricated metal product manufacturing Machinery manufacturing Computer and electronic product manufacturing Electrical equipment and appliance manufacturing Motor vehicles, bodies & trailers, & parts manufacturing
2009 2010 2011 2012 2013 2014 2015 20161,127,837 1,122,802 1,186,226 1,237,446 1,256,161 1,270,918 1,322,149 1,361,618
910,576 908,573 966,693 996,654 1,010,883 1,032,990 1,075,647 1,111,910217,261 214,229 219,533 240,792 245,278 237,928 246,502 249,708145,860 141,009 147,255 160,130 164,045 153,533 158,174 158,60671,401 73,220 72,278 80,662 81,233 84,395 88,328 91,102
53,868 54,197 57,964 57,223 57,404 57,874 58,851 60,055
1,691 1,807 1,683 2,816 2,819 3,021 2,550 2,9301,126,146 1,120,995 1,184,543 1,234,630 1,253,342 1,267,897 1,319,599 1,358,688
995,963 988,804 1,054,932 1,098,227 1,118,262 1,129,351 1,178,256 1,214,629197 199 172 204 173 226 215 232(D) (D) (D) (D) (D) (D) (D) (D)
0 0 0 0 0 0 0 0(D) (D) (D) (D) (D) (D) (D) (D)
40,995 6,581 1,850 5,532 4,896 3,710 5,022 3,767(D) (D) (D) (D) (D) (D) (D) (D)(D) (D) 546 (D) (D) 664 (D) (D)
38,217 (D) (D) 4,215 3,489 (D) 3,366 (D)
(D) 62,228 65,903 61,394 66,213 68,649 (D) (D)160,699 176,584 148,471 219,718 223,396 204,328 213,362 214,88625,764 23,522 22,244 26,186 32,100 29,778 28,427 26,23326,107 29,876 46,564 104,863 87,988 76,900 89,866 94,829
108,828 123,186 79,663 88,669 103,308 97,650 95,069 93,824
152,502 143,809 149,079 163,302 169,085 174,347 187,345 198,889139,315 130,162 134,000 149,017 155,186 159,818 172,718 185,223
(D) (D) (D) (D) (D) (D) (D) (D)4,644 3,199 3,692 3,540 6,481 3,719 3,416 3,461
0 0 0 0 0 0 0 022,552 19,139 22,787 22,664 18,987 20,700 22,616 25,291
(D) (D) (D) (D) (D) (D) (D) (D)8,675 9,376 9,768 (D) (D) (D) (D) (D)
(D) (D) (D) (D) (D) (D) (D) (D)(D) (D) (D) (D) (D) (D) 132,266 142,132
Source: BEA Regional Economic Information SystemBureau of Economic Analysis53

CA06N West Virginia UniversityBureau of Business and Economic Research
Compensation by Industry (Thousands of Dollars)
Putnam County
Other transportation equipment manufacturing Furniture and related product manufacturing Miscellaneous manufacturing Nondurable goods manufacturing Food manufacturing Beverage and tobacco product manufacturing Textile mills Textile product mills Apparel manufacturing Leather and allied product manufacturing Paper manufacturing Printing and related support activities Petroleum and coal products manufacturing Chemical manufacturing Plastics and rubber products manufacturing
Wholesale trade Retail trade Motor vehicle and parts dealers Furniture and home furnishings stores Electronics and appliance stores Building material and garden supply stores Food and beverage stores Health and personal care stores Gasoline stations Clothing and clothing accessories stores Sporting goods, hobby, book and music stores General merchandise stores Miscellaneous store retailers Nonstore retailers
Transportation and warehousing Air transportation Rail transportation Water transportation Truck transportation Transit and ground passenger transportation Pipeline transportation Scenic and sightseeing transportation
2009 2010 2011 2012 2013 2014 2015 2016(D) (D) 0 0 820 797 803 802
0 0 0 0 0 0 0 0(D) (D) (D) (D) (D) (D) (D) (D)
13,187 13,647 15,079 14,285 13,899 14,529 14,627 13,666(D) (D) (D) (D) (D) (D) (D) (D)(D) (D) (D) (D) (D) (D) (D) (D)(D) (D) (D) (D) (D) (D) (D) (D)(D) 0 0 (D) (D) (D) (D) (D)(D) (D) (D) 0 0 0 0 0
0 0 0 0 0 0 0 0(D) (D) (D) (D) (D) (D) (D) (D)
1,199 1,048 (D) (D) (D) (D) (D) (D)0 0 0 0 0 0 0 0
5,350 5,256 6,549 6,471 5,925 5,713 5,761 5,610(D) (D) (D) (D) (D) (D) (D) (D)
122,517 114,431 127,004 141,280 129,482 130,293 140,987 135,15168,155 68,645 71,791 72,083 76,174 78,585 78,981 88,22510,630 10,565 10,652 12,379 13,447 13,382 14,353 14,8832,036 1,912 1,870 1,901 2,032 1,981 2,101 2,2545,608 6,169 6,636 5,230 5,497 5,851 7,171 7,1554,773 4,790 5,407 5,608 5,701 5,589 6,101 6,119
11,523 11,932 11,696 9,695 11,039 12,374 6,756 13,9597,558 8,405 9,261 10,086 10,425 11,143 11,622 11,9856,940 7,561 7,986 8,920 9,133 9,464 10,462 11,235
323 330 1,384 1,475 1,552 1,711 2,061 2,098517 521 451 626 729 612 659 628
13,874 13,192 13,299 13,096 13,389 12,946 13,997 14,2562,926 1,809 1,795 1,800 2,014 2,233 2,483 2,6641,447 1,459 1,354 1,267 1,216 1,299 1,215 989
(D) 42,480 46,398 62,982 63,455 67,282 (D) (D)(D) (D) (D) (D) 0 0 0 0
2,037 1,853 2,131 2,181 2,033 2,348 2,300 2,2520 0 0 0 0 0 0 0
20,132 20,634 24,402 28,112 30,386 32,977 31,990 35,1170 (D) 0 0 (D) (D) (D) (D)0 0 0 0 0 0 0 00 0 0 0 0 0 0 0
Source: BEA Regional Economic Information SystemBureau of Economic Analysis54
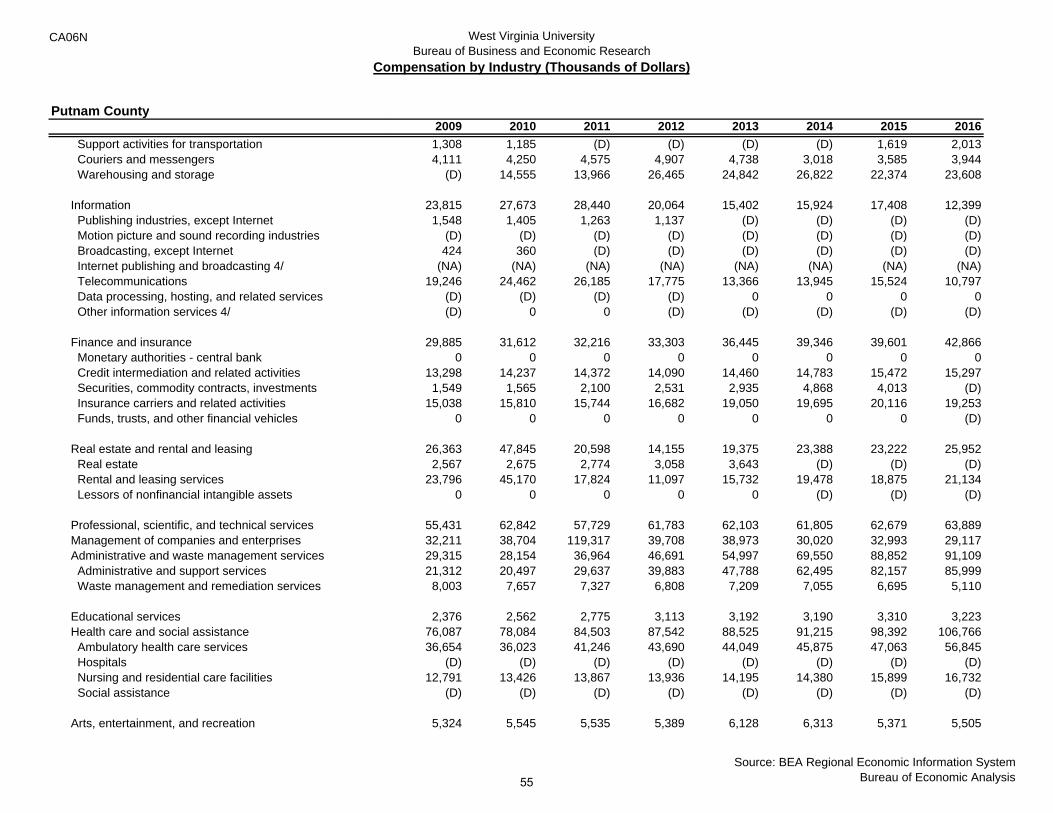
CA06N West Virginia UniversityBureau of Business and Economic Research
Compensation by Industry (Thousands of Dollars)
Putnam County
Support activities for transportation Couriers and messengers Warehousing and storage
Information Publishing industries, except Internet Motion picture and sound recording industries Broadcasting, except Internet Internet publishing and broadcasting 4/ Telecommunications Data processing, hosting, and related services Other information services 4/
Finance and insurance Monetary authorities - central bank Credit intermediation and related activities Securities, commodity contracts, investments Insurance carriers and related activities Funds, trusts, and other financial vehicles
Real estate and rental and leasing Real estate Rental and leasing services Lessors of nonfinancial intangible assets
Professional, scientific, and technical services Management of companies and enterprises Administrative and waste management services Administrative and support services Waste management and remediation services
Educational services Health care and social assistance Ambulatory health care services Hospitals Nursing and residential care facilities Social assistance
Arts, entertainment, and recreation
2009 2010 2011 2012 2013 2014 2015 20161,308 1,185 (D) (D) (D) (D) 1,619 2,0134,111 4,250 4,575 4,907 4,738 3,018 3,585 3,944
(D) 14,555 13,966 26,465 24,842 26,822 22,374 23,608
23,815 27,673 28,440 20,064 15,402 15,924 17,408 12,3991,548 1,405 1,263 1,137 (D) (D) (D) (D)
(D) (D) (D) (D) (D) (D) (D) (D)424 360 (D) (D) (D) (D) (D) (D)
(NA) (NA) (NA) (NA) (NA) (NA) (NA) (NA)19,246 24,462 26,185 17,775 13,366 13,945 15,524 10,797
(D) (D) (D) (D) 0 0 0 0(D) 0 0 (D) (D) (D) (D) (D)
29,885 31,612 32,216 33,303 36,445 39,346 39,601 42,8660 0 0 0 0 0 0 0
13,298 14,237 14,372 14,090 14,460 14,783 15,472 15,2971,549 1,565 2,100 2,531 2,935 4,868 4,013 (D)
15,038 15,810 15,744 16,682 19,050 19,695 20,116 19,2530 0 0 0 0 0 0 (D)
26,363 47,845 20,598 14,155 19,375 23,388 23,222 25,9522,567 2,675 2,774 3,058 3,643 (D) (D) (D)
23,796 45,170 17,824 11,097 15,732 19,478 18,875 21,1340 0 0 0 0 (D) (D) (D)
55,431 62,842 57,729 61,783 62,103 61,805 62,679 63,88932,211 38,704 119,317 39,708 38,973 30,020 32,993 29,11729,315 28,154 36,964 46,691 54,997 69,550 88,852 91,10921,312 20,497 29,637 39,883 47,788 62,495 82,157 85,9998,003 7,657 7,327 6,808 7,209 7,055 6,695 5,110
2,376 2,562 2,775 3,113 3,192 3,190 3,310 3,22376,087 78,084 84,503 87,542 88,525 91,215 98,392 106,76636,654 36,023 41,246 43,690 44,049 45,875 47,063 56,845
(D) (D) (D) (D) (D) (D) (D) (D)12,791 13,426 13,867 13,936 14,195 14,380 15,899 16,732
(D) (D) (D) (D) (D) (D) (D) (D)
5,324 5,545 5,535 5,389 6,128 6,313 5,371 5,505
Source: BEA Regional Economic Information SystemBureau of Economic Analysis55
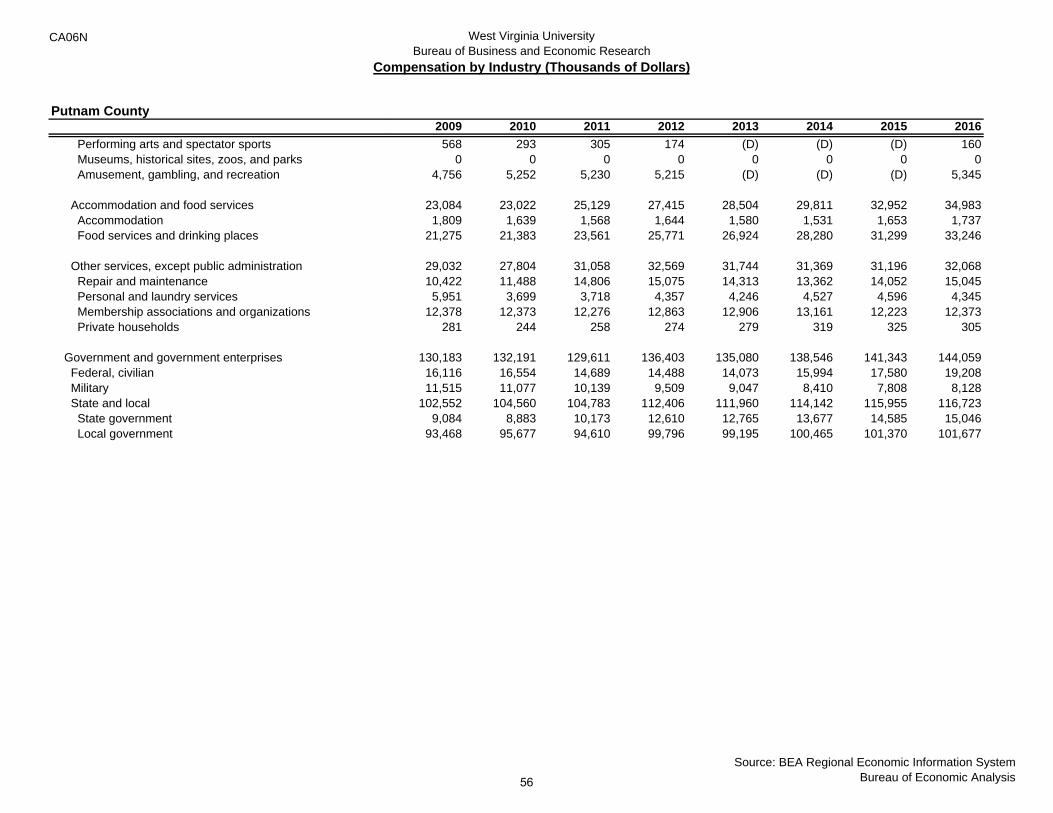
CA06N West Virginia UniversityBureau of Business and Economic Research
Compensation by Industry (Thousands of Dollars)
Putnam County
Performing arts and spectator sports Museums, historical sites, zoos, and parks Amusement, gambling, and recreation
Accommodation and food services Accommodation Food services and drinking places
Other services, except public administration Repair and maintenance Personal and laundry services Membership associations and organizations Private households
Government and government enterprises Federal, civilian Military State and local State government Local government
2009 2010 2011 2012 2013 2014 2015 2016568 293 305 174 (D) (D) (D) 160
0 0 0 0 0 0 0 04,756 5,252 5,230 5,215 (D) (D) (D) 5,345
23,084 23,022 25,129 27,415 28,504 29,811 32,952 34,9831,809 1,639 1,568 1,644 1,580 1,531 1,653 1,737
21,275 21,383 23,561 25,771 26,924 28,280 31,299 33,246
29,032 27,804 31,058 32,569 31,744 31,369 31,196 32,06810,422 11,488 14,806 15,075 14,313 13,362 14,052 15,0455,951 3,699 3,718 4,357 4,246 4,527 4,596 4,345
12,378 12,373 12,276 12,863 12,906 13,161 12,223 12,373281 244 258 274 279 319 325 305
130,183 132,191 129,611 136,403 135,080 138,546 141,343 144,05916,116 16,554 14,689 14,488 14,073 15,994 17,580 19,20811,515 11,077 10,139 9,509 9,047 8,410 7,808 8,128
102,552 104,560 104,783 112,406 111,960 114,142 115,955 116,7239,084 8,883 10,173 12,610 12,765 13,677 14,585 15,046
93,468 95,677 94,610 99,796 99,195 100,465 101,370 101,677
Source: BEA Regional Economic Information SystemBureau of Economic Analysis56

CA06N Footnotes
Last updated: November 16, 2017 ‐‐ new estimates for 2016; revised
estimates for 2014‐2015.
(NA) Data not available for this year.
1/ The estimates of compensation for 2001‐2006 are based on the 2002
North American Industry Classification System (NAICS). The estimates for
2007‐2010 are based on the 2007 NAICS. The estimates for 2011
forward are based on the 2012 NAICS.
2/ Includes actual employer contributions and actuarially imputed
employer contributions to reflect benefits accrued by defined benefit
pension plan participants through service to employers in the current
period.
3/ Average compensation per job is compensation of employees divided
by total full‐time and part‐time wage and salary employment.
4/ Under the 2007 NAICS, internet publishing and broadcasting was
reclassified to other information services.
Note‐‐ All dollar estimates are in current dollars (not adjusted for
inflation).
(D) Not shown to avoid disclosure of confidential information, but the
estimates for this item are included in the total.
57

CA30 West Virginia UniversityBureau of Business and Economic Research
Regional Economic Profile
Putnam County1969 1970 1971 1972 1973 1974 1975
Place of residence profilePersonal income 75,845 85,105 97,048 110,052 127,480 147,748 167,946
Derivation of personal income Net earnings 1/ 62,017 68,885 78,455 89,076 102,476 117,636 130,177 Personal current transfer receipts 6,681 8,024 9,440 10,862 12,925 15,487 20,312
Income maintenance 2/ 766 1,238 1,321 1,420 1,228 1,604 2,113 Unemployment insurance compensation 262 351 603 701 671 816 2,587 Retirement and other 5,653 6,435 7,516 8,741 11,026 13,067 15,612
Dividends, interest, and rent 3/ 7,147 8,196 9,153 10,114 12,079 14,625 17,457
Population (persons) 4/ 28,360 27,644 28,033 29,587 30,147 30,920 31,779
Per capita incomes (dollars) 5/ Per capita personal income 5/ 2,674 3,079 3,462 3,720 4,229 4,778 5,285 Per capita net earnings 5/ 2,187 2,492 2,799 3,011 3,399 3,805 4,096 Per capita personal current transfer receipts 5/ 236 290 337 367 429 501 639
Per capita income maintenance 5/ 27 45 47 48 41 52 66 Per capita unemployment insurance compensation 5/ 9 13 22 24 22 26 81 Per capita retirement and other 5/ 199 233 268 295 366 423 491
Per capita dividends, interest, and rent 5/ 252 296 327 342 401 473 549
Place of work profile Earnings by place of work 50,872 67,609 76,628 81,466 89,335 88,910 90,024
Wages and salaries 41,051 55,898 63,528 66,364 72,000 70,693 70,949 Supplements to wages and salaries 4,955 6,551 7,591 8,600 9,961 10,237 10,178 Employer contrib. for employee pension & insurance funds 6/ 2,674 3,289 3,687 4,226 4,519 5,058 5,086 Employer contributions for government social insurance 2,281 3,262 3,904 4,374 5,442 5,179 5,092 Proprietors' income 4,866 5,160 5,509 6,502 7,374 7,980 8,897 Nonfarm proprietors' income 721 605 444 672 754 564 430 Farm proprietors' income 4,145 4,555 5,065 5,830 6,620 7,416 8,467
Total full-time and part-time employment (number of jobs) 7,206 8,536 8,920 8,754 9,301 9,220 8,973 Wage and salary jobs 6,132 7,411 7,615 7,369 7,743 7,574 7,213 Number of proprietors 1,074 1,125 1,305 1,385 1,558 1,646 1,760
Number of nonfarm proprietors 7/ 361 378 392 408 429 450 531 Number of farm proprietors 713 747 913 977 1,129 1,196 1,229
Average earnings per job (dollars) 0 0 0 0 0 0 0 Average wages and salaries 7,060 7,920 8,591 9,306 9,605 9,643 10,033 Average nonfarm proprietors' income 6,695 7,543 8,342 9,006 9,299 9,334 9,836
Source: BEA Regional Economic Information SystemBureau of Economic Analysis58
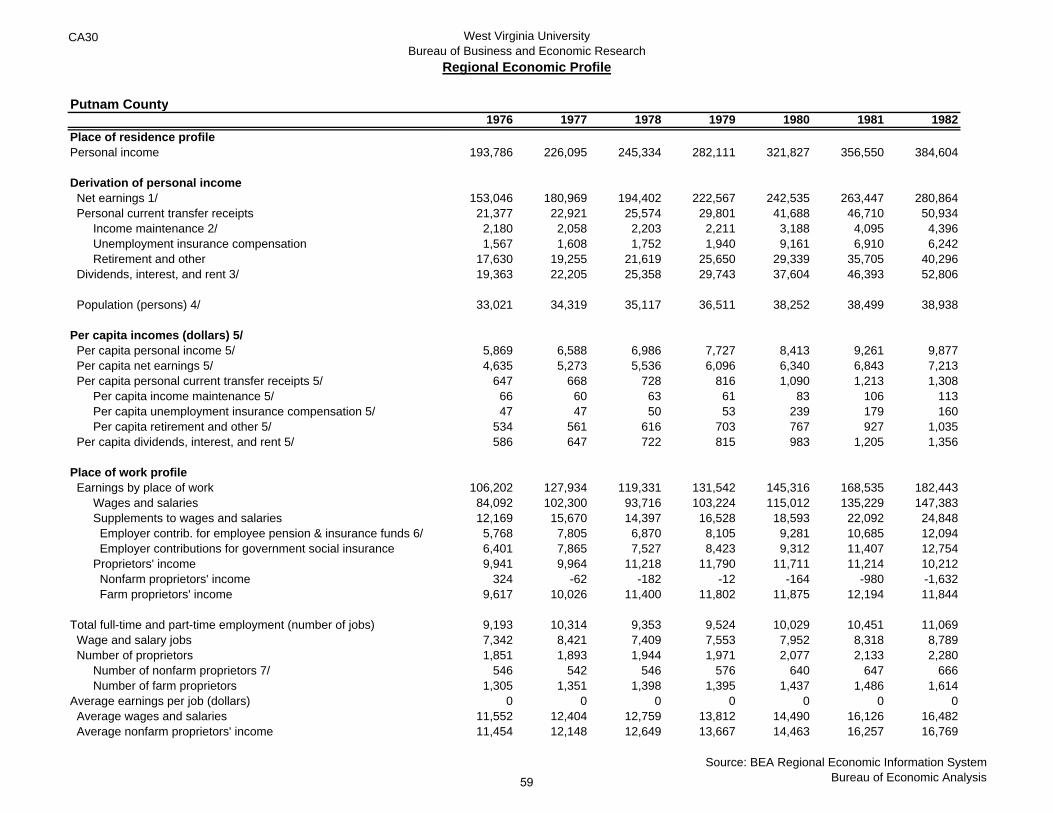
CA30 West Virginia UniversityBureau of Business and Economic Research
Regional Economic Profile
Putnam County
Place of residence profilePersonal income
Derivation of personal income Net earnings 1/ Personal current transfer receipts
Income maintenance 2/ Unemployment insurance compensation Retirement and other
Dividends, interest, and rent 3/
Population (persons) 4/
Per capita incomes (dollars) 5/ Per capita personal income 5/ Per capita net earnings 5/ Per capita personal current transfer receipts 5/
Per capita income maintenance 5/ Per capita unemployment insurance compensation 5/ Per capita retirement and other 5/
Per capita dividends, interest, and rent 5/
Place of work profile Earnings by place of work
Wages and salaries Supplements to wages and salaries Employer contrib. for employee pension & insurance funds 6/ Employer contributions for government social insurance Proprietors' income Nonfarm proprietors' income Farm proprietors' income
Total full-time and part-time employment (number of jobs) Wage and salary jobs Number of proprietors
Number of nonfarm proprietors 7/ Number of farm proprietors
Average earnings per job (dollars) Average wages and salaries Average nonfarm proprietors' income
1976 1977 1978 1979 1980 1981 1982
193,786 226,095 245,334 282,111 321,827 356,550 384,604
153,046 180,969 194,402 222,567 242,535 263,447 280,86421,377 22,921 25,574 29,801 41,688 46,710 50,9342,180 2,058 2,203 2,211 3,188 4,095 4,3961,567 1,608 1,752 1,940 9,161 6,910 6,242
17,630 19,255 21,619 25,650 29,339 35,705 40,29619,363 22,205 25,358 29,743 37,604 46,393 52,806
33,021 34,319 35,117 36,511 38,252 38,499 38,938
5,869 6,588 6,986 7,727 8,413 9,261 9,8774,635 5,273 5,536 6,096 6,340 6,843 7,213
647 668 728 816 1,090 1,213 1,30866 60 63 61 83 106 11347 47 50 53 239 179 160
534 561 616 703 767 927 1,035586 647 722 815 983 1,205 1,356
106,202 127,934 119,331 131,542 145,316 168,535 182,44384,092 102,300 93,716 103,224 115,012 135,229 147,38312,169 15,670 14,397 16,528 18,593 22,092 24,8485,768 7,805 6,870 8,105 9,281 10,685 12,0946,401 7,865 7,527 8,423 9,312 11,407 12,7549,941 9,964 11,218 11,790 11,711 11,214 10,212
324 -62 -182 -12 -164 -980 -1,6329,617 10,026 11,400 11,802 11,875 12,194 11,844
9,193 10,314 9,353 9,524 10,029 10,451 11,0697,342 8,421 7,409 7,553 7,952 8,318 8,7891,851 1,893 1,944 1,971 2,077 2,133 2,280
546 542 546 576 640 647 6661,305 1,351 1,398 1,395 1,437 1,486 1,614
0 0 0 0 0 0 011,552 12,404 12,759 13,812 14,490 16,126 16,48211,454 12,148 12,649 13,667 14,463 16,257 16,769
Source: BEA Regional Economic Information SystemBureau of Economic Analysis59
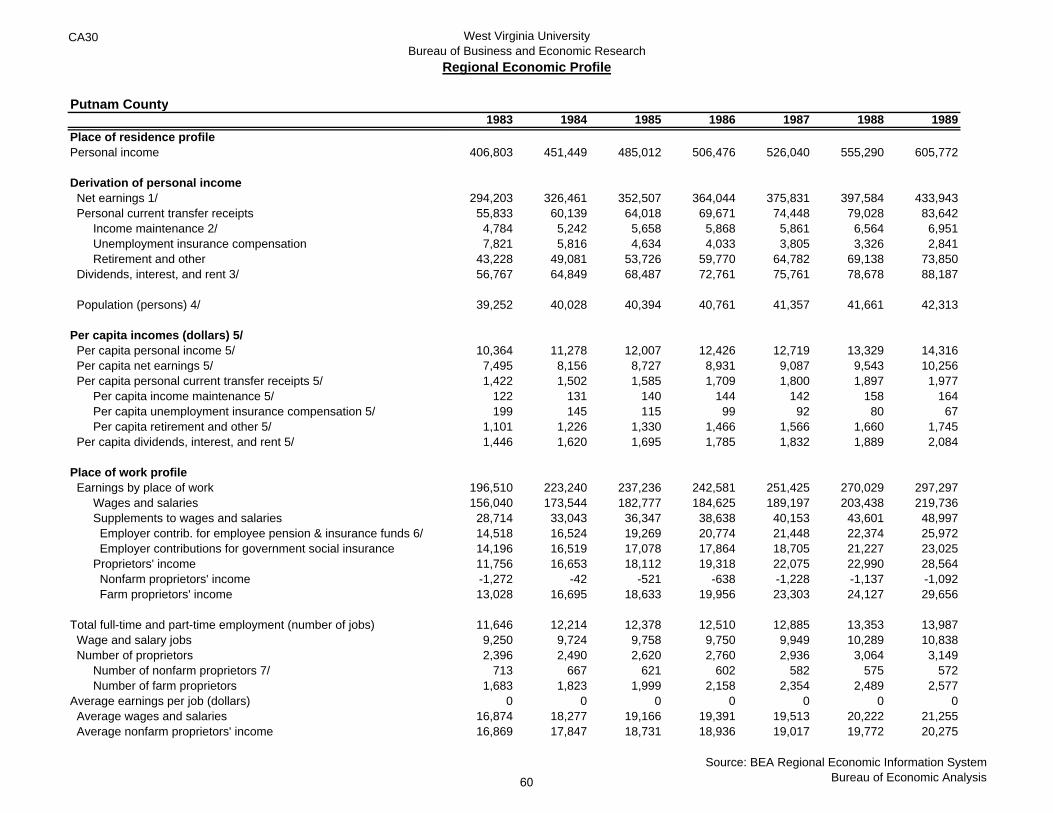
CA30 West Virginia UniversityBureau of Business and Economic Research
Regional Economic Profile
Putnam County
Place of residence profilePersonal income
Derivation of personal income Net earnings 1/ Personal current transfer receipts
Income maintenance 2/ Unemployment insurance compensation Retirement and other
Dividends, interest, and rent 3/
Population (persons) 4/
Per capita incomes (dollars) 5/ Per capita personal income 5/ Per capita net earnings 5/ Per capita personal current transfer receipts 5/
Per capita income maintenance 5/ Per capita unemployment insurance compensation 5/ Per capita retirement and other 5/
Per capita dividends, interest, and rent 5/
Place of work profile Earnings by place of work
Wages and salaries Supplements to wages and salaries Employer contrib. for employee pension & insurance funds 6/ Employer contributions for government social insurance Proprietors' income Nonfarm proprietors' income Farm proprietors' income
Total full-time and part-time employment (number of jobs) Wage and salary jobs Number of proprietors
Number of nonfarm proprietors 7/ Number of farm proprietors
Average earnings per job (dollars) Average wages and salaries Average nonfarm proprietors' income
1983 1984 1985 1986 1987 1988 1989
406,803 451,449 485,012 506,476 526,040 555,290 605,772
294,203 326,461 352,507 364,044 375,831 397,584 433,94355,833 60,139 64,018 69,671 74,448 79,028 83,6424,784 5,242 5,658 5,868 5,861 6,564 6,9517,821 5,816 4,634 4,033 3,805 3,326 2,841
43,228 49,081 53,726 59,770 64,782 69,138 73,85056,767 64,849 68,487 72,761 75,761 78,678 88,187
39,252 40,028 40,394 40,761 41,357 41,661 42,313
10,364 11,278 12,007 12,426 12,719 13,329 14,3167,495 8,156 8,727 8,931 9,087 9,543 10,2561,422 1,502 1,585 1,709 1,800 1,897 1,977
122 131 140 144 142 158 164199 145 115 99 92 80 67
1,101 1,226 1,330 1,466 1,566 1,660 1,7451,446 1,620 1,695 1,785 1,832 1,889 2,084
196,510 223,240 237,236 242,581 251,425 270,029 297,297156,040 173,544 182,777 184,625 189,197 203,438 219,73628,714 33,043 36,347 38,638 40,153 43,601 48,99714,518 16,524 19,269 20,774 21,448 22,374 25,97214,196 16,519 17,078 17,864 18,705 21,227 23,02511,756 16,653 18,112 19,318 22,075 22,990 28,564-1,272 -42 -521 -638 -1,228 -1,137 -1,09213,028 16,695 18,633 19,956 23,303 24,127 29,656
11,646 12,214 12,378 12,510 12,885 13,353 13,9879,250 9,724 9,758 9,750 9,949 10,289 10,8382,396 2,490 2,620 2,760 2,936 3,064 3,149
713 667 621 602 582 575 5721,683 1,823 1,999 2,158 2,354 2,489 2,577
0 0 0 0 0 0 016,874 18,277 19,166 19,391 19,513 20,222 21,25516,869 17,847 18,731 18,936 19,017 19,772 20,275
Source: BEA Regional Economic Information SystemBureau of Economic Analysis60

CA30 West Virginia UniversityBureau of Business and Economic Research
Regional Economic Profile
Putnam County
Place of residence profilePersonal income
Derivation of personal income Net earnings 1/ Personal current transfer receipts
Income maintenance 2/ Unemployment insurance compensation Retirement and other
Dividends, interest, and rent 3/
Population (persons) 4/
Per capita incomes (dollars) 5/ Per capita personal income 5/ Per capita net earnings 5/ Per capita personal current transfer receipts 5/
Per capita income maintenance 5/ Per capita unemployment insurance compensation 5/ Per capita retirement and other 5/
Per capita dividends, interest, and rent 5/
Place of work profile Earnings by place of work
Wages and salaries Supplements to wages and salaries Employer contrib. for employee pension & insurance funds 6/ Employer contributions for government social insurance Proprietors' income Nonfarm proprietors' income Farm proprietors' income
Total full-time and part-time employment (number of jobs) Wage and salary jobs Number of proprietors
Number of nonfarm proprietors 7/ Number of farm proprietors
Average earnings per job (dollars) Average wages and salaries Average nonfarm proprietors' income
1990 1991 1992 1993 1994 1995 1996
661,618 710,309 812,743 870,476 922,489 975,654 1,052,211
475,880 508,556 587,032 626,916 671,414 710,208 760,26689,695 102,675 120,604 130,978 130,160 139,104 153,2677,379 8,281 9,211 9,551 10,476 11,568 12,9062,536 4,298 5,805 4,897 3,634 3,281 3,577
79,780 90,096 105,588 116,530 116,050 124,255 136,78496,043 99,078 105,107 112,582 120,915 126,342 138,678
43,005 44,157 45,183 46,425 47,611 48,397 49,070
15,385 16,086 17,988 18,750 19,376 20,159 21,44311,066 11,517 12,992 13,504 14,102 14,675 15,4932,086 2,325 2,669 2,821 2,734 2,874 3,123
172 188 204 206 220 239 26359 97 128 105 76 68 73
1,855 2,040 2,337 2,510 2,437 2,567 2,7882,233 2,244 2,326 2,425 2,540 2,611 2,826
328,532 363,241 419,833 456,162 508,871 540,252 569,508242,124 266,420 292,218 328,094 369,063 395,150 417,42955,824 63,225 72,963 83,676 93,295 96,612 102,08829,219 33,362 39,379 44,604 49,604 49,862 52,32726,605 29,863 33,584 39,072 43,691 46,750 49,76130,584 33,596 54,652 44,392 46,513 48,490 49,991
-231 -201 472 327 434 -263 -1,15130,815 33,797 54,180 44,065 46,079 48,753 51,142
15,121 15,819 16,426 17,528 18,921 19,726 20,53811,798 12,404 12,969 14,065 15,297 15,953 16,5923,323 3,415 3,457 3,463 3,624 3,773 3,946
555 536 533 555 551 550 5442,768 2,879 2,924 2,908 3,073 3,223 3,402
0 0 0 0 0 0 021,727 22,962 25,559 26,025 26,895 27,388 27,72920,522 21,479 22,532 23,327 24,126 24,770 25,158
Source: BEA Regional Economic Information SystemBureau of Economic Analysis61
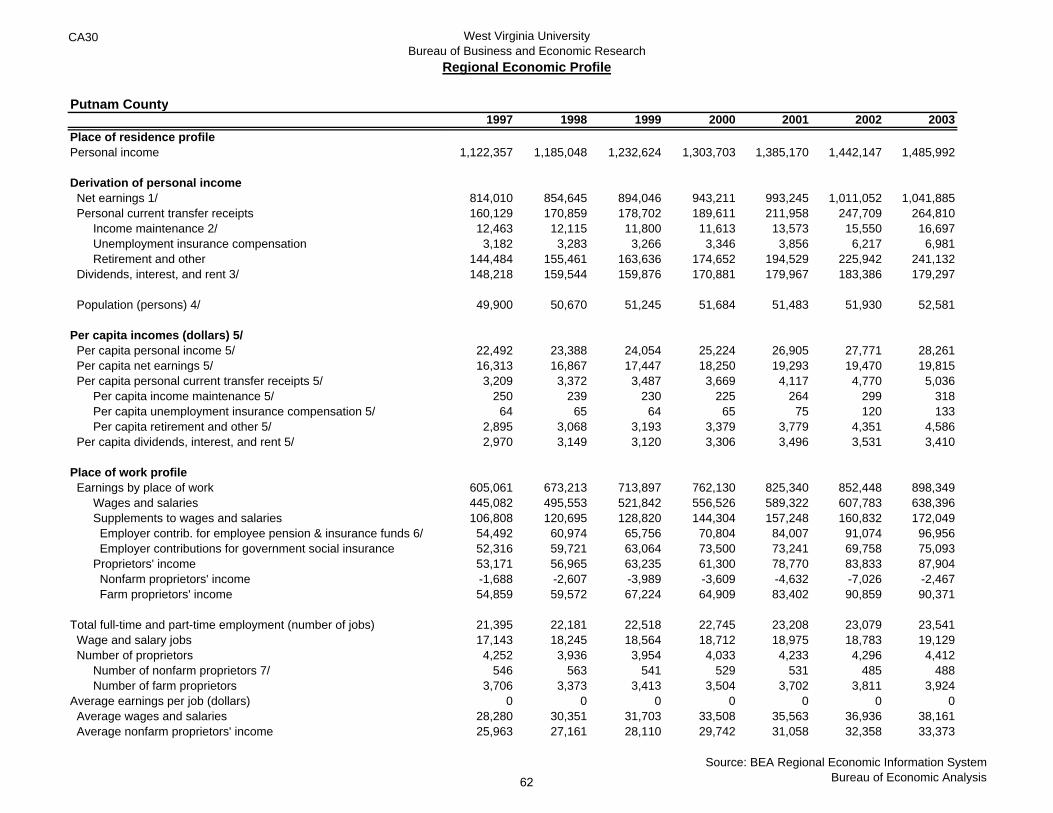
CA30 West Virginia UniversityBureau of Business and Economic Research
Regional Economic Profile
Putnam County
Place of residence profilePersonal income
Derivation of personal income Net earnings 1/ Personal current transfer receipts
Income maintenance 2/ Unemployment insurance compensation Retirement and other
Dividends, interest, and rent 3/
Population (persons) 4/
Per capita incomes (dollars) 5/ Per capita personal income 5/ Per capita net earnings 5/ Per capita personal current transfer receipts 5/
Per capita income maintenance 5/ Per capita unemployment insurance compensation 5/ Per capita retirement and other 5/
Per capita dividends, interest, and rent 5/
Place of work profile Earnings by place of work
Wages and salaries Supplements to wages and salaries Employer contrib. for employee pension & insurance funds 6/ Employer contributions for government social insurance Proprietors' income Nonfarm proprietors' income Farm proprietors' income
Total full-time and part-time employment (number of jobs) Wage and salary jobs Number of proprietors
Number of nonfarm proprietors 7/ Number of farm proprietors
Average earnings per job (dollars) Average wages and salaries Average nonfarm proprietors' income
1997 1998 1999 2000 2001 2002 2003
1,122,357 1,185,048 1,232,624 1,303,703 1,385,170 1,442,147 1,485,992
814,010 854,645 894,046 943,211 993,245 1,011,052 1,041,885160,129 170,859 178,702 189,611 211,958 247,709 264,81012,463 12,115 11,800 11,613 13,573 15,550 16,6973,182 3,283 3,266 3,346 3,856 6,217 6,981
144,484 155,461 163,636 174,652 194,529 225,942 241,132148,218 159,544 159,876 170,881 179,967 183,386 179,297
49,900 50,670 51,245 51,684 51,483 51,930 52,581
22,492 23,388 24,054 25,224 26,905 27,771 28,26116,313 16,867 17,447 18,250 19,293 19,470 19,8153,209 3,372 3,487 3,669 4,117 4,770 5,036
250 239 230 225 264 299 31864 65 64 65 75 120 133
2,895 3,068 3,193 3,379 3,779 4,351 4,5862,970 3,149 3,120 3,306 3,496 3,531 3,410
605,061 673,213 713,897 762,130 825,340 852,448 898,349445,082 495,553 521,842 556,526 589,322 607,783 638,396106,808 120,695 128,820 144,304 157,248 160,832 172,04954,492 60,974 65,756 70,804 84,007 91,074 96,95652,316 59,721 63,064 73,500 73,241 69,758 75,09353,171 56,965 63,235 61,300 78,770 83,833 87,904-1,688 -2,607 -3,989 -3,609 -4,632 -7,026 -2,46754,859 59,572 67,224 64,909 83,402 90,859 90,371
21,395 22,181 22,518 22,745 23,208 23,079 23,54117,143 18,245 18,564 18,712 18,975 18,783 19,1294,252 3,936 3,954 4,033 4,233 4,296 4,412
546 563 541 529 531 485 4883,706 3,373 3,413 3,504 3,702 3,811 3,924
0 0 0 0 0 0 028,280 30,351 31,703 33,508 35,563 36,936 38,16125,963 27,161 28,110 29,742 31,058 32,358 33,373
Source: BEA Regional Economic Information SystemBureau of Economic Analysis62
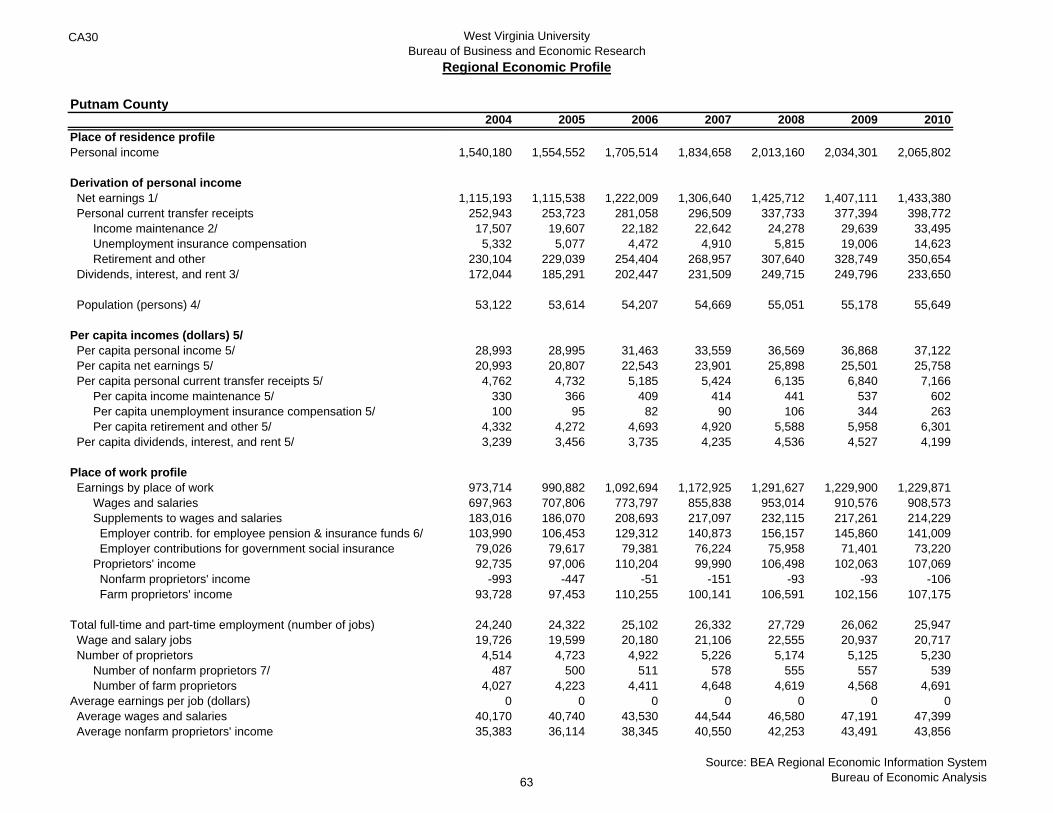
CA30 West Virginia UniversityBureau of Business and Economic Research
Regional Economic Profile
Putnam County
Place of residence profilePersonal income
Derivation of personal income Net earnings 1/ Personal current transfer receipts
Income maintenance 2/ Unemployment insurance compensation Retirement and other
Dividends, interest, and rent 3/
Population (persons) 4/
Per capita incomes (dollars) 5/ Per capita personal income 5/ Per capita net earnings 5/ Per capita personal current transfer receipts 5/
Per capita income maintenance 5/ Per capita unemployment insurance compensation 5/ Per capita retirement and other 5/
Per capita dividends, interest, and rent 5/
Place of work profile Earnings by place of work
Wages and salaries Supplements to wages and salaries Employer contrib. for employee pension & insurance funds 6/ Employer contributions for government social insurance Proprietors' income Nonfarm proprietors' income Farm proprietors' income
Total full-time and part-time employment (number of jobs) Wage and salary jobs Number of proprietors
Number of nonfarm proprietors 7/ Number of farm proprietors
Average earnings per job (dollars) Average wages and salaries Average nonfarm proprietors' income
2004 2005 2006 2007 2008 2009 2010
1,540,180 1,554,552 1,705,514 1,834,658 2,013,160 2,034,301 2,065,802
1,115,193 1,115,538 1,222,009 1,306,640 1,425,712 1,407,111 1,433,380252,943 253,723 281,058 296,509 337,733 377,394 398,77217,507 19,607 22,182 22,642 24,278 29,639 33,4955,332 5,077 4,472 4,910 5,815 19,006 14,623
230,104 229,039 254,404 268,957 307,640 328,749 350,654172,044 185,291 202,447 231,509 249,715 249,796 233,650
53,122 53,614 54,207 54,669 55,051 55,178 55,649
28,993 28,995 31,463 33,559 36,569 36,868 37,12220,993 20,807 22,543 23,901 25,898 25,501 25,7584,762 4,732 5,185 5,424 6,135 6,840 7,166
330 366 409 414 441 537 602100 95 82 90 106 344 263
4,332 4,272 4,693 4,920 5,588 5,958 6,3013,239 3,456 3,735 4,235 4,536 4,527 4,199
973,714 990,882 1,092,694 1,172,925 1,291,627 1,229,900 1,229,871697,963 707,806 773,797 855,838 953,014 910,576 908,573183,016 186,070 208,693 217,097 232,115 217,261 214,229103,990 106,453 129,312 140,873 156,157 145,860 141,00979,026 79,617 79,381 76,224 75,958 71,401 73,22092,735 97,006 110,204 99,990 106,498 102,063 107,069
-993 -447 -51 -151 -93 -93 -10693,728 97,453 110,255 100,141 106,591 102,156 107,175
24,240 24,322 25,102 26,332 27,729 26,062 25,94719,726 19,599 20,180 21,106 22,555 20,937 20,7174,514 4,723 4,922 5,226 5,174 5,125 5,230
487 500 511 578 555 557 5394,027 4,223 4,411 4,648 4,619 4,568 4,691
0 0 0 0 0 0 040,170 40,740 43,530 44,544 46,580 47,191 47,39935,383 36,114 38,345 40,550 42,253 43,491 43,856
Source: BEA Regional Economic Information SystemBureau of Economic Analysis63

CA30 West Virginia UniversityBureau of Business and Economic Research
Regional Economic Profile
Putnam County
Place of residence profilePersonal income
Derivation of personal income Net earnings 1/ Personal current transfer receipts
Income maintenance 2/ Unemployment insurance compensation Retirement and other
Dividends, interest, and rent 3/
Population (persons) 4/
Per capita incomes (dollars) 5/ Per capita personal income 5/ Per capita net earnings 5/ Per capita personal current transfer receipts 5/
Per capita income maintenance 5/ Per capita unemployment insurance compensation 5/ Per capita retirement and other 5/
Per capita dividends, interest, and rent 5/
Place of work profile Earnings by place of work
Wages and salaries Supplements to wages and salaries Employer contrib. for employee pension & insurance funds 6/ Employer contributions for government social insurance Proprietors' income Nonfarm proprietors' income Farm proprietors' income
Total full-time and part-time employment (number of jobs) Wage and salary jobs Number of proprietors
Number of nonfarm proprietors 7/ Number of farm proprietors
Average earnings per job (dollars) Average wages and salaries Average nonfarm proprietors' income
2011 2012 2013 2014 2015 2016
2,220,335 2,271,123 2,245,703 2,315,956 2,385,131 2,404,162
1,536,177 1,568,971 1,545,137 1,577,969 1,623,827 1,624,696407,306 417,541 427,271 444,735 469,533 481,59532,639 32,397 32,774 32,302 32,398 32,36711,953 10,306 9,666 6,108 6,527 6,712
362,714 374,838 384,831 406,325 430,608 442,516276,852 284,611 273,295 293,252 291,771 297,871
56,078 56,531 56,597 56,845 56,799 56,941
39,594 40,175 39,679 40,742 41,992 42,22227,394 27,754 27,301 27,759 28,589 28,5337,263 7,386 7,549 7,824 8,267 8,458
582 573 579 568 570 568213 182 171 107 115 118
6,468 6,631 6,799 7,148 7,581 7,7714,937 5,035 4,829 5,159 5,137 5,231
1,304,573 1,350,329 1,365,549 1,388,508 1,440,782 1,482,084966,693 996,654 1,010,883 1,032,990 1,075,647 1,111,910219,533 240,792 245,278 237,928 246,502 249,708147,255 160,130 164,045 153,533 158,174 158,60672,278 80,662 81,233 84,395 88,328 91,102
118,347 112,883 109,388 117,590 118,633 120,466-69 -156 -79 -62 -37 -15
118,416 113,039 109,467 117,652 118,670 120,481
25,696 26,704 27,066 27,207 27,625 27,93820,465 21,625 21,883 21,960 22,466 22,6735,231 5,079 5,183 5,247 5,159 5,265
525 504 504 502 486 4794,706 4,575 4,679 4,745 4,673 4,786
0 0 0 0 0 050,769 50,567 50,453 51,035 52,155 53,04947,236 46,088 46,195 47,040 47,879 49,041
Source: BEA Regional Economic Information SystemBureau of Economic Analysis64
CA30 Footnotes
5/ Includes actual employer contributions and actuarially imputed
employer contributions to reflect benefits accrued by defined benefit
pension plan participants through service to employers in the current
period.
6/ Excludes limited partners.
Note‐‐ All dollar estimates are in current dollars (not adjusted for
inflation).
Last updated: November 16, 2017‐‐ new estimates for 2016; revised
estimates for 2010‐2015.
1/ Consists largely of Supplemental Security Income (SSI) payments;
Earned Income Tax Credits (EITC); family assistance; general assistance;
expenditures for food under the Special Supplemental Nutrition Program
for Women, Infants, and Children (WIC); Supplemental Nutrition
Assistance Program (SNAP); and other assistance benefits.
2/ Rental income of persons includes the capital consumption
adjustment.
3/ Census Bureau midyear population estimates. Estimates for 2010‐
2016 reflect county population estimates available as of March 2017.
4/ Type of income divided by population yields a per capita measure for
that type of income.
65
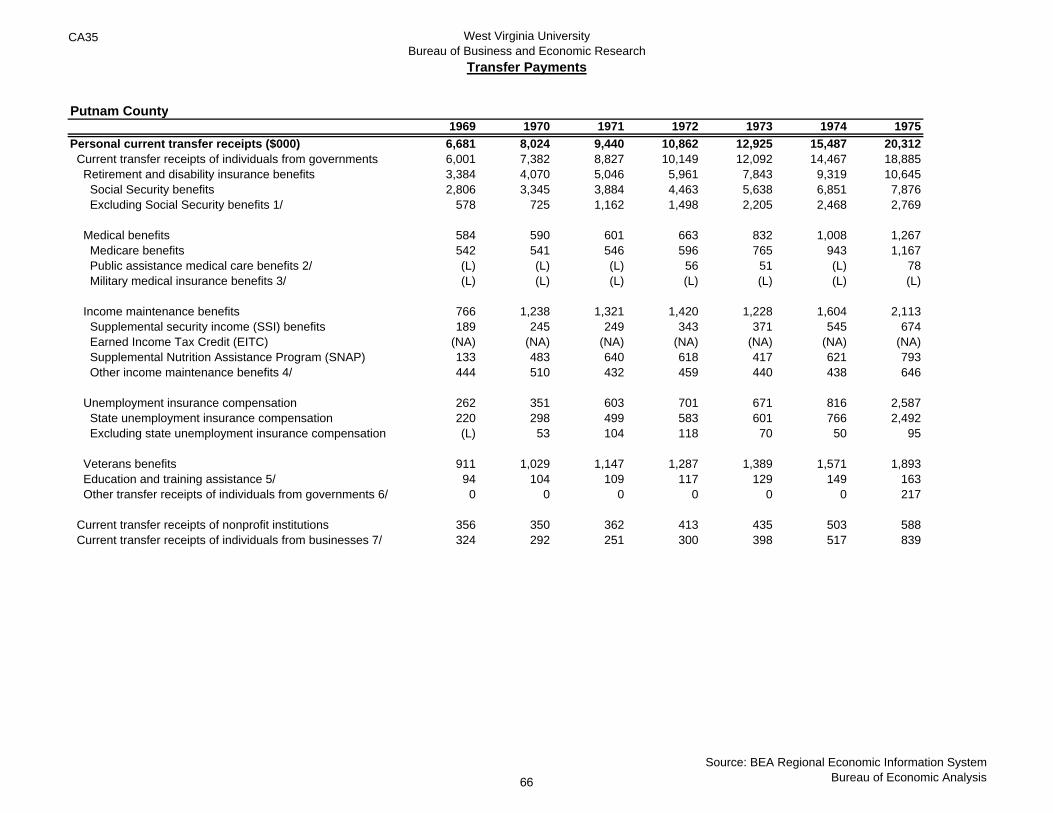
CA35 West Virginia UniversityBureau of Business and Economic Research
Transfer Payments
Putnam County1969 1970 1971 1972 1973 1974 1975
Personal current transfer receipts ($000) 6,681 8,024 9,440 10,862 12,925 15,487 20,312 Current transfer receipts of individuals from governments 6,001 7,382 8,827 10,149 12,092 14,467 18,885 Retirement and disability insurance benefits 3,384 4,070 5,046 5,961 7,843 9,319 10,645 Social Security benefits 2,806 3,345 3,884 4,463 5,638 6,851 7,876 Excluding Social Security benefits 1/ 578 725 1,162 1,498 2,205 2,468 2,769
Medical benefits 584 590 601 663 832 1,008 1,267 Medicare benefits 542 541 546 596 765 943 1,167 Public assistance medical care benefits 2/ (L) (L) (L) 56 51 (L) 78 Military medical insurance benefits 3/ (L) (L) (L) (L) (L) (L) (L)
Income maintenance benefits 766 1,238 1,321 1,420 1,228 1,604 2,113 Supplemental security income (SSI) benefits 189 245 249 343 371 545 674 Earned Income Tax Credit (EITC) (NA) (NA) (NA) (NA) (NA) (NA) (NA) Supplemental Nutrition Assistance Program (SNAP) 133 483 640 618 417 621 793 Other income maintenance benefits 4/ 444 510 432 459 440 438 646
Unemployment insurance compensation 262 351 603 701 671 816 2,587 State unemployment insurance compensation 220 298 499 583 601 766 2,492 Excluding state unemployment insurance compensation (L) 53 104 118 70 50 95
Veterans benefits 911 1,029 1,147 1,287 1,389 1,571 1,893 Education and training assistance 5/ 94 104 109 117 129 149 163 Other transfer receipts of individuals from governments 6/ 0 0 0 0 0 0 217
Current transfer receipts of nonprofit institutions 356 350 362 413 435 503 588 Current transfer receipts of individuals from businesses 7/ 324 292 251 300 398 517 839
Source: BEA Regional Economic Information SystemBureau of Economic Analysis66
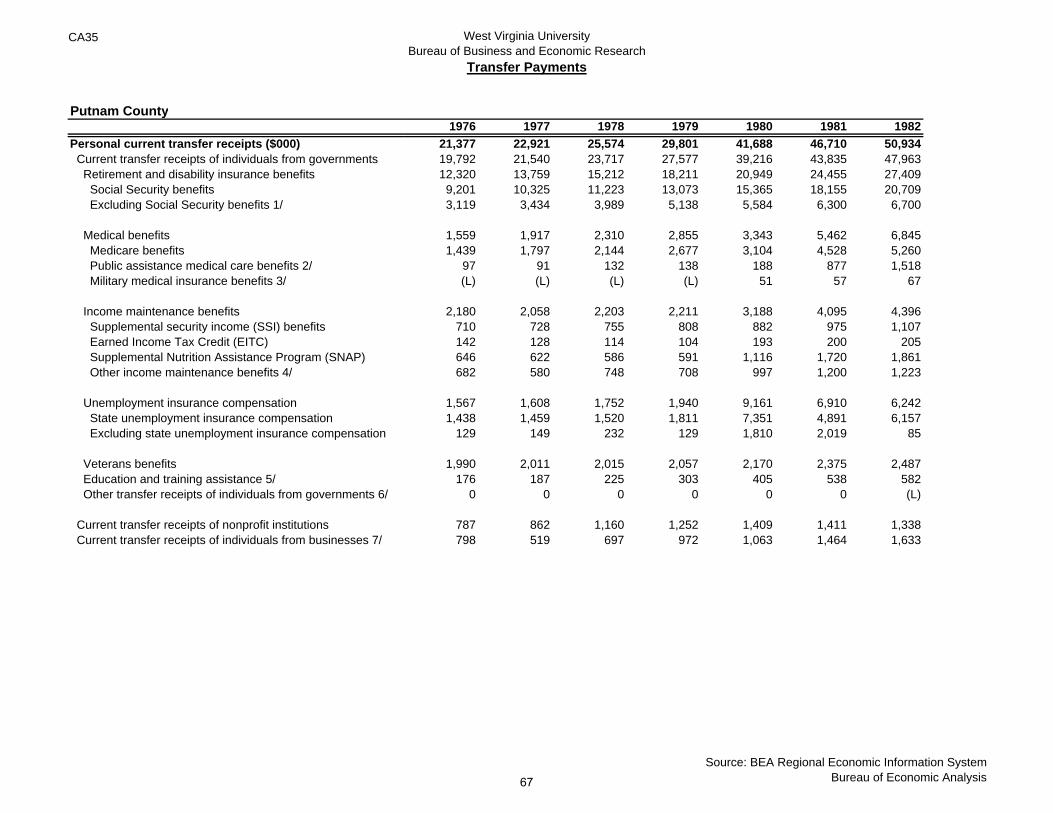
CA35 West Virginia UniversityBureau of Business and Economic Research
Transfer Payments
Putnam County
Personal current transfer receipts ($000) Current transfer receipts of individuals from governments Retirement and disability insurance benefits Social Security benefits Excluding Social Security benefits 1/
Medical benefits Medicare benefits Public assistance medical care benefits 2/ Military medical insurance benefits 3/
Income maintenance benefits Supplemental security income (SSI) benefits Earned Income Tax Credit (EITC) Supplemental Nutrition Assistance Program (SNAP) Other income maintenance benefits 4/
Unemployment insurance compensation State unemployment insurance compensation Excluding state unemployment insurance compensation
Veterans benefits Education and training assistance 5/ Other transfer receipts of individuals from governments 6/
Current transfer receipts of nonprofit institutions Current transfer receipts of individuals from businesses 7/
1976 1977 1978 1979 1980 1981 198221,377 22,921 25,574 29,801 41,688 46,710 50,93419,792 21,540 23,717 27,577 39,216 43,835 47,96312,320 13,759 15,212 18,211 20,949 24,455 27,4099,201 10,325 11,223 13,073 15,365 18,155 20,7093,119 3,434 3,989 5,138 5,584 6,300 6,700
1,559 1,917 2,310 2,855 3,343 5,462 6,8451,439 1,797 2,144 2,677 3,104 4,528 5,260
97 91 132 138 188 877 1,518(L) (L) (L) (L) 51 57 67
2,180 2,058 2,203 2,211 3,188 4,095 4,396710 728 755 808 882 975 1,107142 128 114 104 193 200 205646 622 586 591 1,116 1,720 1,861682 580 748 708 997 1,200 1,223
1,567 1,608 1,752 1,940 9,161 6,910 6,2421,438 1,459 1,520 1,811 7,351 4,891 6,157
129 149 232 129 1,810 2,019 85
1,990 2,011 2,015 2,057 2,170 2,375 2,487176 187 225 303 405 538 582
0 0 0 0 0 0 (L)
787 862 1,160 1,252 1,409 1,411 1,338798 519 697 972 1,063 1,464 1,633
Source: BEA Regional Economic Information SystemBureau of Economic Analysis67
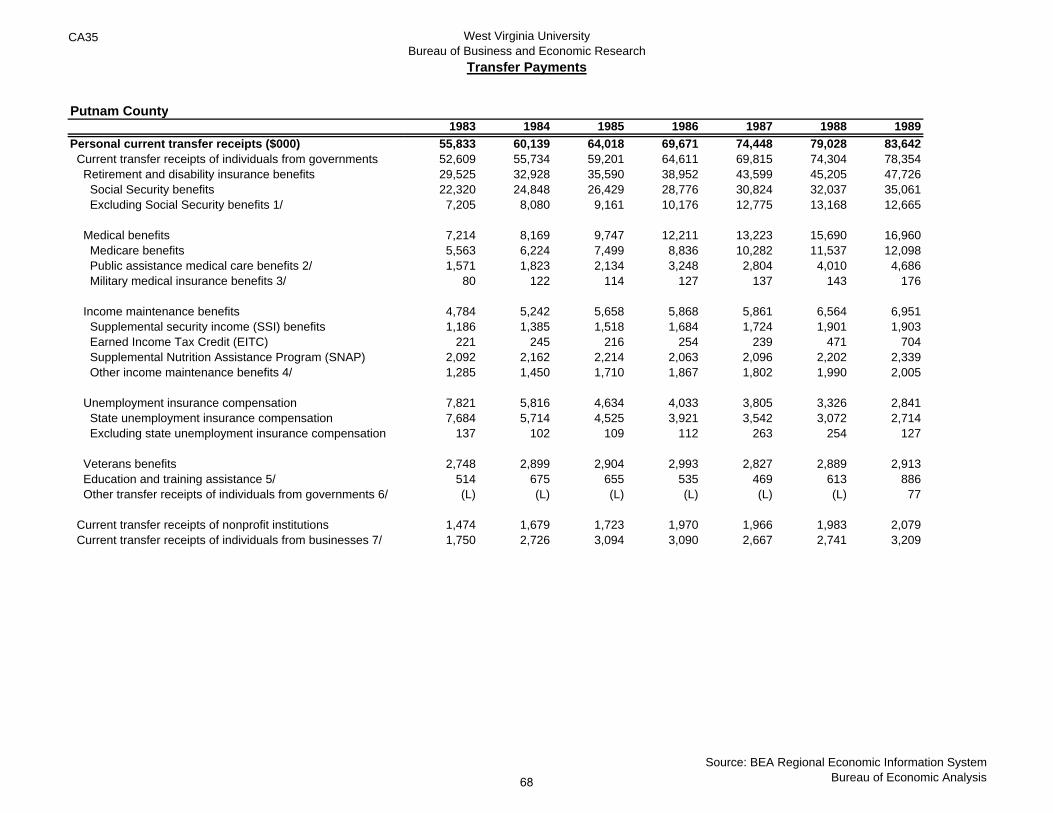
CA35 West Virginia UniversityBureau of Business and Economic Research
Transfer Payments
Putnam County
Personal current transfer receipts ($000) Current transfer receipts of individuals from governments Retirement and disability insurance benefits Social Security benefits Excluding Social Security benefits 1/
Medical benefits Medicare benefits Public assistance medical care benefits 2/ Military medical insurance benefits 3/
Income maintenance benefits Supplemental security income (SSI) benefits Earned Income Tax Credit (EITC) Supplemental Nutrition Assistance Program (SNAP) Other income maintenance benefits 4/
Unemployment insurance compensation State unemployment insurance compensation Excluding state unemployment insurance compensation
Veterans benefits Education and training assistance 5/ Other transfer receipts of individuals from governments 6/
Current transfer receipts of nonprofit institutions Current transfer receipts of individuals from businesses 7/
1983 1984 1985 1986 1987 1988 198955,833 60,139 64,018 69,671 74,448 79,028 83,64252,609 55,734 59,201 64,611 69,815 74,304 78,35429,525 32,928 35,590 38,952 43,599 45,205 47,72622,320 24,848 26,429 28,776 30,824 32,037 35,0617,205 8,080 9,161 10,176 12,775 13,168 12,665
7,214 8,169 9,747 12,211 13,223 15,690 16,9605,563 6,224 7,499 8,836 10,282 11,537 12,0981,571 1,823 2,134 3,248 2,804 4,010 4,686
80 122 114 127 137 143 176
4,784 5,242 5,658 5,868 5,861 6,564 6,9511,186 1,385 1,518 1,684 1,724 1,901 1,903
221 245 216 254 239 471 7042,092 2,162 2,214 2,063 2,096 2,202 2,3391,285 1,450 1,710 1,867 1,802 1,990 2,005
7,821 5,816 4,634 4,033 3,805 3,326 2,8417,684 5,714 4,525 3,921 3,542 3,072 2,714
137 102 109 112 263 254 127
2,748 2,899 2,904 2,993 2,827 2,889 2,913514 675 655 535 469 613 886(L) (L) (L) (L) (L) (L) 77
1,474 1,679 1,723 1,970 1,966 1,983 2,0791,750 2,726 3,094 3,090 2,667 2,741 3,209
Source: BEA Regional Economic Information SystemBureau of Economic Analysis68
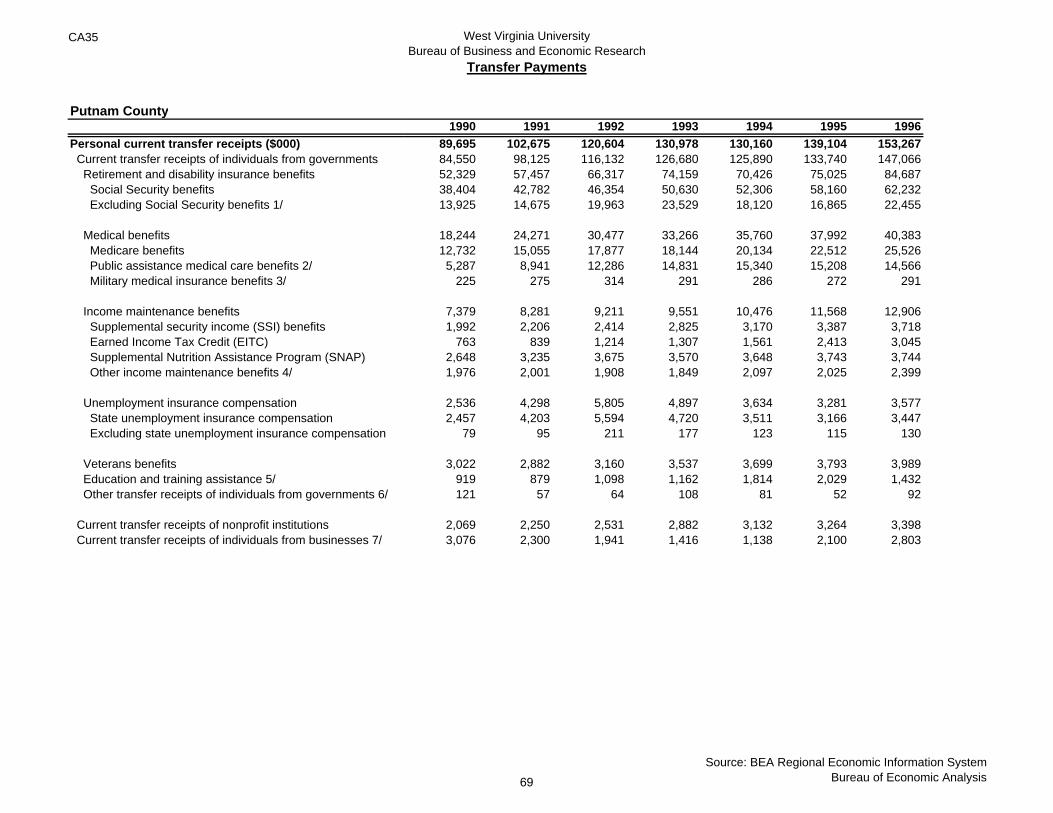
CA35 West Virginia UniversityBureau of Business and Economic Research
Transfer Payments
Putnam County
Personal current transfer receipts ($000) Current transfer receipts of individuals from governments Retirement and disability insurance benefits Social Security benefits Excluding Social Security benefits 1/
Medical benefits Medicare benefits Public assistance medical care benefits 2/ Military medical insurance benefits 3/
Income maintenance benefits Supplemental security income (SSI) benefits Earned Income Tax Credit (EITC) Supplemental Nutrition Assistance Program (SNAP) Other income maintenance benefits 4/
Unemployment insurance compensation State unemployment insurance compensation Excluding state unemployment insurance compensation
Veterans benefits Education and training assistance 5/ Other transfer receipts of individuals from governments 6/
Current transfer receipts of nonprofit institutions Current transfer receipts of individuals from businesses 7/
1990 1991 1992 1993 1994 1995 199689,695 102,675 120,604 130,978 130,160 139,104 153,26784,550 98,125 116,132 126,680 125,890 133,740 147,06652,329 57,457 66,317 74,159 70,426 75,025 84,68738,404 42,782 46,354 50,630 52,306 58,160 62,23213,925 14,675 19,963 23,529 18,120 16,865 22,455
18,244 24,271 30,477 33,266 35,760 37,992 40,38312,732 15,055 17,877 18,144 20,134 22,512 25,5265,287 8,941 12,286 14,831 15,340 15,208 14,566
225 275 314 291 286 272 291
7,379 8,281 9,211 9,551 10,476 11,568 12,9061,992 2,206 2,414 2,825 3,170 3,387 3,718
763 839 1,214 1,307 1,561 2,413 3,0452,648 3,235 3,675 3,570 3,648 3,743 3,7441,976 2,001 1,908 1,849 2,097 2,025 2,399
2,536 4,298 5,805 4,897 3,634 3,281 3,5772,457 4,203 5,594 4,720 3,511 3,166 3,447
79 95 211 177 123 115 130
3,022 2,882 3,160 3,537 3,699 3,793 3,989919 879 1,098 1,162 1,814 2,029 1,432121 57 64 108 81 52 92
2,069 2,250 2,531 2,882 3,132 3,264 3,3983,076 2,300 1,941 1,416 1,138 2,100 2,803
Source: BEA Regional Economic Information SystemBureau of Economic Analysis69
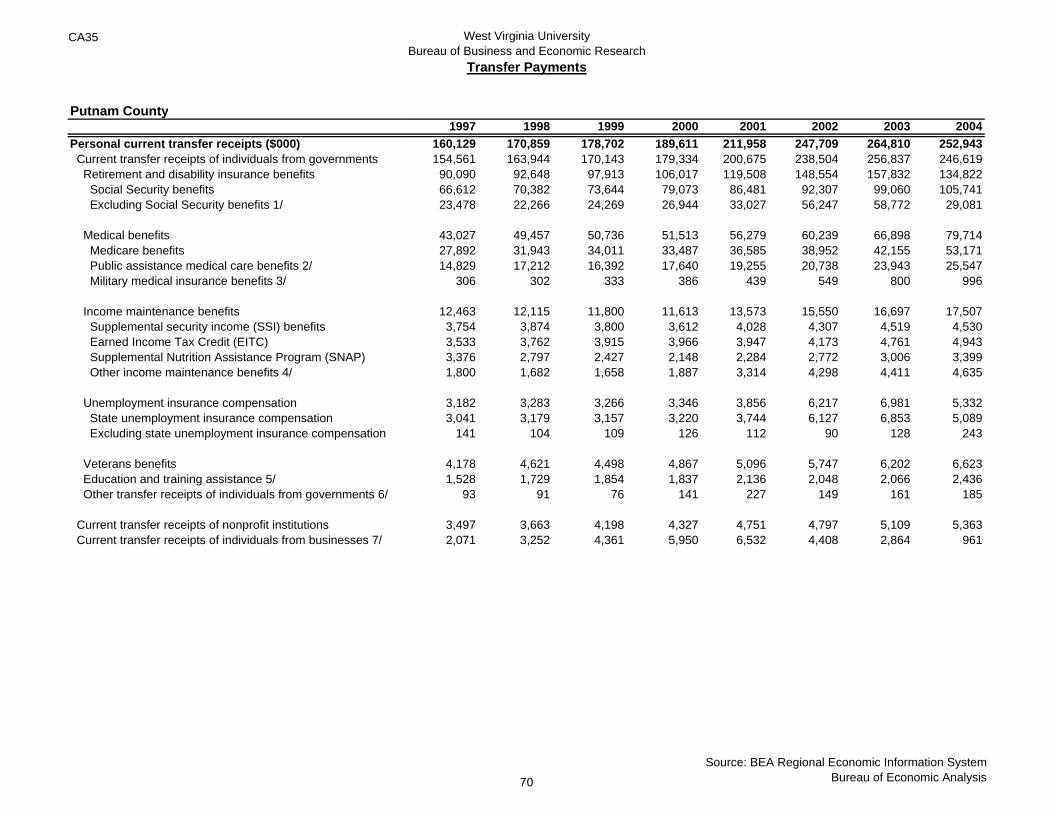
CA35 West Virginia UniversityBureau of Business and Economic Research
Transfer Payments
Putnam County
Personal current transfer receipts ($000) Current transfer receipts of individuals from governments Retirement and disability insurance benefits Social Security benefits Excluding Social Security benefits 1/
Medical benefits Medicare benefits Public assistance medical care benefits 2/ Military medical insurance benefits 3/
Income maintenance benefits Supplemental security income (SSI) benefits Earned Income Tax Credit (EITC) Supplemental Nutrition Assistance Program (SNAP) Other income maintenance benefits 4/
Unemployment insurance compensation State unemployment insurance compensation Excluding state unemployment insurance compensation
Veterans benefits Education and training assistance 5/ Other transfer receipts of individuals from governments 6/
Current transfer receipts of nonprofit institutions Current transfer receipts of individuals from businesses 7/
1997 1998 1999 2000 2001 2002 2003 2004160,129 170,859 178,702 189,611 211,958 247,709 264,810 252,943154,561 163,944 170,143 179,334 200,675 238,504 256,837 246,61990,090 92,648 97,913 106,017 119,508 148,554 157,832 134,82266,612 70,382 73,644 79,073 86,481 92,307 99,060 105,74123,478 22,266 24,269 26,944 33,027 56,247 58,772 29,081
43,027 49,457 50,736 51,513 56,279 60,239 66,898 79,71427,892 31,943 34,011 33,487 36,585 38,952 42,155 53,17114,829 17,212 16,392 17,640 19,255 20,738 23,943 25,547
306 302 333 386 439 549 800 996
12,463 12,115 11,800 11,613 13,573 15,550 16,697 17,5073,754 3,874 3,800 3,612 4,028 4,307 4,519 4,5303,533 3,762 3,915 3,966 3,947 4,173 4,761 4,9433,376 2,797 2,427 2,148 2,284 2,772 3,006 3,3991,800 1,682 1,658 1,887 3,314 4,298 4,411 4,635
3,182 3,283 3,266 3,346 3,856 6,217 6,981 5,3323,041 3,179 3,157 3,220 3,744 6,127 6,853 5,089
141 104 109 126 112 90 128 243
4,178 4,621 4,498 4,867 5,096 5,747 6,202 6,6231,528 1,729 1,854 1,837 2,136 2,048 2,066 2,436
93 91 76 141 227 149 161 185
3,497 3,663 4,198 4,327 4,751 4,797 5,109 5,3632,071 3,252 4,361 5,950 6,532 4,408 2,864 961
Source: BEA Regional Economic Information SystemBureau of Economic Analysis70
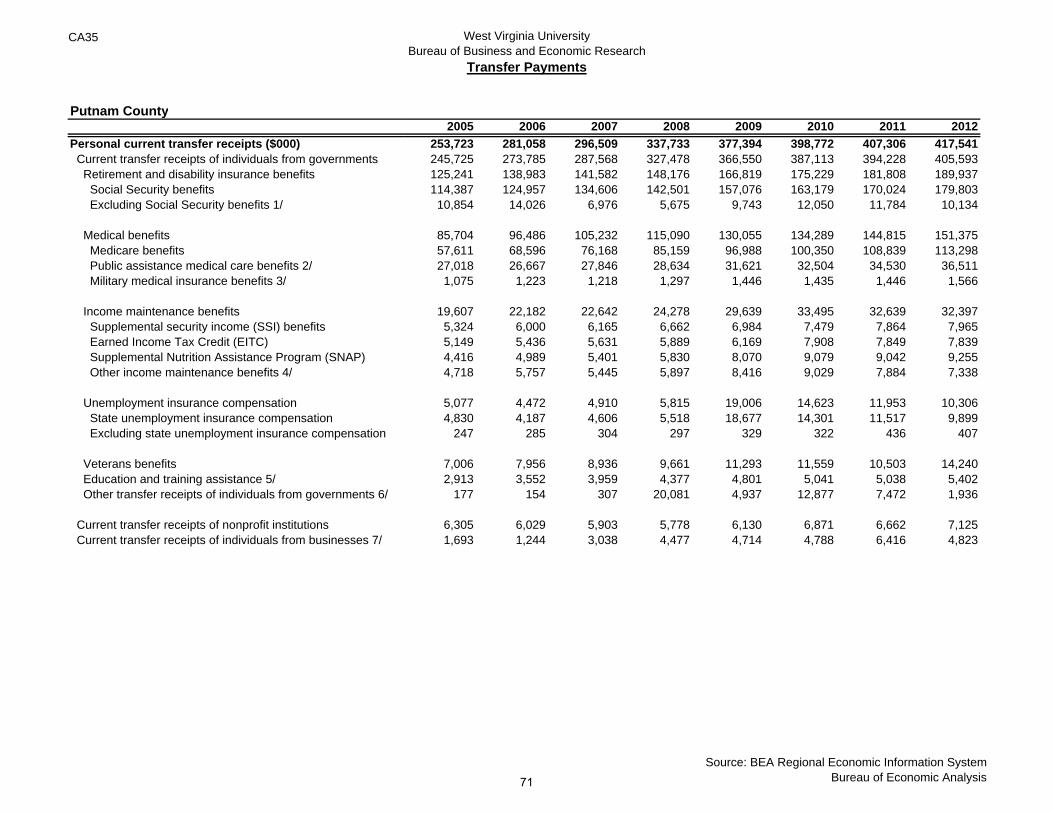
CA35 West Virginia UniversityBureau of Business and Economic Research
Transfer Payments
Putnam County
Personal current transfer receipts ($000) Current transfer receipts of individuals from governments Retirement and disability insurance benefits Social Security benefits Excluding Social Security benefits 1/
Medical benefits Medicare benefits Public assistance medical care benefits 2/ Military medical insurance benefits 3/
Income maintenance benefits Supplemental security income (SSI) benefits Earned Income Tax Credit (EITC) Supplemental Nutrition Assistance Program (SNAP) Other income maintenance benefits 4/
Unemployment insurance compensation State unemployment insurance compensation Excluding state unemployment insurance compensation
Veterans benefits Education and training assistance 5/ Other transfer receipts of individuals from governments 6/
Current transfer receipts of nonprofit institutions Current transfer receipts of individuals from businesses 7/
2005 2006 2007 2008 2009 2010 2011 2012253,723 281,058 296,509 337,733 377,394 398,772 407,306 417,541245,725 273,785 287,568 327,478 366,550 387,113 394,228 405,593125,241 138,983 141,582 148,176 166,819 175,229 181,808 189,937114,387 124,957 134,606 142,501 157,076 163,179 170,024 179,80310,854 14,026 6,976 5,675 9,743 12,050 11,784 10,134
85,704 96,486 105,232 115,090 130,055 134,289 144,815 151,37557,611 68,596 76,168 85,159 96,988 100,350 108,839 113,29827,018 26,667 27,846 28,634 31,621 32,504 34,530 36,5111,075 1,223 1,218 1,297 1,446 1,435 1,446 1,566
19,607 22,182 22,642 24,278 29,639 33,495 32,639 32,3975,324 6,000 6,165 6,662 6,984 7,479 7,864 7,9655,149 5,436 5,631 5,889 6,169 7,908 7,849 7,8394,416 4,989 5,401 5,830 8,070 9,079 9,042 9,2554,718 5,757 5,445 5,897 8,416 9,029 7,884 7,338
5,077 4,472 4,910 5,815 19,006 14,623 11,953 10,3064,830 4,187 4,606 5,518 18,677 14,301 11,517 9,899
247 285 304 297 329 322 436 407
7,006 7,956 8,936 9,661 11,293 11,559 10,503 14,2402,913 3,552 3,959 4,377 4,801 5,041 5,038 5,402
177 154 307 20,081 4,937 12,877 7,472 1,936
6,305 6,029 5,903 5,778 6,130 6,871 6,662 7,1251,693 1,244 3,038 4,477 4,714 4,788 6,416 4,823
Source: BEA Regional Economic Information SystemBureau of Economic Analysis71
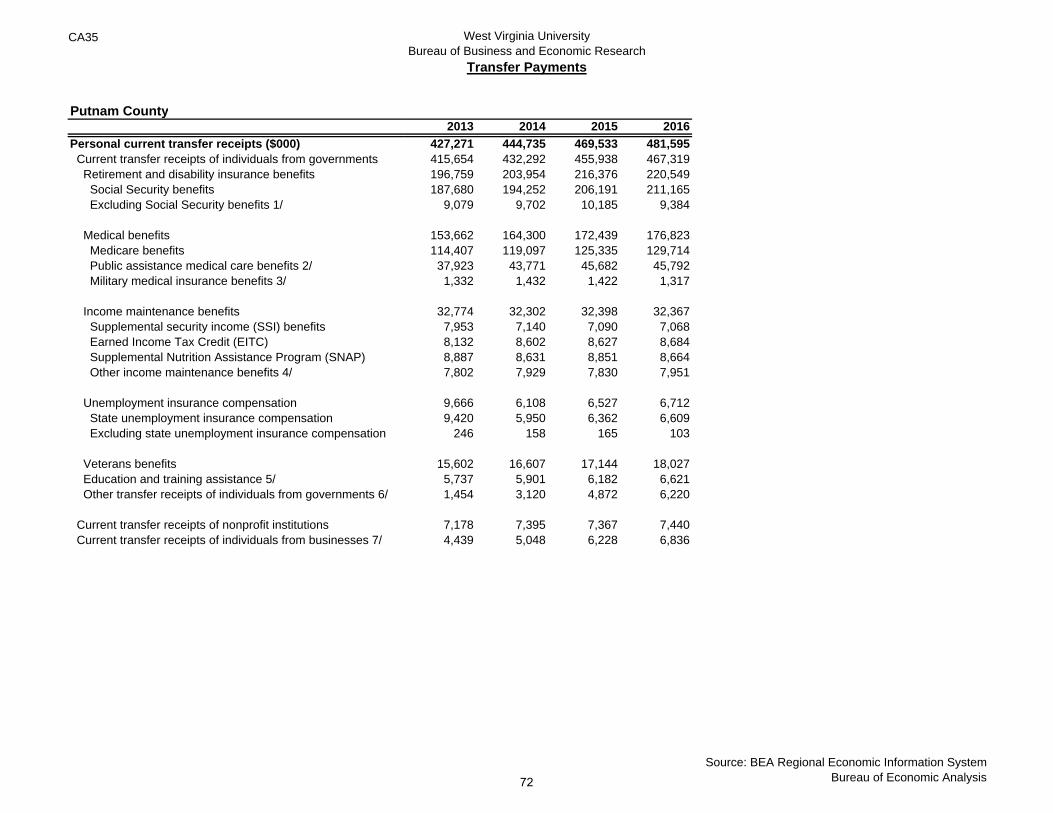
CA35 West Virginia UniversityBureau of Business and Economic Research
Transfer Payments
Putnam County
Personal current transfer receipts ($000) Current transfer receipts of individuals from governments Retirement and disability insurance benefits Social Security benefits Excluding Social Security benefits 1/
Medical benefits Medicare benefits Public assistance medical care benefits 2/ Military medical insurance benefits 3/
Income maintenance benefits Supplemental security income (SSI) benefits Earned Income Tax Credit (EITC) Supplemental Nutrition Assistance Program (SNAP) Other income maintenance benefits 4/
Unemployment insurance compensation State unemployment insurance compensation Excluding state unemployment insurance compensation
Veterans benefits Education and training assistance 5/ Other transfer receipts of individuals from governments 6/
Current transfer receipts of nonprofit institutions Current transfer receipts of individuals from businesses 7/
2013 2014 2015 2016427,271 444,735 469,533 481,595415,654 432,292 455,938 467,319196,759 203,954 216,376 220,549187,680 194,252 206,191 211,165
9,079 9,702 10,185 9,384
153,662 164,300 172,439 176,823114,407 119,097 125,335 129,71437,923 43,771 45,682 45,7921,332 1,432 1,422 1,317
32,774 32,302 32,398 32,3677,953 7,140 7,090 7,0688,132 8,602 8,627 8,6848,887 8,631 8,851 8,6647,802 7,929 7,830 7,951
9,666 6,108 6,527 6,7129,420 5,950 6,362 6,609
246 158 165 103
15,602 16,607 17,144 18,0275,737 5,901 6,182 6,6211,454 3,120 4,872 6,220
7,178 7,395 7,367 7,4404,439 5,048 6,228 6,836
Source: BEA Regional Economic Information SystemBureau of Economic Analysis72
CA35 Footnotes
Note‐‐ All dollar estimates are in current dollars (not adjusted for
inflation).
Last updated: November 16, 2017‐‐ new estimates for 2016; revised
estimates for 2014‐2015.
5/ Consists largely of federal fellowship payments (National Science
Foundation fellowships and traineeships, subsistence payments to state
maritime academy cadets, and other federal fellowships), interest
subsidy on higher education loans, Pell Grants, Job Corps payments,
education exchange payments, and state education assistance
payments.
6/ Consists largely of Bureau of Indian Affairs payments; Alaska
Permanent Fund dividend payments; compensation of survivors of
public safety officers; compensation of victims of crime; disaster relief
payments; compensation for Japanese internment; the Economic
Stimulus Act of 2008 rebates; the American Recovery and Reinvestment
Act of 2009 funded tax credits, Federal Additional Compensation for
unemployment, COBRA premium reduction, and the Economic Recovery
lump sum payment; the health insurance premium tax credit and cost
sharing reductions; other tax credits; and other special payments to
individuals.
7/ Consists of personal injury payments to individuals other than
employees and other business transfer payments.
1/ Consists largely of temporary disability payments, pension benefit
guaranty payments, black lung payments, workers compensation, and
Panama Canal construction annuity payments.
2/ Consists of Medicaid and other medical vendor payments.
3/ Consists of payments made under the TriCare Management Program
(formerly called CHAMPUS) for the medical care of dependents of active
duty military personnel and of retired military personnel and their
dependents at nonmilitary medical facilities.
4/ Consists largely of general assistance; family assistance (currently
Temporary Assistance for Needy Families (TANF), previously emergency
assistance and Aid to Families with Dependent Children (AFDC) and
emergency assistance); expenditures for food under the Special
Supplemental Nutrition Program for Women, Infants, and Children
(WIC); Other Needs Assistance; refugee assistance; foster home care and
adoption assistance; the Additional Child Tax Credit; and energy
assistance.
73
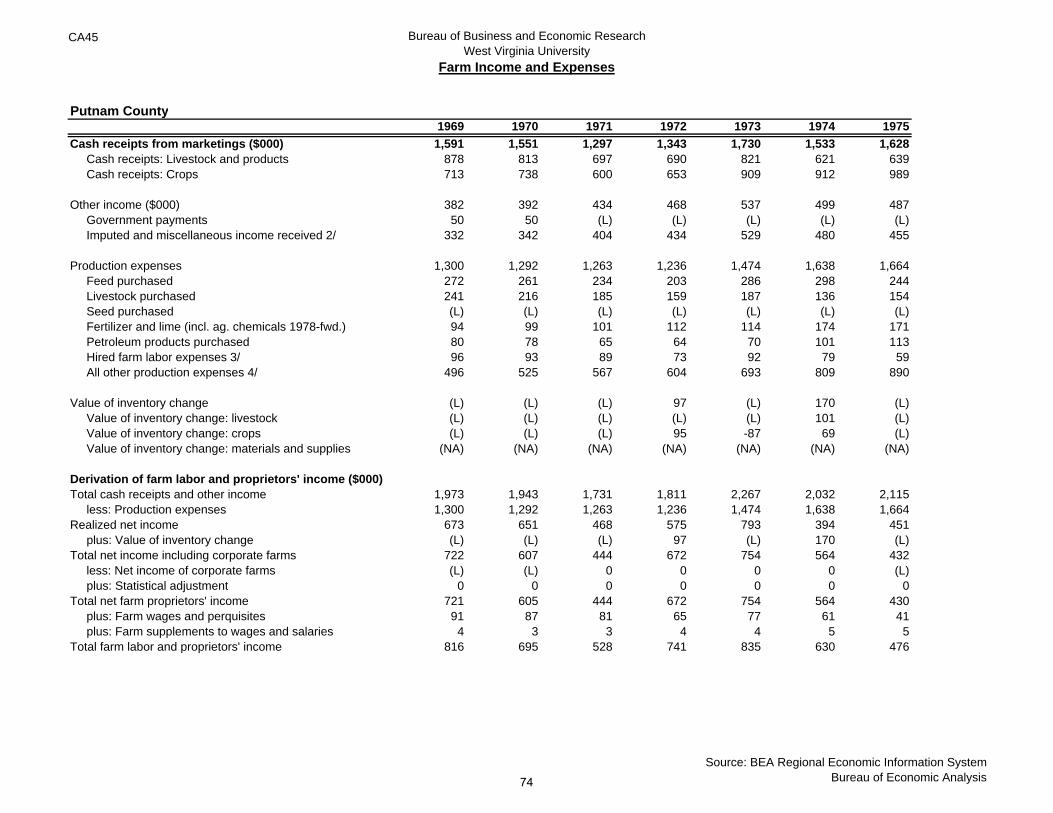
CA45 Bureau of Business and Economic ResearchWest Virginia University
Farm Income and Expenses
Putnam County1969 1970 1971 1972 1973 1974 1975
Cash receipts from marketings ($000) 1,591 1,551 1,297 1,343 1,730 1,533 1,628 Cash receipts: Livestock and products 878 813 697 690 821 621 639 Cash receipts: Crops 713 738 600 653 909 912 989
Other income ($000) 382 392 434 468 537 499 487 Government payments 50 50 (L) (L) (L) (L) (L) Imputed and miscellaneous income received 2/ 332 342 404 434 529 480 455
Production expenses 1,300 1,292 1,263 1,236 1,474 1,638 1,664 Feed purchased 272 261 234 203 286 298 244 Livestock purchased 241 216 185 159 187 136 154 Seed purchased (L) (L) (L) (L) (L) (L) (L) Fertilizer and lime (incl. ag. chemicals 1978-fwd.) 94 99 101 112 114 174 171 Petroleum products purchased 80 78 65 64 70 101 113 Hired farm labor expenses 3/ 96 93 89 73 92 79 59 All other production expenses 4/ 496 525 567 604 693 809 890
Value of inventory change (L) (L) (L) 97 (L) 170 (L) Value of inventory change: livestock (L) (L) (L) (L) (L) 101 (L) Value of inventory change: crops (L) (L) (L) 95 -87 69 (L) Value of inventory change: materials and supplies (NA) (NA) (NA) (NA) (NA) (NA) (NA)
Derivation of farm labor and proprietors' income ($000)Total cash receipts and other income 1,973 1,943 1,731 1,811 2,267 2,032 2,115
less: Production expenses 1,300 1,292 1,263 1,236 1,474 1,638 1,664Realized net income 673 651 468 575 793 394 451
plus: Value of inventory change (L) (L) (L) 97 (L) 170 (L)Total net income including corporate farms 722 607 444 672 754 564 432
less: Net income of corporate farms (L) (L) 0 0 0 0 (L) plus: Statistical adjustment 0 0 0 0 0 0 0
Total net farm proprietors' income 721 605 444 672 754 564 430 plus: Farm wages and perquisites 91 87 81 65 77 61 41 plus: Farm supplements to wages and salaries 4 3 3 4 4 5 5
Total farm labor and proprietors' income 816 695 528 741 835 630 476
Source: BEA Regional Economic Information SystemBureau of Economic Analysis74
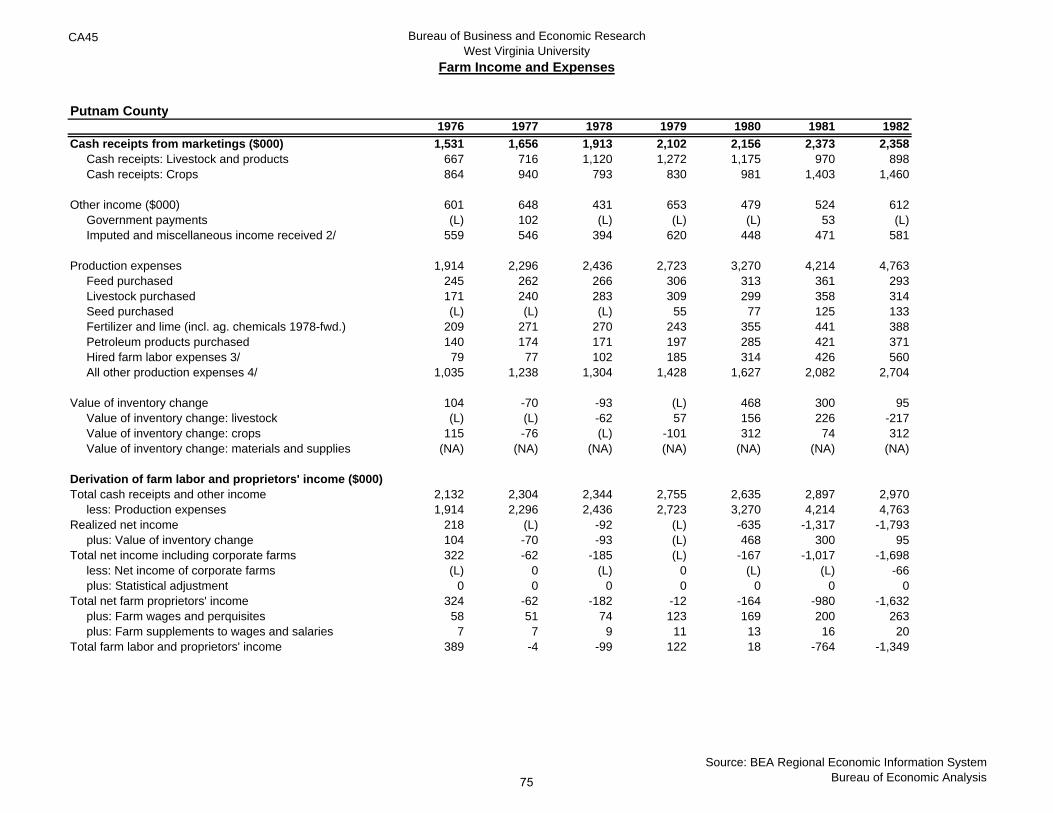
CA45 Bureau of Business and Economic ResearchWest Virginia University
Farm Income and Expenses
Putnam County
Cash receipts from marketings ($000) Cash receipts: Livestock and products Cash receipts: Crops
Other income ($000) Government payments Imputed and miscellaneous income received 2/
Production expenses Feed purchased Livestock purchased Seed purchased Fertilizer and lime (incl. ag. chemicals 1978-fwd.) Petroleum products purchased Hired farm labor expenses 3/ All other production expenses 4/
Value of inventory change Value of inventory change: livestock Value of inventory change: crops Value of inventory change: materials and supplies
Derivation of farm labor and proprietors' income ($000)Total cash receipts and other income
less: Production expensesRealized net income
plus: Value of inventory changeTotal net income including corporate farms
less: Net income of corporate farms plus: Statistical adjustment
Total net farm proprietors' income plus: Farm wages and perquisites plus: Farm supplements to wages and salaries
Total farm labor and proprietors' income
1976 1977 1978 1979 1980 1981 19821,531 1,656 1,913 2,102 2,156 2,373 2,358
667 716 1,120 1,272 1,175 970 898864 940 793 830 981 1,403 1,460
601 648 431 653 479 524 612(L) 102 (L) (L) (L) 53 (L)
559 546 394 620 448 471 581
1,914 2,296 2,436 2,723 3,270 4,214 4,763245 262 266 306 313 361 293171 240 283 309 299 358 314(L) (L) (L) 55 77 125 133
209 271 270 243 355 441 388140 174 171 197 285 421 37179 77 102 185 314 426 560
1,035 1,238 1,304 1,428 1,627 2,082 2,704
104 -70 -93 (L) 468 300 95(L) (L) -62 57 156 226 -217
115 -76 (L) -101 312 74 312(NA) (NA) (NA) (NA) (NA) (NA) (NA)
2,132 2,304 2,344 2,755 2,635 2,897 2,9701,914 2,296 2,436 2,723 3,270 4,214 4,763
218 (L) -92 (L) -635 -1,317 -1,793104 -70 -93 (L) 468 300 95322 -62 -185 (L) -167 -1,017 -1,698(L) 0 (L) 0 (L) (L) -66
0 0 0 0 0 0 0324 -62 -182 -12 -164 -980 -1,63258 51 74 123 169 200 2637 7 9 11 13 16 20
389 -4 -99 122 18 -764 -1,349
Source: BEA Regional Economic Information SystemBureau of Economic Analysis75
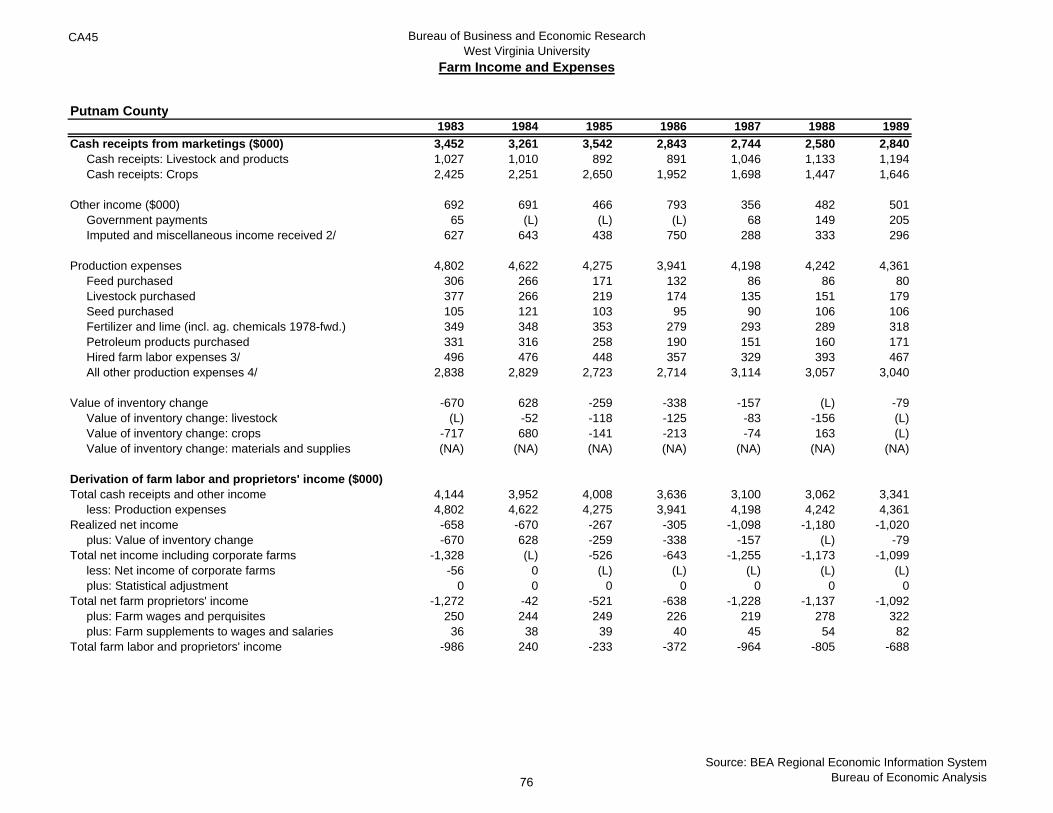
CA45 Bureau of Business and Economic ResearchWest Virginia University
Farm Income and Expenses
Putnam County
Cash receipts from marketings ($000) Cash receipts: Livestock and products Cash receipts: Crops
Other income ($000) Government payments Imputed and miscellaneous income received 2/
Production expenses Feed purchased Livestock purchased Seed purchased Fertilizer and lime (incl. ag. chemicals 1978-fwd.) Petroleum products purchased Hired farm labor expenses 3/ All other production expenses 4/
Value of inventory change Value of inventory change: livestock Value of inventory change: crops Value of inventory change: materials and supplies
Derivation of farm labor and proprietors' income ($000)Total cash receipts and other income
less: Production expensesRealized net income
plus: Value of inventory changeTotal net income including corporate farms
less: Net income of corporate farms plus: Statistical adjustment
Total net farm proprietors' income plus: Farm wages and perquisites plus: Farm supplements to wages and salaries
Total farm labor and proprietors' income
1983 1984 1985 1986 1987 1988 19893,452 3,261 3,542 2,843 2,744 2,580 2,8401,027 1,010 892 891 1,046 1,133 1,1942,425 2,251 2,650 1,952 1,698 1,447 1,646
692 691 466 793 356 482 50165 (L) (L) (L) 68 149 205
627 643 438 750 288 333 296
4,802 4,622 4,275 3,941 4,198 4,242 4,361306 266 171 132 86 86 80377 266 219 174 135 151 179105 121 103 95 90 106 106349 348 353 279 293 289 318331 316 258 190 151 160 171496 476 448 357 329 393 467
2,838 2,829 2,723 2,714 3,114 3,057 3,040
-670 628 -259 -338 -157 (L) -79(L) -52 -118 -125 -83 -156 (L)
-717 680 -141 -213 -74 163 (L)(NA) (NA) (NA) (NA) (NA) (NA) (NA)
4,144 3,952 4,008 3,636 3,100 3,062 3,3414,802 4,622 4,275 3,941 4,198 4,242 4,361-658 -670 -267 -305 -1,098 -1,180 -1,020-670 628 -259 -338 -157 (L) -79
-1,328 (L) -526 -643 -1,255 -1,173 -1,099-56 0 (L) (L) (L) (L) (L)
0 0 0 0 0 0 0-1,272 -42 -521 -638 -1,228 -1,137 -1,092
250 244 249 226 219 278 32236 38 39 40 45 54 82
-986 240 -233 -372 -964 -805 -688
Source: BEA Regional Economic Information SystemBureau of Economic Analysis76
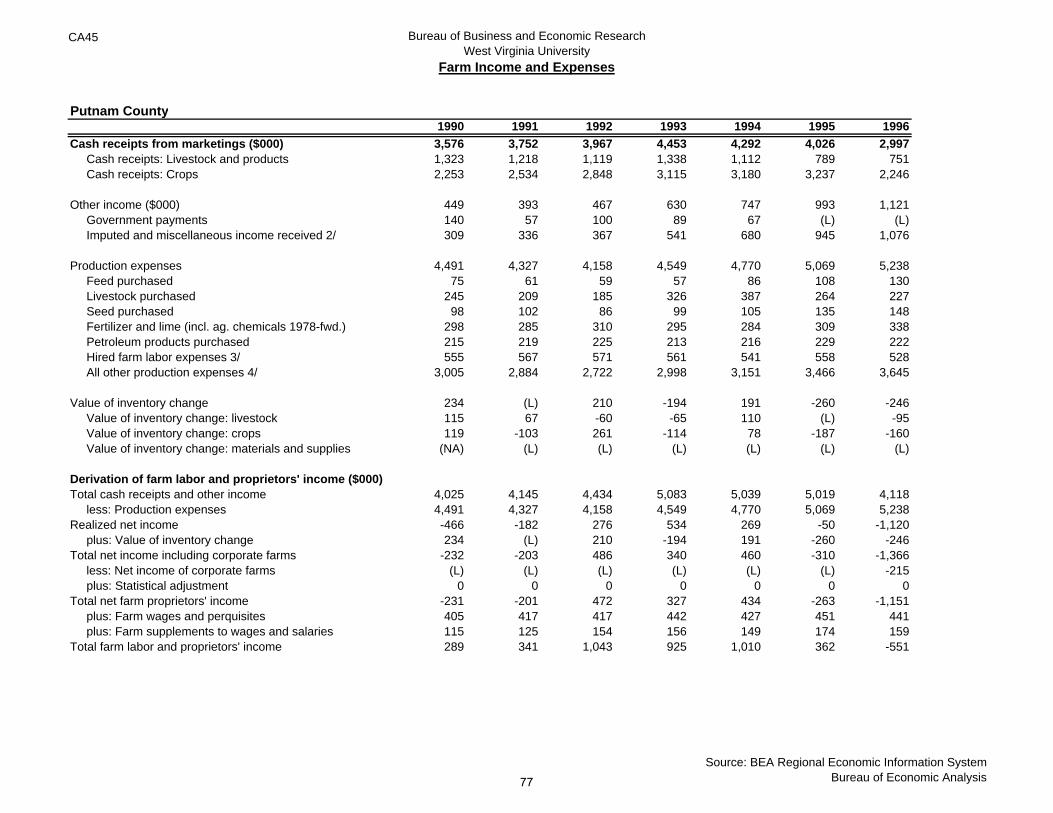
CA45 Bureau of Business and Economic ResearchWest Virginia University
Farm Income and Expenses
Putnam County
Cash receipts from marketings ($000) Cash receipts: Livestock and products Cash receipts: Crops
Other income ($000) Government payments Imputed and miscellaneous income received 2/
Production expenses Feed purchased Livestock purchased Seed purchased Fertilizer and lime (incl. ag. chemicals 1978-fwd.) Petroleum products purchased Hired farm labor expenses 3/ All other production expenses 4/
Value of inventory change Value of inventory change: livestock Value of inventory change: crops Value of inventory change: materials and supplies
Derivation of farm labor and proprietors' income ($000)Total cash receipts and other income
less: Production expensesRealized net income
plus: Value of inventory changeTotal net income including corporate farms
less: Net income of corporate farms plus: Statistical adjustment
Total net farm proprietors' income plus: Farm wages and perquisites plus: Farm supplements to wages and salaries
Total farm labor and proprietors' income
1990 1991 1992 1993 1994 1995 19963,576 3,752 3,967 4,453 4,292 4,026 2,9971,323 1,218 1,119 1,338 1,112 789 7512,253 2,534 2,848 3,115 3,180 3,237 2,246
449 393 467 630 747 993 1,121140 57 100 89 67 (L) (L)309 336 367 541 680 945 1,076
4,491 4,327 4,158 4,549 4,770 5,069 5,23875 61 59 57 86 108 130
245 209 185 326 387 264 22798 102 86 99 105 135 148
298 285 310 295 284 309 338215 219 225 213 216 229 222555 567 571 561 541 558 528
3,005 2,884 2,722 2,998 3,151 3,466 3,645
234 (L) 210 -194 191 -260 -246115 67 -60 -65 110 (L) -95119 -103 261 -114 78 -187 -160
(NA) (L) (L) (L) (L) (L) (L)
4,025 4,145 4,434 5,083 5,039 5,019 4,1184,491 4,327 4,158 4,549 4,770 5,069 5,238-466 -182 276 534 269 -50 -1,120234 (L) 210 -194 191 -260 -246
-232 -203 486 340 460 -310 -1,366(L) (L) (L) (L) (L) (L) -215
0 0 0 0 0 0 0-231 -201 472 327 434 -263 -1,151405 417 417 442 427 451 441115 125 154 156 149 174 159289 341 1,043 925 1,010 362 -551
Source: BEA Regional Economic Information SystemBureau of Economic Analysis77
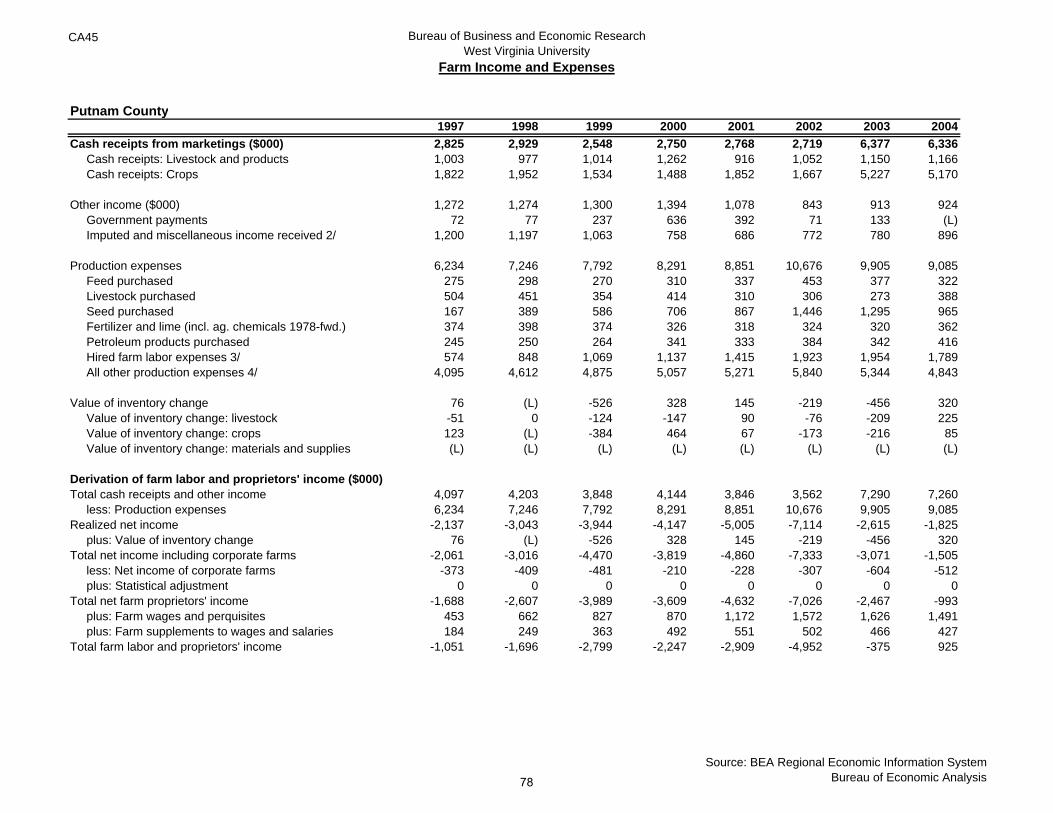
CA45 Bureau of Business and Economic ResearchWest Virginia University
Farm Income and Expenses
Putnam County
Cash receipts from marketings ($000) Cash receipts: Livestock and products Cash receipts: Crops
Other income ($000) Government payments Imputed and miscellaneous income received 2/
Production expenses Feed purchased Livestock purchased Seed purchased Fertilizer and lime (incl. ag. chemicals 1978-fwd.) Petroleum products purchased Hired farm labor expenses 3/ All other production expenses 4/
Value of inventory change Value of inventory change: livestock Value of inventory change: crops Value of inventory change: materials and supplies
Derivation of farm labor and proprietors' income ($000)Total cash receipts and other income
less: Production expensesRealized net income
plus: Value of inventory changeTotal net income including corporate farms
less: Net income of corporate farms plus: Statistical adjustment
Total net farm proprietors' income plus: Farm wages and perquisites plus: Farm supplements to wages and salaries
Total farm labor and proprietors' income
1997 1998 1999 2000 2001 2002 2003 20042,825 2,929 2,548 2,750 2,768 2,719 6,377 6,3361,003 977 1,014 1,262 916 1,052 1,150 1,1661,822 1,952 1,534 1,488 1,852 1,667 5,227 5,170
1,272 1,274 1,300 1,394 1,078 843 913 92472 77 237 636 392 71 133 (L)
1,200 1,197 1,063 758 686 772 780 896
6,234 7,246 7,792 8,291 8,851 10,676 9,905 9,085275 298 270 310 337 453 377 322504 451 354 414 310 306 273 388167 389 586 706 867 1,446 1,295 965374 398 374 326 318 324 320 362245 250 264 341 333 384 342 416574 848 1,069 1,137 1,415 1,923 1,954 1,789
4,095 4,612 4,875 5,057 5,271 5,840 5,344 4,843
76 (L) -526 328 145 -219 -456 320-51 0 -124 -147 90 -76 -209 225123 (L) -384 464 67 -173 -216 85(L) (L) (L) (L) (L) (L) (L) (L)
4,097 4,203 3,848 4,144 3,846 3,562 7,290 7,2606,234 7,246 7,792 8,291 8,851 10,676 9,905 9,085
-2,137 -3,043 -3,944 -4,147 -5,005 -7,114 -2,615 -1,82576 (L) -526 328 145 -219 -456 320
-2,061 -3,016 -4,470 -3,819 -4,860 -7,333 -3,071 -1,505-373 -409 -481 -210 -228 -307 -604 -512
0 0 0 0 0 0 0 0-1,688 -2,607 -3,989 -3,609 -4,632 -7,026 -2,467 -993
453 662 827 870 1,172 1,572 1,626 1,491184 249 363 492 551 502 466 427
-1,051 -1,696 -2,799 -2,247 -2,909 -4,952 -375 925
Source: BEA Regional Economic Information SystemBureau of Economic Analysis78
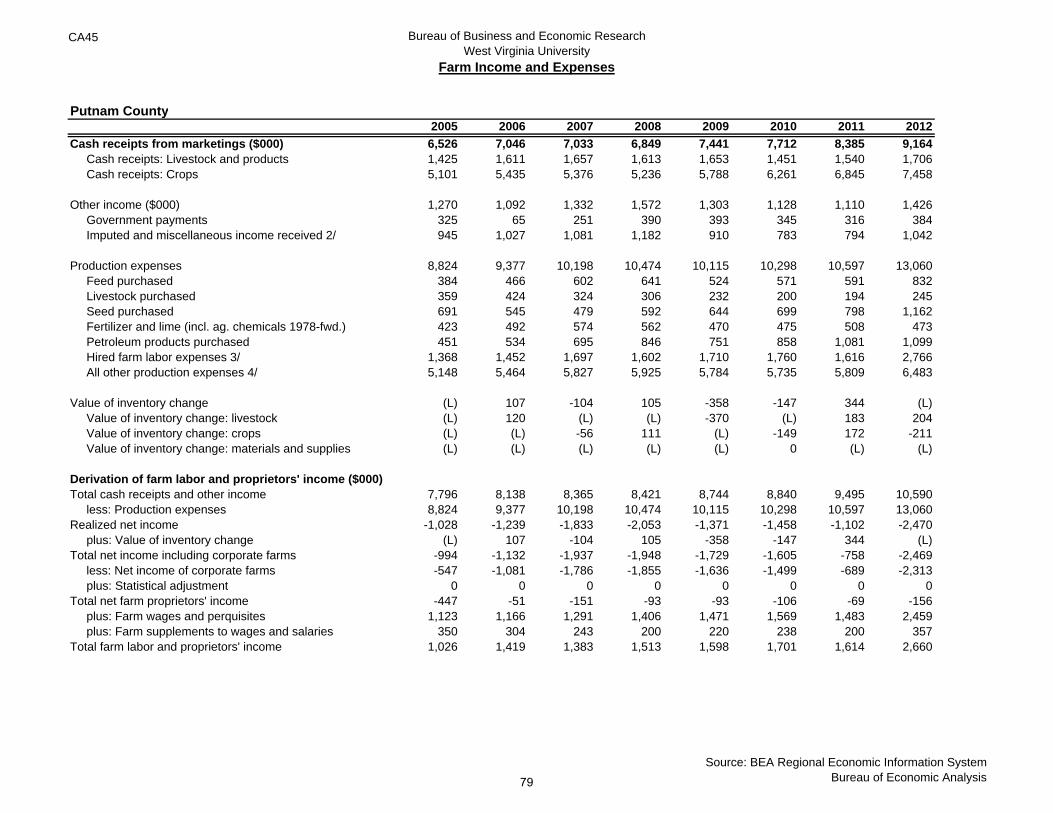
CA45 Bureau of Business and Economic ResearchWest Virginia University
Farm Income and Expenses
Putnam County
Cash receipts from marketings ($000) Cash receipts: Livestock and products Cash receipts: Crops
Other income ($000) Government payments Imputed and miscellaneous income received 2/
Production expenses Feed purchased Livestock purchased Seed purchased Fertilizer and lime (incl. ag. chemicals 1978-fwd.) Petroleum products purchased Hired farm labor expenses 3/ All other production expenses 4/
Value of inventory change Value of inventory change: livestock Value of inventory change: crops Value of inventory change: materials and supplies
Derivation of farm labor and proprietors' income ($000)Total cash receipts and other income
less: Production expensesRealized net income
plus: Value of inventory changeTotal net income including corporate farms
less: Net income of corporate farms plus: Statistical adjustment
Total net farm proprietors' income plus: Farm wages and perquisites plus: Farm supplements to wages and salaries
Total farm labor and proprietors' income
2005 2006 2007 2008 2009 2010 2011 20126,526 7,046 7,033 6,849 7,441 7,712 8,385 9,1641,425 1,611 1,657 1,613 1,653 1,451 1,540 1,7065,101 5,435 5,376 5,236 5,788 6,261 6,845 7,458
1,270 1,092 1,332 1,572 1,303 1,128 1,110 1,426325 65 251 390 393 345 316 384945 1,027 1,081 1,182 910 783 794 1,042
8,824 9,377 10,198 10,474 10,115 10,298 10,597 13,060384 466 602 641 524 571 591 832359 424 324 306 232 200 194 245691 545 479 592 644 699 798 1,162423 492 574 562 470 475 508 473451 534 695 846 751 858 1,081 1,099
1,368 1,452 1,697 1,602 1,710 1,760 1,616 2,7665,148 5,464 5,827 5,925 5,784 5,735 5,809 6,483
(L) 107 -104 105 -358 -147 344 (L)(L) 120 (L) (L) -370 (L) 183 204(L) (L) -56 111 (L) -149 172 -211(L) (L) (L) (L) (L) 0 (L) (L)
7,796 8,138 8,365 8,421 8,744 8,840 9,495 10,5908,824 9,377 10,198 10,474 10,115 10,298 10,597 13,060
-1,028 -1,239 -1,833 -2,053 -1,371 -1,458 -1,102 -2,470(L) 107 -104 105 -358 -147 344 (L)
-994 -1,132 -1,937 -1,948 -1,729 -1,605 -758 -2,469-547 -1,081 -1,786 -1,855 -1,636 -1,499 -689 -2,313
0 0 0 0 0 0 0 0-447 -51 -151 -93 -93 -106 -69 -156
1,123 1,166 1,291 1,406 1,471 1,569 1,483 2,459350 304 243 200 220 238 200 357
1,026 1,419 1,383 1,513 1,598 1,701 1,614 2,660
Source: BEA Regional Economic Information SystemBureau of Economic Analysis79
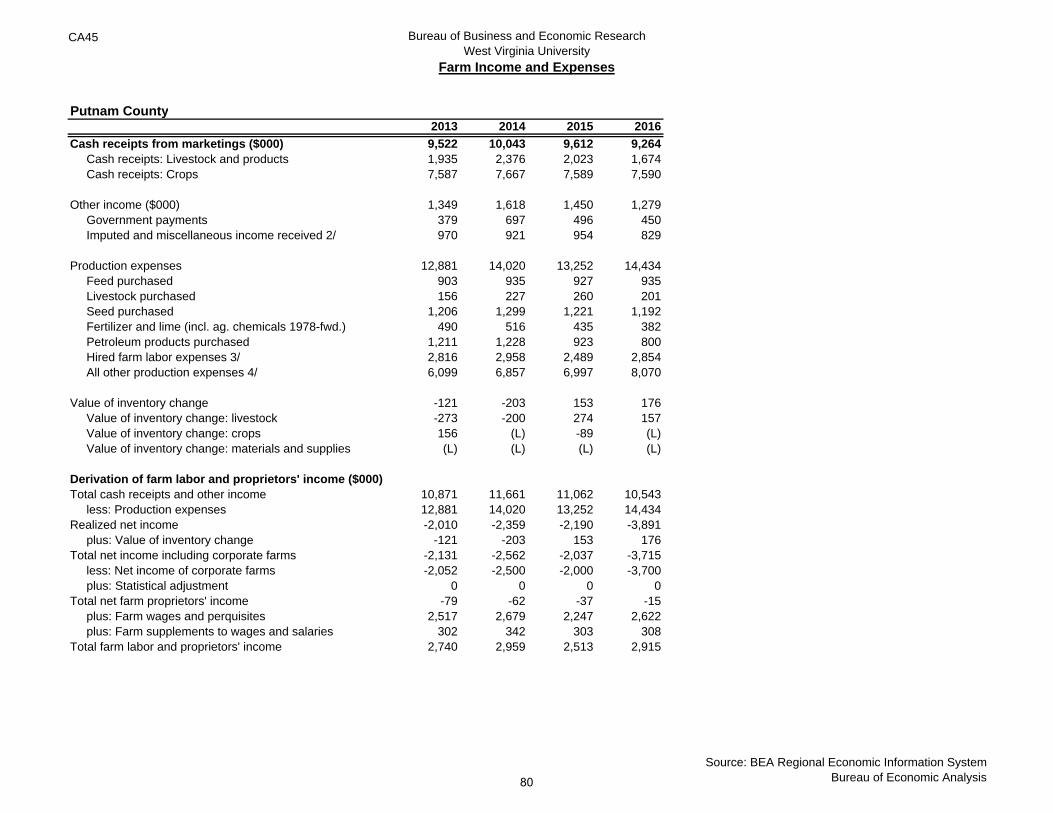
CA45 Bureau of Business and Economic ResearchWest Virginia University
Farm Income and Expenses
Putnam County
Cash receipts from marketings ($000) Cash receipts: Livestock and products Cash receipts: Crops
Other income ($000) Government payments Imputed and miscellaneous income received 2/
Production expenses Feed purchased Livestock purchased Seed purchased Fertilizer and lime (incl. ag. chemicals 1978-fwd.) Petroleum products purchased Hired farm labor expenses 3/ All other production expenses 4/
Value of inventory change Value of inventory change: livestock Value of inventory change: crops Value of inventory change: materials and supplies
Derivation of farm labor and proprietors' income ($000)Total cash receipts and other income
less: Production expensesRealized net income
plus: Value of inventory changeTotal net income including corporate farms
less: Net income of corporate farms plus: Statistical adjustment
Total net farm proprietors' income plus: Farm wages and perquisites plus: Farm supplements to wages and salaries
Total farm labor and proprietors' income
2013 2014 2015 20169,522 10,043 9,612 9,2641,935 2,376 2,023 1,6747,587 7,667 7,589 7,590
1,349 1,618 1,450 1,279379 697 496 450970 921 954 829
12,881 14,020 13,252 14,434903 935 927 935156 227 260 201
1,206 1,299 1,221 1,192490 516 435 382
1,211 1,228 923 8002,816 2,958 2,489 2,8546,099 6,857 6,997 8,070
-121 -203 153 176-273 -200 274 157156 (L) -89 (L)(L) (L) (L) (L)
10,871 11,661 11,062 10,54312,881 14,020 13,252 14,434-2,010 -2,359 -2,190 -3,891
-121 -203 153 176-2,131 -2,562 -2,037 -3,715-2,052 -2,500 -2,000 -3,700
0 0 0 0-79 -62 -37 -15
2,517 2,679 2,247 2,622302 342 303 308
2,740 2,959 2,513 2,915
Source: BEA Regional Economic Information SystemBureau of Economic Analysis80
CA45 Footnotes
1/ Consists of the value of home consumption and other farm related
income components, such as machine hire and custom work income and
income from forest products (1978 to present).
2/ Consists of hired workers' cash pay and perquisites, employers'
contributions for social security and Medicare, and payments for
contract labor, machine hire, and custom work.
3/ Consists of repair and operation of machinery; depreciation, interest,
rent and taxes; and other miscellaneous expenses including agricultural
chemicals (1969‐77).
Note‐‐ All dollar estimates are in current dollars (not adjusted for
inflation).
Last updated: November 16, 2017‐‐ new estimates for 2016; revised
estimates for 2014‐2015.
81