Embed Size (px)
Citation preview

Temperature-size responses in
Daphnia magna along a calcium gradient
Alicia Alfonso Gómez
Master Thesis
Section for Aquatic Biology and Toxicology
Department of Biosciences
University of Oslo December 2018

!II

Temperature-size responses in Daphnia magna
along a calcium gradient
!III

© Alicia Alfonso Gómez
2018
Temperature-size responses in Daphnia magna along a calcium gradient
Alicia Alfonso Gómez
http://www.duo.uio.no
Press: Reprosentralen, University of Oslo
!IV

ACKNOWLEDGMENTS This master project was challenging from the very beginning, but I was incredibly fortunate
to count with a top of the line team to help me at every step of the way. For this and other
reasons, I always refer as ”we” while explaining the project, because all my personal effort
was supported in one way or another by my group. For this, I would like to dedicate this
work and all my gratitude to them.
To my main supervisor and big chief, Dag O. Hessen, for his immense knowledge, leadership
and exhaustive corrections no matter the day or the hour. Also, for believing in me since the
first day and supporting me as a professional, and as a human.
To my co-supervisors, Tom Andersen, Catharina Broch, and Francisco Bullejos. Thank you
Tom, for being the genius behind the most innovative ideas and the statistics. I admit it, now I
love R. Thank you Catharina, for your compromise and considerate teaching, I wish someday
I will be half the scientist you already are. To Fran, for being my mentor, my master Jedi, and
my brother. Thank you for being always available and as committed to this project as I am.
These four people are the reason for this brilliant project, that gave me as many headaches as
satisfaction. Thank you for the long meetings and explanations, for the never-ending emails
and corrections, and mostly, for your creativity, patience and insuperable scientific value.
To Jan Heuschele, which developed and improved an impressive method for measuring that
I’m sure will grant many more incredible results. To Per-Johan Færøvig, the never-failing
help with an eternal smile. To all the Daphnia-people: Yngvild Vindenes, Erik Sperfeld,
Jessica Michel, Franceen Eshun-Wilson and Elke Eriksen. To which I owe incredible ideas,
plenty of algae culture and hours of Daphnia stock care.
And last but not least, to my mother and my partner, for supporting and loving me in the
distance and the closeness.
Muchísimas gracias, de corazón.
!V

!VI
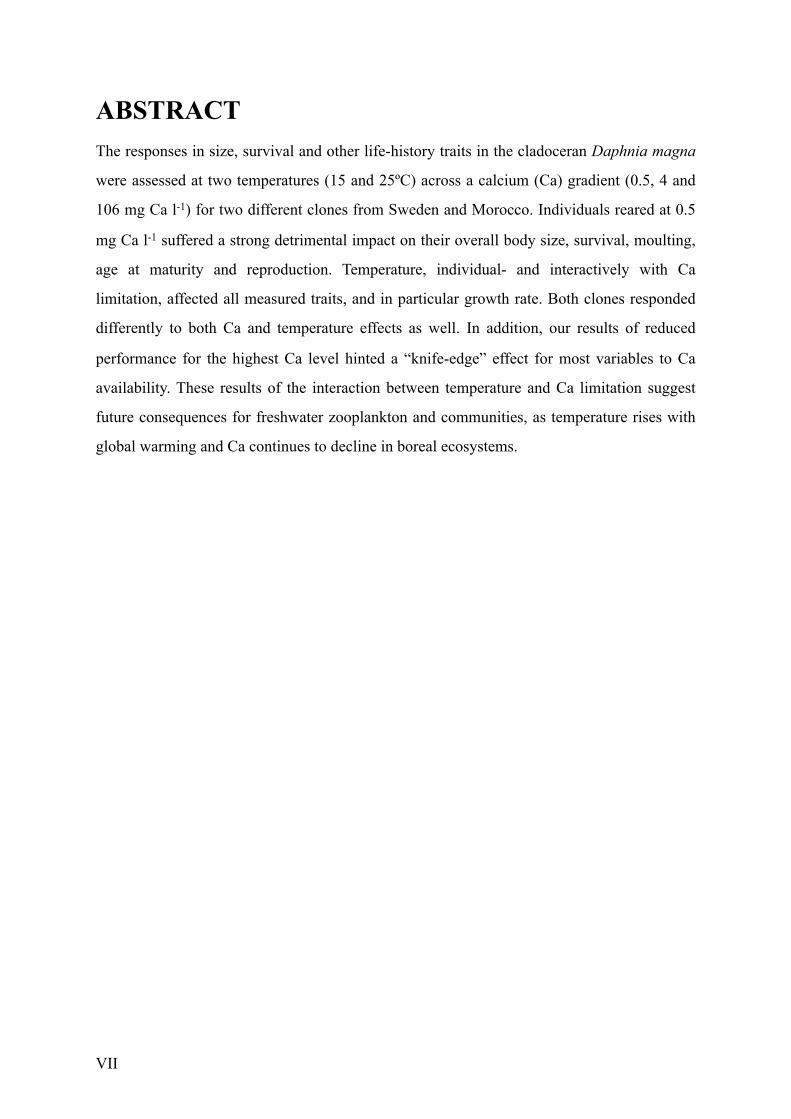
ABSTRACT The responses in size, survival and other life-history traits in the cladoceran Daphnia magna
were assessed at two temperatures (15 and 25ºC) across a calcium (Ca) gradient (0.5, 4 and
106 mg Ca l-1) for two different clones from Sweden and Morocco. Individuals reared at 0.5
mg Ca l-1 suffered a strong detrimental impact on their overall body size, survival, moulting,
age at maturity and reproduction. Temperature, individual- and interactively with Ca
limitation, affected all measured traits, and in particular growth rate. Both clones responded
differently to both Ca and temperature effects as well. In addition, our results of reduced
performance for the highest Ca level hinted a “knife-edge” effect for most variables to Ca
availability. These results of the interaction between temperature and Ca limitation suggest
future consequences for freshwater zooplankton and communities, as temperature rises with
global warming and Ca continues to decline in boreal ecosystems.
!VII

!VIII

CONTENTS
1. Introduction 1 .........................................................................................................................
2. Materials and methods 6 .........................................................................................................
Preliminary analyses and experiments 6 ............................................................................................................
Long-term experiment 10 ...................................................................................................................................
3. Results 15 ................................................................................................................................
4. Discussion 23 ..........................................................................................................................
Conclusion 31 ..............................................................................................................................
References 33 ..............................................................................................................................
Appendixes 46.............................................................................................................................
!IX

!X

1. Introduction
In 1848, Carl Bergmann published his book Über die Verhältnisse der Wärmeökonomie der
Thiere zu ihrer Grösse, where he formulated one of the most iconic hypotheses in biology,
the nowadays called Bergmann’s rule. In his book, Bergmann describes how broadly
distributed species differed in adult body size at different latitudes (Bergmann, 1848). Colder
regions presented animals with larger body sizes, while warmer areas had generally smaller
individuals. More than a hundred and fifty years later, we can find an extensive literature of
studies that have proven (Van Voorhies, 1996; Yom-Tov, 2001), rejected (Geist, 1987), and
even reversed (Mousseau, 1997; Aguilar-Alberola & Mesquita-Joanes, 2014) the Bergmann’s
rule for a wide range of taxa. Originally, Bergmann described this pattern for endotherms, but
it was similarly found intraspecifically on ectotherms, bacteria, protists and plants (Atkinson,
1994, 1995) and then named “Temperature-Size rule” (Atkinson, Morley & Hughes, 2006;
Daufresne, Lengfellner & Sommer, 2009). This rule applies to different populations of the
same species, showing low-temperature adapted individuals to grow slower but reach larger
final sizes than their conspecifics in warmer climates (Van Voorhies, 1996; Forster, Hirst &
Woodward, Perkins & Brown, 2010; Angilletta, Steury & Sears, 2004; Arendt, 2007).
Previous studies also found the same type of pattern at a cellular and genomic level (Hessen
& Persson, 2009; Hessen, Daufresne & Leinaas, 2013; Jalal, Andersen & Hessen, 2013).
Despite the controversy, it was clearly proven that temperature affected important life-history
traits such as growth and body size, and also had an effect on maturation, reproduction and
even oxygen intake (Hoefnagel & Verberk, 2015).
As the effects of global change become more frequent and severe (IPCC, 2018),
organisms need to adjust their physiology to survive and achieve higher fitness (Whitman &
Agrawal, 2009). But temperature is not the only limiting factor for many species, as elements
with allometric effects may also impact the “Temperature-Size rule” (TSR). Among these
elements we find calcium (Ca), which can constitute >10% of the exoskeleton of numerous
crustaceans (Hessen, Alstad & Skardal, 2000), highly limiting their resources in low-Ca
freshwater environments (“soft-waters”). Crustaceans generally get their Ca-uptake directly
from the water, depending greatly on diluted Ca concentration (Cairns & Yan, 2009).
!1

Most freshwater ecosystems in the Northern Hemisphere have suffered a serious Ca
decline in the last decades, partly due to an inherited post-acidification state, but also to
changes in land use (Likens, Driscoll & Buso, 1996; Jeziorski et al., 2008a; Hessen et al.,
2017). Acidification coming from rain lowered the soil pH in soft-water lakes, causing a
leakage of Ca2+ ions reservoirs that almost depleted the cation pool of the basin and reduced
the buffering capacity of the lake (Aherne, Dillon & Cosby, 2003). A national survey of 1500
Norwegian lakes revealed that median Ca concentration was 0.9 mg Ca l-1, 90% of the
localities had less than 2.5 mg Ca l-1 and almost no localities exceeded 5 mg Ca l-1
(Skjelkvåle, Wright & Henriksen, 1998). Later studies in Norway also found a significant
11% Ca reduction per decade in just the last 30 years (Hessen et al., 2017).
One of the keystone secondary producers in freshwater lakes worldwide is Daphnia, a
highly studied cladoceran that feeds on algae and represents one of the primary food sources
for small predators such as aquatic arthropods and small fish (Ebert, 2008). Its particular way
of reproduction is what makes Daphnia the perfect freshwater model organism, as during the
parthenogenetic cycle, females produce diploid clones asexually and under stress conditions
they engender males for sexual reproduction (Green, 1956). The sexual part of the cycle will
produce a resting egg protected by a hard shell called “ephippium”, that can lay in the bottom
of the lake until adverse conditions (freezing temperatures, drought, low food) regress (Ebert,
2008; Kawasaki, Sakata & Namiki, 2004). An schematic diagram of the life cycle of Daphnia
magna is presented in Figure 1.
Daphniids are the highest Ca-demanding group of freshwater zooplankton, since they
absorb it by active uptake and lack a storage mechanism, which makes them very vulnerable
to Ca-limitation (Cairns & Yan 2009; Tan & Wang, 2009, 2010). The active uptake is
mediated by ATPase transporters and facilitative Na+/Ca2+ exchangers (Wheatly, Zanotto &
Hubbard, 2002).
!2

Daphnia magna is the largest species of daphniids worldwide, with one of the highest
Ca concentrations known for freshwater zooplankton (Jeziorski et al., 2008b). As other
crustaceans, Daphnia magna replaces its carapace in order to grow (Porcella, Rixford &
Slater, 1969, Cowgill et al., 1986). This exoskeleton formed mainly by CaCO3 is shed many
times during Daphnia’s life cycle (Wheatly, 1999), predominantly during the juvenile phase,
where individuals spend most of their energy and resources into fast growth until maturity
(Alstad, Skardal & Hessen, 1999). Therefore, moulting increases the Ca demand on these
species and phases, as they can experience a loss of almost a half of their body content in Ca
with every moult shed (Tan & Wang, 2009; Porcella et al., 1969).
Recent studies have confirmed the TSR pattern in Daphnia, also suggesting a link
body size to cell size and genome size (Jalal et al., 2015). Ca being an essential component of
Daphnia’s exoskeleton (Porcella et al., 1969; Wheatly, 1999), the number of studies focused
on Ca thresholds for survival and its interactions with other stressors such as temperature is
surprisingly low (Ashforth & Yan, 2008). However, there are very interesting results on Ca-
dependent toxicity for other elements like copper, zinc, nickel or cadmium (De
Schamphelaere & Janssen, 2002; Clifford & McGeer, 2009; Kozlova, Wood & McGeer,
2009; Clifford & McGeer, 2010; Antczak et al., 2015), as well as extensive research on trade-
offs driven by other elements like phosphorus, nitrogen or carbon (Andersen & Hessen, 1989;
Hessen, 1990; Frost, Xenopoulos & Larson, 2004; He & Wang, 2009). Ca has been found to
also affect movement rates in Daphnia, making individuals less active at low Ca
!3
Figure 1. Life cycle of Daphnia magna. Under favourable environmental conditions, Daphnia females reproduce asexually by parthenogenesis. In adverse conditions, females produce males for sexual reproduction, and resting eggs (ephippia).

concentrations and temperatures, suggesting multiple stressor interactions might play a
crucial role in the life history of daphniids (Betini et al., 2016). Ca limitation combined with
other abiotic or biotic (food quantity and quality constraints) stressors have negative added
impacts on Daphnia’s survival and reproduction (Hessen & Alstad, 2000; Rukke, 2002;
Ashforth & Yan, 2008; Giardini, Yan & Heyland, 2015). Later age at maturation and smaller
clutches were also shown for Daphnia pulex in other studies (Ashforth & Yan, 2008).
Other factors that can get enhanced by Ca limitation are predation and competition
(Alstad et al., 1999, Hessen & Alstad, 2000, Jeziorsky et al., 2012, 2014). In habitats very
limited by low Ca, high Ca-demanding species will be replaced by others with lower Ca
requirements (Hessen & Alstad, 2000; Wærvågen, Rukke & Hessen, 2002) producing a shift
in communities’ structures affecting both their composition and species richness (Hessen,
Faafeng & Andersen, 1995). This has been seen in a process called “jellyfication”, where Ca-
poor gelatinous species like Holopedium gibberum out-compete Ca-rich Daphnia in Ca-
limited environments (Hessen et al., 1995).
In any habitat, organisms face environmental factors that can change the way their
genotype is expressed into different phenotypes. The capability to manage these changes is
called phenotypic plasticity (Lampert, 1993; Whitman & Agrawal, 2009; Kelly, Panhuis &
Stoehr, 2012). This definition also comprehends how the environment can modify an
organism’s development (Zeigler, 2013), or how this individual can also change its phenotype
in order to respond to new environmental conditions (Kelly et al., 2012). Phenotypic
plasticity can help organisms cope with the energy trade-offs of abiotic effects, such as
temperature, but costs and indirect effects on ecological communities are not very well-
known yet (Merilä & Hendry, 2014). Phenotypic plasticity has been observed in different
clones of Daphnia subject to low food (Olijnyk & Nelson 2013, Cressler, Bengtson &
Nelson, 2017), predation (Boeing, Ramcharan & Riessen, 2006), and toxicity (Jiang et al.,
2013) studies. However, inter-clonal variation between Daphnia magna clones at low Ca
concentrations and different temperatures has not been recorded to this day.
!4

Freshwater ecosystems are among the most vulnerable environments to climate
change (Woodward et al., 2010) which is already rising their temperature in lakes all over the
world (O’Reilly et al., 2015). This will represent a threat to Ca-requiring organisms like
Daphnia magna with bottom-up consequences for higher trophic levels in the same
ecosystem (Ashforth & Yan, 2008). Assessing then the impact of Ca limitation and its
combined effect with temperature is key to understand the mechanisms behind phenotypical
changes in species, and also to help us preserve fragile freshwater ecosystems.
Master’s thesis aims and hypotheses
The objective of my Master’s project is to assess the effects of low Ca concentrations and
different temperatures on size, survival and other life-history traits of Daphnia magna.
Animals will be exposed to Ca concentrations that can be found in 95% of Norwegian lakes
(< 5 mg Ca l-1, Hessen et al., 2017), which are still in decline and require a prompt
understanding of interacting factors and most of all an assessment of their potential harmful
effects. To achieve this, I will test two hypotheses:
1. Low Ca concentrations have a detrimental impact on Daphnia magna’s performance
2. Ca limitation has an interactive effect with temperature responses
!5

2. Materials and methods Preliminary analyses and experiments Medium selection
In order to decide the most appropriate medium for growing Daphnia magna at low Ca
concentrations, we considered a priori 5 widely used media: ADaM (Klüttgen et al., 1994),
FLAMES (Celis-Salgado et al., 2008), COMBO (Kilham et al., 1998; Samel et al., 1999),
Elendt M4 and Elendt M7 (Elendt & Bias, 1990; Samel et al., 1999; OECD, 2012).
Giving their chemical composition judged from the bibliography, we discarded ADaM
medium due to the difficulties assessing the exact composition of the synthetic sea salt
required. For the other media we tested the theoretical chemical responses to various CaCl2-
additions using Phreeqc (Parkhurst & Appelo, 2013). This program was used on R statistics
(R Core Team, 2017) with the adapted package ‘phreeqc’ (Charlton & Parkhurst, 2011). Since
complex and unforeseen chemical reactions may take place when adding salts to media, such
assessments are imperative to avoid confounding impacts of experimental manipulations.
This software allowed us to perform titration analyses following modification of the original
input file so that we can calculate the chemical composition after experimental Ca addition to
the media. The speciation analyses gave us information on pH fluctuation and graphic
representation for all the speciation in base of different CaCl2 concentrations.
First, we imported the composition of Elendt M4, Elendt M7 and COMBO described
in Table 1 from Samel et al. (1999). The input data used for FLAMES medium was
originated from Celis-Salgado et al. (2008), but since the pH predicted by Phreeqc differed
substantially from the values given in the article describing the medium (pH = 6.4–6.7), we
rejected FLAMES. We thus performed in depth speciation analysis only with Elendt M4,
Elendt M7 and COMBO (Samel et al., 1999).
Based on the stoichiometries and crystal water contents of the dry media components,
we calculated final concentrations of individual elements (Figure 2) and used this as input for
speciation analysis with Phreeqc (Parkhurst & Appelo, 2013).
!6

For each medium, a script was generated, adding the information for the element we wanted
to do a titration with. In our case, we added CaCl2 to initially Ca-free media in 200 steps from
0 to 0.002 mol Ca l-1. Phreeqc then calculates the chemical equilibria at every step of the
titration. All titrations assumed aerobic conditions (phase equilibrium with a 21% O2
atmosphere). pH was calculated under the assumption of equilibrium with a 350 ppm pCO2
reference atmosphere. All resulting chemical compounds were divided into key elements (Ca,
Fe, Mg, N, P) for better to visualize the responses. As an example, a titration for some Fe
species is included in Figure 3.
Elendt M4 medium was ultimately selected after showing the most stable titrations
above 0.5 mg Ca l-1 and the least complex composition (OECD, 2012).
Details of the media composition and script for the selection with Phreeqc are
described in Appendixes A and B (assembled using RMarkdown), respectively.
!7
Figure 2. Quantity of elements for the three media analyzed with Phreeqc (Parkhurst & Appelo, 2013): COMBO, Elendt M4 and Elendt M7 (Samel et al., 1999).
µ

Daphnia magna clones
To address any intraspecific differences, all experiments were carried out with two clones of
Daphnia magna provided by Professor Dieter Ebert (University of Basel, Switzerland) and
collected between 2006 and 2017 in Morocco and Sweden. The clone from Sweden (which
will be referred as Pippi) came from a rock pool in Gräsö Island (N 60° 25’ 18.239’’ E 18°
30’ 36.539’’). This area is generally under freezing temperatures between December and
March and dries out during the summer, making Pippi a clone accommodated to mild
temperatures (A. Terrigeol 2018, personal communication). The coordinates for the
Moroccan clone (which will be referred as Aicha) are imprecise, but the location is
somewhere near Essaouira (N 31° 29’ 26.57’’ W 9° 45’ 51.948’’). The small ponds around
this location tend to dry during the summer as well, so Aicha might be a winter adapted
clone. Monthly average temperatures of both locations are collected in Table 1 for more
precise information. It should be addressed however, that we have no exact information on
the pond temperatures, and whether e.g., the Moroccan population is winter active or not.
!8
Figure 3. Titration of some Fe species along a gradient of CaCl2 for the three media analyzed and performed with Phreeqc (Parkhurst & Appelo, 2013): COMBO, Elendt M4 and Elendt M7 (Samel et al., 1999).
-1
-1µ
The stock cultures from both clones were kept at 20ºC in aerated ADaM medium
(Klüttgen et al., 1994) with saturating concentrations of the algae Chlamydomonas
reinhardtii (~2 mg C l-1). From these stock cultures, 10 neonates from each clone were
selected and followed individually in separated 100 ml jars until their third clutch, from
where newborns (< 24 h after hatching) were picked randomly and used as replicates for the
experiments. This process was repeated for both the pilot and the long-term experiment.
Newborns were then divided among the different treatments and placed in individual 100 ml
jars.
Pilot experiment
In order to find the threshold of Ca concentration at which Daphnia magna experienced
developmental issues and select three concentrations for our long-term experiment, a pilot
experiment was conducted.
Based on the results from media selection, we used Elendt M4 as medium for our
preliminary experiment. Elendt M4 was made as described by the OECD guideline (OECD,
2012) using glass-distilled water. Before usage, the medium was aerated through the use of
air pumps for at least 24 h. The concentrations of Ca used on this trial were (in mg Ca l-1):
0.5, 1, 2, 4, 8, 16 and 106 (Elendt M4 standard Ca concentration as control treatment). This
Ca gradient was created by CaCl2 additions to the medium, keeping the rest of elements
unchanged.
!9
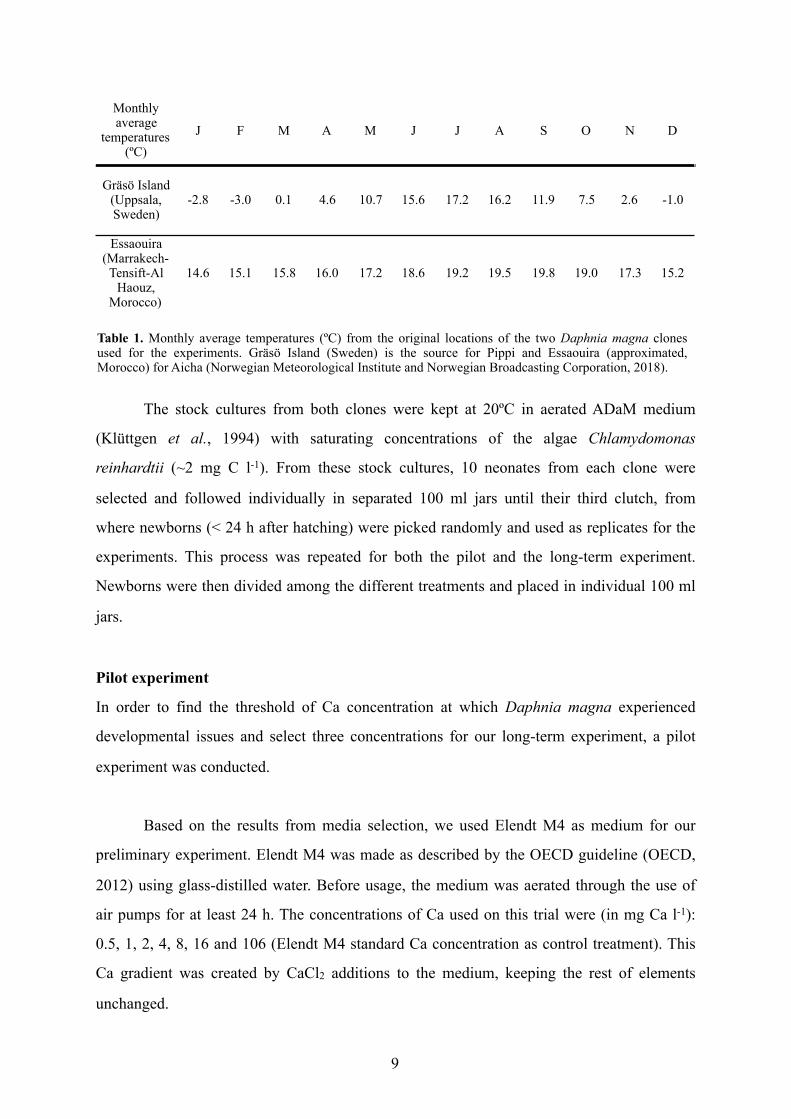
Table 1. Monthly average temperatures (ºC) from the original locations of the two Daphnia magna clones used for the experiments. Gräsö Island (Sweden) is the source for Pippi and Essaouira (approximated, Morocco) for Aicha (Norwegian Meteorological Institute and Norwegian Broadcasting Corporation, 2018).
Monthly average
temperatures (ºC)
J F M A M J J A S O N D
Gräsö Island (Uppsala, Sweden)
-2.8 -3.0 0.1 4.6 10.7 15.6 17.2 16.2 11.9 7.5 2.6 -1.0
Essaouira (Marrakech-Tensift-Al
Haouz, Morocco)
14.6 15.1 15.8 16.0 17.2 18.6 19.2 19.5 19.8 19.0 17.3 15.2

The pilot experiment lasted for 5 days (Monday to Friday), where individuals were
fed with green algae Chlamydomonas reinhardtii from live culture and medium was changed
every second day. Daphnia magna individuals were checked every day for survival,
moulting, presence of eggs and number of offspring, and filmed individually for further
growth analysis. Moults (empty exoskeletons) and offspring were removed from the jars after
each sampling.
Chlamydomonas reinhardtii (strain CC-1690 wild type mt+) was cultured in aerated
2-litre jars with WC medium (Guillard, 1975) at room temperature (≈ 19ºC) and with
continuous LED illumination (25-35 µE/m2/s). To avoid Ca contamination from WC medium
and standardize food quality, prior to feeding, the necessary amount of the algal culture was
removed from its original medium (WC) and resuspended in Elendt M4 medium without
CaCl2. The exact quantity of algal culture varied depending on algal concentration and
number of Daphnia replicates. The desired amount of C. reinhardtii was centrifuged in 50-ml
falcon tubes at 3500 rpm and 20ºC for 10 min (Eppendorf 5810R centrifuge; Eppendorf,
Hamburg, Germany). Supernatant was discarded and tubes were filled up to 50 ml with Ca-
free Elendt M4. Then, algal concentration was measured as optical density at 800 nm using a
Shimadzu UV-160A recording spectrophotometer (Shimadzu, Tokyo, Japan). A calibration
curve between optical density and biomass concentration (mg C ml-1) was then used to
calculate the precise volume of algal suspension needed to feed each individual (ml
Daphnia-1) to ensure a desired carbon ration of 0.2 mg C Daphnia-1.
Explanatory diagrams for both medium and algal culture aeration systems are
included in Appendix C.
Long-term experiment A long-term experiment that lasted for 88 days, thus encompassing the entire life cycle, was
conducted to test the effect of low Ca concentration on the performance of Daphnia magna.
The pilot study showed a decrease in mean growth under 4 mg Ca l-1, being this
concentration the first to achieve lengths > 1.4 mm. Number of moults and day at maturation
were similar for all treatments, and surprisingly number of offspring decreased above 16 mg
!10

Ca l-1. Based on these results, we used Elendt M4 medium and concentrations of 0.5, 4 and
106 (control Elendt M4) mg Ca l-1. The experiment was performed at 15ºC and 25ºC. The
15ºC treatments were kept, like the pilot experiment, in a climate room with stable
temperature, while the experiments at 25ºC were conducted in two identical small thermal
incubators (Sanyo cooled incubator MIR-153; Sanyo, Ora-Gun, Japan) inside two separated
20ºC climate rooms. The light regime and medium preparation were as described for the pilot
experiment.
The replicates from each clone were prepared and randomly selected from the stock
cultures (as for the pilot experiment) and placed individually in 100-ml jars with their
respective Ca concentrations and saturating concentrations of Chlamydomonas reinhardtii.
Consequently, we ended up with 10 replicates per Ca treatment, clone and temperature
(Figure 4).
It should also be noted that we added 10 more replicates for Pippi at 15ºC with 0.5 mg
Ca l-1 as a backup on day 3 of the experiment, as mortality in the previous 10 individuals was
already 60%. This rounded up the number of replicates to 130 individuals in total.
!11
Figure 4. Experiment design diagram showing the different treatments per temperature (15ºC, 25ºC) and Ca concentration in the medium (0.5, 4, 106 mg Ca l-1) for 10 individuals of each clone (Aicha, Pippi).

The experiment was conducted over 12 weeks and medium change and feeding was
scheduled every Monday, Wednesday and Friday. On Fridays the amount of food was
doubled. As explained for the pilot experiment, food was resuspended in Elendt M4 medium
without CaCl2 prior to feeding in order to avoid Ca contamination in the treatments. The
animals were checked every day for the first 4 weeks and three days a week for the remaining
8 weeks. On each sampling we gathered data on survival, moulting, presence of eggs and
number of offspring, along with 30-second films per individual for growth analysis based on
body size increment between sampling dates.
Growth measurements
In order to measure the somatic growth of our replicates, we recorded each individual every
sampling day for 30 seconds with a custom video setup (5MP NOIR Camera and Raspberry
pi 3 computer) developed by Jan Heuschele and Catharina Broch (Department of
Biosciences, University of Oslo). The animals were individually placed in transparent
cuvettes along with some of their medium. To reduce the stress of the individuals we used
cuvettes with 1.5 ml of volume while the animals were small and 2.5 ml ones when they grew
larger. In a custom size 3D printed structure, the cuvette was illuminated by two white LED
lights, ready to be filmed before returning the animal to its particular jar. All data was stored
in a hard drive and further analyzed with a specific Python-based program for size estimation
through image processing algorithms (Broch & Heuschele, unpublished).
Essentially, the program analyses every frame of the videos and measures body length
as a calibrated distance on a silhouette image of the animal. Every frame gets reduced to the
inner area of the cuvette and converted into grayscale to subtract the background from our
animal. Major and minor axes of an ellipse fitted to the outline of the animal are used as
estimates of body length and width. For this study we used length as a proxy for Daphnia
magna’s growth. The image analysis process is illustrated and summarised in Figure 5.
!12

A more extensive description of this method is provided in Appendix D (by courtesy
of Jan Heuschele). In addition, pictures from the image analysis are included in Appendix E.
Statistical analyses
Analyses were performed in R statistics (R Core Team, 2017) with standard and more
specific packages for different variables and graphical representation. All data was initially
investigated through exploratory and descriptive statistic analyses. Each variable was defined
as described in Table 2.
!13
Figure 5. Image processing analysis developed by Jan Heuschele and Catharina Broch. Every frame is extracted from a 30-second video of Daphnia magna in an individual cuvette and later cropped to its inner area. The cropped image is then transformed and sharpened into grayscale for background subtraction and modified to help the detection the animal’s contour. This contour is fitted by an ellipse that measures the length and width of Daphnia (image by courtesy of Jan Heuschele).
Table 2. Definitions for each measured variable: survival and maturity times, reproduction and moulting rates, body size and growth rate. Units used were: days for survival and maturity times; #eggs days-1 for reproduction rate; mm for body size; days-1 for growth rate; and #moults days-1 for moulting rate.
Variable Definition
Survival time Number of days an individual is observed alive
Reproduction rate Total number of offspring output divided by the individual’s survival time
Maturity time First day an individual presents visible eggs
Moulting rate Total number of moults shed divided by the individual’s survival time
Body size Length in mm measured by the image analysis program
Growth rate Exponential rates of body size change from birth to pre-maturation (2 days before maturity)
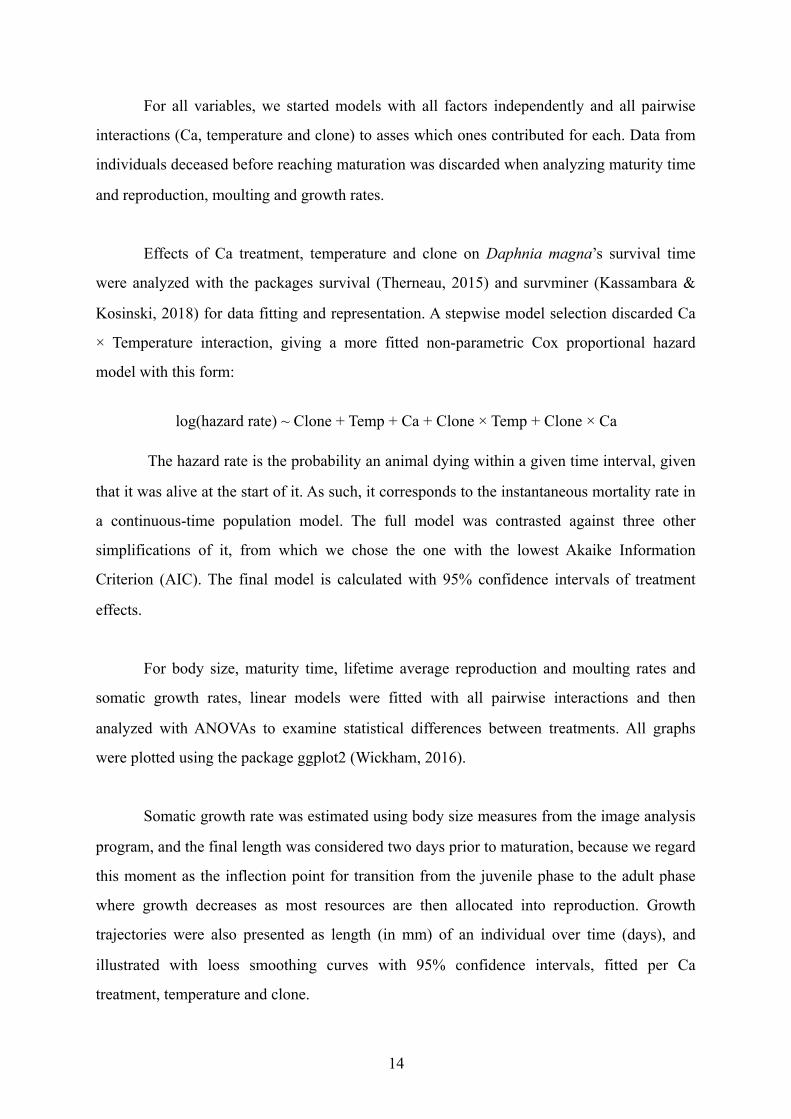
For all variables, we started models with all factors independently and all pairwise
interactions (Ca, temperature and clone) to asses which ones contributed for each. Data from
individuals deceased before reaching maturation was discarded when analyzing maturity time
and reproduction, moulting and growth rates.
Effects of Ca treatment, temperature and clone on Daphnia magna’s survival time
were analyzed with the packages survival (Therneau, 2015) and survminer (Kassambara &
Kosinski, 2018) for data fitting and representation. A stepwise model selection discarded Ca
× Temperature interaction, giving a more fitted non-parametric Cox proportional hazard
model with this form:
log(hazard rate) ~ Clone + Temp + Ca + Clone × Temp + Clone × Ca
The hazard rate is the probability an animal dying within a given time interval, given
that it was alive at the start of it. As such, it corresponds to the instantaneous mortality rate in
a continuous-time population model. The full model was contrasted against three other
simplifications of it, from which we chose the one with the lowest Akaike Information
Criterion (AIC). The final model is calculated with 95% confidence intervals of treatment
effects.
For body size, maturity time, lifetime average reproduction and moulting rates and
somatic growth rates, linear models were fitted with all pairwise interactions and then
analyzed with ANOVAs to examine statistical differences between treatments. All graphs
were plotted using the package ggplot2 (Wickham, 2016).
Somatic growth rate was estimated using body size measures from the image analysis
program, and the final length was considered two days prior to maturation, because we regard
this moment as the inflection point for transition from the juvenile phase to the adult phase
where growth decreases as most resources are then allocated into reproduction. Growth
trajectories were also presented as length (in mm) of an individual over time (days), and
illustrated with loess smoothing curves with 95% confidence intervals, fitted per Ca
treatment, temperature and clone.
!14

3. Results
Ca and Temperature effects
Low Ca concentration (0.5 Ca mg l-1) had a significant impact on survival time and growth in
Daphnia magna for both clones and temperatures. Significant differences related to Ca-
concentration and temperature, and to some extent also between clones, were detected on
most life cycle parameters. Ca explained most of the variance in survival time (45%) and
reproduction rate (52%), although temperature contributed significantly to survival (10%)
and age at maturity (47%) and moulting rate (65%) as well. In addition, significant Ca ×
temperature interactions were found for maturity time and moulting and growth rates (Table
3). Inter-clonal differences were observed for survival time, size, growth and reproduction
rates, being mainly higher for Aicha than Pippi (Figure 6, Table 4).
Survival
Survival time was lowest at 0.5 mg Ca l-1, peaking at 4 mg Ca l-1, and declining again at the
highest Ca concentration (standard Elendt M4: 106 mg Ca l-1), indicating strong detrimental
effects of low Ca for both temperatures and clones, and also a negative response to higher Ca
concentrations (Figure 6A-B). Survival was reduced by 63% for Aicha and 72% for Pippi at
0.5 mg Ca l-1 compared to 4 mg Ca l-1. The negative effect observed at 106 mg Ca l-1 was less
pronounced, being 22% for Aicha and 19% for Pippi reductions in survival rate compared
with 4 mg Ca l-1 (Figure 6A-D, Table 4).
Significant higher survival times were reached at 15ºC than 25ºC for Aicha for all
treatments, but no differences were observed for Pippi (Fig. 5A-B, Table 3). At 15ºC mean
survival time (± SD) was 34 (± 11.3) days for 0.5 mg Ca l-1, 85 (± 9.4) days for 4 mg Ca l-1,
and 63 (± 23.8) days for 106 mg Ca l-1. In contrast, at 25ºC mean survival time (± SD) was 13
(± 5.3) days for 0.5 mg Ca l-1, 43 (± 15.9) days for 4 mg Ca l-1, and 31 (± 14.5) days for 106
mg Ca l-1. A strong temperature × clone interaction was also found for survival, but no mixed
effects between Ca and temperature (Table 3).
!15

!16
-1
º
A B
C D
FE
G H
-1
JI
Figure 6. Survival time (A,B), reproduction (C,D) and growth (E,F) rates, maturity time (G,H) and moulting rate (I,J) for each Ca treatment (0.5, 4 and 106 mg Ca l-1), temperature (15 and 25ºC) and clone of Daphnia magna (Aicha and Pippi). The middle line in each box plot represents the median, the top and bottom edges of the plot show the first and third quartiles, error bars denote 95% of the sample, and individual points represent outliers. See Table 1 for the effects of Ca treatment, temperature, clone, and their interactions, and Table 2 for mean values, standard deviations and number of observations.

!17
Table 3. Results of the ANOVAs examining the effects of Ca treatment, temperature, and interclone differences on survival time, reproduction rate, body size, growth rate, maturity time and moulting rate of Daphnia magna. Units are: days for survival and maturity times; #eggs days-1 for reproduction rate; mm for body size; days-1 for growth rate; and #moults days-1 for moulting rate. Sample size was 3 × 2 × 2 × 10 (Ca treatments × temperatures × clones × replicate) = 120. The percentage of variance (PV) is calculated as (sum of squares of treatment/total sum of squares) × 100. Significant effects (95%) are in shown in bold.
Survival time Reproduction rate
Factor df F p PV df F p PV
Ca 2 78.055 < 2.200e-16 45.098 2 104.143 < 2.200e-16 52.327
Temp 1 36.043 2.390e-08 10.412 1 14.379 2.559e-04 7.121
Clone 1 8.780 0.004 2.537 1 30.735 2.414e-07 7.721
Ca x Temp 2 2.784 0.066 1.608 2 0.846 0.432 0.425
Ca x Clone 2 1.634 0.200 0.943 2 7.557 8.781e-04 3.797
Clone x Temp 1 23.391 4.21e-16 6.757 1 13.873 3.238e-04 3.485
Body size Growth rate
Factor df F p PV df F p PV
Ca 1 22.966 1.774e-06 1.132 1 1.138 0.289 0.527
Temp 1 16.844 4.226e-05 0.830 1 77.321 7.892e-14 35.831
Clone 1 30.415 3.954e-08 1.499 1 18.155 4.915e-05 8.413
Ca x Temp 1 3.179 0.075 0.156 1 4.464 0.037 2.069
Ca x Clone 1 0.185 0.668 0.009 1 0.183 0.700 0.084
Clone x Temp 1 9.241 0.002 0.456 1 22.534 7.550e-06 10.442
Maturity time Moulting rate
Factor df F p PV df F p PV
Ca 2 25.483 1.138e-09 10.457 2 13.415 6.903e-06 6.461
Temp 1 226.654 < 2.200e-16 46.502 1 267.810 < 2.200e-16 64.495
Clone 1 49.700 2.350e-10 10.197 1 1.127 0.291 0.271
Ca x Temp 2 22.997 6.071e-09 9.437 2 7.175 0.002 3.456
Ca x Clone 2 6.077 0.003 2.494 2 1.404 0.250 0.676
Clone x Temp 1 1.934 0.167 0.396 1 2.320 0.131 0.559
!18
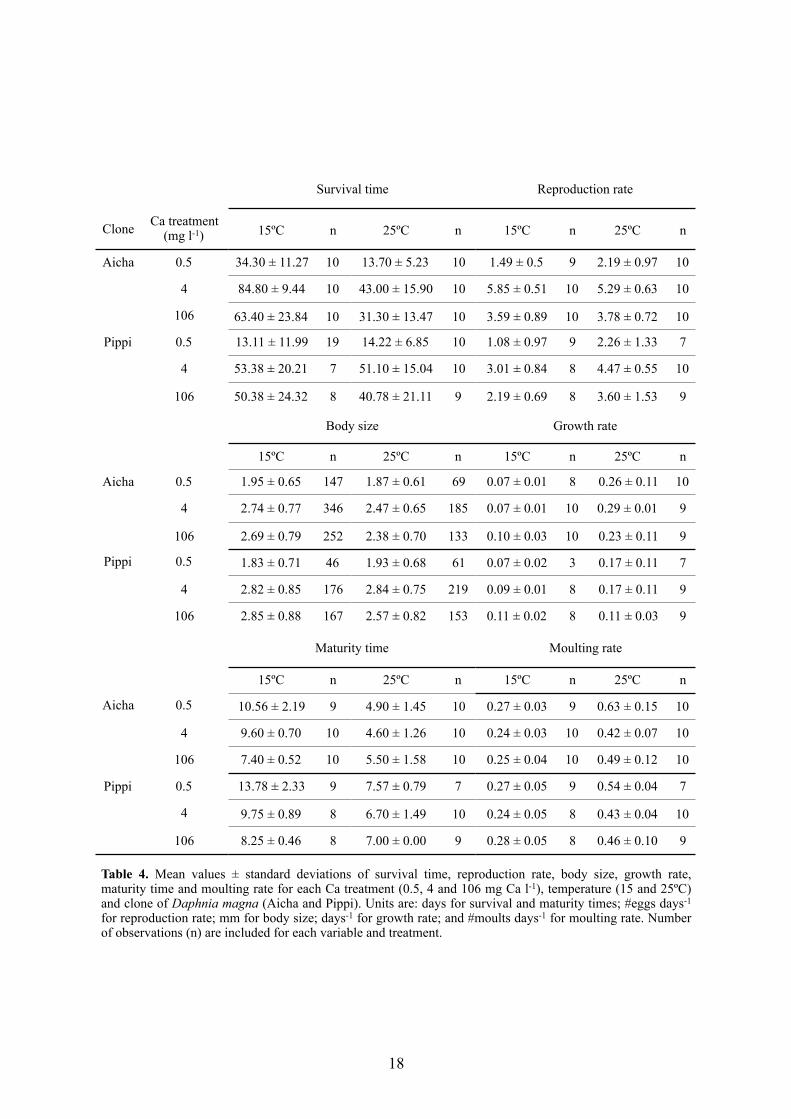
Table 4. Mean values ± standard deviations of survival time, reproduction rate, body size, growth rate, maturity time and moulting rate for each Ca treatment (0.5, 4 and 106 mg Ca l-1), temperature (15 and 25ºC) and clone of Daphnia magna (Aicha and Pippi). Units are: days for survival and maturity times; #eggs days-1 for reproduction rate; mm for body size; days-1 for growth rate; and #moults days-1 for moulting rate. Number of observations (n) are included for each variable and treatment.
Survival time Reproduction rate
Clone Ca treatment (mg l-1) 15ºC n 25ºC n 15ºC n 25ºC n
Aicha 0.5 34.30 ± 11.27 10 13.70 ± 5.23 10 1.49 ± 0.5 9 2.19 ± 0.97 10
4 84.80 ± 9.44 10 43.00 ± 15.90 10 5.85 ± 0.51 10 5.29 ± 0.63 10
106 63.40 ± 23.84 10 31.30 ± 13.47 10 3.59 ± 0.89 10 3.78 ± 0.72 10
Pippi 0.5 13.11 ± 11.99 19 14.22 ± 6.85 10 1.08 ± 0.97 9 2.26 ± 1.33 7
4 53.38 ± 20.21 7 51.10 ± 15.04 10 3.01 ± 0.84 8 4.47 ± 0.55 10
106 50.38 ± 24.32 8 40.78 ± 21.11 9 2.19 ± 0.69 8 3.60 ± 1.53 9
Body size Growth rate
15ºC n 25ºC n 15ºC n 25ºC n
Aicha 0.5 1.95 ± 0.65 147 1.87 ± 0.61 69 0.07 ± 0.01 8 0.26 ± 0.11 10
4 2.74 ± 0.77 346 2.47 ± 0.65 185 0.07 ± 0.01 10 0.29 ± 0.01 9
106 2.69 ± 0.79 252 2.38 ± 0.70 133 0.10 ± 0.03 10 0.23 ± 0.11 9
Pippi 0.5 1.83 ± 0.71 46 1.93 ± 0.68 61 0.07 ± 0.02 3 0.17 ± 0.11 7
4 2.82 ± 0.85 176 2.84 ± 0.75 219 0.09 ± 0.01 8 0.17 ± 0.11 9
106 2.85 ± 0.88 167 2.57 ± 0.82 153 0.11 ± 0.02 8 0.11 ± 0.03 9
Maturity time Moulting rate
15ºC n 25ºC n 15ºC n 25ºC n
Aicha 0.5 10.56 ± 2.19 9 4.90 ± 1.45 10 0.27 ± 0.03 9 0.63 ± 0.15 10
4 9.60 ± 0.70 10 4.60 ± 1.26 10 0.24 ± 0.03 10 0.42 ± 0.07 10
106 7.40 ± 0.52 10 5.50 ± 1.58 10 0.25 ± 0.04 10 0.49 ± 0.12 10
Pippi 0.5 13.78 ± 2.33 9 7.57 ± 0.79 7 0.27 ± 0.05 9 0.54 ± 0.04 7
4 9.75 ± 0.89 8 6.70 ± 1.49 10 0.24 ± 0.05 8 0.43 ± 0.04 10
106 8.25 ± 0.46 8 7.00 ± 0.00 9 0.28 ± 0.05 8 0.46 ± 0.10 9

A Cox regression model was fitted using initially all pairwise interactions and chosen
after backward selection using Ca treatment, temperature and clone as explanatory variables
(Figure 7). For the different Cox regression models tested, “Model 4” with lowest AIC value
(769.51; Table 5) was accounted for being the best fitted. Coefficients and associated
significances of the model are given in Table 6. Consistently with previous results, and
according to Hazard ratios, mortality probabilities were 30 and 3 times higher for 0.5 and
106, vs. 4 mg Ca l-1; 11 times higher for 25 vs. 15ºC, and 6 times higher for Pippi vs. Aicha,
respectively (Table 6).
!19
Figure 7. Survival curves for each Ca treatment (0.5, 4 and 106 mg Ca l-1), temperature (15 and 25ºC) and clone of Daphnia magna (Aicha and Pippi). Shaded error bands represent 95% confidence intervals around the fitted models (solid lines). See Tables 5 and 6 for results of the analyses using Cox regression models.

Moulting, maturity and reproduction
Moulting rate had a similar pattern between clones (p = 0.291), but was significantly different
for both Ca treatments (p < 0.001) and temperatures (p < 0.001). In general, moulting rate
was faster at 25ºC and 0.5 mg Ca l-1 (Figure 6 I-J, Table 3). In addition, a significant
interaction Ca × temperature was found for this rate (Table 3).
Maturity time (see definition in Table 2) happened faster for Aicha and treatments at
25ºC, showing an interaction between temperature and clone variables (Figure 6 G-H, Table
3). Significant differences were found for all variables individually, Ca × clone interaction,
and also a strong impact of the interaction Ca × temperature (p < 0.001, Table 3).
The accumulated number of offspring was significantly different for all Ca
concentrations, temperatures and clones. Reproduction rate showed differences between all
treatments (Figure 6 C-D). In a similar pattern as previous mentioned variables, 0.5 mg Ca l-1
treatments had the lowest reproductive rate, which increased at 4 mg Ca l-1 and decreased
again at 106 mg Ca l-1. Significant differences were explained by all three factors (Ca,
temperature and clone), and also by effects of Ca × clone and clone × temperature
interactions (Table 3). In general, reproductive rate was highest for Aicha and 25ºC, with the
exception of treatment 4 mg Ca l-1 for Aicha at 15ºC which reached the highest reproduction
rate for all the experiment. Pippi on the other hand, had somewhat lower reproductive rates,
!20
Table 5. Akaike Information Criterion (AIC) values of the Cox regression models tested for survival time.
Table 6. Results of the Cox regression analyses for the effects of Ca treatment, temperature and clone on survival time for the tested model Model 4. Units are days for time; mg Ca l-1 for Ca treatment; ºC for temperature; and days-1 for survival rates. Regression model was: survival rate = Ca treatment + temperature + clone + Ca treatment × clone + temperature × clone. Significant coefficients are shown in bold.
Model df AIC
1 6 798.658
2 4 794.701
3 9 773.511
4 7 769.512
Factor Coefficients Hazard ratio z p
0.5 mg Ca l-1 3.35 ± 0.45 028.63 7.39 1.50e-13
106 mg Ca l-1 1.10 ± 0.39 003.02 2.86 4.20e-03
25 ºC 2.48 ± 0.35 011.88 7.12 1.00e-12
Pippi 1.88 ± 0.48 006.52 3.93 8.50e-05
0.5 mg Ca l-1 × Pippi -0.08 ± 0.50 001.08 0.15 0.88
106 mg Ca l-1 × Pippi -0.95 ± 0.53 000.39 -1.80 0.07
25 ºC × Pippi -2.07 ± 0.42 000.13 -4.91 9.20e-07

which increased with temperature (Figure 6 C-D). Once again, we got a peak for both clones
and temperatures at 4 mg Ca l-1 with a strong decline for reproductive rates at 0.5 mg Ca l-1
but also reduced reproduction at 106 mg Ca l-1. Reproduction rate was reduced by 69% for
Aicha and 71% for Pippi at 0.5 mg Ca l-1 compared to 4 mg Ca l-1. Correspondingly, the
observed decrease in reproductive rate at 106 mg Ca l-1 relative to 4 mg Ca l-1 was 32% for
Aicha and a 22% for Pippi (Figure 6 C-D, Table 4).
Growth
The growth data from the video setup showed different curves for every Ca concentration,
temperature and clone (Figure 8), giving lower final body sizes for all four 0.5 mg Ca l-1
treatments (Table 4, Figure 9). The filming method resulted less accurate for larger sizes of
Daphnia magna, giving an increase of spread points with time. Most curves reached a stable
size plateau after 15 days. All four curves for 0.5 mg Ca l-1 treatments are shorter due to
mortality of all individuals, which also happened for the rest of treatments at 25ºC after 75
days. Significant differences in size were found for all single variables (p < 0.001) and also
the temperature × clone interaction (Table 3).
!21
Figure 8. Growth curves for each Ca treatment (0.5, 4 and 106 mg Ca l-1), temperature (15 and 25ºC) and clone of Daphnia magna (Aicha and Pippi). See Figure 9 and Table 3 for statistical results for the effects of Ca treatment, temperature and clone on body size and growth rate.

As hinted by the maturity results, temperature had an important impact on the growth
rates (p < 0.001), increasing at 25ºC for both clones (Figure 6 E-F). Clone was a significant
variable as well (including clone × temperature interaction) and although Ca did not qualified
as a significant variable in this case, the interaction Ca × temperature did (Table 3). In a more
subtle way the peak at 4 mg Ca l-1 trend can also be seen for growth rates (Figure 6 E-F).
The final length per treatment (Figure 9) presents significantly smaller sizes for both
temperatures and clones at 0.5 mg Ca l-1 (Table 3). Individual maximum body size by the end
of the experiment also reflected faithfully the bell pattern, with highest values at the
intermediate Ca treatment and lower values at extremes for both temperatures and clones
(Figure 9, Table 4).
!22
Figure 9. Frequency histogram of individual body size for each Ca treatment (0.5, 4 and 106 mg Ca l-1), temperature (15 and 25ºC) and clone of Daphnia magna (Aicha and Pippi). Solid line represents mean frequency per individual size.
Freq
uenc
y

4. Discussion
The objective of this master thesis was to test if low Ca concentrations had an impact in the
life of cladoceran Daphnia magna and if Ca-limitation interacted with temperature responses.
Our data supports the first hypothesis, proving that very low concentrations of Ca in the
medium have a strong effect on survival, growth and reproduction of Daphnia magna.
Furthermore, we found an interaction between Ca and temperature for age at maturity and
moulting and growth rates, leading us to also support the second hypothesis of this project.
When adjusting levels of Ca in a medium, a suite of other changes take place that may
confound with the Ca effects. It is thus imperative to make a controlled medium with stable
pH, and that only differs with respect to the Ca concentrations or any other chemical property
one aims to test for. A first and important part of this master project was to choose the most
appropriate medium changing Ca concentrations without disrupting the equilibrium of other
elements or affecting the pH. The results obtained with Phreeqc (Parkhurst & Appelo, 2013)
on RStudio (RStudio, 2017) were very accurate and easily replicable so that this program and
script can be used for a broad range of other projects and experimental assays which require a
special attention to media composition. For instance, the accuracy of Phreeqc in predicting
values was measured by comparing the experimental pH of standard Elendt M4 medium (106
mg Ca l-1), which was stable between 8.1-8.2, with the predicted value by Phreeqc (pH =
8.1).
Our results showed Ca limitation as crucial not only for Daphnia magna’s survival,
but also for their life expectancy. Even if some individuals survived several weeks under Ca
deficiency, the lifespan was severely reduced. Since only three levels of Ca were tested (0.5,
4 and 106 mg l-1, a priori representing strongly limiting, sufficient and very high levels), the
responses can not really provide an actual “threshold” for Ca limitation. The experiments by
Hessen and Alstad (2000) found a threshold for survival in Daphnia magna under 0.1 mg Ca
l-1, where individuals had a median life expectancy of only 4 days, and also suggested a
gradual increase in performance up to approximately 5 mg Ca l-1. Our findings support these
!23
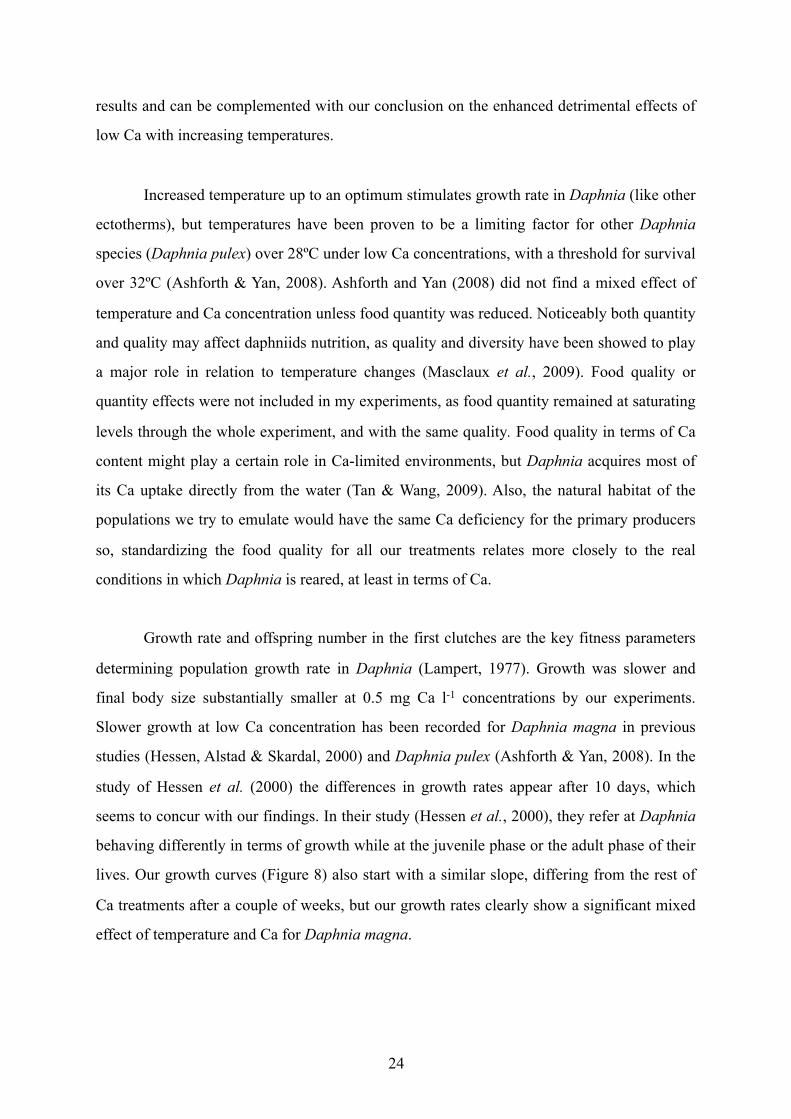
results and can be complemented with our conclusion on the enhanced detrimental effects of
low Ca with increasing temperatures.
Increased temperature up to an optimum stimulates growth rate in Daphnia (like other
ectotherms), but temperatures have been proven to be a limiting factor for other Daphnia
species (Daphnia pulex) over 28ºC under low Ca concentrations, with a threshold for survival
over 32ºC (Ashforth & Yan, 2008). Ashforth and Yan (2008) did not find a mixed effect of
temperature and Ca concentration unless food quantity was reduced. Noticeably both quantity
and quality may affect daphniids nutrition, as quality and diversity have been showed to play
a major role in relation to temperature changes (Masclaux et al., 2009). Food quality or
quantity effects were not included in my experiments, as food quantity remained at saturating
levels through the whole experiment, and with the same quality. Food quality in terms of Ca
content might play a certain role in Ca-limited environments, but Daphnia acquires most of
its Ca uptake directly from the water (Tan & Wang, 2009). Also, the natural habitat of the
populations we try to emulate would have the same Ca deficiency for the primary producers
so, standardizing the food quality for all our treatments relates more closely to the real
conditions in which Daphnia is reared, at least in terms of Ca.
Growth rate and offspring number in the first clutches are the key fitness parameters
determining population growth rate in Daphnia (Lampert, 1977). Growth was slower and
final body size substantially smaller at 0.5 mg Ca l-1 concentrations by our experiments.
Slower growth at low Ca concentration has been recorded for Daphnia magna in previous
studies (Hessen, Alstad & Skardal, 2000) and Daphnia pulex (Ashforth & Yan, 2008). In the
study of Hessen et al. (2000) the differences in growth rates appear after 10 days, which
seems to concur with our findings. In their study (Hessen et al., 2000), they refer at Daphnia
behaving differently in terms of growth while at the juvenile phase or the adult phase of their
lives. Our growth curves (Figure 8) also start with a similar slope, differing from the rest of
Ca treatments after a couple of weeks, but our growth rates clearly show a significant mixed
effect of temperature and Ca for Daphnia magna.
!24

During its juvenile stage, Daphnia is more vulnerable to Ca-limited environments
(Hessen et al., 2000). In this phase, young Daphnias allocate most of their resources into
growing, which implies the active uptake of Ca from the medium. Once Daphnia has grown
into a full adult size, its ability to cope with less Ca in the medium increases (Tan & Wang,
2009), as it slowly reaches its growth plateau. In this phase, the animal allocates less energy
and elements into growth to prioritize reproduction. This also explains why final length and
weight also decreases at low Ca concentrations (Hessen et al., 2000). Adult daphniids have
shown lower weight-specific influx rates of Ca than juveniles reared in the same Ca treatment
(Tan & Wang, 2009), probably due to an allocation of energy from growth into reproduction.
Our Daphnia magna replicates yielded higher growth rates and smaller final sizes
with increased temperature, which would follow the predictions from the Temperature-Size
rule. This “rule” states that ectotherms grow faster but attain small final body size at higher
temperatures, and has been reported by several studies on daphniids (Chopelet, Blier &
Dufresne, 2008; Van Doorslaer et al., 2010; Jalal et al., 2013) and other ectotherms (Forster
et al., 2011, Hessen et al., 2013). It is worth discussing that not all aquatic ectotherms seem
to follow the TSR, and that potentially also oxygen limitation at higher temperatures might
derive in faster metabolism processes or even growth inhibition (Green, 1956; Atkinson,
1995). However, the aquatic isopod Asellus aquaticus presented an inverse TSR while reared
in well-oxygenated medium (Hoefnagel & Verberk, 2015). As explained in the methods for
this project, all our media was properly aerated with air pumps for at least 24 hours prior to
their use and changed regularly, which might have avoided oxygen complications and
therefore giving explanatory TSR data for Daphnia magna. Forster et al. (2011) also pointed
out that TSR effects are mostly shown in the juvenile phase and get accumulated through
generations.
In our experiment Daphnia magna matured significantly faster at higher temperatures
for all Ca concentrations. Ca and temperature were both found significant variables
individually and also interacting with each other, determining major differences in maturation
time. Literature states age at maturity as a size dependent trait for daphniids (Ebert, 1992;
McKee & Ebert, 1996), which would explain why Ca deprived Daphnia would allocate more
!25

time and resources into growth, becoming large before starting to reproduce. Although, these
resources are highly limited in low Ca conditions, deriving in an even slower maturation.
Temperature effects on age at maturation were also described similarly in Daphnia pulex
(Ashforth & Yan, 2008), which relate it to higher energetic costs of survival at higher
temperatures.
Reproduction was severely reduced for the lowest Ca concentrations. Both number of
total offspring and reproductive rate were much smaller for the 0.5 mg Ca l-1 treatments at
both temperatures. Ashforth and Yan (2008) reported corresponding results for Daphnia
pulex, which produced less and smaller clutches under low Ca. It can be argued that this
mechanism together with maturity retardation allows Daphnia to reproduce under stressful
conditions even if delivering a lower brood quality, but it also reduces the chances of survival
for the mother and its offspring (Stearns, 1992; Lampert, 1993). On one side, X-ray analyses
from ephippias have demonstrated than most of the Ca is located in the eggshell instead of
the embryos, in form of crystalline Ca phosphate (Kawasaki et al., 2004). The resting eggs of
Daphnia magna show an insignificant amount of Ca being transferred through maternal
effects (Kawasaki et al., 2004). On the other side, a recent study shows other Daphnia
species acquiring higher Ca concentrations from their mothers (Akbar, 2017). Thus ephippia
and parthenogenetic eggs might have different compositions for different species, since our
experiments were performed only on offspring originated by asexual reproduction, maternal
effects should be accounted. Our previous generations of Daphnia magna were reared in
AdAM medium (Klüttgen et al., 1994) at 20ºC, which has a high Ca concentration, so it
would be interesting to culture several generations under different treatments to assess if they
can inherit Ca resources from their mothers and if growth steadily decreases through
generations at 0.5 mg Ca l-1. Another possibility is that Daphnia is able to reabsorb resources
from the eggs, reducing the clutch sizes but improving their survival chances (McCauley,
Murdoch & Nisbet, 1990; Ebert, 1991). Other studies concur with the hypothesis from
Kawasaki et al. (2004), indicating a low maternal effect in terms of Ca concentration as
offspring from Daphnia magna is born with very low specific Ca content and a partially
developed carapace (Tan & Wang, 2009). In the light of these results, further research on Ca
and maternal effects are required to provide more specific information.
!26

Daphnia magna constructs its carapace mainly with Ca coming from the medium via
active uptake (Tan & Wang, 2009, 2010), which leads to an inner Ca decrease for individuals
born in a low Ca environment (Alstad et al., 1999). This exoskeleton will define how every
individual faces environmental stressors like pH or salinity, as well as predation. Ca not only
has to enter the animal’s body, but also has to be retained, which for Daphnia magna
becomes a challenge due to its high demand but also high efflux and short retention time (Tan
& Wang, 2009). The efflux of Ca back into the medium can involve a loss of 60-85% of the
Ca (Tan & Wang, 2009), making the whole process very energy demanding at low Ca
concentrations.
Another problem daphniids encounter is the loss of up to 40% of their Ca on one
single moult than can increase to 90% at temperatures over 18ºC, as Ca efflux associated to
moulting becomes higher (Tan & Wang, 2009; Porcella et al., 1969). Moulting rate, as other
metabolic processes, increases with temperature (Ashforth & Yan, 2008; Tan & Wang, 2009).
This was shown in our results, with increased differences and rates at the lowest Ca
concentration. The reason for this more dramatic effect can be due to the higher energy
requirements Daphnia encounters in a Ca-limited environment (Hessen et al., 2000; Ashforth
& Yan, 2008). In our experiment, moulting rate was significantly affected by temperature and
Ca, showing a clear interaction between these two variables. We could assume then, as
moulting (in close connection to growth) is the main life-history trait for juveniles, that both
stressors combined promoted the high mortality and short lifespan in our 0.5 mg Ca l-1
treatments. In contrast with our Ca-affected result, the literature argues that moulting is a
fixed trait in Daphnia (Hessen et al., 2000; Lynch, 1989; Porcella et al., 1969), however not
excluding, since individuals can shed their exoskeletons even if the carapace calcification
process is not fully finished (Alstad et al., 1999; Tan & Wang, 2009). Specific Ca content in
Daphnia magna also decreased with age and size (Porcella et al., 1969; Alstad et al., 1999),
which would indicate a higher impact of reduced carapace quality (thinner and containing
less Ca) at juvenile phases, explaining our high mortality results in the first days.
A diminished calcification process in the carapace would signify a thinner
exoskeleton, leading to a higher risk of predation by other invertebrates (Lampert, 2006;
!27

Jeziorski et al., 2015). Large size of Daphnia magna makes it vulnerable in environments
with high predation pressure (Jeziorski & Yan, 2006). As a consequence, its appearance is
mainly restricted to habitats with low predation risk like rock pools (Hessen et al., 2000;
Jeziorski & Yan, 2006). Several studies reveal daphniids to be the most Ca-demanding taxa
relative to other cladocerans and copepods (Vijverberg, 1980; Hessen et al., 2000; Jeziorski
& Yan, 2006; Tan & Wang, 2010; Wærvågen et al., 2002). Therefore, Ca limitation might
cause an interspecific allometry effect, as smaller species require less Ca, and thus benefit
under low Ca (Tessier & Horwitz, 1990). However, Daphnia pulex, a somewhat smaller
species, was found to contain and allocate more Ca in the upper layers of the carapace
(Jeziorski et al., 2008b). This could make Daphnia pulex equally susceptible to Ca-limitation,
as they might get prevented from building neck-spines for protection against invertebrate
predators (Ashforth & Yan, 2008; Riessen et al., 2012).
We also observed significant clone differences for all variables except moulting rate,
which we have previously discussed as being quite a fixed trait mostly affected by
temperature and as presented here, Ca. Different responses between Daphnia clones have
been observed in the past (Carvalho, 1987; Glazier & Calow, 1992) and attributed to latitude
differences (Mitchell & Lampert, 2000). Our data shows a strong interaction between
temperature and clone variables, which might indicate a more complex relationship where
Daphnia magna displays a wide phenotypic plasticity to maximize fitness under different
environmental conditions. Both clones avoided drought in the summer through diapause and
also under freezing winter temperatures for the Swedish clone (Pippi). The Moroccan clone
(Aicha) displayed a higher growth rate and smaller final size, while Pippi presented a slower
growth for all treatments but a significantly larger length at the end of the experiment. The
larger size might make reference to a lack of large predators in the Swedish habitat, being
opposite for Aicha, which tends to grow faster as a strategy to improve fitness in Morocco.
There is however not sufficient background data from these sites to verify this hypothesis.
Our results indicate that Ca-limited environments represent a threat to Daphnia
magna. Most daphniids with larger size and high Ca requirements (Daphnia magna, Daphnia
pulex) will become outcompeted by less Ca-demanding Daphnia species and other groups of
!28

cladocerans (Hessen et al., 1995; Hessen et al., 2000; Jeziorski & Yan, 2006; Tan & Wang,
2010). These deep changes in the ecological communities will transform the aquatic food
web where Daphnia is a key secondary producer and one of the most abundant freshwater
zooplankton in the planet (Ashforth & Yan, 2008). The loss of their ecological function could
generate bottom-up effects on higher levels of the food chain such as invertebrate predators
and small fish (Ashforth & Yan, 2008).
Adding to an already low Ca concentration in a vast number of northern localities, a
pronounced Ca decline has been registered for a large amount of water bodies all over
Scandinavia, Europe and Canada (Jeziorski et al., 2008a; Hessen et al., 2017). The decline is
so steep, that Daphnia magna is currently found only in hard water rock pools in
Scandinavia, making it a rare species in Norway. In 2000, Hessen et al. reported that more
than 50% of lakes in Norway were under concentrations of 1 mg Ca l-1, and only 17 years
later, an extensive study discovered that 95% of Norwegian lakes had less than 5 mg Ca l-1
(Hessen et al., 2017). This numbers extrapolate to other areas like Canada, where 35% of the
lakes have Ca concentrations below 1.5 mg Ca l-1 (Jeziorski et al., 2008a), the specific Ca
threshold found for Daphnia pulex by Ashforth and Yan in 2008.
Both regions also share an acidification history and are currently on a recovery period
from intense anthropic misuse of the soil (Jeziorski et al., 2008a; Hessen et al., 2017). During
the acidification period, cations stored in soils were depleted at high rates and not recovered
due to the nature of the bedrock underneath (Jeziorski et al., 2008a). Reduced acidification
due to a successful combat of “acid rain” have thus lead to the somewhat paradoxical
situation of low-Ca stress. A strong increase in standing forest (that sequester Ca) and
precipitation (causing dilution), may further diminish the flux and concentration of Ca to
surface (Hessen et al., 2017). Since different species have different susceptibility to low Ca,
this will likely cause community changes. Some studies also point to an increasing
“jellification” (replacement of Daphnia by Ca-poor species like Holopendium glacialis) in
boreal lakes (Jeziorski et al., 2008a; Hessen et al., 2017), facilitated by a decrease in Ca
concentrations and a higher predation pressure induced by species like Chaoroborus sp.
(native) and Bythotrephes longimanus (invasive) (Jeziorski et al., 2015).
!29

As a remedy to combat both acidification and low Ca, liming of watersheds is
commonly used. Also there are systems that naturally have a very high Ca content (e.g > 100
mg Ca l-1). While one a priori could expect a flat response level above saturated Ca, there
could also be negative impacts related to osmotic regulation or ionic unbalance. There are
indications that such “too much of a good thing” effects may occur even if strong mechanistic
understanding of the phenomenon is lacking. In 2001, Plath and Boersma observed an
unimodal response in somatic growth of Daphnia magna dependent on the concentration of P
in their food. This response of consumer performance with lower values at both extremes of
the resource quality gradient was also reported for the snail Mexithauma quadripaludium, and
called “knife-edge” by Elser et al. (2005). Later on, empirical evidence of this response was
provided for multiples species and ontogenetic stages across resource quality gradients of P
and N (Boersman & Elser, 2006; Bullejos et al., 2014). For Ca, the results on this project
clearly hinted at such a “knife-edge” effect, yet the accurate threshold or maximum Ca
remains to be settled. However, it must be mentioned, that standard concentrations of Elendt
M4 (106 Ca l-1; OECD, 2012) yielded negative responses for most variables, which suggests
it might not be the optimal medium for Daphnia magna. Clearly this negative impact of high
Ca warrants further studies with a wider range of Ca concentrations, both to verify this trend,
and also to reveal if this really represents a “knife-edge” effect. The reason for a negative
impact of Ca remains speculative, but could be related to somatic regulation or other
physiological responses.
Under the current reality of climate change, an important detrimental factor like Ca
limitation for Daphnia can get enhanced as temperature rises in boreal regions. We did not
analyze specific Ca content here, but generally low Ca reduces carapace toughness and thus
increases the susceptibility to invertebrate predators (Hessen et al., 2000). In boreal areas,
reduced Ca is often accompanied by increased levels of dissolved organic carbon (Finstad et
al., 2016), also called browning, that can add another stressor to this equation, as low food
concentrations and diversity have already been shown to impact negatively in Daphnia’s
survival and growth (Hessen et al., 2000; Ashforth & Yan, 2008).
!30

ConclusionAs Ca follows a declining trend in most soft-water habitats, many key secondary producers
such as Daphnia magna face a strong limitation on survival, growth and reproduction. This
project clarifies 0.5 mg Ca l-1 as a poor environment with drastic consequences on most of the
tested life-history traits. Furthermore, the interaction between Ca and temperature found for
most of the variables indicates an additive effect of Ca limitation with temperature, which
might accelerate detrimental responses with global warming.
We may well conclude that temperature-size responses in Daphnia magna become
greatly affected under Ca-limited conditions. On one side, due to harmful effects of low Ca in
the cladoceran’s performance, and on the other side, because of the interactive effects
between Ca and temperature, which would signify a double threat to Ca-demanding
zooplankton in soft-water ecosystems.
It stands to reason that further research on these newly found mixed effects is greatly
required to preserve vulnerable soft-water habitats and improve our understanding on Ca
related interactions. Additionally, intriguing suggestions of Ca providing a “knife-edge”
effect must be tested in future studies with higher Ca concentrations.
!31

!32

References Aguilar-Alberola, J. A., & Mesquita-Joanes, F. (2014). Breaking the temperature-size rule:
Thermal effects on growth, development and fecundity of a crustacean from temporary
waters. Journal of Thermal Biology, 42, 15-24.
Aherne, J., Dillon, P. J., & Cosby, B. J. (2003). Acidification and recovery of aquatic
ecosystems in south central Ontario, Canada: regional application of the MAGIC model.
Hydrology and Earth System Sciences Discussions, 7(4), 561-573.
Akbar, S., Du, J., Jia, Y., & Tian, X. (2017). The importance of calcium in improving
resistance of Daphnia to Microcystis. PloS one, 12(4), e0175881.
Alstad, N., Skardal, L., & Hessen, D.O. (1999). The effect of calcium concentration on the
calcification of Daphnia magna. Limnology Oceanography, 44, 2011-2017.
Andersen, T., and Hessen, D. O. (1989). Carbon, nitrogen, and phosphorus content of
freshwater zooplankton. Limnology and Oceanography 36, 807–814.
Angilletta Jr, M. J., Steury, T. D., & Sears, M. W. (2004). Temperature, growth rate, and body
size in ectotherms: fitting pieces of a life-history puzzle. Integrative and comparative
biology, 44(6), 498-509.
Antczak, P., White, T. A., Giri, A., Michelangeli, F., Viant, M. R., Cronin, M. T. D., Vulpe, C.
& Falciani, F. (2015). Systems biology approach reveals a calcium-dependent mechanism for
basal toxicity in Daphnia magna. Environmental science & technology, 49(18), 11132-11140.
Arendt, J. (2007). Ecological correlates of body size in relation to cell size and cell number:
patterns in flies, fish, fruits and foliage. Biological Reviews, 82(2), 241-256.
!33

Ashforth D. & Yan, N. (2008). The interactive effects of calcium concentration and
temperature on the survival and reproduction of Daphnia pulex at high and low food
concentrations. Limnology Oceanography, 53, 420-432.
Atkinson, D. (1994). Temperature and organism size-A biological law for ectotherms?.
Advances in Ecological Research, 25, 1–58.
Atkinson, D. (1995). Effects of temperature on the size of aquatic ectotherms: exceptions to
the general rule. Journal of Thermal Biology, 20, 61–74.
Atkinson, D., Morley, S. A., & Hughes, R. N. (2006). From cells to colonies: at what levels
of body organization does the ‘temperature-size rule’ apply?. Evolution & development, 8(2),
202-214.
Bergmann, C. (1848). Über die Verhältnisse der Wärmeökonomie der Thiere zu ihrer Grösse.
Göttingen, Germany: Vandenhoeck und Ruprecht.
Betini, G. S., Roszell, J., Heyland, A., & Fryxell, J. M. (2016). Calcium interacts with
temperature to influence Daphnia movement rates. Royal Society Open Science, 3, 160537.
Boeing, W. J., Ramcharan, C. W., & Riessen, H. P. (2006). Multiple predator defence
strategies in Daphnia pulex and their relation to native habitat. Journal of Plankton Research,
28, 571–584.
Boersma, M., & Elser, J. J. (2006). Too much of a good thing: on stoichiometrically balanced
diets and maximal growth. Ecology, 87(5), 1325-1330.
Bullejos, F. J., Carrillo, P., Gorokhova, E., Medina-Sánchez, J. M., Balseiro, E. G., & Villar-
Argaiz, M. (2014). Shifts in food quality for herbivorous consumer growth: multiple golden
means in the life history. Ecology, 95(5), 1272-1284.
!34

Cairns, A., & Yan, N. (2009). A review of the influence of low ambient calcium
concentrations on freshwater daphniids, gammarids, and crayfish. Environmental Reviews,
17, 67-79.
Carvalho, G. R. (1987). The clonal ecology of Daphnia magna (Crustacea: Cladocera): II.
Thermal differentiation among seasonal clones. In: Journal of Animal Ecology, 56(2), 469–
478.
Celis-Salgado M. P., Cairns, A., Kim, N., & Yan, N. D. (2008). The FLAMES medium: a
new, soft- water culture and bioassay medium for Cladocera. Internationale Vereinigung fur
Theoretische und Angewandte Limnologie Verhandlungen, 30, 265-271.
Chopelet, J., Blier, P. U., & Dufresne, F. (2008). “Plasticity of growth rate and metabolism in
Daphnia magna populations from different thermal habitats”. Journal of Experimental
Zoology, 309(9), 553–562.
Chlamydomonas Resource Center, The University of Minnesota (2015). CC-1690 wild type
mt+ [Sager 21 gr]. Retrieved 4. June 2015, from http://chlamycollection.org/strain/cc-1690-
wild-type-mt-sager-21-gr/.
Clifford, M., & McGeer, J. C. (2009). Development of a biotic ligand model for the acute
toxicity of zinc to Daphnia pulex in soft waters. Aquatic Toxicology, 91, 26–32.
Clifford, M., & McGeer, J. C. (2010). Development of a biotic ligand model to predict the
acute toxicity of cadmium to Daphnia pulex. Aquatic Toxicology, 98, 1–7.
Cowgill, U. M., Emmel, H. W., Hopkins, D. L., Applegath, S. L., & Takahashi, I. T. (1986).
The influence of water on reproductive success and chemical composition of laboratory
reared populations of Daphnia magna. Water Research, 20, 317–323.
!35

Cressler, C. E., Bengtson, S., & Nelson, W. A. (2017). Unexpected nongenetic individual
heterogeneity and trait covariance in Daphnia and its consequences for ecological and
evolutionary dynamics. The American Naturalist, 190, 13–27.
Daufresne, M., Lengfellner, K., & Sommer, U. (2009). Global warming benefits the small in
aquatic ecosystems. Proceedings of the National Academy of Sciences, 106(31),
12788-12793.
De Schamphelaere, K. A. C. & Janssen, C. R. (2002). A biotic ligand model predicting acute
copper toxicity for Daphnia magna: the effects of calcium, magnesium, sodium, potassium,
and pH. Environmental Science & Technology, 36, 48-54.
Ebert, D. (1991). The effect of size at birth , maturation threshold and genetic differences on
the life-history of Daphnia magna. Oecologia, 86(2), 243–250.
Ebert, D. (1992). A food-independent maturation threshold and size at maturity in Daphnia
magna. Limnology and Oceanography, 37, 878-881.
Ebert, D. (2008). Host–parasite coevolution: insights from the Daphnia–parasite model
system. Current opinion in microbiology, 11(3), 290-301.
Elendt, B. P., & Bias, W. R. (1990). Trace nutrient deficiency in Daphnia magna cultured in
standard medium for toxicity testing. Effects of the optimization of culture conditions on life
history parameters of D. magna. Water Research, 24(9), 1157–1167.
Elser, J. J., Schampel, J. H., Kyle, M., Watts, J., Carson, E. W., Dowling, T. E., Tang, C., &
Roopnarine, P. D. (2005). Response of grazing snails to phosphorus enrichment of modern
stromatolitic microbial communities. Freshwater Biology, 50(11), 1826-1835.
Finstad, A. G., Andersen, T., Larsen, S., Tominaga, K., Blumentrath, S., De Wit, H. A.,
Tømmervik, H. & Hessen, D. O. (2016). From greening to browning: Catchment vegetation
!36

development and reduced S-deposition promote organic carbon load on decadal time scales in
Nordic lakes. Scientific reports, 6, 31944.
Forster, J., Hirst, A. G., & Woodward, G. (2011). Growth and development rates have
different thermal responses. The American Naturalist, 178(5), 668–678.
Frost, P. C., Xenopoulos, M. A., & Larson, J. H. (2004). The stoichiometry of dissolved
organic carbon, nitrogen, and phosphorus release by a planktonic grazer, Daphnia. Limnology
and Oceanography, 49(5), 1802-1808.
Geist, V. (1987). Bergmann's rule is invalid. Canadian Journal of Zoology, 65(4), 1035-1038.
Giardini, J.-L., Yan, N. D., & Heyland, A. (2015). Consequences of calcium decline on the
embryogenesis and life history of Daphnia magna. Journal of Experimental Biology, 218,
2005–2014.
Glazier, D. S., & Calow, P. (1992). Energy allocation rules in Daphnia magna: clonal and age
differences in the effects of food limitation. Oecologia 90(4), 540–549.
Green, J. (1956). Growth, size and reproduction in Daphnia (Crustacea: Cladocera).
Proceedings of the Zoological Society of London, 126, 173–204.
He, H. & Wang, W.-X. (2009). Calcium balance in Daphnia grown on diets differing in food
quantity, phosphorus and calcium. Freshwater Biology, 54, 2200-2211.
Hessen, D. O. (1990). Carbon, nitrogen and phosphorus status in Daphnia at varying food
conditions. Journal of Plankton Research, 12(6), 1239-1249.
Hessen, D. O., Faafeng, B. A., & Andersen, T. (1995). Competition or niche segregation
between Holopedium and Daphnia; empirical light on abiotic key parameters. In Cladocera
as Model Organisms in Biology, 253-261. Springer, Netherlands.
!37

Hessen, D. O., & Alstad Rukke, N. (2000). The costs of moulting in Daphnia; mineral
regulation of carbon budgets. Freshwater Biology, 45(2), 169-178.
Hessen, D. O., Alstad, N. E., & Skardal, L. (2000). Calcium limitation in Daphnia magna.
Journal of Plankton Research, 22(3), 553-568.
Hessen, D. O., & Persson, J. (2009). Genome size as a determinant of growth and life-history
traits in crustaceans. Biological journal of the Linnean Society, 98(2), 393-399.
Hessen, D. O., Daufresne, M., & Leinaas, H. P. (2013). Temperature-size relations from the
cellular-genomic perspective. Biological Reviews, 88(2), 476-489.
Hessen, D. O., Andersen, T., Tominaga, K., & Finstad, A. G. (2017). When soft waters
becomes softer; drivers of critically low levels of Ca in Norwegian lakes. Limnology and
Oceanography, 62(1), 289-298.
Hoefnagel, K. N., & Verberk, W. C. (2015). Is the temperature-size rule mediated by oxygen
in aquatic ectotherms?. Journal of Thermal Biology, 54, 56-65.
IPCC (2018). Global warming of 1.5°C. An IPCC Special Report on the impacts of global
warming of 1.5°C above pre-industrial levels and related global greenhouse gas emission
pathways, in the context of strengthening the global response to the threat of climate change,
sustainable development, and efforts to eradicate poverty [V. Masson-Delmotte, P. Zhai, H.
O. Pörtner, D. Roberts, J. Skea, P.R. Shukla, A. Pirani, W. Moufouma-Okia, C. Péan, R.
Pidcock, S. Connors, J. B. R. Matthews, Y. Chen, X. Zhou, M. I. Gomis, E. Lonnoy, T.
Maycock, M. Tignor, T. Waterfield (eds.)]. In Press.
Jalal, M., Wojewodzic, M. W. , Laane, C. M. M., & Hessen, D. O. (2013). Larger Daphnia at
lower temperature: a role for cell size and genome configuration?. Genome 56, 511–519.
!38

Jalal, M., Andersen, T., & Hessen, D. O. (2015). Temperature and developmental responses
of body and cell size in Drosophila; effects of polyploidy and genome configuration. Journal
of thermal biology, 51, 1-14.
Jeziorski, A., & Yan, N. (2006). Species identity and aqueous calcium concentrations as
determinants. Canadian Journal of Fisheries and Aquatic Sciences, 63,1007.
Jeziorski, A., Yan, N. D., Paterson, A. M., DeSellas, A. M., Turner, M. A., Jeffries, D. S.,
Keller, B., Weeber, R. C., McNicol, D. K., Palmer, M. E., McIver, K., Arseneau, K., Ginn, B.
K., Cumming, B. F., & Smol, J. P. (2008a). The widespread threat of calcium decline in fresh
waters. Science, 322, 1374–1377.
Jeziorski, A., Paterson, A. M., Yan, N. D., & Smol, J. P. (2008b). Calcium levels in Daphnia
ephippia cannot provide a useful paleolimnological indicator of historical lakewater Ca
concentrations. Journal of Paleolimnology, 39(3), 421-425.
Jeziorski, A., Paterson, A. M., & Smol, J. P. (2012). Crustacean zooplankton sedimentary
remains from calcium-poor lakes: complex responses to threshold concentrations. Aquatic
Science, 74, 121-131.
Jeziorski, A., Tanentzap, A. J., Yan, N. D., Paterson, A. M., Palmer, M. E., Korosi, J. B.,
Rusak, J. A., Arts, M. T., Keller, W., Ingram, R., Cairns, A., & Smol, J. P. (2015). The
jellification of north temperate lakes. Proceedings of the Royal Society of London B:
Biological Sciences, 282(1798), 20142449.
Jiang, X., Zhang, L., Liang, H., Qingmei, L., Zhao, Y., Chen, L., Yang, W., & Zhao, S.
(2013). Resistance variation within a Daphnia pulex population against toxic cyanobacteria.
Journal of Plankton Research, 35, 1177–1181.
Kassambara, A., & Kosinski, M. (2016). survminer: Drawing Survival Curves using
‘ggplot2’. R Package version 0.2.4. https://CRAN.R-project.org/package=survminer
!39

Kawasaki, T., Sakata, M., & Namiki, H. (2004). Elemental characterization of Daphnia
resting eggs by X-ray analytical microscopy. Zoological science, 21(10), 1019-1023.
Kelly, S. A., Panhuis, T. M., & Stoehr, A. M. (2012). Phenotypic plasticity: molecular
mechanisms and adaptive significance. Comprehensive Physiology, 2(2), 1417-39.
Kilham, S. S., Kreeger, D. A., Lynn, S. G., Goulden, C. E., & Herrera, L. (1998). COMBO: a
defined freshwater culture medium for algae and zooplankton. Hydrobiologia, 377, 147-159.
Klüttgen, B., Dülmer, U., Engels, M., & Ratte, H. (1994). “ADaM, an artificial freshwater for
the culture of zooplankton”. Water Research 28(3), 743–746.
Kozlova, T., Wood, C. M., & McGeer, J. C. (2009). The effect of water chemistry on the
acute toxicity of nickel to the cladoceran Daphnia pulex and the development of a biotic
ligand model. Aquatic Toxicology, 91, 221-228.
Lampert, W. (1977). Studies on the carbon balance of Daphnia pulex de Geer as related to
environmental conditions. IV. Determination of the "threshold" concentration as a factor
controlling the abundance of zooplankton species. Archiv für Hydrobiologie, 48, 361-368.
Lampert, W. (1993). Phenotypic plasticity of the size at first reproduction in Daphnia: the
importance of maternal size. Ecology, 74(5), 1455-1466.
Likens, A. G. E., Driscoll, C. T., & Buso, D. C. (1996). Long-term effects of acid rain:
Response and recovery of a forest ecosystem. Science, 272, 244–246.
Lynch, M. (1989). The life history consequences of resource depression in Daphnia pulex.
Ecology, 70(1), 246-256.
!40

Masclaux, H., Bec, A., Kainz, M., Desvilettes, C., Jouve, L., & Bourdier, G. (2009).
Combined effects of food quality and temperature on somatic growth and reproduction of two
freshwater cladocerans. Limnology and Oceanography, 54(4), 1323–1332.
McCauley, E., Murdoch, W. W. & Nisbet, R. M. (1990). Growth, Reproduction, and
Mortality of Daphnia pulex Leydig: Life at low Food. Functional Ecology, 4, 505-514.
McKee, D. & Ebert, D. E (1996). The interactive effects of temperature, food level and
maternal phenotype on offspring size in Daphnia magna. Oecologia, 107(2), 189– 196.
Merilä, J., & Hendry, A. P. (2014). Climate change, adaptation, and phenotypic plasticity: the
problem and the evidence. Evolutionary applications, 7(1), 1-14.
Mitchell, S. E., & Lampert, W. (2000). Temperature adaptation in a geographically
widespread zooplankter, Daphnia magna. Journal of Evolutionary Biology, 13(3), 371-382.
Mousseau, T. A. (1997). Ectotherms follow the converse to Bergmann's rule. Evolution,
51(2), 630-632.
Norwegian Meteorological Institute and Norwegian Broadcasting Corporation (2007-2018).
Yr. Retrieved from https://www.yr.no
O’Reilly, C. M., Rowley, R. J., Schneider, P., Hampton, S., Read, J., & Rowley, R. (2015).
Rapid and highly variable warming of lake surface waters around the globe. Geo-physical
Research Letters 42, 10 ,773–10, 781.
OECD, Organisation for Economic Cooperation and Development (2012). Test No. 211:
Daphnia magna Reproduction Test, OECD Guidelines for the Testing of Chemicals, Section
2: Effects on Biotic Systems. OECD Publishing.
!41

Olijnyk, A. M., & Nelson, W. A. (2013). Positive phenotypic correlations among life-history
traits remain in the absence of differential resource ingestion. Functional Ecology 27, 165–
172.
Parkhurst, D. L., & Appelo, C. A. J., (2013). Description of input and examples for
PHREEQC version 3--A computer program for speciation, batch- reaction, one-dimensional
transport, and inverse geochemical calculations: U.S. Geological Survey Techniques and
Methods, 6, A43, 497. Available at http://pubs.usgs.gov/tm/06/a43.
Plath, K. & Boersma, M. (2001) Mineral limitation of zooplankton: stoichiometric constraints
and optimal foraging. Ecology, 82, 1260–1269.
Porcella, D. B., Rixford, C. E., & Slater, J. V. (1969). Moulting and calcification in Daphnia
magna. University of Chicago Press, 42, 148–159.
R Core Team (2017). R: A language and environment for statistical computing. R Foundation
for Statistical Computing, Vienna, Austria. http://www.R-project.org/
Riessen, H. P., Linley, R. D., Altshuler, I., Rabus, M., Söllradl, T., Clausen-Schaumann, H.,
Laforsch, C., & Yan, N. D. (2012). Changes in water chemistry can disable plankton prey
defenses. Proceedings of the National Academy of Sciences of the United States of America
109, 15377–15382.
Rukke, N.A. (2002). Effects of low calcium concentrations on two common freshwater
crustaceans, Gammarus lacustris and Astacus astacus. Functional Ecology, 16: 357-366.
Samel, A., Ziegenfuss, M., Goulden, C. E., Banks, S., & Baer, K. N. (1999). Culturing and
Bioassay Testing of Daphnia magna Using Elendt M4, Elendt M7, and COMBO Media.
Ecotoxicology and environmental safety, 43(1), 103-110.
!42
Skjelkvåle, B. L., Wright, R. F., & Henriksen, A. (1998). Norwegian lakes show widespread
recovery from acidification; results from national surveys of lakewater chemistry 1986-1997.
Hydrology and Earth System Sciences Discussions, 2(4), 555-562.
Stearns, S. (1992). The evolution of life histories. Oxford University Press, p. 264.
Tan, Q. G., & Wang, W. X. (2009). The regulation of calcium in Daphnia magna reared in
different calcium environments. Limnology Oceanography 54, 746-756.
Tan, Q. G., & Wang, W. X. (2010). Interspecies differences in calcium content and
requirement in four freshwater cladocerans explained by biokinetic parameters. Limnology
Oceanography, 55, 1426-1434.
Tessier, A. J., & Horwitz, R. J. (1990). Influence of Water Chemistry on Size Structure of
Zooplankton Assemblages. Canadian Journal of Fisheries and Aquatic Sciences, 47, 1937-
1943.
Therneau, T. (2015). A Package for Survival Analysis in S. version 2.38, https://CRAN.R-
project.org/package=survival.
Van Doorslaer, W., Stoks, R., Swillen, I., Feuchtmayr, H., Atkinson, D., Moss, B., & De
Meester, L. (2010). Experimental thermal microevolution in community-embedded Daphnia
populations. Climate Research 43(2), 81–89.
Van Voorhies, W. A. (1996). Bergmann size clines: a simple explanation for their occurrence
in ectotherms. Evolution 50, 1259–1264.
Vijverberg, J. (1980). Effect of temperature in laboratory studies on development and growth
of Cladocera and Copepoda from Tjenkemeer, The Netherlands. Freshwater Biology 10(4),
317–340.
!43

Wærvågen S. B., Rukke, N. A., & Hessen, D. O. (2002). Calcium content of crustacean
zooplankton and its potential role in species distribution. Freshwater Biology, 47, 1866-
1878.
Wheatly, M.G. (1999). Calcium homeostasis in Crustacea: The evolving role of brachial,
renal, digestive, and hypodermal epithelia. Journal of Experimental Zoology 283, 620–640.
Wheatly, M. G., Zanotto, F. P., Hubbard, M. G. (2002). Calcium homeostasis in crustaceans:
subcellular Ca dynamics. Comparative Biochemistry and Physiology Part B, 132, 163-178.
Whitman, D. W. & Agrawal, A. A. (2009). What is phenotypic plasticity and why is it
important?. Phenotypic Plasticity of Insects 1–63. CRC Press.
Wickham, H. (2016) ggplot2: Elegant Graphics for Data Analysis. Springer-Verlag New
York, USA.
Woodward, G., Perkins, D. M., & Brown, L.E. (2010). Climate change and freshwater
ecosystems: impacts across multiple levels of organization. Philosophical Transactions:
Biological Sciences 365, 2093–2106.
Yom-Tov, Y. (2001). Global warming and body mass decline in Israeli passerine birds.
Proceedings of the Royal Society of London B: Biological Sciences, 268(1470), 947-952.
Zeigler, S. (2013). Predicting responses to climate change requires all life-history stages.
Journal of animal ecology, 82(1), 3-5.
!44

!45

Appendixes
!46

!47

Table of appendixes
A. Comparison of media composition 50 ...................................................................................................................
B. Medium selection: Phreeqc 51 ...............................................................................................................................
C. Schematic diagrams for aeration systems 62 .........................................................................................................
D. Video-based size estimation of Daphnia sp. 63 .....................................................................................................
E. Images from video analysis 65..............................................................................................................................
!48

!49

Appendix A A. Comparison of media composition
Chemical constituent (mg/l) COMBO Elendt M4 Elendt M7
Major elements
CaCl2 2H2O 36.76 293.8 293.8MgSO4 7H2O 36.97 123.3 123.3K2HPO4 1.742 0.0184 0.1840KH2PO4 — 0.0143 0.1430NaNO3 17 0.0274 0.2740NaHCO3 12.6 64.8 64.8Na2SiO3 9H2O 28.42 1 10
Trace elements
H3BO3 24 2.86 0.7150KCl 5.96 5.8 5.8LiCl 0.31 0.31 0.0770RbCl 0.07 0.0710 0.0180SrCl2 6H2O 0.15 0.15 0.0380KI 0.0033 0.0033 0.0033Na2EDTA 2H2O 4.36 2.5 0.6250FeCl3 6H2O 1 — —MnCl2 4H2O 0.18 0.3610 0.09CuSO4 5H2O 0.0010 — —ZnSO4 7H2O 0.0220 — —CoCl2 6H2O 0.0100 0.01 0.01NaMoO4 2H2O 0.0220 0.0630 0.0160H2SeO3 0.0016 — —Na3VO4 0.0018 — —NaBr 0.0160 0.0160 0.0040CuCl2 2H2O — 0.0165 0.0042ZnCl2 — 0.0130 0.0130Na2SeO3 — 0.0022 0.0022NH4VO3 — 0.0006 0.0006FeSO4 7H2O — 0.9960 0.2490
VitaminsB12 (cyanocobalamin) 0.00055 0.0010 0.0010Biotin(d-Biotin) 0.0005 0.0008 0.0008Thiamine (HCl) 0.1 0.0750 0.0750
!50
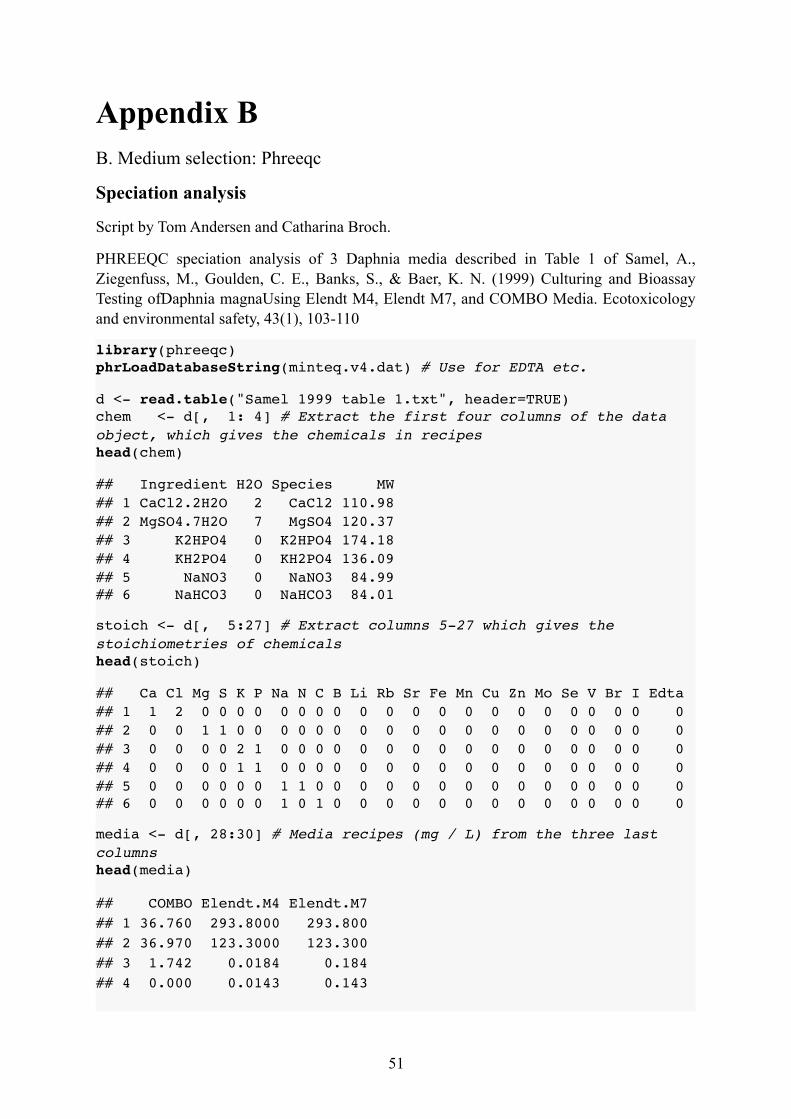
Appendix B B. Medium selection: Phreeqc
Speciation analysis
Script by Tom Andersen and Catharina Broch.
PHREEQC speciation analysis of 3 Daphnia media described in Table 1 of Samel, A., Ziegenfuss, M., Goulden, C. E., Banks, S., & Baer, K. N. (1999) Culturing and Bioassay Testing ofDaphnia magnaUsing Elendt M4, Elendt M7, and COMBO Media. Ecotoxicology and environmental safety, 43(1), 103-110
library(phreeqc) phrLoadDatabaseString(minteq.v4.dat) # Use for EDTA etc.
d <- read.table("Samel 1999 table 1.txt", header=TRUE) chem <- d[, 1: 4] # Extract the first four columns of the data object, which gives the chemicals in recipeshead(chem)
## Ingredient H2O Species MW ## 1 CaCl2.2H2O 2 CaCl2 110.98 ## 2 MgSO4.7H2O 7 MgSO4 120.37 ## 3 K2HPO4 0 K2HPO4 174.18 ## 4 KH2PO4 0 KH2PO4 136.09 ## 5 NaNO3 0 NaNO3 84.99 ## 6 NaHCO3 0 NaHCO3 84.01
stoich <- d[, 5:27] # Extract columns 5-27 which gives the stoichiometries of chemicals head(stoich)
## Ca Cl Mg S K P Na N C B Li Rb Sr Fe Mn Cu Zn Mo Se V Br I Edta## 1 1 2 0 0 0 0 0 0 0 0 0 0 0 0 0 0 0 0 0 0 0 0 0## 2 0 0 1 1 0 0 0 0 0 0 0 0 0 0 0 0 0 0 0 0 0 0 0## 3 0 0 0 0 2 1 0 0 0 0 0 0 0 0 0 0 0 0 0 0 0 0 0## 4 0 0 0 0 1 1 0 0 0 0 0 0 0 0 0 0 0 0 0 0 0 0 0## 5 0 0 0 0 0 0 1 1 0 0 0 0 0 0 0 0 0 0 0 0 0 0 0## 6 0 0 0 0 0 0 1 0 1 0 0 0 0 0 0 0 0 0 0 0 0 0 0
media <- d[, 28:30] # Media recipes (mg / L) from the three last columns head(media)
## COMBO Elendt.M4 Elendt.M7 ## 1 36.760 293.8000 293.800 ## 2 36.970 123.3000 123.300 ## 3 1.742 0.0184 0.184 ## 4 0.000 0.0143 0.143
!51

## 5 17.000 0.0274 0.274 ## 6 12.600 64.8000 64.800
MW.H2O <- with(chem, MW + 18.01528 * H2O) # Calculates the mass contribution of H20 molecules (18.01528 g/mol) to the molecular (MW) weight of the ingredient.# e.g. CaCl2.2H20 contains two H20 molecules and the formula thus adds 2*18.01528 = 36.03056 to the total molecular weight of the ingredient: 110.98+36.03056 = 147.0106. MW.H2O
## [1] 147.0106 246.4770 174.1800 136.0900 84.9900 84.0100 284.1975 ## [8] 61.8300 74.5500 42.3900 120.9200 266.6217 270.2917 278.0170 ## [15] 197.9011 249.6864 170.4806 287.5570 136.3000 237.9317 218.9606 ## [22] 128.9700 172.9400 183.9100 116.9800 102.8900 166.0000 372.2306 ## [29] 1355.3700 244.3100 337.2700
media.uM <- as.matrix(1000 * sweep(media, 1, MW.H2O, "/")) # Convert all concentrations from mg/L to ??mol/l using the molecular weight (g/mol) media.uM
elem.comp <- t(as.matrix(stoich)) %*% media.uM # Here the columns giving the stoichiometries of the chemicals are used together with the molar quantities of the chemicals to calculate the quantity of elements elem.comp
Comparison of quantity of elements
dotchart(log10(t(elem.comp)), labels="", xlab="log10(Final concentration (uM))", pch=19, col = c("#820B8A","#5FBB97","#0C7C59"), main = "Quantity of elements") legend("bottomright", colnames(elem.comp), pch=19, col = c("#820B8A","#5FBB97","#0C7C59"), bg="white")
!52

Chemical speciation modelling with PHREEQC
library(phreeqc) phrLoadDatabaseString(minteq.v4.dat)
This code chunk generates three R.files (COMBO.phreeqc.R, Elendt.M4.phreeqc.R, Elendt.M7.phreeqc.R) that next are used as sources for the PHREEQC speciation modelling. The modelling result is stored in the object speciation.
speciation <- NULL for (i in 1:3) { s0 <- "input <- '" s1 <- paste("SOLUTION", i, colnames(elem.comp)[i]) s2 <- "units umol/L" s3 <- paste(rownames(elem.comp), elem.comp[, i], "\n") s4 <- "EQUILIBRIUM PHASES \n CO2(g) -3.5" s5 <- " SELECTED_OUTPUT -file sel.out -reaction true -molalities HCO3- H2CO3 H2BO3- H3BO3 Ca+2 Ca(Edta)-2 Fe(Edta)- Fe(OH)2+ Fe(OH)3 '" R.script <- paste0(colnames(elem.comp)[i], ".phreeqc.R") cat(s0, "\n", s1, "\n", s2, "\n", s3, "\n", s4, "\n", s5, "\n",
!53

file=R.script) # Run PHREEQC speciation on medium source(R.script) phrRunString(input) output <- as.data.frame(phrGetSelectedOutput()) speciation <- rbind(speciation, output[-1, ]) }
Under the ‘SELECTED_OUTPUT’ header (above), one can specify the chemical species one wants the analysis to return. In the script here, 9 chemical species are listed (HCO3-, H2CO3, H2BO3-, H3BO3, Ca+2, Ca(Edta)-2, Fe(Edta)-, Fe(OH)2+, Fe(OH)3), and these are therefore the 9 components that there are stored values of in the speciation object.
speciation
Rename the rows so that it denotes the correct medium type:
rownames(speciation) <- colnames(elem.comp)
speciation
The pH in the three mediums:
speciation$n1.pH
## [1] 7.360370 8.055015 8.056970
!54
Speciation results

Ca titration analysis
library(phreeqc) phrLoadDatabaseString(minteq.v4.dat) # Use for EDTA etc.
Elendt M7
Step 1: Generate script
To create a titration analysis in PHREEQC the generated input file has to be modified from the code in Phreeqc Speciation Analysis Media. The procedure is as follows.
The script Phreeqc Speciation Analysis Media produced another script named “Elendt.M7.phreeqc.R” which was used as the input file for the PHREEQC speciation analysis.
There are four edits we need to do in order to tell PHREEQC we want to run a titration analysis:
1. Add the three lines REACTION / CaCl2 / 0.002 moles in 200 steps beneath EQUILIBRIUM PHASES. This will tell PHREEQC to do a titration from 0 to 0.002 mol Ca /liter, in 200 steps.
2. Add -totals Ca Cl after -reaction true beneath SELECTED_OUTPUT.
3. Delete the line specifying the quantity of (Ca 1998.49589036325), and adjust the Cl concentrations accordingly (step 4).
4. Since we removed 1998.5 moles of Ca, we would simultaneously remove 2*1998.5 = 3996.992 mol Cl (the ingredient we use is CaCl2), which leaves 4078.275918889 - 3996.992 = 81.28414 mol Cl. We thus change the Cl concentration to 81.28414.
To do this, make first a copy of the original input file, rename it (e.g. “Elendt.M7.phreeqc.R”) and then make the edits in this file.
Step 2: Speciation analysis
Next, one simply send this modified script to PHREEQC and save the results in an object called speciation.
source("Ca.titration.Elendt.M7.phreeqc.R") phrRunString(input) speciation.1 <- as.data.frame(phrGetSelectedOutput())[-1, ]
summary(speciation.1) # summary of the results
!55

pH summary(speciation.1$n1.pH)
## Min. 1st Qu. Median Mean 3rd Qu. Max. ## 8.052 8.059 8.067 8.068 8.076 8.086
Step 3: View results
Prepare data for plotting.
species.1.Ca <- species.1[, 1:15] #head(species.1.Ca) colnames(species.1.Ca) <- c("H+", "Ca+2", "CaSO4", "CaHCO3+", "CaCO3", "Ca(Edta)-2", "CaHPO4", "CaPO4-", "CaH2BO3+", "CaOH+", "CaNO3+", "CaH2PO4+", "CaH(Edta)-", "CaNH3+2", "Ca(NH3)2+2") species.1.Fe <- species.1[, c(1,16:49)] #head(species.1.Fe) colnames(species.1.Fe) <- c("H+", "Fe(Edta)-2", "Fe+2", "FeOH(Edta)-3", "FeSO4", "FeOH+", "FeHCO3+", "FeHPO4", "Fe(OH)2(Edta)-4", "FeH2PO4+", "Fe(OH)2", "Fe(OH)3-", "FeH(Edta)-", "Fe(HS)2", "Fe(HS)3-", "FeOH(Edta)-2", "Fe(Edta)-", "Fe(OH)3", "Fe(OH)2+", "Fe(OH)4-", "Fe(OH)2(Edta)-3", "FeOH+2", "FeH(Edta)", "FeHPO4+", "FeSO4+", "Fe+3", "FeCl+2", "Fe(SO4)2-", "FeH2PO4+2", "FeCl2+", "FeNO3+2", "Fe2(OH)2+4", "FeCl3", "Fe3(OH)4+5", "FeHSeO3+2") species.1.Mg <- species.1[, c(1,50:60)] #head(species.1.Mg) colnames(species.1.Mg) <- c("H+", "Mg+2", "MgSO4", "MgHCO3+", "MgCO3", "MgHPO4", "MgOH+", "MgH2BO3+", "Mg(Edta)-2", "MgH2PO4+", "MgPO4-", "MgH(Edta)-") species.1.N <- species.1[, c(1, 61:66, 11, 14)] #head(species.1.N) colnames(species.1.N) <- c("H+", "NH4+", "NH3", "NH4SO4-", "NO2-", "NO3-", "SrNO3+", "CaNO3+", “CaNH3+2")
species.1.P <- species.1[, c(1,67:75,7,8,12,22,38,43,24,54,58,59)] # and oxygen #head(species.1.P) colnames(species.1.P) <- c("H+", "O2", "HPO4-2", "H2PO4-", "NaHPO4-", "KHPO4-", "PO4-3", "SrHPO4", "H3PO4", "SrH2PO4+", "CaHPO4", "CaPO4-", "CaH2PO4+", "FeHPO4", "FeHPO4+", "FeH2PO4+2", "FeH2PO4+", "MgHPO4", "MgH2PO4+", "MgPO4-")
phreeq_plot <- function(species.group, medium, ylimits){
!56

matplot(reactant.1, species.group, type="l", lty=1, col=heat.colors(ncol(species.group)), lwd=2, xlim=c(0, 2.6), ylim=ylimits, xlab="CaCl2 added (mmol/L)", ylab="Concentration (log10(??mol/L))", main=medium) text(rep(2, ncol(species.group)), species.group[nrow(species.group), ], colnames(species.group), col=heat.colors(ncol(species.group)), pos=4) abline(v=c(1, 5, 10, 20, 40, 80) / 40, lty=2, col="gray") }
Elendt M4
All four steps are equal to Elendt M7, since M4 contains the same amounts of CaCl2.
Speciation analysis source("Ca.titration.Elendt.M4.phreeqc.R") phrRunString(input) speciation.2 <- as.data.frame(phrGetSelectedOutput())[-1, ] summary(speciation.2) # summary of the results
pH summary(speciation.2$n1.pH)
## Min. 1st Qu. Median Mean 3rd Qu. Max. ## 8.050 8.057 8.065 8.066 8.074 8.084
COMBOStep 1 - 3 are equal to Elendt M7, but for step 4 the Cl concentration needs to be calculated anew since the quantity of CaCl2 in COMBO is different from Elendt.
The Ca concentration in COMBO is 250.050064430746, and by removing this we simultaneously remove 2*250.05 = 500.1 mol Cl, which leaves 602.065872858822 - 500.1 = 101.9657 mol Cl. We thus change the Cl concentration to 101.9657.
Speciation analysis source("Ca.titration.COMBO.phreeqc.R") phrRunString(input) speciation.3 <- as.data.frame(phrGetSelectedOutput())[-1, ] summary(speciation.3) # summary of the results
!57

pH summary(speciation.3$n1.pH)
## Min. 1st Qu. Median Mean 3rd Qu. Max. ## 7.332 7.339 7.347 7.348 7.357 7.370
Media comparison
Ca species
!58

Fe species
!59

!60
Mg species
N species

P species + O2
!61
P species + O2

Appendix C C. Schematic diagrams for aeration systems
Media aeration systems:
Chlamydomonas reinhardtii live culture with aeration system:
!62

Appendix D (by Jan Heuschele) D. Video-based size estimation of Daphnia sp.
The measuring setup
We designed and 3d-printed a filming setup to record short movies of the organisms. The
measuring chamber accommodates standard cuvettes with outer dimensions of 1.2 x 1.2 x 4.5
centimetres. Two top-mounted white LEDs are channelled through two frosted Plexiglas
cuboids and illuminate the chamber from two sides. We used a sideward facing infrared-
capable camera (Raspberry Pi NOIR with C mount and a 6 mm adjustable-focus lens) to film
the organisms in the cuvette.
Video analysis and size estimation
We filmed each animal for 30 seconds. We used a python script based on OpenCV (open
computer vision) for object detection and measurement.
Figure 1 illustrates the basic procedure to find and measure the particles in the movies. Each
frame is cropped to cover only the inner area of the cuvette. To correct for the slight barrel
distortion of our lens system, we transformed each frame using a camera matrix based (cv2-
function: getOptimalNewCameraMatrix), which was extracted using checkerboard images
(cv2- findChessboardCorners()), to correct the images (undistort(), see calibX.py for details
about the matrix finding procedure). The script then converts the resulting image to
grayscale, and the overall sharpness of the image is determined using cv2.Laplacian().
We then subtract the background using a K-nearest neighbours-based Background/
Foreground segmentation algorithm (cv2: createBackgroundSubtractorKNN (history=600,
detectShadows=False)). The resulting frame is eroded to remove specks due to noise and
small particles in the water and then dilated (cv2.dilate) to enlarge the remaining particles. All
particles are then detected using the contour finding algorithm and sorted by increasing
contour area. By fitting an ellipse to the biggest object in each frame of the video sequence,
we can extract a length and width measurement of the animal.
!63

In a final step, we convert the measurements from pixel units to metric units.
We further calculate the ratio between both dimensions and determine the brightness of the
object. The first 20 frames with detected animals were also saved as separate images to allow
for manual inspection and measuring using image analysis software such as ImageJ.
!64

Appendix E E. Images from video analysis
Aicha 15ºC 0.5 mg Ca l-1
Birth (day 0) Maturity (day 9) Last day (day 44)
Aicha 15ºC 4 mg Ca l-1
Birth (day 0) Maturity (day 9) Last day (day 88)
Aicha 15ºC 106 mg Ca l-1
Birth (day 0) Maturity (day 7) Last day (day 88)
!65
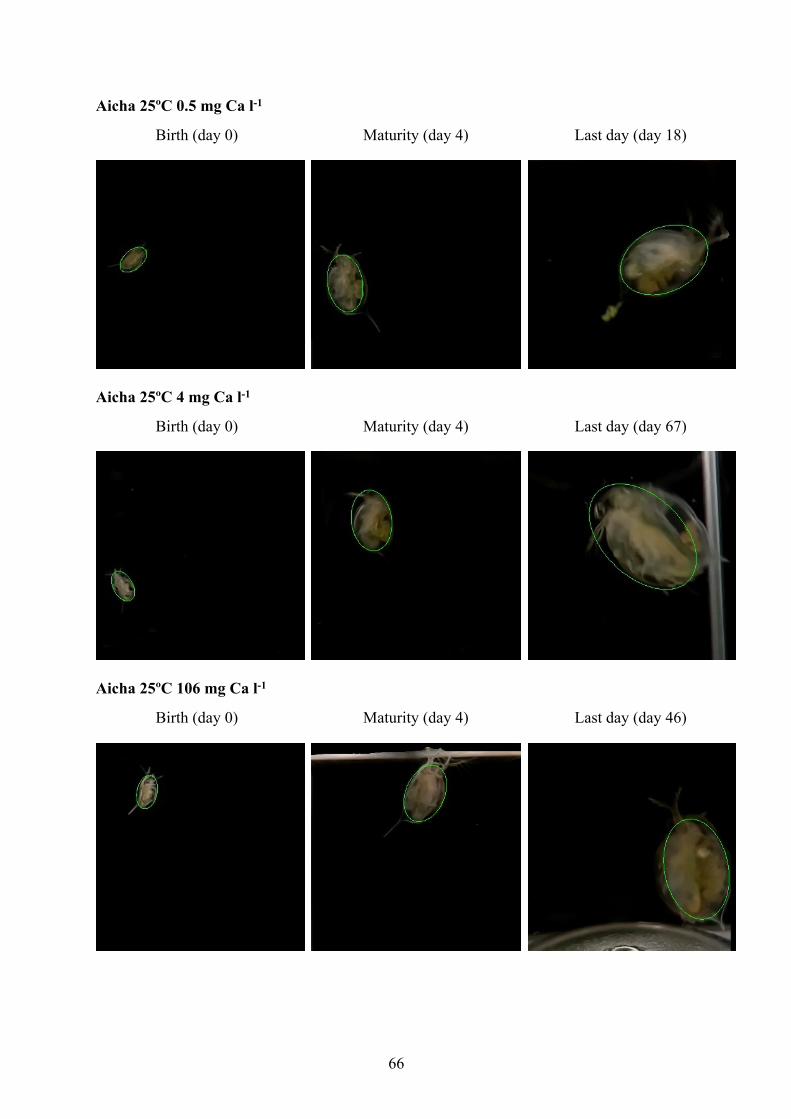
Aicha 25ºC 0.5 mg Ca l-1
Birth (day 0) Maturity (day 4) Last day (day 18)
Aicha 25ºC 4 mg Ca l-1
Birth (day 0) Maturity (day 4) Last day (day 67)
Aicha 25ºC 106 mg Ca l-1
Birth (day 0) Maturity (day 4) Last day (day 46)
!66

Pippi 15ºC 0.5 mg Ca l-1
Birth (day 0) Maturity (day 12) Last day (day 23)
Pippi 15ºC 4 mg Ca l-1
Birth (day 0) Maturity (day 11) Last day (day 74)
Pippi 15ºC 106 mg Ca l-1
Birth (day 0) Maturity (day 9) Last day (day 86)
!67

Pippi 25ºC 0.5 mg Ca l-1
Birth (day 0) Maturity (day 7) Last day (day 21)
Pippi 25ºC 4 mg Ca l-1
Birth (day 0) Maturity (day 4) Last day (day 74)
Pippi 25ºC 106 mg Ca l-1
Birth (day 0) Maturity (day 7) Last day (day 60)
!68

!1