Embed Size (px)
Citation preview
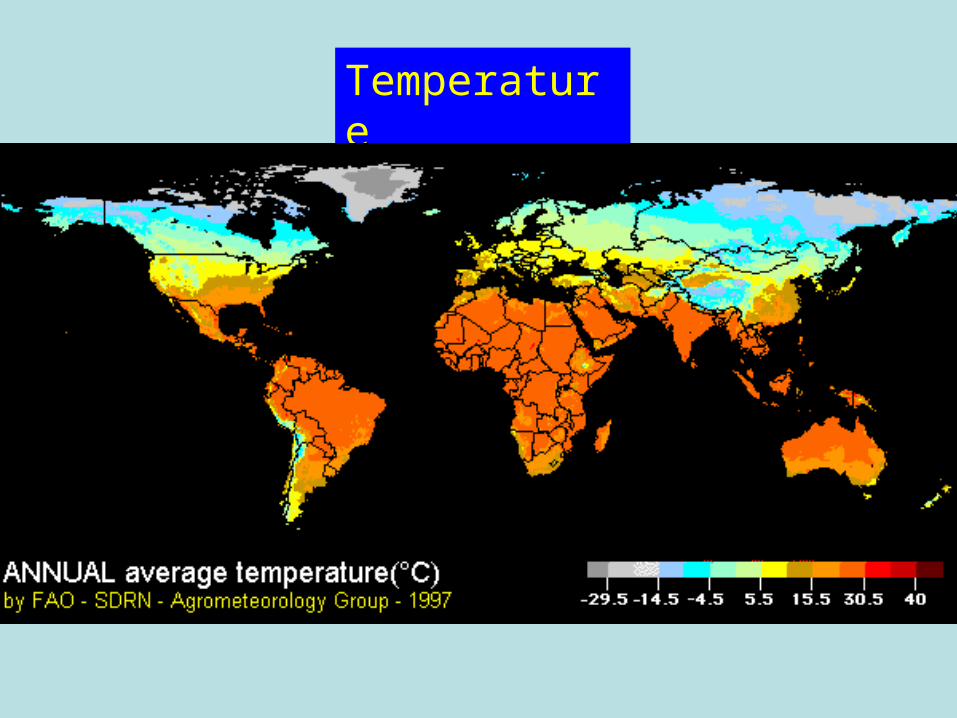
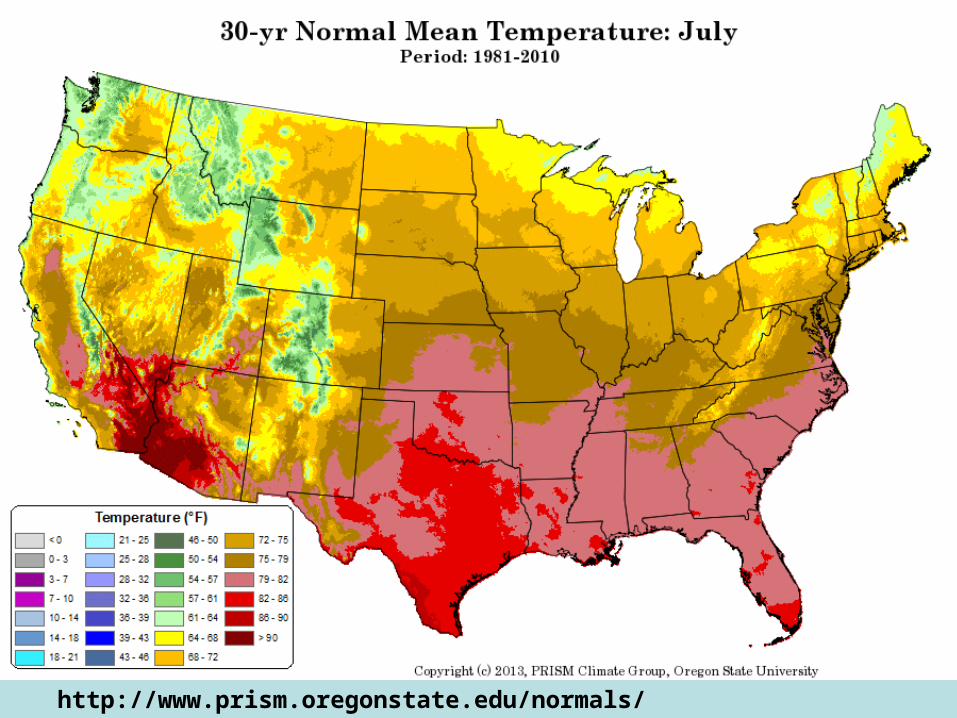
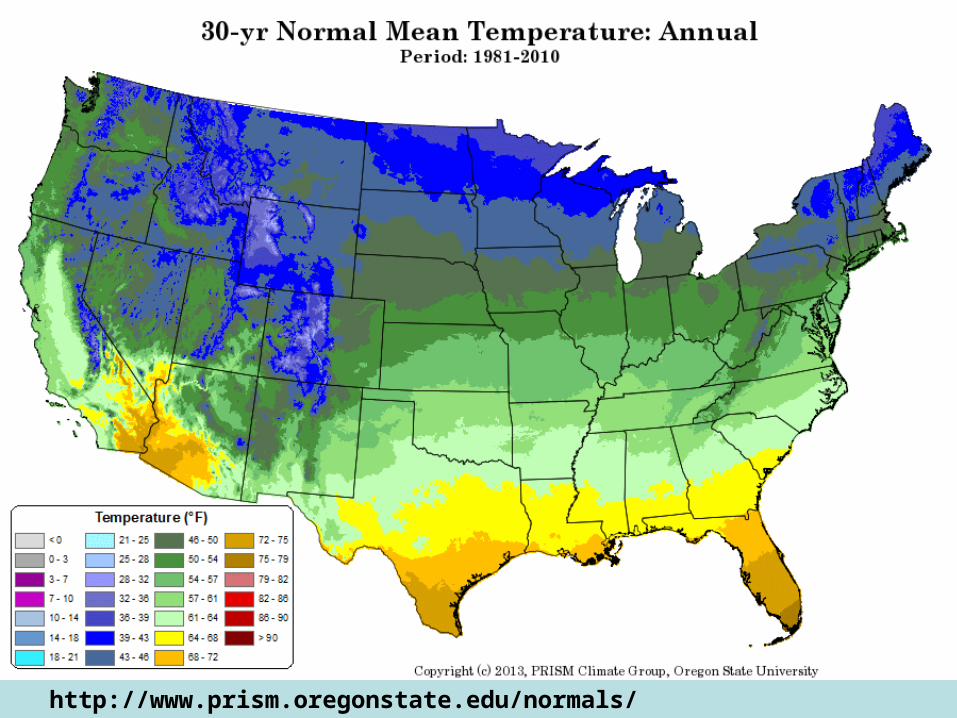
Temperature
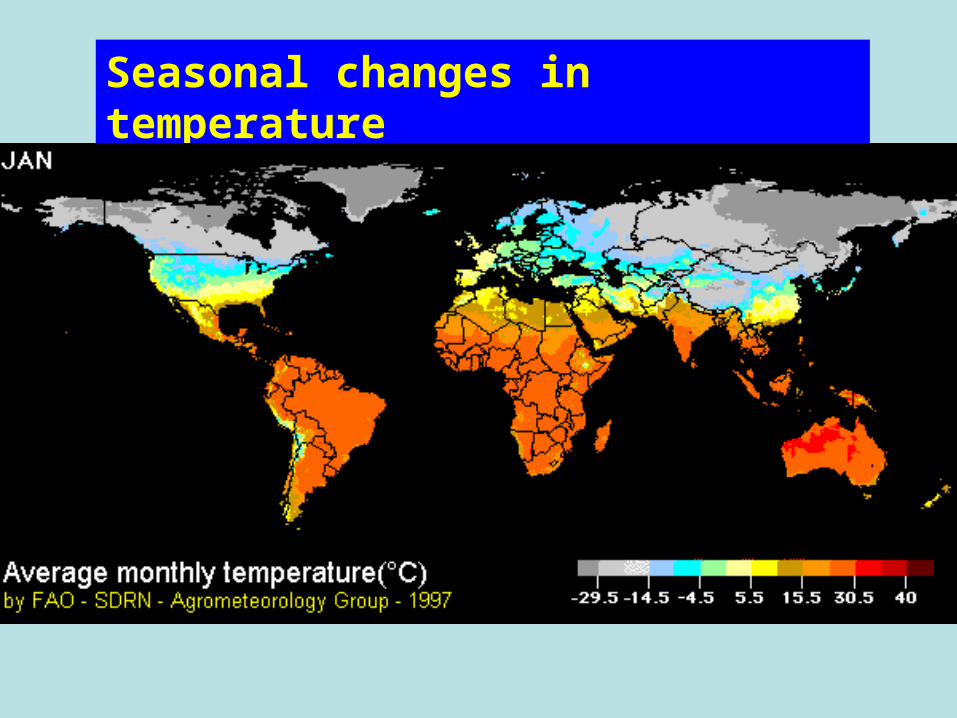
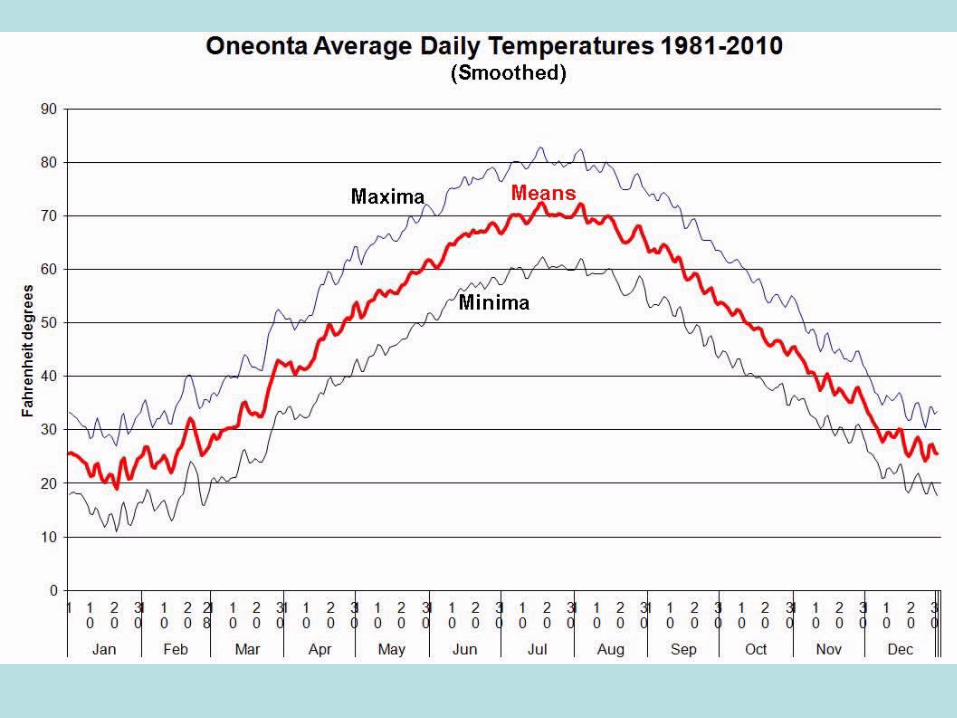
Seasonal changes in temperature
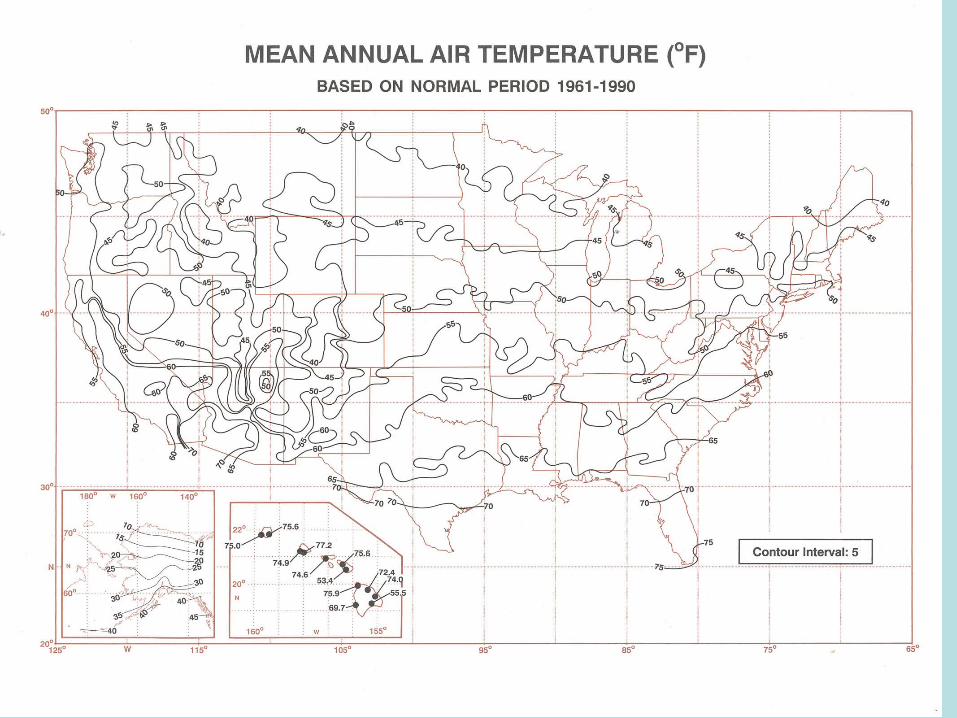
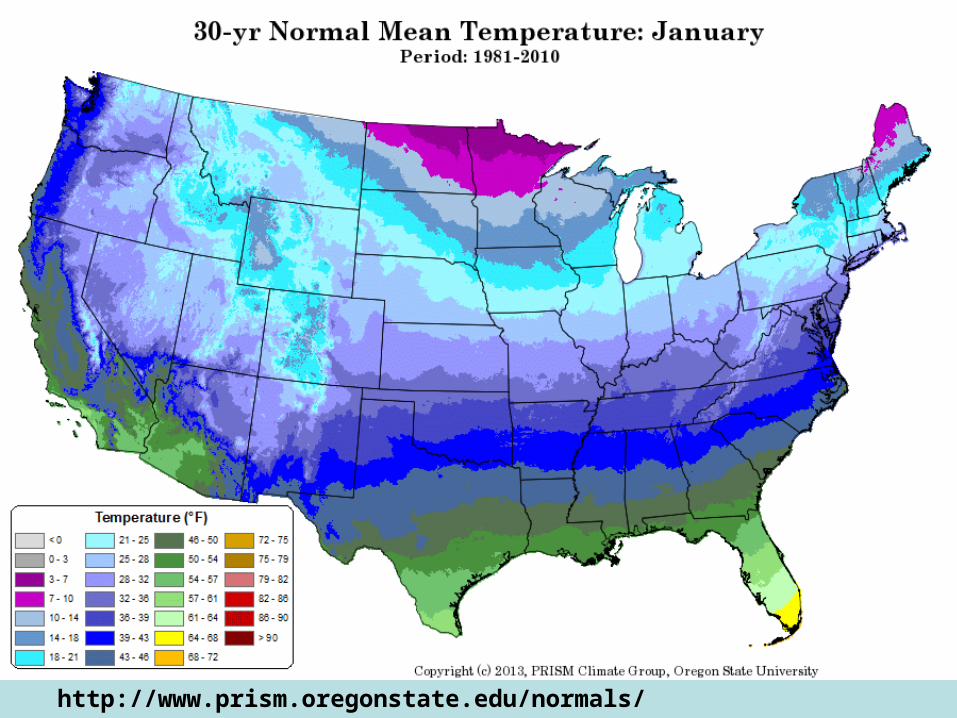
http://www.prism.oregonstate.edu/normals/
http://www.prism.oregonstate.edu/normals/
http://www.prism.oregonstate.edu/normals/
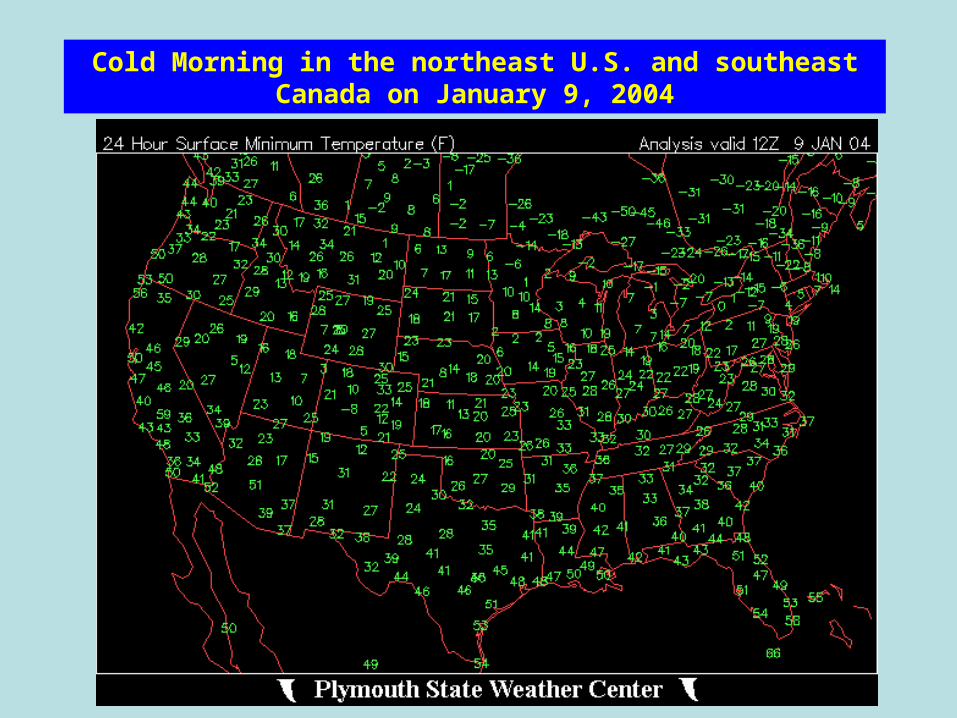
Cold Morning in the northeast U.S. and southeast Canada on January 9, 2004
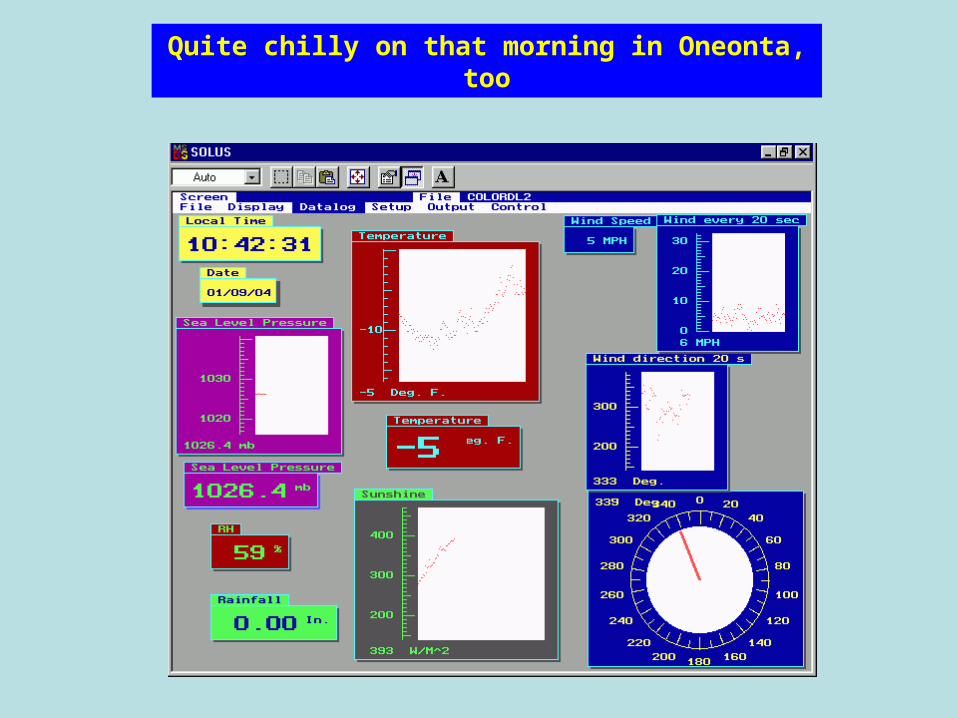
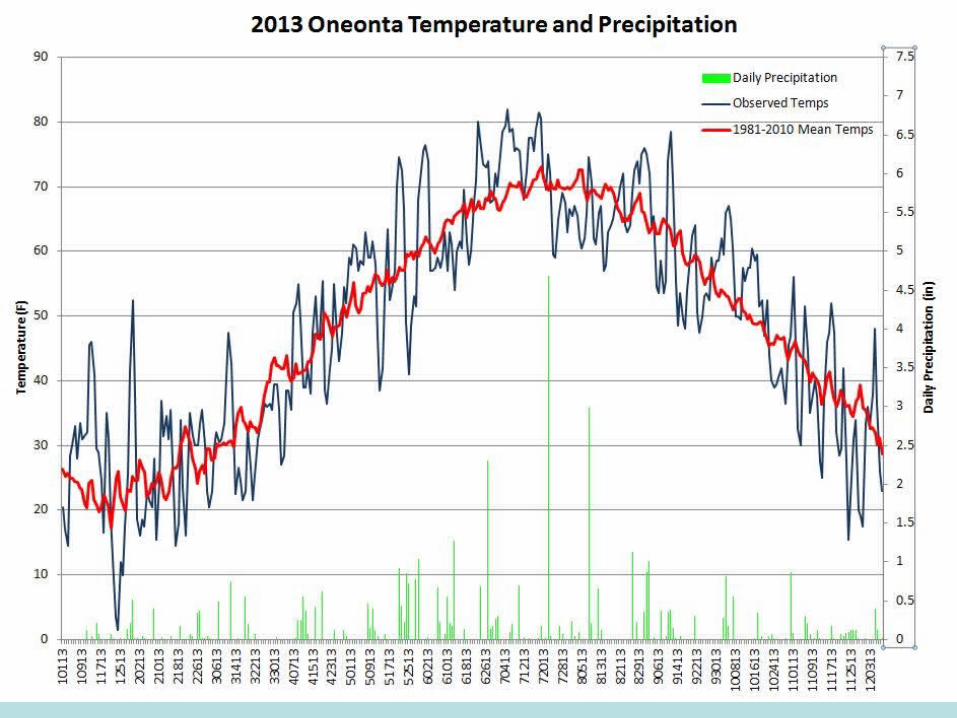
Quite chilly on that morning in Oneonta, too
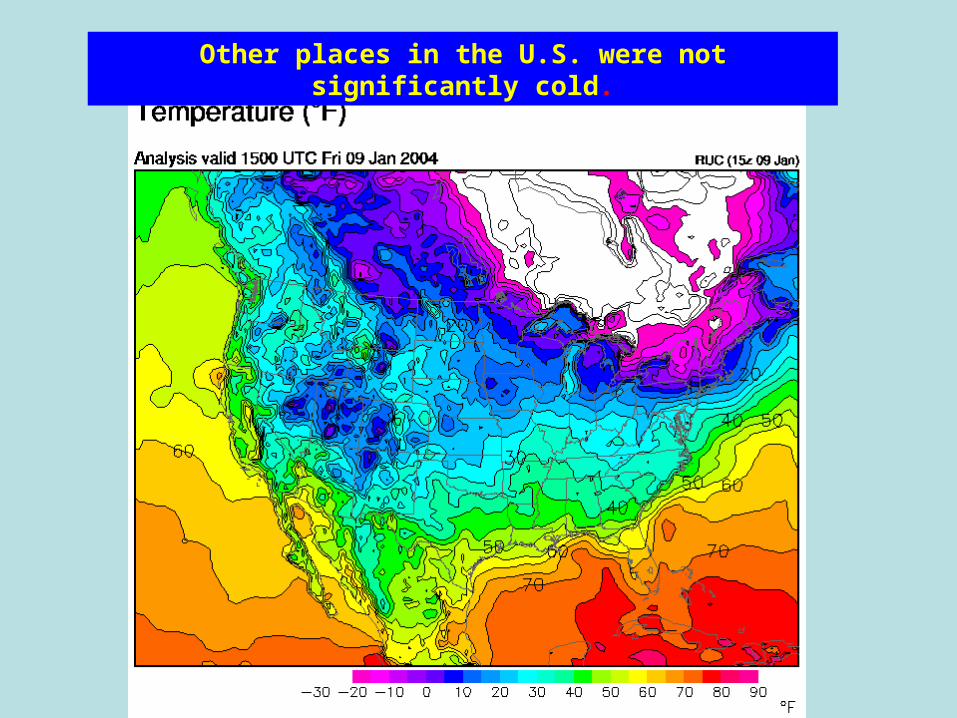
Other places in the U.S. were not significantly cold.
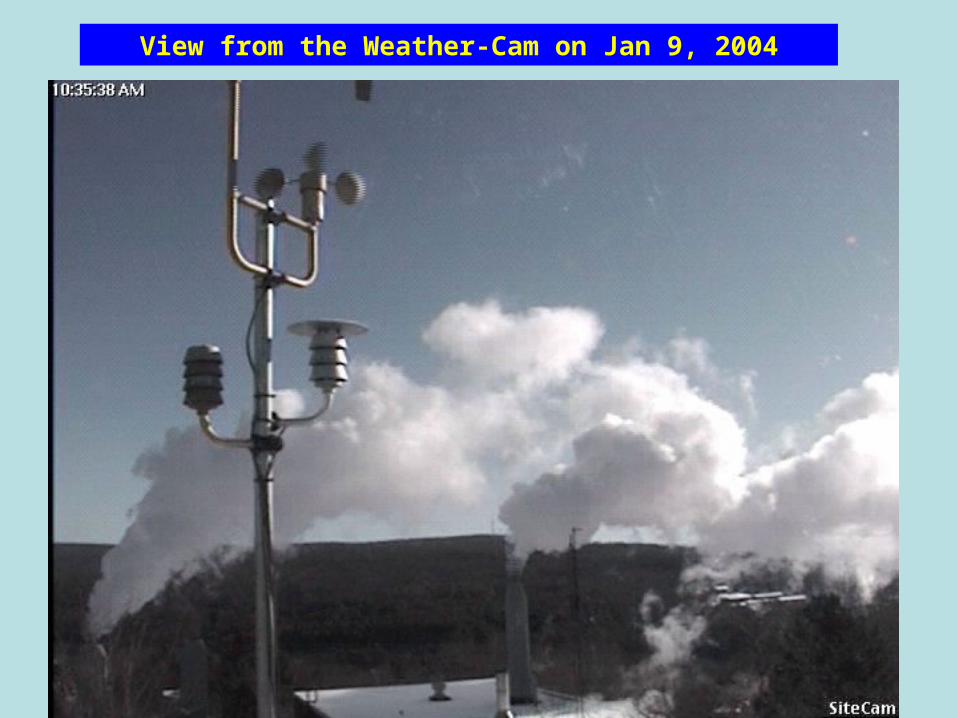
View from the Weather-Cam on Jan 9, 2004
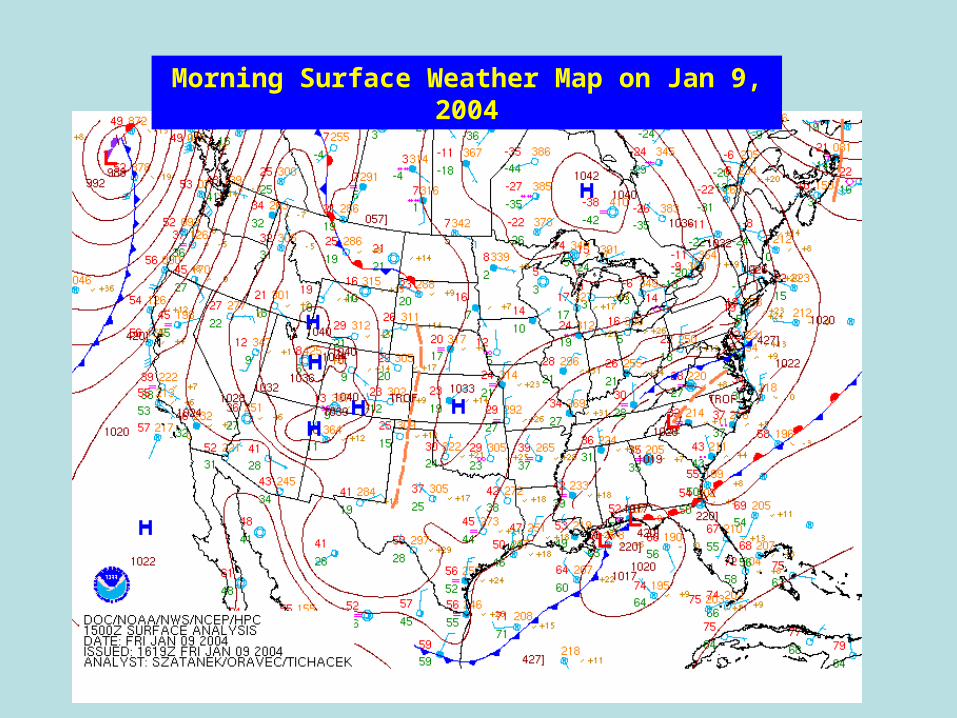
Morning Surface Weather Map on Jan 9, 2004
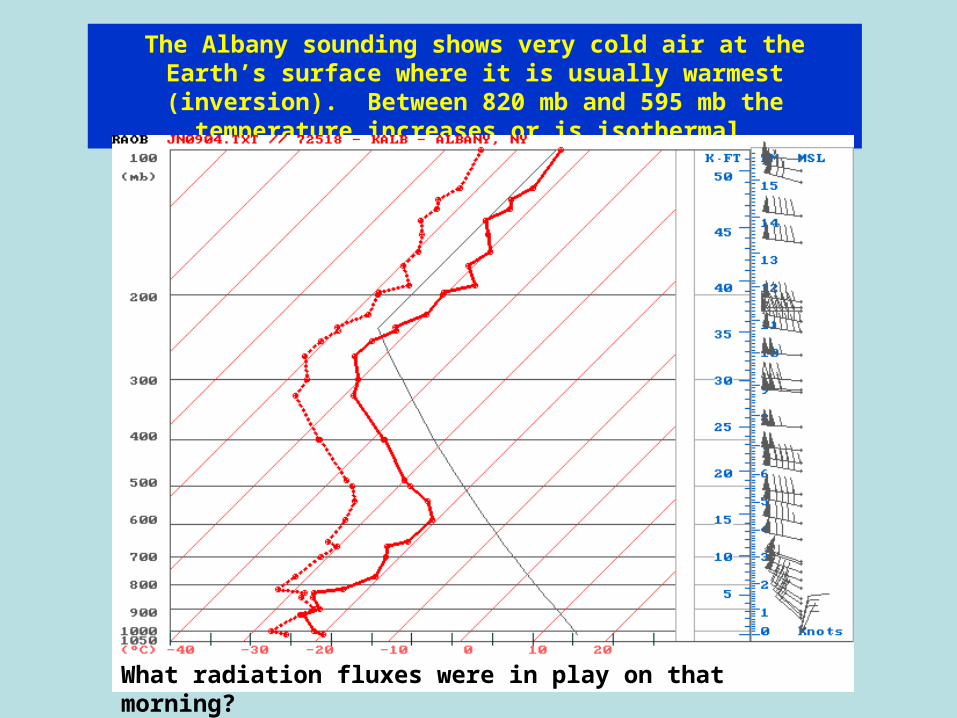
The Albany sounding shows very cold air at the Earth’s surface where it is usually warmest (inversion). Between 820 mb and 595
mb the temperature increases or is isothermal.
What radiation fluxes were in play on that morning?

Class Exercise: Meteorological features correlated with surface
temperature
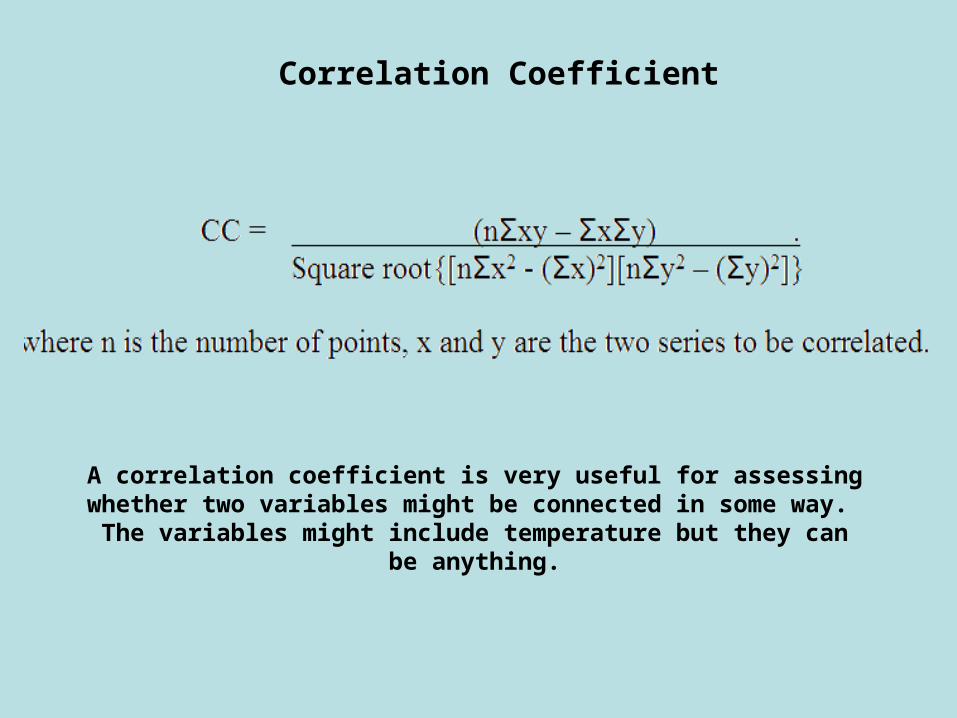
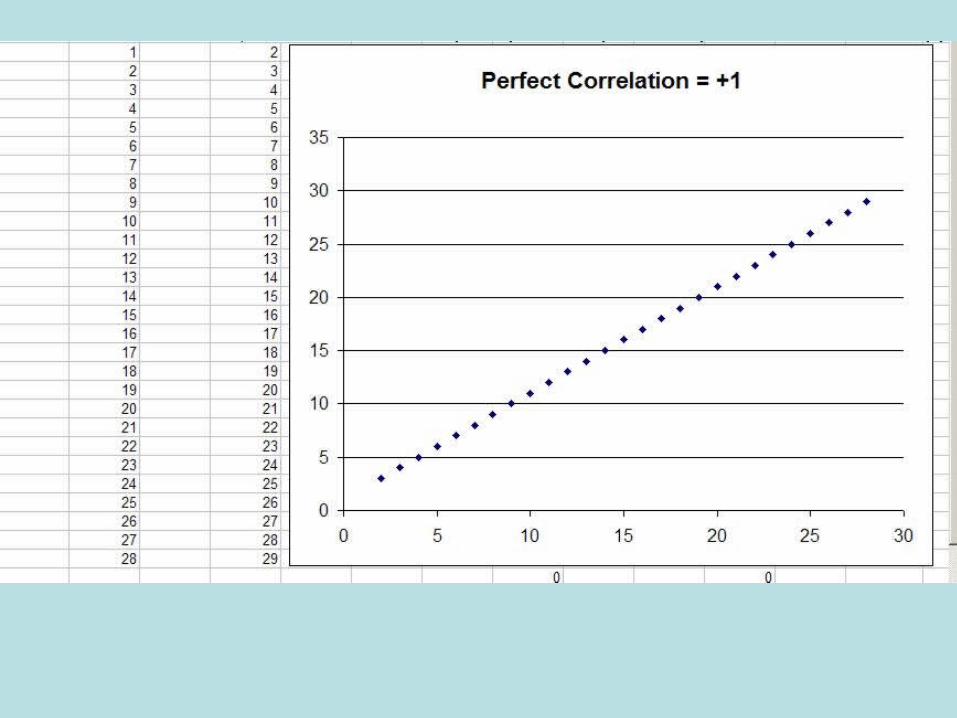
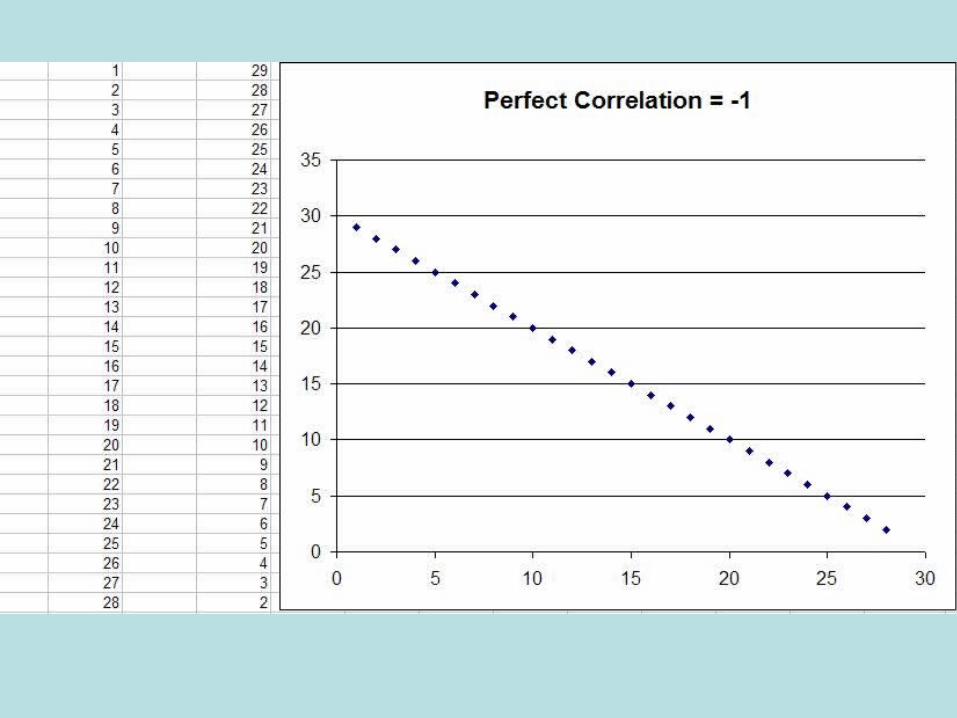
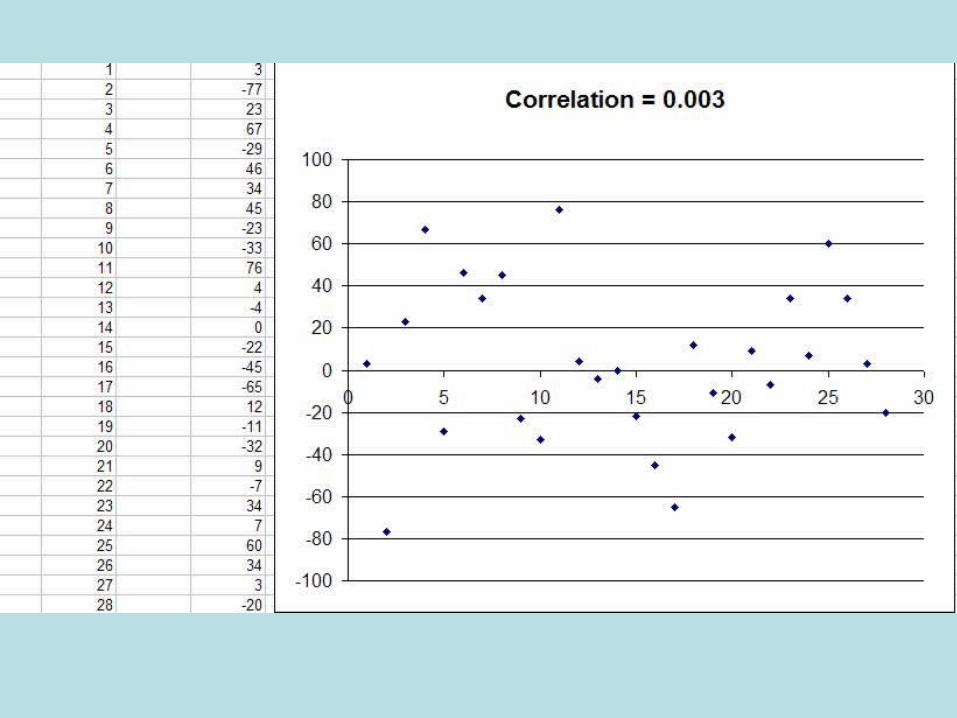
Correlation Coefficient
A correlation coefficient is very useful for assessing whether two variables might be connected in some way. The variables might
include temperature but they can be anything.

Temperature exercise to be distributed in class
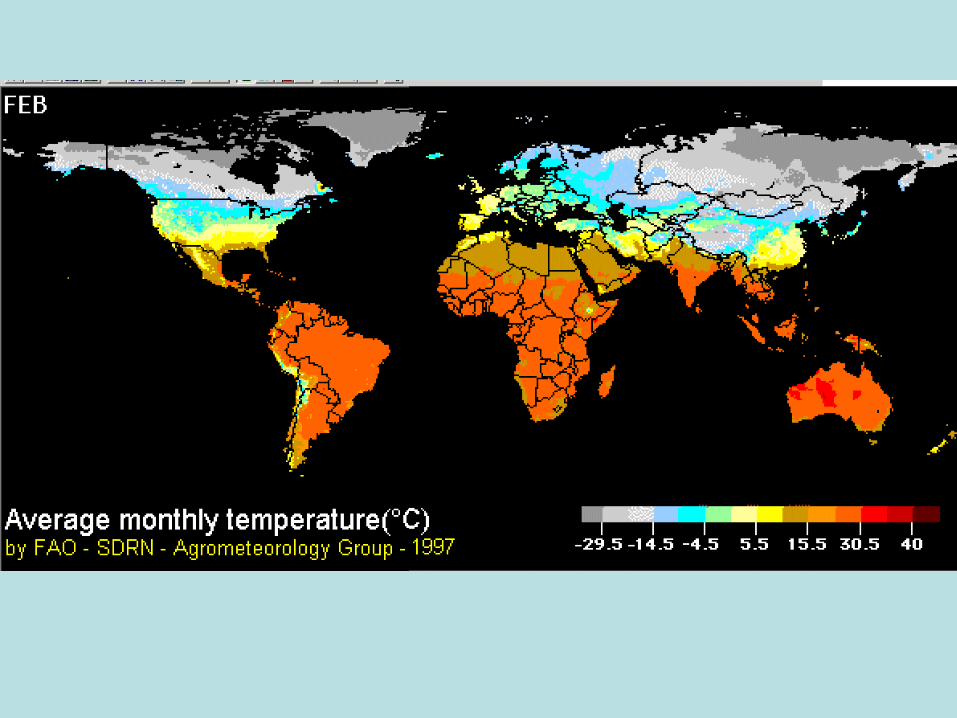
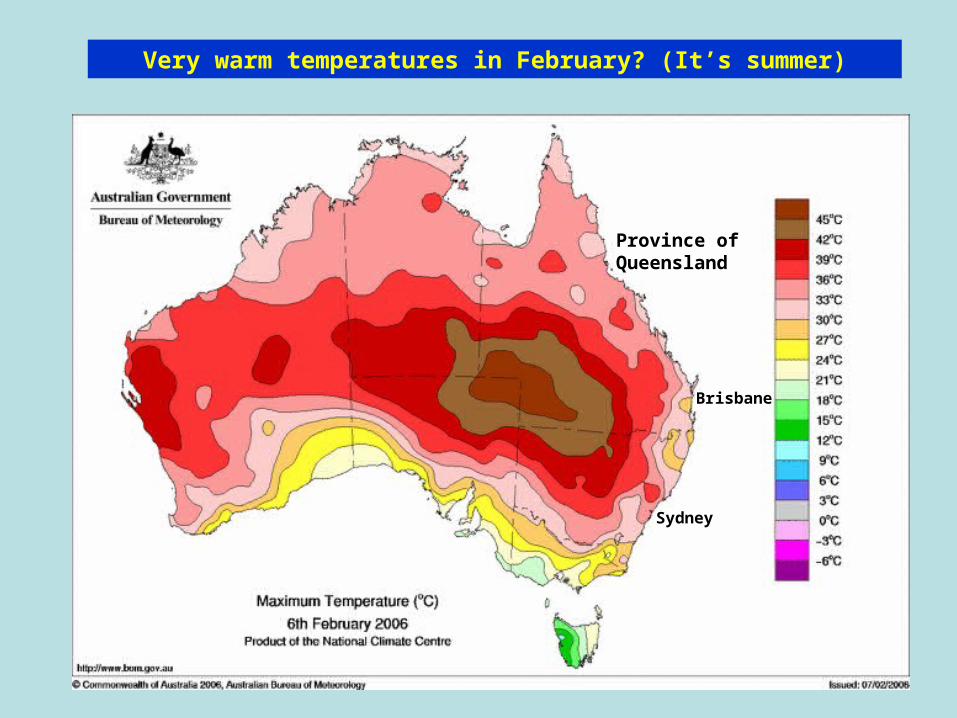
Very warm temperatures in February? (It’s summer)
Province of Queensland
Brisbane
Sydney
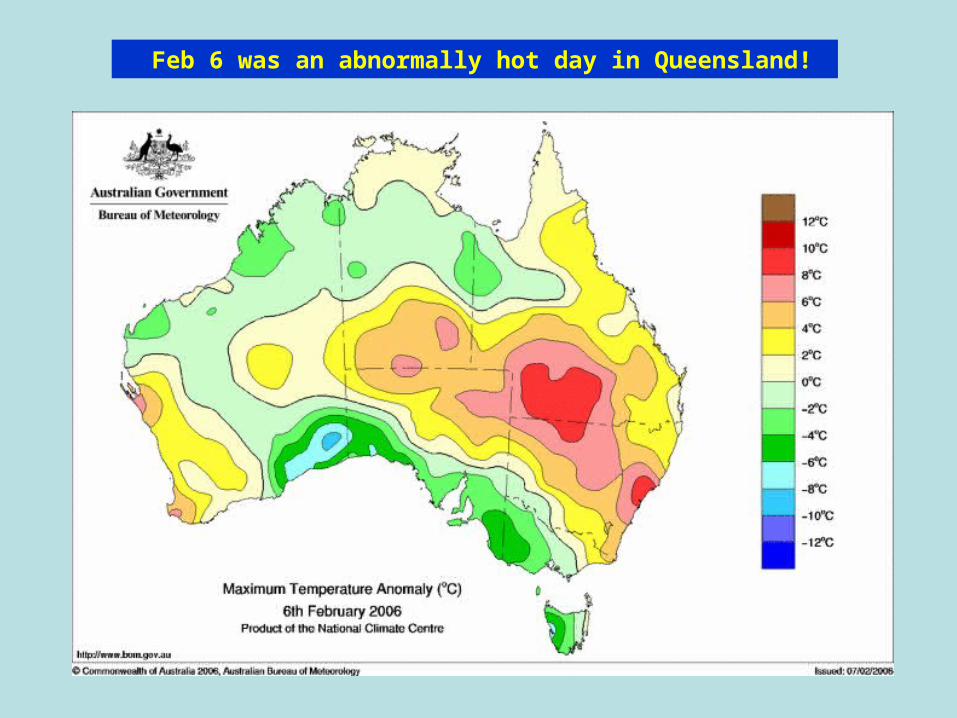
Feb 6 was an abnormally hot day in Queensland!
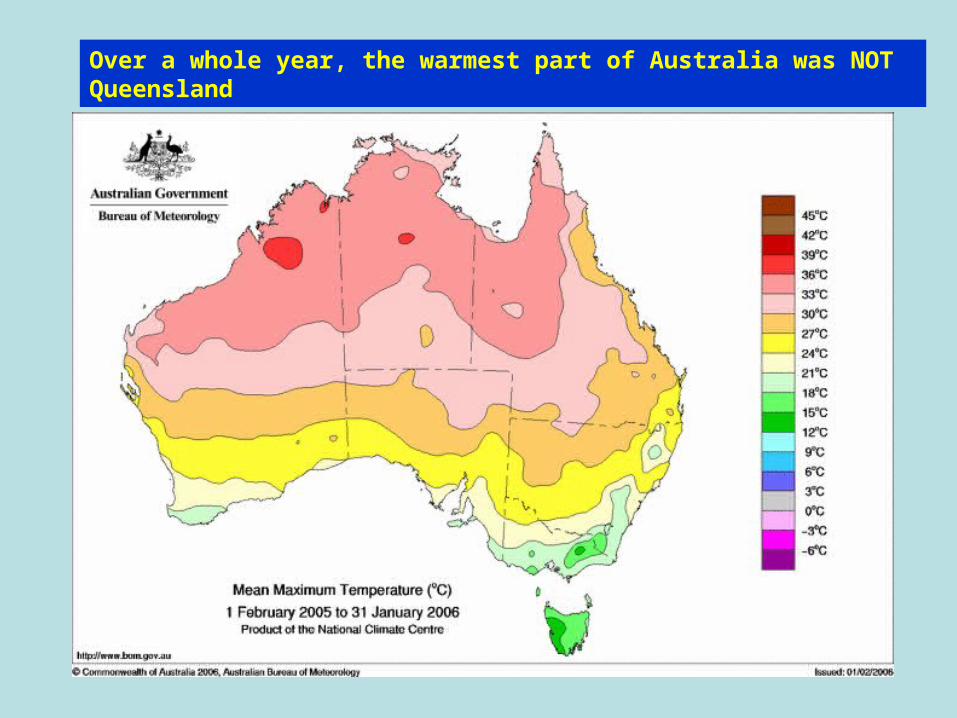
Over a whole year, the warmest part of Australia was NOT Queensland
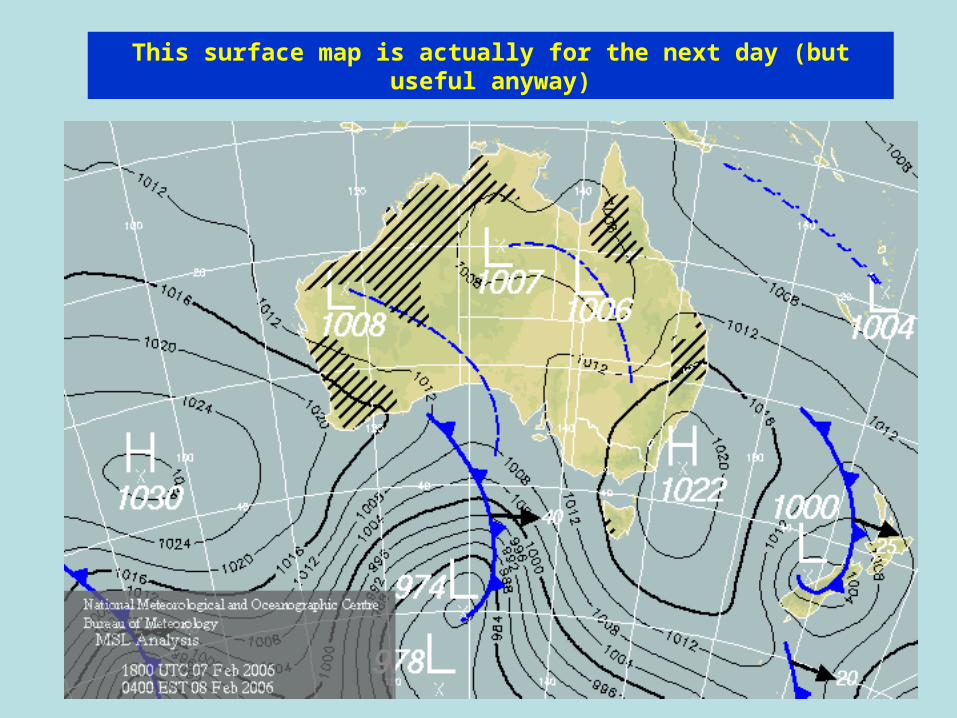
This surface map is actually for the next day (but useful anyway)
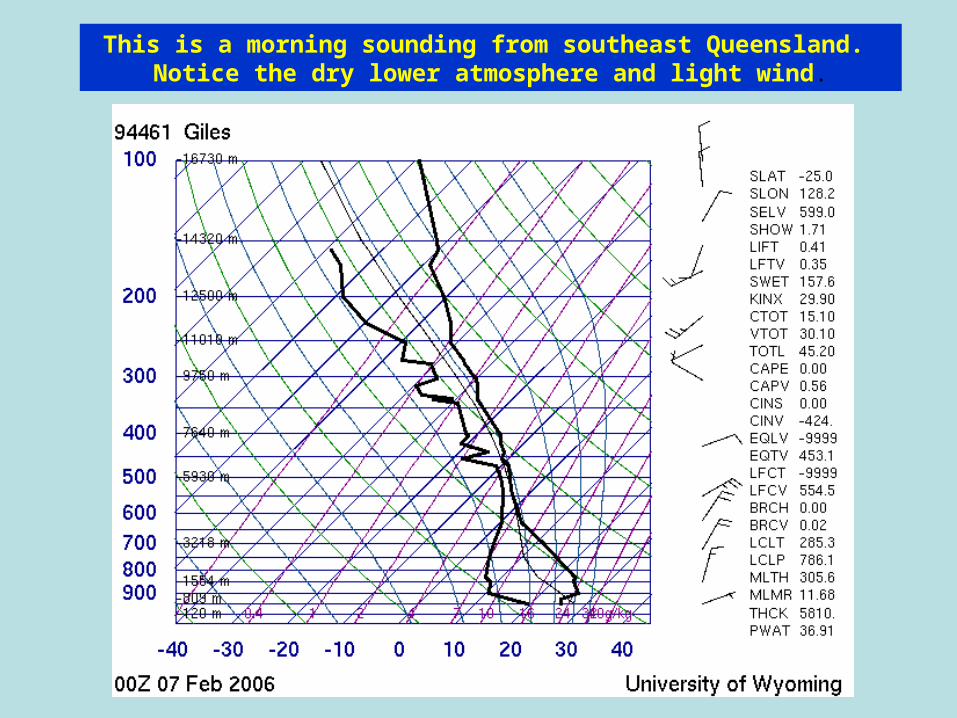
This is a morning sounding from southeast Queensland. Notice the dry lower atmosphere and light wind.
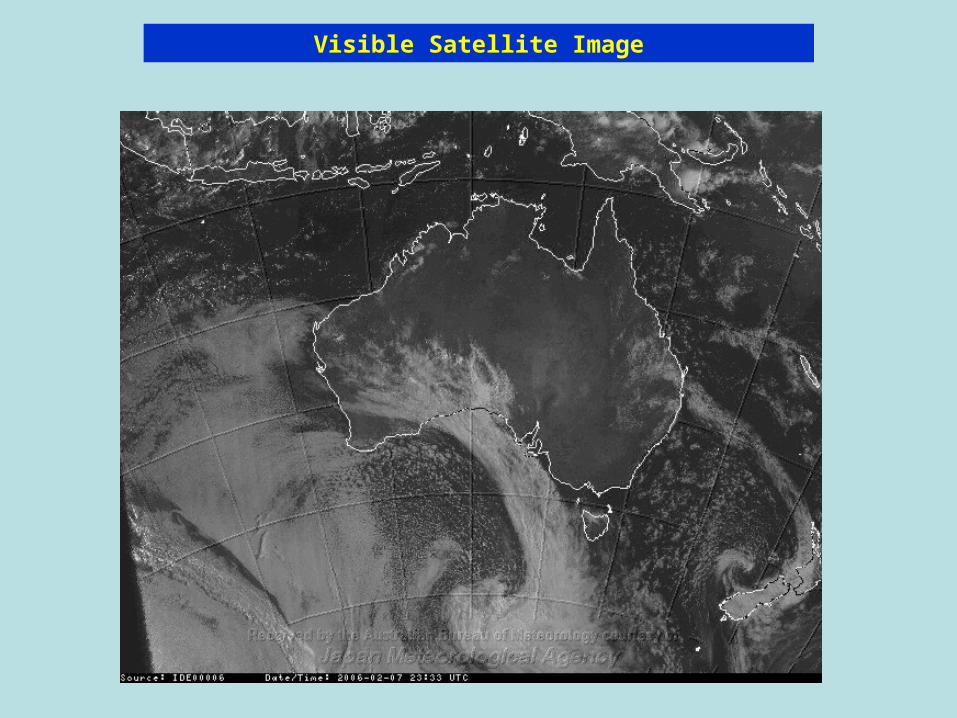
Visible Satellite Image
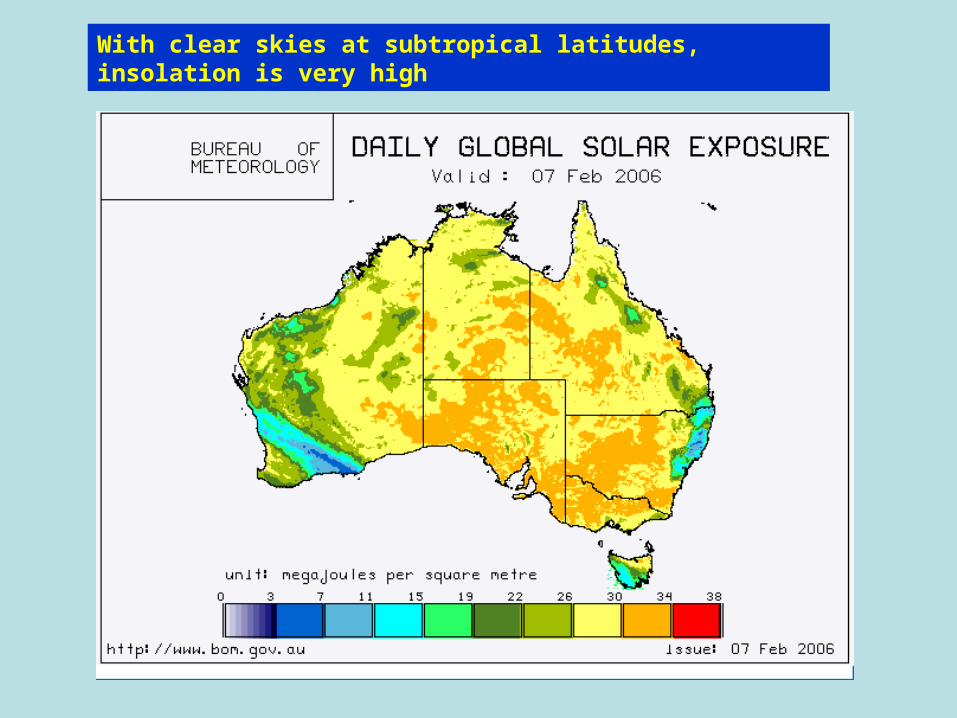
With clear skies at subtropical latitudes, insolation is very high
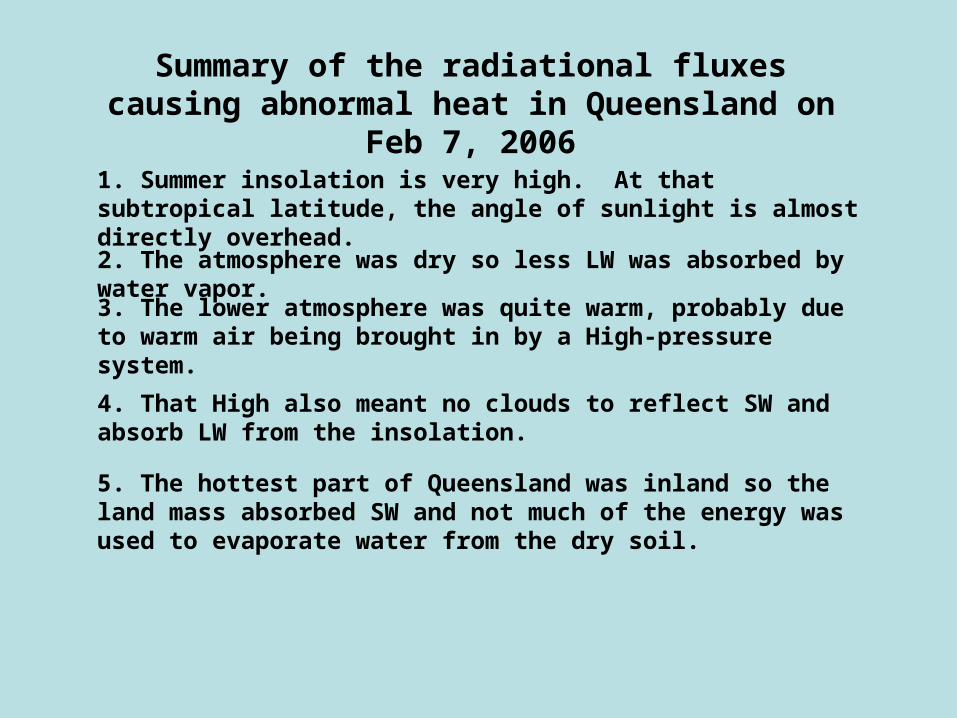
Summary of the radiational fluxes causing abnormal heat in Queensland on Feb 7, 2006
1. Summer insolation is very high. At that subtropical latitude, the angle of sunlight is almost directly overhead.
2. The atmosphere was dry so less LW was absorbed by water vapor.
3. The lower atmosphere was quite warm, probably due to warm air being brought in by a High-pressure system.
5. The hottest part of Queensland was inland so the land mass absorbed SW and not much of the energy was used to evaporate water from the dry soil.
4. That High also meant no clouds to reflect SW and absorb LW from the insolation.
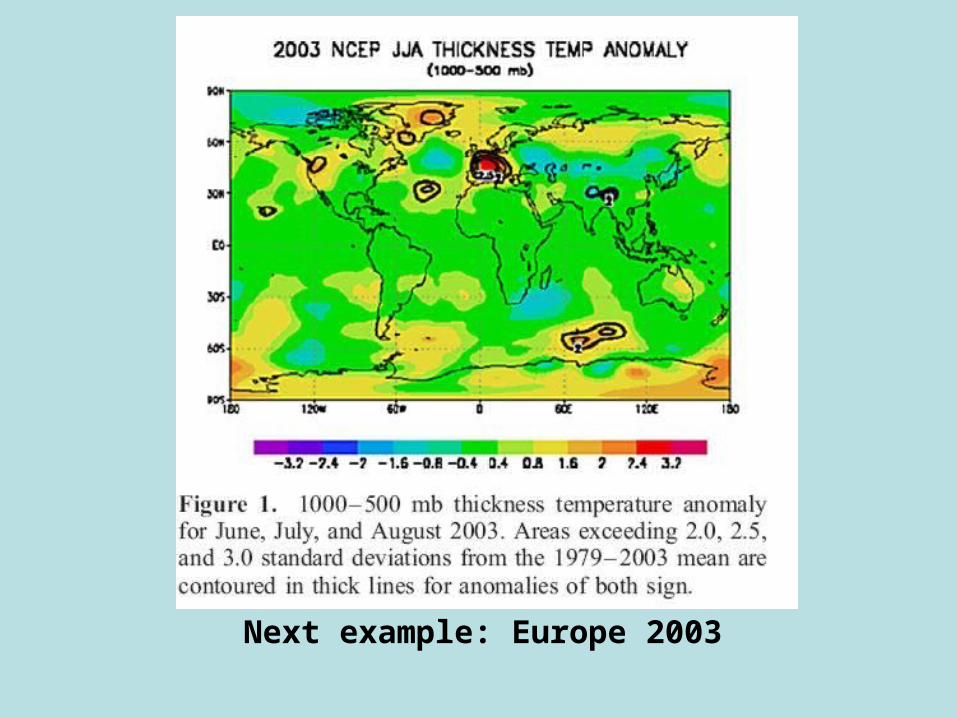
Next example: Europe 2003
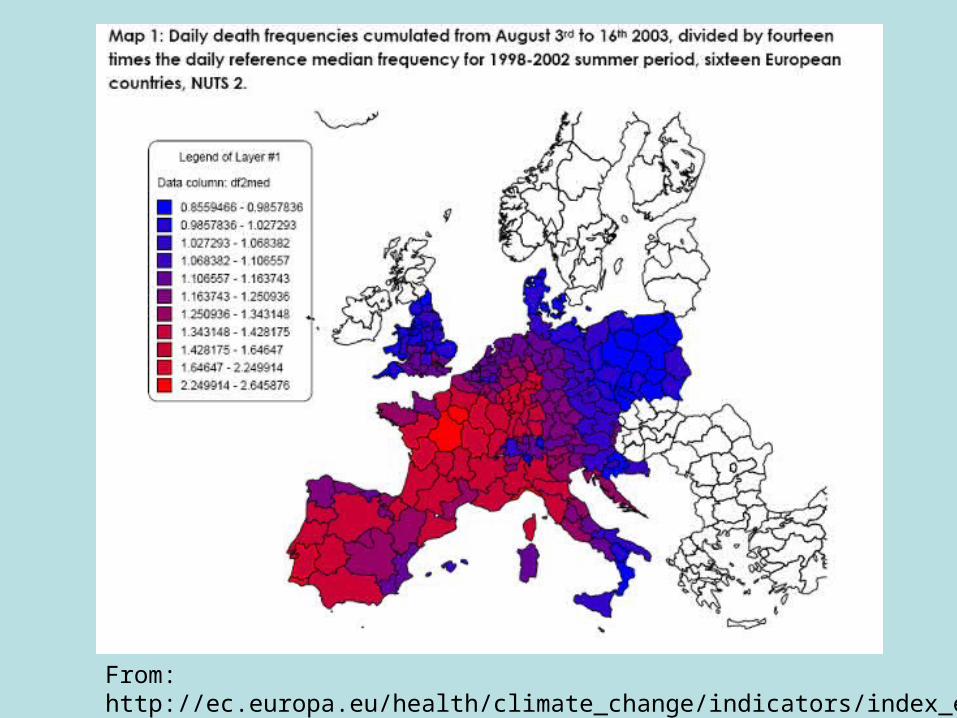
From: http://ec.europa.eu/health/climate_change/indicators/index_en.htm
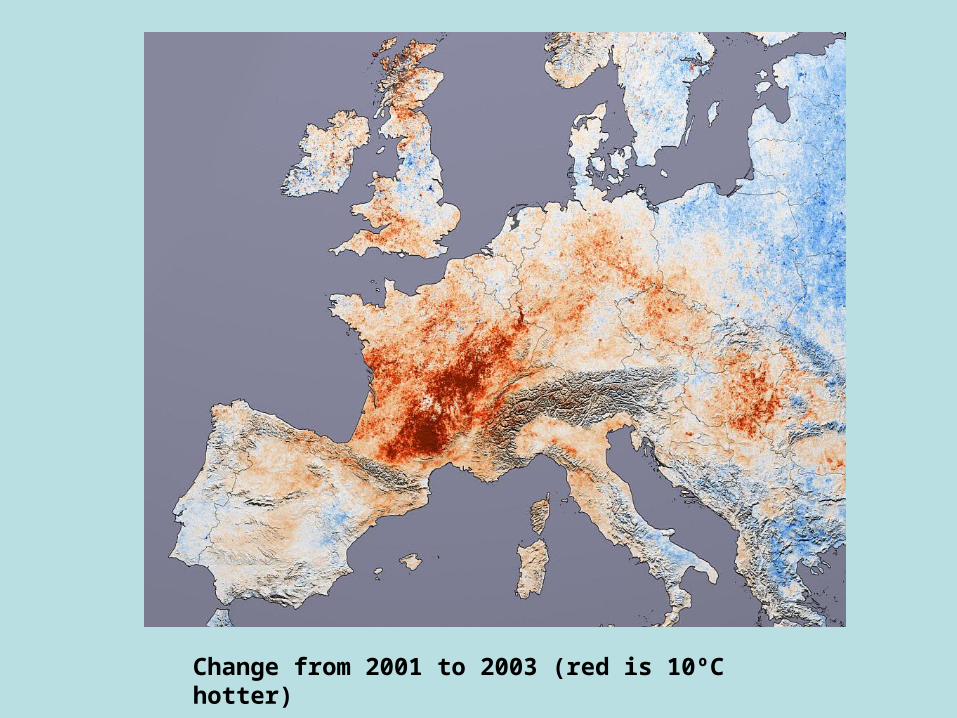
Change from 2001 to 2003 (red is 10ºC hotter)
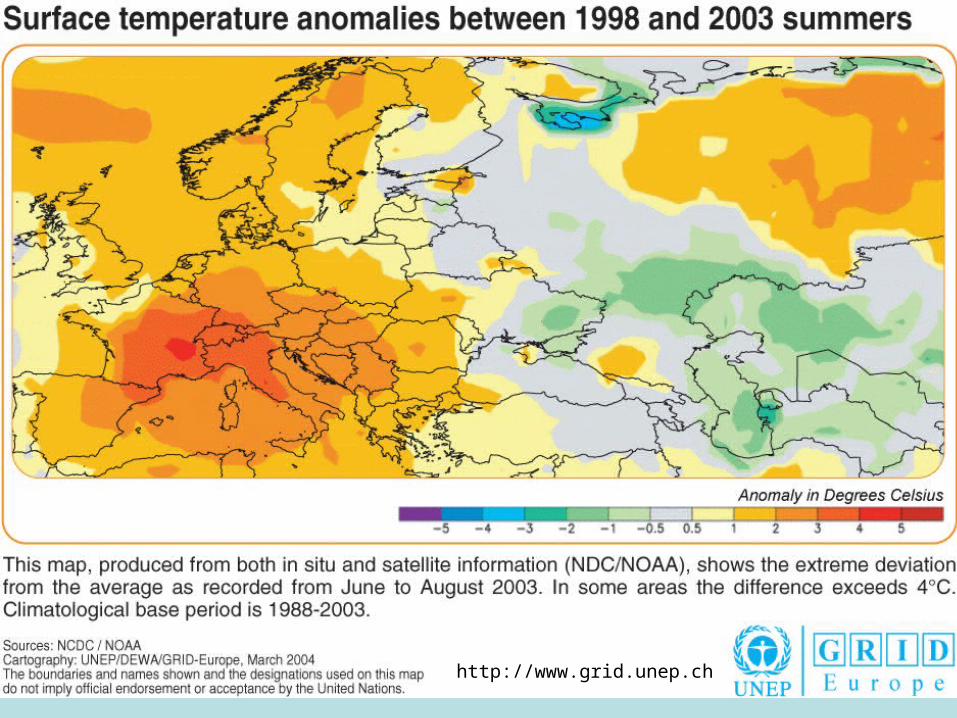
http://www.grid.unep.ch
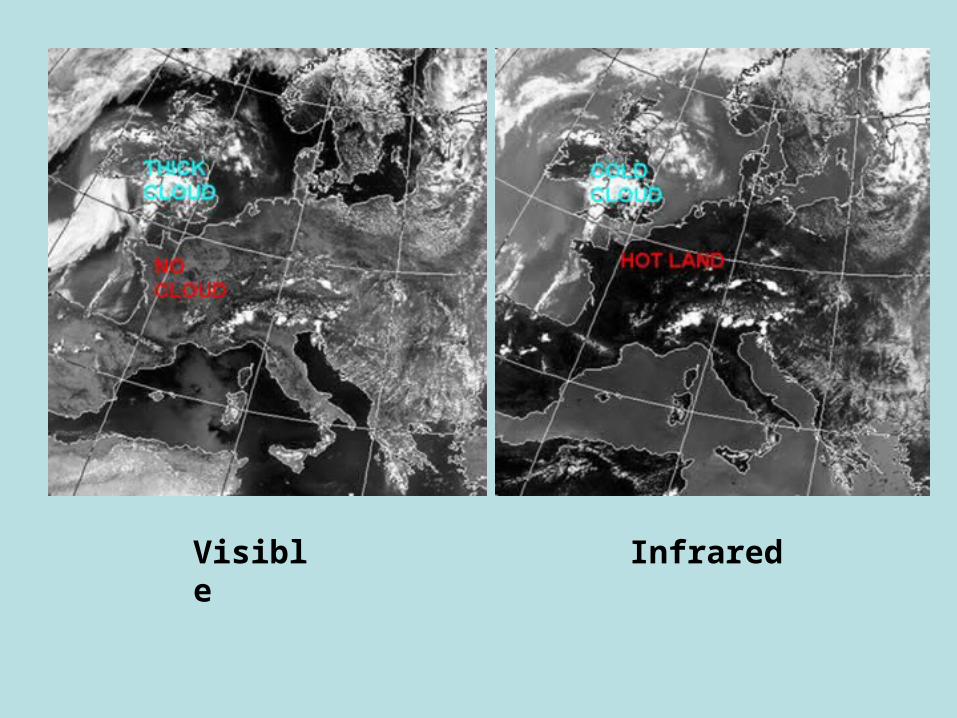
Visible Infrared
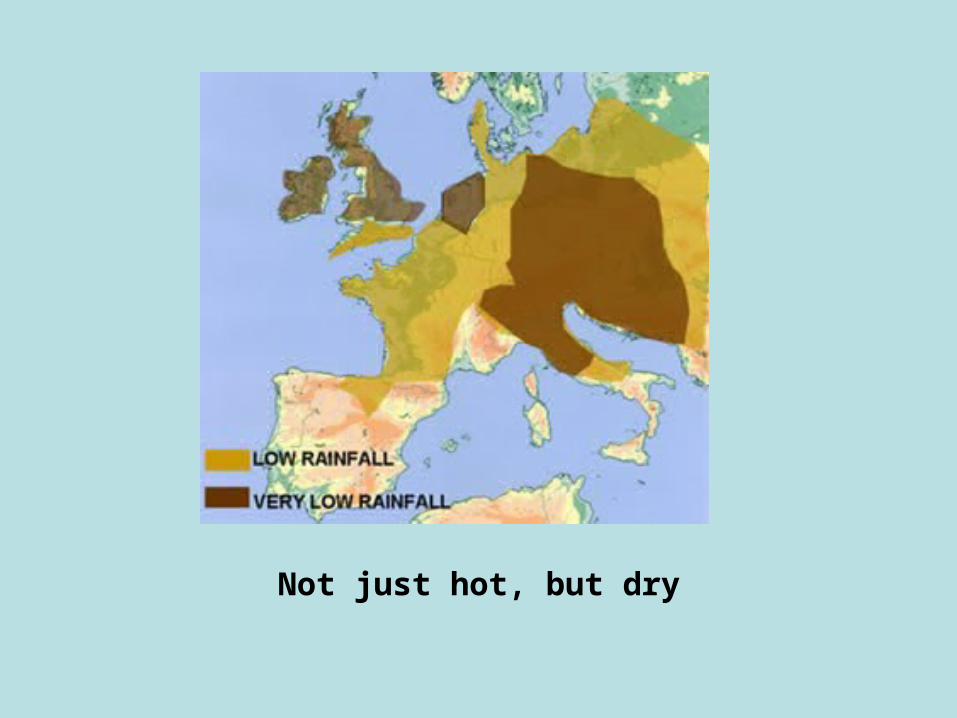
Not just hot, but dry
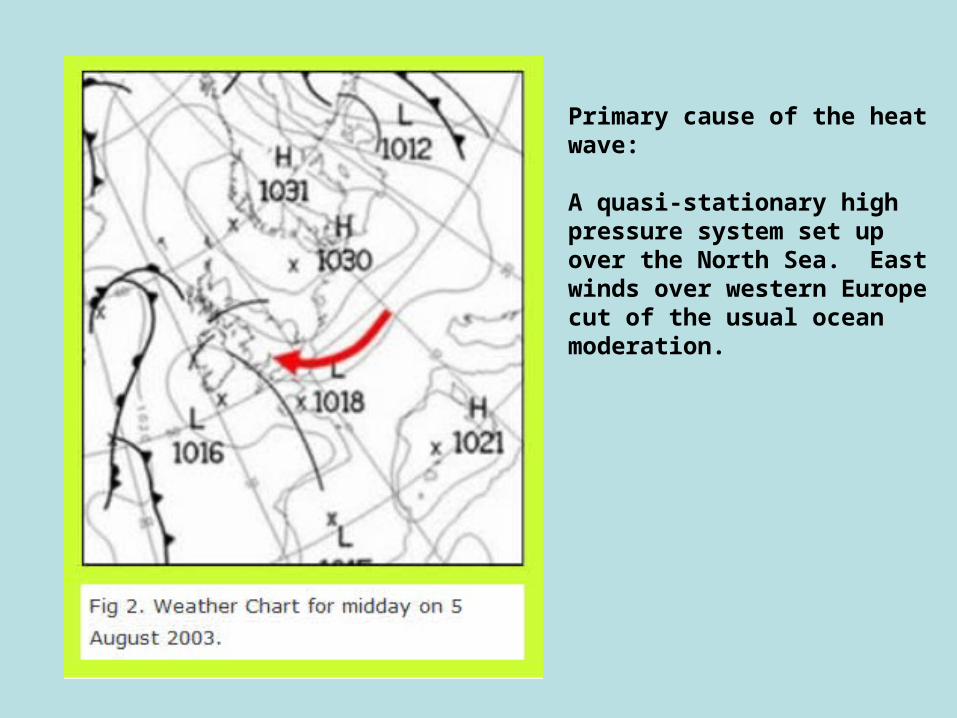
Primary cause of the heat wave:
A quasi-stationary high pressure system set up over the North Sea. East winds over western Europe cut of the usual ocean moderation.
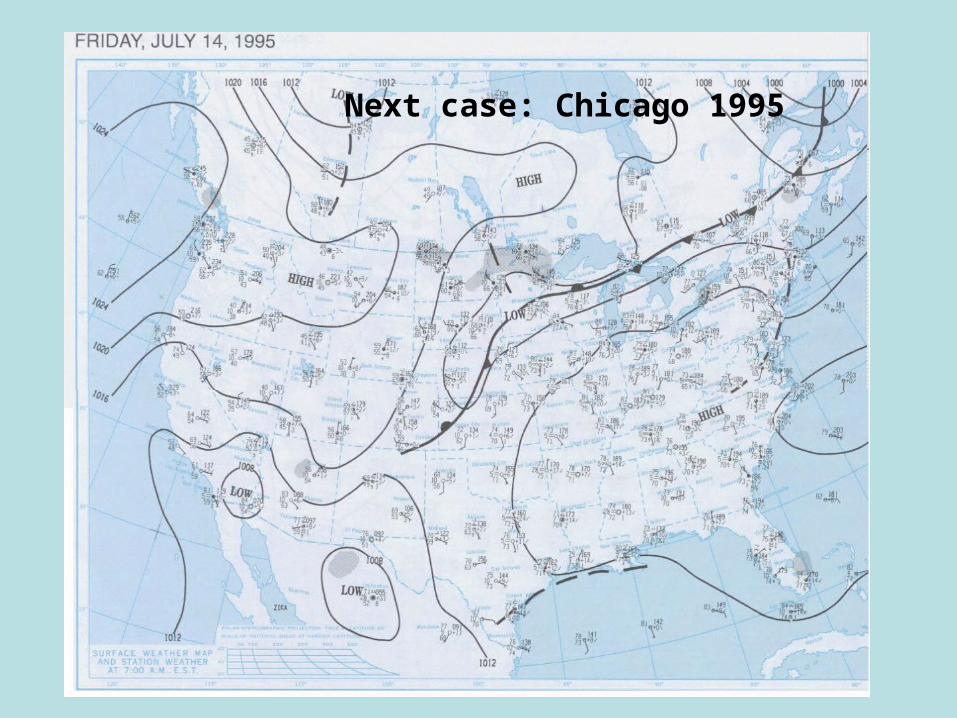
Next case: Chicago 1995
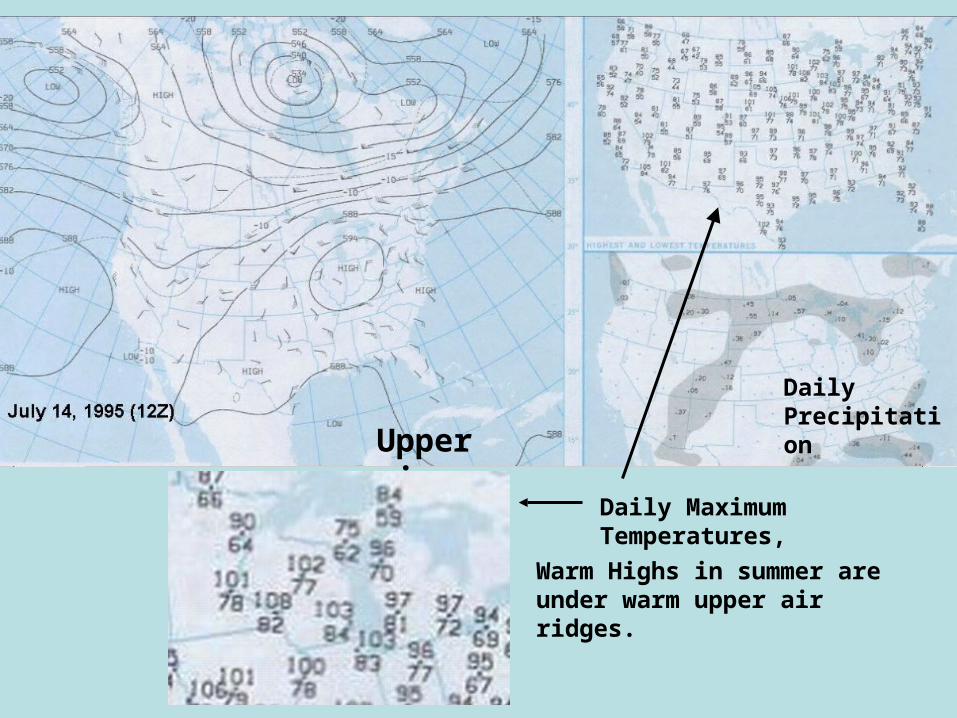
Upper air
Daily Maximum Temperatures,
Daily Precipitation
Warm Highs in summer are under warm upper air ridges.
Next: Humidity
(Fogs and Clouds)


![Diagnosis on the Seasonal Temperature Changes of the ...mixed layer temperature, except with 0.5 C or 1 C difference Hanawa [11] & Suga [12], we therefore use temperature of the upper](https://img.pdfslide.us/doc/110x75/613e194759df6428461650a7/diagnosis-on-the-seasonal-temperature-changes-of-the-mixed-layer-temperature.jpg)