Embed Size (px)
Citation preview
JOURNAL OF CATALYSIS 38,477-481 (1975)
NOTES
Temperature Programmed Desorption of CO from Supported Cobalt
During recent years several authors have been using the temperature pro- grammed desorption (TPD) method for studying the activity of catalytic surfaces and for obtaining kinetic parameters of de- sorption processes (Z-5). This note is con- cerned with the application of this method to the study of carbon monoxide adsorbed at 40°C on a commercial cobalt catalyst supported on kieselguhr.
The catalyst, which was the same one as used by Adrian and Smith (6), was a com- mercial hydrogenation catalyst (G-61, Girdler Corp.) consisting of 60% cobalt (as oxide) on kieselguhr. The particles were obtained by grinding 3/I 6 x l/8 in. tablets and sifting through a 28-35 mesh sieve. The catalyst was reduced in situ as described by Kokes (7): pure hydrogen, obtained directly from an electrolytic gen- erator (Milton Roy Co.), was streamed over the catalyst at 30 cm3/min for 12 hr at 300°C. The reducing temperature was reached in two stages: from room tempera- ture to 100°C at a rate of 10°C every 10 min, and from 100 to 300°C at a rate of 5°C every 10 min. The heating was con- trolled manually and was performed in one of two ways, either in air at atmospheric pressure or in a stream of 99.99% helium (Matheson Ultrahigh Purity) flowing at 8 cm3/min. We designate as solid a the cata- lyst which was heated in air at atmospheric pressure prior to its reduction, and as solid b the catalyst which was heated in helium. After the reduction the solid kept for 1 hr at 300°C and 10e5 Torr (1 Torr = 133 N rn-‘), and then cooled to 40°C keeping the pressure constant. The adsorp-
tion and TPD experiments were per- formed 5 hr after the end of the reduction.
The TPD equipment was similar to that employed by Amenomiya and Cvetanovid (1). A 0.73 g sample of the solid, having a total BET area of 77 m”/g, was used, and it was replaced for each experiment. After reducing and cleaning the solid as de- scribed above, the adsorption of carbon monoxide (Matheson, CP grade) was al- lowed to proceed at 40°C. Equilibrium was reached rapidly, but in all cases a total time of 15 min was allowed for the adsorp- tion. In the TPD experiment the adsorbate was then desorbed in a stream of carrier gas (99.99% He), using a thermal conduc- tivity cell as the detector. After obtaining the signal corresponding to the gas phase sufficient time (approximately 15 min) was allowed for the recorder to return to the base line, and the temperature of the reac- tor was increased linearly at the desired rate by means of a Carlo Erba L. T. pro- grammer. A TPD chromatogram was ob- tained in which the peaks are due to the gas desorbed at different temperatures. The quantity of desorbed CO was calcu- lated from the areas under the peaks corre- sponding to known amounts of CO. Buffer volumes in the circuit helped reduce fluc- tuations in the flow rate of the gas. The desorbed gases corresponding to the peaks were collected on 5A zeolite in a liquid ni- trogen trap, and examined in a Leitz Model 1 I I G infrared spectrophotometer; in all cases, only carbon monoxide could be detected.
To supplement the TPD results, the ad- sorption isotherm for carbon monoxide on
477 Copyright 0 1975 by Academic Press, Inc. All rights of reproduction in any form reserved.
478 NOTES
VP) IOO- (11
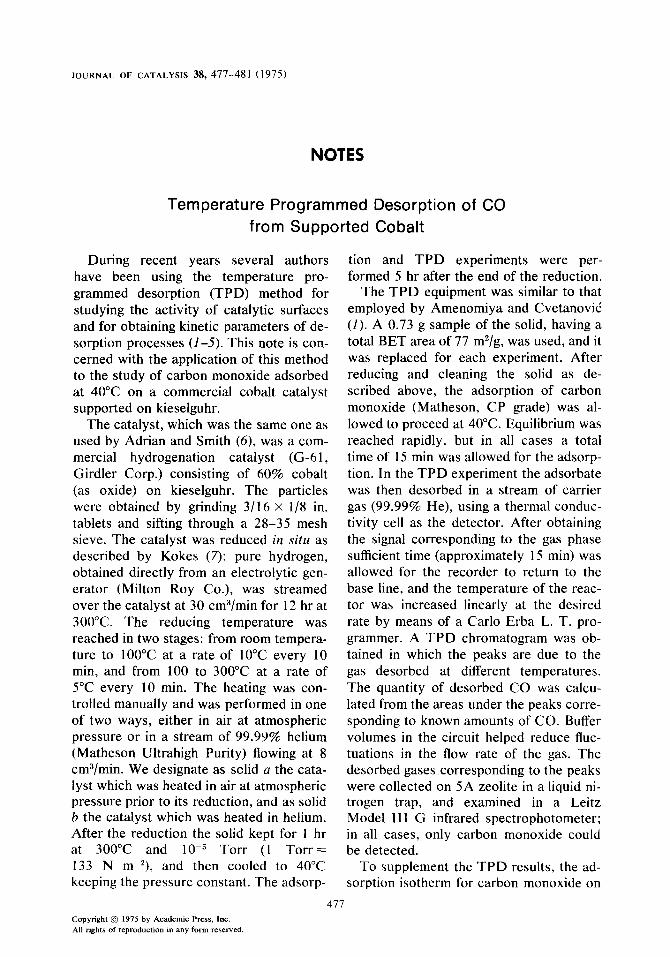
FIG. I. (1) Adsorption isotherm of carbon mon- oxide on solid b at 40°C. n,: Total adsorbed quantity; n,: adsorbed quantity from the chromatogram. (2) Langmuir plot for the data shown in (1).
the reduced cobalt/kieselguhr catalyst was determined at 40°C in a volumetric appara- tus. Figure la shows the isotherm for a sample of solid 6, where the respective curves correspond to the total adsorbed quantity obtained volumetrically (n,) and calculated from the area under the TPD chromatogram (n,). The curves coincide for low values of the equilibrium pressure, P, but not for high values. The P/I/,,, vs P plot for the n, isotherm is shown in Fig. lb, showing adherence to the Langmuir equation below 100 Torr. The monolayer value, V,, obtained using a least squares treatment was 1.47 cm3 (STP) for solid a
and 1.69 cm3 (STP) for solid b. This corre- sponds to 6.6% and 7.3%, respectively, of the total surface area, and provides an es- timate of the cobalt surface.
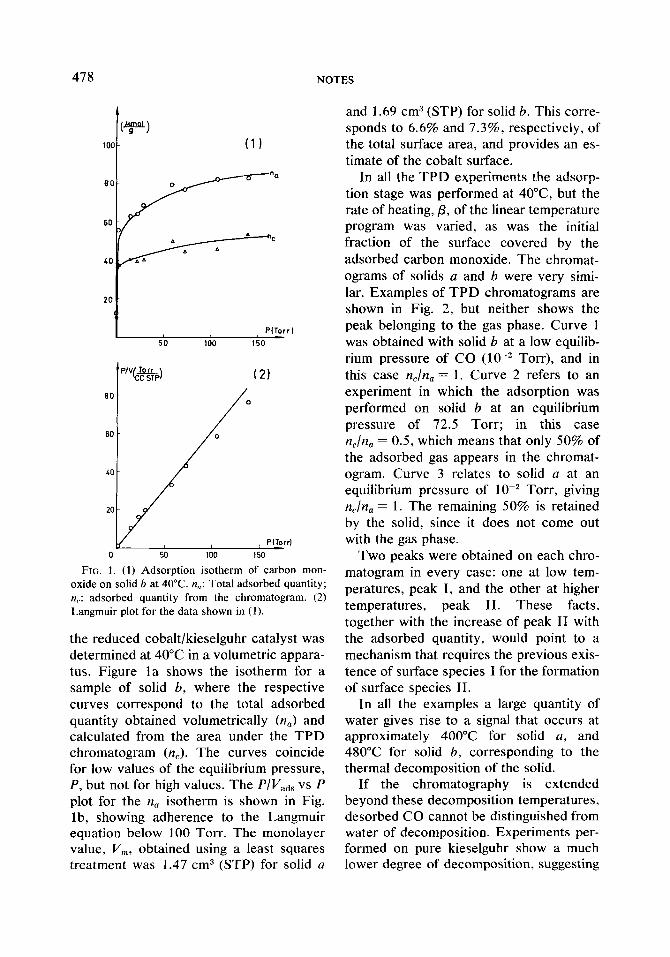
In all the TPD experiments the adsorp- tion stage was performed at 40°C but the rate of heating, /3, of the linear temperature program was varied, as was the initial fraction of the surface covered by the adsorbed carbon monoxide. The chromat- ograms of solids a and b were very simi- lar. Examples of TPD chromatograms are shown in Fig. 2, but neither shows the peak belonging to the gas phase. Curve 1 was obtained with solid b at a low equilib- rium pressure of CO (1O-2 Torr), and in this case n,..n, = 1. Curve 2 refers to an experiment in which the adsorption was performed on solid b at an equilibrium pressure of 72.5 Torr; in this case n,/n, = 0.5, which means that only 50% of the adsorbed gas appears in the chromat- ogram. Curve 3 relates to solid a at an equilibrium pressure of 1O-2 Tori-, giving n,/n, = 1. The remaining 50% is retained by the solid, since it does not come out with the gas phase.
Two peaks were obtained on each chro- matogram in every case: one at low tem- peratures, peak I, and the other at higher temperatures, peak II. These facts, together with the increase of peak II with the adsorbed quantity, would point to a mechanism that requires the previous exis- tence of surface species I for the formation of surface species II.
In all the examples a large quantity of water gives rise to a signal that occurs at approximately 400°C for solid a, and 480°C for solid b, corresponding to the thermal decomposition of the solid.
If the chromatography is extended beyond these decomposition temperatures, desorbed CO cannot be distinguished from water of decomposition. Experiments per- formed on pure kieselguhr show a much lower degree of decomposition, suggesting
NOTES 479
I LOO
TomperaturelOCl FIG. 2. TPD chromatograms. (1) Solid h, n, = 76.5 (pmol/g) /3 = 19.6 (“Clmin); (2) solid b, n, = 11.8
(pmol/g) p = 22.9 (“C/min); (3) solid (1, n,, = 11.7 (pmol/g) /3 = 18.3 (Wmin); (4) blank.
that kieselguhr undergoes some change during the catalyst preparation. Some blanks were run by heating the solids without having them previously adsorb CO, and the same peak was obtained, in addition to a very small one for water at about 350°C in the region of the high tem- perature peak in the TPD experiments. The latter is shown with a broken line in the chromatogram for solid b in Fig. 2.
In order to test the influence of the re- duction temperature of the solid, some experiments were performed on this at 380°C. Within the accuracy of our experi- ments, no differences were observed in the chromatograms, except for the decomposi-
tion temperature, which was higher than that for the solid reduced at 300°C. Ad- sorption experiments performed on pure kieselguhr showed that CO is not adsorbed on the support.
It would seem reasonable to assume that species 1 are linear forms of CO adsorbed on cobalt, while species II are bridged forms, although infrared examination of the adsorbed phase should lead to a direct confirmation of this assumption. These structures have been suggested in the liter- ature on the basis of the infrared spectra of CO adsorbed on metals (10-12).
A mathematical analysis of the desorp- tion chromatogram allows one to obtain
480 NOTES
the following simple analytic expression for the case of linear heating, first order desorption, homogeneous surface, and a sufficiently high flow rate of the carrier gas to prevent readsorption (3):
(2 log Tm - log P)
where p is the heating rate, Ed the activa- tion energy of desorption, R the gas con- stant, A the rate constant of desorption, and T, the temperature of the peak max- imum.
By measuring T, in experiments per- formed at different heating rates /I, it is possible to plot (2 log T, - log j?) against l/T, to obtain straight lines from whose slopes either Ed or AH, can be calculated depending on whether the process takes place without or with readsorption. Since
in systems such as the ones under consid- eration equilibrium is reached rapidly, it can be assumed that adsorption is nonac- tivated (E, = 0) (6), and the heat of ad- sorption can be obtained from the slope (Ed =-AH,).
One way of avoiding readsorption is to make sure that T, is the same for different flow rates of the carried gas. In our case a flow rate of 19 cmYmin of He was used, and it was observed that when this rate, F, was increased, the value of T, varied slightly, showing that the value of A calculated from Eq. (1) must be taken as an approximation; fortunately this varia- tion does not happen with the heat of ad- sorption.
We have already seen that two peaks ap- pear in the chromatograms in all cases. It is not possible to obtain good straight lines when Eq. (1) was plotted for peak II, but
3.6 I I I I l/Tpld 2.lL 2.16 2.22 2.2 6 2.30 2.34
16
t
Solid (al l
Solid I b) 0
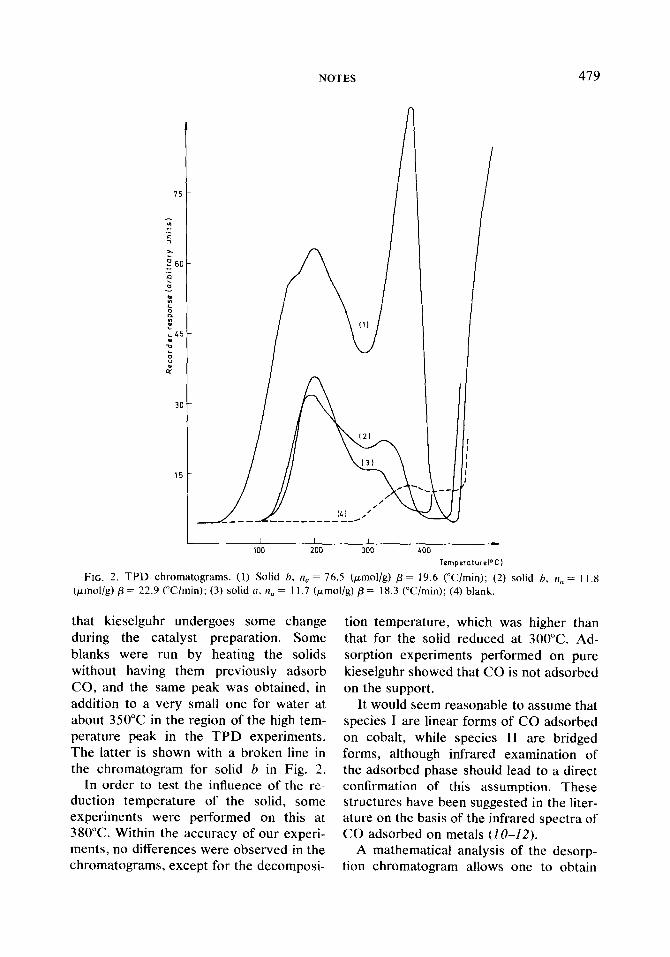
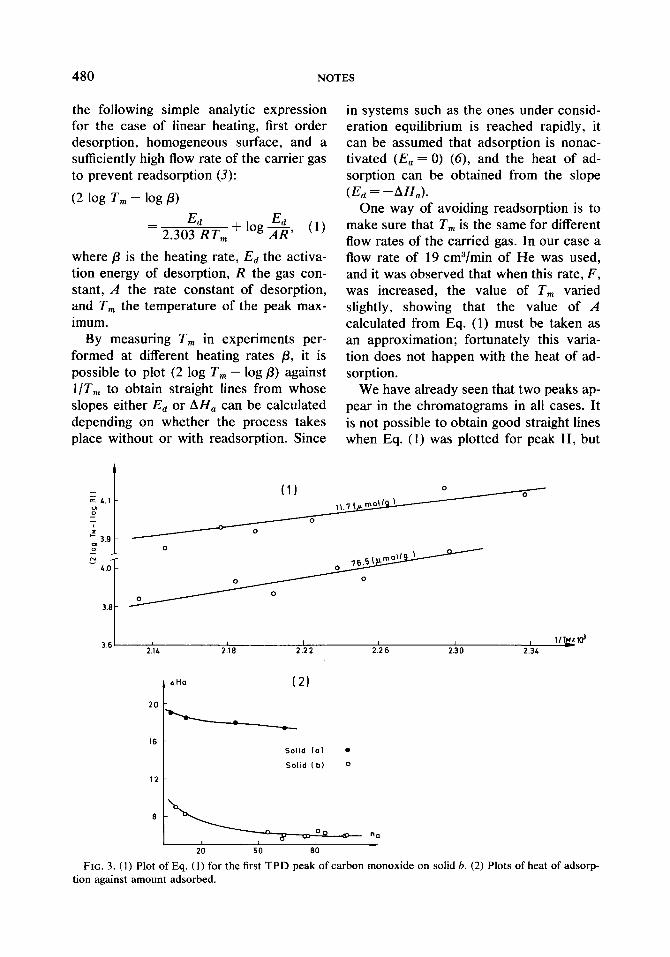
FIG. 3. (1) Plot of Eq. (1) for the first TPD peak of carbon monoxide on solid b. (2) Plots of heat of adsorp tion against amount adsorbed.
NOTES 481
this was always possible with peak I. Fig- ure 3a shows the straight line plots for peak I and for adsorbed amounts of 11.7 and 76.5 pmol/g, respectively, for solid b. The values of p were between 12 and 35”C/min, and from a least squares fit of the plots values of 8.3 and 5.9 kcal/mol, respectively, are obtained for AH,. In Fig. 3b AH, is plotted against n,. The values just given provide two points of the curve for solid b; the other points were obtained from experiments performed with different adsorbed quantities. The sites seem to be quite homogeneous, except in the region of very low equilibrium pressures, AH,, which had values up to six times larger than the heat of liquefaction of CO, was much smaller for solid b than for solid a, where at an equilibrium pressure of IO-* Torr and 11.8 pmol/g adsorbed, a heat of adsorption of 18.6 kcal/mol is obtained. For solid a the sites that should corre- spond to peak I are also quite homoge- neous because AH,, which has a value of 19 kcal/mol for n, = 3.4 pmol/g, decreases only to 17.5 kcal/mol for rz, = 64.4 pmol/g, retaining always values more than ten times larger than the heat of liquefac- tion of CO.
Hayward and Trapnell (9), who made experimental determinations of the BET constant c, have established 6 kcal/mol as the upper limit for the heat of physisorp- tion of CO, so that a larger value should be an indication of chemisorption. If this cri- terion is valid, it indicates chemisorption in our experiments, though in the case of solid b the heat for the peak I adsorption at high coverage is close to the physisorp- tion limit.
At this stage it has not been possible to suggest a reasonable explanation for the differences found between the results for solids LI and b, although the study of this
problem constitutes, in our opinion, the most interesting aspect in continuing this work.
ACKNOWLEDGMENTS
Thanks are due to Dr. J. M. Smith for his interest in this work and for supplying the materials, and to Professor Samy Atala who determined the ir spectra.
I.
2.
3.
4.
5.
6.
7.
8. 9.
10.
Il.
REFERENCES
Amenomiya, Y., and Cvetanovic. R. J., J. Phys. Chem. 67, 144 (1963).
Amenomiya, Y., and Cvetanovid, R. J., J. Phys. Chem. 68, 52 (1964).
Cvetanovic, R. J., and Amenomiya, Y., in “Ad- vances in Catalysis” (D. D. Eley, H. Pines and P. B. Weisz, Eds.). Vol. 17, p. 103. Academic Press, New York, 1967.
Kondo, J., Uchijima, T., and Yoneda, Y., Bull. Chem. Sot. Jap. 40, 1040 (1967).
Rivin, D., and Illinger, H. L., J. Colloid Inferface Sci. 31, 85 (1969).
Adrian, J. C., and Smith, J. M., J. Caral. 18, 57 (1970).
Kokes, R. J., J. Amer. Chem. Sot. 82, 3018 (1960).
Smith, J. M., private communication. Hayward, D. O., and Trapnell, B. M. W.,
“Chemisorption.” Butterworth, London, 1964. Eischens, R. P., Francis, S. A., and Pliskin,
W. A.,J. Phys. Chem. 60, 194 (1956). Eischens, R. P., and Pliskin, W. A., in “Ad-
vances in Catalysis” (D. D. Eley, W. G. Frankenburg, V. 1. Komarewsky and P. B. Weisz, Eds.), Vol. 10, p. 1. Academic Press, New York, 1958.
12. Guerra, C. R., and Schulman, J. H., Surface Sci. 7, 229 (1967).
JOAQUIN CORTES SERCIO DROGUETT
Departamento de Qurmica Facultad de Ciencias Fkcas y Matemriticas Universidad de Chile Santiago, Chile
Received September 5, 1973; revised October 7, I974