Embed Size (px)
Citation preview
UV-Raman Spectroscopy, X-ray Photoelectron Spectroscopy, and Temperature Programmed Desorption Studies of Model and Bulk Heterogeneous Catalysts
by
Craig Richmond Tewell
B.S. (North Carolina State University) 1994 B.S. (North Carolina State University) 1995
A dissertation submitted in partial satisfaction of the requirements for the degree of
Doctor of Philosophy
in
Chemistry
in the
GRADUATE DIVISION
of the
UNIVERSITY of CALIFORNIA, BERKELEY
Committee in Charge:
Professor Gabor A. Somorjai, Chair Professor Adam Arkin
Professor Roya Maboudian
Fall 2002
1
Abstract
UV-Raman Spectroscopy, X-ray Photoelectron Spectroscopy, and
Temperature Programmed Desorption Studies of Model and Bulk
Heterogeneous Catalysts
by
Craig Richmond Tewell
Doctor of Philosophy in Chemistry
University of California, Berkeley
Professor Gabor A. Somorjai, Chair
X-ray photoelectron spectroscopy (XPS) and Temperature Programmed
Desorption (TPD) have been used to investigate the surface structure of model
heterogeneous catalysts in ultra-high vacuum (UHV). UV-Raman spectroscopy has
been used to probe the structure of bulk model catalysts in ambient and reaction
conditions. The structural information obtained through UV-Raman spectroscopy has
been correlated with both the UHV surface analysis and reaction results.
The present day propylene and ethylene polymerization catalysts (Ziegler-Natta
catalysts) are prepared by deposition of TiCl4 and a Al(Et)3 co-catalyst on a
microporous Mg-ethoxide support that is prepared from MgCl2 and ethanol. A model
thin film catalyst is prepared by depositing metallic Mg on a Au foil in a UHV chamber
in a background of TiCl4 in the gas phase. XPS results indicate that the Mg is
completely oxidized to MgCl2 by TiCl4 resulting in a thin film of MgCl2/TiClx, where x
2
= 2, 3, and 4. To prepare an active catalyst, the thin film of MgCl2/TiClx on Au foil is
enclosed in a high pressure cell contained within the UHV chamber and exposed to ~1
Torr of Al(Et)3.
TPD of physisorbed mesitylene molecules has been used as a nondestructive
surface probe to distinguish the surface adsorption sites of this model Ziegler-Natta
polymerization catalyst. The mesitylene TPD probe revealed two types of surface
adsorption sites. The dominant site was attributed to the basal plane of these halide
crystallites. Other sites present in lower concentration could be attributed to a defect
structure at the basal plane boundaries with other crystal planes. Due to the chlorine
termination of the catalyst surface, the metal ions under the chlorine layer could not be
differentiated directly with the physisorbed mesitylene molecules. However, the
mesitylene TPD profile was able to monitor compositional changes in the outermost
chlorine layer accompanying a) the reaction of the catalyst film with the
triethylaluminum cocatalysts, b) electron beam irradiation of the film surface, and c)
diffusion of bulk chlorine to the surface to minimize the number of defect sites.
Microporous samples of Mg-ethoxide Ziegler-Natta catalyst supports were made
from MgCl2 and ethanol. Samples with an ethanol-to-MgCl2 molar ratio (x) from 0.47
to 6 were studied by UV-Raman spectroscopy. These studies indicate the breaking of
Mg-Cl bonds at molar ratios > 2. At x = 6, the octahedral coordination of the Mg2+ ion
has been completely replaced by octahedral coordination of the oxygen atoms from the
ethanol molecules. It is suggested that the presence of the peak at 683 cm-1 may be
attributed to the totally symmetric breathing mode of Mg-O octahedra, reinforcing the
structure analysis of MgCl2(C2H5OH)6. The Raman shift of the O-H stretch shifts in the
3
3230-3480 cm-1 range as the C2H5OH to MgCl2 molar ratio is altered and thus, it can be
used to monitor the MgCl2(C2H5OH)x composition. This correlation is used to follow
the dealcoholation of an industrial sample of a Ziegler-Natta support.
The structure of Co-Mo catalysts supported on commercial silica, doped with
various amount of sodium ions, was investigated by means of X-ray diffraction (XRD),
UV-Raman spectroscopy and XPS. Samples prepared by two different methods were
investigated. One set of samples was prepared by classic incipient wet impregnation
(WI) and the other by co-impregnation in the presence of nitrilotriacetic acid (NTA).
UV-Raman spectroscopic results indicated that sodium effected these two series of
catalysts differently. In the case of the WI prepared catalysts, sodium promoted a
transformation of polymolybdate species into monomolybdate Na2MoO4. In the case of
the NTA prepared samples, sodium did not form the Na2MoO4 compound, but still
induced transformation from heptamolybdates, Mo2O7 2- and mixed CoMo oxides into
MoO42- units with distorted tetrahedral symmetry. As indicated by Mo 3d and Co 2p
XPS binding energy shifts, in addition to purely structural modifications, sodium
induced an electronic effect in the WI samples. The hydrodesulfurization (HDS)
catalytic behavior of the samples was explained in terms of the observed structural and
electronic changes.
With the success of applying UV-Raman spectroscopy to studying the structure
of two different heterogeneous catalysts, an attempt was made to extend the use of this
technique to study surface adsorbates on industrial catalyst in situ. Two reactions were
studied: Cyclohexene hydrogenation / dehydrogenation on a 0.9 wt% Pt / γ-Al2O3
catalyst and ethylene hydrogenation on a 5 wt% Pt / γ-Al2O3 catalyst. No Raman
4
features where observed due to either the amorphous alumina support or hydrocarbon
fragments on the surface during the cyclohexene reaction experiments. One very broad
peak from 2750 to 3250 cm-1 was observed during one ethylene hydrogenation
experiment. The broadness of the peak indicates a wide distribution of ethylene
fragments on the surface and no correlation between this peak and the reaction kinetics
could be drawn. UV-Raman spectroscopy results for mesoporous silica (MCM-41)
supported nanoparticle catalysts indicate the need for a crystalline support to detect
Raman features for the catalyst. A crystalline support may induce better ordering of
surface reaction species and may facilitate interpretation of UV-Raman spectroscopic
observations.

i
Dedicated to Elise
ii
Table of Contents
List of Figures v List of Tables vii
Acknowledgements viii
Chapter 1 Introduction 1 Chapter 2 Experimental Techniques 2.1 UV-Raman Spectroscopy and Experimental Setup 5 2.1.1 Introduction to Normal Raman Spectroscopy 5 2.1.2 Theoretical Origin of Light Scattering by Molecules 6 2.1.3 Motivation for UV-Raman 9 2.1.4 95-SHG Lexel Laser 12 2.1.5 Acquiring a Raman Spectrum 13 2.1.6 Catalytic Reactors for UV-Raman Spectroscopy 16 2.2 Surface Science Techniques and Experimental Setup 18 2.2.1 Ultra High Vacuum (UHV) 18 2.2.2 X-ray Photoelectron Spectroscopy (XPS) 20 2.2.3 Temperature Programmed Desorption (TPD) 22 2.3 References 24 Chapter 3 Surface Characterization of the TiClx/MgCl2 Model Ziegler-
Natta Polymerization Catalysts: Adsorption Site Studies Using Mesitylene Thermal Desorption
3.1 Introduction 41 3.2 Experimental Section 44 3.3 Results and Discussion 46 3.3.1 Identification of Surface Adsorption Sites 46 3.3.2 Catalyst Activation and Propylene Polymerization 50
3.3.3 Surface Modification: Diffusion of Bulk Chlorine to the Surface 53
3.3.4 Implications to the Catalyst Preparation and Polymerization 57
3.4 Conclusions 58 3.5 References 59
iii
Chapter 4 Characterization and in situ Monitoring of Model Industrial Ziegler-Natta Catalytic Support Materials Using Ultraviolet-
Raman Spectroscopy 4.1 Introduction 69 4.2 Experimental 70
4.3 Results and Discussion 4.3.1 Characterization of Model Mg-ethoxide Ziegler-Natta
Support Materials 72 4.3.2 In situ Monitoring of an Industrial Mg-ethoxide Ziegler-
Natta Support Material During Dealcoholation 75 4.4 Conclusions 77 4.5 References 79 Chapter 5 Structural Characterization of Silica Supported CoMo
Catalysts by UV-Raman, XPS, and X-ray Diffraction Techniques
5.1 Introduction 96 5.2 Experimental
5.2.1 Catalyst Preparation 98 5.2.2 X-ray Diffraction 99 5.2.3 BET Analysis 99 5.2.4 X-ray Photoelectron Spectroscopy (XPS) 99 5.2.5 UV-Raman Spectroscopy 100
5.3 Results 5.3.1 BET and PZC 101 5.3.2 XRD Results 102 5.3.3 UV-Raman Results 102 5.3.4 XPS Results 104
5.4 Discussion 5.4.1 WI Samples 106 5.4.2 NTA Samples 108 5.5 Conclusions 109 5.6 Reference 110
Chapter 6 In situ UV-Raman Spectroscopic Studies of Hydrocarbon Catalysis on Platinum-Alumina Catalysts 6.1 Introduction 124
6.2 Experimental 6.2.1 Pt/γ-Al2O3 Industrial Catalysts 125 6.2.2 Experimental Setup 126
6.3 Results 6.3.1 Ethylene Hydrogenation over 5 wt% Pt/γ-Al2O3 126 6.3.2 Cyclohexene Disproportionation over 0.9 wt%
Pt/γ-Al2O3 126

iv
6.3.3 UV-Raman spectral of crystalline zeolites and mesoporous silica (MCM-41) nanoparticle catalyst samples 127
6.4 Conclusions 128 6.5 References 130 Chapter 7 Summary 139
v
List of Figures Figure 2.1 Simplified molecular orbital depiction of fluorescence process 29 Figure 2.2 Comparison of Visible and UV-Raman spectra of Al2O3·3H2O 30 Figure 2.3 95-SHG Laser Cavity 31 Figure 2.4 SPEX 1877 Triplemate Spectrometer 32 Figure 2.5 SPEX 1877 Triplemate Control Panel 33 Figure 2.6 Glass packed bed UV-Raman reactor 34 Figure 2.7 Stainless steel fluidized bed UV-Raman reactor 35 Figure 2.8 Photo of fluidized bed UV-Raman reactor with electromagnetic shaker 36 Figure 2.9 Pyridine adsorption on ZSM-5 zeolite in both the fluidized bed and packed bed reactors 37 Figure 2.10 UHV chamber employed for the study of model UHV Ziegler- Natta catalyst 38 Figure 2.11 Depiction of the XPS process for carbon 1s core electron 39 Figure 2.12 Depiction of a temperature programmed desorption (TPD) experiment 40 Figure 3.1 Mesitylene TPD for (a) the TiClx/MgCl2 film and (b) the MgCl2 reference film 64 Figure 3.2 XPS and mesitylene TPD for the model Zielger-Natta catalyst:
(a) as-deposited TiClx/MgCl2 film; (b) after catalyst activation; (c) after 20 min polymerization 65
Figure 3.3 Mesitylene TPD after annealing the TiClx/MgCl2 film at 640 K 66 Figure 3.4 Effect of post-deposition electron irraciation on 0.2 L mesitylene TPD for the TiClx/MgCl2 film 67 Figure 3.5 Mesitylene TPD (0.2 L) for the TiClx/MgCl2 film (a) before and after Mg doses of (b) 0.5 ML and (c) 1.5 ML 68 Figure 4.1 XRD patter of α-MgCl2 82 Figure 4.2 XRD of MgCl2(C2H5OH)6 (a) as synthesized and (b) reference spectrum 83 Figure 4.3 Experimental UV-Raman setup 84 Figure 4.4 UV-Raman spectra of powdered MgCl2, MgCl2(C2H5OH)x adducts and liquid ethanol 85 Figure 4.5 Intensity of Mg-O octahedral stretch at 683 cm-1 86 Figure 4.6 Normal modes of octahedral molecules 87 Figure 4.7 Totally symmetric “breathing mode” (Alg) of an octahedral molecule 88 Figure 4.8 Identification of 683 cm-1 peak 89 Figure 4.9 UV-Raman spectra of powdered MgCl2(C2H5OH)x adducts and liquid ethanol 90 Figure 4.10 O-H peak Raman shift for MgCl2(C2H5OH)x adducts shown as a function of ethanol to MgCl2 molar ratio, x 91 Figure 4.11 UV-Raman spectra of 42 wt% EtOH industrial Mg-ethoxide
support: Data acquired in packed bed UV-Raman reactor 92
vi
Figure 4.12 UV-Raman spectra of 42 wt% EtOH industrial Mg-ethoxide support: Data acquired in fluidized bed UV-Raman reactor 93
Figure 4.13 Dealcoholation of 42 wt% EtOH industrial Mg-ethoxide support: (a) Raman shift, cm-1 and relative intensity vs. time and (b) mole fraction, x, and relative intensity vs. time for the O-H peak that originated at 3436 cm-1 at t = 10 min 94
Figure 4.14 Dealcoholation of 42 wt% EtOH industrial Mg-ethoxide support: (a) Raman shift, cm-1 and relative intensity vs. time and (b) mole fraction, x, and relative intensity vs. time for the O-H peak that originated at 3337 cm-1 at t = 10 min 95
Figure 5.1 Experimental UV-Raman setup 118 Figure 5.2 X-ray diffraction data for WI samples 119 Figure 5.3 UV-Raman spectra of (a) SilWI, (b) 1NaSilWI, and
(c) 3NaSilWI 120 Figure 5.4 UV-Raman spectra of (a) SilNTA, (b) 1NaSilNTA,
(c) 3NaSilNTA, and (d) 4NaSilNTA 121 Figure 5.5 Mo 3d XPS spectra of the WI samples 122 Figure 5.6 Co 2p XPS spectra of selected WI samples 123 Figure 6.1 UV-Raman reactor and gas chromatography configuration for (a) & (b) inlet gas sampling and (c) & (d) outlet gas sampling 134 Figure 6.2 UV-Raman spectrum during ethylene hydrogenation over 5 wt%
Pt/γ-Al2O3 135 Figure 6.3 UV-Raman spectrum during cyclohexene disproportionation over 0.9 wt% Pt/γ-Al2O3 136 Figure 6.4 UV-Raman spectra of (a) ZSM-5, (b) MOR, (c) Zeolite A, and (d) Zeolite Y 137 Figure 6.5 UV-Raman spectra of mesoporous silica (MCM-41) supported noble metal nanoparticle catalyst samples 138
vii
List of Tables Table 2.1 Wavelength of 10 and 4000 cm-1 Raman shifted photons with three different wavelengths of incident photons 26 Table 2.2 Statistical analysis of wavelength calibration for CCD Detector using cyclohexane 27 Table 2.3 XPS and AES atomic sensitivity factors 28 Table 3.1 Effect of the AlEt3 activation on the Ti oxidation state distribution (%) in the TiClx/MgCl2 film deposited by reaction of Mg with TiCl4 62 Table 3.2 Effect of annealing on the Ti oxidation state distribution in the TiClx/MgCl2 film deposited by reaction of TiCl4 63 Table 5.1 Surface areas, S, of the catalysts determined by BET nitrogen Adsorption 113 Table 5.2 BET surface area (S), point of zero charge (PZC), and sodium content in atomic percent of the pure silica and sodium doped silica supports 114 Table 5.3 XPS binding energy (eV) data for reference compounds 115 Table 5.4 XPS binding energy (eV) data, Co 2p / Si 2p and Mo 3d / Si 2p intensity ratios, and XPS derived Na atomic% for the WI catalysts 116 Table 5.5 XPS binding energy (eV) data, Co 2p / Si 2p and Mo 3d / Si 2p intensity ratios, and XPS derived Na atomic% for the NTA catalysts 117

viii
Acknowledgements The chance to acknowledge my colleagues and friends reminds me how
rewarding it was to know and work with them. Long ago I decided to wait until I had
written my entire dissertation before I would even start writing the acknowledgements.
The writing of the acknowledgements has been a useful carrot dangling before me to
keep my motivation high during the writing process.
First and foremost, I would like to thank Professor Gabor A. Somorjai for his
support, guidance, and motivation during my atypical graduate school path. I am
forever indebted to his patience and understanding as I struggled to decide on a career
and educational path. He has always believed in me—thrusting me into new research
areas and allowing significant latitude to not only learn, but to fail and thus to succeed.
I daresay there is no other advisor with whom I could have had such an incredible
experience.
My time with the Somorjai research group has spanned more than seven years
now. I began my tenure in June 1995. My early UHV mentors and good friends
included Howard Fairbrother, François Reniers, Alex Yoon, Nick Materer, and Pete
Jacobs. I have to especially thank Howard and François who have remained important
colleagues and friends through the years. I am deeply grateful for the chance to work
with and count among my friends Rüdiger Döll, Katja Sperling, Martin Gierer,
Christophe Bulliard, Craig Gerken, and John Jensen. All of these folks greatly extended
my understanding not only of science, but of life, politics, and ironically, after a great
deal of reluctance, foosball. The irony will become evident. I would be remiss if I did
not mention the help from the other members of the research group at the time: Paul

ix
Cremer, Fabio Ribeiro, Renee Minick, Gunther Rupprechter, Xingcai Su, David
Gracias, and Michael Yang.
When I began working with Enrico Magni in 1996, I realized that the universe
could be explained from the seemingly simple equation, V = IR. I am indebted to him
for his mentoring, vision, and enthusiasm for science. Over the years Enrico has
become much more than a mentor. Both he and his wife, Cristina, are great friends and
trusted advisors. I cannot thank them enough.
My life outside the laboratory during my first two years at Berkeley would not
have been the same had if it were not for Joel Roberts, Cheryl Hawkins, Robin Fulton,
and Chris Caylor. I wish them continued success in their careers wherever they are.
I have to thank Exxon Research and Engineering Company for giving me a
chance to extend my experiences during my two and a half year break from graduate
school. I have to thank some current and former employees of Exxon for encouraging
me to quit and return to Berkeley: Richard Madrid, Chris and Sarah Wall, Yunaima
Hernandez, Scott Hagstrom, Mark Andreacci, Giselle Larish, Don Gardner, Hansie
Mathelier, and Monica Arboleda.
During some rough times I often relied on my own personal cheerleaders who
have and continue to provide unconditional support and friendship. It is said that it is
rare to have more than one true friend. I am lucky to have six. Kristi Goettinger, Laura
Linton, Angela Gasior, Catherine Harvey, Maria McDonald Freeman, and Joanna Perry
thank you! I deeply appreciate the support from Patrick Heinrich, BradTad Nishida,
Nathan Sutton, Jon Butzke, Veronica Godfrey, Dana and Kate Lynch, Stacie Moon,
Jennifer King, Sameer Damre, and Erin Chervenak.
x
It was difficult to return to graduate school after a two and a half year break.
Saskia Hoffer deserves special recognition in my acknowledgements. She has been an
amazing friend to me and especially to Elise. Saskia was always there as a confidant,
an extra pair of hands, a carpool partner, a dissertation writing partner, and most
recently an ambassador to Los Alamos. We did it!
Jessica Parker Gaughn, too, was a trusted confidant and an always willing extra
pair of hands. She helped me through the qualifying process and I hope I returned the
favor. I wish her continued success in research and I regret that I will not be in
Berkeley to see her graduate.
If it were not for the less visible efforts of Learr English, Sue Yoshioka, Davina
Abram, Joel Ager, and especially Inger Coble, this disseration would not have been
possible. I am also indebted to Seong Kim, Steve Baldelli, Bénédicte and Gilles
Mailhot, and Keng Chou. David Tang deserves special mention for reviewing my
dissertation for mistakes. Thank you all.
A l'ami j'ai connu le plus long, Hélène Huchette Desmarault, et ses parents...je
vous remercie.
Although my family has not always understood the path my career has taken,
they have always been supportive. Even though graduate school has increased the
geographical distance between my parents, Terry and Ruth, and my sister, Julie, it has,
in many ways, brought us closer. I am grateful for their love and understanding. I am
lucky to have had the continued support and love of my two grandmothers, Anna
Richmond and Betty Louise Tewell, through most of graduate school. My

xi
grandmother, Louise, was one of my greatest cheerleaders. I wish she were here to see
me complete my Ph.D.
During my two and a half years of indecision at Exxon Research and
Engineering in Florham Park, NJ, my reluctantly acquired foosball skills gave me the
greatest gift of my life. An improbable meeting at a foosball table introduced me to my
future wife, Elise Custy. She is the greatest cheerleader, friend, advisor, and confidant.
I am not sure if graduate school was more of a challenge for me or for Elise. I thank her
for her patience. With the love and support of Elise came the added bonus of her
family, Ed, Barbara, John, Joe, Mary, Chris, Evan, David, Mary Jane, Andrew, Peter,
Jayna, Mike, and Thelma.
This work was supported by the Director, Office of Science, Office of Basic
Energy Sciences, Division of Materials Sciences and Engineering, of the U.S.
Department of Energy under Contract No. DE-AC03-76SF00098.
Chapter 1
Introduction
The present scientific frontier in the field of heterogeneous catalysis is
understanding and controlling reaction selectivity. To achieve this goal, knowledge
must be gained about the structure of the catalyst and the nature of the surface species in
situ, that is, under reaction conditions. Surface science has provided a great deal of
insight into catalysis through ex situ studies of model catalysts. Even today on the
cutting edge of catalysis research, traditional surface science studies permit an essential
starting point of scientific investigation. However, new techniques and approaches are
necessary to complement traditional surface science studies with in situ information.
Photon in / photon out techniques have the capability of probing both model and
industrial catalysts in situ and ex situ. Vibrational spectroscopies are perhaps the most
important of these techniques due to the highly specific molecular-level information
obtained. The choice of which particular vibrational technique to use is dictated by
careful consideration of the catalytic system. The interaction of the probe and collected
photons with both the catalyst and the reaction media must be well understood.
The vibrational spectroscopic technique to probe heterogeneous catalysts
important to the petrochemical industrial must meet several important criteria. The
reactions are generally conducted in a dense gas phase of organic molecules with a bed
of catalyst at temperatures ranging from 25 to 500oC. The catalyst is usually an active
metal (e.g., Pt, Pd, Rh, Mo, Co, Ni, Cu, Ag) dispersed on a metal oxide support (e.g.,
2
Al2O3, CeO2, TiO2). These conditions almost immediately preclude using infrared (IR)
photons as an in situ probe for several reasons: (1) attenuation of the incident photon by
the gas phase organic molecules, (2) detection interference from blackbody radiation
emitted by the high temperature catalyst bed, and (3) the attenuation of the incident
photons below 1200 cm-1 from the strong absorption due to the highly ionic metal-
oxygen bonds of the support. To overcome these difficulties the photon in and photon
out must be in a different part of the electromagnetic spectrum. Since Raman
spectroscopy is an energy loss rather than absorption technique, the photon in (and
therefore photon out) can be chosen to be compatible with a particular catalytic system.
As with all techniques, Raman spectroscopy is not without its challenges. The
Raman scattering process is notably weak. This weakness not only requires an intense
source of incident photons, but the detection of the photon out often competes with
other photophysical processes such as Rayleigh scattering, fluorescence, and
phosphorescence. Early application of Raman spectroscopy to heterogeneous catalysis
was hampered by the lack of highly intense, monochromatic incident photon sources.
With the advent of continuous-wave noble gas ion lasers, this problem was overcome.
However, these lasers provide photons in the visible region only. Surface hydroxyl
groups commonly found on the metal oxide supports and trace organic contaminants
fluoresce quite strongly in the visible.1 The fluorescence spectrum overlaps with and
overwhelms the much weaker Raman spectrum.
With newer generation of laser instruments2, Asher and Johnson report a new
approach to measuring the unenhanced Raman spectrum of samples known to fluoresce
strongly in the visible.3 Using a laser wavelength in the ultraviolet, the Raman
3
spectrum can be collected without interference from the fluorescence that is still
occurring in the visible.
This approach to Raman spectroscopy is emulated and extended in the work
presented in this dissertation. A detailed description of Raman spectroscopy and the
other experimental techniques used is given in Chapter 2. A portion of recent extensive
ex situ studies of model propylene and ethylene polymerization catalysts (Ziegler-Natta
catalysts) is discussed in Chapter 3.4,5 A UV-Raman spectroscopic investigation of the
structure of a bulk Ziegler-Natta catalyst support material6 and an in situ study is
presented in Chapter 4. Results of a UV-Raman and X-ray photoelectron spectroscopic
study of the structural differences between two preparation methods for
hydrodesulfurization catalysts are given in Chapter 5.7 Finally, in Chapter 6 results of
an attempt to monitor surface hydrocarbon fragments on an industrial reforming
catalysts (Pt supported on γ-Al2O3) during reaction are presented.
4
References
(1) Koningstein, J. A.; Gachter, B. F. J. Opt. Soc. Am. 1973, 63, 892. (2) Asher, S. A.; Johnson, C. R.; Murtaugh, J. Rev. Sci. Instrum. 1983, 54, 1657. (3) Asher, S. A.; Johnson, C. R. Science 1984, 225, 311. (4) Kim, S. H.; Tewell, C. R.; Somorjai, G. A. Langmuir 2000, 16, 9414. (5) Kim, S. H.; Tewell, C. R.; Somorjai, G. A. Korean J Chem Eng 2002, 19 (1), 1. (6) Tewell, C. R.; Malizia, F.; Ager, J. W.; Somorjai, G. A. J. Phys. Chem. B 2002,
106, 2946. (7) Parola, V. L.; Deganello, G.; Tewell, C. R.; Venezia, A. M. Applied Catalysis
A:General 2002, in press.
Chapter 2
Experimental Techniques Section 2.1 UV-Raman Spectroscopy and Experimental Setup
Section 2.1.1 Introduction to Normal Raman Spectroscopy Raman
spectroscopy is a technique that provides molecular-level information by analyzing the
light scattered from molecules subjected to illumination by a monochromatic source of
photons. Upon collision with a molecule, a photon, hνo, can be scattered elastically or
inelastically. The elastically scattered photons are referred to as Rayleigh or classical
scattering. The inelastically scattered photons (hνr) have either lost (Stokes) or gained
(anti-Stokes) energy. The magnitude of the energy lost or gained is reported, not in
energy units, but as a frequency shift, ∆ν, where ∆ν = (νo - νr)/c and the units are in
wave numbers, cm-1. This frequency shift is referred to as the Raman frequency or the
Raman shift.
A Raman shift corresponds to a vibrational or rotational transition of the
molecule. In the case of vibrational modes of organic molecules, the frequency of these
transitions are in the infra-red (IR) region of the electromagnetic (E-M) spectrum. In IR
spectroscopy, these transitions are measured by direct absorption of infra-red photons.
The region of the E-M spectrum where these transitions are observed in Raman
6
spectroscopy is dictated by the wavelength of the illuminating photon. For example, the
wavelength of a Raman photon for a given shift is calculated as follows:
−=
−=−
ro
ro
cmnm
ccmRamanShift
λλνν 11
10, 71 (2.1)
where νo and νr are the frequency of the incident and Raman scattered photon,
respectively, and λo and λr are the wavelength of the incident and Raman scattered
photon in nm, respectively. Solving for λr in (2.1 ):
17
7
,10
10
−−=
cmRamanShifto
r
λ
λ (2.2)
Table 2.1 shows the calculated wavelengths for 10 and 4000 cm-1 Raman shifted
photons with three different wavelengths of incident photons. In absorption
experiments, 10 to 4000 cm-1 always corresponds to 1,000,000 to 2,500 nm.
Raman spectroscopy is not merely a molecular vibration technique that can be
conducted in different spectral regions, although this capability will be shown to be
quite useful in a later section. Scattering and absorption vibrational spectroscopies
differ in mechanism and do not provide identical information. The frequencies of a
Raman spectrum are not necessarily identical to those in an infrared absorption
spectrum. As will be demonstrated in Chapter 4, the molecular vibrational information
provided by the two techniques are different, but complementary.
Section 2.1.2 Theoretical Origin of Light Scattering by Molecules There are
generally three approaches to account for observed light scattering phenomena: (1) a
classical explanation in terms of E-M radiation produced by electric and magnetic
multipoles oscillating with a given frequency induced in the scattering molecule by the
7
electric and magnetic fields of the incident photon; (2) a time-independent quantum
mechanical treatment to calculate transition moment amplitudes or the electric moment
matrix; and (3) a general quantum mechanical treatment using time-dependent
perturbation theory.
(1) The classical approach will not be discussed in this dissertation but can
be found elsewhere.1,2 The mathematics used in developing this treatment are more
straightforward, but the results cannot account for many aspects of light scattering
phenomena.
(2) The induced electric moment matrix, Pnm, for transitions between the
initial state, n, and the final state, m, is defined by the following:
δτψψ∫= nmmn PP * (2.3a)
or using Dirac notation, (2.3a) becomes;
nmmn PP ψψ ||= (2.3b)
where P is the induced dipole moment, ψn and ψm are the time-independent wave
functions of the initial and final states, respectively. In the linear induced dipole
approximation, P, in (2.3a) and (2.3b) be approximated (in first order) by:
oEP ⋅= α (2.4)
where α is the polarizability matrix and Eo is the electric field vector of the incident
photon, hνo. A Taylor series expansion of one element of the polarizability matrix in
terms of the normal coordinates is given by:
( ) ∑ ∑ +
∂∂
∂+
∂
∂+=
k lklk
lk
ijk
ok
ij
oijij QQQQ
QQ ,
2
...21 αα
αα (2.5)
8
where αij is the ijth element of the polarizability tensor, α, and Q is the normal
coordinate of the molecular vibration denoted by the subscripts k and l. To obtain an
expression that qualitatively describes the selection rules for light scattering from
molecules, the first two terms of (2.5) are substituted into (2.4). Then (2.4) is inserted
in (2.3b) to yield:
( )4444 84444 76
44 844 76b
ok
nkm
ok
ij
a
onmoijmn EQQ
EP ∑
∂
∂+= ψψ
αψψα ||| (2.6)
Term a of (2.6) accounts for Rayleigh scattering since it is only non-zero when n = m.
The selection rules of Raman scattering are determined term b of (2.6). By assuming
that the electronic, vibrational, and rotational wavefunctions are separable and that the
vibrational wavefunctions can be approximated by harmonic oscillator wave functions,
the Raman selection rule is m = n ± 1. In addition, at least one normal mode vibration
must have a non-zero polarizability derivative.
(3) By applying time-dependent perturbation theory, the following is
obtained for the induced electric moment matrix:
∑
+
+−
=r
oorm
rmnr
orn
rmnrnm E
MMMMh
Pνννν
1 (2.7)
where h is Planck’s constant, r is any level of a complete set of the unperturbed
molecule, νrm and νrn are the frequencies corresponding to the difference between states
denoted in the subscripts, νo is the frequency of the incident photon, Mnr and Mrm are
the corresponding transition moments using time-independent wavefunctions as
calculated by (2.6) with the appropriate change of subscripts, and Eo is the electric
vector of the incident light. In this expression, the selection rules for Rayleigh and
9
Raman scattering, as discussed previously, are also valid. This expression accounts for
the so-called Resonance Raman effect. When the frequency of the incident photon, νo,
matches the transition frequency, νrn, the first term of (2.7) becomes, in principle,
infinitely large. In practice, a large increase in scattering intensity can be observed,
although only those vibrations that couple to the r ? n transition are enhanced.
Now that (2.7) has been introduced it is possible to briefly discuss the theoretical
intensity of a Raman transition. A simplified expression for the intensity of a Raman
transition, I, is given by:
( ) 24nmro PNII ν∝ (2.8)
where Io is the intensity of the incident laser, N is the number of scatters inside the focal
volume of the laser, the νr is the frequency of the Raman scattered photon (not the
Raman shift), and Pnm is the transition matrix given by (2.7). A more detailed
description can be found elsewhere.1
Section 2.1.3 Motivation for UV-Raman The Raman spectra reported in this
dissertation have been acquired with a UV laser excitation source. The motivation for
using a UV photon source arises from the experimental difficulties from competing
photoluminescent processes frequently encountered when using a visible photon
source.3,4 Visible photons are sufficiently energetic to induce electronic transitions in
many of the inorganic and organic compounds of interest in heterogeneous catalysis.
Once the sample has absorbed a photon, the energy will dissipate through
photoluminescent or photophysical processes. In photophysical processes, the sample’s
vibrational modes are excited and the energy is dissipated through heat. In
10
photoluminescent processes, all or part of the absorbed energy is released as a photon
through fluorescence or phosphorescence. To understand the motivation for choosing a
UV excitation source for Raman scattering experiments, a brief explanation of
photoluminescent processes is necessary. In principle, both fluorescence and
phosphorescence can create the same experimental difficulty and it is not generally
possible to know which of the two processes is occurring during acquisition of a Raman
spectrum. As such, only fluorescence will be discussed. A more rigorous explanation
of fluorescence and phosphorescence can be found elsewhere.4,5
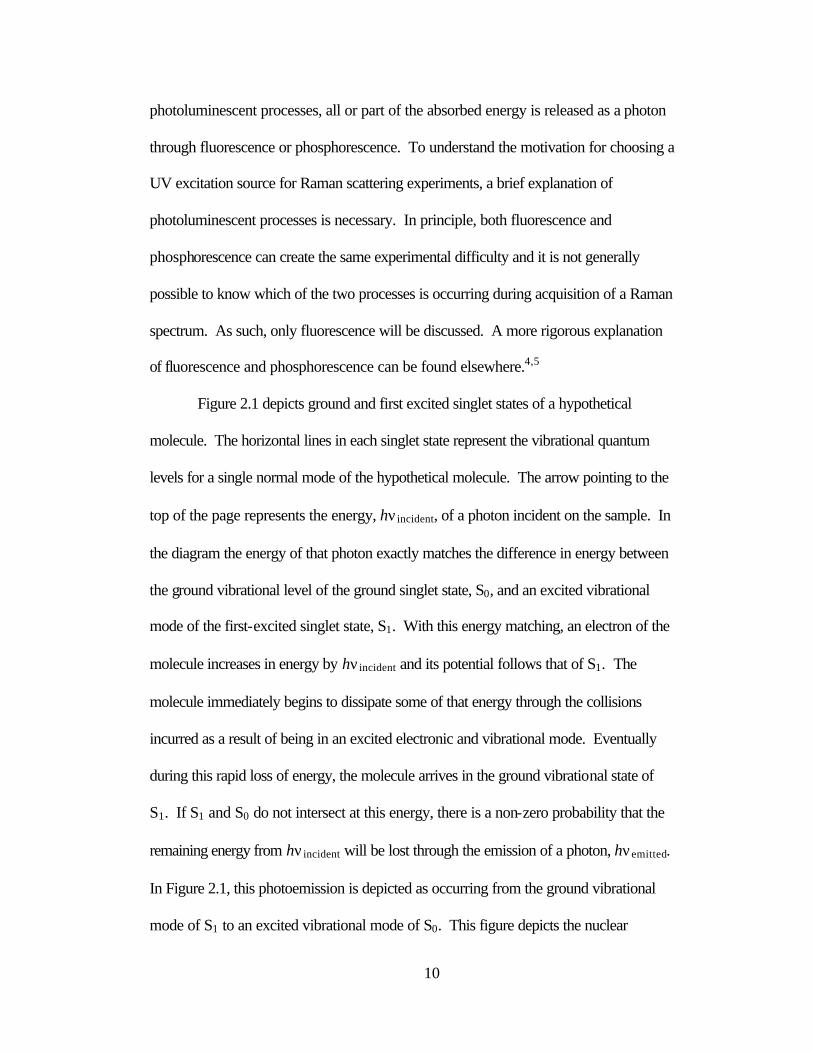
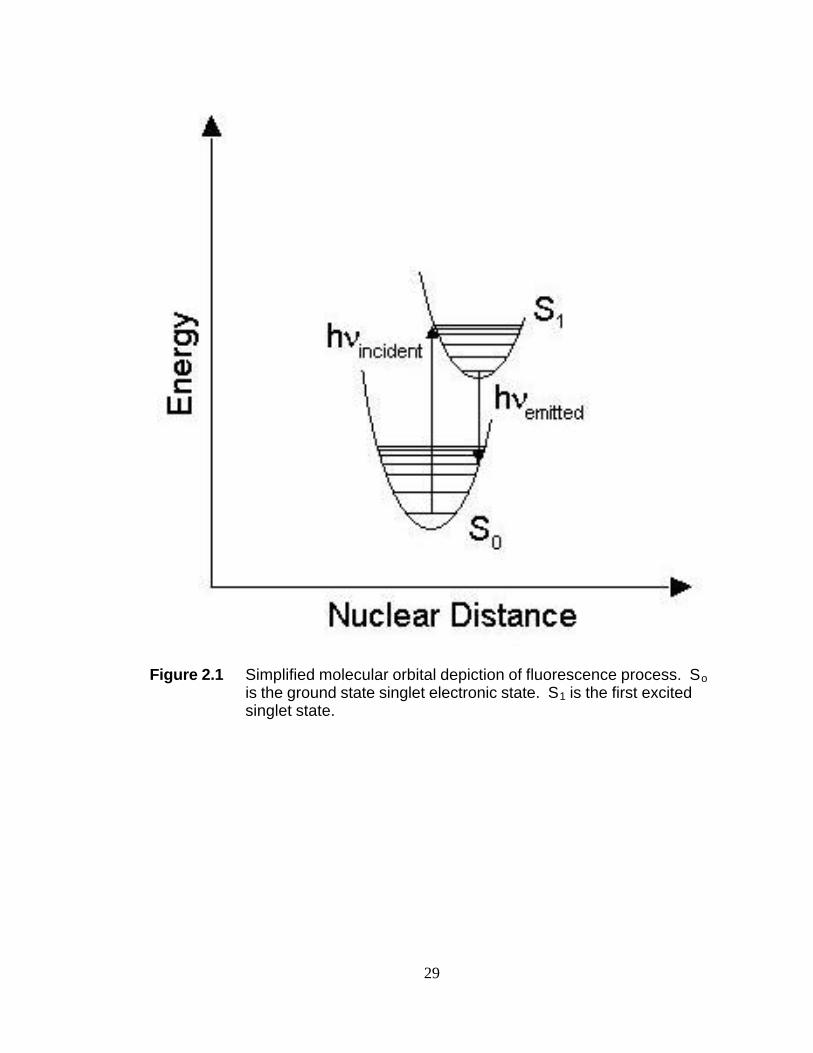
Figure 2.1 depicts ground and first excited singlet states of a hypothetical
molecule. The horizontal lines in each singlet state represent the vibrational quantum
levels for a single normal mode of the hypothetical molecule. The arrow pointing to the
top of the page represents the energy, hνincident, of a photon incident on the sample. In
the diagram the energy of that photon exactly matches the difference in energy between
the ground vibrational level of the ground singlet state, S0, and an excited vibrational
mode of the first-excited singlet state, S1. With this energy matching, an electron of the
molecule increases in energy by hνincident and its potential follows that of S1. The
molecule immediately begins to dissipate some of that energy through the collisions
incurred as a result of being in an excited electronic and vibrational mode. Eventually
during this rapid loss of energy, the molecule arrives in the ground vibrational state of
S1. If S1 and S0 do not intersect at this energy, there is a non-zero probability that the
remaining energy from hνincident will be lost through the emission of a photon, hνemitted.
In Figure 2.1, this photoemission is depicted as occurring from the ground vibrational
mode of S1 to an excited vibrational mode of S0. This figure depicts the nuclear
11
distance in lowest vibrational state of the first-excited electronic state being larger than
the equivalent in the ground electronic state. As a result of this difference in nuclear
distance, hνemitted will be less than hνincident. This loss in energy corresponds to a
lengthening of the wavelength of the emitted photon relative to the absorbed photon.
This change in energy and wavelength is called a Stokes-shift.
Recalling from the introduction to normal Raman spectroscopy, the scattered
photons are also Stokes-shifted. In fact the use of the term Stokes photons in Raman
spectroscopy originates from the study of fluorescence and phosphorescence. The
experimental difficulty arises when the Stokes-shifted fluorescence photons overlap the
Stokes-shifted Raman photons. Typically the fluorescence emission is much more
intense than Raman scattering. Figure 2.1 does not fully explain the observed
fluorescence emission. Only the most probable photoemission is shown. Other
transitions from S1 to different vibrational levels of S0 have non-zero probability. Thus,
a fluorescence spectrum is not discrete but rather broad, owing to the high density of
vibrational levels at the higher energy portion of So.
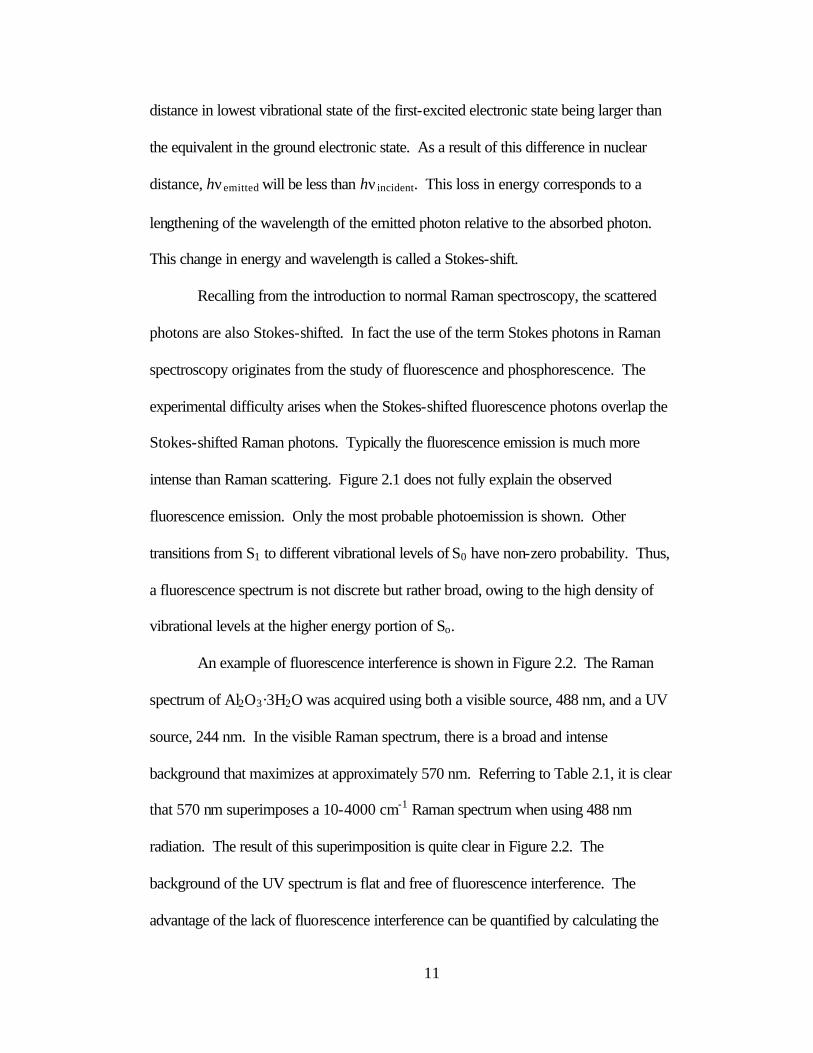
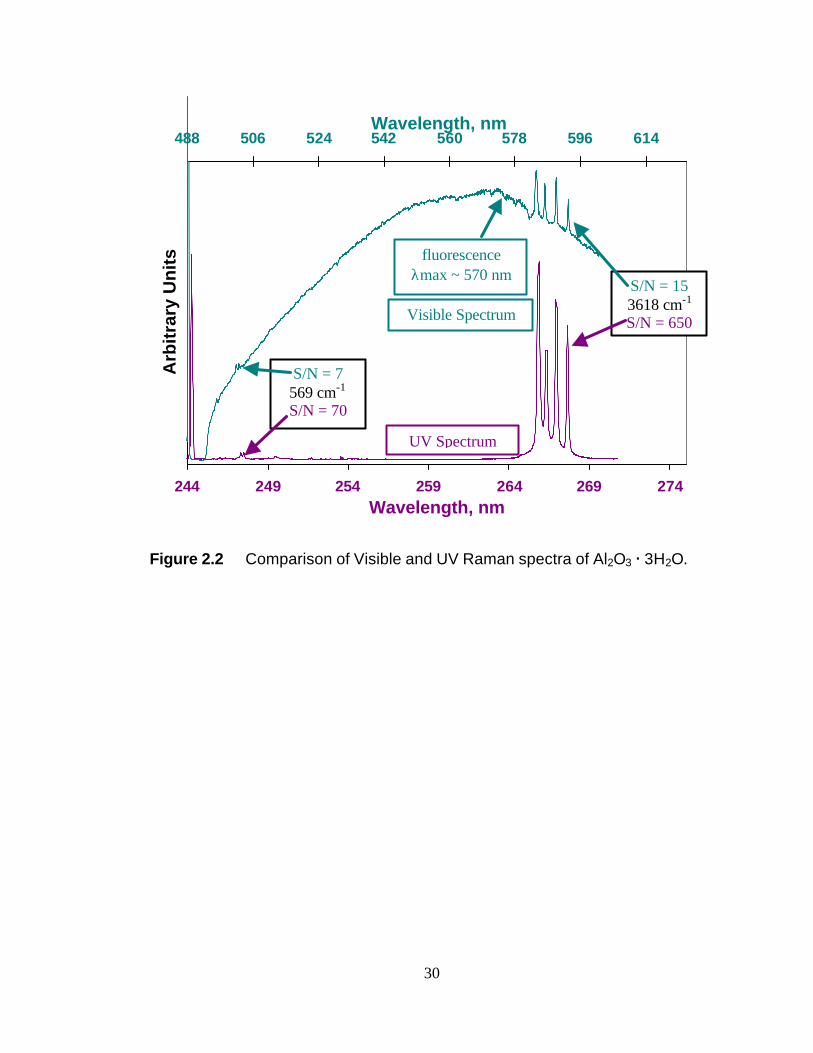
An example of fluorescence interference is shown in Figure 2.2. The Raman
spectrum of Al2O3·3H2O was acquired using both a visible source, 488 nm, and a UV
source, 244 nm. In the visible Raman spectrum, there is a broad and intense
background that maximizes at approximately 570 nm. Referring to Table 2.1, it is clear
that 570 nm superimposes a 10-4000 cm-1 Raman spectrum when using 488 nm
radiation. The result of this superimposition is quite clear in Figure 2.2. The
background of the UV spectrum is flat and free of fluorescence interference. The
advantage of the lack of fluorescence interference can be quantified by calculating the
12
signal-to-noise (S/N) ratio for a given mode in each spectrum. The S/N ratio of the
3618 cm-1 peak is 43 times greater in the UV spectrum than the visible spectrum. At
lower frequency, the 569 cm-1 peak is 10 times greater in the UV spectrum than the
visible spectrum.
It is important to note that the Al2O3·H2O is fluorescing during the acquisition of
both spectra in Figure 2.2. The transition between electronic states that is the source of
fluorescence emission is always the same for a given molecule (S1? S0 in this
hypothetical case). So, unlike Raman scattering, the fluorescence spectrum does not
shift with a change in incident photon energy. The fluorescence maximum is 570 nm
for Al2O3·H2O.
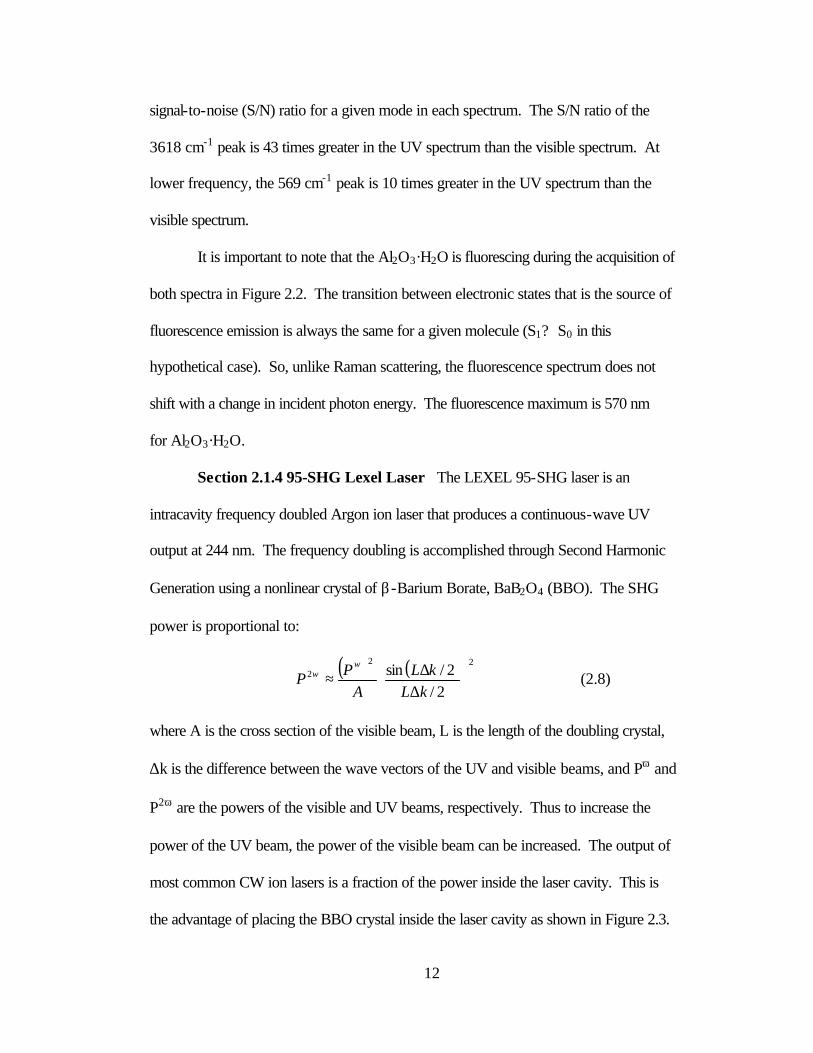
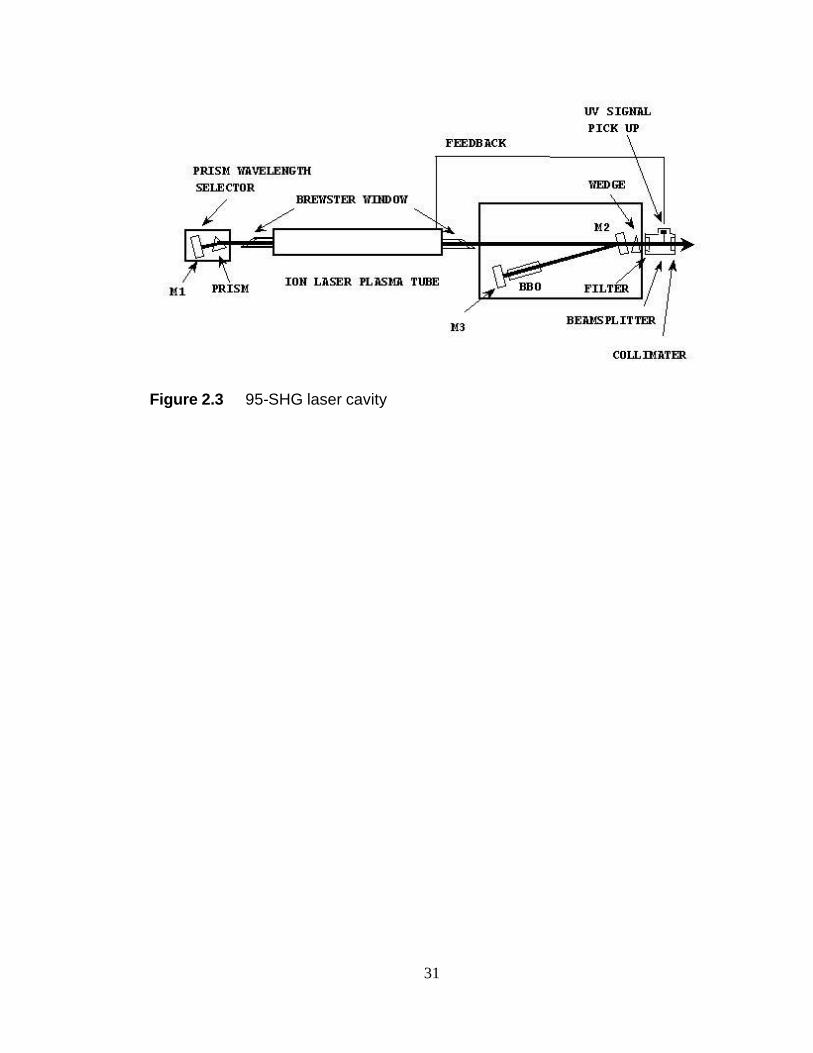
Section 2.1.4 95-SHG Lexel Laser The LEXEL 95-SHG laser is an
intracavity frequency doubled Argon ion laser that produces a continuous-wave UV
output at 244 nm. The frequency doubling is accomplished through Second Harmonic
Generation using a nonlinear crystal of β-Barium Borate, BaB2O4 (BBO). The SHG
power is proportional to:
( ) ( ) 222
2/2/sin
∆∆≈kL
kLA
PPω
ω (2.8)
where A is the cross section of the visible beam, L is the length of the doubling crystal,
∆k is the difference between the wave vectors of the UV and visible beams, and Pω and
P2ω are the powers of the visible and UV beams, respectively. Thus to increase the
power of the UV beam, the power of the visible beam can be increased. The output of
most common CW ion lasers is a fraction of the power inside the laser cavity. This is
the advantage of placing the BBO crystal inside the laser cavity as shown in Figure 2.3.
13
However, care must be taken to prevent the power density from exceeding the damage
threshold of the BBO crystal.
The power of the UV beam will be maximized for a given visible power when
the argument of the sine function in (2.8) is zero. That is, when
( )
04 2
2 =−
=−=∆ ω
ωωωω
λπ nn
kkk (2.9)
where k2ω and kω are the wave vectors for the UV and visible beams, respectively.
When the phases of the UV and visible beams are matched, n2ω will equal nω and (2.9)
will be zero. This phase matching is accomplished by adjusting the angle of the BBO
crystal shown in Figure 2.3. In principle the prism near M1 of Figure 2.3 can be
adjusted to “select” another Argon ion transition to lase and this new line could be
frequency doubled by the BBO. In practice with the existing BBO crystal, phase
matching cannot be maximized for any but the 488.0 nm wavelength of the Argon ion
laser.
Section 2.1.5 Acquiring a Raman Spectrum The Raman scattered light is
collected by a 50 mm diameter f/2 fused silica lens; this corresponds to a solid angle of
collection of 0.20 sr. The collected scattered light is focused on the entrance slit of a
f/3.7 SPEX 1877 Triplemate triple spectrometer by a 160 mm focal length lens.
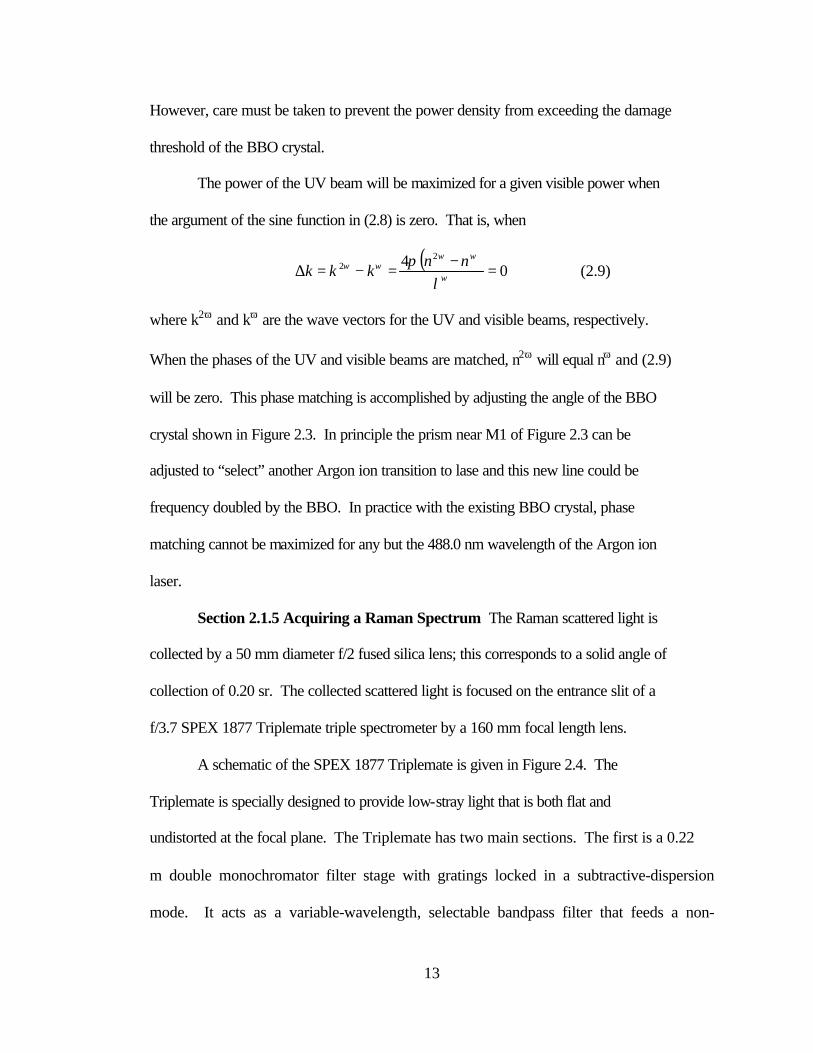
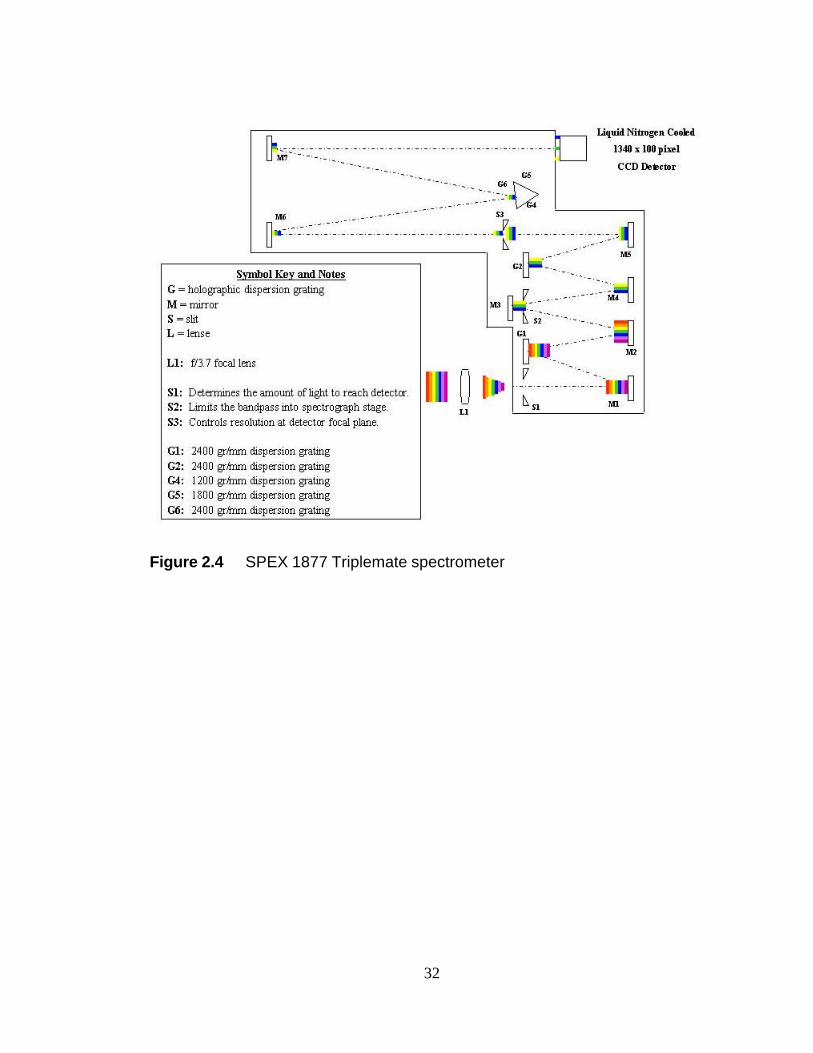
A schematic of the SPEX 1877 Triplemate is given in Figure 2.4. The
Triplemate is specially designed to provide low-stray light that is both flat and
undistorted at the focal plane. The Triplemate has two main sections. The first is a 0.22
m double monochromator filter stage with gratings locked in a subtractive-dispersion
mode. It acts as a variable-wavelength, selectable bandpass filter that feeds a non-
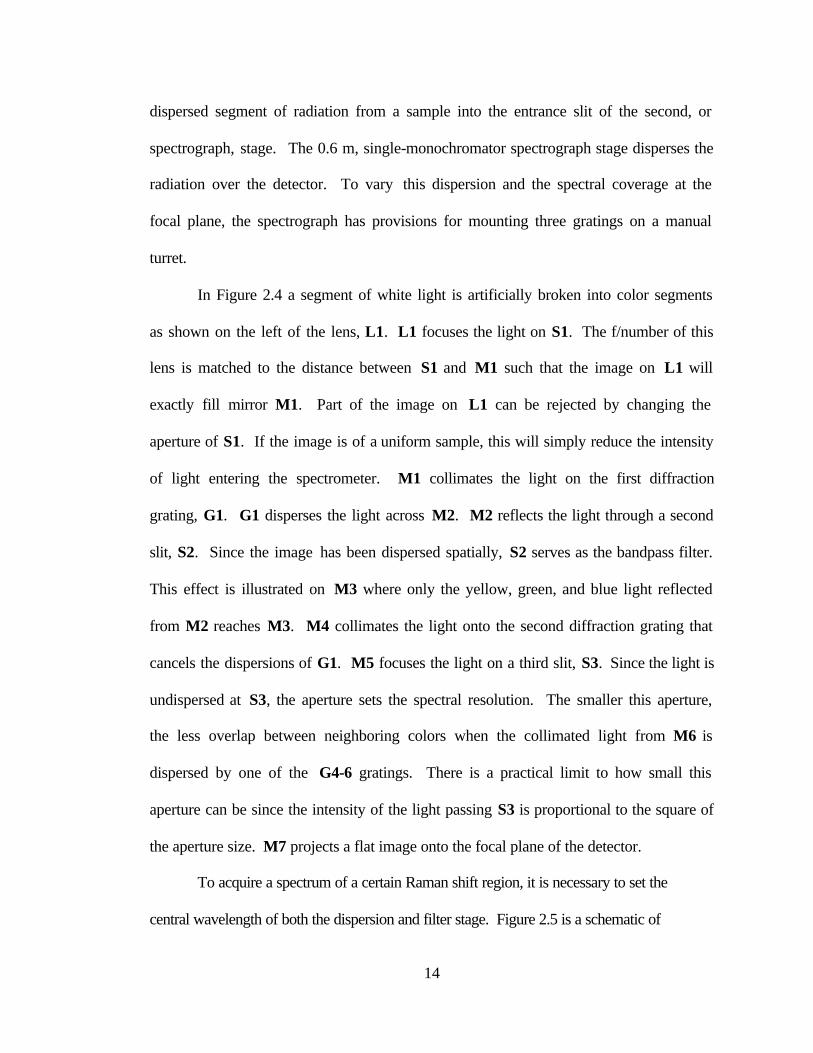
14
dispersed segment of radiation from a sample into the entrance slit of the second, or
spectrograph, stage. The 0.6 m, single-monochromator spectrograph stage disperses the
radiation over the detector. To vary this dispersion and the spectral coverage at the
focal plane, the spectrograph has provisions for mounting three gratings on a manual
turret.
In Figure 2.4 a segment of white light is artificially broken into color segments
as shown on the left of the lens, L1. L1 focuses the light on S1. The f/number of this
lens is matched to the distance between S1 and M1 such that the image on L1 will
exactly fill mirror M1. Part of the image on L1 can be rejected by changing the
aperture of S1. If the image is of a uniform sample, this will simply reduce the intensity
of light entering the spectrometer. M1 collimates the light on the first diffraction
grating, G1. G1 disperses the light across M2. M2 reflects the light through a second
slit, S2. Since the image has been dispersed spatially, S2 serves as the bandpass filter.
This effect is illustrated on M3 where only the yellow, green, and blue light reflected
from M2 reaches M3. M4 collimates the light onto the second diffraction grating that
cancels the dispersions of G1. M5 focuses the light on a third slit, S3. Since the light is
undispersed at S3, the aperture sets the spectral resolution. The smaller this aperture,
the less overlap between neighboring colors when the collimated light from M6 is
dispersed by one of the G4-6 gratings. There is a practical limit to how small this
aperture can be since the intensity of the light passing S3 is proportional to the square of
the aperture size. M7 projects a flat image onto the focal plane of the detector.
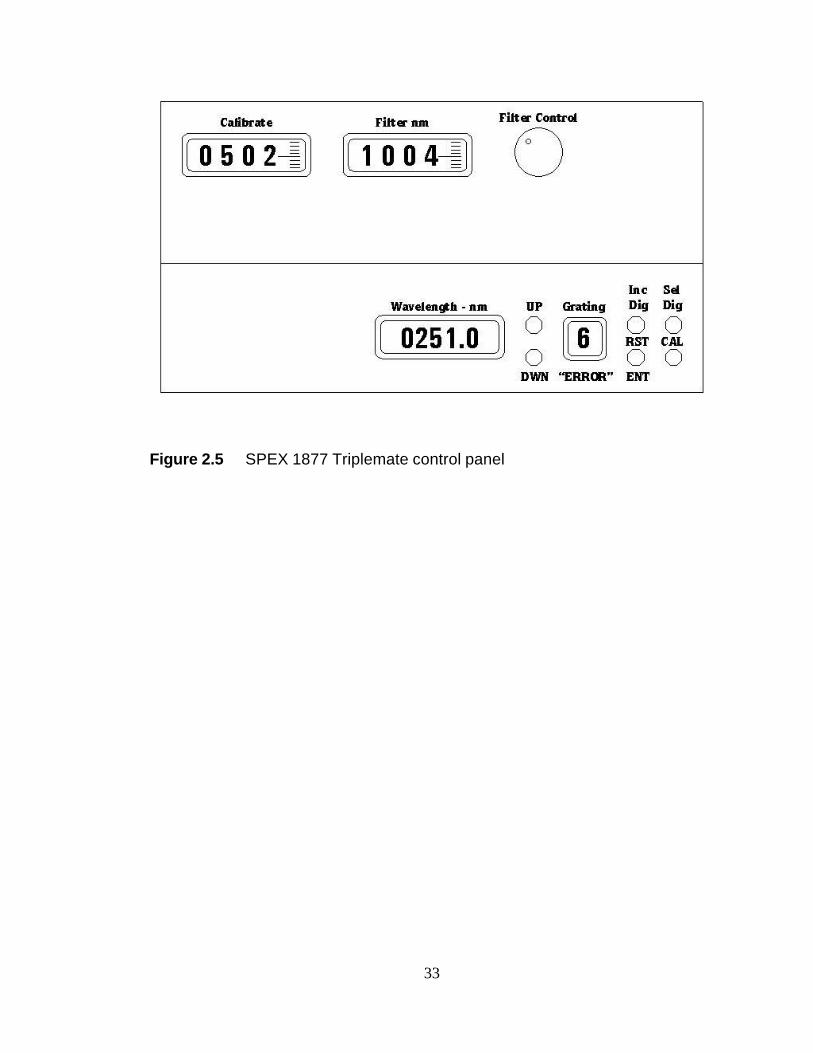
To acquire a spectrum of a certain Raman shift region, it is necessary to set the
central wavelength of both the dispersion and filter stage. Figure 2.5 is a schematic of
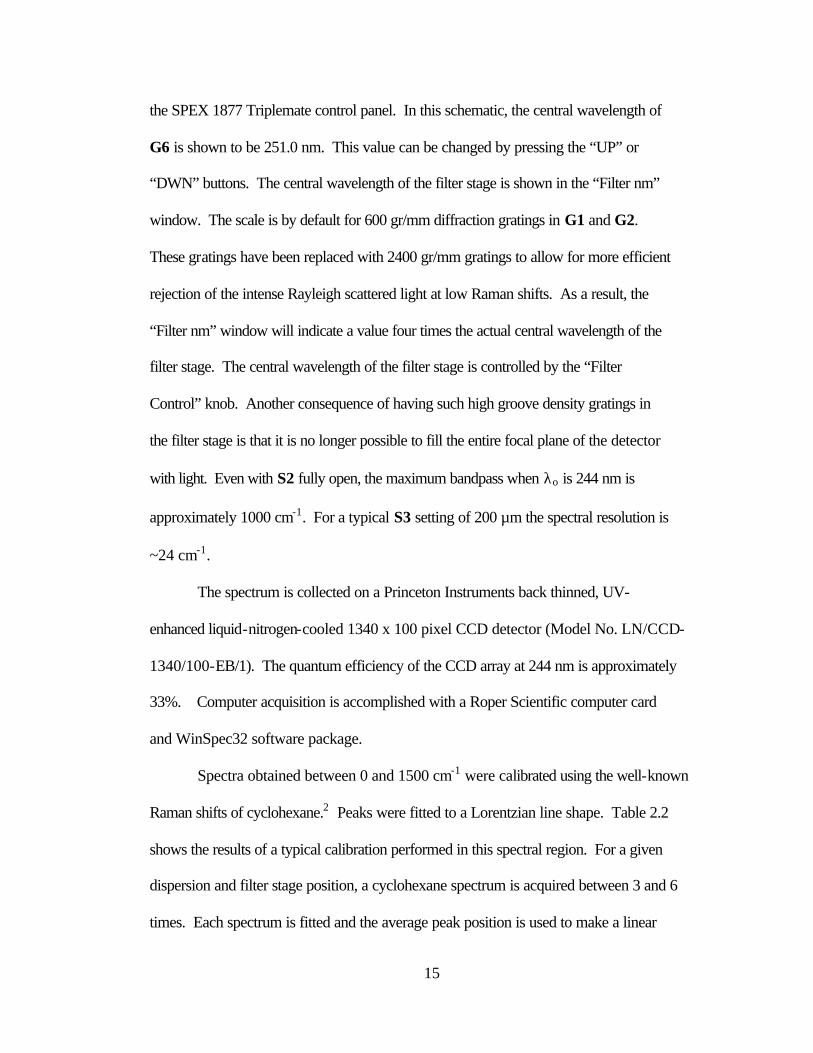
15
the SPEX 1877 Triplemate control panel. In this schematic, the central wavelength of
G6 is shown to be 251.0 nm. This value can be changed by pressing the “UP” or
“DWN” buttons. The central wavelength of the filter stage is shown in the “Filter nm”
window. The scale is by default for 600 gr/mm diffraction gratings in G1 and G2.
These gratings have been replaced with 2400 gr/mm gratings to allow for more efficient
rejection of the intense Rayleigh scattered light at low Raman shifts. As a result, the
“Filter nm” window will indicate a value four times the actual central wavelength of the
filter stage. The central wavelength of the filter stage is controlled by the “Filter
Control” knob. Another consequence of having such high groove density gratings in
the filter stage is that it is no longer possible to fill the entire focal plane of the detector
with light. Even with S2 fully open, the maximum bandpass when λo is 244 nm is
approximately 1000 cm-1. For a typical S3 setting of 200 µm the spectral resolution is
~24 cm-1.
The spectrum is collected on a Princeton Instruments back thinned, UV-
enhanced liquid-nitrogen-cooled 1340 x 100 pixel CCD detector (Model No. LN/CCD-
1340/100-EB/1). The quantum efficiency of the CCD array at 244 nm is approximately
33%. Computer acquisition is accomplished with a Roper Scientific computer card
and WinSpec32 software package.
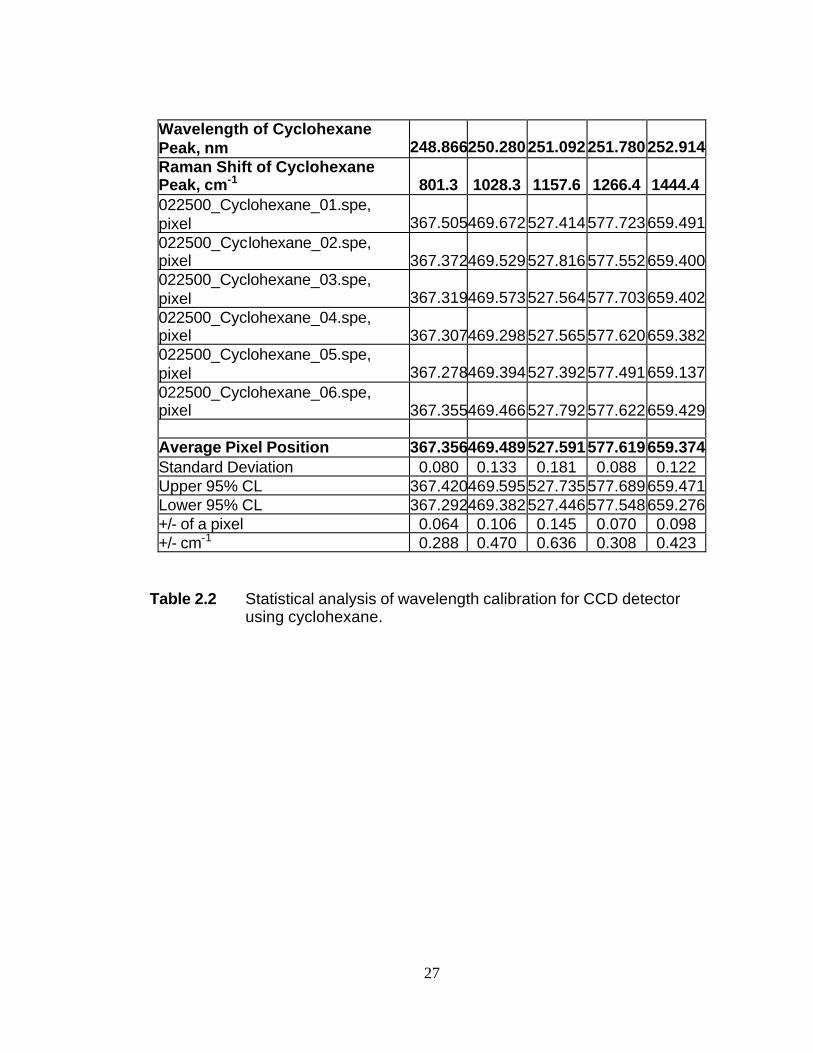
Spectra obtained between 0 and 1500 cm-1 were calibrated using the well-known
Raman shifts of cyclohexane.2 Peaks were fitted to a Lorentzian line shape. Table 2.2
shows the results of a typical calibration performed in this spectral region. For a given
dispersion and filter stage position, a cyclohexane spectrum is acquired between 3 and 6
times. Each spectrum is fitted and the average peak position is used to make a linear
16
correlation between CCD pixel position and Raman photon wavelength, λr. This
correlation is inserted into equation (2.1) to create a correlation between Raman shift
and CCD pixel. As seen from Table 2.2, this calibration will provide a Raman shift
with a 95% confidence level between 0.3 and 0.7 cm-1.
Spectra obtained between 3200 and 3620 cm-1 were calibrated using the O-H
peak frequencies of gibbsite6 in a procedure identical to that described above. This
calibration is extrapolated for use in a region spanning from 2800 to 3700 cm-1.
Section 2.1.6 Catalytic Reactors for UV-Raman Spectroscopy Raman
spectroscopy offers the capability of probing samples in the presence of a dense gas or
ambient liquid phase. Unlike some non-linear spectroscopic techniques, Raman
spectroscopy is not uniquely surface sensitive. This is advantageous in the sense that,
with Raman spectroscopy, optically flat and reflective surfaces are not strictly required.
The intensity of a Raman transition is governed by (2.8). In the case of hydrocarbon
fragments on a high surface area catalyst, the number of scatters, N, will be very small
in a very tightly focused laser beam. To obtain a useful signal-to-noise ratio with no
enhancement due to resonance or the surface enhanced Raman (SERS) effect, one can
only increase the incident laser intensity, Io. With an increase in laser intensity comes
an increase in the local temperature of the sampled spot. It has been reported that the
local temperature can be as much as 100oC greater than the surrounding material.7 Such
a large temperature difference creates a significant problem to relate Raman spectra
with kinetic data. Several studies have been conducted to determine the effect of the
temperature increase.7-10

17
Several approaches have been used to minimize the local heating effect during
the acquisition of a Raman spectrum. A common approach is to focus the laser beam
not as a spot, but as a line. In this way, the flux of photons is spread across the sample
in effect increasing the number of scatters, N, probed by the incident laser, Io.
In another approach, the catalyst sample is rotated during irradiation by the
incident laser.11,12 Most heterogeneous catalysts are in the form of extrudates of silica,
alumina, or other metal oxides and are often crushed to powder for scientific studies.
To prevent the powder from dispersing during rotation it is usually compressed into a
mechanically rigid pellet. Reactant gases are flowed around the pellet during the
experiment. Quantitative kinetic data is difficult to obtain because it is usually
unknown how far reactant gases diffuse into the pellet.
A rather creative approach has been developed to study samples under cryogenic
temperature control although it can be extended to any temperature range. To avoid the
obvious difficulties of rotating very cold components of the apparatus, the geometry of
the incident laser and the laser focusing lens is carefully designed to provide for
scanning the laser beam over the sample in a linear13 or circular path14. This approach
does allow for significant flexibility in the types of samples to be probed but the
experimental setup is very sensitive to alignment.
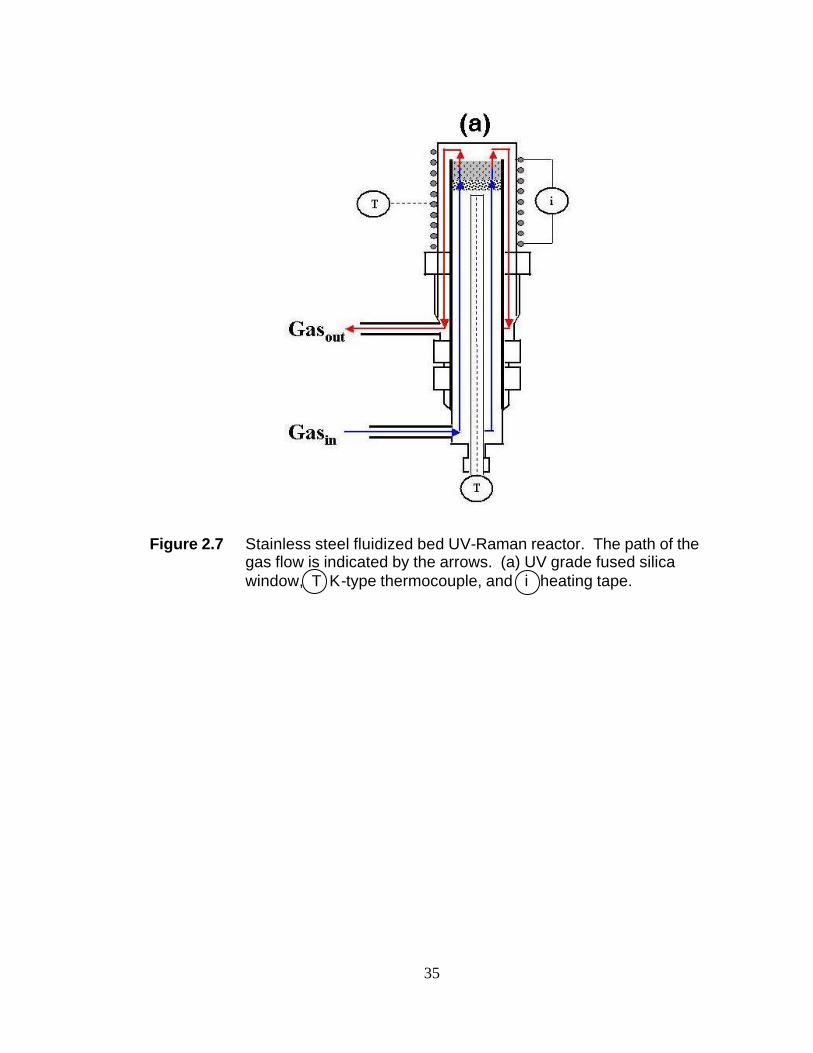
In 2000 Chua and Stair published a paper that described an in situ fluidized bed
reactor for measuring UV-Raman spectra of catalysts during reaction.15 In their
approach a powdered catalyst rests on a porous frit contained near the top of a stainless
steel tube. Gas is forced through the frit and the bottom of the powdered catalyst bed
providing vertical lift to the particles. An electromagnetic shaker is used to induce side-
18
to-side motion of the particles. The result is a bed of fluidized particles. In other words
the packing density of the powdered bed has been significantly reduce but the particles
are not propelled out of the stainless steel tube. Now when a laser is incident on the top
of this fluidized bed, the same catalyst particles are not always in the focal volume.
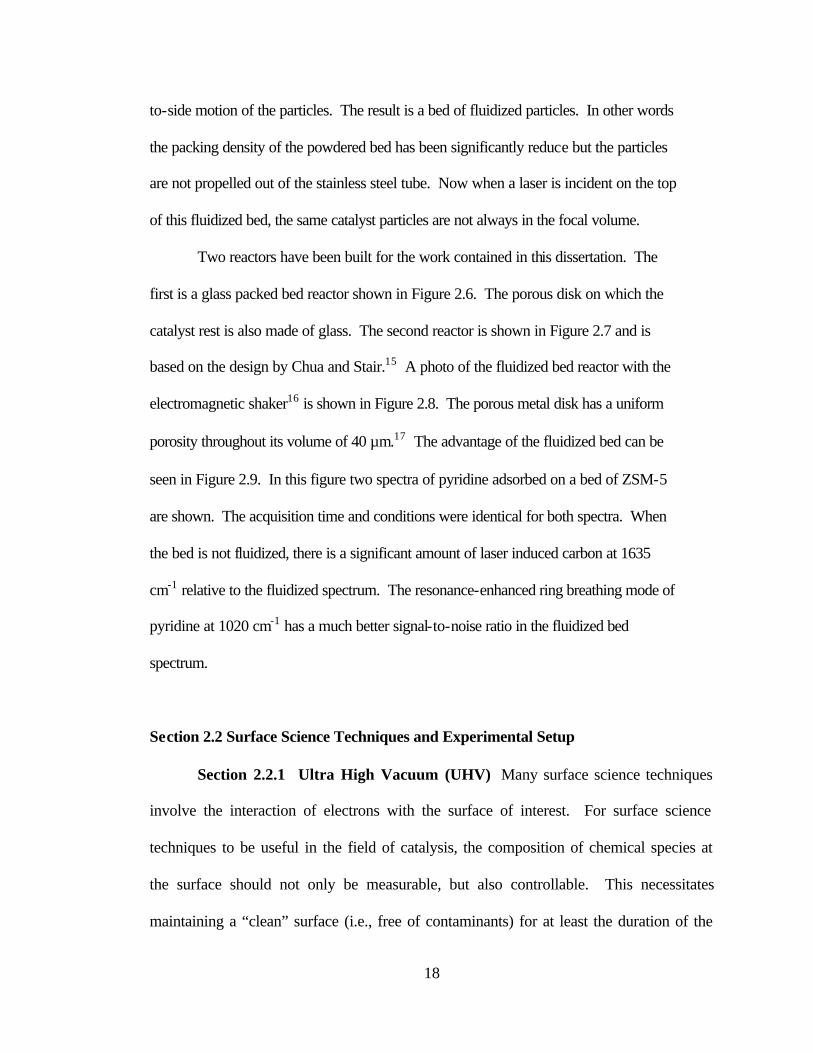
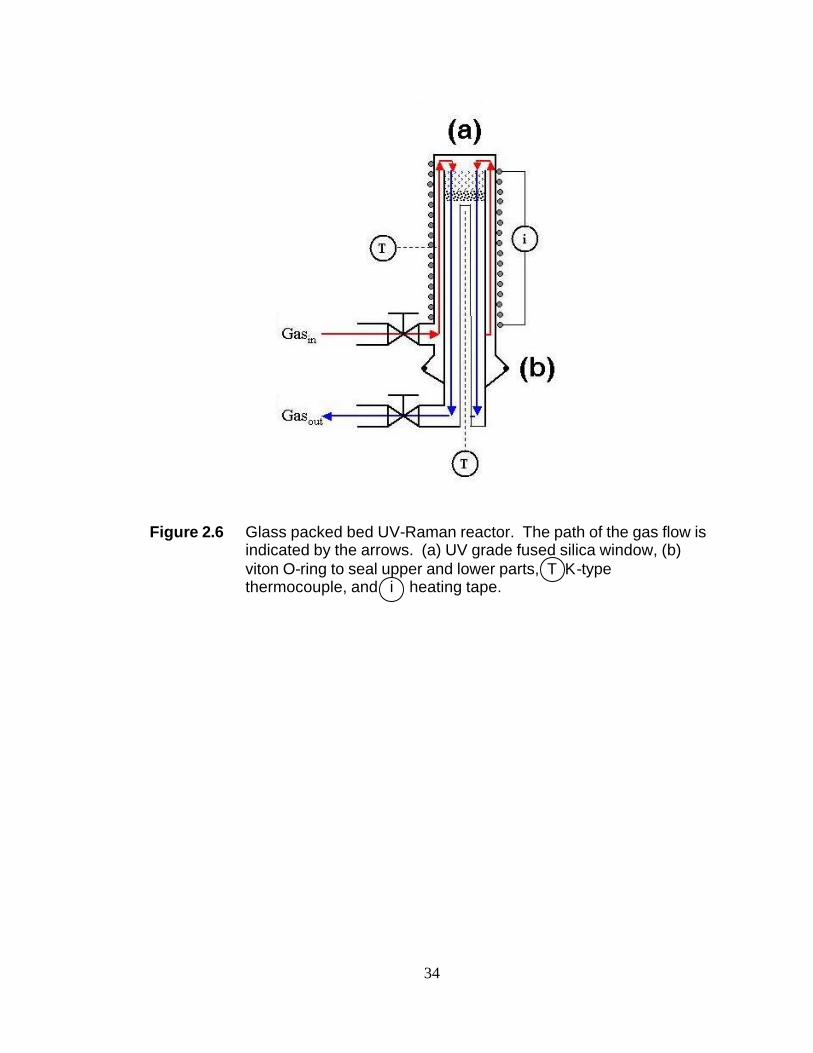
Two reactors have been built for the work contained in this dissertation. The
first is a glass packed bed reactor shown in Figure 2.6. The porous disk on which the
catalyst rest is also made of glass. The second reactor is shown in Figure 2.7 and is
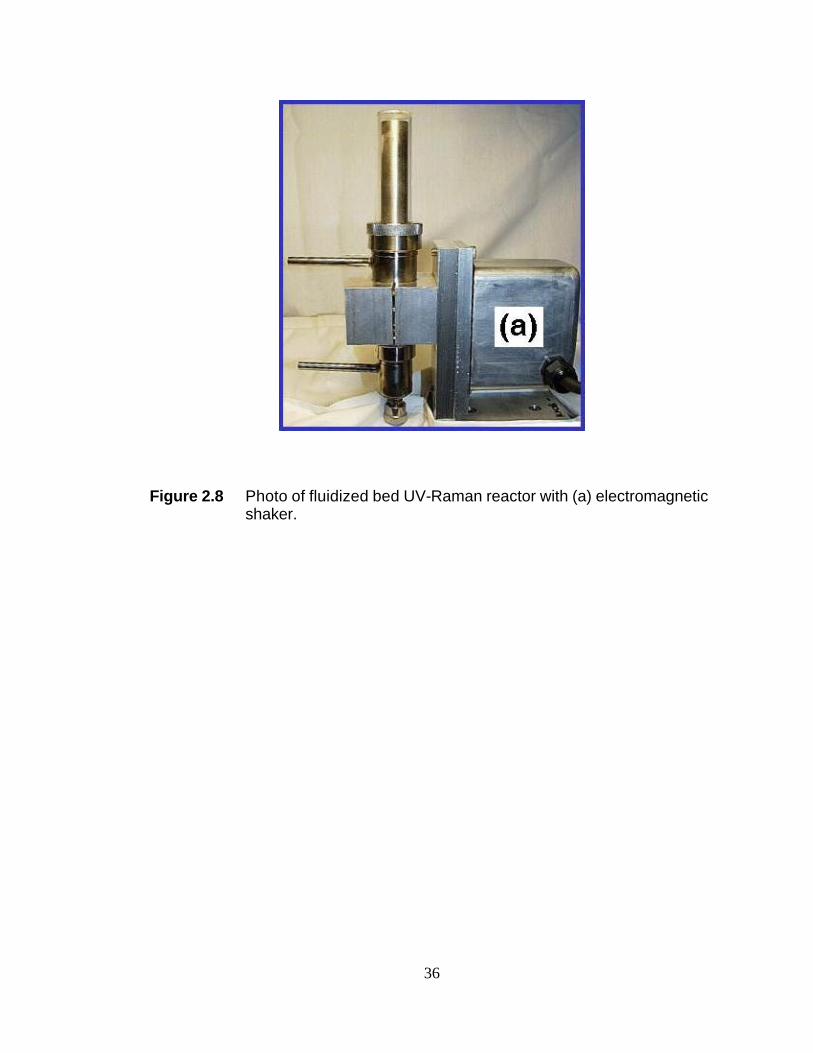
based on the design by Chua and Stair.15 A photo of the fluidized bed reactor with the
electromagnetic shaker16 is shown in Figure 2.8. The porous metal disk has a uniform
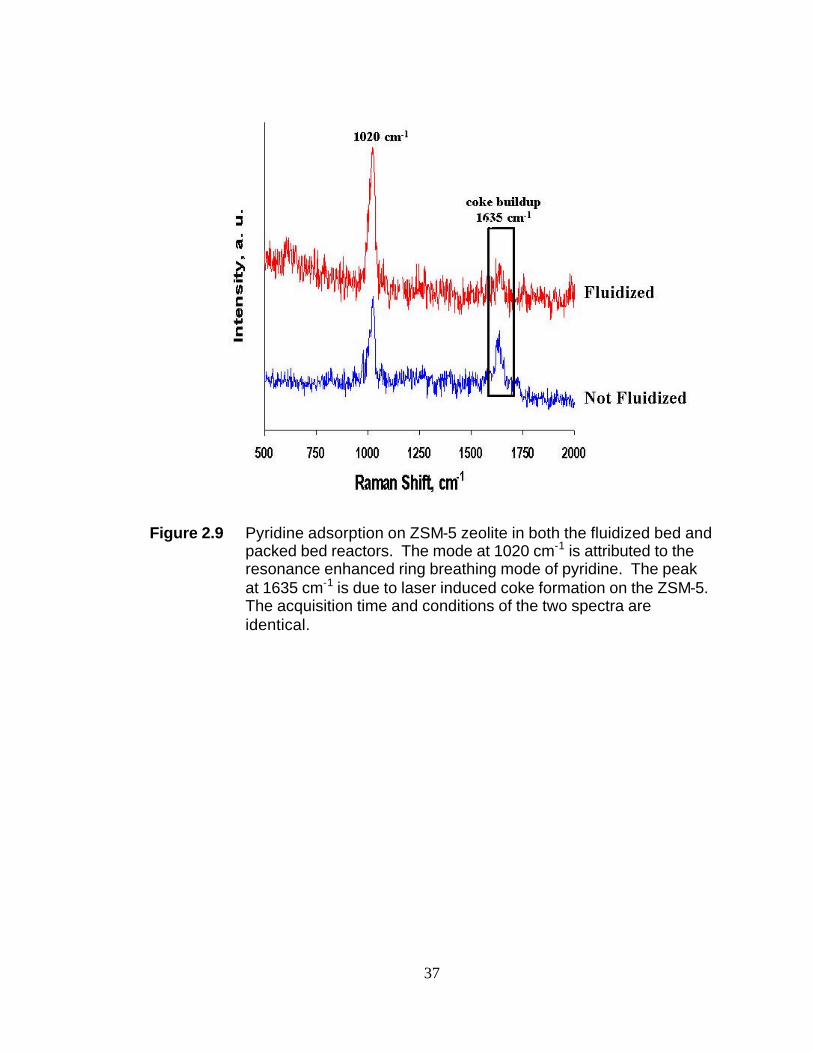
porosity throughout its volume of 40 µm.17 The advantage of the fluidized bed can be
seen in Figure 2.9. In this figure two spectra of pyridine adsorbed on a bed of ZSM-5
are shown. The acquisition time and conditions were identical for both spectra. When
the bed is not fluidized, there is a significant amount of laser induced carbon at 1635
cm-1 relative to the fluidized spectrum. The resonance-enhanced ring breathing mode of
pyridine at 1020 cm-1 has a much better signal-to-noise ratio in the fluidized bed
spectrum.
Section 2.2 Surface Science Techniques and Experimental Setup
Section 2.2.1 Ultra High Vacuum (UHV) Many surface science techniques
involve the interaction of electrons with the surface of interest. For surface science
techniques to be useful in the field of catalysis, the composition of chemical species at
the surface should not only be measurable, but also controllable. This necessitates
maintaining a “clean” surface (i.e., free of contaminants) for at least the duration of the
19
experiment. Many clean surfaces (e.g. metallic surfaces) are highly reactive with
oxygen and carbon containing compounds. Performing experiments under ultra-high
vacuum conditions ensures that the mean free path of an electron is large enough to
leave the source, interact with the surface, and return to the analyzer as well as leaving
the surface free of oxygen and carbon for a reasonable length of time. The quality of
the vacuum can be approximated by considering the impact rate of molecules with the
surface. Using a simplified form of the kinetic theory of gases, the impact rate is
estimated by the following:
rP
TM= ×351 1022
0 5.( ) .
where P is the pressure in torr, T is the temperature in Kelvin, and M is the atomic mass
unit of the molecule impacting the surface. For a molecule of atomic mass 28 (e.g., N2
or CO) at a pressure of 1 x 10⁻⁹
torr and room temperature, the arrival rate is 3.3 x 10¹¹
molecules cm-2
s-1
. For a 1 cm2 sample area, one monolayer will be formed in
approximately one hour assuming each impact results in a physisorption or
chemisorption (i.e., a sticking probability of 1).
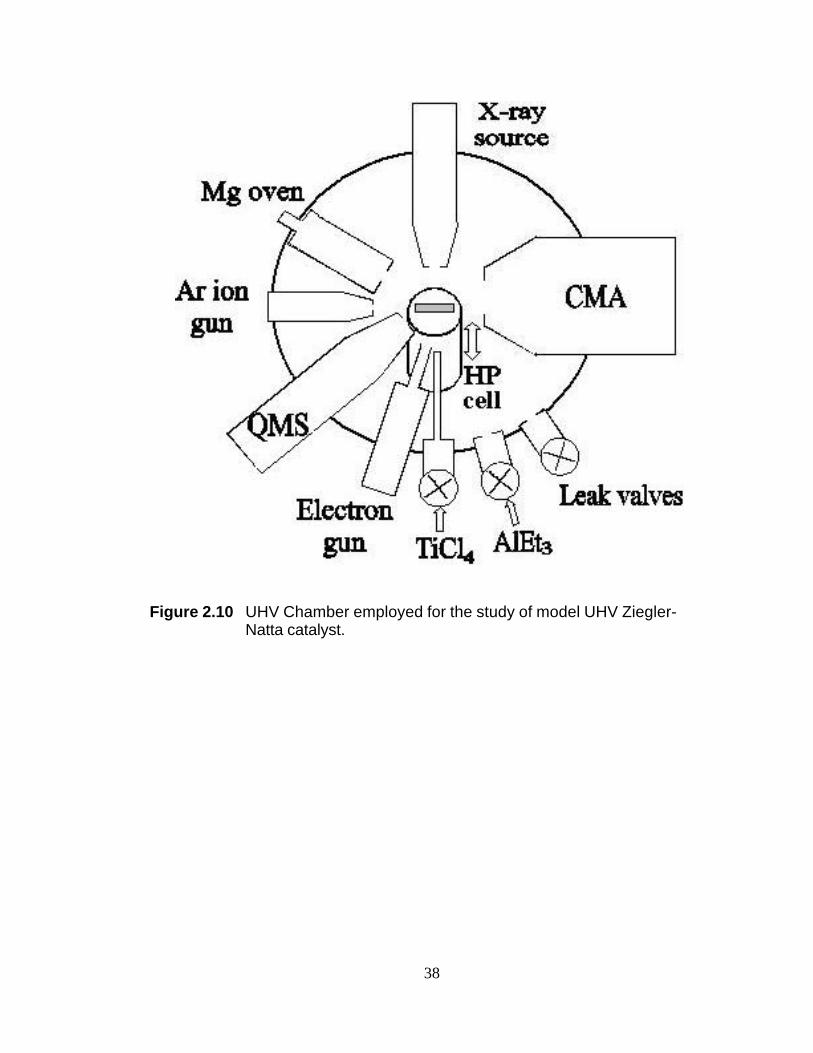
The studies reported in this dissertation were performed in a stainless steel UHV
chamber (Figure 2.10) pumped with a liquid nitrogen cooled diffusion pump. An ion
pump is attached to the chamber, but is used primarily for maintaining vacuum when
the diffusion pump is off line. A base pressure of 2 x 10⁻⁹
torr can be achieved after
heating the chamber to desorb gases adsorbed to the walls until a pressure of <5 x 10⁻⁸
Torr is achieved while the chamber is still hot. After the heating is turned off, all of the
equipment with filaments are energized slowly to operating conditions. Current is
20
continually passed through the filaments until the chamber is at room temperature. If
the filaments are not energized while the chamber is cooling, subsequent use of the
equipment will cause the base pressure to increase.
The UHV chamber is equipped with a sputter ion gun for surface cleaning, an
X-ray source, a double-pass cylindrical mirror analyzer (CMA) with a coaxial electron
gun for X-ray photoelectron spectroscopy (XPS), and a quadrupole mass spectrometer
(QMS) for residual gas analysis and TPD. A commercially available sample
manipulator provided three-dimensional translation and 360o rotation of the sample.
The chamber also has three leak valves for gas exposure, a Mg evaporation source for
the Mg dose, an electron flood gun for electron beam irradiation of the sample, and an
internal high-pressure (HP) reaction cell for polymerization. Further details are given
elsewhere.18 Gas admittance into the UHV chamber was controlled with leak valves
facing the sample. Nominal pressures reported in this dissertation were readouts of the
nude ion gauge, located about 20 cm away from the sample, without correction for
ionization sensitivity and dosing geometry.
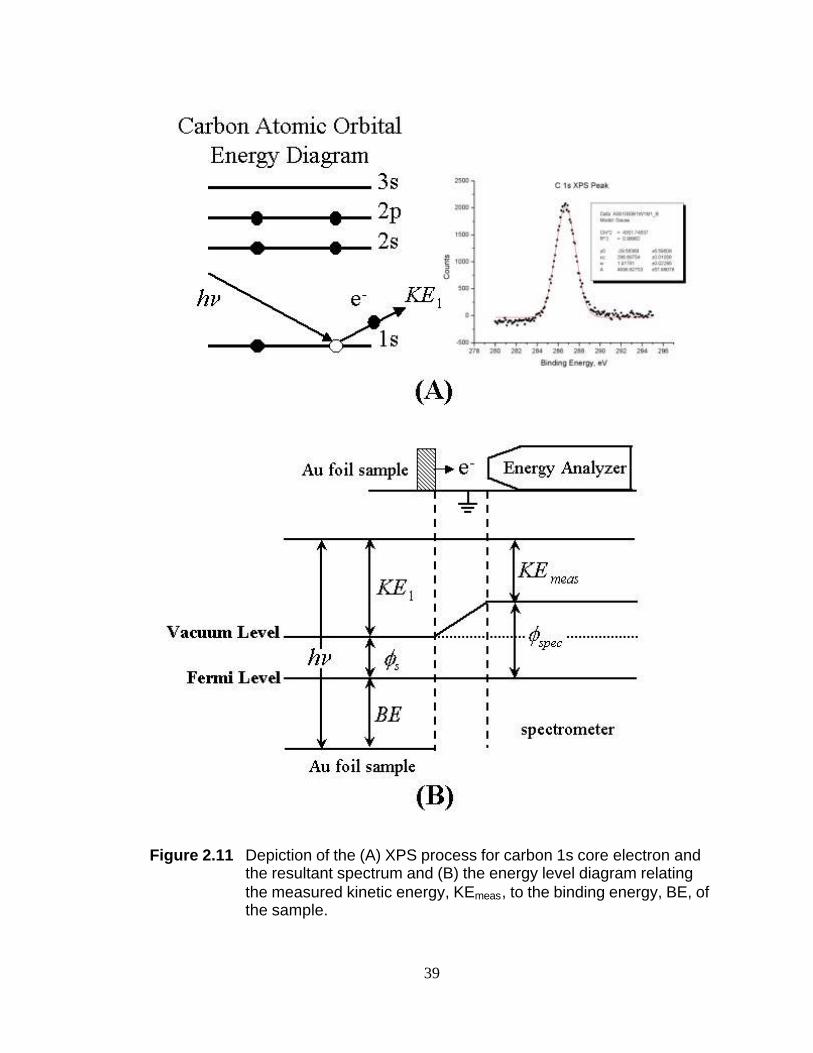
Section 2.2.2 X-ray Photoelectron Spectroscopy (XPS) X-ray photoelectron
spectroscopy (XPS) is a technique in which a sample is irradiated with nearly
monochromatic soft X-rays and the kinetic energy of the emitted core electrons is
measured. A simplified depiction of the XPS process is shown in Figure 2.11A. More
elaborate explanations can be found elsewhere.20-22 In Figure 2.11A an X-ray of energy
hν ejects a carbon 1s electron. The emitted electron has a kinetic energy, KE1, that can
be measured by an electron energy analyzer (typically referred to as a spectrometer).
XPS spectra are given as a plot of intensity versus binding energy (BE). The binding
21
energy of the photoelectron is characteristic of the atomic orbital from which the
electron originated. Therefore, the BE will provide the identity of the atoms present in
the analysis volume. Furthermore, since the BE is sensitive to the local electron
density, shifts in BE for a given atom provides an indication of the oxidation state of the
atom.
In Koopman’s approximation, the binding energy (BE) of the photoelectron is
related to the measured kinetic energy as follows:
smeasKEhBE Φ−−= ν (2.10)
where hν is the energy of the soft x-ray, KEmeas is the kinetic energy of the emitted
photoelectron as measured by the spectrometer, and Φs is the work function of the
spectrometer. As indicated in Figure 2.11B, the kinetic energy that is measured by the
spectrometer is not necessarily equivalent to the kinetic energy of the electron emitted
from the sample volume. Oftentimes, the sample and spectrometer work functions are
different and unknown. The spectrometer work function can be estimated by using an
internal BE standard within the sample volume. In this dissertation, a BE of 84.0 eV for
the Au4f7/2
peak is used as the internal standard unless otherwise noted.
Quantitative determination of the surface atomic concentration is accomplished
by correcting the calculated peak area by a sensitivity factor specific to each element as
follows22:
∑=
=i
j j
j
i
i
i
S
ASA
C
1
(2.x)
22
where Ci is the concentration of species i, Si is the sensitivity factor of species i, and the
summation is over all species present in the XPS spectrum. The sensitivity factors used
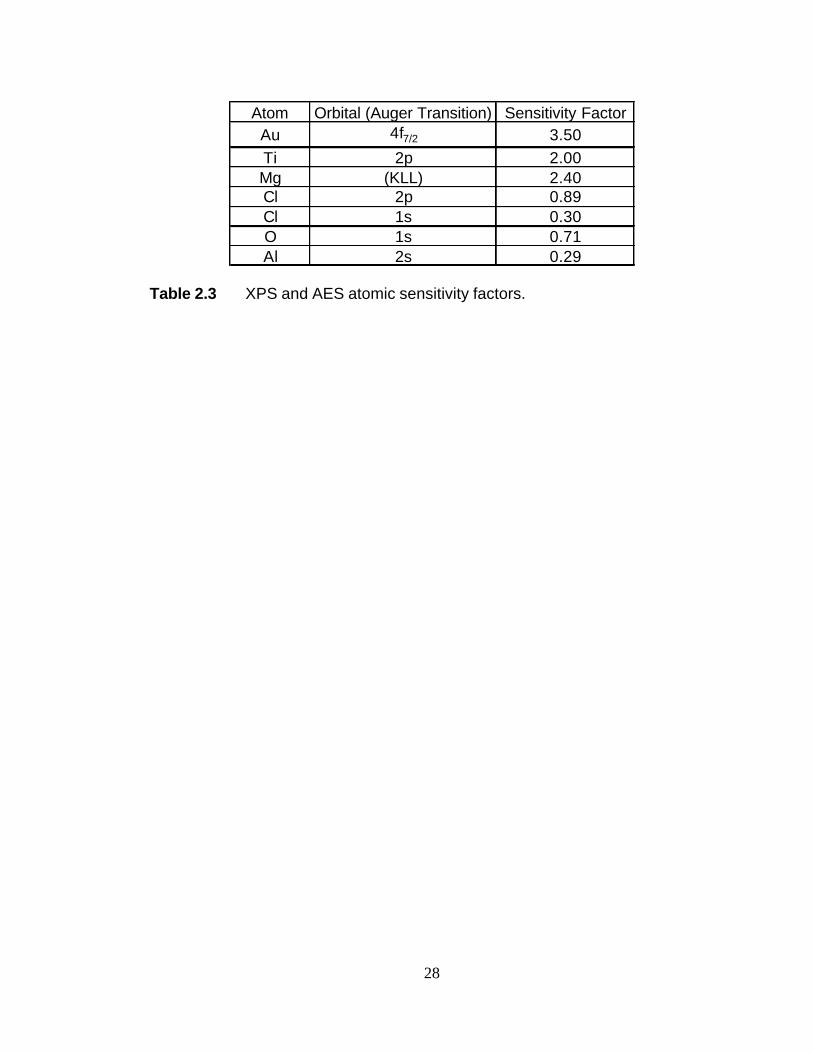
are provided in Table 2.3 and were taken from reported values.23
XPS experiments are performed with a Perkin-Elmer 04-548 Dual Anode X-ray
Source and a PHI 13-255G Double Pass Cylindrical Mirror Analyzer for electron
energy analysis. Both the Mg (1253.6 eV) and Al (1486.6 eV) anode X-ray sources are
used to acquire XPS spectra. The Al X-ray photons are sufficiently energetic to induce
the Mg KLL Auger transition. The Mg source is more intense and allows a better
signal-to-noise ratio in a shorter accumulation time.
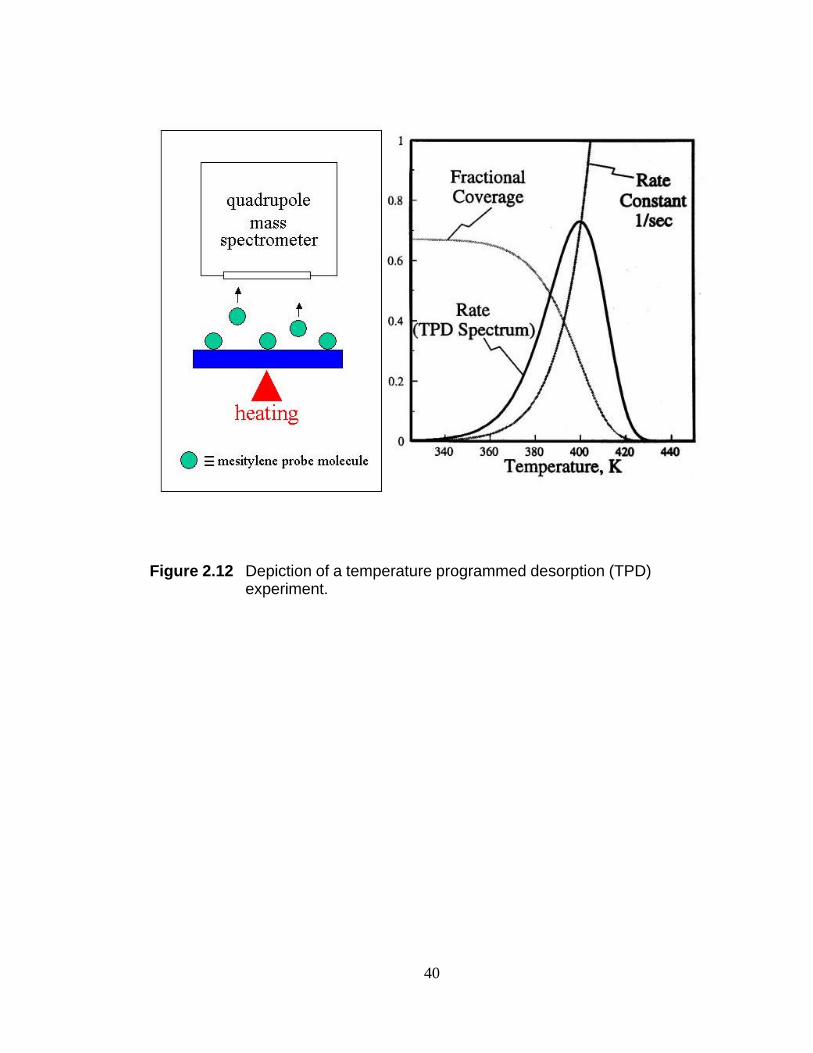
Section 2.2.3 Temperature Programmed Desorption (TPD) Temperature
programmed desorption (TPD) is probably the most widely used technique for the
determination of the heat of adsorption and coverage of molecules on surfaces and for
studying desorption kinetics. Detailed descriptions of the experimental setup and the
interpretation of results have been published elsewhere.21,24-30 Briefly, the surface under
analysis is held at constant temperature while being exposed to a probe molecule. The
system is then evacuated and the temperature of the adsorbate-covered surface is
ramped linearly. The desorbing species are monitored with a mass spectrometer and
plotted as a function of sample temperature. A schematic of the experimental setup
used in this dissertation is given in Figure 2.12.
The sample coverage is proportional to the integral of the thermal desorption
spectrum. The gas-phase concentration profile can easily be related to the kinetics and
energetics of the desorption process. A variety of approaches have been suggested to
extract this information. When the pumping rate is very large compared to the
23
desorption rate, the latter is directly proportional to the gas-phase pressure. In the
simplest interpretation of the thermal desorption spectrum, the activation energy for the
desorption process Ed is obtained from the temperature of the desorption peak
maximum Tmax using the following equation21,29:
max12
max
RTE
dd
eRT
E−
=
βν
(2.11)
for first-order desorption where ν1 is the pre-exponential factor, R is the universal
constant of gases, and β is the temperature ramp (dT/dt). According to (2.11), Tmax is
independent of the initial coverage. By assuming a value of 1013 for the pre-exponential
factor, the activation energy for desorption can be obtained. Ed is a good approximation
of the heat of adsorption as long as the adsorption is a non-activated process. This
assumption is implicitly applied whenever heats of adsorption are evaluated from TPD
data.
24
Section 2.3 References
(1) Long, D. A. Raman Spectroscopy; McGraw-Hill International Book Company: New York, 1977.
(2) McCreery, R. L. Raman Spectroscopy for Chemical Analysis; Wiley-
Interscience: New York, 2000; Vol. 157. (3) Asher, S. A.; Johnson, C. R. Science 1984, 225, 311. (4) Turro, N. J. Modern Molecular Photochemistry; University Science Books:
Sausalito, 1991. (5) Pankove, J. I. Optical Processes in Semiconductors; Dover Publications, Inc.:
New York, 1971. (6) Dollish, F. R.; Fateley, W. G.; Bentley, F. Characteristic Raman Frequencies of
Organic Compounds; John Wiley & Sons, Inc.: New York, 1974. (7) Bock, A. Phys. Rev. B 1995, 51, 15506. (8) Fell, N. F.; Vanderhoff, J. A.; Pesce-Rodriguez, R. A.; McNesby, K. L. J.
Raman Spectrosc. 1998, 29, 165. (9) Pope, S. J. A.; West, Y. D. Spectrochim. Acta, Part A 1995, 51, 2011. (10) Xie, S. B.; Rosynek, M. P.; Lunsford, J. H. Appl Spectroscopy 1999, 53, 1183. (11) Cheng, C. P.; Ludowise, J. D.; Schrader, G. L. Applied Spectroscopy 1980, 34,
146. (12) Brown, F. R.; Makovsky, L. E.; Rhee, K. H. Applied Spectroscopy 1977, 31,
563. (13) Koningstein, J. A.; Gachter, B. F. J. Opt. Soc. Am. 1973, 63, 892. (14) Zimmerer, N.; Kiefer, W. Applied Spectroscopy 1974, 23, 279. (15) Chua, Y. T.; Stair, P. C. J. of Catal. 2000, 196, 66. (16) Cleveland Vibrator Company, Cleveland, OH. (17) Mott Corporation, Farmington, CT.
25
(18) Kim, S. H.; Somorjai, G. A. J. Phys. Chem. B 2000, 104, 5519. (19) Mousty-Desbuquoit, C.; Riga, J.; Verbist, J. J. Inorg. Chem. 1987, 26, 1212. (20) Ertl, G.; Kuppers, J. Low Energy Electrons and Surface Chemistry; Verlag
Chemie: Weinheim, 1985. (21) Woodruff, D. P.; Delchar, T. A. Modern Techniques of Surface Science;
Cambridge University Press: Cambridge, 1994. (22) Moulder, J. F.; Stickle, W. F.; Sobol, P. E.; Bomben, K. D. Handbook of X-ray
Photoelectron Spectroscopy; Physical Electronics, Inc.: Eden Prairie, MN, 1995. (23) ESCA Operator's Reference Manual. ESCA Version 4.0 and Multi-Technique
2.0; Physical Electronics, Inc.: Eden Prairie, MN, 1988. (24) Redhead, P. A. Vacuum 1962, 12, 203. (25) Cvetanovic, R. J.; Amenomiya, Y. Catal. Rev. 1972, 6, 21. (26) Cvetanovic, R. J.; Amenomiya, Y. In Advances in Catalysis; Eley, D. D.,
Selwood, P. W., Weisz, P. B., Eds.; Academic Press, 1967; pp 103. (27) Falconer, J. L.; Schwarz, J. A. Catal. Rev. -Sci. Eng. 1983, 25, 141. (28) Bhatia, S.; Beltramini, J.; Do, D. D. Catalysis Today 1990, 3, 308. (29) Somorjai, G. A. Chemistry in Two Dimensions; Cornell University Press: Ithaca,
NY, 1981. (30) Adamson, A. W. Physical Chemistry of Surfaces; Wiley: New York, 1990; pp
690.

26
λo λr, 10 cm-1 λr, 4000 cm-1
1064 1065.1 1852.4488 488.2 606.4244 244.1 270.4
Table 2.1 Wavelength of 10 and 4000 cm-1 Raman Shifted photons with three different wavelengths of incident photons. All wavelengths are given in nm.
27
Wavelength of Cyclohexane Peak, nm 248.866250.280 251.092 251.780 252.914Raman Shift of Cyclohexane Peak, cm-1 801.3 1028.3 1157.6 1266.4 1444.4 022500_Cyclohexane_01.spe, pixel 367.505469.672 527.414 577.723 659.491022500_Cyclohexane_02.spe, pixel 367.372469.529 527.816 577.552 659.400022500_Cyclohexane_03.spe, pixel 367.319469.573 527.564 577.703 659.402022500_Cyclohexane_04.spe, pixel 367.307469.298 527.565 577.620 659.382022500_Cyclohexane_05.spe, pixel 367.278469.394 527.392 577.491 659.137022500_Cyclohexane_06.spe, pixel 367.355469.466 527.792 577.622 659.429 Average Pixel Position 367.356469.489 527.591 577.619 659.374Standard Deviation 0.080 0.133 0.181 0.088 0.122 Upper 95% CL 367.420469.595 527.735 577.689 659.471Lower 95% CL 367.292469.382 527.446 577.548 659.276+/- of a pixel 0.064 0.106 0.145 0.070 0.098 +/- cm-1 0.288 0.470 0.636 0.308 0.423
Table 2.2 Statistical analysis of wavelength calibration for CCD detector using cyclohexane.
28
Atom Orbital (Auger Transition) Sensitivity FactorAu 4f7/2 3.50Ti 2p 2.00Mg (KLL) 2.40Cl 2p 0.89Cl 1s 0.30O 1s 0.71Al 2s 0.29
Table 2.3 XPS and AES atomic sensitivity factors.
29
Figure 2.1 Simplified molecular orbital depiction of fluorescence process. So
is the ground state singlet electronic state. S1 is the first excited singlet state.
30
244 249 254 259 264 269 274Wavelength, nm
Arb
itra
ry U
nit
s
488 506 524 542 560 578 596 614Wavelength, nm
Figure 2.2 Comparison of Visible and UV Raman spectra of Al2O3 · 3H2O.
Visible Spectrum
UV Spectrum
S/N = 15 3618 cm-1 S/N = 650
fluorescence λmax ~ 570 nm
S/N = 7 569 cm-1 S/N = 70
31
Figure 2.3 95-SHG laser cavity
32
Figure 2.4 SPEX 1877 Triplemate spectrometer
33
Figure 2.5 SPEX 1877 Triplemate control panel
34
Figure 2.6 Glass packed bed UV-Raman reactor. The path of the gas flow is indicated by the arrows. (a) UV grade fused silica window, (b) viton O-ring to seal upper and lower parts, T K-type thermocouple, and i heating tape.
35
Figure 2.7 Stainless steel fluidized bed UV-Raman reactor. The path of the gas flow is indicated by the arrows. (a) UV grade fused silica window, T K-type thermocouple, and i heating tape.
36
Figure 2.8 Photo of fluidized bed UV-Raman reactor with (a) electromagnetic shaker.
37
Figure 2.9 Pyridine adsorption on ZSM-5 zeolite in both the fluidized bed and packed bed reactors. The mode at 1020 cm-1 is attributed to the resonance enhanced ring breathing mode of pyridine. The peak at 1635 cm-1 is due to laser induced coke formation on the ZSM-5. The acquisition time and conditions of the two spectra are identical.
38
Figure 2.10 UHV Chamber employed for the study of model UHV Ziegler-Natta catalyst.
39
Figure 2.11 Depiction of the (A) XPS process for carbon 1s core electron and the resultant spectrum and (B) the energy level diagram relating the measured kinetic energy, KEmeas, to the binding energy, BE, of the sample.
40
Figure 2.12 Depiction of a temperature programmed desorption (TPD)
experiment.
Chapter 3
Surface Characterization of the TiClx/MgCl2 Model Ziegler-Natta Polymerization Catalysts: Adsorption Site Studies Using Mesitylene Thermal Desorption
Section 3.1 Introduction
Identification of the active catalytic sites is one of the most difficult challenges
in a MgCl2-supported TiCl4-based Ziegler-Natta polymerization catalysis system used
for polyolefin production.1,2 The ability to distinguish and monitor surface adsorption
sites on the Ziegler-Natta catalysts can provide an unprecedented opportunity to
correlate catalytic behaviors, such as polymerization activity and stereospecificity, with
surface structure and composition. In addition, molecular-level knowledge of the
surface adsorption sites is a prerequisite to controlling the active sites of the
heterogeneous catalysts. If one can find a way to produce a single-site Ziegler-Natta
catalyst, it would be possible to control the molecular weight distribution and
stereospecificity of polymers to tailor their mechanical properties.3-8
For structure determination of flat surfaces, the most frequently used surface-
science technique is low-energy electron diffraction (LEED).9 This technique has been
successfully used to study the surface structure of a model MgCl2 film prepared by
thermal evaporation in ultra high vacuum (UHV).10,11 The surface of a multilayer
MgCl2 film has the structure of the MgCl2 (001) basal plane. However, LEED would
not be an appropriate technique for a titanium chloride film supported on MgCl2
(TiClx/MgCl2). First, the titanium species are not expected to have long-range order on
42
the supported catalyst that is necessary for diffraction.12 Second, the primary electron
beam of LEED will alter the film composition via electron-stimulated desorption (ESD)
of chlorine.10 The Ti-Cl bond of a TiClx species would be more susceptible to electron-
induced dissociation than the Mg-Cl bond of the MgCl2 substrate. The ease of this
process for TiClx is expected because the Ti ion can exist in multiple oxidation states.
Other techniques such as low-energy ion scattering (LEIS) cannot be employed for the
polycrystalline films because a large single domain is required for data analysis.13
With these techniques using electrons or ions as a probe ruled out, temperature-
programmed desorption (TPD) of organic molecules can be an alternative way to
differentiate various surface adsorption sites of the catalysts if different sites exhibit
different heats of desorption.14 The key requirements to be an appropriate probe
molecule are (1) strong and selective interaction with the various surface sites and (2)
molecular adsorption and intact desorption without changing surface composition and
structure. The second requirement is especially critical; otherwise, the effects of
various surface treatments should be determined from TPD data of different samples.
In this case, the catalyst samples must be prepared with extremely high reproducibility,
that is, the same adsorption site distribution, which is unlikely in the preparation of the
model Ziegler-Natta catalysts.
In a previous study, mesitylene was found to be a proper molecule for TPD
characterization of the model Ziegler-Natta catalysts.14 Due to the high stability of the
conjugated π-electron ring, mesitylene exhibited no chemical reaction with the model
catalyst upon adsorption and thermal desorption. The high polarizability of the
aromatic ring produced strong interactions with the surface. Compared to the case of
43
benzene, the presence of three electron-donating methyl groups increased electron
density in the aromatic ring, enhancing adsorbate-surface interactions.15
This work demonstrates that the mesitylene TPD technique is an effective way
to identify and quantify the surface adsorption sites of the TiClx/MgCl2 model Ziegler-
Natta polymerization catalysts. For the as-prepared TiClx/MgCl2 catalysts, two
desorption peaks were observed in mesitylene TPD. On the basis of the topographic
and structural knowledge of the film obtained with X-ray diffraction (XRD),16-18
density functional theory,19 scanning electron microscopy (SEM),20,21 LEED,10,11 and
ion scattering spectroscopy (ISS),22,23 two peaks were assigned to a site on the basal
plane where the metal ions are hexagonally coordinated with six chlorine ions and a
defective site where the metal ions are undercoordinated with chlorine ions. The latter
sites could be found at the basal plane boundaries or crystallographic dislocations on the
basal planes.16-21
The surface changes of the model catalyst, due to activation with
triethylaluminum and propylene polymerization, could be followed by the peak
temperature change of the mesitylene desorption. The mesitylene TPD technique has
also suggested that bulk chlorine atoms can diffuse to the surface to fill the defect sites
generated on the basal planes both by electron irradiation and by atomic Mg adsorption
from the gas phase.22,23 This diffusion process lowered the surface energy of the film to
an equilibrium value. The mobility of bulk chlorine ions might suggest that the bulk
chlorine atoms act as an inhibitor in surface reactions of the catalyst with electron
donors (Lewis bases) to form stereospecific polymerization sites at the catalyst surface.
44
Section 3.2 Experimental Section
The experiments were performed in a UHV chamber equipped with a sputter ion
gun for surface cleaning, an X-ray source, a double-pass cylindrical mirror analyzer
(CMA) with a coaxial electron gun for X-ray photoelectron spectroscopy (XPS) and
Auger electron spectroscopy (AES), and a quadrupole mass spectrometer (QMS) for
residual gas analysis and TPD. The UHV chamber was pumped by a 2000 L/s diffusion
pump and maintained a base pressure of about 1 x 10⁻⁹ Torr. A commercially available
sample manipulator provided three-dimensional translation and 360o rotation of the
sample. The chamber also had three leak valves for gas exposure, a Mg evaporation
source for the Mg dose, an electron flood gun for electron beam irradiation onto the
sample, and an internal high-pressure reaction cell (HP) for in-situ polymerization.
Further details were given elsewhere.24 Gas admittance into the UHV chamber was
controlled with leak valves facing the sample. Nominal pressures reported in this paper
were readouts of the nude ion gauge, located about 20 cm away from the sample,
without correction for ionization sensitivity and dosing geometry.
A polycrystalline Au foil (1.2 cm2) was used as an inert substrate that could be
heated resistively to 1000 K and cooled to 100 K. The surface temperature was
measured using a K-type thermocouple attached to the back of the foil. The Au foil was
cleaned with Ar ion sputtering followed by annealing at 900 K. Surface cleanliness was
checked with XPS and AES. TiCl4 and mesitylene (1, 3, 5-trimethylbenzene) were
purified by several freeze-pump-thaw cycles.
Thin films of titanium chloride and magnesium chloride, TiClx/MgCl2, were
fabricated by codeposition of TiCl4 and Mg metal on the Au foil at 300 K. During
45
deposition, the substrate faced both the Mg evaporation source and the TiCl4 doser at
60o with respect to the surface normal. Mg was evaporated from the Mg source during
the TiCl4 exposure. Adjusting the Mg source temperature (TMg) and exposure time
controlled the Mg dose. With TMg = 600 K, the Mg flux on the Au substrate was
estimated to be about 6 x 10¹² atoms/cm2·s.24
XPS was used to measure the surface composition and oxidation states. The X-
ray source was positioned 55o with respect to the surface normal and emitted the Al Kα
line (1486.6 eV). The angle between the X-ray source and the CMA axis was 90o. The
Au 4f7/2 peak at 84 eV was taken as a reference for the energy scale. The titanium
oxidation state distribution was obtained from the deconvolution of the Ti 2p XPS
spectra with a series of synthetic peaks that represented the photoelectron emission from
different oxidation states.24,25
In mesitylene TPD experiment, the deposited film was exposed to a given
exposure (1 L = 1x10⁻⁶ Torr . s) of mesitylene and then resistively heated at a ramp rate
of 4 K/s. The QMS ionizer was covered with a shroud that had an aperture of about 5
mm, positioned about 1 cm from the surface, to discriminate background desorption.
QMS signals, up to 5 masses, were recorded with a computer.
As a reference surface for mesitylene TPD, MgCl2 multilayers were deposited
on Au at 300 K by thermal evaporation of MgCl2 from a separate Knudsen cell, until no
Au signal was observable in AES. XPS confirmed the stoichiometry of MgCl2.
After high-pressure catalyst activation and propylene polymerization in the HP
cell, the changes in surface composition and adsorption sites of the model catalyst film
were studied using XPS and mesitylene TPD in UHV. The model catalyst was
46
activated by exposing it to ~1 Torr of triethylaluminum (AlEt3) for 3 min at 300K.
After the AlEt3 was pumped out, 800 Torr of propylene was introduced and the catalyst
temperature was increased to 343K.
Section 3.3 Results and Discussion
The film structure, composition, and titanium oxidation state distribution of the
model catalyst film (TiClx/MgCl2) are summarized briefly here. Mg was completely
oxidized to Mg2+, forming MgCl2 multilayers. Most of the deposited TiClx species
were present at the film surface. The TiClx/MgCl2 film was stable up to 400 K, above
which TiCl4 desorbed. More details have been described elsewhere.24
Mesitylene adsorbed molecularly on the TiClx/MgCl2 film at 100 K and
desorbed intact in the temperature range 170-350 K. The desorption profile of
mesitylene was highly reproducible in the TPD experiments for a single sample,
indicative of reversible mesitylene desorption without altering the catalyst surface
composition. No hydrocarbon desorption was detected at temperatures higher than
350K. The peak desorption temperature decreased with increasing mesitylene exposure
in the monolayer regime, indicative of repulsive interadsorbate interactions. For this
reason, the mesitylene exposure in TPD was limited to lower than 1.5 L (about 30% of
the monolayer saturation coverage) in order to avoid the effect of interadsorbate
interactions in the desorption profile. A multilayer desorption peak appeared at about
175 K for exposures larger than ~4.5 L (data not shown).
Section 3.3.1 Identification of Surface Adsorption Sites. The mesitylene
TPD of the TiClx/MgCl2 film exhibited two distinct peaks at 205-220 and 260-273 K, as
47
shown in Figure 1a. The narrowness of the full width at half-maximum (fwhm ~ 20 K)
implied that each peak corresponds to a single adsorption site. Hereafter, each site will
be called A and B, respectively, for convenience. From their relative intensities, the site
distribution on the catalyst surface was calculated to be 84% of the A site and 16% of
the B site. Assuming first-order desorption kinetics and a pre-exponential value of 1013
s-1, the mesitylene desorption energies from the A and B sites were calculated to be
12.3-13.3 kcal/mol and 15.9-16.6 kcal/mol, respectively.26
The mesitylene TPD profile for a MgCl2 film is presented in Figure 1b. The
multilayer MgCl2 film was chosen as a reference because its surface structure has been
determined with LEED10,11 and its bulk crystalline structure is similar to those of
titanium chlorides.16-18 Two desorption peaks (A and B) were observed in the same
temperature range as in Figure 1a. The widths (fwhm) of these two desorption peaks
appeared to be the same. The relative ratio of A/B on the MgCl2 film was about 70:30,
indicating that the B site concentration was twice that of Figure 1a. Due to the
repulsive nature of the lateral interactions between the adsorbates, the higher
concentration of the B site on MgCl2 lowered the peak temperature of mesitylene
desorption from this site, in comparison to the data of Figure 1a (∆T ~ 10 K for 1.4L).
The lower mesitylene desorption temperature from the B site at higher concentration of
the B site was also observed from the TiClx/MgCl2 films (see Figures 2, 4, and 5).
The mesitylene TPD alone could not determine unambiguously the surface
structure of the TiClx/MgCl2 model Ziegler-Natta catalyst. However, one could deduce
the surface structure corresponding to the A and B sites, observed in Figure 1, on the
basis of (1) the similarity of the mesitylene TPD profiles for the TiClx/MgCl2 and
48
MgCl2 films, (2) the close analogy of the crystal structure for MgCl2, TiCl2, and
TiCl3,1,16-18 (3) the shape of the microcrystals of TiCl3,20,21 (4) the surface structure of
MgCl2,10,11 and (5) the surface composition of the MgCl2 and TiClx/MgCl2 films.22,23
These halide crystals have a layered structure, each layer consisting of two monoatomic
layers of chlorine atoms octahedrally coordinated to intercalating metal atoms. The
surface energies of the (001) basal planes of these crystals are the lowest, owing to the
very weak interaction (dispersive interaction) between the neighboring layers.19
Therefore, the majority of the film surfaces of TiClx/MgCl2 and MgCl2 will adopt the
basal plane structure to lower the film surface energy. The SEM images of the TiCl3
films20,21 and LEED studies of the MgCl2 multilayer film10,11 confirmed that the
surfaces of these films consist of small platelets with the (001) basal plane structure.
Since the desorption peak (205-220 K) from the A site was dominant in the mesitylene
TPD (Figure 1), the A site could be attributed to the (001) basal plane. This site would
be called a coordinatively saturated site because the metal ions under the chlorine layer
are coordinated with six chlorine atoms.
Since the heat of mesitylene desorption was higher for the B site than the A site,
the surface structure of the B site must be different from that of the A site. The He+ ISS
studies of the model Ziegler-Natta catalysts films22,23 found that the surfaces of these
films are terminated with chlorine ions and no metal ions are exposed to vacuum. So it
was unlikely that the high-temperature desorption peak originated from mesitylene
molecules directly adsorbed to metal ions. To distinguish from the A site, the B site
would be called a coordinatively unsaturated site where the metal ions under the
chlorine layer are undercoordinated. Since the majority of the film surface had the
49
(001) basal plane structure, these minor sites (15-30% depending on the deposition
conditions) could be the crystallographic dislocations on the basal plane formed during
the crystal growth,20 or other crystallographic planes at the boundaries of the (001) basal
plane.21
Even though the data could not select the most plausible structure, the presence
of only one peak attributable to the undercoordinated site suggested that only one
structure appeared dominant among various possible structures. Busico et al. suggested
the presence of the (100) and (110) planes on the small MgCl2 particulates.27 The
MgCl2 (100) surface has the Mg atoms coordinated to five chlorine atoms. The MgCl2
(110) surface has the Mg atoms coordinated to four chlorine atoms. If these surfaces
retain their bulk-terminated structure without any reconstruction, the mesitylene TPD
would distinguish these two surface structures. However, the fact that there was only
one defect peak indicated these energetically unstable surfaces undergo significant
reconstruction to lower the surface energy,19 leading to a structure with the chlorine
densities similar to each other.
One of the goals of probe-molecule TPD characterization of the model Ziegler-
Natta catalysts was to quantify the Ti concentration at the catalyst surface.
Unfortunately, mesitylene TPD could not distinguish the titanium-containing site from
the magnesium-containing site. This could be attributed to the chlorine termination of
the catalyst surface.11,22,23 Metal chlorides always tend to have a chlorine-terminated
surface to lower the system surface energy.19 On these surfaces, the main interactions
of the physisorbed mesitylene molecule with the surface would be van der Waals
50
interactions between the adsorbate and the chlorine layer whose atomic densities were
determined by the metal coordination under the layer.
For metal-specific TPD characterization, chemisorption of a small molecule
might be required. In this case, however, the chemisorbed probe molecule would not
desorb below the polymerization temperature and would alter the surface composition
of the catalyst. When dimethyl ether, one of the weakest Lewis bases, was used as a
probe molecule, a small fraction of the adsorbed molecules desorbed along with the
titanium species at T > 450K.14 Stronger Lewis bases, for example, ethyl benzoate used
as an internal electron donor, could replace the titanium chloride species chemisorbed
on the MgCl2 surface.1,2 Petts and Waugh studied the adsorption isotherm of allene (a
weak poison for ethylene and propylene polymerization) on the TiCl3-based high-
surface-area catalysts and found that a certain fraction of the allene was irreversibly
adsorbed; that is, the desorbed amount was always less than the adsorbed amount.28 It
should be noted that, even with the weak poison probe, they found only two adsorption
sites on the powdered sample, with a low-temperature site being dominant, consistent
with this data.
Section 3.3.2 Catalyst Activation and Propylene Polymerization. After
reacting with AlEt3 (cocatalyst) the model TiClx/MgCl2 catalyst film was active for the
gas-phase polymerization of propylene. Figure 2 presents the XPS and mesitylene TPD
data obtained with a single catalyst film at various stages of the polymerization process.
The fresh TiClx/MgCl2/Au film showed the Mg, Ti and Cl signals of the catalyst as well
as the Au substrate signal in XPS and two types of the surface adsorption sites (A/B =
78:22) in mesitylene TPD (Figure 2a). Compared to Figure 1, the desorption
51
temperature of the B site in Figure 2 was lower due to a higher concentration of the B
site (22% in Figures 2 and 16% in Figure 1). At a higher defect concentration, the
mesitylene molecules adsorbed at the defect sites will feel more repulsive interadsorbate
interactions, leading to desorption at a lower temperature.
After catalyst activation by the reaction with about 1 Torr of AlEt3 for 3 min at
300 K, XPS (Figure 2b) showed the reduction of Ti4+ and Ti3+ species into Ti2+ species
(Table 1) and a slight decrease in the Cl signal and a slight increase in the C signal
(most likely C2H5), indicative of surface alkylation. This was consistent with a previous
study.29 These surface changes lowered the mesitylene desorption temperature to a
different extent for the A and B sites (Figure 2b), indicative of weaker interactions of
mesitylene with the activated surface species. It appeared that the alteration of the
mesitylene desorption profile was caused more likely by the alkylation, not by the metal
reduction, because the mesitylene TPD was not sensitive to the metal identity (Figure 1)
or oxidation state (see Figure 3) under the outermost chlorine layer. However, it should
be noted that the alkylation and reduction of the catalyst are not separate processes; that
is, both result from the AlEt3 alkylation.
Accepting the structural assignments for the surface sites from section 3.3.1 and
the reaction stoichiometry data reported by Rodriguez et al.,30 one could describe the
surface alkylation by AlEt3 as replacement of one Cl ligand with one C2H5 group for the
coordinately saturated site (A) and addition of one C2H5 group to the undercoordinated
site (B). Then, the slight decrease (about 6K) of the mesitylene desorption temperature
for the A site could be attributed to a slightly lower polarizability of the C2H5 group that
replaced the Cl anion.30 The large decrease (about 16 K) of the mesitylene desorption
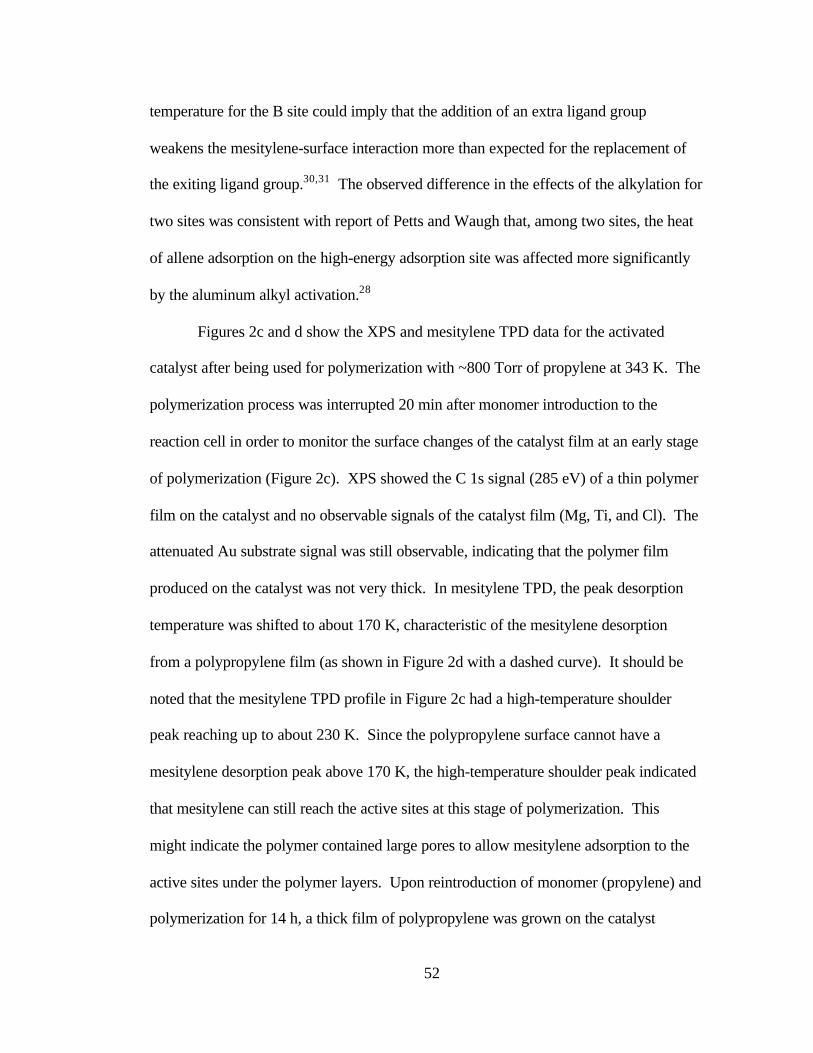
52
temperature for the B site could imply that the addition of an extra ligand group
weakens the mesitylene-surface interaction more than expected for the replacement of
the exiting ligand group.30,31 The observed difference in the effects of the alkylation for
two sites was consistent with report of Petts and Waugh that, among two sites, the heat
of allene adsorption on the high-energy adsorption site was affected more significantly
by the aluminum alkyl activation.28
Figures 2c and d show the XPS and mesitylene TPD data for the activated
catalyst after being used for polymerization with ~800 Torr of propylene at 343 K. The
polymerization process was interrupted 20 min after monomer introduction to the
reaction cell in order to monitor the surface changes of the catalyst film at an early stage
of polymerization (Figure 2c). XPS showed the C 1s signal (285 eV) of a thin polymer
film on the catalyst and no observable signals of the catalyst film (Mg, Ti, and Cl). The
attenuated Au substrate signal was still observable, indicating that the polymer film
produced on the catalyst was not very thick. In mesitylene TPD, the peak desorption
temperature was shifted to about 170 K, characteristic of the mesitylene desorption
from a polypropylene film (as shown in Figure 2d with a dashed curve). It should be
noted that the mesitylene TPD profile in Figure 2c had a high-temperature shoulder
peak reaching up to about 230 K. Since the polypropylene surface cannot have a
mesitylene desorption peak above 170 K, the high-temperature shoulder peak indicated
that mesitylene can still reach the active sites at this stage of polymerization. This
might indicate the polymer contained large pores to allow mesitylene adsorption to the
active sites under the polymer layers. Upon reintroduction of monomer (propylene) and
polymerization for 14 h, a thick film of polypropylene was grown on the catalyst
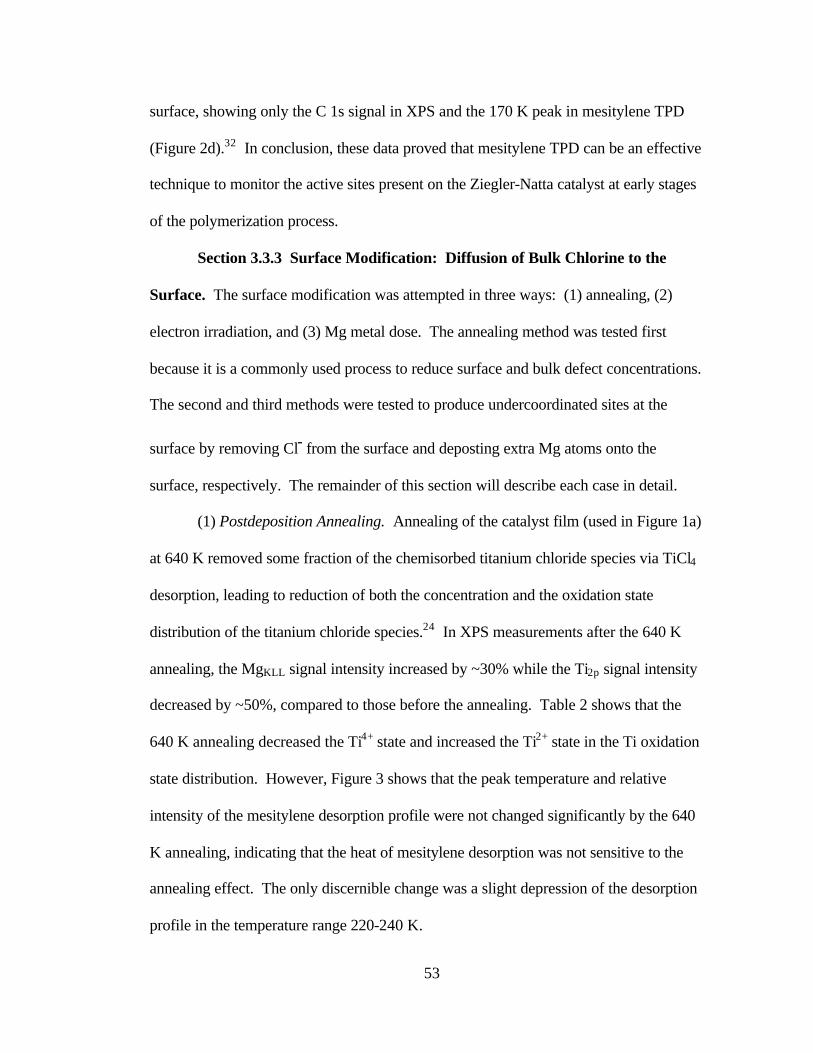
53
surface, showing only the C 1s signal in XPS and the 170 K peak in mesitylene TPD
(Figure 2d).32 In conclusion, these data proved that mesitylene TPD can be an effective
technique to monitor the active sites present on the Ziegler-Natta catalyst at early stages
of the polymerization process.
Section 3.3.3 Surface Modification: Diffusion of Bulk Chlorine to the
Surface. The surface modification was attempted in three ways: (1) annealing, (2)
electron irradiation, and (3) Mg metal dose. The annealing method was tested first
because it is a commonly used process to reduce surface and bulk defect concentrations.
The second and third methods were tested to produce undercoordinated sites at the
surface by removing Cl- from the surface and deposting extra Mg atoms onto the
surface, respectively. The remainder of this section will describe each case in detail.
(1) Postdeposition Annealing. Annealing of the catalyst film (used in Figure 1a)
at 640 K removed some fraction of the chemisorbed titanium chloride species via TiCl4
desorption, leading to reduction of both the concentration and the oxidation state
distribution of the titanium chloride species.24 In XPS measurements after the 640 K
annealing, the MgKLL signal intensity increased by ~30% while the Ti2p signal intensity
decreased by ~50%, compared to those before the annealing. Table 2 shows that the
640 K annealing decreased the Ti4+ state and increased the Ti2+ state in the Ti oxidation
state distribution. However, Figure 3 shows that the peak temperature and relative
intensity of the mesitylene desorption profile were not changed significantly by the 640
K annealing, indicating that the heat of mesitylene desorption was not sensitive to the
annealing effect. The only discernible change was a slight depression of the desorption
profile in the temperature range 220-240 K.
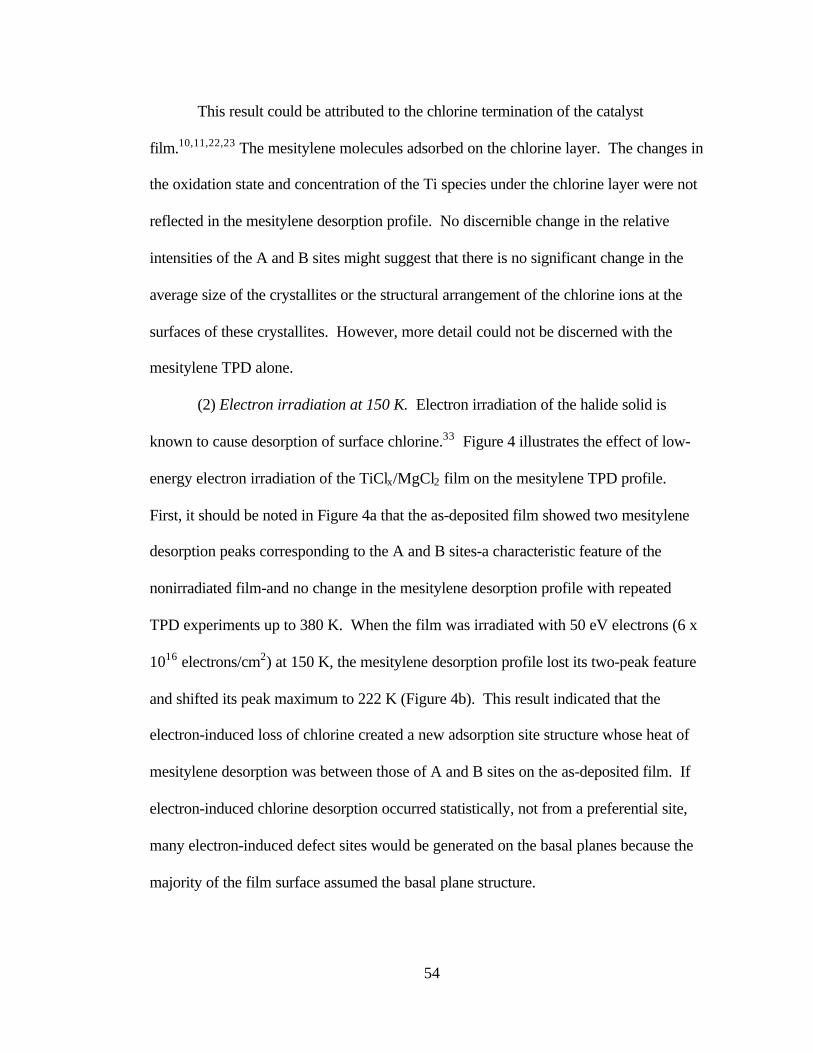
54
This result could be attributed to the chlorine termination of the catalyst
film.10,11,22,23 The mesitylene molecules adsorbed on the chlorine layer. The changes in
the oxidation state and concentration of the Ti species under the chlorine layer were not
reflected in the mesitylene desorption profile. No discernible change in the relative
intensities of the A and B sites might suggest that there is no significant change in the
average size of the crystallites or the structural arrangement of the chlorine ions at the
surfaces of these crystallites. However, more detail could not be discerned with the
mesitylene TPD alone.
(2) Electron irradiation at 150 K. Electron irradiation of the halide solid is
known to cause desorption of surface chlorine.33 Figure 4 illustrates the effect of low-
energy electron irradiation of the TiClx/MgCl2 film on the mesitylene TPD profile.
First, it should be noted in Figure 4a that the as-deposited film showed two mesitylene
desorption peaks corresponding to the A and B sites-a characteristic feature of the
nonirradiated film-and no change in the mesitylene desorption profile with repeated
TPD experiments up to 380 K. When the film was irradiated with 50 eV electrons (6 x
1016 electrons/cm2) at 150 K, the mesitylene desorption profile lost its two-peak feature
and shifted its peak maximum to 222 K (Figure 4b). This result indicated that the
electron-induced loss of chlorine created a new adsorption site structure whose heat of
mesitylene desorption was between those of A and B sites on the as-deposited film. If
electron-induced chlorine desorption occurred statistically, not from a preferential site,
many electron-induced defect sites would be generated on the basal planes because the
majority of the film surface assumed the basal plane structure.
55
In repeating the TPD experiment for the same film, the two-peak desorption
feature characteristic of the nonirradiated films appeared again. Heating to 380 K
appeared to be enough to anneal the electron-irradiated film surface and recover the
original surface structure before electron irradiation. This result could indicate that,
during the TPD run, bulk chlorine atoms diffuse and fill the electron-induced defect
sites, lowering the surface energy of the plane.
Figure 4c shows the effect of 200 eV electron irradiation at 150 K. With the
same electron dose (6 x 10¹⁶ electrons/ cm2), more noticeable changes were observed in
the mesitylene desorption profile and more heating cycles were required to recover the
original desorption profile. The enhanced electron-irradiation effect could be explained
with a secondary electron effect. At higher energy of the incident electrons, more
secondary electrons are generated34-36 and participated in the electron-stimulated
desorption of chlorine, leading to more damage on the film surface.
Electron irradiation at 150 K altered the film surface at a much lower dose than
that for electron irradiation at 300 K. In previous studies, ion scatting spectroscopy
(ISS) showed that electron irradiation of titanium chloride and MgCl2 films at 300 K
exposed metals at the film/vacuum interface only after extended irradiation of the film
with a focused beam of 1keV electrons.22,23 However, with the current irradiation
conditions (small electron dose at 150 K), no Mg0 was detected in XPS while the
mesitylene TPD monitored the formation of chlorine-deficient sites at the surface. This
higher efficiency at low temperature could be attributed to suppression of the chlorine
diffusion from the bulk at low temperature.
56
(3) Metallic Mg Dose at 150 K. An attempt was made to produce Mg adatoms
on the TiClx/MgCl2 catalyst surface by depositing Mg atoms at 150 K. The deposition
rate of Mg was about half a monolayer per minute. Figure 5 compares the mesitylene
desorption profiles for the as-depostied film and the Mg-dosed films. The data showed
no change in the mesitylene TPD profile with the Mg doses on the TiClx/MgCl2 film,
indicating that the Mg adatoms were immediately covered with chlorine atoms. This
result could be explained with the reaction of the adsorbed Mg atoms with the
TiClx(Ti4+) species in the surface layer even at 150 K.37
It is interesting to note that the Mg atom doses at 150 K did not produce any
change in the surface adsorption site structure (Figure 5) while the electron-induced
desorption of chlorine at 150 K produced a new adsorption site structure that was
removed by chlorine diffusion only at higher temperatures (Figure 4). In the case of the
Mg dose onto the film, the adsorbed Mg atoms energetically favored reaction with
TiClx(Ti4+) species in the surface layer rather than with the MgCl2 species.24 This
process reduced the Ti oxidation state and converted the Mg adatoms to MgCl2,
recovering the chlorine-terminated surface structure. In contrast, the hyperthermal
electron irradiation removed chlorine atoms from both Mg2+ and Ti4+ species in the
surface layer. In addition, it altered the underlayer composition. For electrons of a
kinetic energy of 5-200 eV, the inelastic mean free path of electrons is typically on the
order of 5-10Å,38 which is about 2-3 times the c-axis of the MgCl2 unit cell.11
Therefore, the electron-induced process altered the surface composition and structure
more significantly than the Mg dose producing more prominent changes in the
mesitylene desorption profile.
57
Section 3.3.4 Implications to the Catalyst Preparation and Polymerization.
Lowering of the surface energy by diffusion of bulk chlorine atoms to the surface
defects, observed in these experiments, will provide insights into the dynamic roles of
the MgCl2 substrate in reactions with TiCl4 and ethyl benzoate (internal Lewis base).
For preparation of high-surface-area catalysts, comilling of MgCl2 with TiCl4 always
gives more MgCl2 size reduction and more TiCl4 incorporation, compared to milling of
MgCl2 alone followed by reaction with TiCl4.39-41 Ethyl benzoate or ethanol are often
comilled with MgCl2 to stabilize newly exposed faces that are created by the milling
action and are responsible for stereospecific polymerization of propylene.42-44 The
efficacy of the comilling processes can now be understood in light of the fast diffusion
of bulk chlorine to the surface from the bulk. When MgCl2 is milled alone, the
undercoordinated sites produced during the milling process will be immediately
chlorinated by the chlorine atoms from the bulk, lowering the concentration of the
binding sites for TiCl4 and ethyl benzoate.
The importance of the undercoordinated sites in stereospecific polymerization of
propylene has been studied by correlating the mesitylene TPD profile for the model
catalyst produced by different methods and the isotacticity of the polypropylene
produced with these model catalysts.45 When a MgCl2-free model catalyst was
prepared by electron-induced deposition of TiCl4, the A site in the mesitylene TPD
(basal plane structure) was absent and the gas-phase polymerization without any Lewis
base produced exclusively isotactic polypropylene. When a model catalyst was
produced by the codeposition of Mg and TiCl4, the mesitylene TPD showed the same
profile as reported in this work and both atactic and isotactic polypropylene were
58
produced. In the former case, the simultaneous and continuous irradiation of electrons
during the catalyst deposition seemed to be responsible for removal of chlorine from the
film, lowering the formation of the basal plane structure on the film surface. These
studies showed that the capability to titrate the surface adsorption site distribution
would be expected to aid understanding of stereospecific polymerization.
Section 3.4 Conclusions
TPD of mesitylene has been shown to be an efficient method for surface
adsorption site characterization of the model Ziegler-Natta polymerization catalyst
films. The mesitylene TPD for the TiClx/MgCl2 film indicated the presence of two
distinct adsorption site structures that have different chlorine arrangements. The
dominant site was a coordinately saturated site of the basal plane structure. The minor
site was tentatively attributed to a coordinatively unsaturated site at the basal plane
boundaries or defects. Due to the chlorine termination of the catalyst surface, the
mesitylene TPD could not distinguish the identity and oxidation state of the metals
under the chlorine layer. The catalyst activation by AlEt3 was accompanied by a
lowering of the mesitylene desorption temperature from the alkylated sites. The
catalyst film revealed a remarkably high diffusion rate of the bulk chlorine atoms to the
surface to fill chlorine-deficient defect sites that were generated by Cl removal from the
basal plane or Mg addition to the basal plane.
59
Section 3.5 References (1) Barbe, P. C.; Cecchin, G.; Noristi, L. Adv. Polym. Sci. 1987, 81, 1. (2) Dusseault, J. J. A.; Hsu, C. C. J. M. S.- Rev. Macromol. Chem. Phys. 1993, C33,
103. (3) Floyd, S.; Heiskanen, T.; Tayor, T. W.; Mann, G. E. J. Appl. Polym. Sci. 1987,
33, 1021. (4) Shiono, T.; Hagihara, H.; Ikeda, T.; Soga, K. Polymer 1997, 38, 6409. (5) Misra, S.; Lu, F. M.; Spruiell, J. E.; Richeson, G. C. J. Appl. Polym. Sci. 1995,
56, 1761. (6) Andreassen, E.; Myhre, O. J.; Hinrichsen, E. L.; Grostad, K. J. J. Appl. Polym.
Sci. 1994, 52, 1505. (7) Ogawa, T. J. Appl. Polym. Sci. 1992, 44, 1869. (8) Flood, J. E.; Nulf, S. A. Polym. Eng. Sci. 1990, 30, 1504. (9) Somorjai, G. A. Chapter 2. In Introduction to Surface Chemistry and Catalysis;
John Wiley and Sons: New York, 1994. (10) Fairbrother, D. H.; Roberts, J. G.; Rizi, S.; Somorjai, G. A. Langmuir 1997, 13,
2090. (11) Fairbrother, D. H.; Roberts, J. G.; Somorjai, G. A. Surf. Sci. 1998, 399, 109. (12) Hasebe, K.; Mori, H.; Tomitori, M.; Keii, T.; Terano, M. J. Mol. Catal. A 1997,
115, 259. (13) Woodruff, D. P.; Delchar, T. A. In Modern Techniques of Surface Science; 2nd
ed.; Cambridge University Press: London, 1994; pp 292. (14) Kim, S. H.; Somorjai, G. A. Appl. Surf. Sci. 2000, 161, 333. (15) Bruggerman, K.; Czernuszewicz, R. S.; Kochi, K. J. J. Phys. Chem. 1992, 96,
4405. (16) Giunchi, G.; Allegra, G. J. Appl. Chrystallogr. 1984, 17, 172. (17) Allegra, G. Macromol. Symp. 1995, 89, 163. (18) Kashiwa, N. Polym. J. 1980, 12, 603.
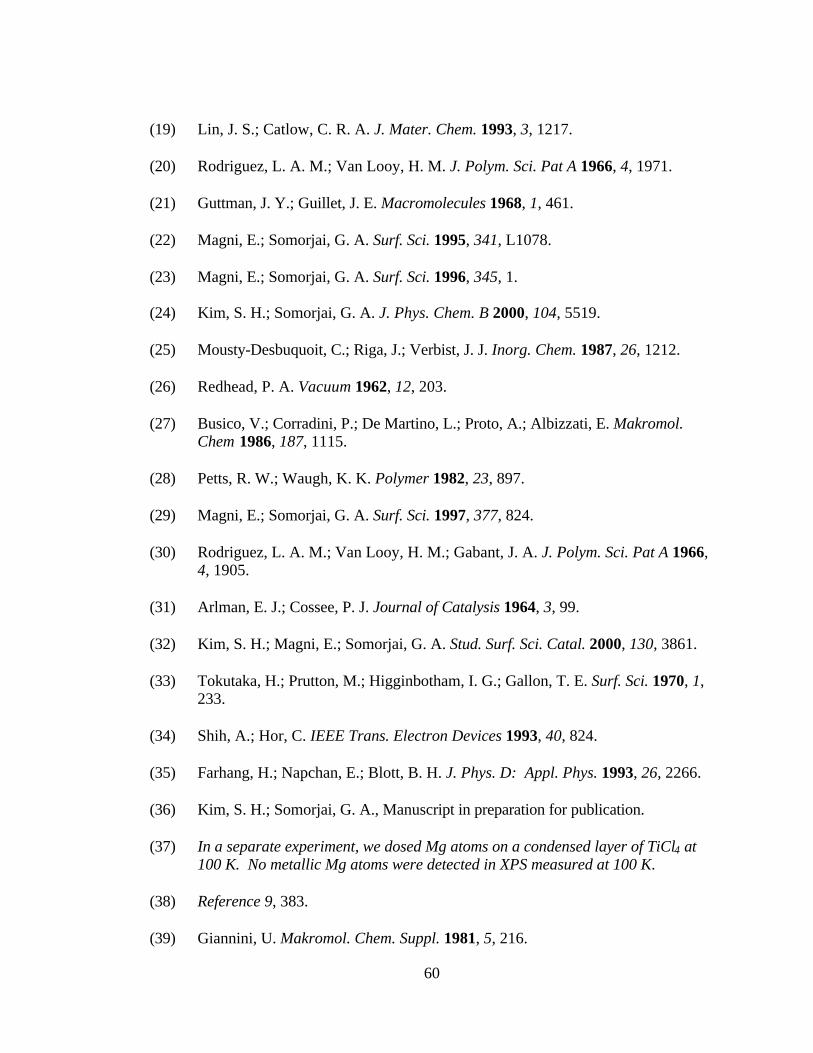
60
(19) Lin, J. S.; Catlow, C. R. A. J. Mater. Chem. 1993, 3, 1217. (20) Rodriguez, L. A. M.; Van Looy, H. M. J. Polym. Sci. Pat A 1966, 4, 1971. (21) Guttman, J. Y.; Guillet, J. E. Macromolecules 1968, 1, 461. (22) Magni, E.; Somorjai, G. A. Surf. Sci. 1995, 341, L1078. (23) Magni, E.; Somorjai, G. A. Surf. Sci. 1996, 345, 1. (24) Kim, S. H.; Somorjai, G. A. J. Phys. Chem. B 2000, 104, 5519. (25) Mousty-Desbuquoit, C.; Riga, J.; Verbist, J. J. Inorg. Chem. 1987, 26, 1212. (26) Redhead, P. A. Vacuum 1962, 12, 203. (27) Busico, V.; Corradini, P.; De Martino, L.; Proto, A.; Albizzati, E. Makromol.
Chem 1986, 187, 1115. (28) Petts, R. W.; Waugh, K. K. Polymer 1982, 23, 897. (29) Magni, E.; Somorjai, G. A. Surf. Sci. 1997, 377, 824. (30) Rodriguez, L. A. M.; Van Looy, H. M.; Gabant, J. A. J. Polym. Sci. Pat A 1966,
4, 1905. (31) Arlman, E. J.; Cossee, P. J. Journal of Catalysis 1964, 3, 99. (32) Kim, S. H.; Magni, E.; Somorjai, G. A. Stud. Surf. Sci. Catal. 2000, 130, 3861. (33) Tokutaka, H.; Prutton, M.; Higginbotham, I. G.; Gallon, T. E. Surf. Sci. 1970, 1,
233. (34) Shih, A.; Hor, C. IEEE Trans. Electron Devices 1993, 40, 824. (35) Farhang, H.; Napchan, E.; Blott, B. H. J. Phys. D: Appl. Phys. 1993, 26, 2266. (36) Kim, S. H.; Somorjai, G. A., Manuscript in preparation for publication. (37) In a separate experiment, we dosed Mg atoms on a condensed layer of TiCl4 at
100 K. No metallic Mg atoms were detected in XPS measured at 100 K. (38) Reference 9, 383. (39) Giannini, U. Makromol. Chem. Suppl. 1981, 5, 216.
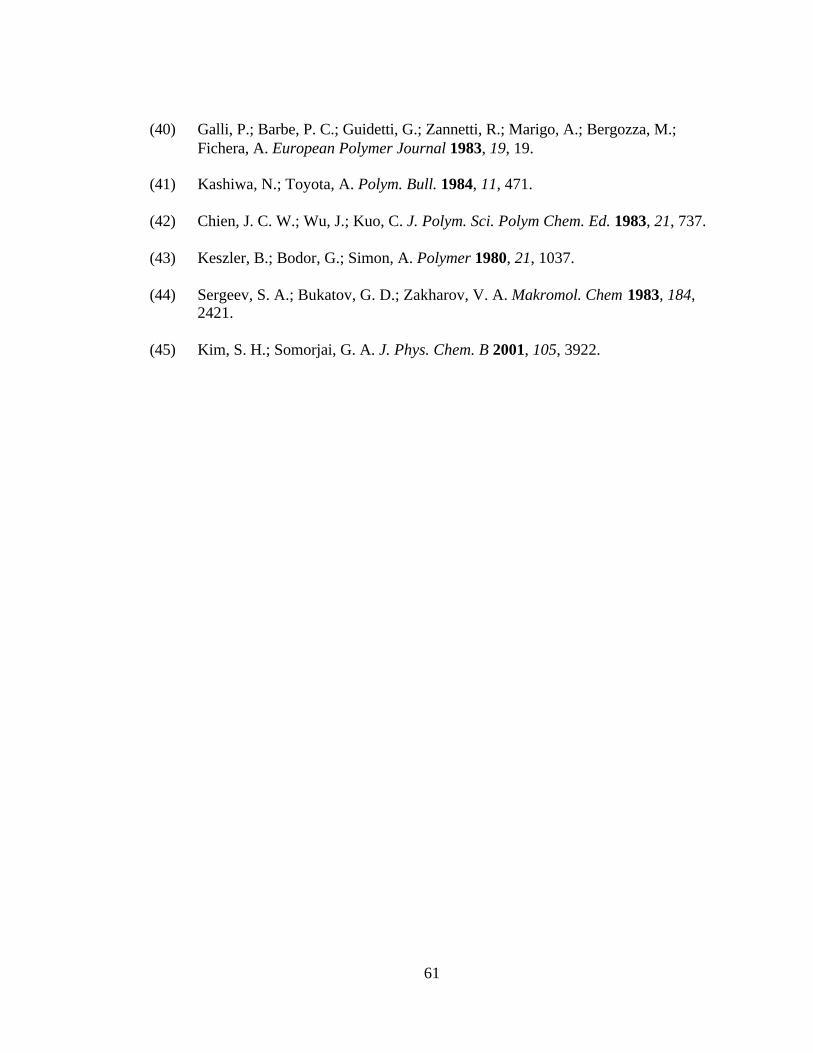
61
(40) Galli, P.; Barbe, P. C.; Guidetti, G.; Zannetti, R.; Marigo, A.; Bergozza, M.;
Fichera, A. European Polymer Journal 1983, 19, 19. (41) Kashiwa, N.; Toyota, A. Polym. Bull. 1984, 11, 471. (42) Chien, J. C. W.; Wu, J.; Kuo, C. J. Polym. Sci. Polym Chem. Ed. 1983, 21, 737. (43) Keszler, B.; Bodor, G.; Simon, A. Polymer 1980, 21, 1037. (44) Sergeev, S. A.; Bukatov, G. D.; Zakharov, V. A. Makromol. Chem 1983, 184,
2421. (45) Kim, S. H.; Somorjai, G. A. J. Phys. Chem. B 2001, 105, 3922.
62
Table 3.1 Effect of the AlEt3 activation on the Ti oxidation state distribution (%) in the TiClx / MgCl2 film deposited by reaction of Mg with TiCl4.a,b
a. XPS Measurement: 300K b. P(TiCl4) = 2 x 10⁻⁷ Torr, TMg = 610 K, deposition time = 10 min c. P(AlEt3) = 1 Torr, Tsample = 300 K, reaction time = 3 min
63
Table 3.2 Effect of the annealing on the Ti oxidation state distribution (%) in the TiClx / MgCl2 film deposited by reaction of TiCl4.a,b
a. XPS Measurement: 300K b. P(TiCl4) = 1 x 10⁻⁷ Torr, TMg = 600 K, deposition time = 10 min c. Figure 3.1 d. Figure 3.3
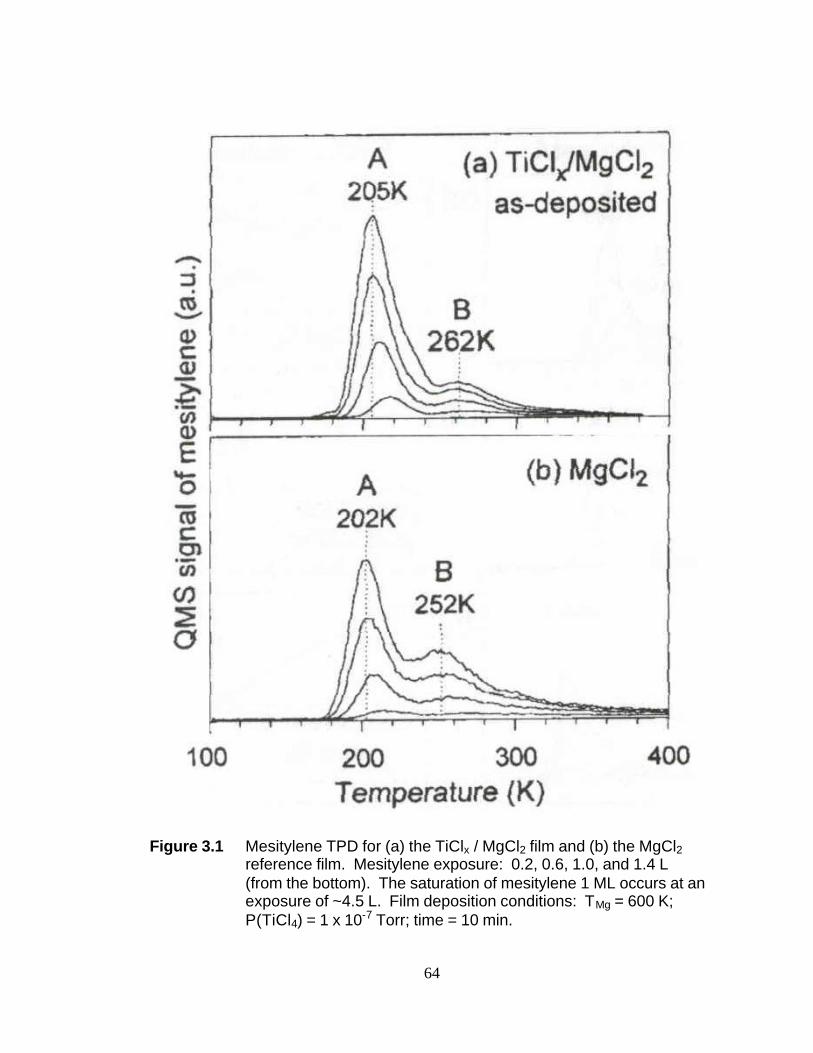
64
Figure 3.1 Mesitylene TPD for (a) the TiClx / MgCl2 film and (b) the MgCl2
reference film. Mesitylene exposure: 0.2, 0.6, 1.0, and 1.4 L (from the bottom). The saturation of mesitylene 1 ML occurs at an exposure of ~4.5 L. Film deposition conditions: TMg = 600 K; P(TiCl4) = 1 x 10⁻⁷ Torr; time = 10 min.
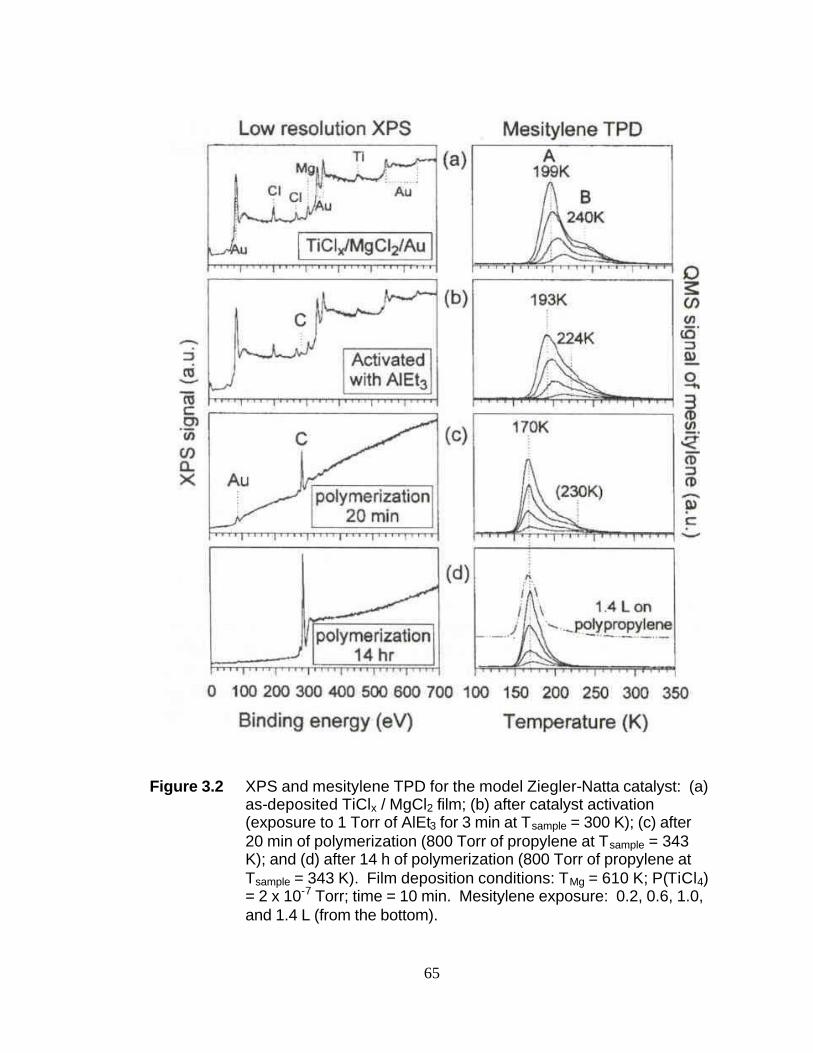
65
Figure 3.2 XPS and mesitylene TPD for the model Ziegler-Natta catalyst: (a)
as-deposited TiClx / MgCl2 film; (b) after catalyst activation (exposure to 1 Torr of AlEt3 for 3 min at Tsample = 300 K); (c) after 20 min of polymerization (800 Torr of propylene at Tsample = 343 K); and (d) after 14 h of polymerization (800 Torr of propylene at Tsample = 343 K). Film deposition conditions: TMg = 610 K; P(TiCl4) = 2 x 10⁻⁷ Torr; time = 10 min. Mesitylene exposure: 0.2, 0.6, 1.0, and 1.4 L (from the bottom).
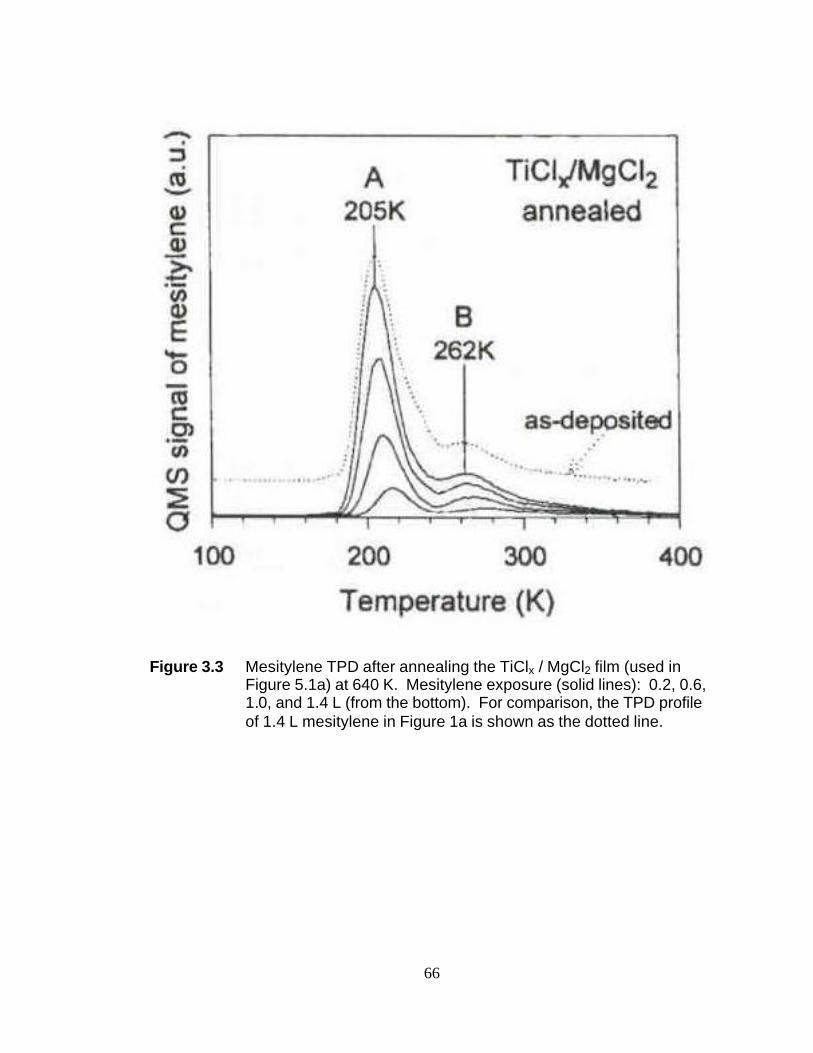
66
Figure 3.3 Mesitylene TPD after annealing the TiClx / MgCl2 film (used in Figure 5.1a) at 640 K. Mesitylene exposure (solid lines): 0.2, 0.6, 1.0, and 1.4 L (from the bottom). For comparison, the TPD profile of 1.4 L mesitylene in Figure 1a is shown as the dotted line.
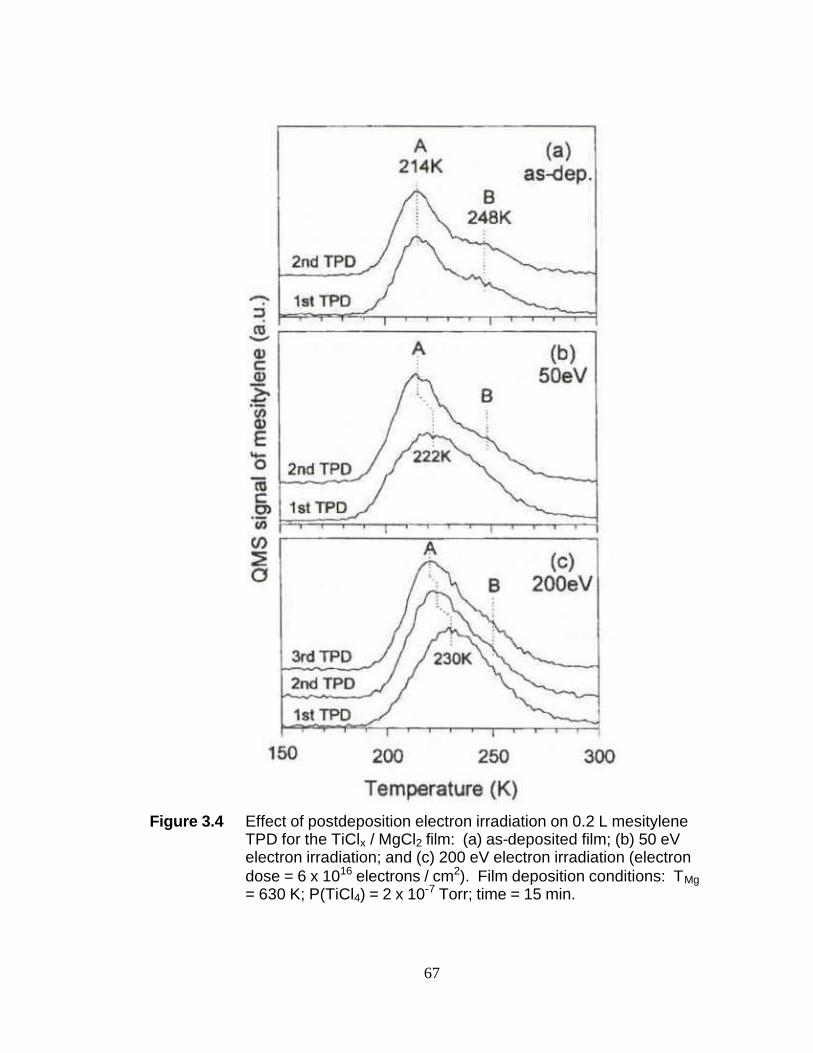
67
Figure 3.4 Effect of postdeposition electron irradiation on 0.2 L mesitylene
TPD for the TiClx / MgCl2 film: (a) as-deposited film; (b) 50 eV electron irradiation; and (c) 200 eV electron irradiation (electron dose = 6 x 10¹⁶ electrons / cm2). Film deposition conditions: TMg = 630 K; P(TiCl4) = 2 x 10⁻⁷ Torr; time = 15 min.
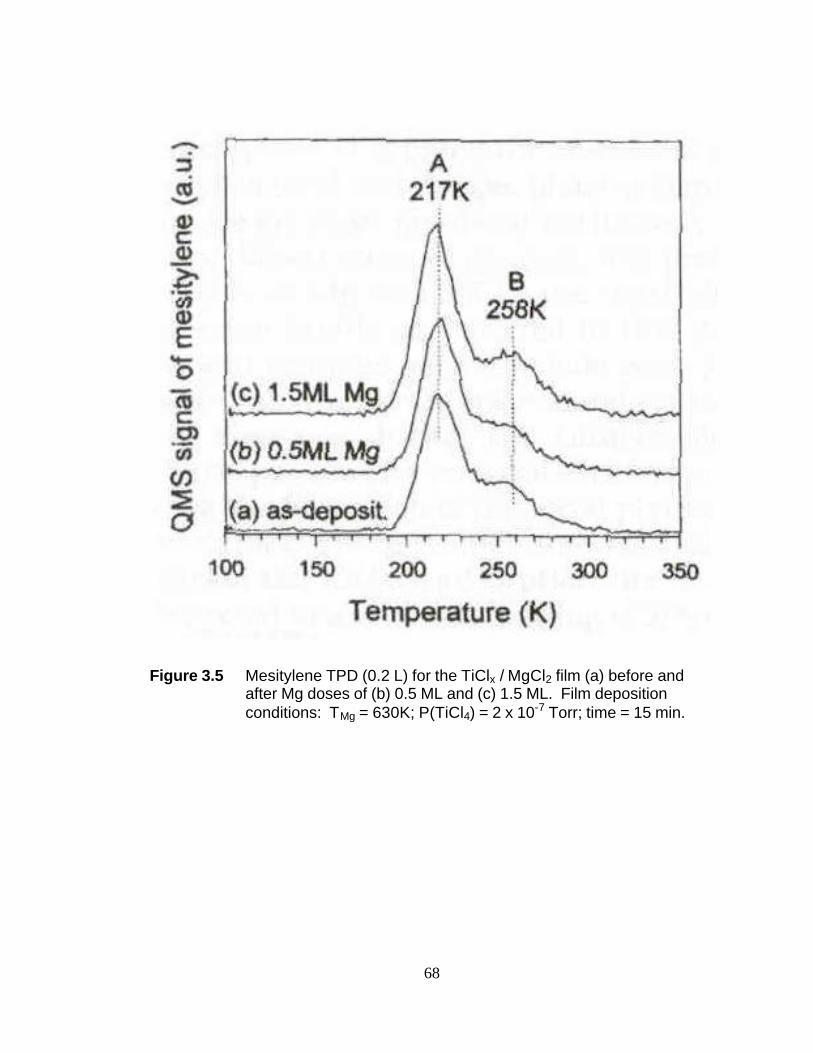
68
Figure 3.5 Mesitylene TPD (0.2 L) for the TiClx / MgCl2 film (a) before and after Mg doses of (b) 0.5 ML and (c) 1.5 ML. Film deposition conditions: TMg = 630K; P(TiCl4) = 2 x 10⁻⁷ Torr; time = 15 min.
Chapter 4 Characterization and in situ Monitoring of Model and Industrial Ziegler-Natta Catalytic Support Materials Using Ultraviolet-Raman Spectroscopy
Section 4.1 Introduction
High-yield Ziegler-Natta polymerization catalysts are based on a TiCl4 catalyst
with an Al-trialkyl co-catalyst supported on chemically activated MgCl2. The nature of
the active site for this highly-active and stereospecific polypropylene catalyst has been
the subject of Chapter 3 and numerous other studies.1-18 The molecular-level
information gained from these ex-situ studies has led to the recent report of a correlation
between different surface adsorption sites and the degree of stereospecificity in
propylene polymerization.19 The ability to probe the structure of a Ziegler-Natta
catalyst in-situ can provide a significant opportunity to extend the success of these ex-
situ studies.
Toward this end, this chapter discusses the first step in developing a technique to
probe the structure of Ziegler-Natta catalysts in situ. UV-Raman spectroscopy has been
applied to the study of Mg-ethoxide Ziegler-Natta supports prepared from MgCl2 and
ethanol. Characterization of these supports is important because it is known that
chemically activating MgCl2 with an electron donor such as ethanol, markedly affects
both catalyst performance and polymer properties.20-24
70
In this chapter UV-Raman spectroscopic studies of MgCl2(C2H5OH)x adducts
prepared over a wide composition range, x = 0.47 to 6, are reported. Structures were
determined for the x = 2 and x = 6 adducts by XRD.25,26 The results reported in this
dissertation confirm the dissociation of the Mg-Cl octahedra at x > 2. The Raman
frequency of the O-H stretch shifts as the C2H5OH to MgCl2 molar ratio is altered. A
unique correlation between the Raman O-H peak frequency and the MgCl2(C2H5OH)x
composition is reported. This correlation is used as an in situ tool to monitor the
dealcoholation of an industrial Mg-ethoxide support sample. The origin of a vibrational
spectroscopic feature unique to the x = 6 adduct is discussed.
Section 4.2 Experimental
A series of MgCl2(C2H5OH)x adducts with 0 < x < 6 were synthesized at Basell
“G. Natta” Research Center in Ferrara, Italy. The samples were synthesized by addition
of pure ethanol (Ethanol 99.8% purchased from Carlo Erba) to crystalline α-MgCl2
(purchased from Cezus and sieved to select crystals between 700 and 1000 ? m, XRD
pattern in Figure 4.1) in precise different stoichiometric amounts which resulted in a
swollen white material. The material, independent of composition, was heated to 180
0C at a rate of 5 0C/min, followed by a slow cooling to room temperature at a rate of 0.5
0C/min. After the thermal treatment the samples were reduced to powder by manual
milling for 5 minutes into an agate mill in order to obtain a fine powder suitable to be
loaded into fused silica capillaries. This entire procedure was performed in an inert, dry
atmosphere. The error in determining the molar composition of the synthesized systems
is estimated to be within ± 3% based on thermogravimetric analysis.27 The samples
71
were determined to be crystalline by differential scanning calorimetry.27 The XRD
pattern for the sample with x = 6 is compared to a reference spectrum in Figure 4.2.
The X-ray Powder Diffraction (XRD) spectra of the synthesized samples were
obtained with a Phylips Powder Diffractometer PW 1710. The Cu-K? 1 radiation (λ=
0.154 nm) was employed and an instrumental 2θ step of 0.1º every 6 seconds from 5º to
60º was selected. During the XRD measurement the samples were maintained in a N2
atmosphere in a well sealed polyethylene bag that was kept out of the focal plane. The
absolute diffraction line positions were determined relative to the diffraction lines of
silicon powder that was added to the sample as internal position line reference.
Figure 4.3 is an overview of the UV-Raman spectroscopy experimental setup.
The excitation source is the 244 nm output of a Lexel SHG, an intracavity doubled,
continuous wave Ar+ laser. The 244 nm beam is focused at 45o to the sample normal by
a 2 cm focal length spherical lens. The Raman scattered light is collected by a 50 mm
diameter f/2 fused silica lens; this corresponds to a solid angle of collection of 0.20 sr.
The collected scattered light is focused on the entrance slit of a f/3.7 Triplemate triple
spectrometer by a 160 mm focal length lens. The filter stage of the Triplemate contains
two 2400 gr/mm diffraction gratings for efficient rejection of stray reflections and the
intense Rayleigh scattered light. A 2400 gr/mm diffraction grating is used in the
dispersion stage. The spectrum is collected on a back thinned, UV-enhanced liquid-
nitrogen-cooled 1340 x 100 pixel CCD detector. The quantum efficiency of the CCD
array at 244 nm is approximately 33%. The spectral resolution is ~24 cm-1.
Spectra obtained between 0 and 1500 cm-1 were calibrated using the well-known
Raman shifts of cyclohexane.28 Spectra obtained between 3200 and 3620 cm-1 were
72
calibrated using the O-H peak frequencies of gibbsite.29 This calibration was
extrapolated for use in a region spanning from 2800 to 3700 cm-1.
The spectrometer response function was assumed to be constant and no attempt
was made to correct the spectra. The absolute signal intensity did vary between
samples due to slight differences in the focus of the incident laser on the fused silica
capillary tubes. To facilitate comparison of peak intensities between spectra, one peak
in a given spectral region for each sample was chosen as an internal intensity standard.
The ν(CCO)s peak of ethanol at ~885 cm-1 was used for the spectra between 0 and 1500
cm-1. The ν(CH2)as peak of ethanol at ~2938 cm-1 was used for the spectra between
2800 and 3700 cm-1.
Sample integrity under the UV laser beam was investigated. Without thermal or
photochemical damage induced by the laser beam, the Raman intensity would increase
proportionally with the incident laser power. Raman spectra of the adducts were
obtained at 2, 4, 8, 12, and 16 mW. Signal intensity increased linearly with laser power
between 2 and 12 mW and all spectra reported here were obtained within this power
range. Another indication of sample integrity is the absence of any peak ~1630 cm-1
that is indicative of laser induced coke formation from the ethanol.30,31
Section 4.3 Results and Discussion
Section 4.3.1 Characterization of Model Mg-ethoxide Ziegler-Natta
Support Materials Crystalline MgCl2 belongs to the rhombohedral space group, D3d,
and has a layered structure. The magnesium atoms are in a distorted octahedral
configuration coordinated to six chlorine atoms. The octahedra are joined through
73
chlorine bridges. The Raman mode at 242 cm-1 has been assigned to the A1g breathing
of the octahedra in the lattice.32
Figure 4.4 shows the Raman spectra of powdered MgCl2, a series of
MgCl2(C2H5OH)x adducts, and liquid ethanol from 100 to 1600 cm-1. Features below
200 cm-1 in the MgCl2(C2H5OH)x adduct spectra are due to the fused silica capillary
tubes. The A1g mode of MgCl2 at 240 cm-1 is observed for the x = 1.67 adduct which
indicates the octahedral arrangement of chlorine atoms is maintained at this
stoichiometry. This mode is no longer present for the x = 2.05 adduct, indicating a loss
of the D3d symmetry of MgCl2. This result is consistent with the MgCl2(C2H5OH)2
structure proposed by Di Noto et al. based on their x-ray diffraction results on powdered
polycrystalline samples.25 They reported a structure where ethanol has disrupted the
D3d symmetry of solid MgCl2 through displacement of two chlorine atoms by oxygen
atoms of two ethanol molecules. The Mg atoms are connected through two chlorine
bridges creating a chain of repeating MgCl2(C2H5OH)2 units.
For x > 3.35, a peak at 683 cm-1 is observed which is not found in liquid ethanol.
As shown in Figure 4.5, the intensity of this mode relative to the ethanol ν(CCO)s peak
at ~875 cm-1 increases with the ethanol loading and is most intense for x = 6. The
structure of MgCl2(C2H5OH)6 has been solved by G. Valle et al.26 The structure
consists of Mg atoms octahedrally coordinated to six ethanol oxygens. The normal
modes for the octahedral point group, Oh, are shown in Figure 4.6. The Raman active
modes are A1g, Eg, and T2g. Previous IR studies show no peak around 683 cm-1.25 This
peak is most likely due to the A1g mode (Figure 4.7) since it contains inversion
symmetry and would not be simultaneously IR active. A review of the literature shows
74
a range of frequencies for Mg-O stretches that supports this assignment. Magnesium
oxide and magnesium hydroxide Mg-O stretches are found at 785 and 750 cm-1,
respectively.33,34 An ab initio calculation for a Mg2+O2- superperoxide complex predicts
a Mg-O stretch at 679 cm-1.35 In their HREELS study of the interaction of magnesium
with tris(8-hydroxy-quinoline) aluminum, P. He et al. proposed that their observed peak
at 653 cm-1 was due to a Mg-O stretch.36 The closest analogue to the x = 6 adduct that
is commercially available is Mg(OC2H5)2. A UV-Raman spectrum of this compound is
shown in Figure 4.8 along with a spectrum for C2H5OH and MgCl2(C2H5OH)6. There is
a small peak at ~600 cm-1 in the Mg(OC2H5)2 spectrum that could be due to a Mg-O
stretch. Given the difference in the coordination and symmetry around Mg2+, the
frequency shift and intensity decrease is not unreasonable. The validity of this
assignment could be improved by determining the depolarization ratio of the peak for a
single crystal. Assuming the spectral assignment to be correct, the increase in relative
intensity of this new peak indicates that the octahedral arrangement of the six ethanol
molecules begins to form below the stoichiometric value of x = 6.
In Figure 4.9, the spectra of liquid ethanol and the MgCl2(C2H5OH)x adducts in
the C-H and O-H stretching region are shown. The peaks in the 3230-3480 cm-1 range
are due to the O-H stretch of ethanol. The frequency of the O-H stretch is effected
strongly by the molar ratio of ethanol to MgCl2 whereas the C-H stretches are not. The
O-H stretch for the x = 0.47 adduct is well defined and centered at 3480 cm-1. For x >
1, the O-H stretch broadens and shifts to frequencies at or below the observed peak for
liquid ethanol where strong hydrogen bonding is known to occur.37-39 In the gas phase,
the O-H stretch of ethanol is not effected by hydrogen bonding and two peaks are
75
observed at 3660 and 3677 cm-1 which can be assigned to the gauche and trans isomers,
respectively.40,41 The O-H Raman shifts for adducts with x < 1 fall between those of
liquid and gas phase ethanol and indicate the O-H groups are involved in weak
hydrogen bonds. For x > 1, the observed O-H Raman shift falls below that of liquid
ethanol and therefore hydrogen bonding between ethanol molecules does not account
for the observed shift. The O-H stretch for the MgCl2(C2H5OH)6 adduct is observed at
3233 cm-1. The structure proposed for this adduct indicates that the hydrogen of each
alcohol group forms a hydrogen bond with a chlorine atom and each chlorine atom
contributes to the formation of three hydrogen bonds.26 Low temperature Raman
studies of concentrated ethanol-LiCl solid solutions have shown O-H Raman shifts as
low as 3285 cm-1, lower than that of liquid ethanol.42 Therefore, hydrogen bonding
with a chloride ion is a plausible explanation for the observed peak shift and is
consistent with the structure analysis of the MgCl2(C2H5OH)6 adduct.
In Figure 4.10 the O-H stretch peak frequency is plotted as a function of the
ethanol to MgCl2 ratio, x. As mentioned previously, the Mg atoms are connected
through two chlorine bridges creating a chain of repeating MgCl2(C2H5OH)2 units for
the x = 2 adduct. Below the stoichiometric value of x = 2, the O-H stretching frequency
is greater than that of the x = 2 adduct which indicates a similar structure, but with
fewer neighboring MgCl2(C2H5OH)2 units.
As x increases beyond 2, the chlorine bridges are broken as more ethanol is
incorporated into the Mg2+ coordination sphere. The ethanol hydroxy groups become
involved in more hydrogen bonds with the resultant chlorine anions as observed in the
continuous decrease in the O-H frequency.
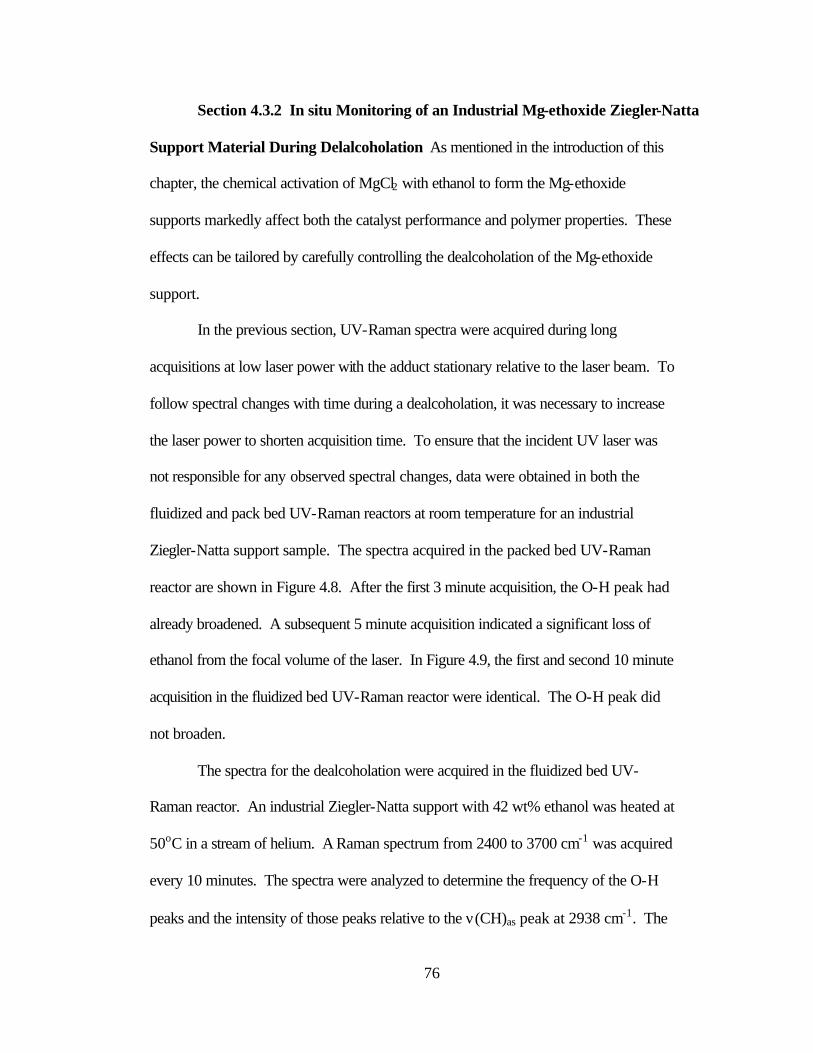
76
Section 4.3.2 In situ Monitoring of an Industrial Mg-ethoxide Ziegler-Natta
Support Material During Delalcoholation As mentioned in the introduction of this
chapter, the chemical activation of MgCl2 with ethanol to form the Mg-ethoxide
supports markedly affect both the catalyst performance and polymer properties. These
effects can be tailored by carefully controlling the dealcoholation of the Mg-ethoxide
support.
In the previous section, UV-Raman spectra were acquired during long
acquisitions at low laser power with the adduct stationary relative to the laser beam. To
follow spectral changes with time during a dealcoholation, it was necessary to increase
the laser power to shorten acquisition time. To ensure that the incident UV laser was
not responsible for any observed spectral changes, data were obtained in both the
fluidized and pack bed UV-Raman reactors at room temperature for an industrial
Ziegler-Natta support sample. The spectra acquired in the packed bed UV-Raman
reactor are shown in Figure 4.8. After the first 3 minute acquisition, the O-H peak had
already broadened. A subsequent 5 minute acquisition indicated a significant loss of
ethanol from the focal volume of the laser. In Figure 4.9, the first and second 10 minute
acquisition in the fluidized bed UV-Raman reactor were identical. The O-H peak did
not broaden.
The spectra for the dealcoholation were acquired in the fluidized bed UV-
Raman reactor. An industrial Ziegler-Natta support with 42 wt% ethanol was heated at
50oC in a stream of helium. A Raman spectrum from 2400 to 3700 cm-1 was acquired
every 10 minutes. The spectra were analyzed to determine the frequency of the O-H
peaks and the intensity of those peaks relative to the ν(CH)as peak at 2938 cm-1. The
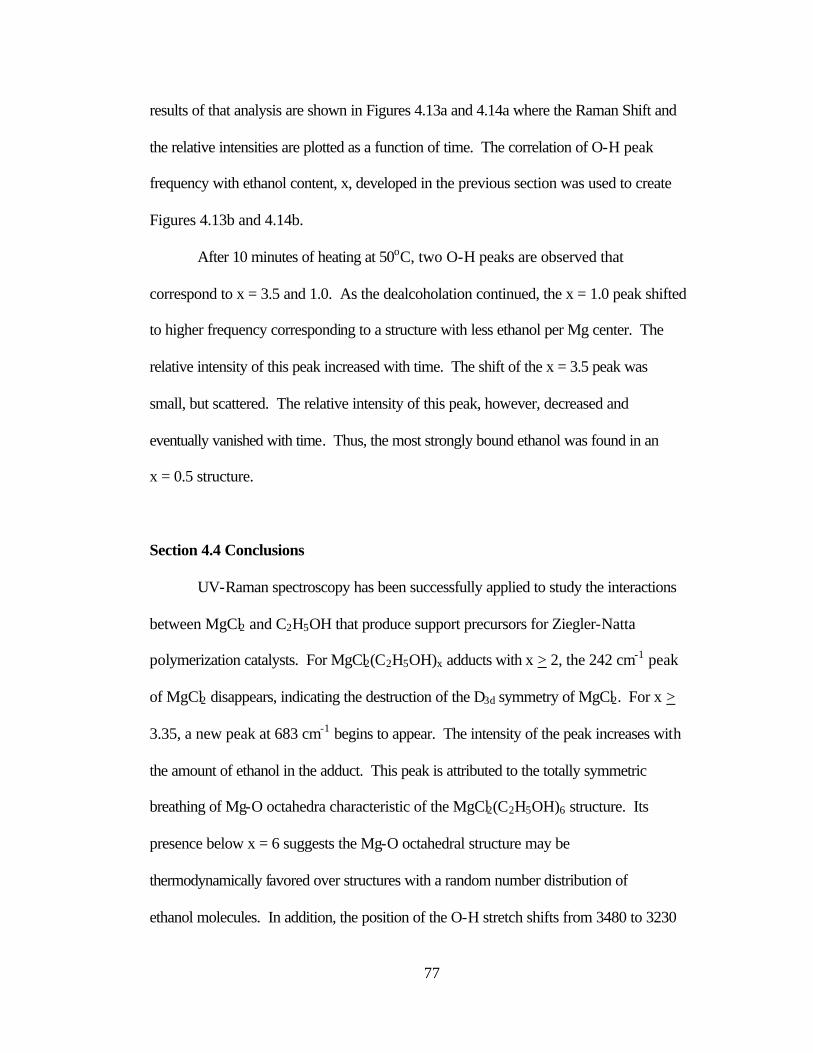
77
results of that analysis are shown in Figures 4.13a and 4.14a where the Raman Shift and
the relative intensities are plotted as a function of time. The correlation of O-H peak
frequency with ethanol content, x, developed in the previous section was used to create
Figures 4.13b and 4.14b.
After 10 minutes of heating at 50oC, two O-H peaks are observed that
correspond to x = 3.5 and 1.0. As the dealcoholation continued, the x = 1.0 peak shifted
to higher frequency corresponding to a structure with less ethanol per Mg center. The
relative intensity of this peak increased with time. The shift of the x = 3.5 peak was
small, but scattered. The relative intensity of this peak, however, decreased and
eventually vanished with time. Thus, the most strongly bound ethanol was found in an
x = 0.5 structure.
Section 4.4 Conclusions
UV-Raman spectroscopy has been successfully applied to study the interactions
between MgCl2 and C2H5OH that produce support precursors for Ziegler-Natta
polymerization catalysts. For MgCl2(C2H5OH)x adducts with x > 2, the 242 cm-1 peak
of MgCl2 disappears, indicating the destruction of the D3d symmetry of MgCl2. For x >
3.35, a new peak at 683 cm-1 begins to appear. The intensity of the peak increases with
the amount of ethanol in the adduct. This peak is attributed to the totally symmetric
breathing of Mg-O octahedra characteristic of the MgCl2(C2H5OH)6 structure. Its
presence below x = 6 suggests the Mg-O octahedral structure may be
thermodynamically favored over structures with a random number distribution of
ethanol molecules. In addition, the position of the O-H stretch shifts from 3480 to 3230

78
cm-1 as x increases from 0 to 6 relative to MgCl2. The correlation between O-H peak
shift and the C2H5OH to MgCl2 molar ratio, x, can be utilized as an in situ monitoring
tool. The in situ monitoring of the dealcoholation of an industrial Mg-ethoxide support
material indicated that the most strongly bound ethanol was found in the x = 0.5
structure. The tailoring of the catalyst performance with different dealcoholation
conditions could be due to creating a support with different ratios of strongly and
weakly bound ethanol before uptake of TiCl4.
79
Section 4.5 References
(1) Barbe, P. C.; Cecchin, G.; Noristi, L. Adv. Polym. Sci. 1987, 81, 1. (2) Dusseault, J. J. A.; Hsu, C. C. J. M. S.- Rev. Macromol. Chem. Phys. 1993, C33,
103. (3) Cossee, P. J. Journal of Catalysis 1964, 3, 80. (4) Arlman, E. J. Journal of Catalysis 1964, 3, 89. (5) Arlman, E. J.; Cossee, P. J. Journal of Catalysis 1964, 3, 99. (6) Fujimoto, H.; Koga, N.; Hataue, J. J. Phys. Chem. 1984, 88, 3539. (7) Guerra, G.; Pucciariello, R.; Villani, V.; Corradini, P. Polym. Commun. 1987,
28, 100. (8) Venditto, V.; Guerra, G.; Corradini, P. European Polymer Journal 1991, 27, 45. (9) Cavallo, L.; Guerra, G.; Corradini, P. J. Am. Chem. Soc. 1998, 120, 2428. (10) Lin, J. S.; Catlow, C. R. A. J. Mater. Chem. 1993, 3, 1217. (11) Colbourn, E. A.; Cox, P. A.; Carruthers, B.; Jones, P. J. V. J. Mater. Chem.
1994, 4, 805. (12) Shiga, A.; Kawamura-Kuribayashi, H.; Sasaki, T. J. Mol. Catal. 1994, 87, 243. (13) Shiga, A.; Kawamura-Kuribayashi, H.; Sasaki, T. J. Mol. Catal. 1995, 98, 15. (14) Puhakka, E.; Pakkanen, T. T.; Pakkanen, T. A. Surf. Sci. 1995, 334, 289. (15) Puhakka, E.; Pakkanen, T. T.; Pakkanen, T. A. J. Mol. Catal. A 1997, 120, 143. (16) Boero, M.; Parrinello, M.; Terakura, K. J. Am. Chem. Soc. 1998, 120, 2746. (17) Boero, M.; Parrinello, M.; Terakura, K. Surf. Sci. 1999, 438, 1. (18) Boero, M.; Parrinello, M.; Huffer, S.; Terakura, K. J. Am. Chem. Soc. 2000, 122,
501. (19) Kim, S. H.; Somorjai, G. A. J. Phys. Chem. B 2001, 105, 3922.
80
(20) Boor, J., Jr. Ziegler-Natta Catalysis and Polymerizations; Academic Press: New York, 1979.
(21) van der Ven, S. Polypropylene and Other Polyolefins: Polymerization and
Characterization; Elsevier: Amsterdam, 1990. (22) Albizzati, E.; Giannini, U.; Collina, G.; Noristi, L.; Resconi, L. In
Polypropylene Handbook; Moore, E. P., Jr., Ed.; Carl Hanser Verlag: Munich, 1996.
(23) Kissin, Y. V. Isospecific Polymerization of Olefins with Heterogeneous Ziegler-
Natta Catalysts; Springer: New York, 1985. (24) Encyclopedia of Polymer Science and Engineering; Wiley: New York, 1988;
Vol. 13. (25) Di Noto, V.; Zannetti, R.; Viviani, M.; Marega, C.; Marigo, A.; Bresadola, S.
Makromol. Chem 1992, 193, 1653. (26) Valle, G.; Baruzzi, G.; Paganetto, G.; Depaoli, G.; Zannetti, R.; Marigo, A.
Inorg. Chim. Acta 1989, 156, 157. (27) unpublished results, Basell "G. Natta" Research Center. (28) McCreery, R. L. Raman Spectroscopy for Chemical Analysis; Wiley-
Interscience: New York, 2000; Vol. 157. (29) Dollish, F. R.; Fateley, W. G.; Bentley, F. Characteristic Raman Frequencies of
Organic Compounds; John Wiley & Sons, Inc.: New York, 1974. (30) Chua, Y. T.; Stair, P. C. J. of Catal. 2000, 196, 66. (31) Gilkes, K. W. R.; Prawer, S.; Nugent, K. W.; Robertson, J.; Sands, H. S.;
Lifshitz, Y.; Shi, X. J. Applied Physics 2000, 87, 7283. (32) Balasubrahmanyam, K. J. Chem. Phys. 1966, 44, 3270. (33) Spectra of Diatomic Molecules; Van Nostrand Reinhold: New York, 1950. (34) Bunker, P. R.; Kolbuszewski, M.; Jensen, P.; Brumm, M.; Anderson, M. A.;
Barclay, W. L.; Ziurys, L. M.; Ni, Y.; Harris, D. O. Chemical Physics Letters 1995, 239, 217.
(35) Chen, J.; Wong, T. H.; Kleiber, P. D. Journal of Chemical Physics 1998, 109, 8311.
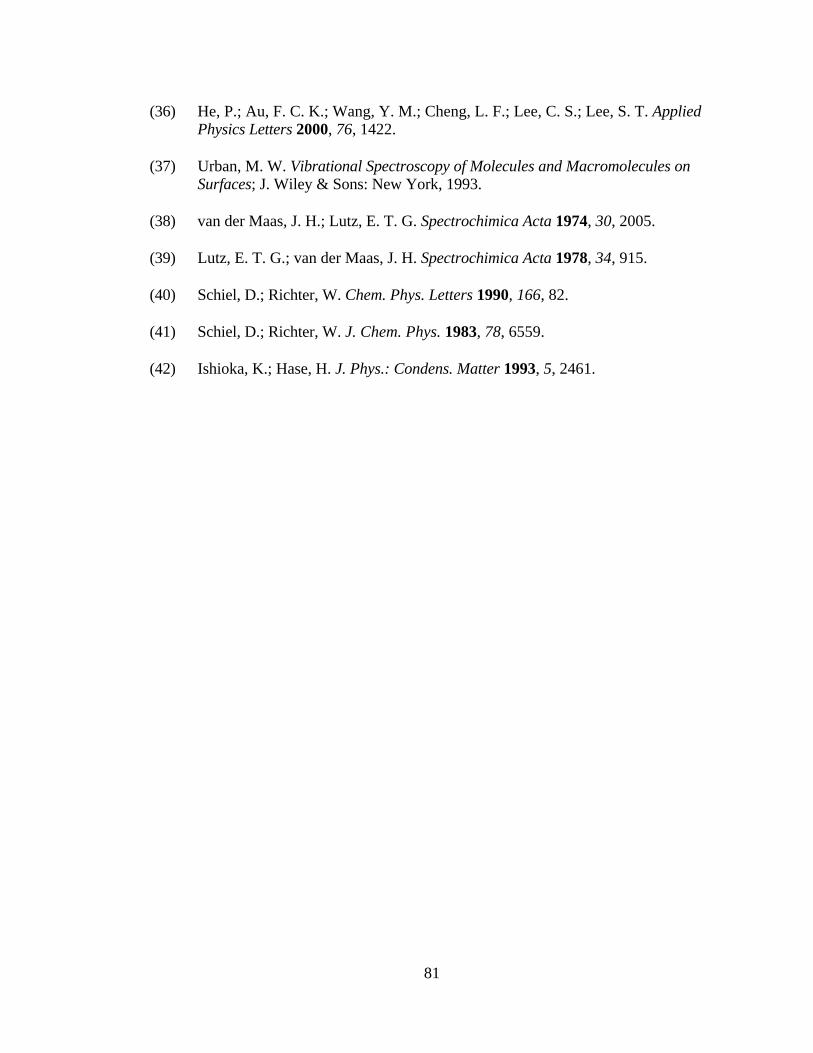
81
(36) He, P.; Au, F. C. K.; Wang, Y. M.; Cheng, L. F.; Lee, C. S.; Lee, S. T. Applied Physics Letters 2000, 76, 1422.
(37) Urban, M. W. Vibrational Spectroscopy of Molecules and Macromolecules on
Surfaces; J. Wiley & Sons: New York, 1993. (38) van der Maas, J. H.; Lutz, E. T. G. Spectrochimica Acta 1974, 30, 2005. (39) Lutz, E. T. G.; van der Maas, J. H. Spectrochimica Acta 1978, 34, 915. (40) Schiel, D.; Richter, W. Chem. Phys. Letters 1990, 166, 82. (41) Schiel, D.; Richter, W. J. Chem. Phys. 1983, 78, 6559. (42) Ishioka, K.; Hase, H. J. Phys.: Condens. Matter 1993, 5, 2461.
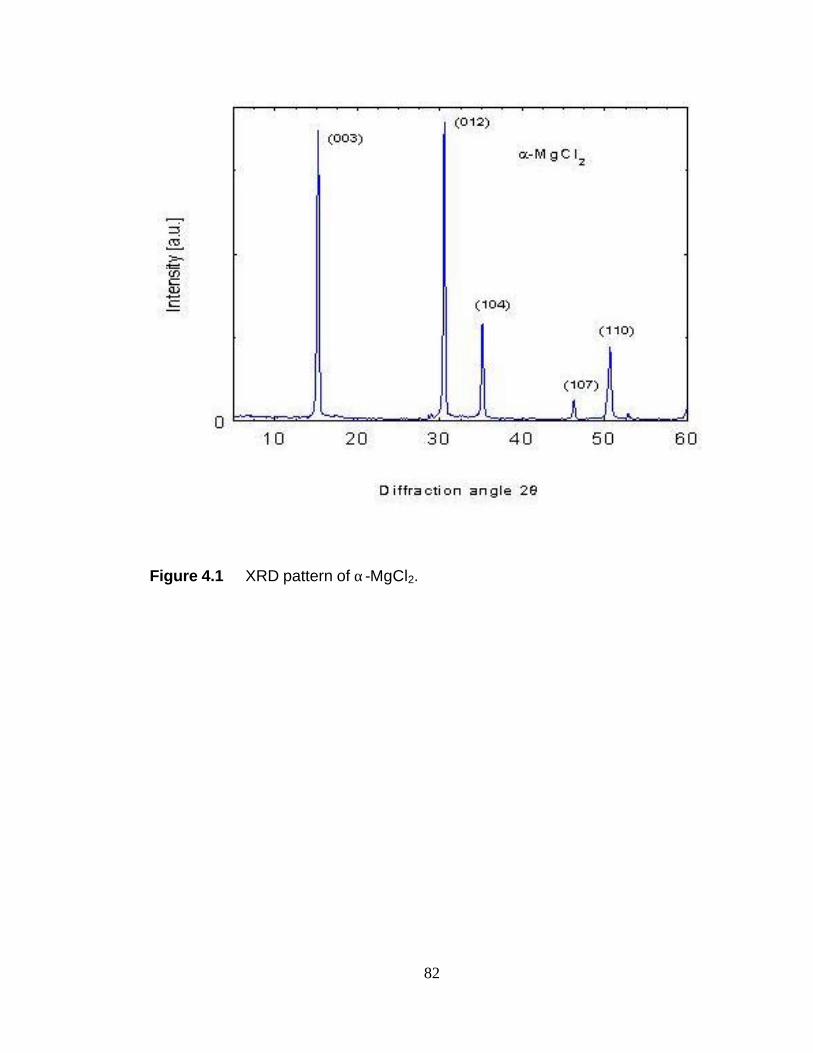
82
Figure 4.1 XRD pattern of α-MgCl2.
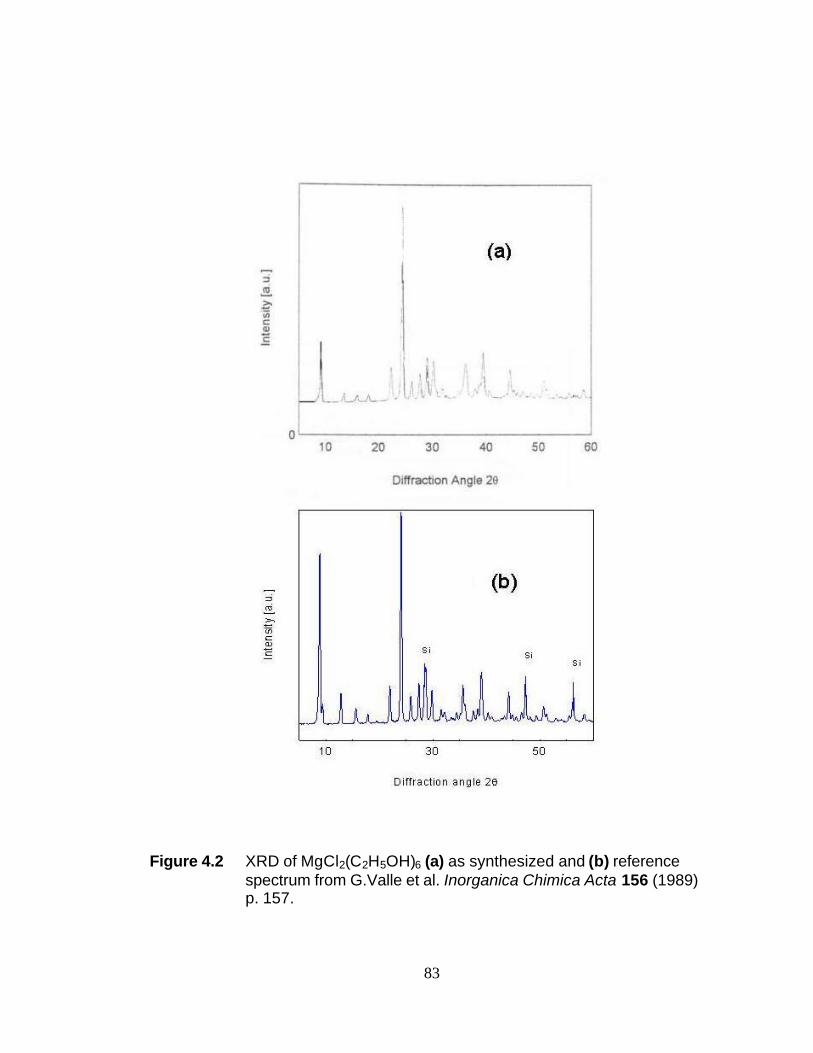
83
Figure 4.2 XRD of MgCl2(C2H5OH)6 (a) as synthesized and (b) reference spectrum from G.Valle et al. Inorganica Chimica Acta 156 (1989) p. 157.
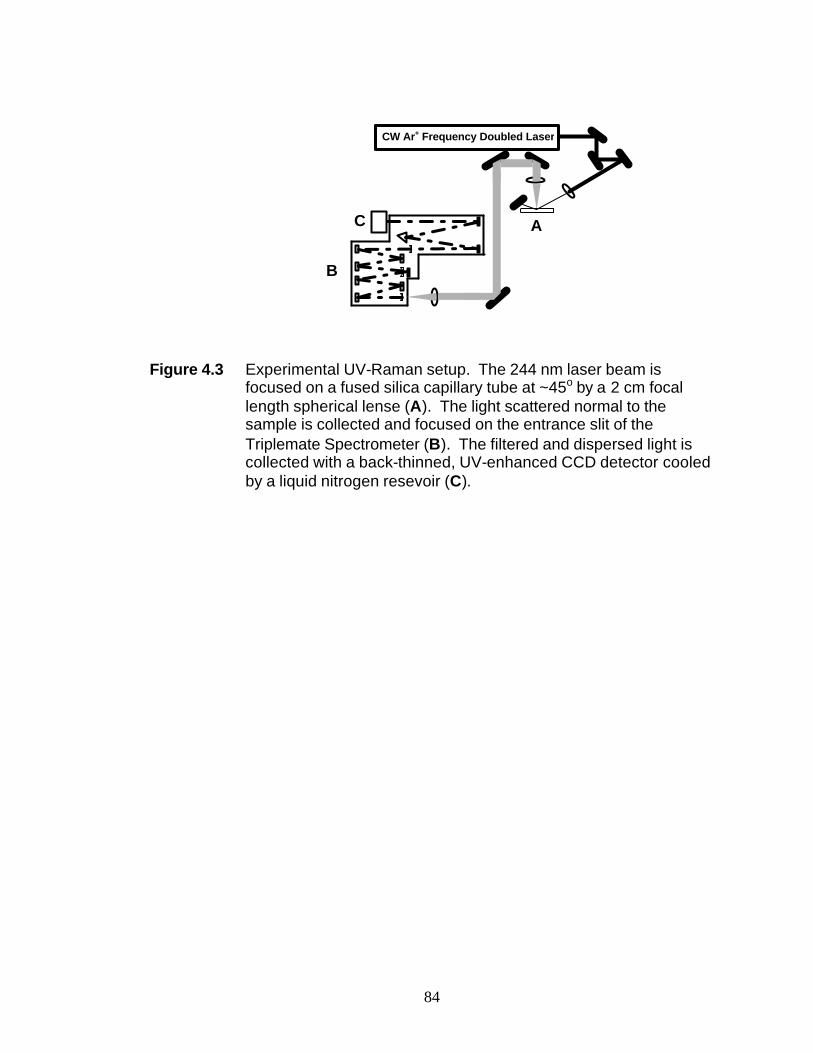
84
Figure 4.3 Experimental UV-Raman setup. The 244 nm laser beam is
focused on a fused silica capillary tube at ~45o by a 2 cm focal length spherical lense (A). The light scattered normal to the sample is collected and focused on the entrance slit of the Triplemate Spectrometer (B). The filtered and dispersed light is collected with a back-thinned, UV-enhanced CCD detector cooled by a liquid nitrogen resevoir (C).
CW Ar+ Frequency Doubled Laser
A
B
C
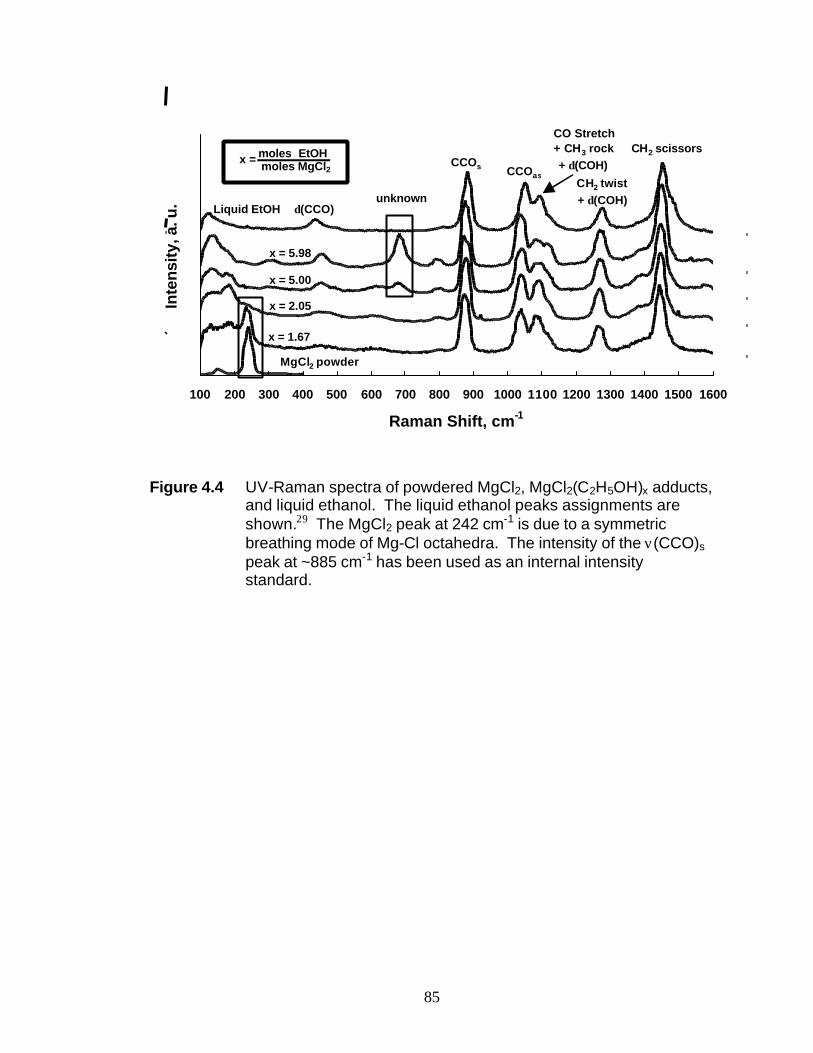
85
100 200 300 400 500 600 700 800 900 1000 1100 1200 1300 1400 1500 1600
Raman Shift, cm-1
Inte
nsity
, a. u
.
MgCl2 powder
x = 1.67
x = 2.05
x = 5.00
x = 5.98
Liquid EtOH
CCOasCCOs
CH2 twist + δ(COH)
δ(CCO)
CO Stretch + CH3 rock + δ(COH)
CH2 scissors
unknown
moles EtOHmoles MgCl2
x =
Figure 4.4 UV-Raman spectra of powdered MgCl2, MgCl2(C2H5OH)x adducts,
and liquid ethanol. The liquid ethanol peaks assignments are shown.29 The MgCl2 peak at 242 cm-1 is due to a symmetric breathing mode of Mg-Cl octahedra. The intensity of the ν(CCO)s peak at ~885 cm-1 has been used as an internal intensity standard.
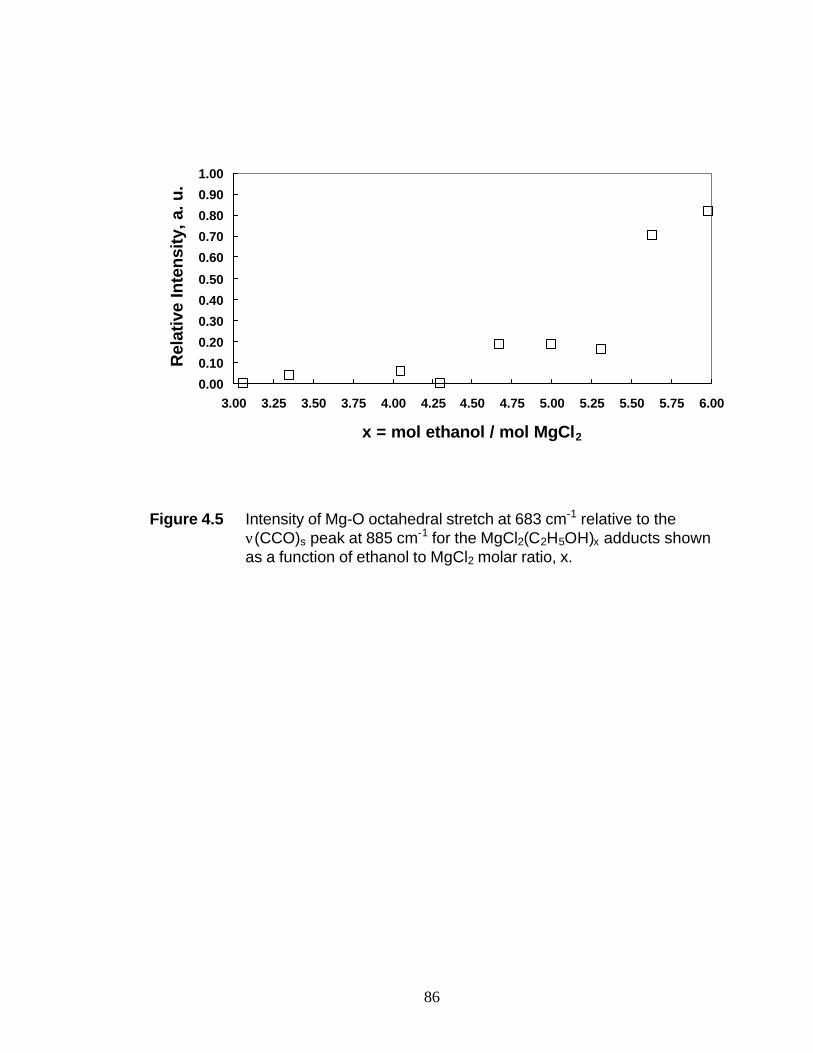
86
0.00
0.10
0.20
0.30
0.40
0.50
0.60
0.70
0.80
0.90
1.00
3.00 3.25 3.50 3.75 4.00 4.25 4.50 4.75 5.00 5.25 5.50 5.75 6.00
x = mol ethanol / mol MgCl2
Rel
ativ
e In
tens
ity, a
. u.
Figure 4.5 Intensity of Mg-O octahedral stretch at 683 cm-1 relative to the ν(CCO)s peak at 885 cm-1 for the MgCl2(C2H5OH)x adducts shown as a function of ethanol to MgCl2 molar ratio, x.
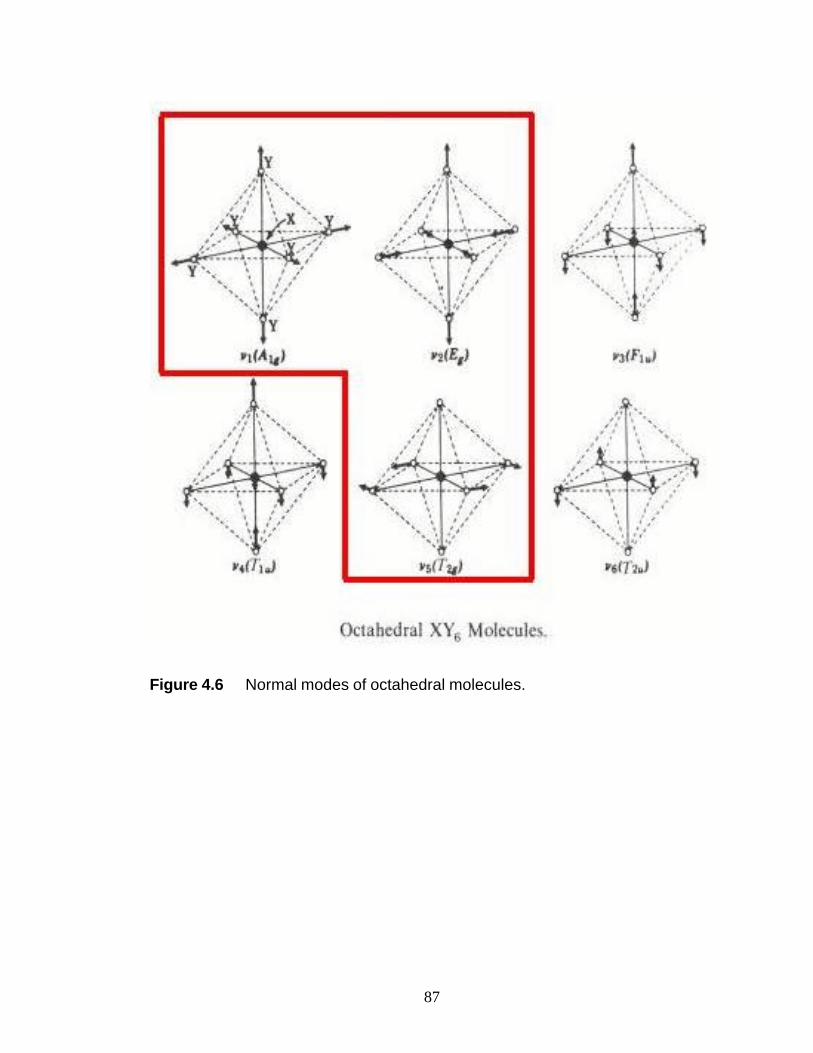
87
Figure 4.6 Normal modes of octahedral molecules.
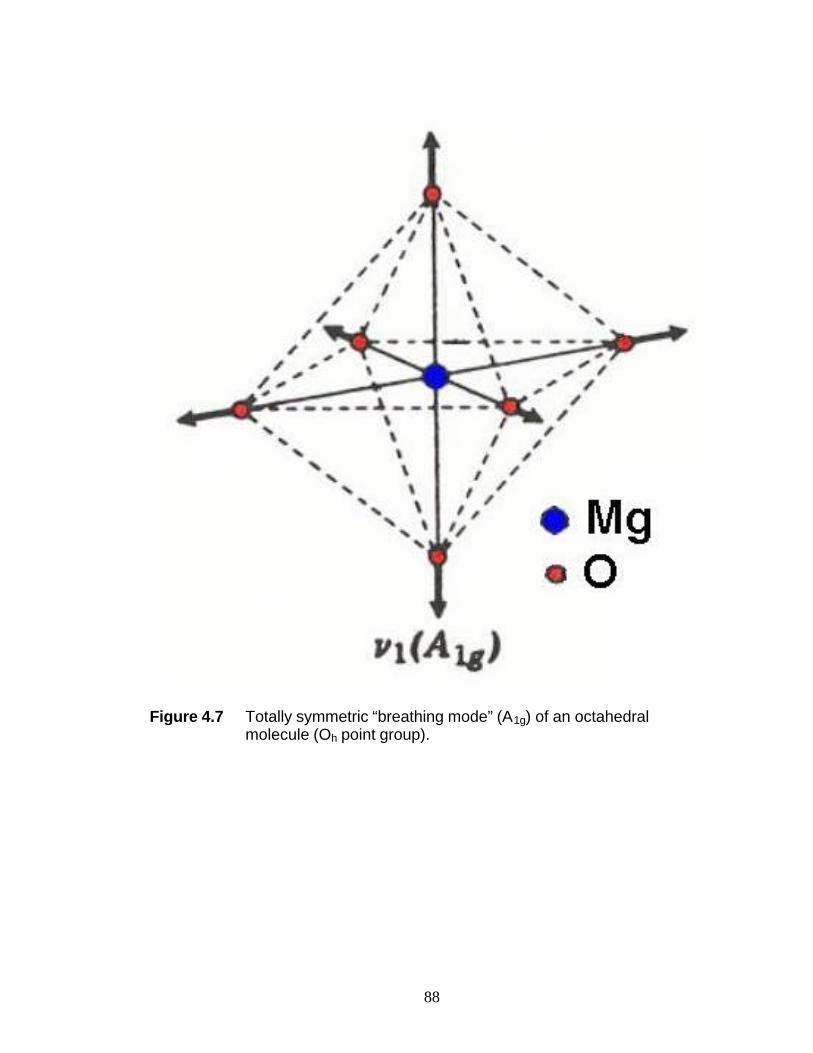
88
Figure 4.7 Totally symmetric “breathing mode” (A1g) of an octahedral
molecule (Oh point group).
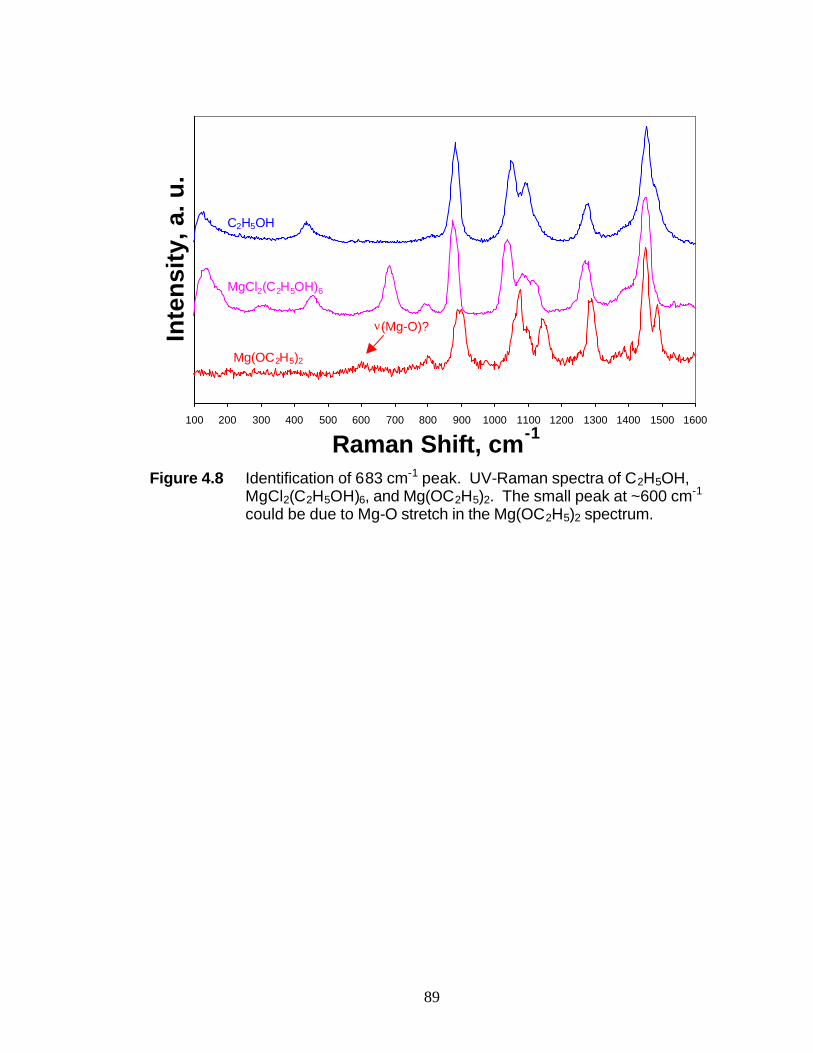
89
100 200 300 400 500 600 700 800 900 1000 1100 1200 1300 1400 1500 1600
Raman Shift, cm-1
Inte
nsi
ty, a
. u.
Mg(OC2H5)2
MgCl2(C2H5OH)6
C2H5OH
ν(Mg-O)?
Figure 4.8 Identification of 683 cm-1 peak. UV-Raman spectra of C2H5OH,
MgCl2(C2H5OH)6, and Mg(OC2H5)2. The small peak at ~600 cm-1 could be due to Mg-O stretch in the Mg(OC2H5)2 spectrum.
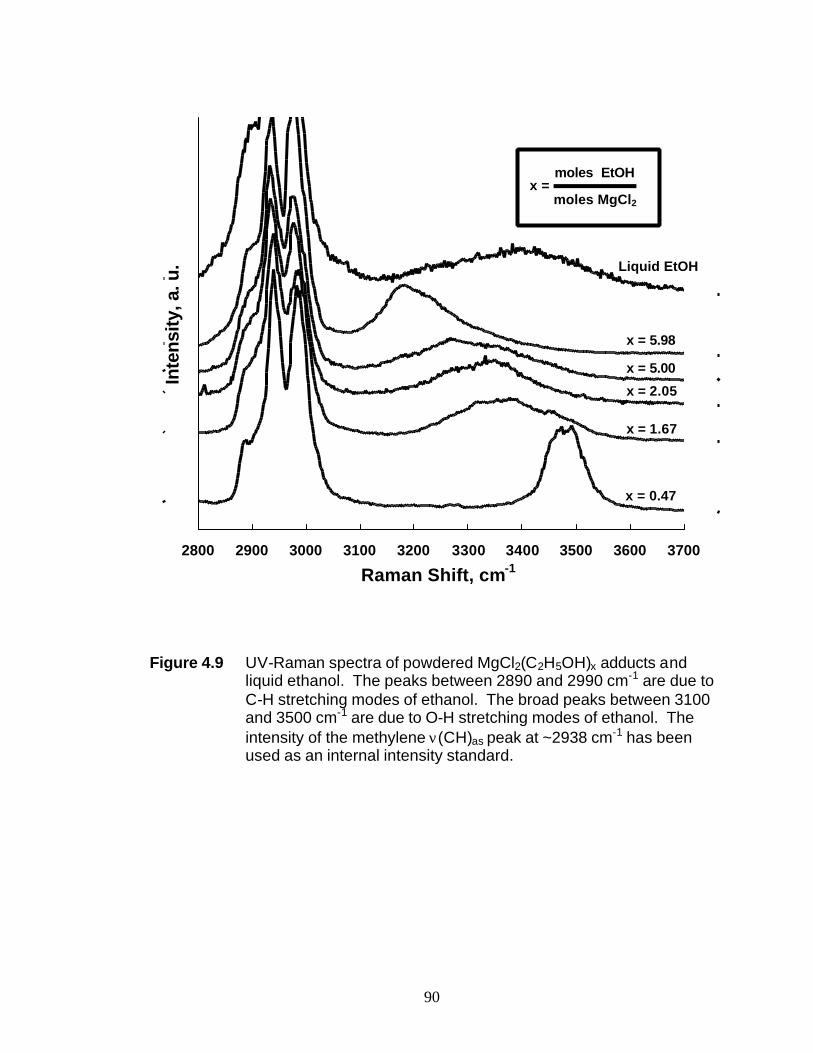
90
2800 2900 3000 3100 3200 3300 3400 3500 3600 3700
Raman Shift, cm-1
Inte
nsity
, a. u
. Liquid EtOH
x = 0.47
x = 1.67
x = 2.05
x = 5.00
x = 5.98
moles EtOH
moles MgCl2x =
Figure 4.9 UV-Raman spectra of powdered MgCl2(C2H5OH)x adducts and
liquid ethanol. The peaks between 2890 and 2990 cm-1 are due to C-H stretching modes of ethanol. The broad peaks between 3100 and 3500 cm-1 are due to O-H stretching modes of ethanol. The intensity of the methylene ν(CH)as peak at ~2938 cm-1 has been used as an internal intensity standard.
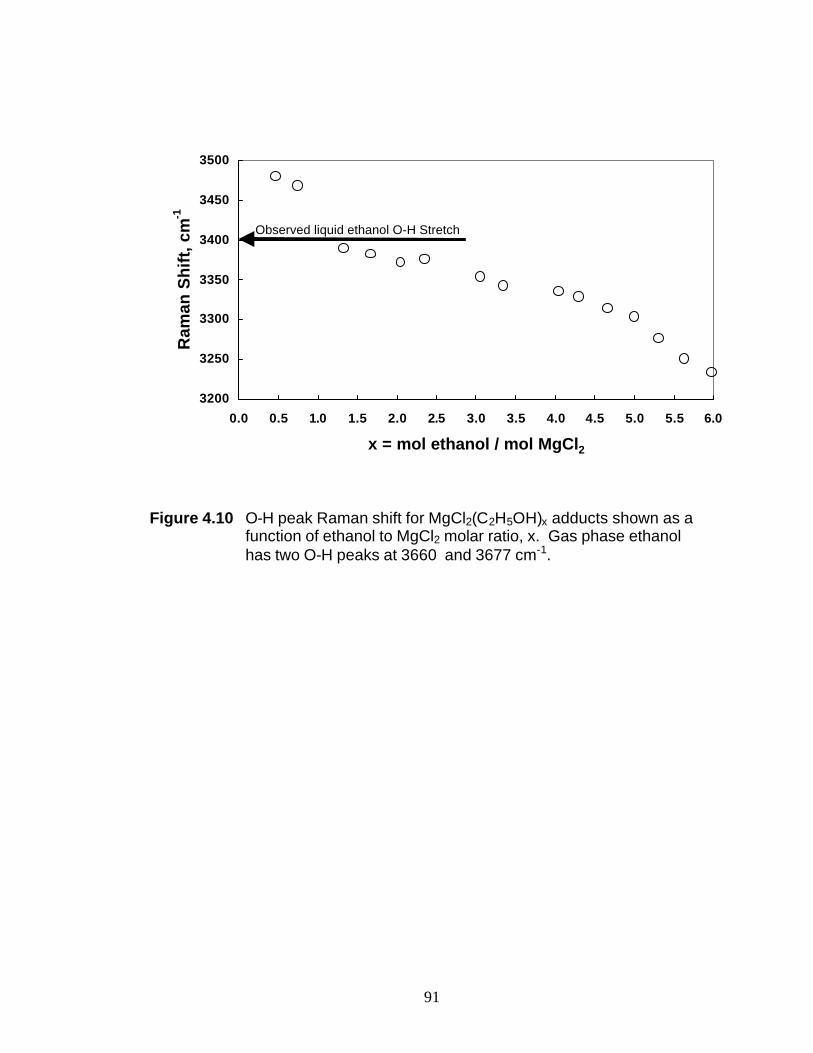
91
3200
3250
3300
3350
3400
3450
3500
0.0 0.5 1.0 1.5 2.0 2.5 3.0 3.5 4.0 4.5 5.0 5.5 6.0
x = mol ethanol / mol MgCl2
Ram
an S
hif
t, c
m-1
Observed liquid ethanol O-H Stretch
Figure 4.10 O-H peak Raman shift for MgCl2(C2H5OH)x adducts shown as a
function of ethanol to MgCl2 molar ratio, x. Gas phase ethanol has two O-H peaks at 3660 and 3677 cm-1.
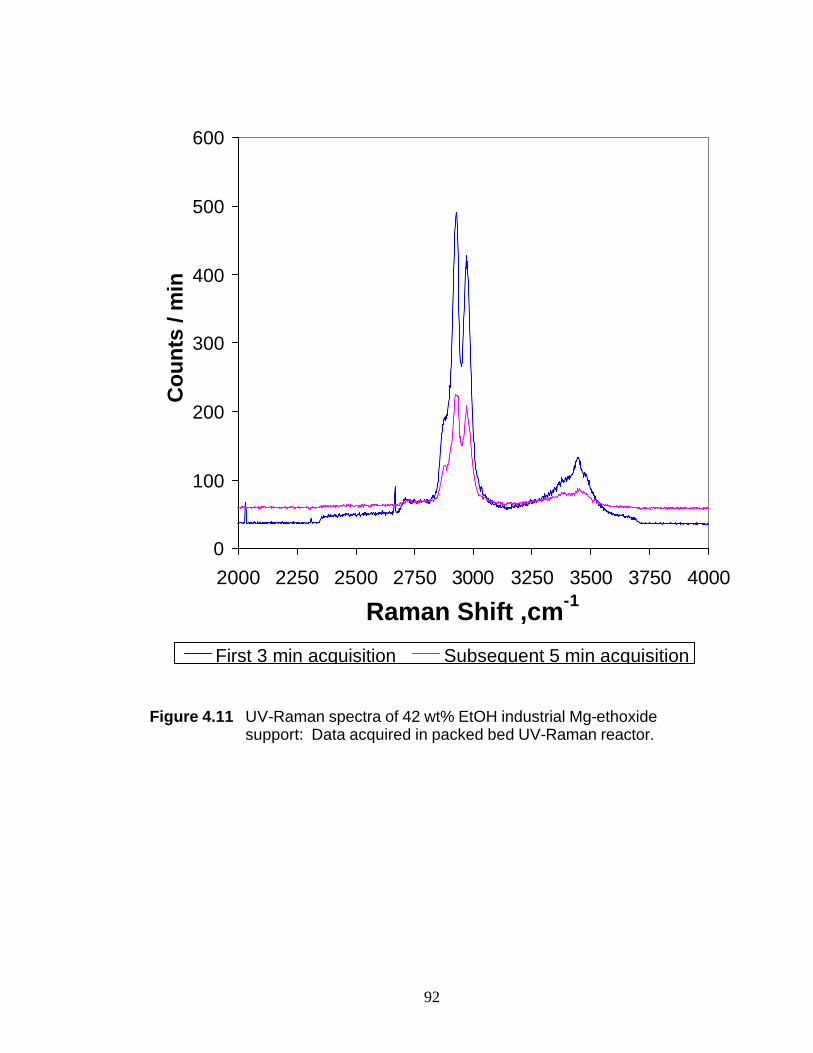
92
0
100
200
300
400
500
600
2000 2250 2500 2750 3000 3250 3500 3750 4000
Raman Shift ,cm-1
Co
un
ts /
min
First 3 min acquisition Subsequent 5 min acquisition Figure 4.11 UV-Raman spectra of 42 wt% EtOH industrial Mg-ethoxide
support: Data acquired in packed bed UV-Raman reactor.
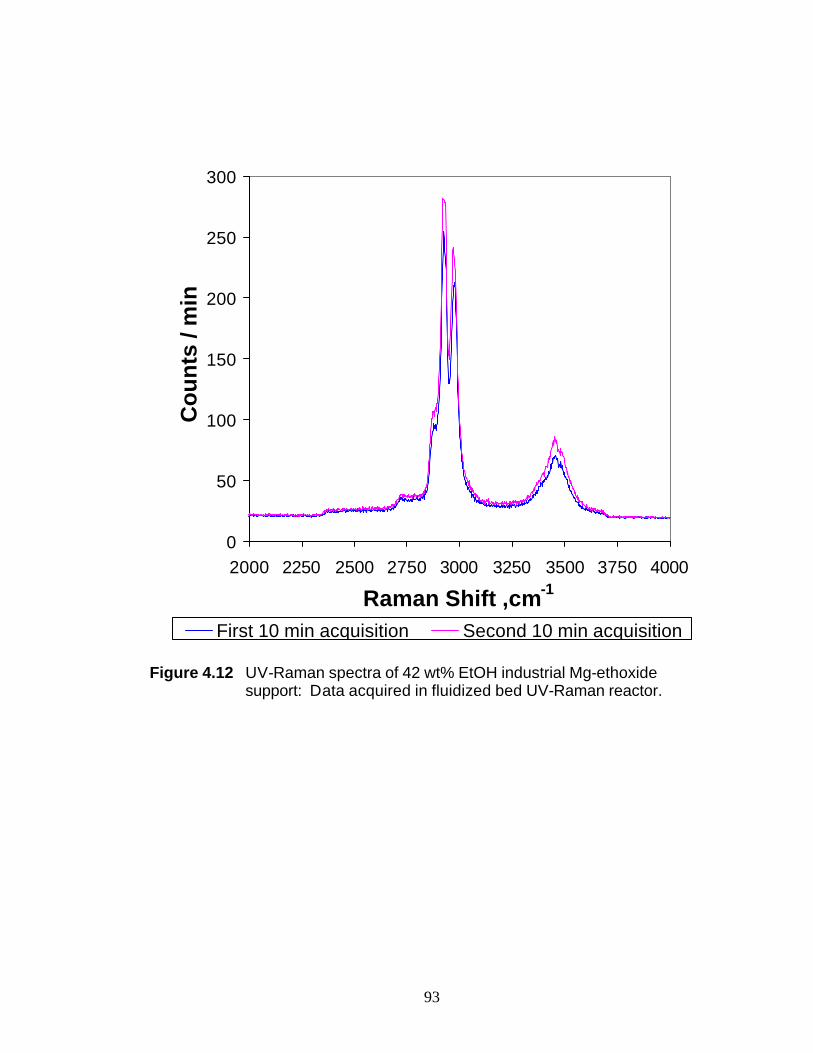
93
0
50
100
150
200
250
300
2000 2250 2500 2750 3000 3250 3500 3750 4000
Raman Shift ,cm-1
Co
un
ts /
min
First 10 min acquisition Second 10 min acquisition Figure 4.12 UV-Raman spectra of 42 wt% EtOH industrial Mg-ethoxide
support: Data acquired in fluidized bed UV-Raman reactor.
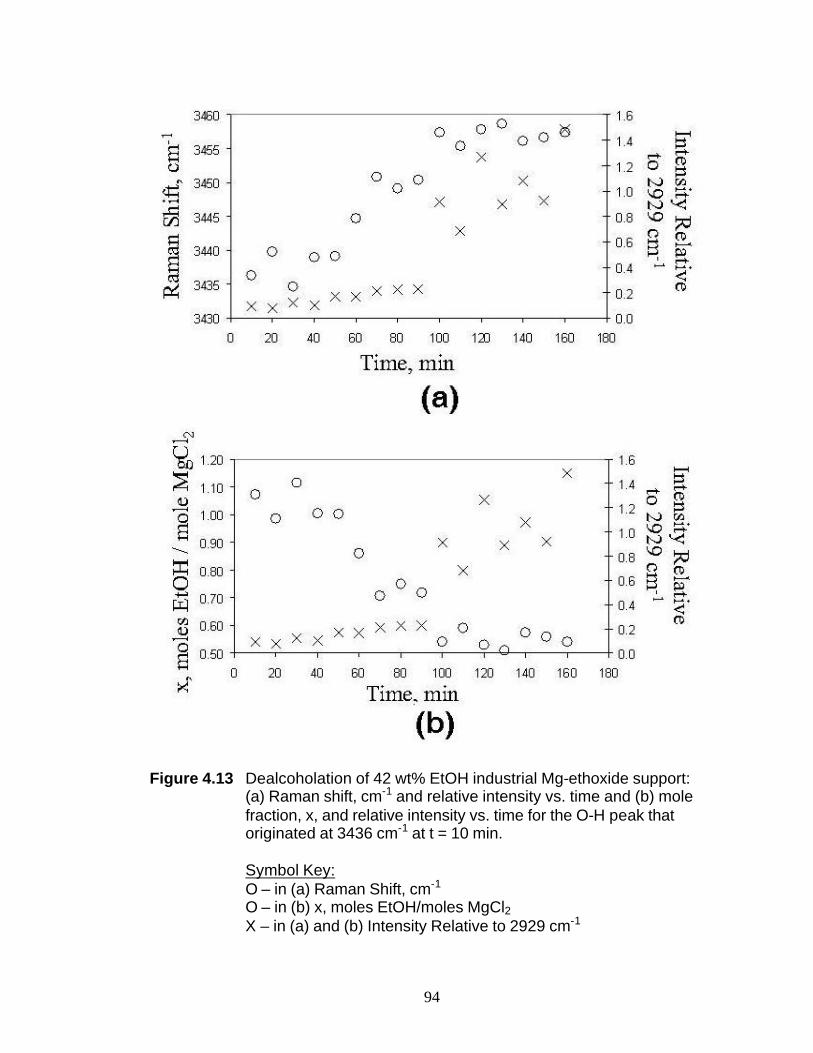
94
Figure 4.13 Dealcoholation of 42 wt% EtOH industrial Mg-ethoxide support:
(a) Raman shift, cm-1 and relative intensity vs. time and (b) mole fraction, x, and relative intensity vs. time for the O-H peak that originated at 3436 cm-1 at t = 10 min.
Symbol Key: O – in (a) Raman Shift, cm-1 O – in (b) x, moles EtOH/moles MgCl2
X – in (a) and (b) Intensity Relative to 2929 cm-1
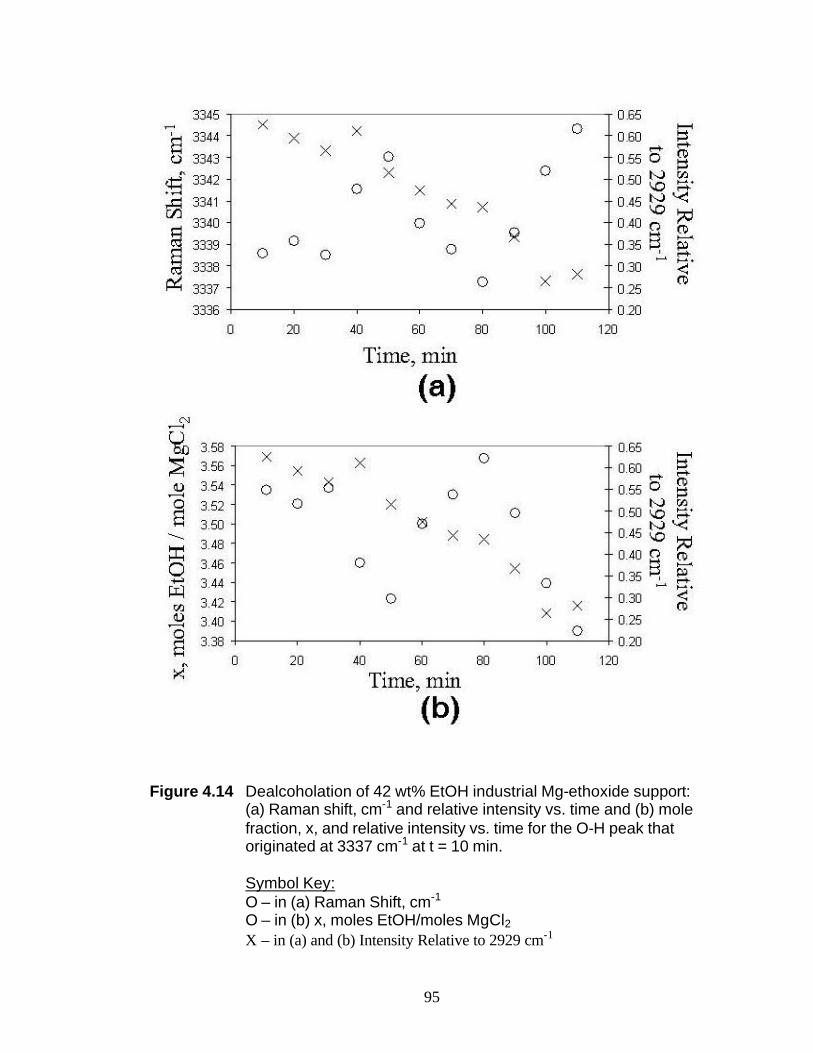
95
Figure 4.14 Dealcoholation of 42 wt% EtOH industrial Mg-ethoxide support:
(a) Raman shift, cm-1 and relative intensity vs. time and (b) mole fraction, x, and relative intensity vs. time for the O-H peak that originated at 3337 cm-1 at t = 10 min.
Symbol Key: O – in (a) Raman Shift, cm-1 O – in (b) x, moles EtOH/moles MgCl2
X – in (a) and (b) Intensity Relative to 2929 cm-1
Chapter 5 Structural Characterization of Silica Supported CoMo Catalysts by UV Raman, XPS and X-ray Diffraction Techniques
Section 5.1 Introduction
CoMo catalysts supported on silica or alumina are commonly used as
hydrodesulfurization (HDS) catalysts in the petroleum refining industries.1 These
systems have been extensively characterized by various techniques in both oxidized and
sulfided states but contradictory conclusions have sometimes been drawn about the
reciprocal effect of Mo and Co.1 However, general agreement exists on the importance
of the CoMoS species of “type II” which consist of small MoS2 particles with Co
promoter atoms located at the edges of MoS2 slabs.2,3 The promoting effect of Co is
attributed to its electron donor capability causing reduction of the Mo oxidation state.4
The HDS activity of the supported catalysts depends significantly on the types of
support material. The support material effects the structure of the oxide precursors
formed during the calcination step.5,6 Indeed important correlations between catalytic
activity and precursor oxides are found. Generally speaking, supports interacting
strongly with the supported elements induce higher dispersion of the supported
molybdena phase which is reflected in higher activity of the sulfided catalysts.7
However interactions that are too strong may inhibit the subsequent formation of the
MoS2 phase, as in the case of alumina supported catalysts which are harder to sulfide
97
than silica supported ones. Conversely, the complete absence of interaction with the
support, as in silica supported catalysts, favors sintering of the precursor oxide species
with a subsequent decrease in activity. Therefore, to achieve an optimally active and
stable catalyst, a compromise between the two support interactions is important.
Various methods to control the interaction between supports and active species have
been tried including changes of the preparation conditions, addition of complexing
agents such as nitrilotriacetic acid (NTA)8 or ethylenediamine9 or doping the supports
with different types of additives.3,10,11 A recent investigation of sodium doped CoMo
catalysts has revealed a dependence of the sodium effect on the type of support; an
increase of the HDS activity with sodium was observed for the aluminosilicate support,
in contrast to a decrease of activity observed at any Na loading on silica support.12,13
The positive effect of sodium in the aluminosilicate case was attributed to the formation
of β-CoMoO4 species driven by sodium. This mixed oxide is characterized by
tetrahedral coordination of Mo and octahedral coordination of Co and is considered a
precursor to the active CoMoS species of type II having the same structural features.9
On the contrary, based on X-ray diffraction results and on physisorption methods, the
decrease of the catalytic activity in the sodium doped silica supported catalysts12,13 was
attributed to morphological effects, such as surface area and pore size distribution
variation. The extent of the effect depended on the catalyst preparation. To further
investigate the nature of the adsorbed species (e.g. isolated MoO42-, mixed oxide and
polyanions such as Mo7O24 6- ) and the effect of sodium from the structural and
electronic point of view, an X-ray photoelectron spectroscopy (XPS) and UV-Raman
spectroscopy study of CoMo catalysts, supported on differently sodium doped silica,
98
was undertaken and is here described. Correlations between structure and activity are
also discussed.
Section 5.2 Experimental
Section 5.2.1 Catalyst preparation. All catalysts were prepared starting with
commercially available sodium free silica (Aldrich Chemical Company; surface area of
546 m2/g; pore sizes10-50 Å; PZC = 3.8). For the sodium doped samples, the silica was
impregnated with a solution of sodium nitrate of different concentrations, dried at 343 K
for 2 h and then calcined at 773 K in air. Samples doped with sodium are labelled as
1Na, 2Na, 3Na, and 4Na where the numbers represent the wt% of sodium in the
support. These supports were then loaded with molybdenum (at % Mo = 1.4) and
cobalt (at % Co = 0.6) following two different procedures.
One series was prepared by incipient wetness impregnation, involving a first
impregnation with an aqueous solution of (NH4)6Mo17O24·4H2O. Ammonia was added
in order to shift the polymolibdate ↔ monomolybdate equilibrium.14 The samples were
dried for 2 h at 343 K and overnight calcined at 773 K in air. The second impregnation
was with an aqueous solution of Co(NO3)2·6 H2O followed by the same drying step as
before. Samples prepared in this manner are labelled with WI.
A second set of catalysts was prepared by co-impregnation of the two metal salt
solutions in the presence of the tridentate nitriloacetic acid (NTA).8,12 The solid
samples were dried at 343 K for 24 h. Unlike the first series, calcination in air was
omitted. Samples prepared by this technique are labelled with NTA.
99
Reference samples, MoO3, Co3O4, and CoMoO4 for XPS measurements, were
prepared from ammonium heptamolybdate and from cobalt nitrate precursors according
to the literature.14 Their crystallinity was checked by X-ray diffraction (JCPDS Powder
diffraction Files no. 35-0609, 42-1467, 21-868 respectively.)15
Section 5.2.2 X-ray diffraction (XRD). X-ray diffraction measurements for
structure determination were carried out with a Philips vertical goniometer using Ni-
filtered Cu Kα radiation. A proportional counter and 0.05° step sizes in 2θ were used.
The assignments of the various crystalline phases were based on the JPDS powder
diffraction file cards.15
Section 5.2.3 BET Analysis. The microstructural characterization was
performed with a Carlo Erba Sorptomat 1900 instrument. The surface area of the
samples were obtained through the BET method using nitrogen as the probe. By
analysis of the desorption curve, using the Dollimore and Heal calculation method, the
pore size volume distribution was also obtained.16
Section 5.2.4 X-Ray Photoelectron Spectroscopy (XPS). XPS measurements
were taken on a Perkin-Elmer PHI 5300 XPS spectrometer equipped with a
hemispherical energy analyzer and a dual Mg/Al anode. The spectra were obtained
using the non-monochromated Al Kα source (1486.6 eV). For the individual peak
energy regions, a pass energy of 20 eV set across the hemispheres was used. Survey
spectra were measured at 50 eV pass energy. The sample powders were analysed as
pellets, mounted on a double-sided adhesive tape. The pressure in the analysis chamber
was in the range of 10-8 Torr during data collection. The constant charging of the
samples was removed by referencing all the energies to the C 1s set at 285.1 eV, arising
100
from the adventitious carbon. The invariance of the peak shapes and widths at the
beginning and at the end of the analyses ensured absence of differential charging.
Analysis of the peaks were based on non-linear least square fitting program using
properly weighted sum of Lorentzian and Gaussian component curves after background
subtraction according to Shirley and Sherwood.17,18 Constraints on the intensity ratios
of the two Mo 3d and Co 2p doublet components were used in accord with the spin
orbit coupling processes. Atomic concentration were calculated from peak intensity as
described in Chapter 2. The binding energy (BE) values are quoted with a precision of
± 0.15 eV. Contact of the samples with air was minimised during sample loading. In
order to check for possible radiation damage, spectra of the Mo 3d and Co 2p regions
were acquired as the first and last regions. No differences were observed.
Section 5.2.5 UV- Raman Spectroscopy. In order to eliminate interference
from photodecomposition and thermal degradation, the fluidized bed (FB) reactor has
been used.19 In this type of set up the powder sample is placed on top of a fritted disc.
Helium gas, flowing through the sample, produced vertical lift. Stable fluidization was
achieved by adding an electric shaker.
Figure 5.1 is an overview of the UV-Raman spectroscopy experimental set up.
The excitation source is the 244 nm output of a Lexel SHG, an intracavity doubled,
continuous wave Ar + laser. The 244 nm beam is focused at 45o to the sample normal
by a 2 cm focal length spherical lens. The Raman scattered light is collected by a 50
mm diameter f/2 fused silica lens; this corresponds to a solid angle of collection of 0.20
sr. The collected scattered light is focused on the entrance slit of a f/3.7 Triplemate
triple spectrometer by a 160 mm focal length lens. The filter stage of the Triplemate
101
contains two 2400 gr/mm diffraction gratings for efficient rejection of stray reflections
and the intense Rayleigh scattered light. A 2400 gr/mm diffraction grating is used in the
dispersion stage. The spectrum is collected on a back thinned, UV-enhanced liquid-
nitrogen-cooled 1340 x 100 pixel CCD detector. The quantum efficiency of the CCD
array at 244 nm is approximately 33%. The spectral resolution is ~24 cm-1. Spectra
obtained between 700 and 1500 cm-1 were calibrated using the well-known Raman
shifts of cyclohexane.20 The spectrometer response function was assumed to be
constant and no attempt was made to correct the spectra. The absolute signal intensity
did vary between samples due to slight differences in the focus of the incident laser on
the fused silica capillary tubes. To facilitate qualitative comparison of peak intensities
between spectra, one peak in a given spectral region for each sample was chosen as
internal intensity standard.
Sample integrity under the UV laser beam was investigated. If the laser beam
were inducing thermal or photochemical damage, the Raman intensity would not
increase proportionally with the incident laser power. Under stationary conditions,
sample degradation was already observed at 9 mW, especially for the NTA series,
whereas under fluidized bed conditions, Raman spectra recorded at 2, 9, 18 and 36 mW
exhibited signal intensity which increased linearly with laser power. All spectra
reported here were obtained at 36 mW.
Section 5.3 Results
Section 5.3.1 BET and PZC. Table 5.1 summarizes the surface areas obtained
from BET analysis for the catalyst samples. The meaning of the catalyst sample names
102
is described in section 5.2.1. The decrease of the surface area of the supports is related
to the amount of the added sodium.21 Consecutive calcinations can also reduce the
surface area.
The point of zero charge (PZC) of the silica support as a function of the amount
of added sodium was determined by mass titration.22 The PZC is determined by
monitoring the pH as more of the solid sample is added to solution. The steady-state
pH value is the PZC. The PZC values and the surface areas relative to pure silica and to
the sodium doped supports are reported in Table 5.2. Addition of sodium to the silica
support induces an increase of the PZC. At around 2 atomic % of sodium, the pH
(PZC) > 9 is reached, corresponding to the dissolution of silica.23
Section 5.3.2 XRD Results. X-ray diffraction patterns of the sodium free
samples prepared by the NTA procedure, exhibit the broad band typical of amorphous
silica (data not shown).12,13 In agreement with previous observations, addition of
sodium to silica, followed by calcination at 773 K, induces the transformation from
amorphous to cristobalite.21 For the WI series in Figure 5.2, diffraction lines attributed
to β-CoMoO4 are present.12 Moreover, diffraction lines, from Na2MoO4 phase, are
observed in the case of samples with Na loading above 2.7 at %.
Section 5.3.3 UV-Raman Results. In Figure 5.3 the Raman spectra of the WI
series with varying sodium content are displayed. In the SilWI sample (Figure 5.3a) a
broad peak centered at 970 cm-1 with a shoulder at 944 cm-1 is detected. The peak at
944 cm-1 is attributed to Mo7O246- (Mo=O Raman band at 946-951 cm-1).24 The peak at
970 cm-1 is attributed to large polymolybdate clusters such as Mo8O264- (Mo=O Raman
band at 958-960 cm-1.24,25 Formation of MoO3, especially after calcination at high
103
temperature, characterized by peaks in the range of 990 - 1000 cm-1 can also be
postulated due to the weak interaction between Mo(VI) and SiO2.24,26-28 Some
contribution from Mo-O-Co stretching vibrations in CoMoO4 species are also observed
in the region at 930 cm-1 and 870 cm-1.29
In the presence of 1% wt of sodium ions the spectrum changes (Figure 5.3b).
The intensity of the peak at 970 cm-1 decreases, while a broad band at 916 cm-1 appears.
Moreover, small features at 840 cm-1, 892 cm-1 and 807 cm-1 are distinguished. The
band at around 840 cm-1 can be associated with the Mo-O-Mo asymmetric stretching
mode of the octahedral molybdate species. The peaks at 892 and 807 cm-1 are attributed
to the stretching modes of Mo=O bond of the tedrahedral molybdate species due to the
formation of sodium molybdate.24 The peak at 916 cm-1 can be attributed to the Mo=O
stretching mode of MoO42- species with distorted tetrahedral symmetry.30 Indeed, this
distortion will lead to a rehybridization and strengthening of terminal Mo=O bonds and
consequently to a shift of the Mo=O stretching frequency to higher wavenumbers with
respect to the undistorted symmetry.27
The spectrum of the sample doped with 4 % wt of sodium exhibits two sharp
peaks at 807 cm-1 and 892 cm-1 typical of Na2MoO4. A strong peak at 1060 cm-1 is
observed due to nitrate residue from the sodium precursor which is still present in the
samples. The polymeric molybdate species have totally disappeared and the
coordination of Mo has changed from octahedral, as in the polymolybdates, to
tetrahedral, as in the sodium monomolybdate.
In Figure 5.4 the Raman spectra of the NTA series as a function of the sodium
content are shown. In this case, the spectra are quite similar to each other, suggesting
104
that the surface oxide species are not influenced much by the presence of differing
amounts of sodium. Unlike the WI samples, the region of 990-1000 cm-1 does not
contain any features due to MoO3 species. The samples with no sodium and with 1%
wt sodium exhibit a broad band centred at 915 cm-1 with shoulders at ca. 960, 930, 890
and 860 cm-1. The broadness of the signal and its positions indicates a mixture of
several Mo species with different symmetries. The peak at 915 cm-1 may arise from
[MoO3(NTA)] 3- complex anchored to the silica surface and from MoO42- with distorted
tetrahedral symmetry.26 Contribution from heptamolydbate (peaks at 937 cm-1 and 886
cm-1)31, CoMoO4 (930 cm-1), smaller Mo units like Mo2O72- (932 cm-1)24 and MoO4
2-
(892 cm-1 and 803 cm–1)24 are also present in the large envelope. With an increasing
amount of sodium the main band shifts to 905 cm-1, as observed in the spectra of the
samples containing 3 and 4 % wt of sodium. The shift can be attributed to the increase
of the monomeric Mo species relative to the [MoO3(NTA)] 3- ligand complex
component and to a decrease of the surface concentration of the polymolybdate species.
The peaks at 1060 cm-1 and 1044 cm-1 are again due to nitrate ions from sodium and
cobalt precursors respectively.
Section 5.3.4 XPS Results. The Mo 3d 5/2 , Co 2p 3/2, O 1s and Si 2p binding
energies of the model compounds are listed in Table 5.3. The values are in agreement,
within experimental errors, with literature work.14,32 The Co 2p3/2 of the mixed oxide
Co3O4 could be fitted with two peaks, one at low energy corresponding Co2+ species
and the other at higher value corresponding to a Co3+ oxidation state. Typically, the Co
2p spectra of oxidized cobalt species are characterized by shake-up satellite structures at
6 eV on the high energy side of the main Co 2p3/2 and Co 2p1/2 peaks. The intensity of
105
the satellites is also related to the chemical environment, being much stronger in the
mixed CoMoO4 oxide as compared to the Co3O4 .14
The experimental XPS spectra of the Mo 3d level for the various catalysts
prepared by classic wet impregnation (WI) of the differently sodium doped supports are
shown in Figure 5.5. The two spin – orbit components, 3d5/2 and 3d3/2, are present. The
energy separation between the two states is constant and fixed at 3.1 eV along with the
relative intensity ratio (3d5/2 to 3d3/2) of 1.5 in the peak fitting routine. As shown in
Figure 5.5 the resolution of the Mo 3d spectra improves upon addition of sodium to the
silica support. The principal binding energies and the corresponding full width at half
maximum (FWHM) for the WI samples are listed in Table 5.4. For comparison,
samples with no Co are also reported. The binding energy of Mo 3d 5/2, typical of Mo
(VI)33, ranges from 233.2 eV for the sodium free and the low sodium content samples,
to 231.8 eV for the more highly sodium loaded catalysts. At the same time a decrease
of the FWHM with sodium is also observed. This is observed for the samples without
cobalt as well. The constant line widths of the Si 2p and O 1s excludes the possibility
of any charging effects to account for the origin of Mo 3d FWHM variation. The values
of the sodium free samples are quite close to the value of the unsupported MoO3, in
accordance with a rather weak or absent electronic interaction with the support.33
The Si 2p binding energy of the samples are close to 103.5 eV found for pure
silica. No trend can be envisioned for the Na 1s binding energy as the sodium doping is
increased. Comparison of the XPS derived Na atomic concentration of the CoMo
samples with Mo samples, indicates that repeated calcinations induce sodium
segregation to the surface.
106
In Figure 5.6 the Co 2p spectra of two selected samples, SilWi and 4NaSilWI,
are shown. The Co 2p peaks do not shift with increasing sodium doping. The increase
of the Co 2p / Si 2p intensity ratio with increasing sodium could arise from an increase
of the cobalt dispersion, as already observed in alumina supported cobalt.29
The binding energies and the intensity ratios of the NTA prepared samples,
listed in Table 5.5, are rather unchanged by the increase of sodium in the support. The
organic ligand, NTA, makes the exact determination of the position of the referencing C
1s more difficult. As a consequence, variations of the values are attributed to
experimental error. The absence of a support effect on the binding energy values of the
supported elements would agree with the supposed role of the organic ligand which
tends to decrease the interaction with the support.8
Section 5.4 Discussion
Section 5.4.1 WI Samples. The UV Raman spectroscopy, along with the XPS
results, has clearly indicated that in the CoMo catalyst supported on pure silica prepared
by classic wet impregnation, a mixture of polymolybdate oxides are formed. The
assignment of the various peaks agrees with the presence of large clusters, like
Mo7O246- , Mo8O26
4- and also MoO3. The presence of sodium in the silica transforms
the original polymolybdate surface phases into monomeric Na2MoO4, leading to the
change from octahedral coordination of Mo (VI) to tetrahedral coordination.34
This shift from polymeric to monomeric molybdate structures can be accounted
for by examining the effect of pH of the solution and the support surface during the
catalyst preparation steps. Oxymolybdenic species in aqueous solution are in
107
equilibrium between (MoO4) 2- and (MoxOy)n-, depending upon pH, temperature and
concentration of the solution. The pH of 8 for the precursor impregnating solution
would favour formation of monomeric Mo units according to the following equilibrium:
Mo7O24 6- + 4H2O ⇔ MoO4 2-
+ 8H + (5.1)
However, since pure silica is characterized by an acidic PZC, one can assume that the
monomeric units forming in solution can easily polymerize at the solid surface. The
addition of sodium by impregnation followed by high temperature calcination induces a
decrease of the silica surface acidity (as shown in Table 5.1) with a subsequent shifting
of the equilibrium to the right in (5.1). Similar Raman results were obtained for
alumina supported Mo catalysts in which the depolymerization of polymolibdate
species was promoted by increasing K+ content.31
The Mo 3d and Co 2p binding energies indicate a very weak interaction between
supported Mo (VI) and Co (II) with the pure silica support. As the sodium content
increases, the FWHM and BE of the Mo 3d peaks decrease. The decrease in binding
energy can be attributed to an electron donor effect by sodium.28 The larger FWHM of
the SilWI sample is attributed to a mixture of polymeric oxymolybdates and to a lesser
extent, a possible Mo (V) species caused by the reducing action of NH3 formed by the
decomposition of the ammonium salt.34 The decrease in the FWHM with increasing
sodium content agrees with the Raman results that indicate a shift from a mixture of
polymolybdates towards a monomolybdate species.
The Raman spectra and the XPS results are not conclusive about the chemical
state of cobalt. The XPS intensity ratio of the main Co2p3/2 peak over the shake-up
satellite, suggests that Co(II) species are formed preferentially to Co3O4. Only in the
108
Raman spectra of the sodium free sample are features related to CoMoO4 surface
species present. In the presence of sodium, Na2MoO4 particles are formed in place of
CoMoO4. The decrease of HDS catalytic activity with increasing sodium doping of the
WI catalysts can be attributed to the absence of CoMoO4 surface species which are
considered a precursor for the active CoMoS entity.12
Section 5.4.2 NTA Samples. XPS and UV-Raman spectroscopy indicate very
little change with increased sodium doping of the NTA prepared catalysts. Raman
spectra show the presence of vibrations from a [MoO3(NTA)] 3- complex anchored to
the silica surface, a MoO42- species with distorted tetrahedral symmetry, and a CoMoO4
species.26 The shift of the center of the broad peak from 915 cm-1 to 905 cm-1 is
attributed to an increase of the monomeric MoO42- species with respect to the
[MoO3(NTA)]3- complex and to the CoMoO4 species. XPS spectra of the samples with
and without sodium are similar and are in agreement with the Raman results. Any
effect the sodium could have on the binding energy of Mo 3d and Co 2p is modulated
by the presence of the organic ligand which is known to shield the Mo and Co from the
increased electron density from the sodium.
The decrease in HDS activity with increasing sodium content for the NTA
catalysts can therefore be accounted for by considering the structural changes induced
by sodium.12 The structural transformation of the polymolybdate into the Na2MoO4
monomolybdate reduces the concentration of CoMoO4 species with a resultant loss in
HDS activity.12 As expected from the literature, the activity of the NTA prepared
samples is enhanced relative the WI samples.8
109
Section 5.5 Conclusion
This study has shown that addition of sodium to the silica support affects the
structure and the electronic properties of the molybdenum oxides formed at the surface
of the supported CoMo catalysts. In the samples prepared by classic wet impregnation,
the high temperature calcinations drive the sodium ions to the surface increasing the
PZC. The increased PZC drives the equilibrium from polymolybdate to
monomolybdates species forming Na2MoO4 compounds at the expense of the active
precursor, CoMoO4. The formation of sodium molybdates species, which are not good
precursors for the active site in the HDS of thiophene may account for the decrease of
HDS activity observed in previous studies. In the NTA prepared samples, the
complexing action of the organic ligand, limits the structural and electronic effects of
sodium. This shielding capability of the NTA ligand could account for the increased
HDS activity of the NTA catalysts over the WI catalysts.
110
Section 5.6 References
(1) Topsoe, H.; Clausen, B. S.; Massoth, F. E. Hydrotreating Catalysis; Springer: Berlin, 1988.
(2) Topsoe, N.-Y.; Topsoe, H. I. Catal. 1983, 84, 386. (3) Bouwens, S. M. A. M.; van Zon, F. B. M.; van Dijk, M. P.; van der Kraan, A.
M.; de Beer, V. H. J.; van Veen, J. A. R.; Koningsberger, D. C. J. Catal. 1994, 146, 375.
(4) Harris, S.; Chianelli, R. R. J. Catal. 1986, 98, 17. (5) Breysse, M.; Portefaix, J. L.; Vrinat, M. Catal. Today 1991, 10, 489. (6) Muralidhar, G.; Massoth, F. E.; Shabtai, J. J. Catal. 1984, 85, 44. (7) Lauritsen, J. V.; Helveg, S.; Laegsgaard, E.; Stensgaard, I.; Clausen, B. S.;
Topsoe, H.; Besenbacher, F. J. Catal. 2001, 197, 1. (8) van Veen, J. A. R.; Gerkema, E.; van der Kraan, A. M.; Knoster, A. J. Chem.
Soc. Chem. Commun. 1987, 1684. (9) Brito, J. I.; Barbosa, A. L. J. Catal. 1997, 171, 467. (10) Olorunyolemi, T.; Kydd, R. A. Catal. Lett. 1999, 59, 27. (11) Adachi, M.; Contescu, C.; Schwarz, J. A. J. Catal. 1996, 162, 66. (12) Venezia, A. M.; Raimondi, F.; La Parola, V.; Deganello, G. J. Catal. 2000, 194,
393. (13) Venezia, A. M.; La Parola, V.; Deganello, G.; Cauzzi, D.; Leonardi, G.; Predieri,
G. J. Appl. Catal. in press. (14) Koranyi, T. I.; Manninger, I.; Paal, Z.; Marks, O.; Gunter, J. R. J. Catal. 1989,
116, 422. (15) JCPDS Powder Diffraction File; Int. Centre for Diffraction Data: Swarthmore. (16) Gregg, S. J.; Sing, K. S. Adsorption, Surface Area and Porosity, 2nd ed.;
Academic Press: San Diego, 1982. (17) Shirley, D. A. Phys. Rev. 1972, B5, 4709.
111
(18) Handbook of X-Ray Photoelectron Spectroscopy; Perkin-Elmer Corp.: Eden Prairie, MN, 1992.
(19) Chua, Y. T.; Stair, P. C. J. Catal. 2000, 196, 66. (20) McCreery, R. L. Raman Spectroscopy for Chemical Analysis; Wiley-
Interscience: New York, 2000; Vol. 157. (21) Venezia, A. M.; La Parola, V.; Longo, A.; Martorana, A. J. Sol. State Chem.
2001, 161, 373. (22) Subramanian, S.; Noh, J. S.; Schwarz, J. A. J. Catal. 1988, 114, 433. (23) van Santen, R. A.; van Leeuven, P. W. N. M.; Moulijn, J. A.; Averill, A. In Stud.
Surf. Sci. and Catal.; Elsevier: Amsterdam, 1999; Vol. 123; pp Chapter 9. (24) Mestl, G.; Srinivasan, T. K. K. Chem. Rev. Sci. Eng. 1998, 40, 451. (25) Wachs, I. E. Catalysis Today 1996, 27, 437. (26) Medici, L.; Prins, R. J. Catal. 1996, 163, 38. (27) Kantschewa, M.; Delannay, F.; Jeziorowski, H.; Delgado, E.; Eder, S.; Ertl, G.;
Knozinger, H. J. Catal. 1984, 87, 482. (28) Venezia, A. M.; Rossi, A.; Duca, D.; Martorana, A.; Deganello, G. Appl. Catal.
A 1995, 125, 113. (29) Lycourghiotis, A.; Defosse, C.; Delannay, F.; Lemaitre, J.; Delmon, B. J. C. S.
Faraday I 1980, 76, 1677. (30) Xiong, G.; Feng, Z.; Li, J.; Yang, Q.; Ying, P.; Xin, Q.; Li, C. J. Phys. Chem. B
2000, 104, 3581. (31) Verbruggen, N. F. D.; von Hippel, L. M. J.; Mestl, G.; Lengeler, B.; Knozinger,
H. Langmuir 1994, 10, 3073. (32) Okamoto, Y.; Imanaka, T.; Teranishi, S. J. Catal. 1980, 65, 448. (33) Plyuto, Y. V.; Babich, I. V.; Plyuto, I. V.; van Langeveld, A. D.; Moulijn, J. A.
Appl. Surf. Sci. 1997, 119, 11. (34) Lycourghiotis, A.; Defosse, C.; Delannay, F.; Delmon, B. J. C. S. Faraday I
1980, 76, 2052.
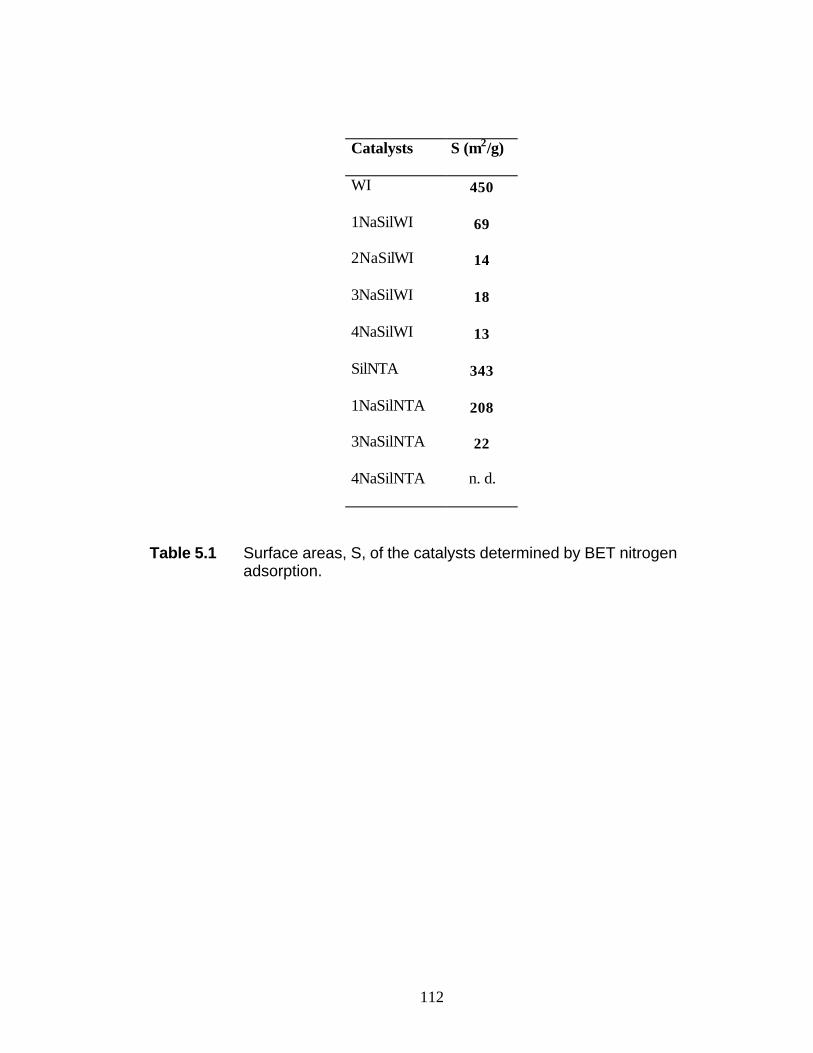
112
Catalysts S (m2/g)
WI 450
1NaSilWI 69
2NaSilWI 14
3NaSilWI 18
4NaSilWI 13
SilNTA 343
1NaSilNTA 208
3NaSilNTA 22
4NaSilNTA n. d.
Table 5.1 Surface areas, S, of the catalysts determined by BET nitrogen adsorption.
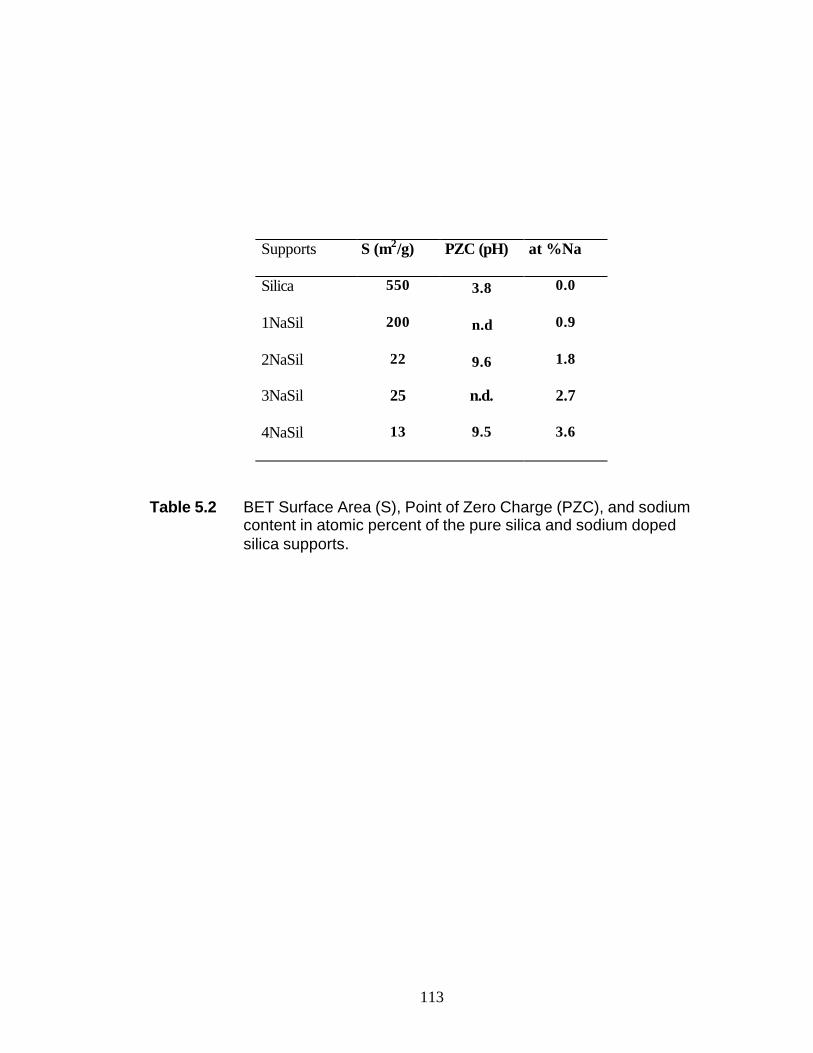
113
Supports S (m2/g) PZC (pH) at %Na
Silica 550 3.8 0.0
1NaSil 200 n.d 0.9
2NaSil 22 9.6 1.8
3NaSil 25 n.d. 2.7
4NaSil 13 9.5 3.6
Table 5.2 BET Surface Area (S), Point of Zero Charge (PZC), and sodium content in atomic percent of the pure silica and sodium doped silica supports.
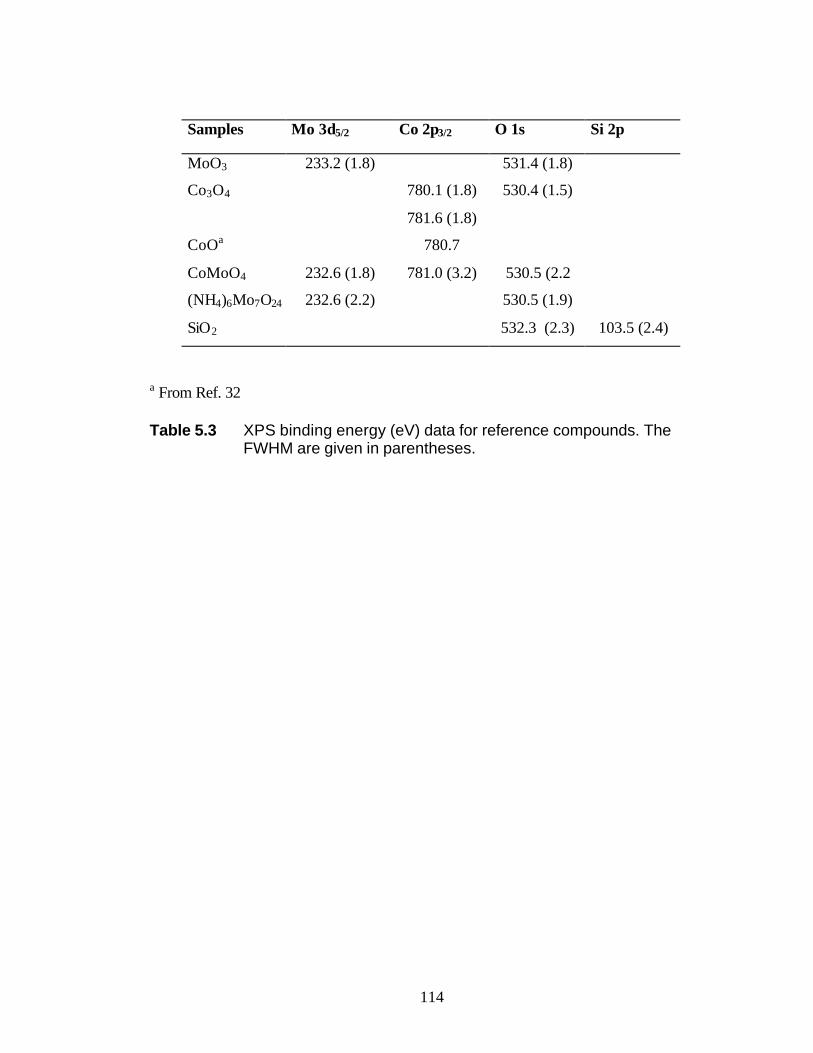
114
Samples Mo 3d5/2 Co 2p3/2 O 1s Si 2p
MoO3 233.2 (1.8) 531.4 (1.8)
Co3O4 780.1 (1.8)
781.6 (1.8)
530.4 (1.5)
CoOa 780.7
CoMoO4 232.6 (1.8) 781.0 (3.2) 530.5 (2.2
(NH4)6Mo7O24 232.6 (2.2) 530.5 (1.9)
SiO2 532.3 (2.3) 103.5 (2.4)
a From Ref. 32
Table 5.3 XPS binding energy (eV) data for reference compounds. The FWHM are given in parentheses.
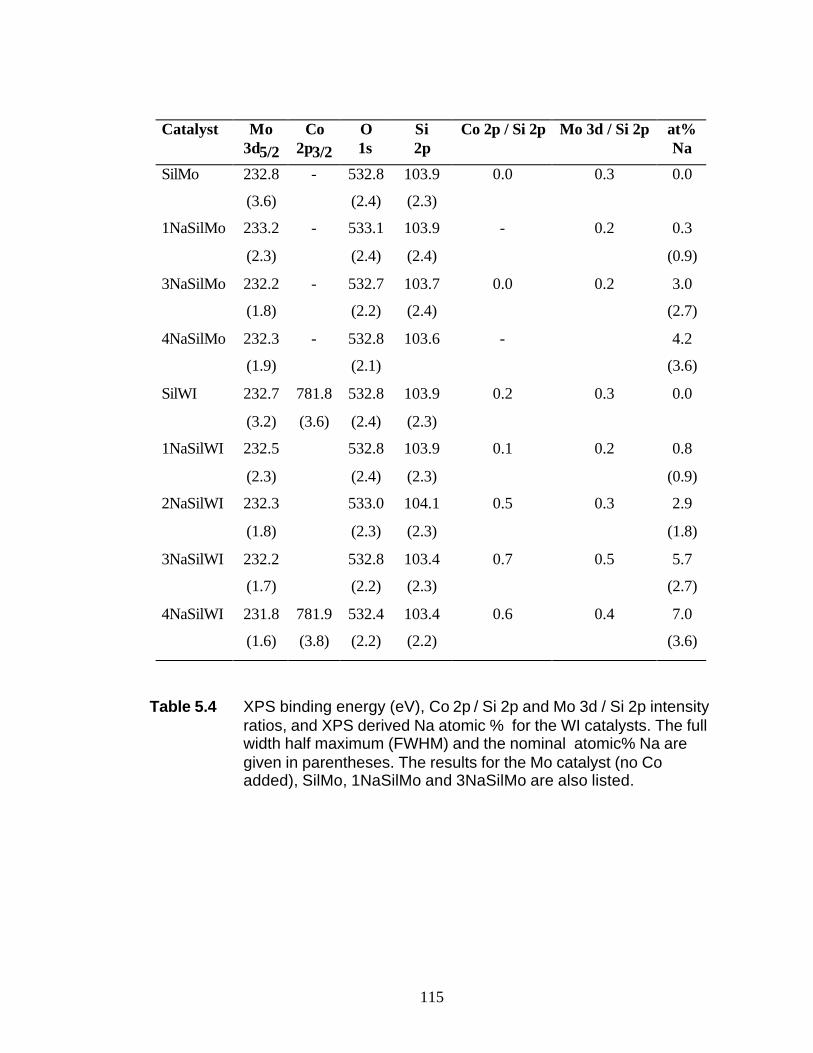
115
Catalyst Mo
3d5/2 Co
2p3/2 O 1s
Si 2p
Co 2p / Si 2p Mo 3d / Si 2p at% Na
SilMo 232.8
(3.6)
- 532.8
(2.4)
103.9
(2.3)
0.0 0.3 0.0
1NaSilMo
233.2
(2.3)
- 533.1
(2.4)
103.9
(2.4)
- 0.2 0.3
(0.9)
3NaSilMo
232.2
(1.8)
- 532.7
(2.2)
103.7
(2.4)
0.0 0.2 3.0
(2.7)
4NaSilMo
232.3
(1.9)
- 532.8
(2.1)
103.6 - 4.2
(3.6)
SilWI 232.7
(3.2)
781.8
(3.6)
532.8
(2.4)
103.9
(2.3)
0.2 0.3 0.0
1NaSilWI 232.5
(2.3)
532.8
(2.4)
103.9
(2.3)
0.1 0.2 0.8
(0.9)
2NaSilWI 232.3
(1.8)
533.0
(2.3)
104.1
(2.3)
0.5 0.3 2.9
(1.8)
3NaSilWI 232.2
(1.7)
532.8
(2.2)
103.4
(2.3)
0.7 0.5 5.7
(2.7)
4NaSilWI 231.8
(1.6)
781.9
(3.8)
532.4
(2.2)
103.4
(2.2)
0.6 0.4 7.0
(3.6)
Table 5.4 XPS binding energy (eV), Co 2p / Si 2p and Mo 3d / Si 2p intensity ratios, and XPS derived Na atomic % for the WI catalysts. The full width half maximum (FWHM) and the nominal atomic% Na are given in parentheses. The results for the Mo catalyst (no Co added), SilMo, 1NaSilMo and 3NaSilMo are also listed.
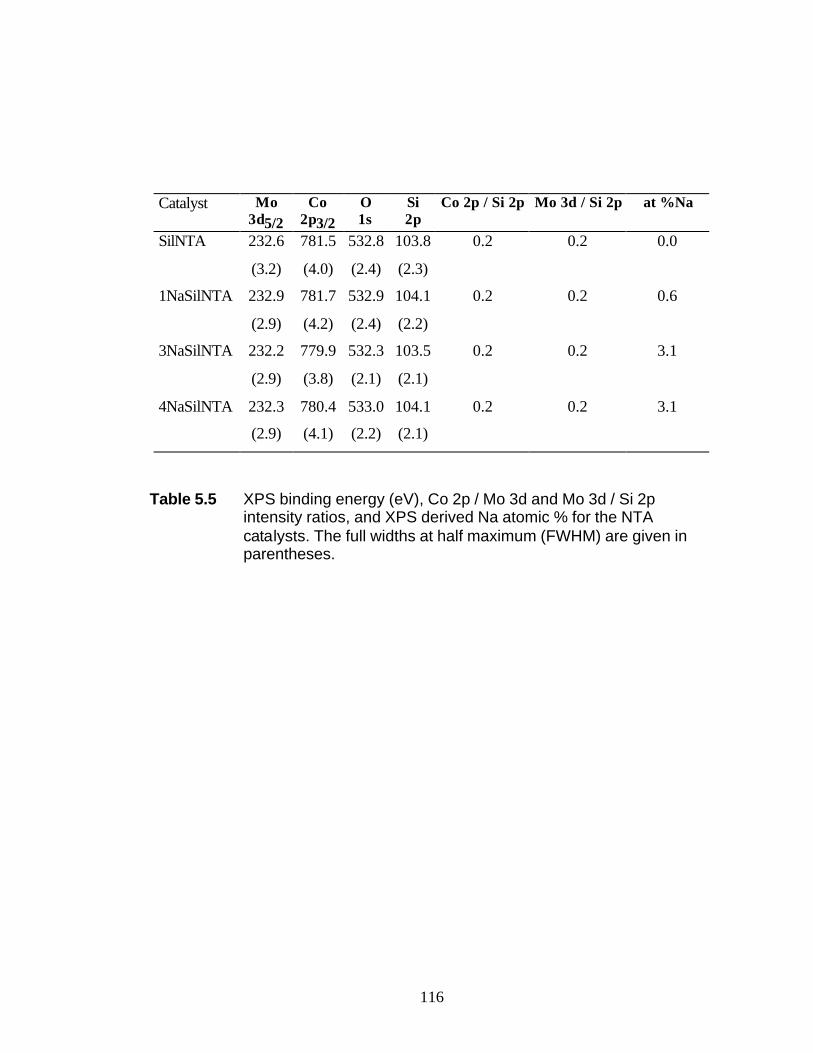
116
Catalyst Mo 3d5/2
Co 2p3/2
O 1s
Si 2p
Co 2p / Si 2p Mo 3d / Si 2p at %Na
SilNTA 232.6
(3.2)
781.5
(4.0)
532.8
(2.4)
103.8
(2.3)
0.2 0.2 0.0
1NaSilNTA 232.9
(2.9)
781.7
(4.2)
532.9
(2.4)
104.1
(2.2)
0.2 0.2 0.6
3NaSilNTA 232.2
(2.9)
779.9
(3.8)
532.3
(2.1)
103.5
(2.1)
0.2 0.2 3.1
4NaSilNTA 232.3
(2.9)
780.4
(4.1)
533.0
(2.2)
104.1
(2.1)
0.2 0.2 3.1
Table 5.5 XPS binding energy (eV), Co 2p / Mo 3d and Mo 3d / Si 2p intensity ratios, and XPS derived Na atomic % for the NTA catalysts. The full widths at half maximum (FWHM) are given in parentheses.
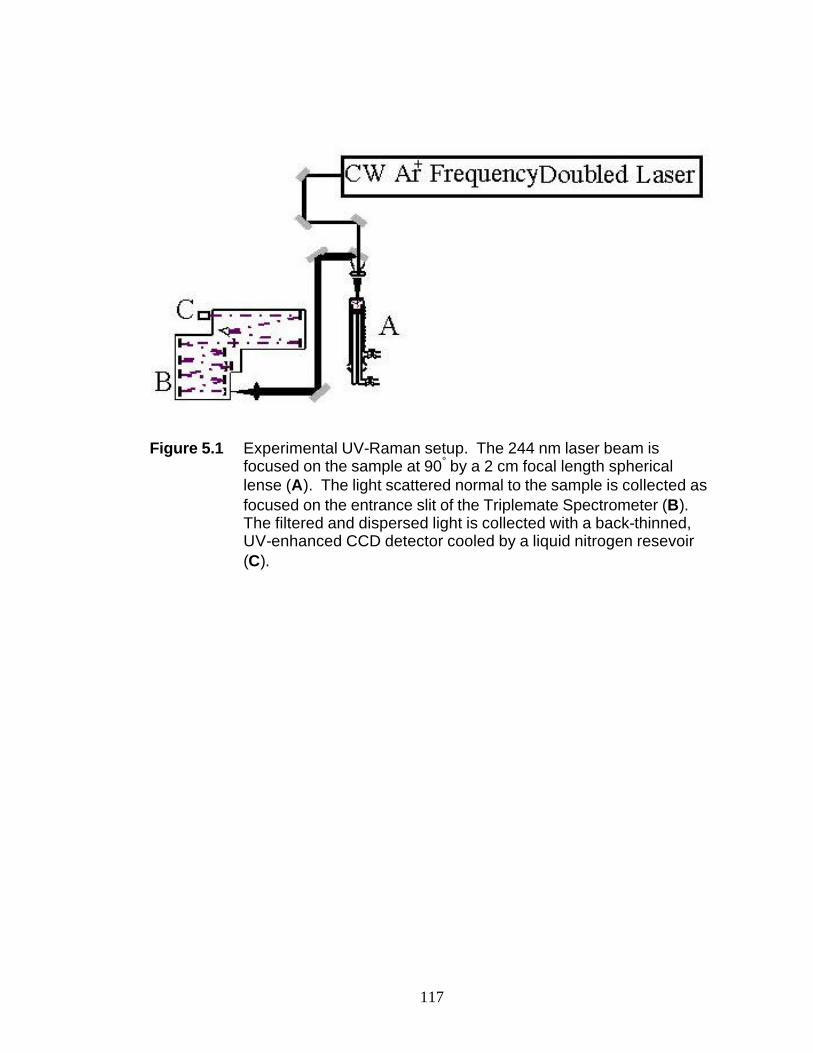
117
Figure 5.1 Experimental UV-Raman setup. The 244 nm laser beam is focused on the sample at 90° by a 2 cm focal length spherical lense (A). The light scattered normal to the sample is collected as focused on the entrance slit of the Triplemate Spectrometer (B). The filtered and dispersed light is collected with a back-thinned, UV-enhanced CCD detector cooled by a liquid nitrogen resevoir (C).
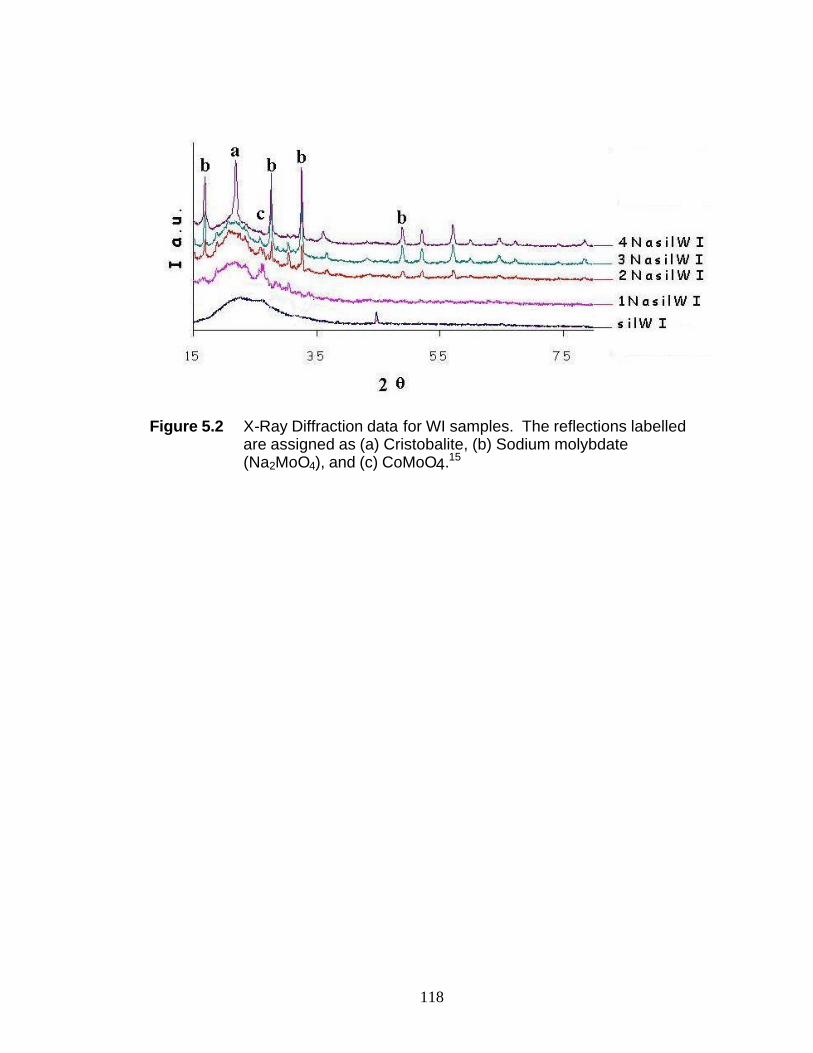
118
Figure 5.2 X-Ray Diffraction data for WI samples. The reflections labelled are assigned as (a) Cristobalite, (b) Sodium molybdate (Na2MoO4), and (c) CoMoO4.15
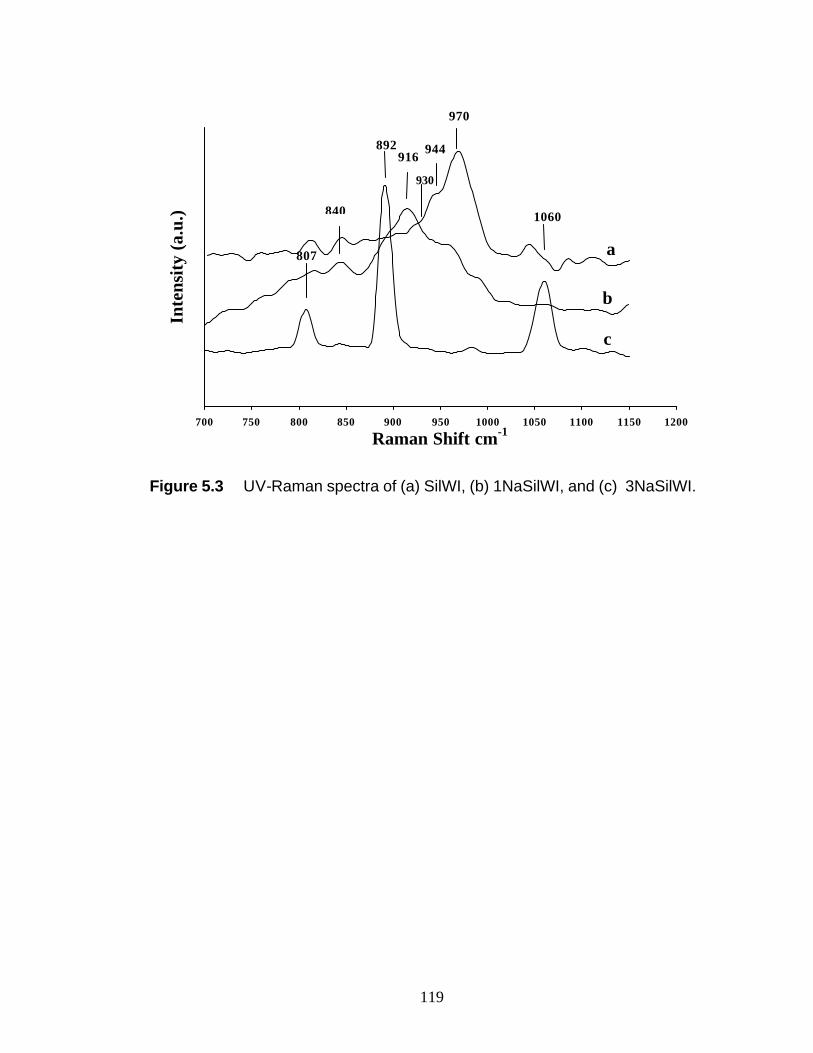
119
700 750 800 850 900 950 1000 1050 1100 1150 1200
Raman Shift cm-1
Inte
nsit
y (a
.u.)
807
c
a
b
1060
970
944 916
892
840
930
Figure 5.3 UV-Raman spectra of (a) SilWI, (b) 1NaSilWI, and (c) 3NaSilWI.
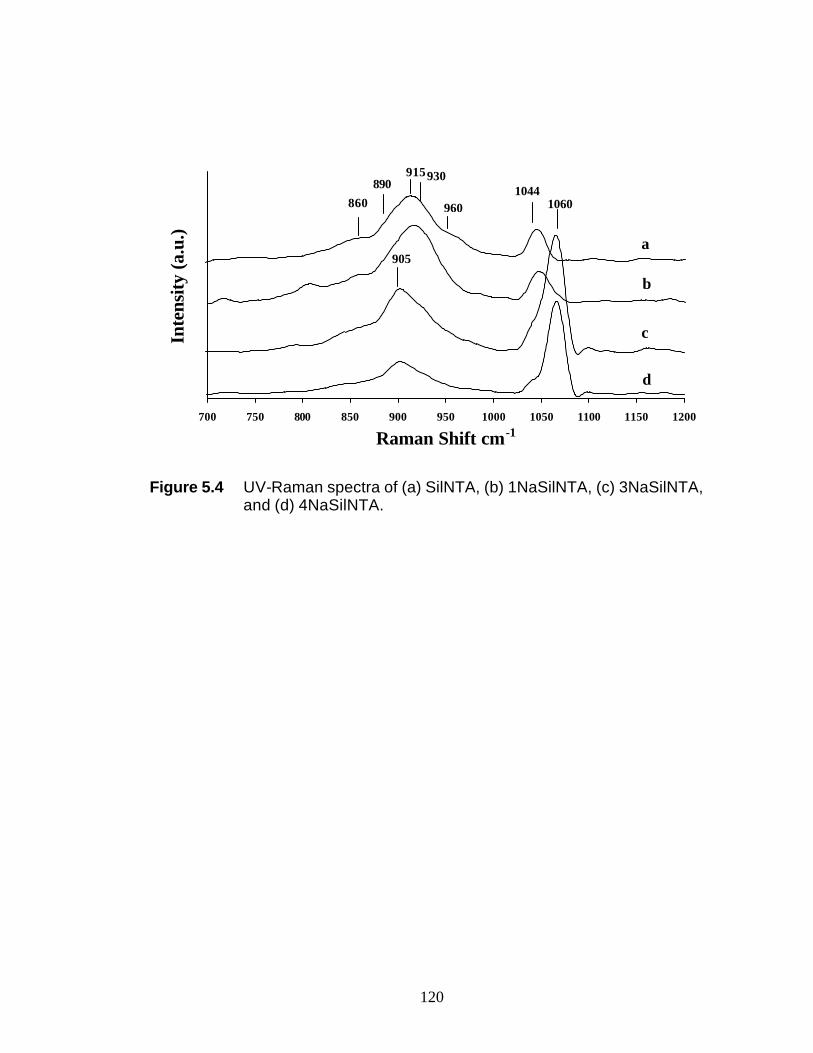
120
700 750 800 850 900 950 1000 1050 1100 1150 1200
Raman Shift cm-1
Inte
nsity
(a.u
.)
d
a
b
c
860 10601044
960
930915
905
890
Figure 5.4 UV-Raman spectra of (a) SilNTA, (b) 1NaSilNTA, (c) 3NaSilNTA,
and (d) 4NaSilNTA.
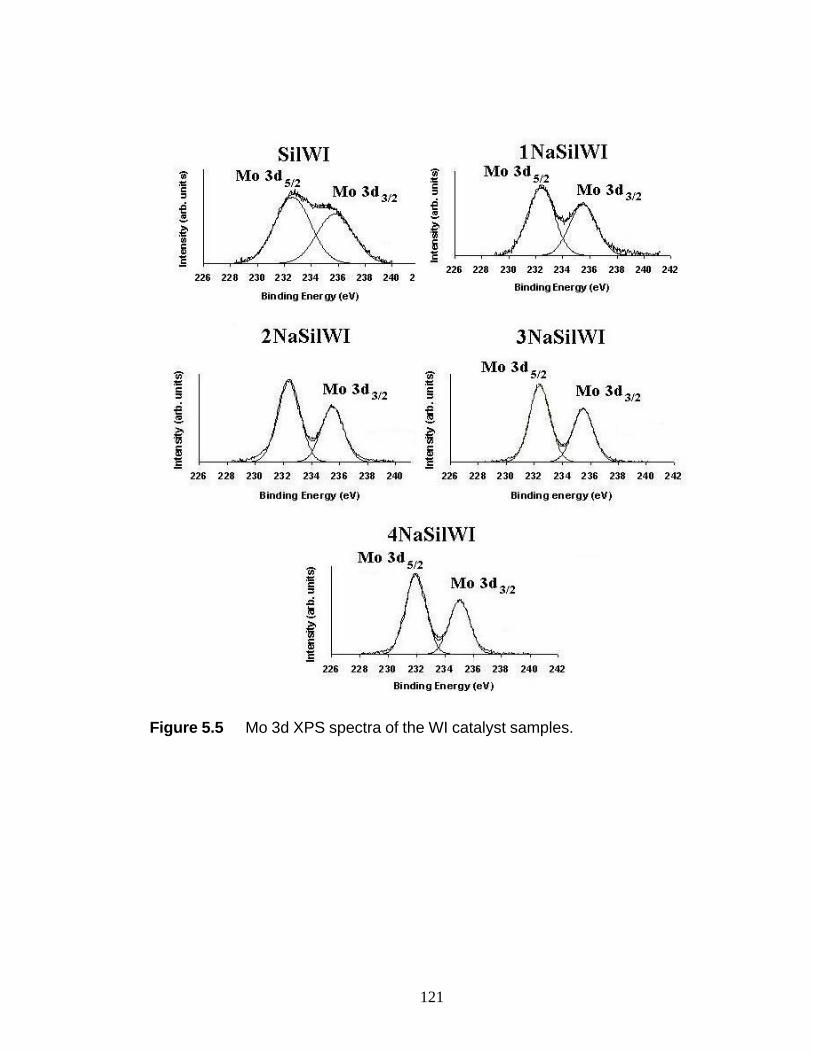
121
Figure 5.5 Mo 3d XPS spectra of the WI catalyst samples.
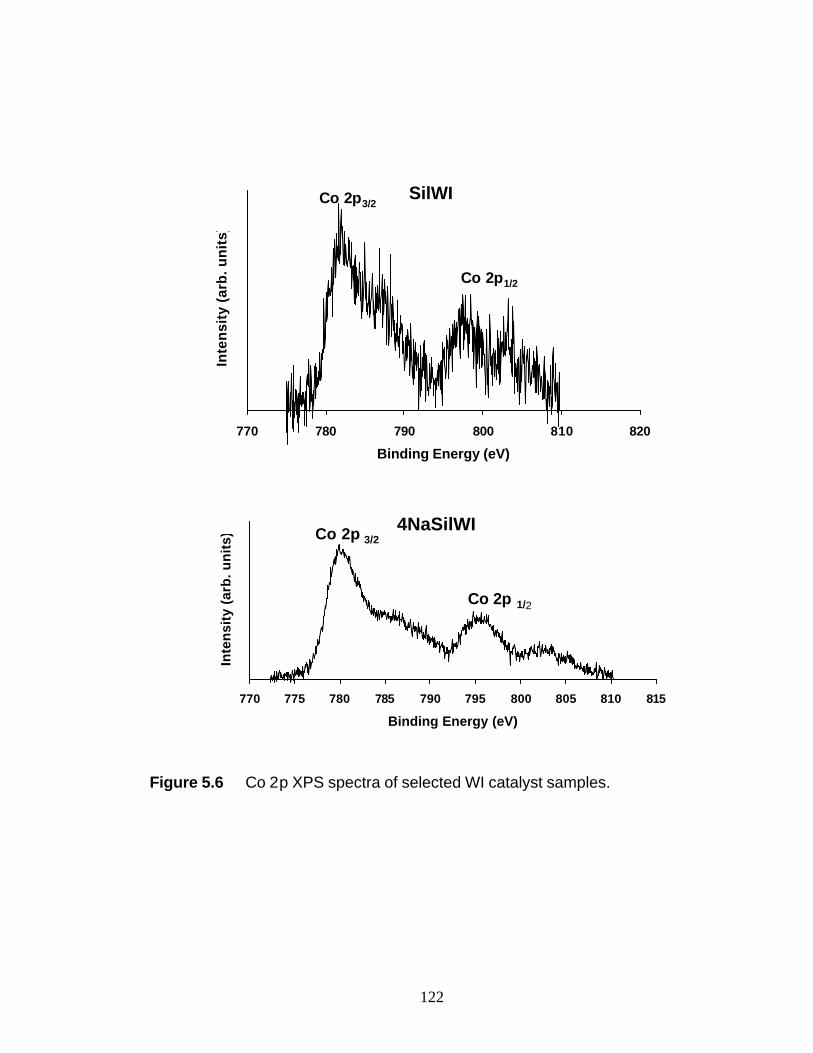
122
770 780 790 800 810 820
Binding Energy (eV)
Inte
nsi
ty (
arb
. un
its)
Co 2p3/2
Co 2p1/2
SilWI
770 775 780 785 790 795 800 805 810 815
Binding Energy (eV)
Inte
nsi
ty (
arb
. un
its)
4NaSilWI
Co 2p 1/2
Co 2p 3/2
Figure 5.6 Co 2p XPS spectra of selected WI catalyst samples.
Chapter 6 In situ UV-Raman Spectroscopic Studies of Hydrocarbon Catalysis on Platinum-Alumina Catalysts
Section 6.1 Introduction
Many scientists in the field of catalysis have hypothesized on the ability of
Raman spectroscopy to probe the mechanism of catalysis by monitoring reaction
intermediates.1-5 Indeed the number of publications reporting Raman spectroscopic
studies of heterogeneous catalysts has been growing steadily since 1975.2 A closer
examination of the literature indicates that these studies are similar to those reported in
Chapters 4 and 5, in which Raman spectroscopy has been widely used to study solid
crystalline phases on the surface of heterogeneous catalysis. In situ investigations
generally involve monitoring the evolution of these crystalline phases with changes in
temperature and gas phase concentration.6-46 There have been many fewer reports of
unenhanced Raman spectra of surface adsorbates that originated from the gas
phase.1,5,47-63 These type of studies are limited due to the small signal-to-noise ratio
resulting from the low concentration of adsorbates in the focal volume of the laser.
There are two specialized Raman spectroscopic techniques that greatly enhance
signal-to-noise making the detection of such adsorbates easier. One is surface enhanced
Raman spectroscopy (SERS), but it is limited to a few specific substrates. The other is
Resonance Raman spectroscopy that was briefly discussed in Chapter 2. The resonance
enhancement is specific to the adsorbed molecule. To be completely general,
Resonance Raman requires a laser tunable over a very wide frequency range. In
124
addition, interpretation of resonance Raman spectra are sometimes complicated by
competing photochemical processes.
As one of the most significant challenges to understanding and controlling
selectivity in heterogeneous catalysts, a more general method of detecting surface
reaction intermediates is needed. This chapter will focus on attempts to use UV-Raman
spectroscopy as a completely general tool to probe the adsorbate structure on industrial
Pt-alumina catalysts in situ. Surface hydrocarbon fragments play a key role in
hydrocarbon conversion reactions in nearly every catalytic process in petroleum
refining. Surface scientists have created a wide body of literature describing the nature
of these adsorbates on model catalysts, primarily noble metal single crystals and foils,
but much of the knowledge of the adsorbate structure from these studies is ex situ. 64,65
Section 6.2 Experimental
Section 6.2.1 Pt / γ-Al2O3 Industrial Catalyst Exxon Research and
Development Laboratory (ERDL) donated several samples of an industrial Pt-alumina
catalyst for these experiments. The catalyst preparation technique is proprietary.
The active metal surface area for the 5 wt% catalyst was determined by H2
chemisorption at 40oC to be 4.719 m2 / g. The metal dispersion is 38.2%. This data
was not obtained for the 0.9 wt% Pt catalyst sample.
Prior to the experiment, the catalyst samples were calcined at 500oC in air for 12
h. The catalyst was activated by heating at 300oC in a stream of flowing H2 in the UV-
Raman reactor.
125
Section 6.2.2 Experimental Setup In these experiments, the UV-Raman
reactors were coupled with a gas chromatograph (GC) which was used to monitor inlet
and outlet compositions. The inlet and outlet ports of the UV-Raman reactors are
plumbed to the GC column through a combination of two multiposition valves. Both
the inlet and outlet compositions can be monitored by alternating the position of those
valves as shown in Figure 1a-d.
Section 6.3 Results
Section 6.3.1 Ethylene Hydrogenation over 5 wt% Pt /γ-Al2O3 Figure 6.2
shows the UV-Raman spectrum acquired during an ethylene hydrogenation reaction at
25oC and atmospheric pressure over a sample of the 5 wt% Pt / γ-Al2O3 catalyst
obtained in the fluidized bed reactor. The gas contained a mixture of ethylene and
hydrogen in a 1:1 molar ratio. The ethylene flow rate was 104.8 sccm and the hydrogen
flow rate was 6.88 sccm. The turn over rate (TOR) under these conditions was 0.7
molecules C2H4 / Pt atom / sec. The narrow peak centered at 2992 cm-1 is attributed to
gas phase ethylene. The very broad peak centered at 3050 cm-1 encompasses the range
from about 2750 to 3250 cm-1. This peak is most likely π-bonded ethylene but could be
due to a mixture of species including ethylidyne.47,66
Section 6.3.2 Cyclohexene Disproportionation over 0.9 wt% Pt / γ-Al2O3
In the presence of some catalysts, cyclohexene can disproportionate into cyclohexane
and benzene. Because of the distinct Raman spectra of these three molecules, this
reaction seemed ideal to study. The experiment was performed in both the packed bed
and fluidized bed UV-Raman reactors.
126
The UV-Raman results for a cyclohexene disproportionation reaction
experiment in the packed bed reactor at atmospheric pressure are shown in Figure 6.3.
The catalyst was allowed to reach steady-state (i.e., constant conversion of cyclohexene
and a constant ratio of reaction products) in a stream of He with approximately 1 Torr
of cyclohexene at 25oC before acquiring the spectrum labeled as 1. One broad peak
centered at 1616 cm-1 is observed. At these conditions 24% of the cyclohexene is
converted and three times as much cyclohexane is produced as benzene. After reaching
steady-state at 25oC the catalyst bed was slowly heated to 125oC. Mid-way through the
temperature ramp, another Raman spectrum was acquired and labeled as spectrum 2.
Again, one broad peak centered at 1616 cm-1 is observed. The intensity of this peak is
much less than spectrum 1. The cyclohexene conversion increased as expected from the
increase in temperature. The product distribution changed to equal proportions of
cyclohexane and benzene. The third spectrum was obtained when the catalyst achieved
steady-state at 125oC. The cyclohexene conversions is again higher due to the greater
temperature. The concentration of benzene is twice that of cyclohexane.
It is well known that Raman features around 1616 cm-1 are due to surface
carbonaceous species.47 When this experiment was repeated in the fluidized bed
reactor, no Raman features were observed. Thus it is apparent that the band at 1616
cm-1 was due to a carbonaceous species formed from the thermal degradation induced
by the laser beam. The Raman features are localized and cannot be compared to the
kinetic information for the packed catalyst bed.
Section 6.3.3 UV-Raman spectra of crystalline zeolites and mesoporous
silica (MCM-41) nanoparticl catalyst samples In the results presented in Sections
127
6.3.1 and 6.3.2, no Raman features were detected due to the catalyst. No Raman
features are expected for Pt, a fcc metal. The phonon spectra of typical catalytic
supports are known to be weak.2 Since the γ-Al2O3 is amorphous, the phonon spectrum
is farther weakened. As a test of the capability of the UV-Raman spectroscopy system,
four samples of crystalline zeolites were examined. The UV-Raman spectra for ZSM-5,
MOR, Zeolite A, and Zeolite Y are shown in Figure 6.4a-d. These spectra agree very
well with the recent reports.67-69
In Figure 6.5, the UV-Raman spectrum of four different samples of a noble
metal nanoparticle catalyst supported by mesoporous silica (MCM-41) is shown. The
noble metal nanoparticles have a very narrow distribution of sizes and shapes. The
complete analysis of these samples is the subject of a future publication by co-workers.
The MCM-41 is semi-crystalline. The Raman features cannot be definitely assigned at
the time of publication of this dissertation.
Section 6.4 Conclusions
No Raman features were observed due to either the amorphous alumina support
or to hydrocarbon fragments on the surface during the cyclohexene reaction
experiments. One very broad peak from 2750 to 3250 cm-1 was observed during one
ethylene hydrogenation experiment. The broadness of the peak indicates a wide
distribution of ethylene fragments on the surface and no correlation between this peak
and the reaction kinetics could be drawn. UV-Raman spectroscopy results for
mesoporous silica (MCM-41) supported nanoparticle catalysts indicate the need for a
crystalline support to detect Raman features for the catalyst. A crystalline or semi-

128
crystalline support with uniform metal nanoparticle sizes may induce better ordering of
surface reaction species and may facilitate interpretation of UV-Raman spectroscopic
observations of adsorbed molecules.
129
Section 6.5 References (1) Campion, A. J. Vac. Sci. Technol. B 1985, 3, 1404. (2) Wachs, I. E. Topics in Catalysis 1999, 8, 57. (3) Knozinger, H. Catalysis Today 1996, 32, 71. (4) Knozinger, H.; Mestl, G. Topics in Catalysis 1999, 8, 45. (5) Chua, Y. T.; Stair, P. C. J. of Catal. 2000, 196, 66. (6) Barton, D. G.; Shtein, M.; Wilson, R. D.; Soled, S. L.; Iglesia, E. J. Phys. Chem
B 1999, 103, 630. (7) Chan, S. S.; Bell, A. T. Journal of Catalysis 1984, 89, 433. (8) Pittman, R. M.; Bell, A. T. J. Phys. Chem 1993, 97, 12178. (9) Su, S. C.; Bell, A. T. J. Phys. Chem B 1998, 102, 7000. (10) Abdelouahab, F. B.; Olier, R.; Guilhaume, N.; Lefebvre, F.; Volta, J. C. Journal
of Catalysis 1992, 134, 151. (11) Burcham, L. J.; Wachs, I. E. Spectrochimica Acta, Part A 1998, 54A, 1355. (12) Chan, S. S.; Wachs, I. E.; Murrell, L. L.; Wang, L.; Hall, W. K. J Phys Chem
1984, 88, 5831. (13) Das, N.; Echert, H.; Hangchun, H.; Wachs, I. E.; Walzer, J. F.; Feher, F. J. J
Phys Chem 1993, 97, 8240. (14) Haller, K.; Lunsford, J. H.; Laane, J. J Phys Chem-US 1996, 100, 551. (15) Hardcastle, F. D.; Wachs, I. E. Journal of Raman Spectroscopy 1990, 21, 683. (16) Hardcastle, F. D.; Wachs, I. E. J Phys Chem 1991, 95, 10763. (17) Hardcastle, F. D.; Wachs, I. E. Solid State Ionics, Diffusion & Reactions 1991,
45, 201. (18) Hardcastle, F. D.; Wachs, I. E. Journal of Solid State Chemistry 1992, 97, 319. (19) Hardcastle, F. D.; Wachs, I. E. Journal of Raman Spectroscopy 1995, 26, 397.
130
(20) Hardcastle, F. D.; Wachs, I. E. Journal of Raman Spectroscopy 1995, 26, 407. (21) Hardcastle, F. D.; Wachs, I. E.; Echert, H.; Jefferson, D. A. Journal of Solid
State Chemistry 1991, 90, 194. (22) Horsley, J. A.; Wachs, I. E.; Brown, J. M.; Via, G. H.; Hardcastle, F. D. J Phys
Chem 1987, 91, 4014. (23) Lunsford, J. H.; Yang, X. M.; Haller, K. J Phys Chem-US 1993, 97, 13810. (24) Mestl, G.; Knozinger, H.; Lunsford, J. H. Ber Bunsen Phys Chem 1993, 97, 319. (25) Mestl, G.; Rosynek, M. P.; Lunsford, J. H. J Phys Chem B 1997, 101, 9321. (26) Mestl, G.; Rosynek, M. P.; Lunsford, J. H. J Phys Chem B 1997, 101, 9329. (27) Mestl, G.; Rosynek, M. P.; Lunsford, J. H. J Phys Chem B 1998, 102, 154. (28) Mestl, G.; Xie, S. B.; Rosynek, M. P.; Lunsford, J. H. Stud Surf Sci Catal 1998,
118, 459. (29) Snyder, T.; Hill, C. G., Jr. Journal of Catalysis 1991, 132, 536. (30) Wachs, I. E.; Chan, S. S. Applications of Surface Science 1984, 20, 181. (31) Weckhuysen, B. M.; Mestl, G.; Rosynek, M. P.; Lunsford, J. H. J Phys Chem B
1998, 102, 3773. (32) Weckhuysen, B. M.; Rosynek, M. P.; Lunsford, J. H. Phys Chem Chem Phys
1999, 1, 3157. (33) Williams, C. C.; Ekerdt, J. G.; Jehng, J.-M.; Hardcastle, F. D.; Turek, A. M.;
Wachs, I. E. J Phys Chem 1991, 95, 8781. (34) Williams, C. C.; Ekerdt, J. G.; Jehng, J.-M.; Hardcastle, F. D.; Wachs, I. E. J
Phys Chem 1991, 95, 8791. (35) Xie, S. B.; Lunsford, J. H. Appl Catal A-Gen 1999, 188, 137. (36) Xie, S. B.; Mestl, G.; Rosynek, M. P.; Lunsford, J. H. J Am Chem Soc 1997,
119, 10186. (37) Xie, S. B.; Rosynek, M. P.; Lunsford, J. H. Journal of Catalysis 1999, 188, 24. (38) Xie, S. B.; Rosynek, M. P.; Lunsford, J. H. Appl Spectroscopy 1999, 53, 1183.
131
(39) Xie, S. B.; Rosynek, M. P.; Lunsford, J. H. Journal of Catalysis 1999, 188, 32. (40) Yu, Z.; Yang, X.; Lunsford, J. H.; Rosynek, M. P. Journal of Catalysis 1995,
154, 163. (41) Li, C.; Li, M. J. Raman Spectrosc. 2002, 33, 301. (42) Kuba, S.; Knozinger, H. J. Raman Spectrosc. 2002, 33, 325. (43) Mestl, G. J. Raman Spectrosc. 2002, 33, 333. (44) Busca, G. J. Raman Spectrosc. 2002, 33, 348. (45) Banares, M. A.; Wachs, I. E. J. Raman Spectrosc. 2002, 33, 359. (46) Arab, M.; Bougeard, D.; Aubry, J. M.; Marko, J.; Paul, J. F.; Payen, E. J. Raman
Spectrosc. 2002, 33, 390. (47) Li, C.; Stair, P. C. Catalysis Today 1997, 33, 353. (48) Campion, A. Annual Review of Physical Chemistry 1985, 36, 549. (49) Campion, A. Journal of Electron Spectroscopy and Related Phenomena 1990,
54, 877. (50) Campion, A.; Brown, J. K.; Grizzle, V. Surface Science 1982, 115, L153. (51) Campion, A.; Mullins, D. R. Chem. Phys. Letters 1983, 94, 576. (52) Campion, A.; Mullins, D. R. Surface Science 1985, 158, 263. (53) Hallmark, V. M.; Campion, A. Chem. Phys. Letters 1984, 110, 561. (54) Hallmark, V. M.; Campion, A. J. Chem. Phys. 1986, 84, 2942. (55) Hallmark, V. M.; Campion, A. J. Chem. Phys. 1986, 84, 2933. (56) Harradine, D.; Campion, A. Chemical Physics Letters 1987, 135, 501. (57) Kambhampati, P.; Child, C. M.; Foster, M. C.; Campion, A. J. Chem. Phys.
1997, 108, 5013. (58) Mullins, D. R.; Campion, A. Chemical Physics Letters 1984, 110, 565. (59) Perry, S. S.; Campion, A. Surface Science Letters 1990, 234, L275.
132
(60) Perry, S. S.; Campion, A. Surface Science 1991, 259, 207. (61) Shannon, C.; Campion, A. Journal of Physical Chemistry 1988, 92, 1385. (62) Shannon, C.; Campion, A. Surface Science 1990, 227, 219. (63) Moissette, A.; Gener, I.; Bremard, C. J. Raman Spectrosc. 2002, 33, 381. (64) Somorjai, G. A. Chemistry in Two Dimensions; Cornell University Press: Ithaca,
NY, 1981. (65) Somorjai, G. A. Introduction to Surface Chemistry and Catalysis; Wiley-
Interscience: New York, 1994. (66) Cremer, P. S.; Su, X.; Shen, Y. R.; Somorjai, G. A. J. Am. Chem. Soc. 1996,
118, 2942. (67) Yu, Y.; Xiong, G.; Li, C.; Xiao, F. S. Microporous and Mesoporous Materials
2001, 46, 23. (68) Poborchii, V. V. J. Chem. Phys. 2001, 114, 2707. (69) Mozgawa, W. Journal of Molecular Structure 2001, 596, 129.
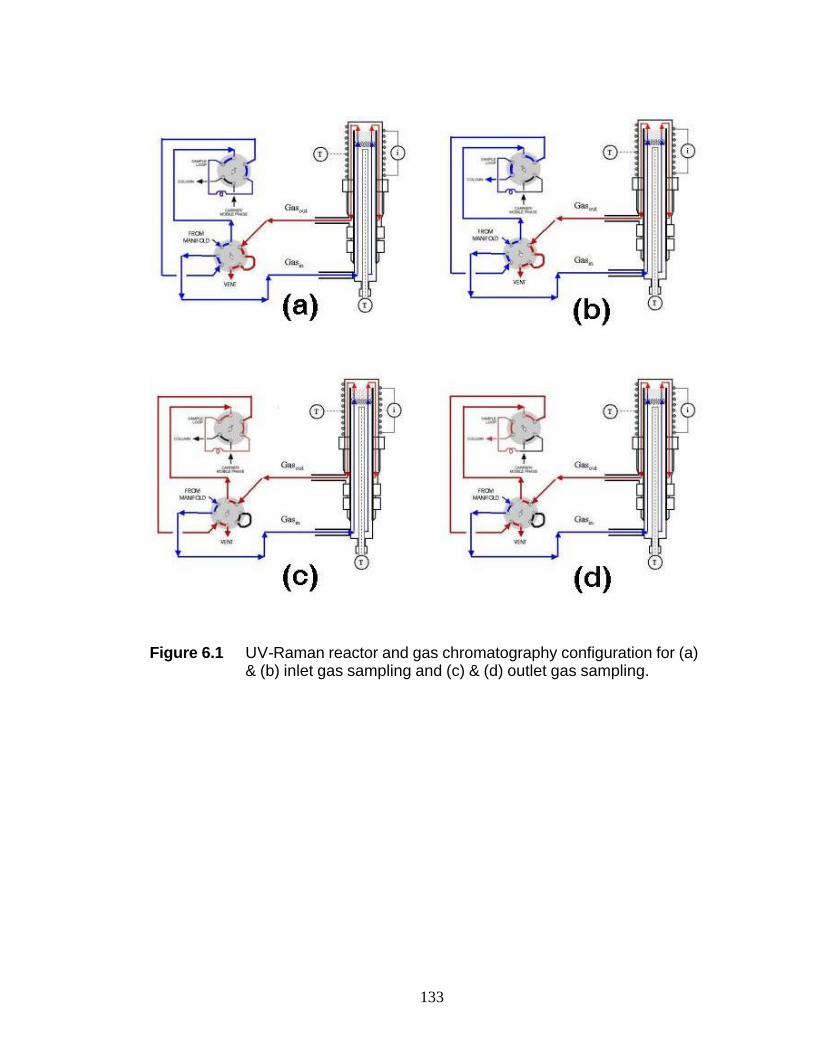
133
Figure 6.1 UV-Raman reactor and gas chromatography configuration for (a) & (b) inlet gas sampling and (c) & (d) outlet gas sampling.
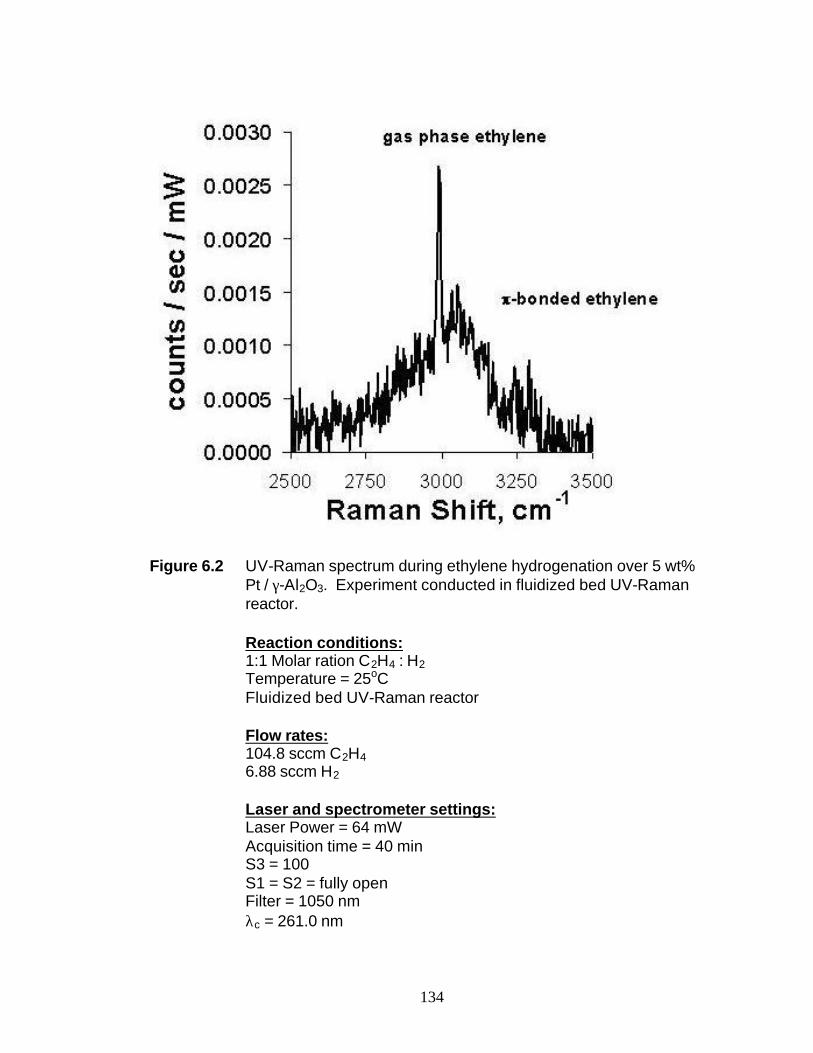
134
Figure 6.2 UV-Raman spectrum during ethylene hydrogenation over 5 wt%
Pt / γ-Al2O3. Experiment conducted in fluidized bed UV-Raman reactor. Reaction conditions: 1:1 Molar ration C2H4 : H2 Temperature = 25oC Fluidized bed UV-Raman reactor Flow rates: 104.8 sccm C2H4 6.88 sccm H2 Laser and spectrometer settings: Laser Power = 64 mW Acquisition time = 40 min S3 = 100 S1 = S2 = fully open Filter = 1050 nm λc = 261.0 nm
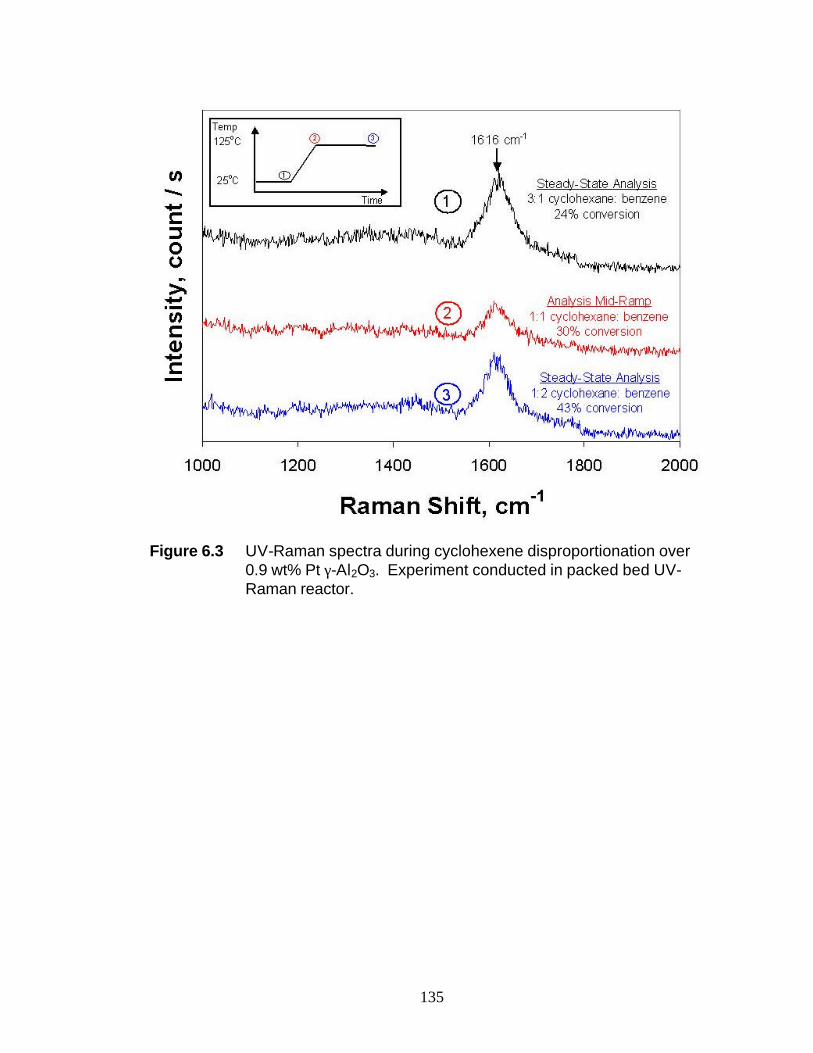
135
Figure 6.3 UV-Raman spectra during cyclohexene disproportionation over
0.9 wt% Pt γ-Al2O3. Experiment conducted in packed bed UV-Raman reactor.
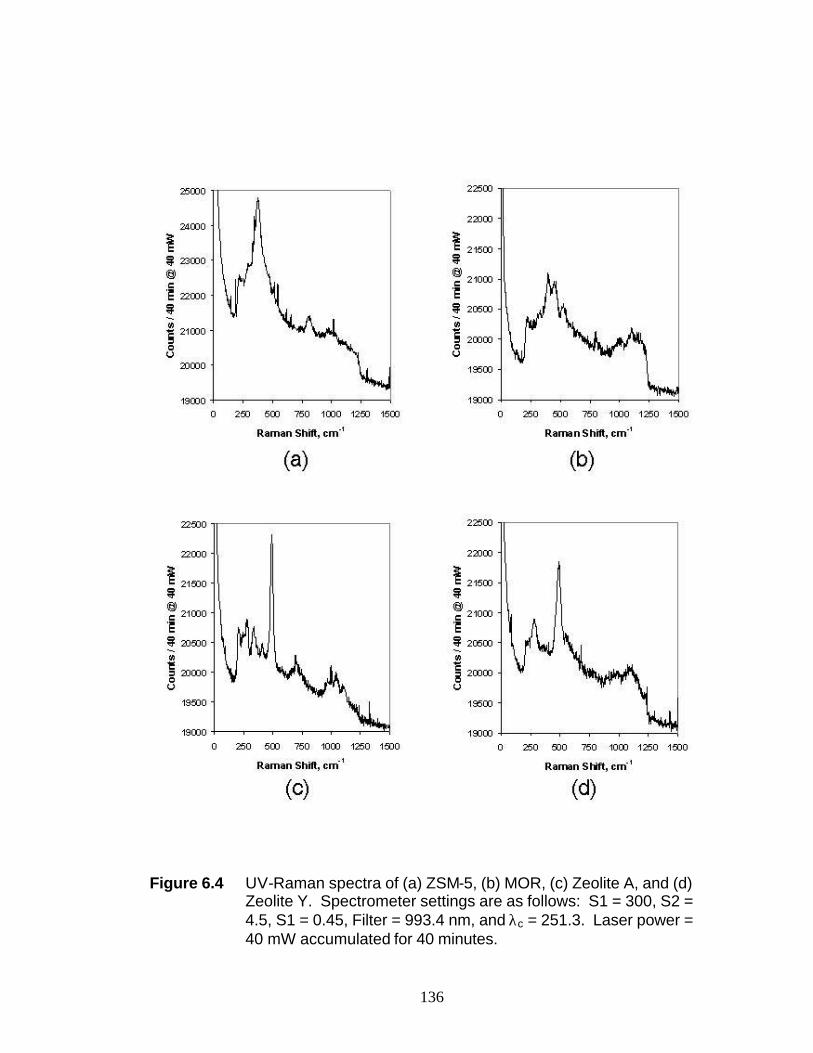
136
Figure 6.4 UV-Raman spectra of (a) ZSM-5, (b) MOR, (c) Zeolite A, and (d)
Zeolite Y. Spectrometer settings are as follows: S1 = 300, S2 = 4.5, S1 = 0.45, Filter = 993.4 nm, and λc = 251.3. Laser power = 40 mW accumulated for 40 minutes.

137
Figure 6.5 UV-Raman spectra of mesoporous silica (MCM-41) supported
noble metal nanoparticle catalyst samples.
Chapter 7
Summary
UV-Raman spectroscopy has been successfully applied to studying
heterogeneous catalysts in situ and ex situ. This technique will continue to be a useful
complement to the array of ex situ surface science techniques such as X-ray
photoelectron spectroscopy (XPS) and temperature programmed desorption (TPD). The
availability of continuous wave lasers with an output in the ultraviolet have eliminated
the fluorescence interference commonly encountered with many catalytic support
materials.
The preponderance of the Raman spectroscopic studies in this dissertation and
the current literature involve the changes in the crystalline phases on the catalyst surface
due to changes in preparation methods or reaction environment. The highest
concentration of scattering molecules in the focal volume of the laser are usually these
crystalline phases which makes it quite easy to obtain a high signal-to-noise ratio.
Fluidized and spinning bed reactors can be used, even in a less than optimized
collection geometry, to minimize thermally induced laser damage while acquiring a
Raman spectrum of these crystalline phases.
The goal of monitoring the structure of surface adsorbates during a catalytic
reaction has not been fully realized. This is largely due to the low number of adsorbates
in the focal volume of the laser. If adsorbates are susceptible to laser induced damage,
it is even more difficult to measure the Raman spectrum. There are generally two
139
methods to enhance the signal-to-noise ratio of adsorbate Raman spectra: Surface
Enhanced Raman Spectroscopy (SERS) and Resonance Raman spectroscopy. SERS is
substrate specific and Resonance Raman spectroscopy is adsorbate specific. In
addition, photochemical damage is difficult to avoid in Resonance Raman spectroscopy.
To use Raman spectroscopy as a generally applicable technique to study adsorbates on
catalysts, more progress needs to be made on reactors that can minimize thermal
damage while optimizing the scattered light collection. Ideally, a Raman excitation
source in the IR, visible, and UV spectral regions should be available. The choice of
excitation source could be optimized based upon the optical properties of the system of
interest.