Embed Size (px)
Citation preview
Rochester Institute of Technology Rochester Institute of Technology
RIT Scholar Works RIT Scholar Works
Theses
2012
Temperature mapping study of United States distribution systems Temperature mapping study of United States distribution systems
Ken Silverman
Follow this and additional works at: https://scholarworks.rit.edu/theses
Recommended Citation Recommended Citation Silverman, Ken, "Temperature mapping study of United States distribution systems" (2012). Thesis. Rochester Institute of Technology. Accessed from
This Thesis is brought to you for free and open access by RIT Scholar Works. It has been accepted for inclusion in Theses by an authorized administrator of RIT Scholar Works. For more information, please contact [email protected].

i
Temperature Mapping Study of United States
Distribution Systems
By
Ken Silverman
A Thesis Project
Submitted to the
Department of Packaging Science
College of Applied Science and Technology
In partial fulfillment of the requirements for the degree of
Master of Science
Rochester Institute of Technology
2012
Temperature Mapping Study of United States Distribution Systems
ii
Department of Packaging Science College of Applied Science and Technology
Rochester Institute of Technology Rochester, New York
CERTIFICATE OF APPROVAL _________________________
M. S. DEGREE THESIS PROJECT
________________________
The M.S. degree thesis project of Ken Silverman has been examined and approved
by the thesis committee as satisfactory for the requirements for the Master of Science Degree
_____________________________________________________
Daniel L. Goodwin, PhD RIT, Packaging Science Professor
_____________________________________________________
Dennis Young RIT, Packaging Science Professor
_____________________________________________________
Deanna M. Jacobs RIT, Packaging Science Graduate Program Chair

Temperature Mapping Study of United States Distribution Systems
iii
November 2012 COPY RELEASE
Temperature Mapping Study of United States Distribution Systems
I, Ken Silverman, hereby grant permission to the RIT Library of the Rochester Institute of Technology to reproduce my thesis in whole or in part. Any reproduction will not be for commercial use or profit.
Date: ____________ Signature of Author: _____________________

Temperature Mapping Study of United States Distribution Systems
iv
ABSTRACT
The purpose of this one-year temperature mapping study was to determine the extreme
temperatures and respective durations commercial pharmaceutical products are expected to be
exposed to during routine ambient distribution within the continental United States. Extreme
temperature conditions may affect the safety and efficacy of pharmaceutical products during
distribution. Knowing the value and duration of the extreme temperatures that products are
likely to experience in the ambient (uncontrolled) distribution environment allows for improved
product degradation testing, optimized thermal package design and scientifically based
determination as to when logistical and environmental controls should be used. Before this
study, testing was performed using profiles provided by standards organizations. This study was
designed to provide company specific data that may be used to design tests, validate, or modify
existing test procedures throughout the organization. To achieve this, packages were shipped to
selected locations across the United States from the company’s Eastern, Southern, and Western
Distribution Centers (DCs) during peak summer and winter conditions. The packages were
equipped with data logging instrumentation that recorded the temperature and the time-of-day.
As a result of this project, the organization now has first hand knowledge of the expected
extremes and durations within its United States distribution environment. This information is
now in use for study design, logistical decision-making, and proving that appropriate testing has
been performed to regulatory bodies.
Temperature Mapping Study of United States Distribution Systems
v
ACKNOWLEDGEMENTS
I would like to thank daughter Kimberly, my wife Thi, my parents Robert and Blanche
Silverman, my Professors Dan Goodwin, Dennis Young and Deanna Jacobs, the Cold-Chain
Services team at Sensitech, Nicole Nepomuceno, Paul DellaVilla, Mark Maurice and Stefan
Popescu, my colleagues Beth Ruland, Keith Holland and John Lombardo, and my editor,
Jennifer Liebman.

Temperature Mapping Study of United States Distribution Systems
vi
TABLE OF CONTENTS
Chapter 1: Introduction ............................................................................................................................. 8
BACKGROUND OF THE PROBLEM .................................................................................................. 8 PROBLEM STATEMENT ................................................................................................................. 8 OBJECTIVE OF THE RESEARCH ..................................................................................................... 8 SCOPE OF THE RESEARCH............................................................................................................. 8
Chapter 2: Literature Review and Background Theories ........................................................................ 10
PHARMACEUTICAL PRODUCT STABILITY – TECHNICAL ISSUES INCLUDING DEGRADATION
CHARACTERISTICS ..................................................................................................................... 10 ICH Q1A SUMMARY OF STABILITY PARAMETERS ..................................................................... 16 STABILITY ISSUES IN PHARMACEUTICAL PRODUCTS – LOGISTICS ISSUES .................................. 18 TEMPERATURE MAPPING STUDY – BEST PRACTICES ................................................................. 25 MATERIALS/EQUIPMENT USED .................................................................................................. 29 FIGURE 1 – TEMPTALE4 ............................................................................................................. 29 FIGURE 2 – VENTILATED BOX .................................................................................................... 29 FIGURE 3 – COMPANY DISTRIBUTION CENTERS AND SHIP TO LOCATIONS – MAP AND KEY ...... 30 TABLE 4 – ORIGIN DC, DESTINATION CITY AND NUMBER OF MONITORS SHIPPED ..................... 31
CHAPTER 4: RESULTS, ANALYSIS, AND DISCUSSION ................................................................ 33
TABLE 5 – NUMBERS OF MONITORS SHIPPED BY LOCATION ..................................................... 33 ACTUAL MINIMUM AND MAXIMUM TEMPERATURE EXTREMES, DURATIONS AT EXTREMES AND
CALCULATED MEAN .................................................................................................................. 33 THE MAXIMUM TEMPERATURE SEEN IN THE US SINGLE PARCEL COMMERCIAL GROUND
DISTRIBUTION ENVIRONMENT WAS 60.9°C FOR 2.3 HOURS, CAPTURED IN RENO, NV DURING THE
SUMMER SEASON. THE LOWEST TEMPERATURE SEEN IN THE DISTRIBUTION ENVIRONMENT WAS -19.8 °C FOR 38 HOURS, ALSO CAPTURED IN RENO, NV DURING THE WINTER. TABLE 6 SHOWS THE
MINIMUM AND MAXIMUM TEMPERATURE EXTREMES EXPERIENCED WITHIN ALL THREE DC’S
SHIPPING LANES. ........................................................................................................................ 33 TABLE 6– TEMPERATURE EXTREMES AND DURATIONS BY DC .................................................. 34 TABLE 7– SEASONAL SUMMARY ANALYSIS OF SHIPMENTS BY ORIGIN ..................................... 35 NUMBER OF MONITORS OVER AND UNDER 0°C AND OVER 40°C AND ASSOCIATED DURATIONS
................................................................................................................................................... 35 STATICALLY DERIVED MINIMUM AND MAXIMUM TEMPERATURE BOUNDARIES WITH
CONFIDENCE LEVELS BY SEASON .............................................................................................. 36 TABLE 8 - EASTERN DC WINTER STATISTICAL MINIMUM AND MAXIMUM TEMPERATURE
AMBIENT TEMPERATURE PROFILES ........................................................................................... 37 TABLE 9 - EASTERN DC SUMMER STATISTICAL MINIMUM AND MAXIMUM TEMPERATURE
AMBIENT TEMPERATURE PROFILES ........................................................................................... 37 TABLE 10 – WESTERN DC WINTER STATISTICAL MINIMUM AND MAXIMUM TEMPERATURE
AMBIENT TEMPERATURE PROFILES ........................................................................................... 38 TABLE 11 WESTERN DC SUMMER STATISTICAL MINIMUM AND MAXIMUM TEMPERATURE
AMBIENT TEMPERATURE PROFILES ........................................................................................... 38

Temperature Mapping Study of United States Distribution Systems
vii
TABLE 12 SOUTHERN DC WINTER STATISTICAL MINIMUM AND MAXIMUM TEMPERATURE
AMBIENT TEMPERATURE PROFILES ........................................................................................... 39 TABLE 13 SOUTHERN DC SUMMER STATISTICAL MINIMUM AND MAXIMUM TEMPERATURE
AMBIENT TEMPERATURE PROFILES ........................................................................................... 39
Chapter 5: Conclusion ............................................................................................................................. 40
RECOMMENDATIONS FOR FUTURE RESEARCH ........................................................................... 40
References ............................................................................................................................................... 41
Appendix A .............................................................................................................................................. 44
Temperature Mapping Study of United States Distribution Systems
8
CHAPTER 1: INTRODUCTION
Background of the Problem
Before this study, the company utilized temperature profiles provided by standards
organizations for the determination of shipping methods, product robustness testing, and thermal
package design without company specific first hand data. Available temperature profiles are
nonspecific and highly generalized to fit a wide array of applications. A comprehensive thermal
mapping study of the company’s commercial distribution systems facilitates optimized study
design, better logistical decision-making and proof that appropriate testing has been performed to
regulatory bodies.
Problem Statement
Relying solely on profiles published by standards organizations and not comparing
product sensitivities to company specific, actual field data leaves the company vulnerable to the
questioning of their current practices in regard to study design, logistical decision-making and
proving that appropriate testing has been performed.
Objective of the Research
The objective of this study was to map the single parcel commercial ground shipping
routes used by the company to distribute commercial Rx products. This was done by shipping
time-stamping, temperature sensing data loggers throughout the continental United States using
modes and routes representative of the actual commercial shipping lanes.
Scope of the Research
The scope of the research was limited to:
• Single parcel packages.
• The continental United States.
• Year-round data collection with increased data collection during summer and
winter seasonal extremes.
• This data was used to:

Temperature Mapping Study of United States Distribution Systems
9
o Verify or supersede temperature profiles generated by standards
organizations currently in use for cold chain package testing.
o Establish minimum and maximum temperatures used to determine
shipping methods and design or confirm cycling profiles used in studies to
evaluate product sensitivities during formulation.
Temperature Mapping Study of United States Distribution Systems
10
CHAPTER 2: LITERATURE REVIEW AND BACKGROUND THEORIES
Pharmaceutical product stability has time and temperature dependencies. A temperature
mapping study of the pharmaceutical product distribution routes is performed to establish the
value and duration of extreme temperatures products are likely to experience in the commercial
distribution environment. The information gathered is important for purposes of regulatory
compliance, product development and testing, packaging design, and logistics planning. This
review of literature therefore proceeds in the topical order below to establish the technical and
business-level foundation of temperature mapping studies, as well as best practices for
performing such studies:
• Stability issues in pharmaceutical products
• Technical issues, including degradation characteristics
• Physical causes, with emphasis on temperature considerations
• Manufacturing issues
• Logistics issues
• Packaging issues
• Regulatory compliance
• Product development and testing
• Temperature mapping study best practices
Pharmaceutical Product Stability – Technical Issues Including Degradation Characteristics
The United States Pharmacopeia is the authority that sets public standards for
pharmaceutical products manufactured or sold in the United States. USP <1150> provides the
key definitions and parametric boundaries for the study of stability in pharmaceutical products.
USP <1150> states that when possible, the dosage unit should be used as the unit of
measurement for pharmaceutical product stability, and that the concept of stability applies to
product identity, strength, quality, and purity. USP <1150> lists temperature, light, air,
humidity, packaging components, and if applicable, microbial contaminations as factors that
affect stability. It is noteworthy that the list of factors affecting stability does not include the
elapse of time. Instead, USP <1150> makes it clear that concept of time is implicit in the
Temperature Mapping Study of United States Distribution Systems
11
concept of stability because stability protocols apply to products “from initial preparation to
expiration date.”
USP <1191> provides a technical discussion of stability and the breakdown in stability in
pharmaceutical products. According to USP <1191>: “Stability is defined as the extent to which
a product retains, within specified limits, and throughout its period of storage and use (i.e., its
shelf-life), the same properties and characteristics that it possessed at the time of its
manufacture.”
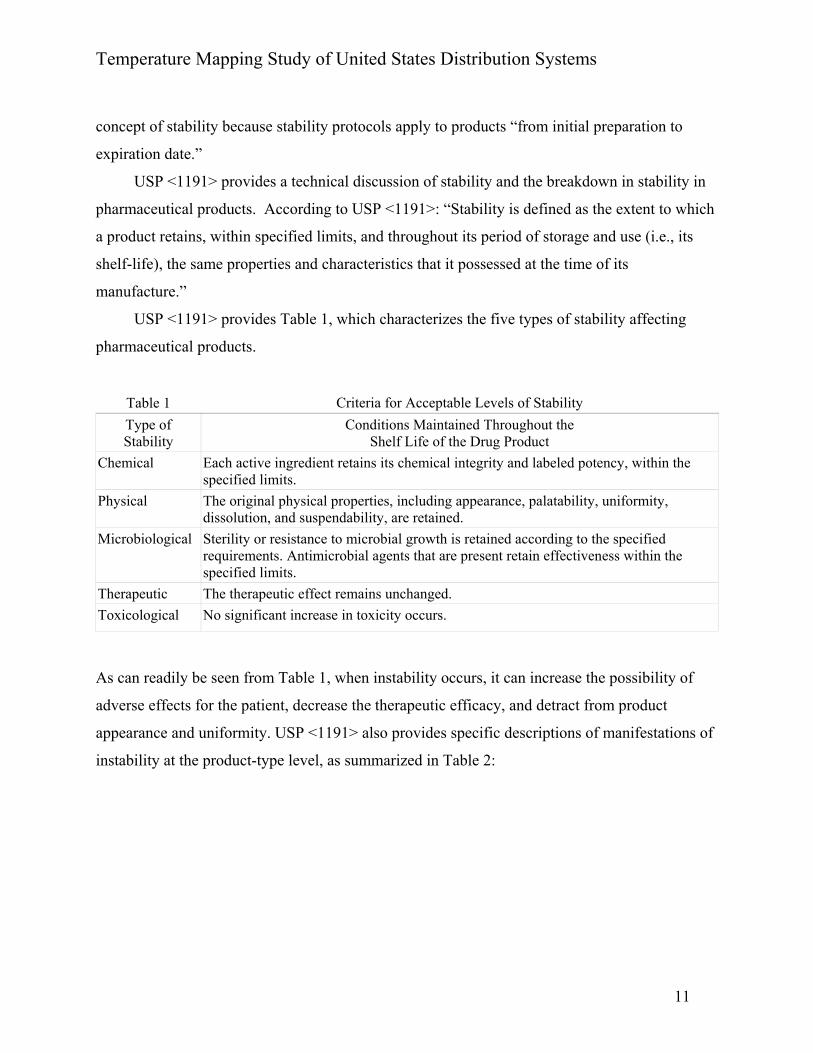
USP <1191> provides Table 1, which characterizes the five types of stability affecting
pharmaceutical products.
Table 1 Criteria for Acceptable Levels of Stability
Type of Stability
Conditions Maintained Throughout the Shelf Life of the Drug Product
Chemical Each active ingredient retains its chemical integrity and labeled potency, within the specified limits.
Physical The original physical properties, including appearance, palatability, uniformity, dissolution, and suspendability, are retained.
Microbiological Sterility or resistance to microbial growth is retained according to the specified requirements. Antimicrobial agents that are present retain effectiveness within the specified limits.
Therapeutic The therapeutic effect remains unchanged.
Toxicological No significant increase in toxicity occurs.
As can readily be seen from Table 1, when instability occurs, it can increase the possibility of
adverse effects for the patient, decrease the therapeutic efficacy, and detract from product
appearance and uniformity. USP <1191> also provides specific descriptions of manifestations of
instability at the product-type level, as summarized in Table 2:

Temperature Mapping Study of United States Distribution Systems
12
Table 2
PRODUCT TYPE TYPICAL MANIFESTATIONS OF INSTABILITY
Gelatin Capsule Softening or hardening of the shell
Uncoated Tablet Crumbling (not from breakage), discoloration, swelling, crystal formation, fusion
Coated Tablet Discoloration, clumping, tackiness
Powders and Granules Caking, odor
Effervescents Swelling, development of gas pressure within container
Solutions, Elixirs, Syrups Precipitation, microbial contamination, gas pressure within container
Emulsions Permanent oil separation
Suspensions Non-resuspendable caking, crystal growth
Tinctures, Fluids, Extracts precipitation
Sterile Liquids microbial contamination, change in color, cloudiness
Creams crystal growth, microbial contamination, emulsion breakdown, evaporation
Ointments change in consistency (grittiness), separation
Suppositories softening, drying
The negative consequences of product stability changes that result in abnormal product
appearance and efficacy are as varied as customer dissatisfaction and product returns, and
damaged reputation and court-imposed fines for criminal actions. As an example, Clinard and
Yeager (2006) report that “in 1995 Warner-Lambert pled guilty and was given a criminal fine of
$10 million for failing to notify the FDA about stability problems with a widely used drug for the
treatment of epilepsy.”
Pharmaceutical Product Stability – Physical Causes with Emphasis on Temperature
Considerations
There are four primary environmental exposure factors affecting pharmaceutical product
stability. These factors are temperature, light, humidity, and atmospheric gases. Obviously,
temperature mapping studies, which are the focus of this thesis, are concerned with the impact of
temperature on stability. As such, it must be remembered that while exposure to excess heat is
Temperature Mapping Study of United States Distribution Systems
13
often considered the biggest worry, it must also be realized that inappropriately cold
temperatures may also affect product safety and efficacy. USP <1191> illustrates effects of low
temperatures by citing that inappropriate refrigeration of liquid drugs may cause excess
viscosity, and that inappropriate freezing can have adverse effects on dispensability and efficacy.
When performing or interpreting the results of a temperature mapping study, it is useful
to understand the magnitude of temperature variations and specific effects that concern
pharmaceutical products. USP <1191> characterizes the impact of temperature on stability in
terms of the typical effects temperature has on chemical reactions. To this end the document
notes that across most drug hydrolysis and many drug oxidation reactions the rate of a chemical
reaction increases exponentially for each 10 degree Celsius increase in temperature.
While the actual impact of temperature variation for any individual product will vary
depending on such factors as its molecular bonding type and pH value, U.S. Pharmacopeia
<1191> provides the general example of a hydrolysable product intended to be refrigerated that
is instead exposed at room temperature to a continual 20 degree increase in temperature. In this
case the efficacy should be expected to decrease to one-fourth to one-twenty-fifth of its shelf life
under refrigeration.
Since this example in USP <1191> covers the affect of continual exposure to an elevated
temperature on pharmaceutical products, for the purposes of interpreting variations uncovered in
a temperature mapping study it is worthwhile to consider the mathematics applicable to the
transient variations experienced in the distribution environment. To this end, in the article
“Comparing Ambient Temperature Profiles,” O'Donnell (2009) describes a useful method for
computing the impact of transient temperature spikes. O’Donnell considers these critical factors
when determining a representative ambient temperature profile:
• The cumulative amount of heat exposure during the distribution process (the area under
the curve), and
• The assignment of temperature spikes at the appropriate place along the timeline, (the
elapsed time during the distribution process capturing day/night exposure and critical
touch points).
Temperature Mapping Study of United States Distribution Systems
14
O'Donnell provides the following method for calculating the cumulative amount of heat
exposure: “Simple Calculation for Determining the Heat under the Curve.” During the package
design process, it is important to determine the amount of heat exposure the packaged product is
likely to be exposed to during the distribution process. Such a calculation is helpful in
determining the amount of insulation required for the amount of refrigerant necessary, and the
size of the package, which are all necessary elements for maintaining the product within a
specified temperature range. A simple process for determining a relative number representing the
total amount of heat is by calculating the area under the heat curve. This can be achieved by
multiplying the length times the width of the curve.
A = L x W
Where A = area, L = temperature and W = (time) and where all widths are broken down to an
equal interval… the length, L = (temperature) at each interval is multiplied by the width, W =
(time) and where all widths are equal.
A = L1 x W + L2 x W + L3 x W + L4 x W
The resulting area... represents all the heat under the curve and can be used to compare other
profiles (whose area is determined by the same method), for determining which are more
“severe.” This can be critical information to have when determining package design parameters.
O'Donnell's discussion of the computation and impact upon product stability quoted
above provides a mathematical foundation for estimating effects of transient and long term
exposure of pharmaceutical product to elevated and extreme low temperatures that is especially
useful for comparing temperature excursions having different durations and temperature
extremes. Such comparisons are useful for extrapolating between test cases with documented
results, and cases in which potential or actual results need to be estimated.
The area under the curve described by O'Donnell represents Mean Kinetic Temperature,
or MKT. USP <1150> describes the importance of MKT relative to pharmaceutical product
stability as providing a single number that represents the cumulative effect of degradation caused
by various temperatures to which the product has been exposed. USP <1150> states that data
loggers can be used to collect the periodic readings required as input to the calculation of MKT,

Temperature Mapping Study of United States Distribution Systems
15
and takes special care to point out that MKT “is not a simple arithmetic mean,” but, when
formally calculated, a value that more highly weights temperature extremes through use of
logarithmic functions.
In an earlier work, O'Donnell characterized the role that MKT (mean kinetic temperature)
calculations play in regulatory compliance that are useful in avoiding the types of criminal
sanctions described by Clinard and Yeager (2006). Citing the FDA, O'Donnell writes:
The FDA states in its Code of Federal Regulations, Part 203 that manufacturers, authorized distributors of drugs and their representatives shall store and handle all drug samples under conditions that will maintain their stability, integrity, and effectiveness, and ensure that the drug samples are free of contamination, deterioration and adulteration. This is not possible without the application of MKT.
In addition to the steady state MKT example from USP <1191> and the cumulative MKT
calculation methodology provided by O'Donnell the International Conference on Harmonization
based recommendations for extrapolations to aid in accelerated studies have been widely
embraced within the pharmaceutical industry. For example, in “A Stability Program for the
Distribution of Drug Products,” Lucas, Bishara, and Seevers (2004) provide guidelines for both
long term and accelerated stability testing that are compliant with ICH product registration study
requirements as summarized in Table 3.
Temperature Mapping Study of United States Distribution Systems
16
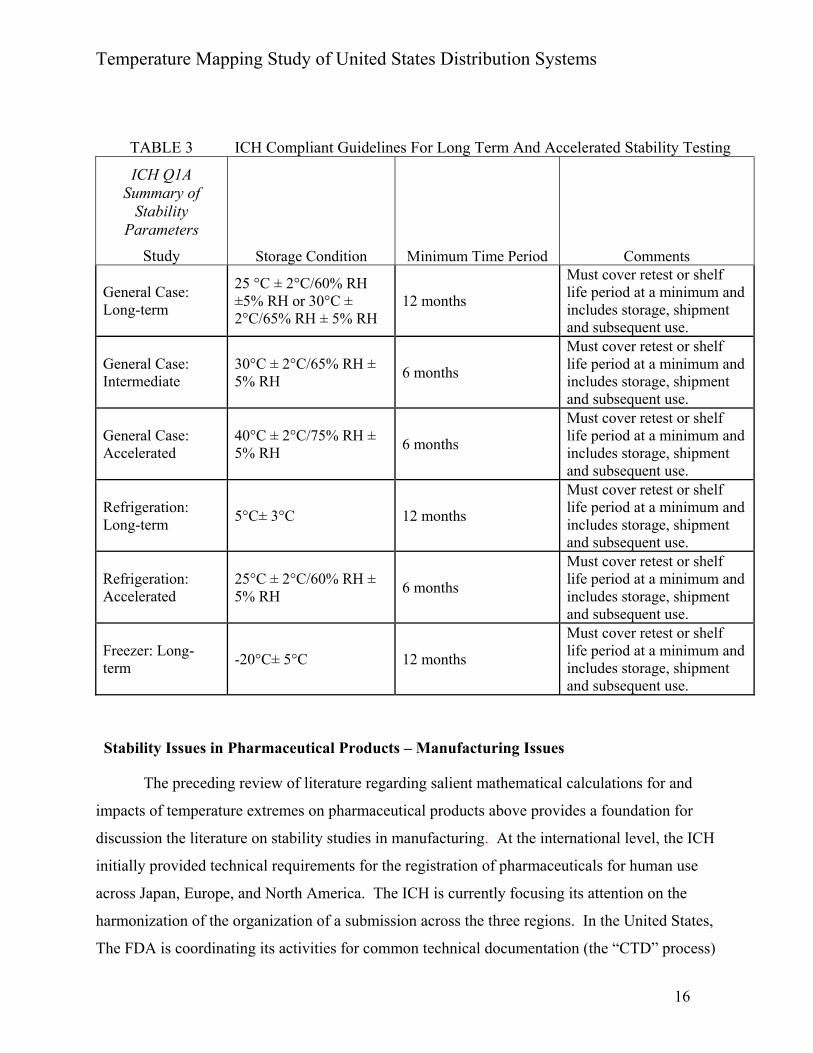
TABLE 3 ICH Compliant Guidelines For Long Term And Accelerated Stability Testing
ICH Q1A Summary of
Stability Parameters
Study Storage Condition Minimum Time Period Comments
General Case: Long-term
25 °C ± 2°C/60% RH ±5% RH or 30°C ± 2°C/65% RH ± 5% RH
12 months
Must cover retest or shelf life period at a minimum and includes storage, shipment and subsequent use.
General Case: Intermediate
30°C ± 2°C/65% RH ± 5% RH
6 months
Must cover retest or shelf life period at a minimum and includes storage, shipment and subsequent use.
General Case: Accelerated
40°C ± 2°C/75% RH ± 5% RH
6 months
Must cover retest or shelf life period at a minimum and includes storage, shipment and subsequent use.
Refrigeration: Long-term
5°C± 3°C 12 months
Must cover retest or shelf life period at a minimum and includes storage, shipment and subsequent use.
Refrigeration: Accelerated
25°C ± 2°C/60% RH ± 5% RH
6 months
Must cover retest or shelf life period at a minimum and includes storage, shipment and subsequent use.
Freezer: Long-term
-20°C± 5°C 12 months
Must cover retest or shelf life period at a minimum and includes storage, shipment and subsequent use.
Stability Issues in Pharmaceutical Products – Manufacturing Issues
The preceding review of literature regarding salient mathematical calculations for and
impacts of temperature extremes on pharmaceutical products above provides a foundation for
discussion the literature on stability studies in manufacturing. At the international level, the ICH
initially provided technical requirements for the registration of pharmaceuticals for human use
across Japan, Europe, and North America. The ICH is currently focusing its attention on the
harmonization of the organization of a submission across the three regions. In the United States,
The FDA is coordinating its activities for common technical documentation (the “CTD” process)

Temperature Mapping Study of United States Distribution Systems
17
with ICH specifications, as is illustrated by the FDA's publication “International Conference on
Harmonization (ICH) - Guidance for Industry - M4E: The CTD – Efficacy.” In addition to its
M4E specifications for efficacy, the ICH provides M4Q and M4S specifications for,
respectively, quality and safety.
By providing a set of common terminology and measurements for pharmaceutical
product efficacy, this coordinated international and national-level work establishes a basis for
providing an objective, quantification-based method for stability studies. This level of
commonality is vital for establishing and maintaining effective and affordable regulatory, testing,
and production processes. For example, while manufacturing methods and products will
obviously differ from one company to another, the process for testing stability may be
documented as in USP <1150>, Pharmaceutical Stability, which specifies that the formulator of a
product typically first determines the effects of temperature, light, air, pH, moisture, trace metals,
and commonly used excipients or solvents on the active ingredient(s). From this information, one
or more formulations of each dosage form are prepared, packaged in suitable containers, and
stored under a variety of environmental conditions, both exaggerated and normal. At appropriate
time intervals, samples of the product are assayed for potency by use of a stability-indicating
method, observed for physical changes, and, where applicable, tested for sterility and or for
resistance to microbial growth and for toxicity and bioavailability. Such a study, in combination
with clinical and toxicological results, enables the manufacturer to select the optimum
formulation and container and to assign recommended storage conditions and an expiration date
for each dosage form in its package.
These guidelines provide a basis for the provision of common services across the
pharmaceutical industry, thereby facilitating third-party provision of testing services, including
stability studies. For example, in a 2005 white paper “Pharmaceutical Stability Studies,” Dr.
Kim Baughman, the Director of Development at Microbac Inc., attributes the ability of Microbac
to provide pharmaceutical industry-wide preclinical and clinical testing services to the
standardization being imposed by ICH guidelines product efficacy, quality, and safety through
stability achieved by optimal packaging and storage conditions.
Apart from temperature-related manufacturing protocols for the testing of finished
product stability, temperature control is a vital part of the manufacturing process itself. As an
Temperature Mapping Study of United States Distribution Systems
18
example, Del Cielo (1993) points out in his chapter on biopharmaceutical manufacturing facility
design chapter in Pharmaceutical Dosage Forms: Parenteral Medications, key processes in the
production of biopharmaceuticals require chromatography to take place at 4 degrees centigrade,
and if columns cannot be jacketed, the process must occur in a cold room with an appropriate
single source of heat transfer between heating and cooling within the same piece of equipment.
Temperature controls require sensors to verify that operational controls are functioning properly.
Typically, sensors are attached to alarm systems so that the operations staff can be alerted to
non-compliant conditions, including variations from accepted temperature conditions in the
manufacturing environment. As Hinckley (2009) points out, for alarm systems to be effective,
several conditions must hold. Among these conditions are operators that must not be “subject to
so many alarms that they cannot prioritize actions,” operators must not “know or believe that the
sensors generating the alarms are faulty,” and must not be “rewarded for ignoring the alarm.”
This brings forth the important point that compliance is not simply a question of quantification
and measurement, but that there is a human component as well which is of particular importance
not only in the manufacture, but also in the transport of pharmaceutical products.
Stability Issues in Pharmaceutical Products – Logistics Issues
In view of the cost, compliance, and public relations issues that pharmaceutical
companies face regarding product stability, and in view of the role temperature extremes and
variations can play relative to product stability, it is easily seen that determining the temperature
parameters applying to the (uncontrolled) ambient shipping environment is a critical undertaking
for the pharmaceutical industry. One of the key parameters for any such study is defining the
expected time product will spend within the distribution environment. In the case of Merck, a
key logistics strategy employed to control time within the supply chain outside the company’s
control is to employ a three-distribution center strategy. This strategy generally limits the transit
time for Merck’s shipments of products from its distribution centers to its customers’ warehouses
to 48 to 96 hours, but with need to account for exceptions beyond 96 hours.
Cost is a major consideration in logistics. Reporting on The Council of Supply Chain
Management Professionals’ annual report, Schultz states that in 2007, “American businesses
spent a record $1.4 trillion on logistics… That was equal to 10.1% of the nation’s Gross
Domestic Product.” Breaking logistics costs into transportation and carrying cost components,
Temperature Mapping Study of United States Distribution Systems
19
Schultz further notes that while transportation costs represent 56% of total logistics expenditures;
their current annual rate of increase is a relatively modest 5.9% when compared with the 9% rate
for inventory carrying costs. Schultz (2007) attributes the low rate of increase in shipping costs
to overcapacity among shippers, and states that the large number of bankruptcies among carriers
(“2000 trucking companies have closed in the first quarter alone”), the current overcapacity
among shippers, which currently limits shipping cost increases, can be expected to disappear.
The pharmaceutical industry finds itself in an environment in which logistics costs,
especially shipping, are a significant and growing concern. And it is expected that the
geographic range, technical and regulatory complexity, and cost implications of pharmaceutical
product distribution will continue to increase. For example, a variety of public relations, cost
pressure, and government agency scrutiny factors are causing pharmaceutical companies to
reduce sales force size and, as a direct consequence direct visits to physicians’ offices,
particularly in remote areas. Regarding sales force reduction at pharmaceutical companies,
Quinn (2008) notes that even without direct sales force contact distribution of samples directly to
physicians remains a desirable function for the pharmaceutical industry, physicians, and patients.
For pharmaceutical companies, it provides education and advertising. For physicians it provides
a convenient program for commencing patient therapy rapidly with direct instruction to the
patient on dosage and administration. And for patients it provides reduced cost and familiarity
with the product and its proper usage.
Among the factors at play in increasing logistics costs is the growing need for
refrigerated transport of pharmaceutical products. As new products with new functions are
developed, many, especially biopharmaceuticals, tend to have increasingly large molecular
structures which render them increasingly sensitive to temperature-induced instability.
A 2005 Novumed study found that approximately 11% of all products from large
pharmaceutical companies require refrigeration. With costs a major concern, avoiding need for
refrigeration and other special handling is desirable, whenever possible. As Catalano Ruriani
(2003) notes, when shipping temperature-sensitive products that require refrigeration it is
necessary to plan not only for the end-to-end, across the supply chain cost for refrigeration, but
also for the per-truck space reduction capacity that results from extra truck-wall insulation and
the payload reduction resulting from the weight of the refrigeration equipment and insulation.
Temperature Mapping Study of United States Distribution Systems
20
Since products requiring refrigerated shipment incur significantly higher logistics costs, it
is important for pharmaceutical companies to understand the temperature ranges in their
distribution environments so that products can be packaged and shipped safely without
refrigeration, if possible. Examination of the literature shows that looking to the future it is
possible that technology breakthroughs may help limit the need for cold chain transport.
In response to the burdensome costs involved in cold chain shipping, proposals for use of
industrial protein production techniques within the pharmaceutical industry are starting to
appear. As an example, Estell (2006) advocates the use of industrial biotechnology techniques
for mass production of highly stable proteins as a means of producing a pandemic flu vaccine.
Estell writes:
An important aspect of industrial protein manufacturing is the development of the production process before the creation of the final product molecule. This is essentially the opposite of the classical pharmaceutical approach in which the product is created, and the manufacturing process is then developed from the research chemistry bench. In industrial protein manufacturing, an initial robust process is developed for a scaffold protein that has many of the desired properties; then a few changes are made in this protein to create the final molecule. The production and purification processes developed for the scaffold protein can then be modified for the final molecule. Industrial protein manufacturing can supply a protein-based product at yields, volumes, and cost levels not possible with the classical pharmaceutical approach.
Estell then describes temperature stability as a key facet of any such protein synthesis:
Formulation and delivery systems must allow flexibility and end-product stability. Protein-based end products that are transported and stored around the world must be able to withstand the high temperatures and humidity of tropical locations without losing potency, strength, or efficacy, and must remain stable for years with no refrigeration. Finally, the protein scaffold must be engineered to provide the desired properties. In the case of the influenza vaccine, epitopes for the new strain are added to the protein scaffold, which is then introduced to the protein production pathway.
In addition to the scaffold-method for production of proteins, Estell advocates separation
of product components to increase stability. The upshot of the combination of scaffolding and
compartmentalization, according to Estell, would be a pharmaceutical product that can withstand
the temperature ranges experienced in non-temperature-controlled shipping. Estell describes this
as follows:

Temperature Mapping Study of United States Distribution Systems
21
Temperatures during shipment can be anywhere from below freezing to higher than 40 degrees C, but the performance and stability of the active ingredients remain efficacious for the life of the product, including during shipment and storage, in either solid or liquid form. These protein formulations do not require refrigeration or freezing. Unique properties of solid, multilayer, granular formulations can control the release of active ingredients and delay degradation by humidity, temperature, and other environmental influences. Compartmentalizing the active ingredient against other components of the product may also help maintain its effectiveness and control the release of active ingredients. An example everyone knows is the “tiny little time pills” in Contac cold formulations.
Estell's work points the way to a potential future environment in which ambient
temperatures and protective packaging are of less concern than today. However, for now and the
foreseeable future, it will be necessary to perform ambient temperature studies to help ensure
cost-effective compliance and stability of pharmaceutical products.
Stability Issues in Pharmaceutical Products – Packaging Issues
USP <1079>, Good Storage and Shipping Practices, focuses on the relationship between
temperature variations in the distribution environment and packaging. USP <1079> states:
Operational and performance testing should be parts of a formal qualification protocol that may use controlled environments or actual field testing based on the projected transportation channel. These should reflect actual load configurations, conditions, and expected environmental extremes. Temperature and humidity monitors should be placed into the product or a representative thereof. Testing consists of consecutive replicate field transportation tests using typical loads, according to an established protocol.
After stating the importance of field transportation temperature testing, USP <1079>
continues by reemphasizing the importance of temperature, and then relating temperature
concerns to protective packaging requirements:
Shipping of temperature-sensitive articles requiring thermally controlled packaging presents a special challenge. Unlike shock, vibration, and other physical hazards, thermal hazards tend to be unique to a given system. Except for temperature-controlled trucks, the distribution environment is widely variable and depends upon a range of factors, including points of origin and destination, article and container sensitivities to cold, accidental freezing or heat, transit mode (e.g., air, truck, combination), time, weather or season, and carrier type (e.g., small package carrier or integrator, freight forwarder, U.S. Postal Service). The shippers should know and understand the systems they use and should design the protective package accordingly.
Temperature Mapping Study of United States Distribution Systems
22
Much of the latest literature on package design focuses on cold chain package design.
For example in “Cold Chain Logistics Challenges and Trends in a Complex Market,” Peter
(2004) focuses on the requirements, costs, and need for advanced passive and active packaging
technologies. Peter's article focuses on how ambient temperature testing remains vital for (1)
defining the parameters for valid laboratory testing of the packaging in temperature extremes of
the normal shipping environment, and (2) providing audit support for proving that adequate
testing has been performed, thereby providing the cost and ecological benefits of validating least
ecological impact, least cost packaging solutions.
Regarding least impact, least cost packaging solutions, it should be pointed out that
summer and winter pack outs are being designed and employed in order to address specific
seasonal needs. McLean (2008) describes these seasonal pack outs together with all-season pack
outs with the clear message that the effort “to maintain temperature range regardless of ambient
temperature” can be fine-tuned for the purpose of minimizing cost and impact.
McLean describes the process required for such fine as consisting of the following steps: Process to Qualify Protective Packaging
1) Identification of Requirements 1a) Identify product, stability data, mode of transportation, and temperature sensitivity 2) Design Qualification
2a) Define ambient temperature profile 2b) Define product shipping configuration 2c) Determine temperature monitoring device location 2d) Determine insulating material. Especially noteworthy for the purposes of this discussion is the key role (step 2a) that ambient
temperature testing plays in effective, efficient, least impact package design.
A developing trend for cost sharing and carbon footprint reduction outside the
pharmaceutical industry that bears watching is occurring in the United Kingdom (with
participants including Coca Cola and Heinz) and in continental Europe (with participants
including Nestle, Carrefour, Wal-Mart, Kraft Foods, and Procter and Gamble) in which the
companies are sharing warehouses and trucks. According to the International Institute of
Refrigeration Newsletter (2008):
Each warehouse and truck is being used by several competitors, and it is hoped this could potentially save up to 25% emissions per pallet. Participating suppliers would relinquish their own warehouses and deliver directly from the manufacturing facility into a
Temperature Mapping Study of United States Distribution Systems
23
collaborative warehouse that is run jointly with other suppliers. From there the goods would be shipped either to city hubs that supply urban stores or regional centres that deliver to rural zones.
Regulatory Compliance Considerations - Product Development and Testing
Within the context of logistics, the reason for concern with time and temperature is their
potentially adverse impact on product efficacy. Temperature extremes, especially over time,
affect the stability of many products. Decreases in product stability have a negative impact on
efficacy, which is the key consideration behind the regulations with which pharmaceutical
companies must comply. As was discussed in detail above in the review of USP <1191>, the
efficacy and appearance of pharmaceutical products can be impaired by improper temperature
extremes, including those experienced during shipping. It is therefore critical that
pharmaceutical companies study the impact of temperature variations on products and apply the
knowledge gained when designing packaging and planning product transportation.
The literature on logistics tends to focus on issues of costs and compliance. Regarding
costs Barakat (2003) lists the specific aspects of logistics that affect costs as: “packaging
materials, carrier costs, handling costs, and value of rejected shipments (expired or damaged).”
After covering customer satisfaction issues in logistics (notably, replenishment time) Barakat
turns his attention to compliance issues in logistics. Regarding compliance, Barakat notes that
the FDA requires integrity up to the time when the product is received by customer, which
means that quality assurance must be built into packaging and transit. He says, “Testing and
validation are minimum steps required to demonstrate that the temperature of the products
shipped will remain within the acceptable temperature range in the real world.” For this purpose
he recommends the use of data loggers to “quantify the transit times and risks relatively
inexpensively in the real world within a testing laboratory environment.”
In Temperature Management of Pharmaceutical Distribution: Update 2008 Beard
discusses logistics costs relative to industry-wide competitive pressures, and then discusses
compliance in terms of being able to document and prove compliance. Specifically, when
discussing costs, Beard first focuses on the competitive environment and pressures of research,
development, and trial costs across the pharmaceutical industry. After mentioning the additional
pressures introduced by increasing competition from manufacturers of generics, Beard turns his
attention to regulatory compliance. In this regard, he focuses on the requirement for and
Temperature Mapping Study of United States Distribution Systems
24
processes for establishing proof of compliance. Beard discusses the steps for proof of
compliance as follows:
...proof of temperature (POT) from point of origin to point of delivery is required for all pickup and delivery vehicles, line-haul trailers and temperature-managed facilities, as well as the transfer of products between each....A manufacturer’s first step in complying with this mandate is to develop categories based upon stability data for all their products. Each category describes modes of transport, approved carriers, temperature limits and allowable excursions. At what temperature is the product stable and when does temperature begin to alter its efficacy over time? Precise lengths of time out of range, plus the severity of temperature excursions themselves, must be established and documented both for in-house production and storage and for out-of facility shipping and distribution.
Beard then covers the temperature mapping aspect of proving compliance:
For the temperature to remain within precise limits, sensors must be set in both vehicles and warehouse storage rooms. Temperature mapping to show variations throughout each room and trailer should be performed during annual extreme climate fluctuations and when the spaces are full and empty of content. These results will point to the best placement for calibrated monitoring devices and to the manner in which shipments should be stacked to maximize airflow. Temperature mapping and all other temperature management procedures, systems and technologies must be qualified by an experienced quality-assurance and control department, whether in-house or outsourced, that is thoroughly trained in validation activities.
Beard covers the topics of regulatory agencies and compliance as follows:
Regulatory Agencies
In North America, USP <1079?, “Good Storage and Shipping Practices,” and Health
Canada’s “Guidelines for Temperature Control of Drug Products During transportation
and Storage” each lay out regulatory expectations and good distribution practices for
temperature sensitive deliveries. The Canadian document is expected to be revised later
this year.
Compliance
What’s important in the future is to promote a culture of industry collaboration and to
champion the value of information-sharing across all stakeholders. Regulatory bodies in
the U.S. and Canada may differ somewhat in their handling of new requirements, but in
Temperature Mapping Study of United States Distribution Systems
25
both countries and around the world the safety and quality protection of pharmaceuticals
and other health-care products in transit can no longer be left in doubt.
Temperature Mapping Study – Best Practices
Temperature mapping studies are required for product and packaging development and
for compliance. Sensitech (2006), a major supplier of data loggers, writes:
To determine appropriate packaging specifications for a specific product, it is first critical to have an accurate ambient temperature profile for the specific trade lane in question. The only way to develop a temperature profile is to conduct a Shipping Study because there are many factors that contribute to determining the thermal variability of a specific trade lane, including carriers, delivery times, service levels, and routes.
Best practices for temperature mapping start with the equipment that will be employed in
performing the study. When considering temperature sensing equipment, Sensitech (2006)
recommends use of data loggers, and advises against use of chemical-strip color change
temperature indicators in their article entitled “Reconsidering Temperature Indicators.”
USP <1118> Monitoring Devices, Time, Temperature, and Humidity provides specific
recommendations covering device selection and recording intervals. Regarding device selection,
USP <1118> states:
An inexpensive limit detector may be all that is needed when there is a low probability that excessive temperatures will be experienced. Alternatively, a data logger may be preferred when it would be useful to demonstrate that exposure to the highest temperatures was very brief.
USP <1118> continues by noting that ambient temperatures as recorded in climatic databases are
not necessarily indicative of the temperatures experienced within mailboxes, trucks, or shipping
containers at those times. For this reason USP <1118> suggests the use of microelectronic
devices, such as data loggers, to record time, temperature, and humidity whether at a fixed
location such as a warehouse, or to travel with a product during shipment.
When discussing the use of electronic recording devices, USP <1118> is careful to point
out the importance of validation, as follows:
Validation is a process that assures the user of the monitoring device that the device has been tested prior to use either by the manufacturer or the user, to assess the measurement accuracy, measurement responsiveness, and time accuracy, where appropriate. Monitors used in manufacturing, storage, and transport of drugs should be properly qualified by

Temperature Mapping Study of United States Distribution Systems
26
their users to ensure that the monitors have been received and maintained in proper working order. Pharmacies and consumers may accept the validation performed by the manufacturer of the device.
Regarding measurement accuracy, USP <1118> states that device calibration should be
performed to ensure validity of reported results:
For temperature and humidity monitoring devices, measurement accuracy refers to the closeness of the value obtained with a particular device to the true value being measured. In practice, this is determined by comparison with a device that has been calibrated against a standard that is obtained from or traceable to the National Institute of Standards and Technology (NIST).
Another validation factor covered by USP <1118> is measurement responsiveness. USP <1118>
provides guidelines for frequency of measurement taking and recording appropriate to the
likelihood of capturing occurrence of significant changes as follows:
Any monitor takes time to respond to a change in the temperature or humidity. The more rapid the response, the clearer the picture of the environmental history of a monitored product will be. Measurement responsiveness may be defined as the time, t½, required for a device to read a value of (x + y)/2 after an instantaneous change in the property being measured from x to y. Measurement responsiveness is typically defined for the operating range of a device. Different levels of responsiveness are needed for different monitoring applications. For devices used to monitor storage locations, where the temperature and humidity are unlikely to change rapidly, a t½ 15 minutes may be appropriate. For devices used to monitor transport, where more rapid changes are possible, a t½ 5 minutes may be needed.
Time accuracy is also a validation factor covered by USP <1118>. USP <1118> states: “Most
commonly, time accuracy is expressed as a ± percentage of total duration of the recording
period. For pharmaceutical applications a ±0.5% time accuracy is adequate.”
Since there are alternatives to temperature mapping studies, it is worthwhile to evaluate
the plusses and minuses of the different methods. In his discussion of the process for qualifying
a new package, Crawford (2003) refers the selection of the alternative to be selected and using
“just right” testing. Crawford provides three assessment options; expert knowledge/rigorous
logic, actual shipment and stress simulation in the laboratory. Crawford argues that expert
knowledge/rigorous logic has the advantage of allowing us to focus our testing to a specific
distribution stress, or even to decide that some aspect of stress is not applicable to the case at

Temperature Mapping Study of United States Distribution Systems
27
hand. Applying this to a temperature mapping study, knowledge and logic might allow us to
limit a shipping study to Phoenix, Arizona in August, and Minneapolis, Minnesota in January,
while skipping a temperate location such as Atlanta, Georgia altogether.
Crawford says that while the second alternative, actual (or test) shipment “expose[s] test
packages to a slice of the actual distribution environment... unfortunately it is only a small slice
of the whole distribution reality because there can be large variation in distribution stress from
shipment to shipment.” Crawford continues by explaining that for such testing, the testing should
be instrumented, but that “even with multiple test shipments, the full extent of distribution stress
may not be experienced by the test packages due to the large variation (shipment to shipment) of
distribution stress.” As a result, Crawford appears to prefer laboratory simulation of distribution
stress. Crawford cites the following advantages of laboratory testing:
1. Simulated distribution stress is controlled – it is a known, definable stress input.
a. Package performance is assessed in response to the known stress input.
b. The type and intensity of the simulated distribution stress can be (and should be)
created to replicate, as best as possible, actual distribution environment stress.
2. Simulated distribution stress is repeatable – assuming adequate test equipment and
techniques.
a. Performance of a proposed package can be compared to an existing package.
3. Laboratory testing can be completed more quickly than test shipments.
a. Package performance assessment can be completed in hours rather than days.
b. Packages can be modified in response to initial test results and quickly retested.
c. Lab tests can be quickly adjusted/refocused based on preliminary results.
4. Sometimes fewer test samples can be used than with test shipments (can still get good
results).
In evaluating Crawford's reasoning, it must be realized that temperature excursion testing
must be performed in order to be able to verify that the parameters chosen for laboratory testing
match those that will be experienced in the distribution environment. Thus we might try to apply
Crawford's reasoning as follows:
Temperature Mapping Study of United States Distribution Systems
28
1. Use knowledge and logic to limit test excursion sites (for example, test Phoenix, Arizona
in mid-summer, test Minneapolis, Minnesota in mid-winter to determine temperature
extremes for testing).
2. Test using temperature logging equipment to ensure that all aspects of temperature
variation are captured.
3. Use the resulting data to set temperature parameter values for accelerated laboratory
testing.
While this reasoning might be applicable for certain purposes, such as shock and
vibration testing, it would not be appropriate for passing an FDA audit. This is because
temperature excursion testing that covers the entire distribution geography provides benefits of
unanticipated anomaly detection and correction, mutual data confirmation, and average value
discovery that are required for proving compliance and assuring proper setting of test parameters.
But it is exactly Crawford's point that a reasoned combination of experience, real world
observation, and laboratory testing is required for “just right” testing, so that what applies to
shock and vibration stress test formulation may not apply to temperature test formulation, and
Crawford would almost certainly agree that best practices for establishing and using temperature
profiles should include a full test of the entire shipping environment, at least during the mid-
summer and mid-winter seasons.

Temperature Mapping Study of United States Distribution Systems
29
Chapter 3: Methodology
Materials/Equipment Used:
o TempTale4 data loggers o Ventilated boxes o Shipping Manifest o Secure web enabled data warehousing software
The data loggers selected for the test were TempTale4 single use electronic time-stamped
temperature recording devices (Figure 1) manufactured by Sensitech Inc. TempTale4s have the
outside dimensions of 3.6" L x 2.0" W x 0.67" and weigh approximately 1.6 ounces. The
measurement range of the data logger is from -30ºC to +70ºC. The accuracy of the data logger is
±1.1ºC ºfrom -30ºC to -18ºC, ±0.55ºC from -18ºC to +50ºC and ±1.1ºC from +50ºC to +70ºC.
The data loggers were configured to take a temperature measurement every ten minutes. The
memory type is Non-volatile 16K EEPROM with a storage capacity of 16,000 data points. The
data logger has the battery life 1 year run life, 3.0v Lithium Battery.
Figure 1 – TempTale4 Figure 2 – Ventilated Box
The TempTale4s (Figure 1) were activated and placed in ventilated boxes (Figure 2). The boxes
were mailed out from the company’s three United States DCs to specific destinations across the
United States. Figure 3 is a map showing the locations of the DCs and destinations to which the
Temperature Mapping Study of United States Distribution Systems
30
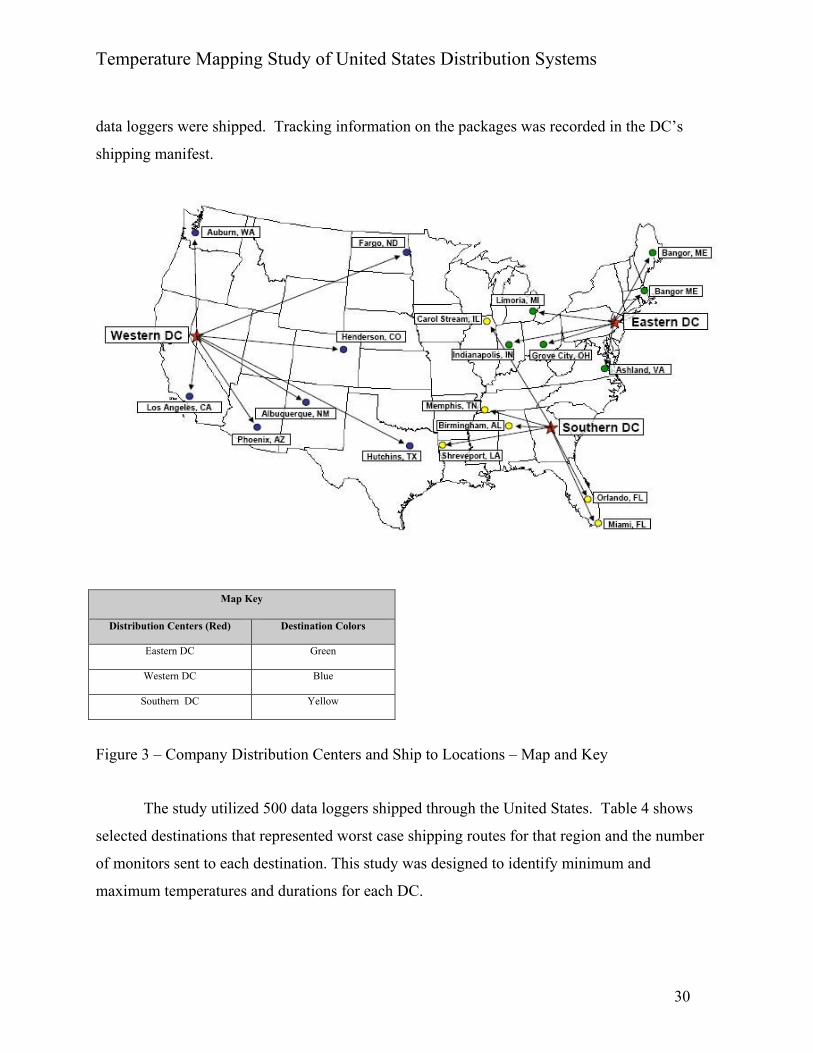
data loggers were shipped. Tracking information on the packages was recorded in the DC’s
shipping manifest.
Map Key
Distribution Centers (Red) Destination Colors
Eastern DC Green
Western DC Blue
Southern DC Yellow
Figure 3 – Company Distribution Centers and Ship to Locations – Map and Key
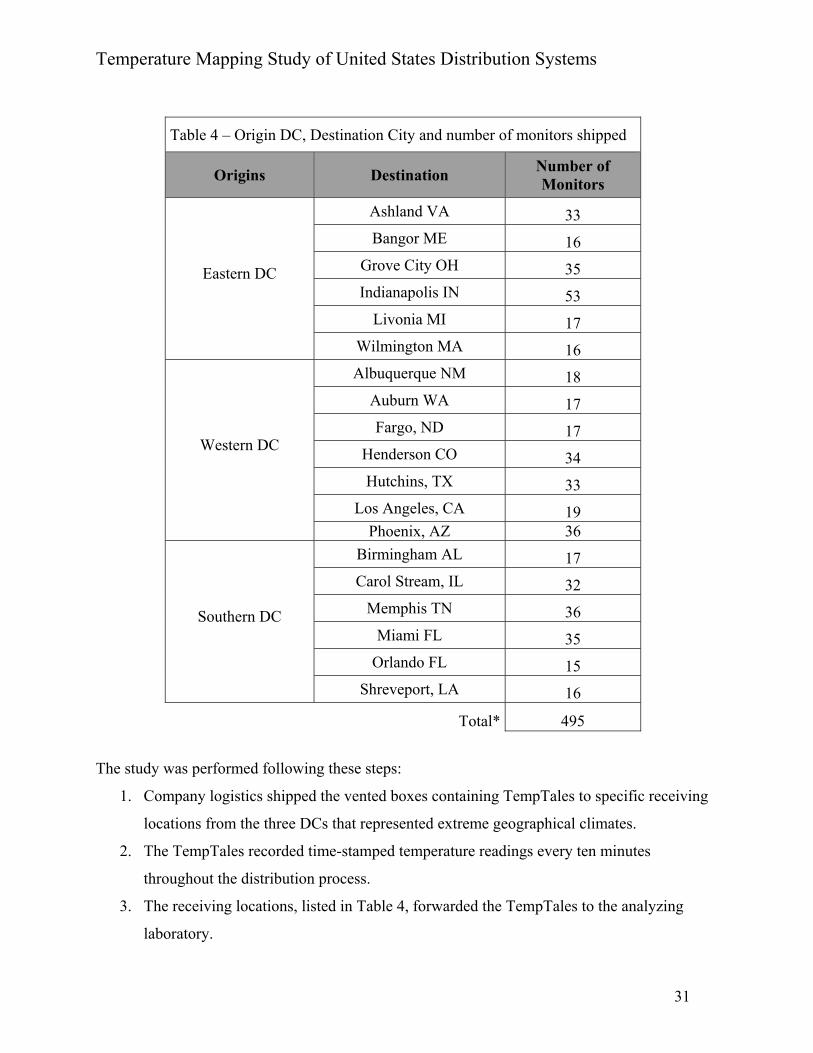
The study utilized 500 data loggers shipped through the United States. Table 4 shows
selected destinations that represented worst case shipping routes for that region and the number
of monitors sent to each destination. This study was designed to identify minimum and
maximum temperatures and durations for each DC.
Temperature Mapping Study of United States Distribution Systems
31
Table 4 – Origin DC, Destination City and number of monitors shipped
Origins Destination Number of Monitors
Eastern DC
Ashland VA 33
Bangor ME 16
Grove City OH 35
Indianapolis IN 53
Livonia MI 17
Wilmington MA 16
Western DC
Albuquerque NM 18
Auburn WA 17
Fargo, ND 17
Henderson CO 34
Hutchins, TX 33
Los Angeles, CA 19 Phoenix, AZ 36
Southern DC
Birmingham AL 17
Carol Stream, IL 32
Memphis TN 36
Miami FL 35
Orlando FL 15
Shreveport, LA 16
Total* 495
The study was performed following these steps:
1. Company logistics shipped the vented boxes containing TempTales to specific receiving
locations from the three DCs that represented extreme geographical climates.
2. The TempTales recorded time-stamped temperature readings every ten minutes
throughout the distribution process.
3. The receiving locations, listed in Table 4, forwarded the TempTales to the analyzing
laboratory.
Temperature Mapping Study of United States Distribution Systems
32
4. The analyzing laboratory downloaded the temperature data into its secure web enabled
data warehousing software.
5. Time stamped temperature data from the secure web enabled data warehousing software
was analyzed for the following attributes:
a. Actual minimum and maximum temperature.
b. Mean temperatures by DC.
c. Number of monitors over 40°C and under 0°C and associated durations.
d. Statistical minimum and maximum temperatures.
e. Statically derived temperature boundaries with confidence levels by season.

Temperature Mapping Study of United States Distribution Systems
33
CHAPTER 4: RESULTS, ANALYSIS, AND DISCUSSION
Of the 500 Monitors shipped from the three DCs to nineteen locations across the continental
United States, 495 monitors were successfully returned to the analyzing laboratory. This equates
to 99% of the monitors successfully shipped, received and read. Table 5 contains a breakdown
of the number of monitors shipped from each DC and lost in transit.
Table 5 – Numbers of Monitors Shipped By Location
Location Number of Monitors
Eastern DC 170
Western DC 174
Southern DC 151
NOTE: 5 monitors were lost in transit.
Actual Minimum and Maximum Temperature Extremes, Durations at Extremes and
Calculated Mean
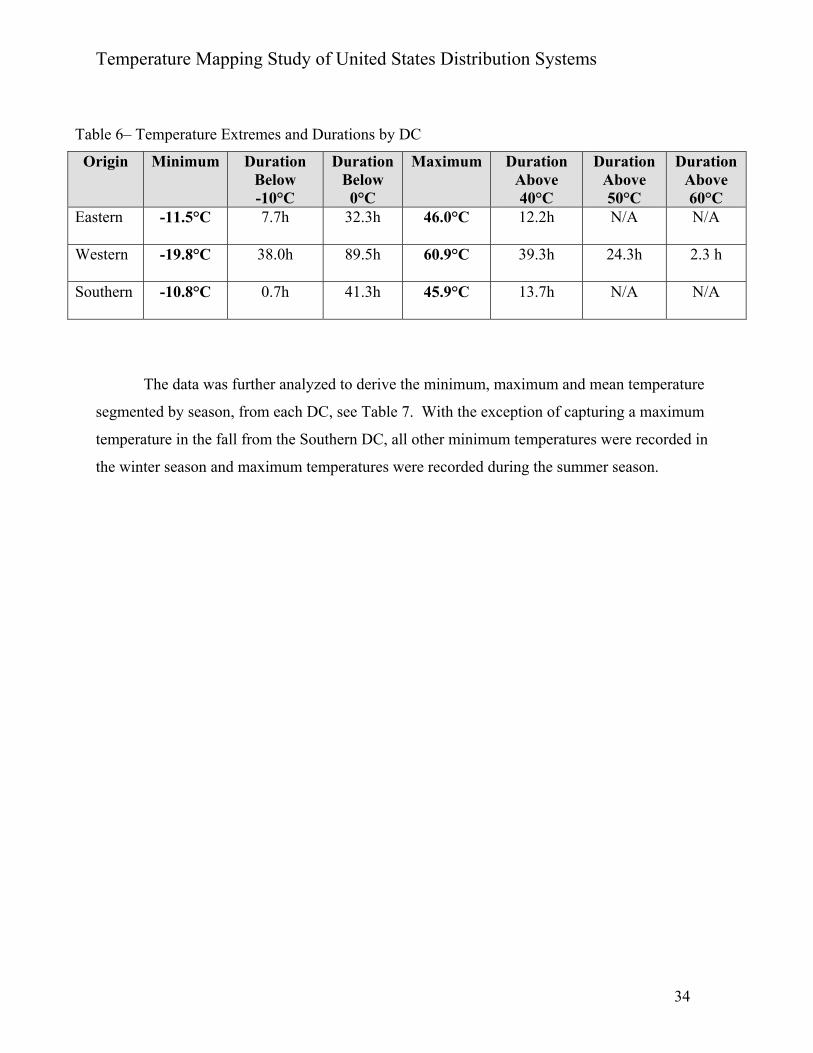
The maximum temperature seen in the US single parcel commercial ground distribution
environment was 60.9°C for 2.3 hours, captured in Reno, NV during the summer season. The
lowest temperature seen in the distribution environment was -19.8 °C for 38 hours, also captured
in Reno, NV during the winter. Table 6 shows the minimum and maximum temperature
extremes experienced within all three DC’s shipping lanes.
Temperature Mapping Study of United States Distribution Systems
34
Table 6– Temperature Extremes and Durations by DC
Origin Minimum Duration Below -10°C
Duration Below 0°C
Maximum Duration Above 40°C
Duration Above 50°C
Duration Above 60°C
Eastern -11.5°C 7.7h 32.3h 46.0°C 12.2h N/A N/A
Western -19.8°C 38.0h 89.5h 60.9°C 39.3h 24.3h 2.3 h
Southern -10.8°C 0.7h 41.3h 45.9°C 13.7h N/A N/A
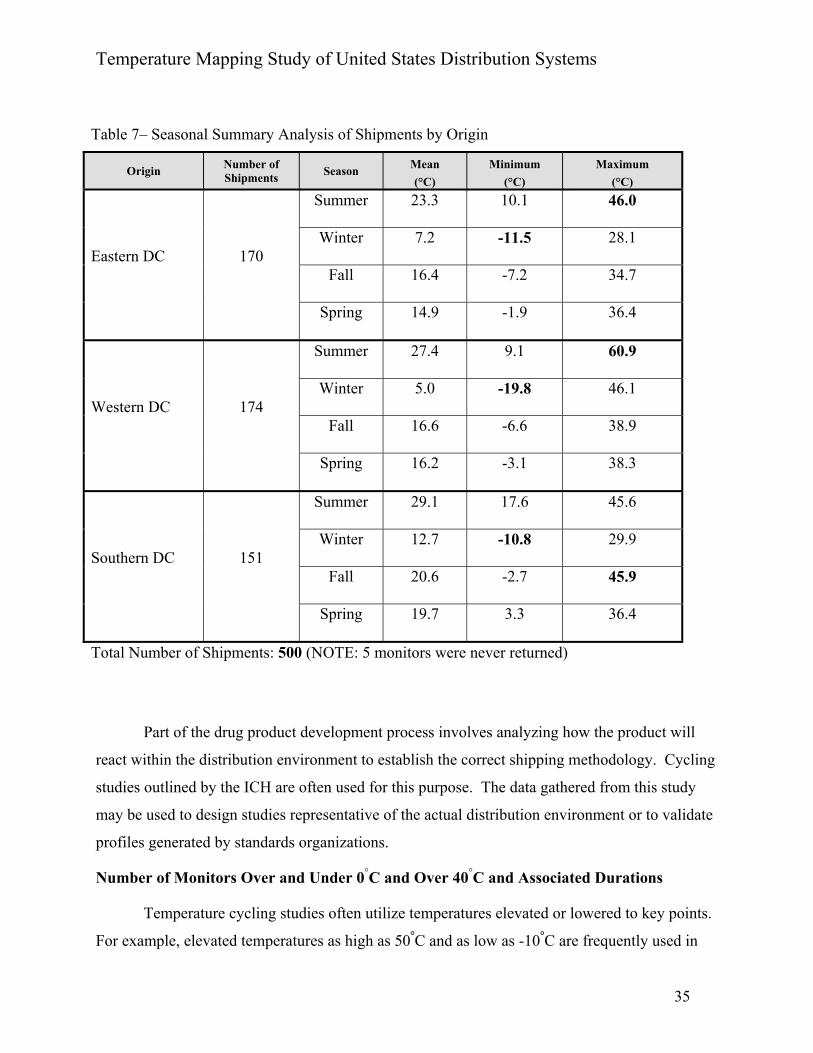
The data was further analyzed to derive the minimum, maximum and mean temperature
segmented by season, from each DC, see Table 7. With the exception of capturing a maximum
temperature in the fall from the Southern DC, all other minimum temperatures were recorded in
the winter season and maximum temperatures were recorded during the summer season.
Temperature Mapping Study of United States Distribution Systems
35
Table 7– Seasonal Summary Analysis of Shipments by Origin
Origin Number of Shipments Season Mean
(°C)
Minimum
(°C)
Maximum
(°C)
Eastern DC 170
Summer 23.3 10.1 46.0
Winter 7.2 -11.5 28.1
Fall 16.4 -7.2 34.7
Spring 14.9 -1.9 36.4
Western DC 174
Summer 27.4 9.1 60.9
Winter 5.0 -19.8 46.1
Fall 16.6 -6.6 38.9
Spring 16.2 -3.1 38.3
Southern DC 151
Summer 29.1 17.6 45.6
Winter 12.7 -10.8 29.9
Fall 20.6 -2.7 45.9
Spring 19.7 3.3 36.4
Total Number of Shipments: 500 (NOTE: 5 monitors were never returned)
Part of the drug product development process involves analyzing how the product will
react within the distribution environment to establish the correct shipping methodology. Cycling
studies outlined by the ICH are often used for this purpose. The data gathered from this study
may be used to design studies representative of the actual distribution environment or to validate
profiles generated by standards organizations.
Number of Monitors Over and Under 0°C and Over 40°C and Associated Durations
Temperature cycling studies often utilize temperatures elevated or lowered to key points.
For example, elevated temperatures as high as 50°C and as low as -10°C are frequently used in

Temperature Mapping Study of United States Distribution Systems
36
product fragility temperature cycling studies. For this reason, the data has been analyzed to
show the frequency and duration at elevated and low temperatures.
Low temperature exposure:
• 49 shipments were exposed to temperatures below 0°C, with the time of exposure
ranging from 0.2 - 97.3 hours.
• 13 shipments were exposed to temperatures below -10°C (min temp -19.8°C), with
the time of exposure ranging from 0.2 - 38.0 hours.
• There were no shipments exposed to temperatures below -20°C.
Elevated temperature Exposure:
• 22 shipments were exposed to temperatures above 40°C, with the time of exposure
ranging from 0.2 - 39.3 hours.
• 3 shipments were exposed to temperatures above 50°C, with the time of exposure
ranging from 0.2 - 24.3 hours.
• 1 shipment was exposed to temperatures above 60°C (max temp of 60.9°C) for an
exposure length of 2.3 hours.
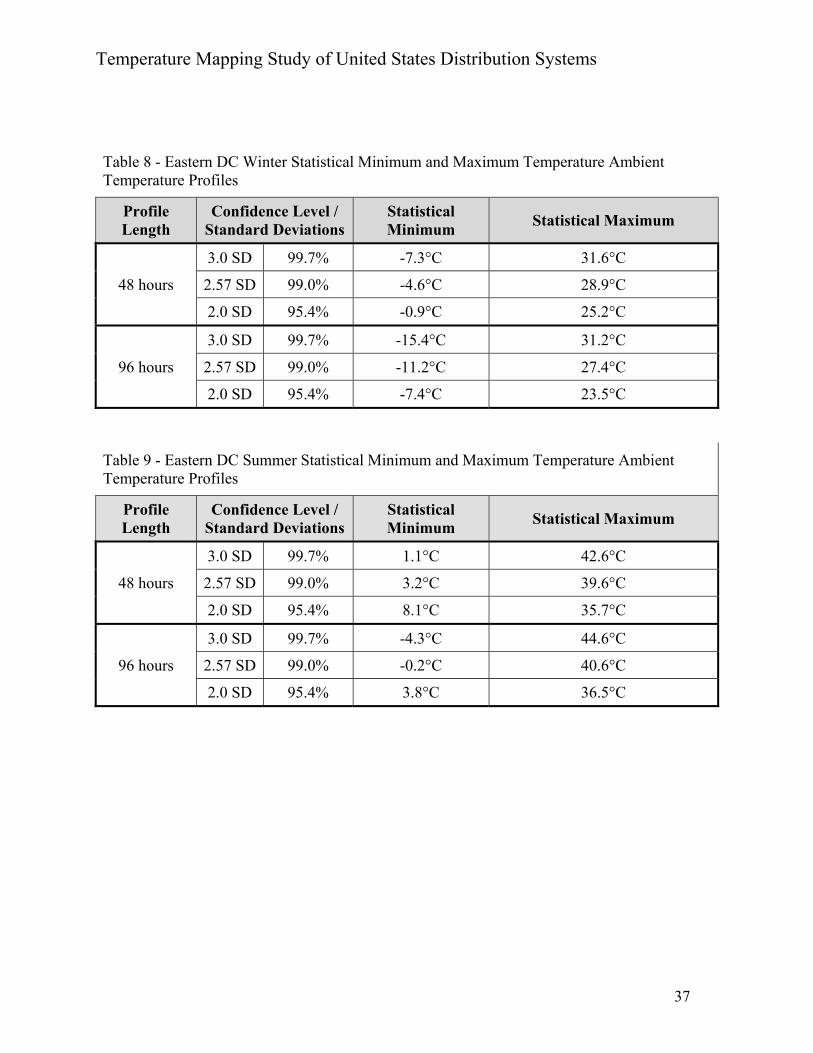
Statically Derived Minimum and Maximum Temperature Boundaries with Confidence
Levels by Season
Tables 6 through 11 contain statically derived minimum and maximum temperatures by
confidence level broken down by DC, season and trip length. This data is most valuable to
formulators performing product fragility studies who may use this data to compare product
sensitivities to the actual distribution environment. By providing the confidence levels, testing
may be designed with a better understanding of the probability of an extreme temperature being
realized in the actual distribution environment.
Temperature Mapping Study of United States Distribution Systems
37
Table 8 - Eastern DC Winter Statistical Minimum and Maximum Temperature Ambient Temperature Profiles
Profile Length
Confidence Level / Standard Deviations
Statistical Minimum
Statistical Maximum
48 hours
3.0 SD 99.7% -7.3°C 31.6°C
2.57 SD 99.0% -4.6°C 28.9°C
2.0 SD 95.4% -0.9°C 25.2°C
96 hours
3.0 SD 99.7% -15.4°C 31.2°C
2.57 SD 99.0% -11.2°C 27.4°C
2.0 SD 95.4% -7.4°C 23.5°C
Table 9 - Eastern DC Summer Statistical Minimum and Maximum Temperature Ambient Temperature Profiles
Profile Length
Confidence Level / Standard Deviations
Statistical Minimum
Statistical Maximum
48 hours
3.0 SD 99.7% 1.1°C 42.6°C
2.57 SD 99.0% 3.2°C 39.6°C
2.0 SD 95.4% 8.1°C 35.7°C
96 hours
3.0 SD 99.7% -4.3°C 44.6°C
2.57 SD 99.0% -0.2°C 40.6°C
2.0 SD 95.4% 3.8°C 36.5°C

Temperature Mapping Study of United States Distribution Systems
38
Table 10 – Western DC Winter Statistical Minimum and Maximum Temperature Ambient Temperature Profiles
Profile Length
Confidence Level / Standard Deviations
Statistical Minimum
Statistical Maximum
48 hours
3.0 SD 99.7% -13.5°C 39.1°C
2.57 SD 99.0% -9.4°C 34.7°C
2.0 SD 95.4% -4.7°C 30.4°C
96 hours
3.0 SD 99.7% -19.3°C 37.9°C
2.57 SD 99.0% -15.3°C 33.8°C
2.0 SD 95.4% -9.8°C 28.3°C
Table 11 Western DC Summer Statistical Minimum and Maximum Temperature Ambient Temperature Profiles
Profile Length
Confidence Level / Standard Deviations
Statistical Minimum
Statistical Maximum
48 hours
3.0 SD 99.7% 1.1°C 45.6°C
2.57 SD 99.0% 4.8°C 42.5°C
2.0 SD 95.4% 8.5°C 38.2°C
96 hours
3.0 SD 99.7% -4.1°C 48.7°C
2.57 SD 99.0% -0.3°C 44.9°C
2.0 SD 95.4% 4.7°C 39.9°C

Temperature Mapping Study of United States Distribution Systems
39
Table 12 Southern DC Winter Statistical Minimum and Maximum Temperature Ambient Temperature Profiles
Profile Length
Confidence Level / Standard Deviations
Statistical Minimum
Statistical Maximum
48 hours
3.0 SD 99.7% -4.5°C 38.1°C
2.57 SD 99.0% 1.4°C 35.1°C
2.0 SD 95.4% 2.6°C 31.0°C
96 hours
3.0 SD 99.7% -7.0°C 38.6°C
2.57 SD 99.0% -3.7°C 35.3°C
2.0 SD 95.4% 0.5°C 30.9°C
Table 13 Southern DC Summer Statistical Minimum and Maximum Temperature Ambient Temperature Profiles
Profile Length
Confidence Level / Standard Deviations
Statistical Minimum
Statistical Maximum
48 hours
3.0 SD 99.7% 9.0°C 45.5°C
2.57 SD 99.0% 11.6°C 42.9°C
2.0 SD 95.4% 15.1°C 39.5°C
96 hours
3.0 SD 99.7% 2.9°C 45.0°C
2.57 SD 99.0% 5.8°C 41.9°C
2.0 SD 95.4% 9.8°C 37.9°C

Temperature Mapping Study of United States Distribution Systems
40
CHAPTER 5: CONCLUSION
The objective of this study was to determine the extreme temperatures and respective
durations commercial pharmaceutical products are expected to be exposed to during routine,
single parcel, ambient distribution within the Continental United States. This study met the
intended objective by capturing extreme seasonal temperatures with durations within the United
States. The maximum temperature seen in the distribution environment was 60.9°C for 2.3
hours. The lowest temperature seen in the distribution environment was -19.8 °C for 38 hours.
The study utilized 500 data loggers that were shipped from the company's three United
States commercial distribution centers over the course of twelve months. Out of the 500
monitors shipped, 495 were recovered and read. Of the 495 shipments analyzed, one data logger
was exposed to temperatures above 60°C. Three data loggers were exposed to temperatures
above 50°C. Forty nine data loggers were exposed to temperatures below 0°C. Thirteen data
loggers were exposed to temperatures below -10°C. No shipments were exposed to temperatures
below - 20°C.
Before this study, the company relied solely on temperature profiles published by
standards organizations. This study provided company specific temperature mapping data. This
mapping data is now being used throughout the organization for study design, logistical decision
making and to verify profiles provided by standards organizations relevant to the United States.
Through the use of this company specific first hand data, assurance that appropriate testing is
being performed has been realized.
Recommendations for Future Research
This study was limited to the commercial distribution system within the United States.
As the company is a global entity, it is recommended that studies similar to this be performed in
international distribution lanes such as Europe, Asia and South America.

Temperature Mapping Study of United States Distribution Systems
41
REFERENCES
Ames, H. (2007, September). Reconsidering temperature indicators. Retrieved from
http://www.sensitech.com/PDFs/life_science/Reconsidering_Temp_Indicators.pdf
Barakat, M. (2003). Transit packaging and temperature-controlled packaging issues. Business
Briefing: Pharmagenerics, pp. 103-110. Retrieved from
http://www.sensitech.eu/pdfs/archives/transit_pack_issues.pdf
Beard, M. (2008). Temperature management of pharmaceutical distribution: Update 2008.
Logistics Quarterly, 14(3). Retrieved from http://www.logisticsquarterly.com/issues/14-
3/mike.html
Bishara, R. H., Lucas T. I., & Seevers, R. H. (2004, July). A stability program for the distribution
of drug products. Pharmaceutical Technology, 68-73. Retrieved from
http://www.scribd.com/doc/18794739/Article-PharmTechn-Stability-Program-Drug-
Distribution-July-2004
Baughman, K. (2005). Pharmaceutical stability studies. Microbac Laboratories, Inc. Retrieved
from http://www.microbac.com/technical_articles/news_detail.php?news_ID=10
Catalano Ruriani, D. (2003, October). Shipping temperature-sensitive products. Inbound
Logistics. Retrieved from
http://www.inboundlogistics.com/articles/10tips/10tips1003.shtml
Clinard, M. & Yeager, P. (2006). Corporate crime, xxiii. New Brunswick, NJ: Transaction
Publishers.
Coulomb, D. (2008, October). International Institute of Refrigeration Newsletter, 3-4. Retrieved
from https://www.iifiir.org/en/doc/nl/36.pdf

Temperature Mapping Study of United States Distribution Systems
42
Crawford, A.J. (2003). Case Study: New package qualifications? Use “just right” ISTA testing!
Dimensions, 3-4. Retrieved from http://www.ista.org/forms/Use_Just-
Right_ISTA_Testing-Crawford_2003.pdf).
Del Cielo, R. (1993). Pharmaceutical dosage forms: parenteral medication, volume 2. In K. Avis,
H. Lieberman, & L. Lachman (Eds.). Biopharmaceutical manufacturing facility design
(p. 317). New York: Marcel Dekker, Inc.
Estell, D. (2006, Fall). Adapting industry practices for the large-scale manufacture of
pharmaceutical products. National Academy of Engineering, 36(3). Retrieved from
http://www.nae.edu/Publications/TheBridge/Archives/V-36-
3EngineeringandVaccineProductionforanInfluenzaPandemic/AdaptingIndustryPracticesf
ortheRapidLarge-ScaleManufactureofPharmaceuticalProteins.aspx
Health Canada. (2005, November). Guidelines for temperature control of drug products during
transportation and storage. Guide, 0069.
Hinckley, M.C. (2009). Alarms: behind the red screen. Pharma Manufacturing. Retrieved from
http://www.pharmamanufacturing.com/articles/2009/119.html?page=1
McLean, D. (2008, January, 8). Cold chain shipping: protecting temperature-sensitive products.
Retrieved from
http://www.pda.org/MainMenuCategory/Chapters/Metro/Presentations/Cold-Chain-
Shipping--Protecting-Temperature-Sensitive-Products-Diane-McLean-102-MB.aspx
Novumed Life Science Consulting. (2007, June). Lack of in-transit temperature control may
influence drug effectiveness. Pharma Bio World, 64-65. Retrieved from
http://www.novumed.com/fileadmin/user_upload/PDF/2007-
06_Pharma_Bio_World_India-Pharma_Logistics.pdf

Temperature Mapping Study of United States Distribution Systems
43
O’Donnell, K. (2009, April 1). Comparing ambient temperature profiles: why no two are created
equal. Contract Pharma. Retrieved from
http://www.contractpharma.com/articles/2009/04/advanced-degrees
Peter, M. (2004, September). Cold chain logistics: challenges and trends in a complex market.
Business Briefing: Pharmagenerics, 84-91
Quinn, F.J. (2008, May 30). Spotlight on physician's sample management programs.
Pharmaceutical Commerce Journal. Retrieved from
http://www.pharmaceuticalcommerce.com/frontEnd/main.php?idSeccion=904
Sensitech Inc. (2006, March). Shipping Studies, 1. Retrieved from
http://www.sensitech.com/PDFs/services/Sensitech_SS_DS.pdf
Schultz, J. (2007). The Council of Supply Chain Management Professionals’ Annual Report.
United States Pharmacopeia <1150>. Pharmaceutical Stability.
United States Pharmacopeia <1191>. Stability Considerations in Dispensing Practice.
United States Pharmacopeia <1079>. Good Storage and Shipping Practices.
U.S. Food & Drug Administration, 21, C.F.R. Vol. 4, Sub-part D, Section 203.32, (April 1,
2007).

Temperature Mapping Study of United States Distribution Systems
44
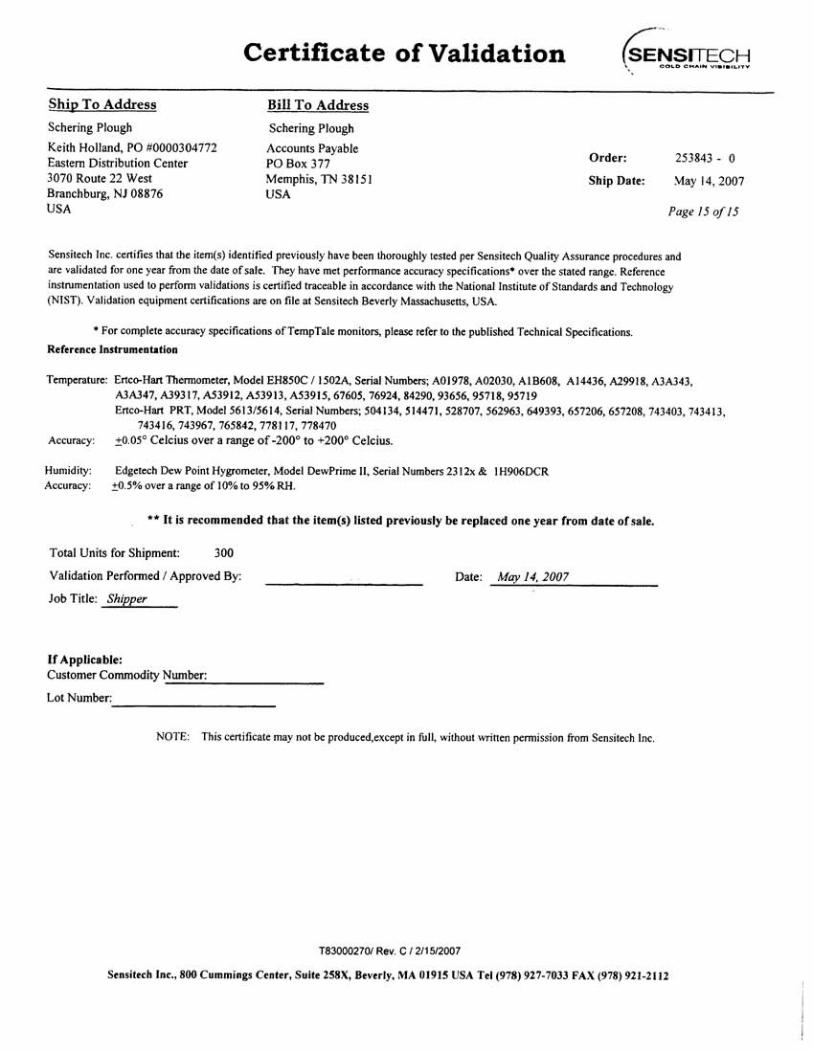
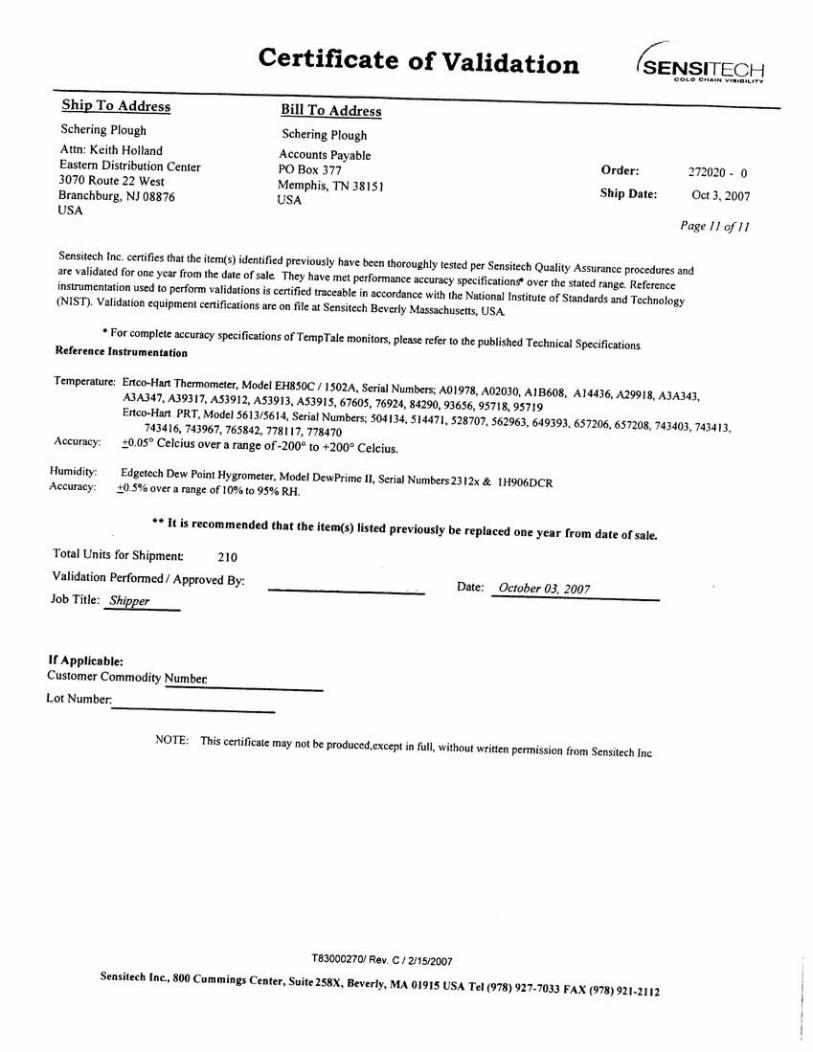
APPENDIX A
TempTale - Certificates of Validation