Embed Size (px)
Citation preview
1
PROPOSED IMPROVEMENTS TO THE TEMPERATURE MAPPING SYSTEM OF SINGLE-CELL SUPERCONDUCTING RADIO FREQUENCY
CAVITIES AT CORNELL UNIVERSITY
Ryan French, CLASSE, Cornell University, Ithaca, NY 14853, U.S.A.
Abstract Single-cell Superconducting Radio Frequency (SRF)
cavities, made of niobium, are manufactured at Cornell University. The primary purpose of these cavities is to further the understanding of SRF. With this better understanding, improved cavities can be manufactured for particles accelerators such as the Cornell Energy Recovery Linear-accelerator (ERL). A temperature mapping system (T-Map) has been developed that can detect temperature changes on the surface of the cavity to give a full temperature profile of the cavity during operation. This paper details ideas to improve the T-Map at Newman Lab such as using LabVIEW for data acquisition and designs of a new testing insert to move from the center testing pit to the west testing pit.
INTRODUCTION
SRF cavities made of Niobium are used in particle
accelerators around the world. Niobium enters a superconductive state at 9.2K. Liquid helium is used as a cryogen because it is in its liquid state at 4.2K. When a cavity transitions from superconducting to normal conducting under RF operation it is known as quenching. [1] If a cavity were to quench during operation in a particle accelerator, the beam could be lost. Quenches are caused by the exceeding the critical temperature or critical magnetic field. By taking a full temperature profile of the cavity under different conditions such as changing temperatures and Eacc, the cause of the quench can be located. Newman lab has three test pits to accommodate cavity tests of various sizes. Single-cell temperature maps tests are conducted in the center testing pit.
Temperature Mapping System
The current temperature mapping system (T-Map) consists of 646 Allen-Bradley resistors (see figure 1) on 38 boards positioned around the entire cavity. There are additional Allen-Bradley resistors mounted on the sides of a few boards to measure the bath temperature for comparison and offset. The voltages across the resistors
are read by a National Instruments (NI) DAQ PCI-6229 which is connected to two NI SCXI-1001 that are daisy chained together. Each NI SCXI-1001 has 12 NI SCXI-1100 modules that have 32 channels on each module resulting in 768 channels total. There is a layout file that relates the resistors by board to the module/channel layout. In addition to the Allen-Bradley resistors, Cernox temperature sensors are placed on the cavity and in the bath. The Cernox sensors are read using a LakeShore 370.
The data has been acquired and compiled into usable results in a MATLAB program. On average the MATLAB program takes 160 seconds to complete one data acquisition cycle. The majority of this time occurs switching between channels. A single data acquisition cycle consists of reading 1000 samples per channel and averages those samples for each of the 768 channels; then stores the averages. For each channel average that is stored, one Cernox temperature is taken and stored. Testing time is limited because the testing pit is filled completely with liquid helium and tests are conducted as the liquid helium evaporates. Because of this time limiting factor, it would be beneficial if the data acquisition took less time. LabVIEW is made by NI and does not have the latency that occurs in MATLAB when switching between channels.
This paper addresses using LabVIEW as a data acquisition tool to reduce the data acquisition cycle time while keeping the existing MATLAB program to compile data into usable results.
Transition to the West Pit
Figure 1: T-Map Board with 17 Allen-Bradley resistors
2
Newman laboratory has three testing pits: the east pit, center pit, and west pit. The center pit is the smallest of the three and holds a 17.5” cryogenic testing dewar. The west pit can accommodate a 22” dewar. Since both dewars are the same height, the 22” has a greater volume to be filled with liquid helium. Each test starts by filling the dewar with liquid helium and testing until the cavity is no longer covered. With the larger dewar it is possible to test for longer amounts of time.
With the center pit test insert, the T-Map boards have to be turned into place. This puts undesirable stress on the resistors and boards due to space restrictions. Additionally, the cables have to be wrapped in plastic, adding stress to the cables. The added space in the west pit would eliminate the need to rotate the boards into place while the resistors are touching the cavity. There would also be room for an all-metal valve to be added to the insert. The all-metal valve is an important addition to the insert because it allows the cavity to be assembled in the clean room without being attached to the entire test insert. This provides for a cleaner and quicker transfer between different cavities to be tested.
The center pit insert will be modified to go into the west pit with new vacuum tubes and an upgraded viking horn setup. This paper details these designs.
METHODS
LabVIEW for Data Acquisition
A data acquisition program was written using LabVIEW in order to better interface with the NI hardware. Running the LabVIEW program prompts the user to select between scanning all the channels and scanning only the channels that have resistors wired
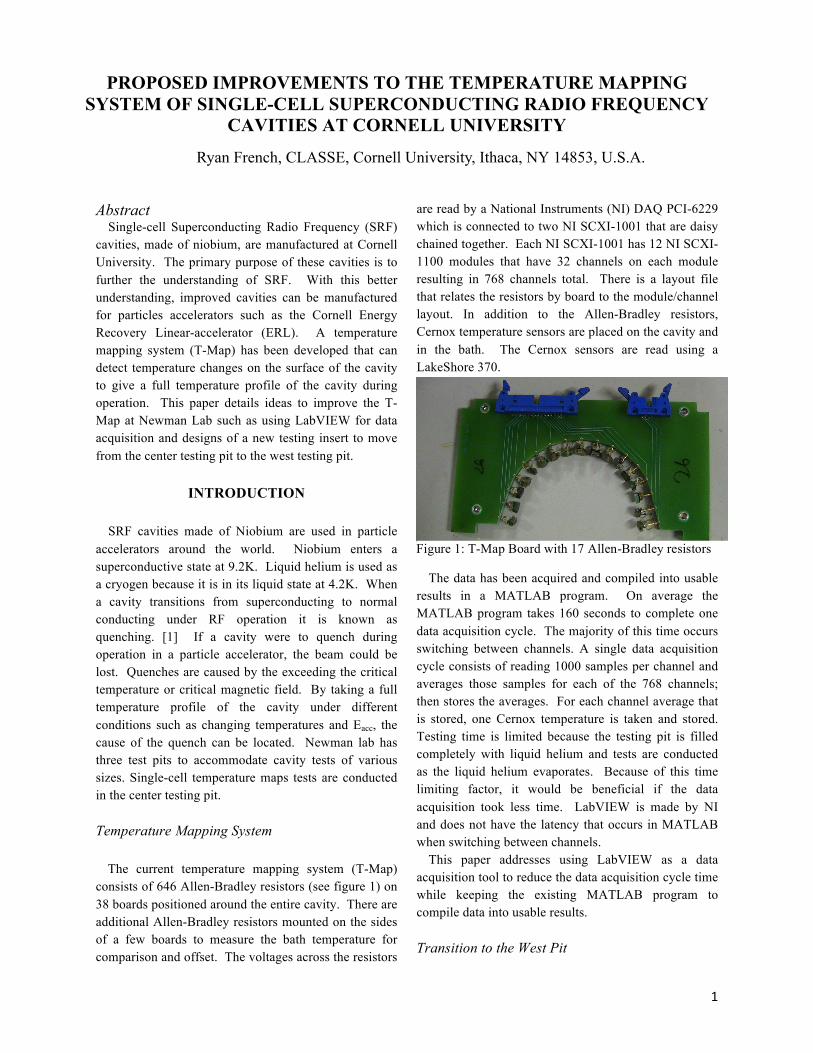
according to the layout file. The program takes 1000 readings on one channel, averages those samples and one reading from the LakeShore simultaneously. It does this for all 768 channels. It then saves the raw voltages listed by channel, the averages in a 24 by 32 array, and the LakeShore readings to separate files and displays that file location. The program front panel also displays the time it took to complete the data acquisition (see figure 2).
Testing Insert for West Pit
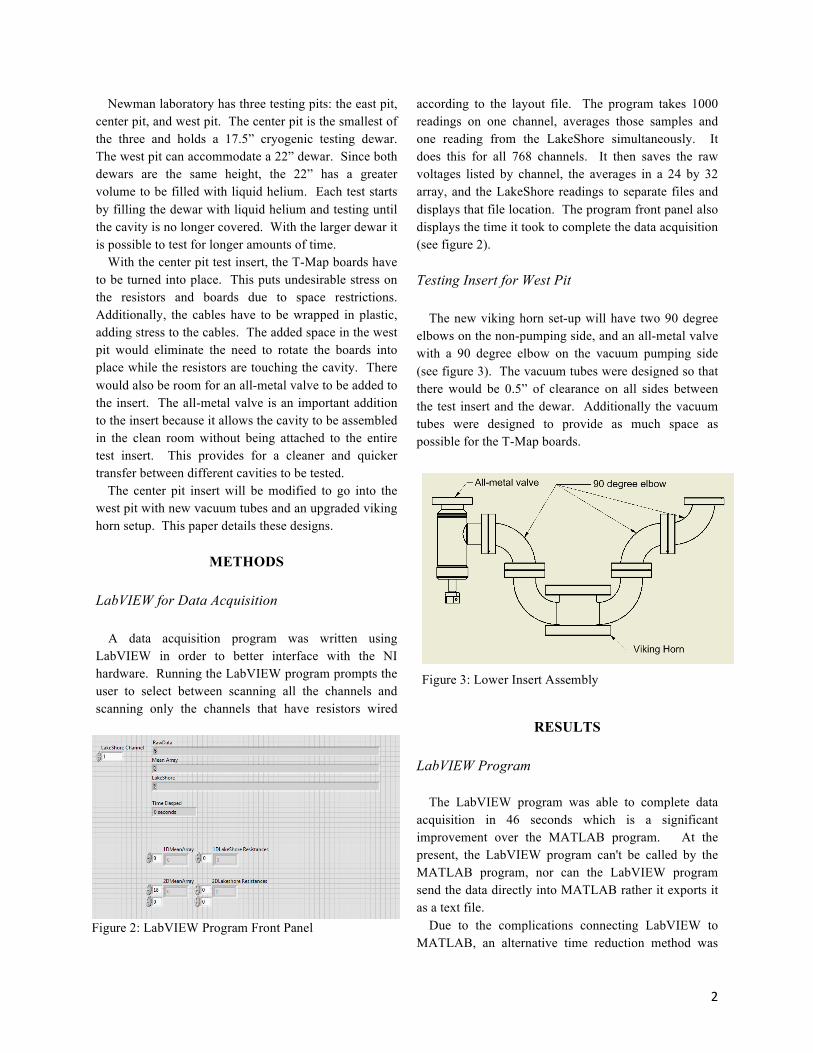
The new viking horn set-up will have two 90 degree elbows on the non-pumping side, and an all-metal valve with a 90 degree elbow on the vacuum pumping side (see figure 3). The vacuum tubes were designed so that there would be 0.5” of clearance on all sides between the test insert and the dewar. Additionally the vacuum tubes were designed to provide as much space as possible for the T-Map boards.
RESULTS
LabVIEW Program
The LabVIEW program was able to complete data
acquisition in 46 seconds which is a significant improvement over the MATLAB program. At the present, the LabVIEW program can't be called by the MATLAB program, nor can the LabVIEW program send the data directly into MATLAB rather it exports it as a text file.
Due to the complications connecting LabVIEW to MATLAB, an alternative time reduction method was
Figure 3: Lower Insert Assembly
Figure 2: LabVIEW Program Front Panel
3
implemented using the current MATLAB program. During data collection, graphing the temperature was reduced from all 768 temperatures that are recorded to only graphing 76 of the temperatures. This speeds up the process by 52 seconds allowing more data to be collected.
Additional time reduction may be accomplished by reducing the number of data points collected for each resistor. However, further data analysis would need to be done to asses if the number of data points can be reduced without being detrimental to the signal-to-noise ratio of the system.
Vacuum Tubes for West Pit
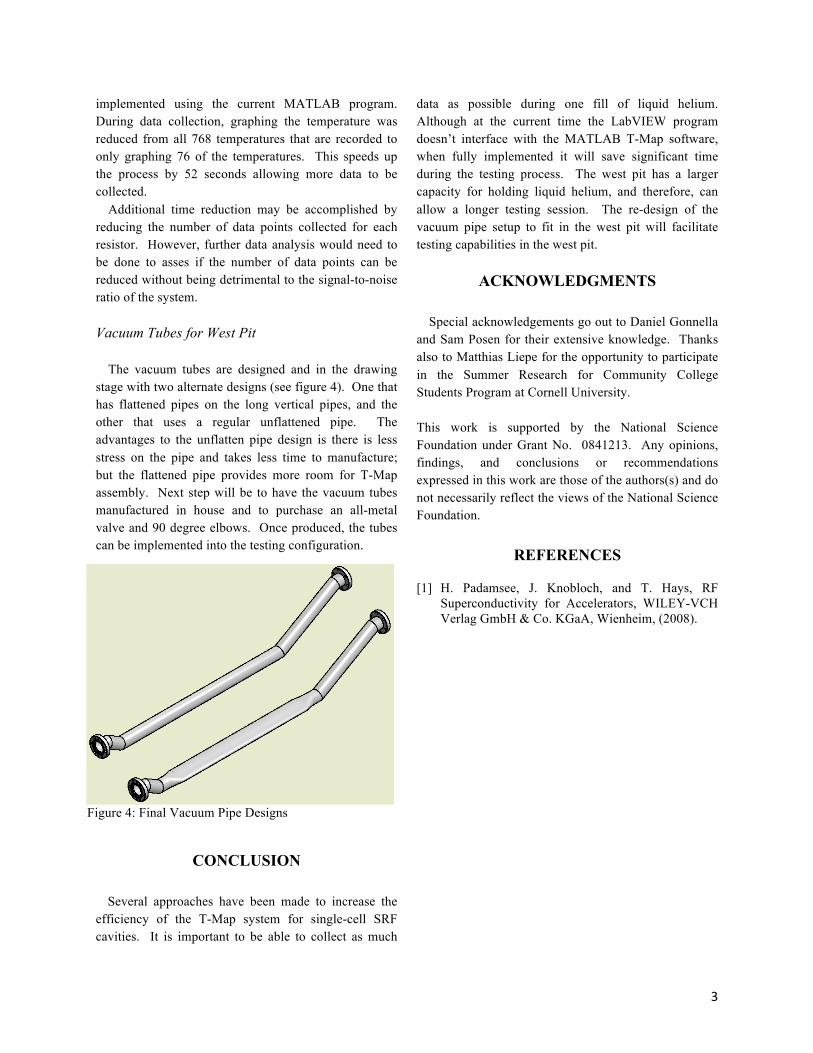
The vacuum tubes are designed and in the drawing
stage with two alternate designs (see figure 4). One that has flattened pipes on the long vertical pipes, and the other that uses a regular unflattened pipe. The advantages to the unflatten pipe design is there is less stress on the pipe and takes less time to manufacture; but the flattened pipe provides more room for T-Map assembly. Next step will be to have the vacuum tubes manufactured in house and to purchase an all-metal valve and 90 degree elbows. Once produced, the tubes can be implemented into the testing configuration.
CONCLUSION
Several approaches have been made to increase the
efficiency of the T-Map system for single-cell SRF cavities. It is important to be able to collect as much
data as possible during one fill of liquid helium. Although at the current time the LabVIEW program doesn’t interface with the MATLAB T-Map software, when fully implemented it will save significant time during the testing process. The west pit has a larger capacity for holding liquid helium, and therefore, can allow a longer testing session. The re-design of the vacuum pipe setup to fit in the west pit will facilitate testing capabilities in the west pit.
ACKNOWLEDGMENTS
Special acknowledgements go out to Daniel Gonnella
and Sam Posen for their extensive knowledge. Thanks also to Matthias Liepe for the opportunity to participate in the Summer Research for Community College Students Program at Cornell University.
This work is supported by the National Science Foundation under Grant No. 0841213. Any opinions, findings, and conclusions or recommendations expressed in this work are those of the authors(s) and do not necessarily reflect the views of the National Science Foundation.
REFERENCES
[1] H. Padamsee, J. Knobloch, and T. Hays, RF Superconductivity for Accelerators, WILEY-VCH Verlag GmbH & Co. KGaA, Wienheim, (2008).
Figure 4: Final Vacuum Pipe Designs