Embed Size (px)
Citation preview

Why do you need a map? What’s it’s purpose?
Who is the audience?
How will they access/use the map.
What is the map’s job?
For example:
Looking at several data sources at once
Communicating or illustrating a point or key finding
Persuading
Exploring: a tool for people to use to make their own meaning

Cartography 101
Basemaps Titles Types of data and layer symbology Layer properties Legends

TitleA good title includes:
◦ Theme◦ Place◦ Timee.g. Twin Cities Bicycle Trails, 2018
You don’t need to include the word “map” in your title!

BasemapsAppropriate applications for different basemaps:
◦ Reference◦ Business locations◦ Mountain peaks (for hikers)◦ Nearby landmarks for tourism
◦ Thematic◦ Obesity rates by state◦ Ecological footprints by country◦ Housing values by neighborhood

Layer Symbology Qualitativeo Differences in kind of thingo No order is implied
Kenyan Dialects

Layer Symbology Qualitativeo Differences in kind of thingo No order is implied
Quantitativeo Differences in amount, rank, etc.o Graduated ordero Rates vs counts

Symbology: Qualitative Data Hue
Shape
Examples: o Points symbolizing different kinds of schools – public vs private, K-12 vs
higher edo Polygons of land use classification – residential, commercial, etc.

Symbology: Quantitative Data Lightness
Size
Examples: o State populationo Employment density by census tract
Use conventions – lighter color = less, darker color = more; red = bad, green = good… or challenge conventions, carefully Use a different color (gray, for example) for “no data”

Layer Properties Transparency: can be set from 0-100%
Order matters: watch out for top layers to obscure lower layers
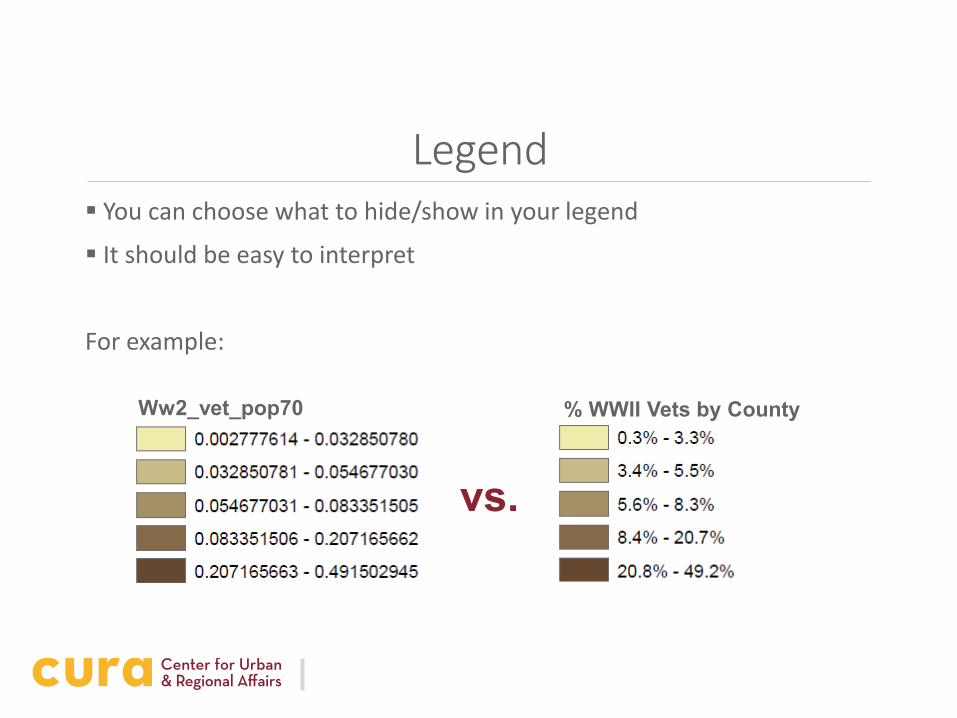
Legend You can choose what to hide/show in your legend
It should be easy to interpret
For example:
Ww2_vet_pop70
vs.
% WWII Vets by County

Tips for Making Clearer Maps Visual Contrast Legibility
Figure-Ground
Hierarchical Organization
Balance

Visual Contrast

Legibility

Figure-Ground
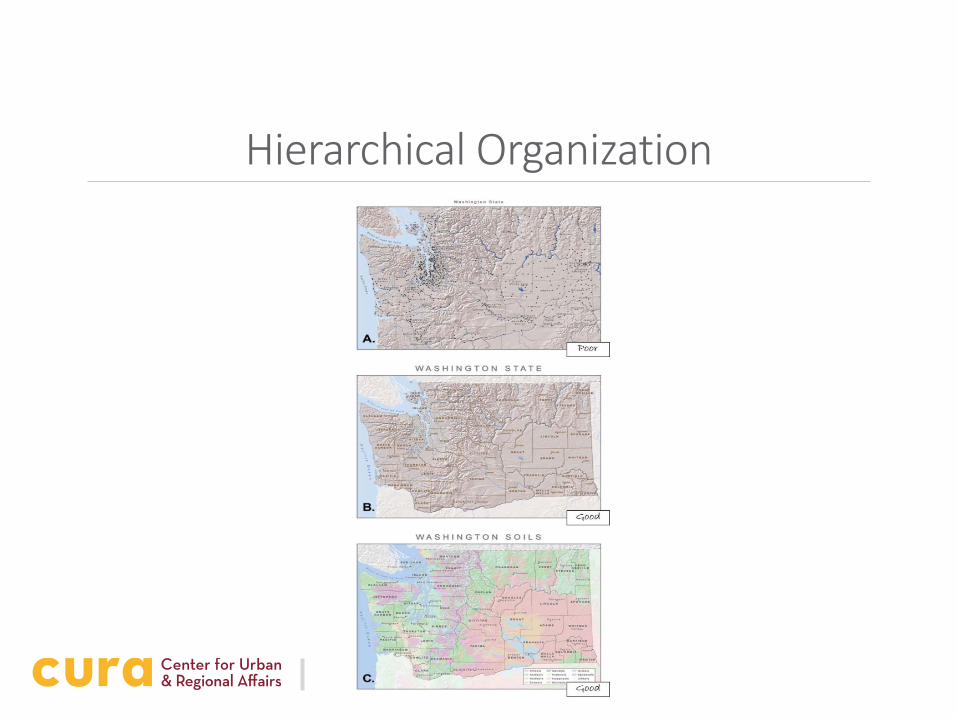
Hierarchical Organization

Balance

Tips for Making Clearer Maps
Put your map into the format and scale it will be in
Step away from it to look at it critically
Invite someone else to look at it and tell you what they see


Common GIS Tools
Places to get data to use in ArcMap/ArcGIS Online: City and county open data websites (Mpls, St. Paul, Hennepin and
Ramsey Counties, etc.) MN Geospatial Commons (statewide and MetroGIS datasets) Social Explorer and Factfinder (Census and ACS data)
Places to create maps that you download, link to, etc. Social Explorer OnTheMap MN Compass and Neighborhood Profiles ArcGIS Online to make web maps, including story maps


Support
U-Spatial training: both in-person and downloadable content for desktop and web mapping
ESRI online trainings and technical workshops from user conferences are available to UMN students