Embed Size (px)
Citation preview
Telecommunications Sector Presentation
By Brad Moore
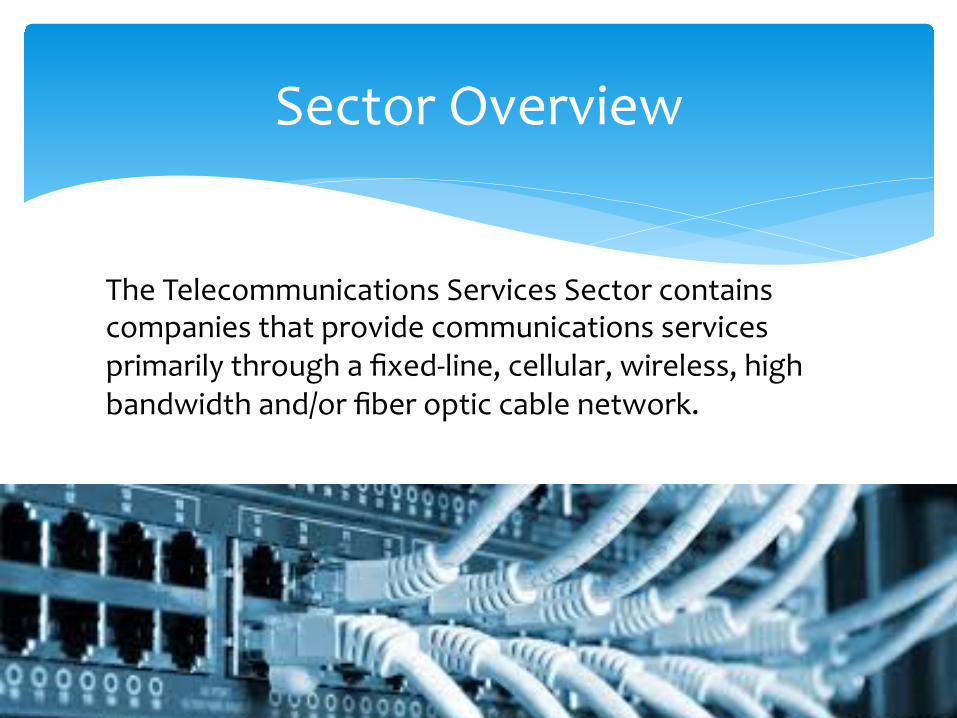
Sector Overview
The Telecommunications Services Sector contains companies that provide communications services primarily through a fixed-‐line, cellular, wireless, high bandwidth and/or fiber optic cable network.
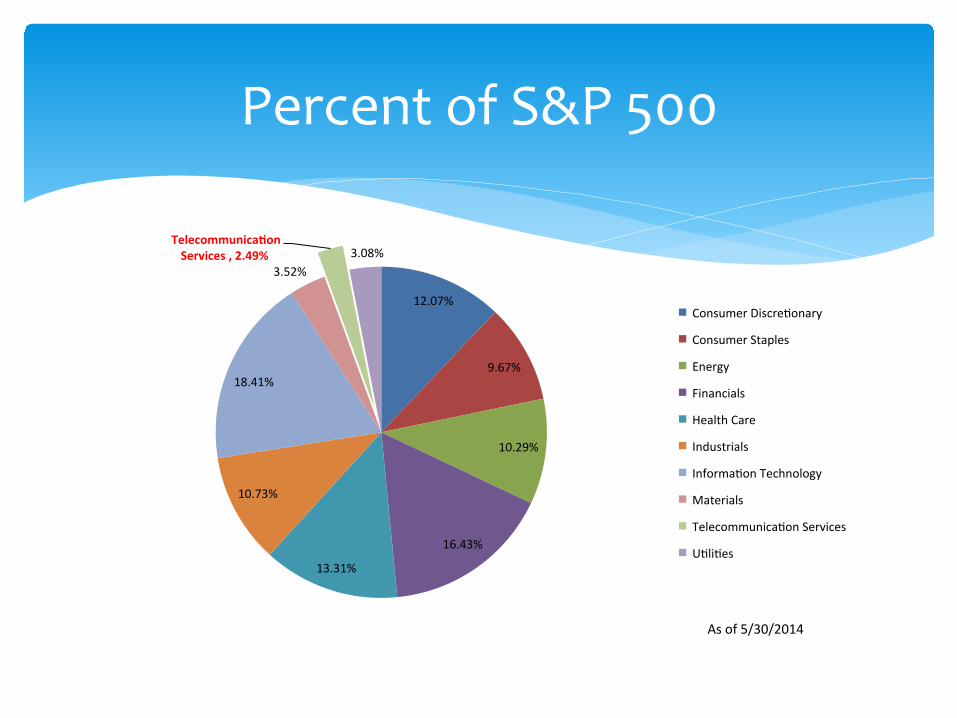
Percent of S&P 500
12.07%
9.67%
10.29%
16.43%
13.31%
10.73%
18.41%
3.52%
Telecommunica+on Services , 2.49% 3.08%
Consumer Discre9onary
Consumer Staples
Energy
Financials
Health Care
Industrials
Informa9on Technology
Materials
Telecommunica9on Services
U9li9es
As of 5/30/2014
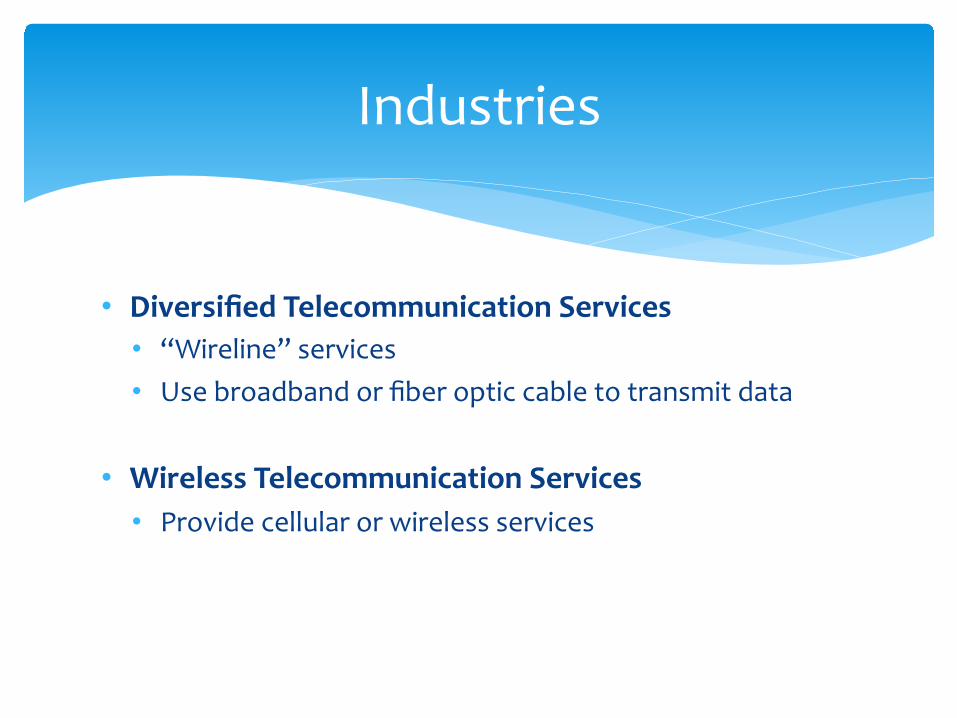
• Diversified Telecommunication Services • “Wireline” services • Use broadband or fiber optic cable to transmit data
• Wireless Telecommunication Services • Provide cellular or wireless services
Industries
Companies

Market Cap by Company
Company Market Cap
AT&T Inc 184,686,934,030
CenturyLink Inc 21,771,564,850
Fron9er Communica9ons Corp 5,787,377,130
Verizon Communica9ons Inc 206,891,404,360
Windstream Holdings Inc 5,703,758,280
Total 424,841,038,650
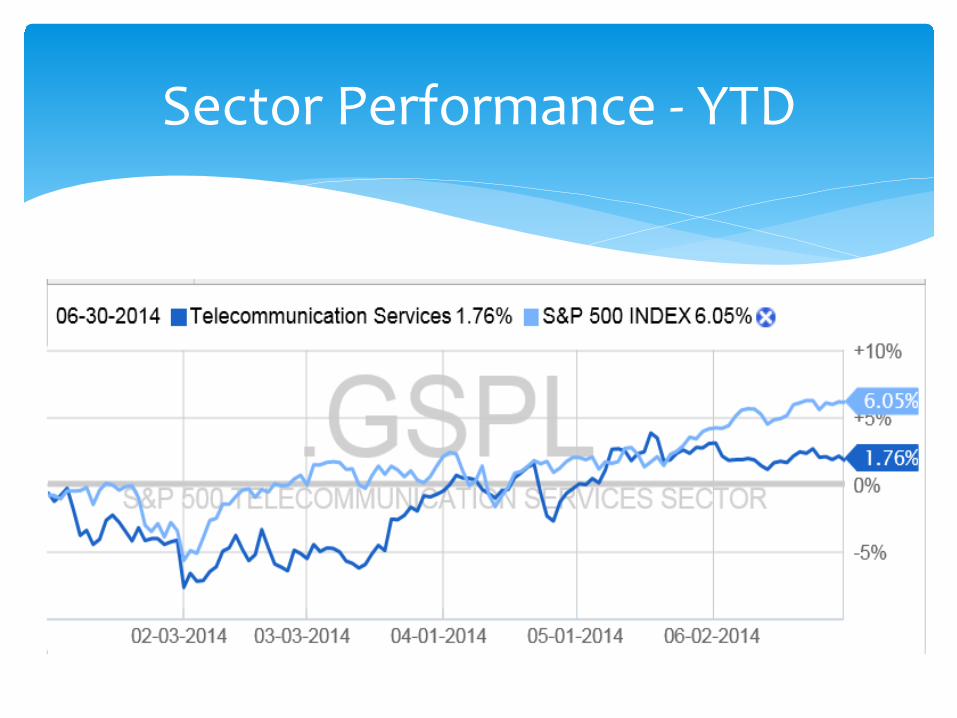
Sector Performance -‐ YTD
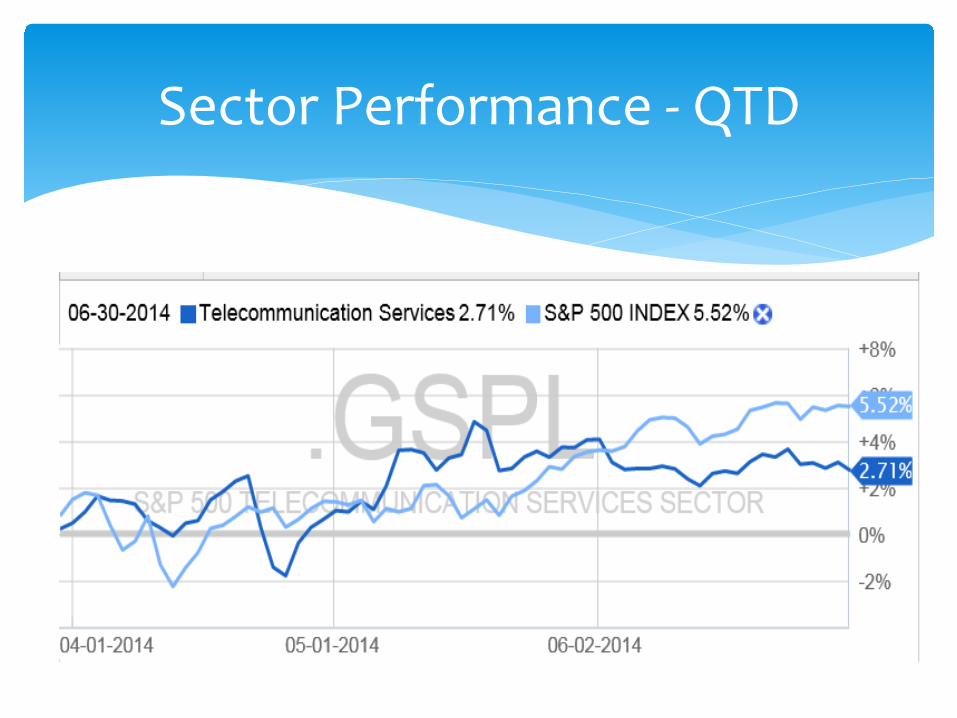
Sector Performance -‐ QTD
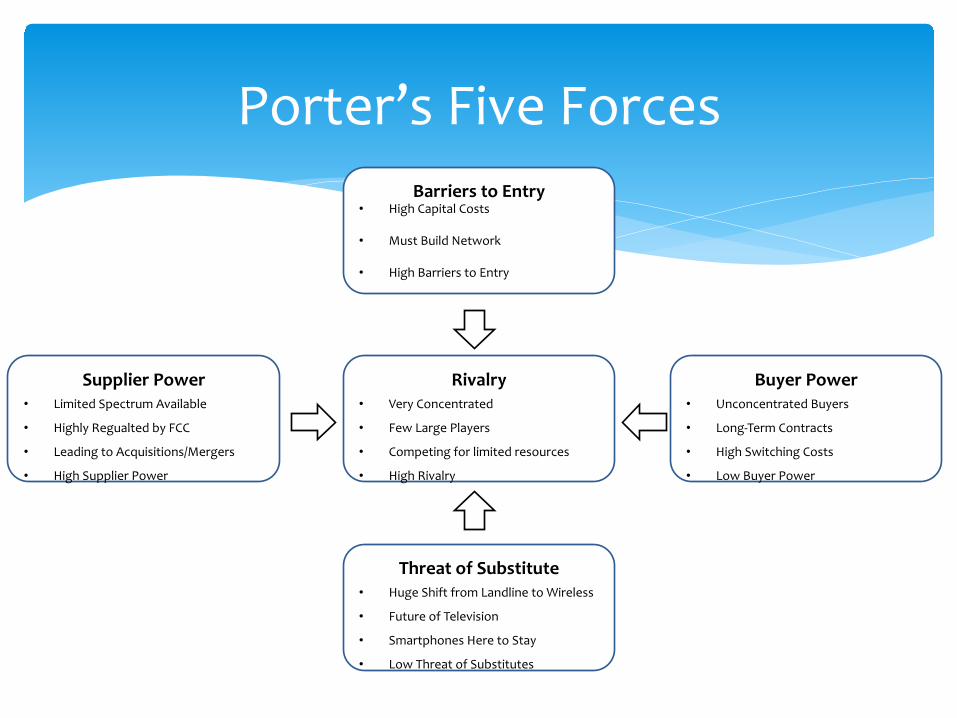
Rivalry • Very Concentrated
• Few Large Players
• Competing for limited resources
• High Rivalry
Barriers to Entry • High Capital Costs
• Must Build Network
• High Barriers to Entry
Threat of Substitute • Huge Shift from Landline to Wireless
• Future of Television
• Smartphones Here to Stay
• Low Threat of Substitutes
Supplier Power • Limited Spectrum Available
• Highly Regualted by FCC
• Leading to Acquisitions/Mergers
• High Supplier Power
Buyer Power • Unconcentrated Buyers
• Long-‐Term Contracts
• High Switching Costs
• Low Buyer Power
Porter’s Five Forces
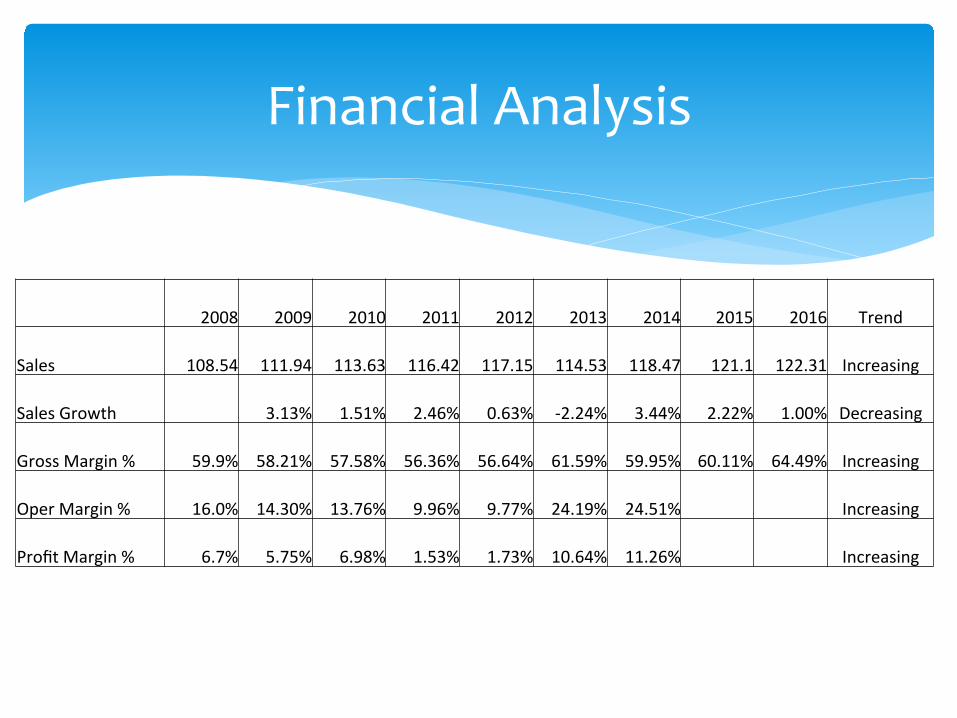
Financial Analysis
2008 2009 2010 2011 2012 2013 2014 2015 2016 Trend
Sales 108.54 111.94 113.63 116.42 117.15 114.53 118.47 121.1 122.31 Increasing
Sales Growth 3.13% 1.51% 2.46% 0.63% -‐2.24% 3.44% 2.22% 1.00% Decreasing
Gross Margin % 59.9% 58.21% 57.58% 56.36% 56.64% 61.59% 59.95% 60.11% 64.49% Increasing
Oper Margin % 16.0% 14.30% 13.76% 9.96% 9.77% 24.19% 24.51% Increasing
Profit Margin % 6.7% 5.75% 6.98% 1.53% 1.73% 10.64% 11.26% Increasing
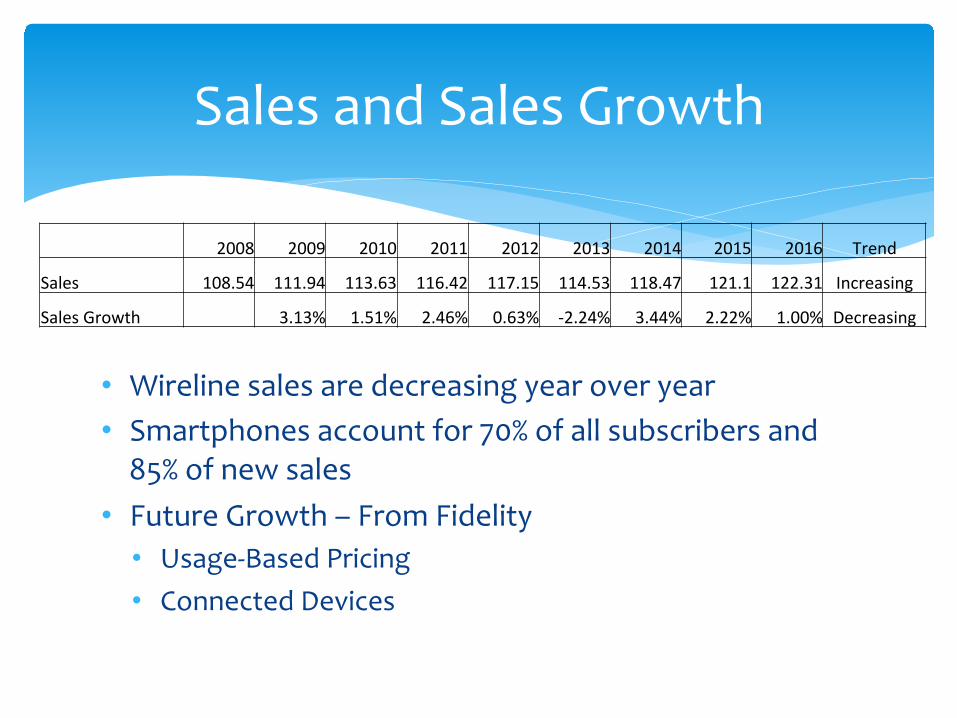
• Wireline sales are decreasing year over year • Smartphones account for 70% of all subscribers and 85% of new sales
• Future Growth – From Fidelity • Usage-‐Based Pricing • Connected Devices
Sales and Sales Growth
2008 2009 2010 2011 2012 2013 2014 2015 2016 Trend
Sales 108.54 111.94 113.63 116.42 117.15 114.53 118.47 121.1 122.31 Increasing
Sales Growth 3.13% 1.51% 2.46% 0.63% -‐2.24% 3.44% 2.22% 1.00% Decreasing
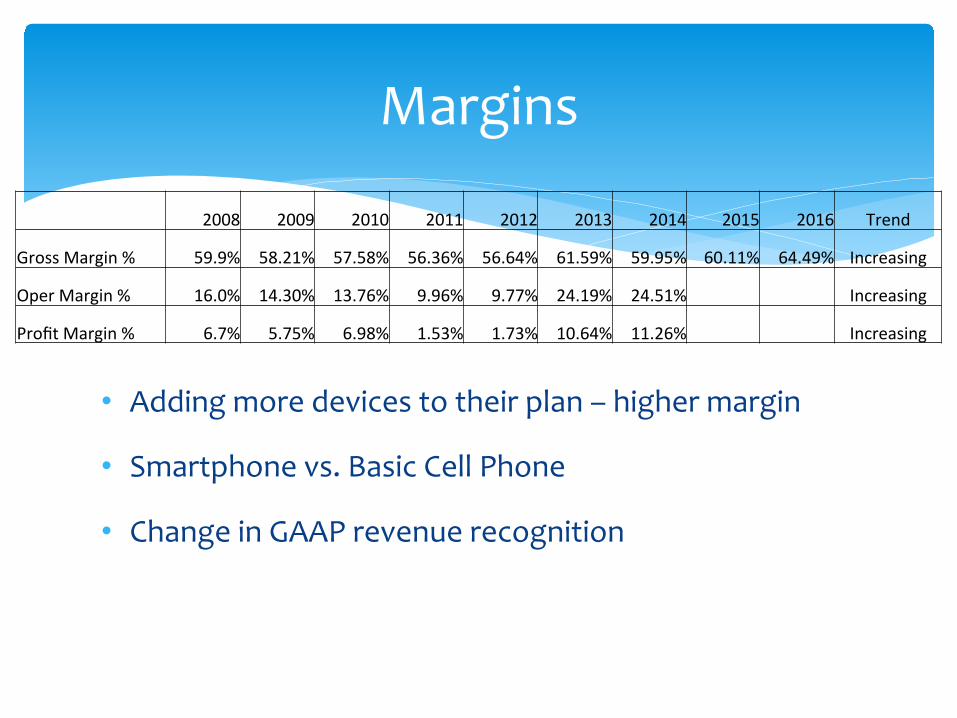
• Adding more devices to their plan – higher margin
• Smartphone vs. Basic Cell Phone
• Change in GAAP revenue recognition
Margins
2008 2009 2010 2011 2012 2013 2014 2015 2016 Trend
Gross Margin % 59.9% 58.21% 57.58% 56.36% 56.64% 61.59% 59.95% 60.11% 64.49% Increasing
Oper Margin % 16.0% 14.30% 13.76% 9.96% 9.77% 24.19% 24.51% Increasing
Profit Margin % 6.7% 5.75% 6.98% 1.53% 1.73% 10.64% 11.26% Increasing
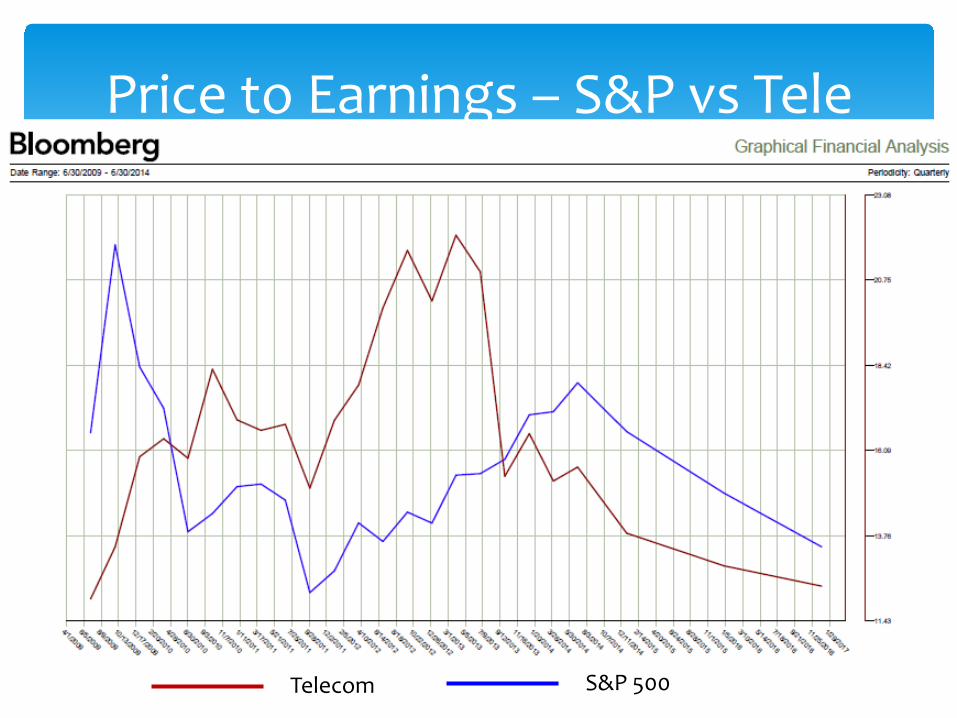
Price to Earnings – S&P vs Tele
Telecom S&P 500
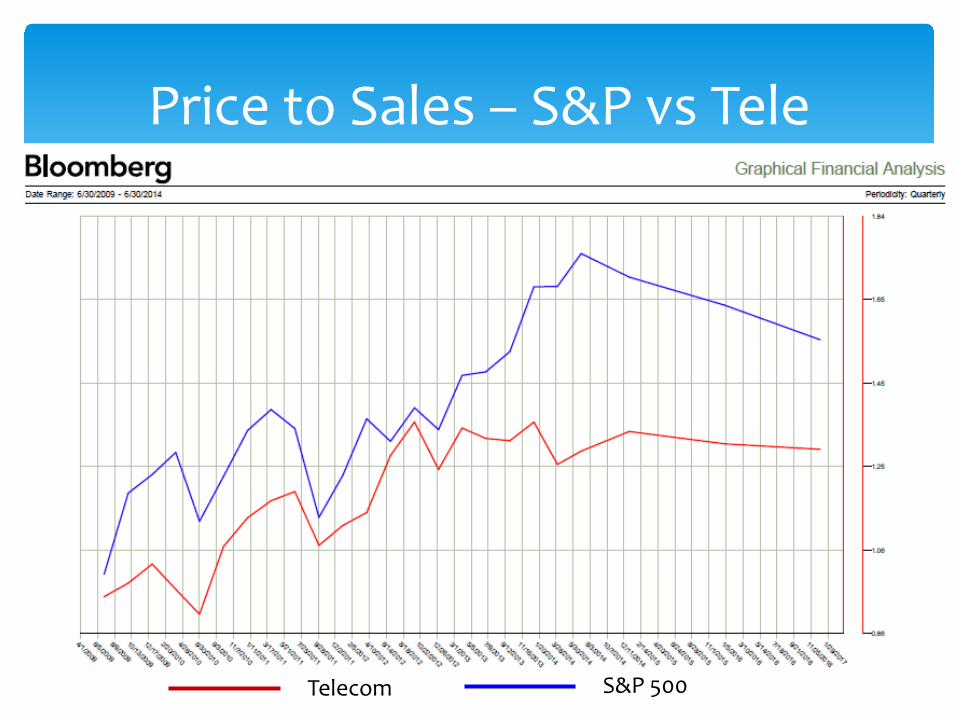
Price to Sales – S&P vs Tele
Telecom S&P 500
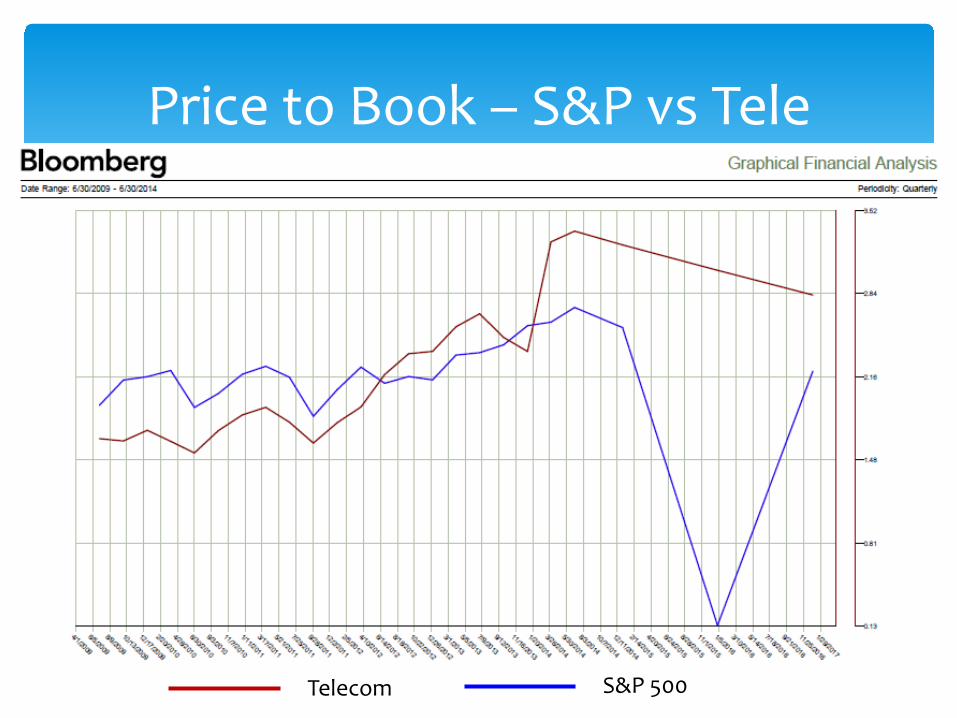
Price to Book – S&P vs Tele
Telecom S&P 500
• Difficulty using valuation methods on multi-‐industry businesses
• Example AT&T/DirecTV
• Creates riskiness of cash flows – increase in discount rate
• How realistic are synergies?
• Negative impacts of transaction
• Google acquisition of wireless start up
Affect of Mergers/Acquisitions
• Currently, overweight in Telecommunications (2.84% vs. 2.49%
of S&P)
• Should move to be underweight
• No diversification within Telecommunications (AT&T only)
• Spread investment over multiple companies that look appealing
• Be ready for a rebound in this sector
Recommendation