Embed Size (px)
Citation preview
Telecommunications Markets in the Nordic and Baltic Countries 2017
20 June 2018
| 2
|
About the database
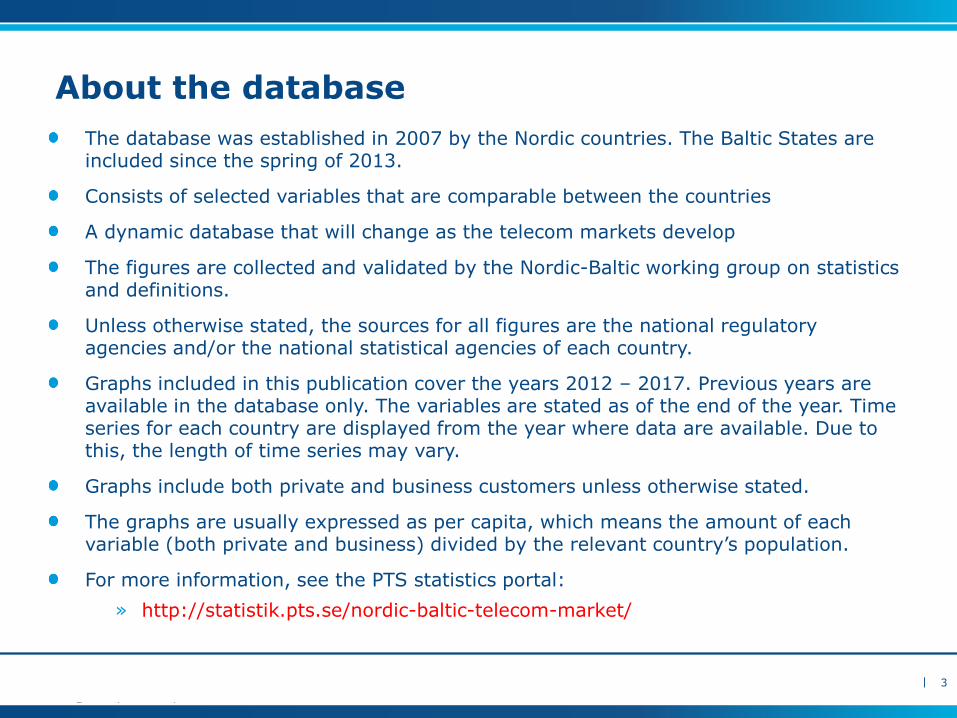
The database was established in 2007 by the Nordic countries. The Baltic States are included since the spring of 2013.
Consists of selected variables that are comparable between the countries
A dynamic database that will change as the telecom markets develop
The figures are collected and validated by the Nordic-Baltic working group on statistics and definitions.
Unless otherwise stated, the sources for all figures are the national regulatory agencies and/or the national statistical agencies of each country.
Graphs included in this publication cover the years 2012 – 2017. Previous years are available in the database only. The variables are stated as of the end of the year. Time series for each country are displayed from the year where data are available. Due to this, the length of time series may vary.
Graphs include both private and business customers unless otherwise stated.
The graphs are usually expressed as per capita, which means the amount of each variable (both private and business) divided by the relevant country’s population.
For more information, see the PTS statistics portal:
» http://statistik.pts.se/nordic-baltic-telecom-market/
3
|
Population
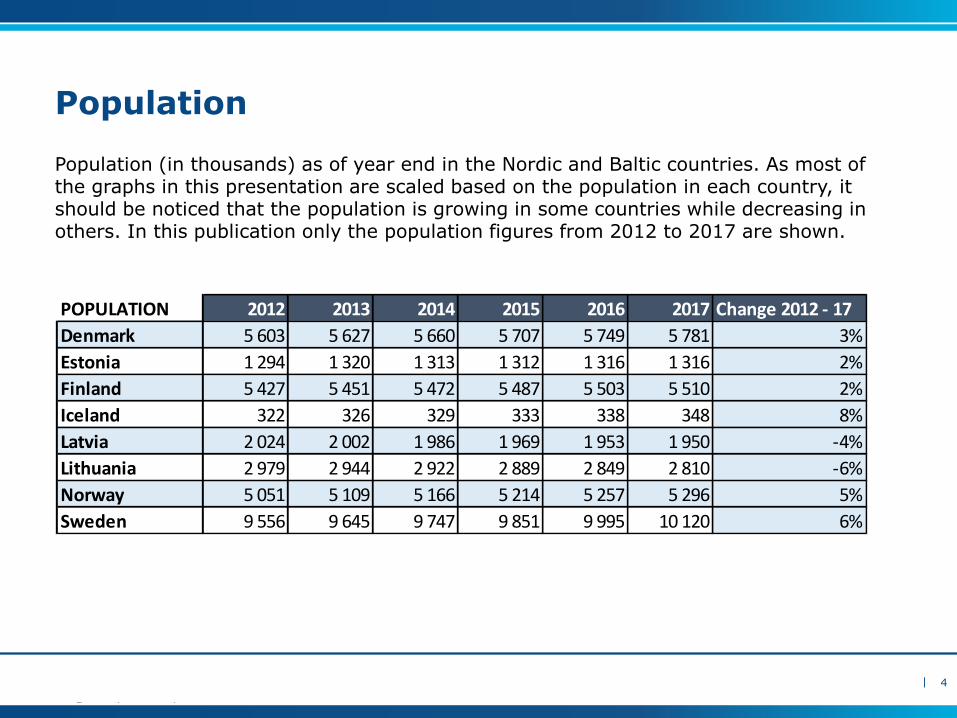
Population (in thousands) as of year end in the Nordic and Baltic countries. As most of the graphs in this presentation are scaled based on the population in each country, it should be noticed that the population is growing in some countries while decreasing in others. In this publication only the population figures from 2012 to 2017 are shown.
4
POPULATION 2012 2013 2014 2015 2016 2017 Change 2012 - 17
Denmark 5 603 5 627 5 660 5 707 5 749 5 781 3%
Estonia 1 294 1 320 1 313 1 312 1 316 1 316 2%
Finland 5 427 5 451 5 472 5 487 5 503 5 510 2%
Iceland 322 326 329 333 338 348 8%
Latvia 2 024 2 002 1 986 1 969 1 953 1 950 -4%
Lithuania 2 979 2 944 2 922 2 889 2 849 2 810 -6%
Norway 5 051 5 109 5 166 5 214 5 257 5 296 5%
Sweden 9 556 9 645 9 747 9 851 9 995 10 120 6%
1. Mobile services
5
|
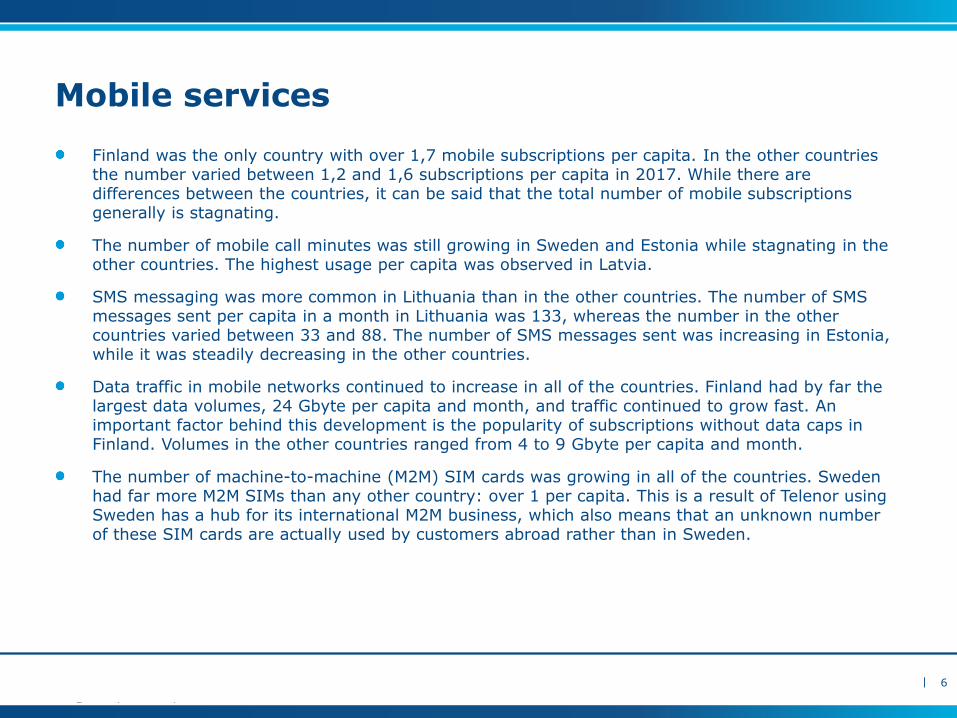
Mobile services
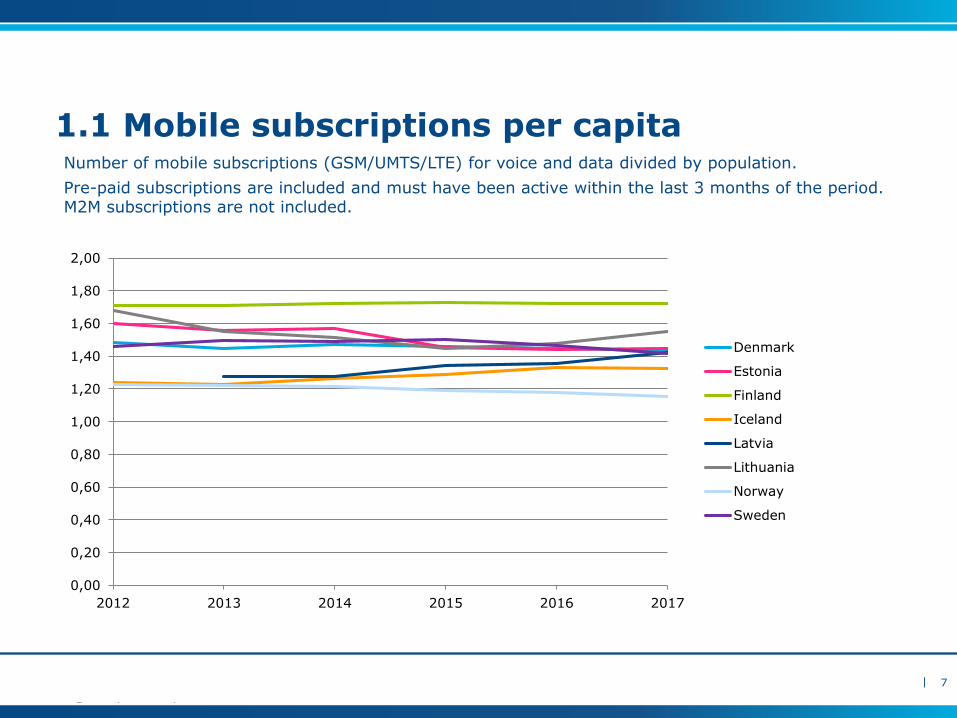
Finland was the only country with over 1,7 mobile subscriptions per capita. In the other countries the number varied between 1,2 and 1,6 subscriptions per capita in 2017. While there are differences between the countries, it can be said that the total number of mobile subscriptions generally is stagnating.
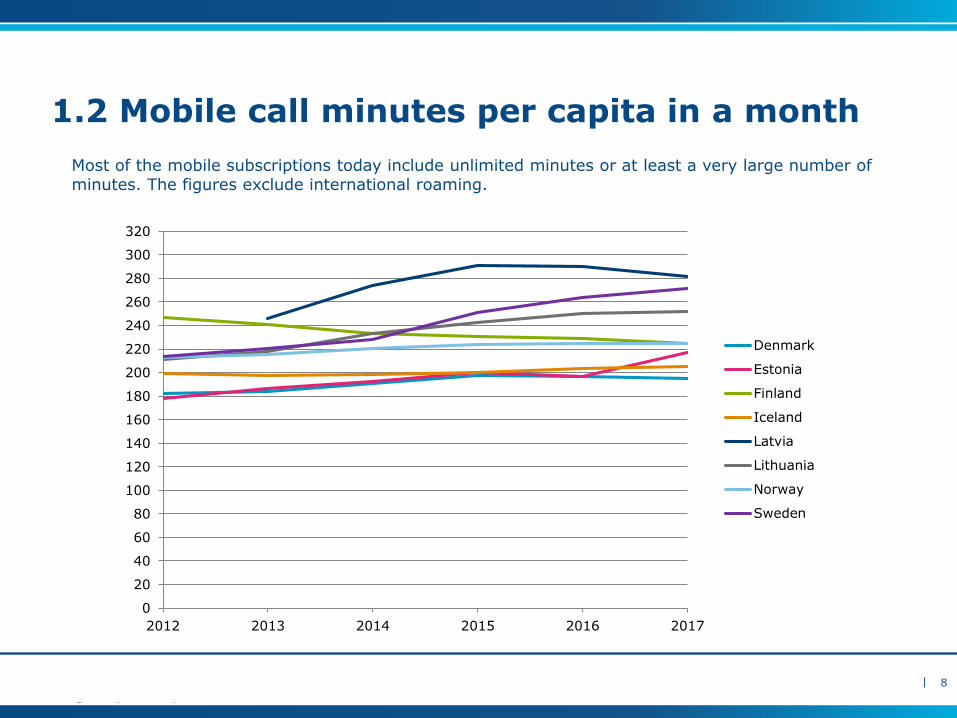
The number of mobile call minutes was still growing in Sweden and Estonia while stagnating in the other countries. The highest usage per capita was observed in Latvia.
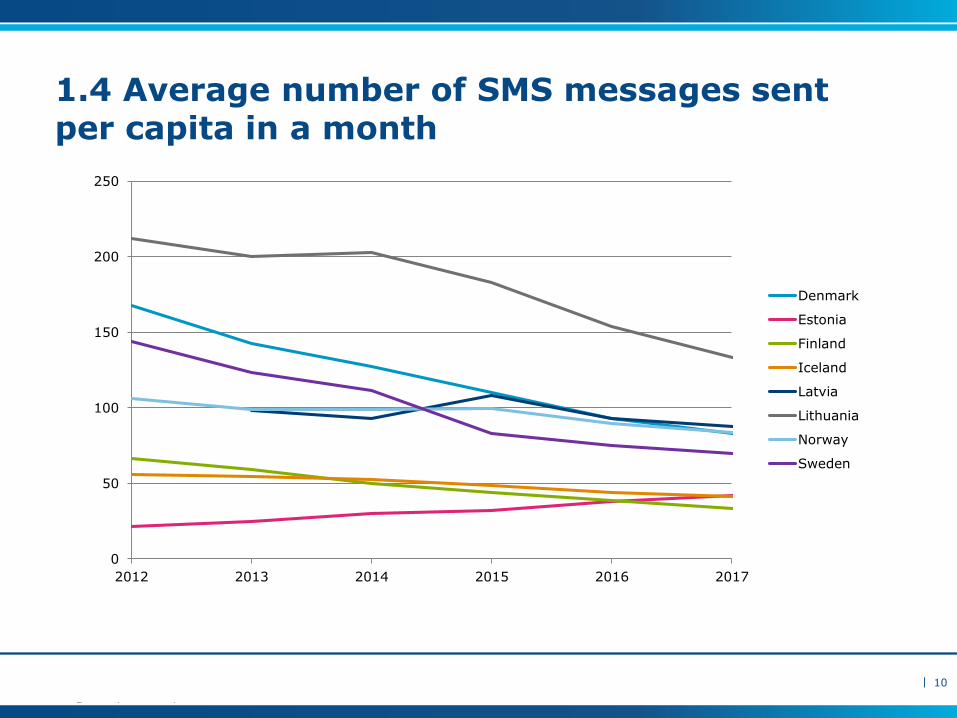
SMS messaging was more common in Lithuania than in the other countries. The number of SMS messages sent per capita in a month in Lithuania was 133, whereas the number in the other countries varied between 33 and 88. The number of SMS messages sent was increasing in Estonia, while it was steadily decreasing in the other countries.
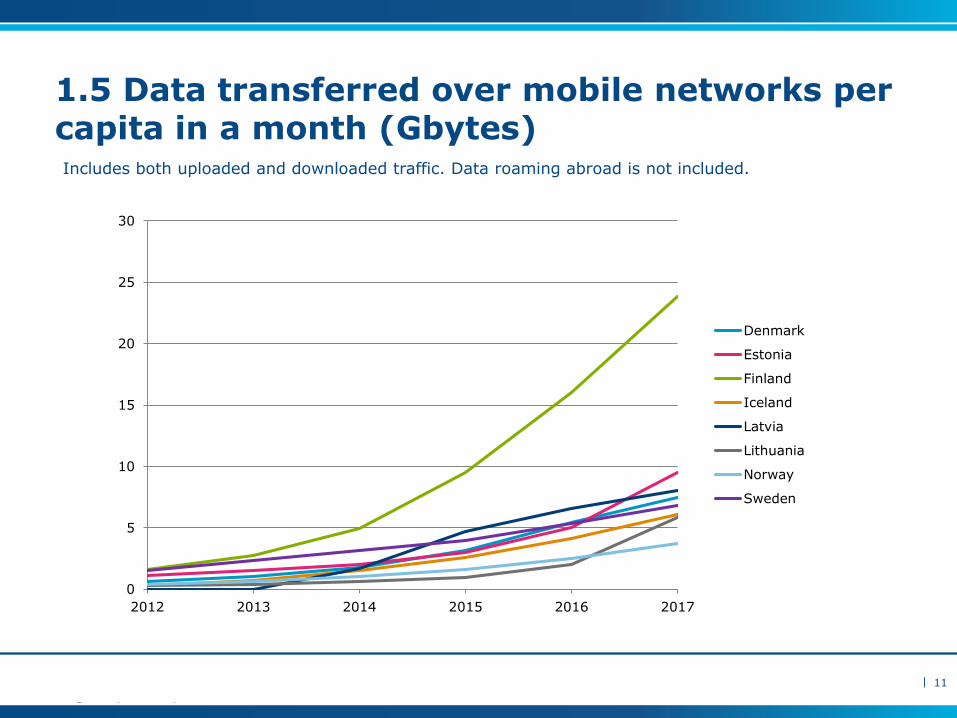
Data traffic in mobile networks continued to increase in all of the countries. Finland had by far the largest data volumes, 24 Gbyte per capita and month, and traffic continued to grow fast. An important factor behind this development is the popularity of subscriptions without data caps in Finland. Volumes in the other countries ranged from 4 to 9 Gbyte per capita and month.
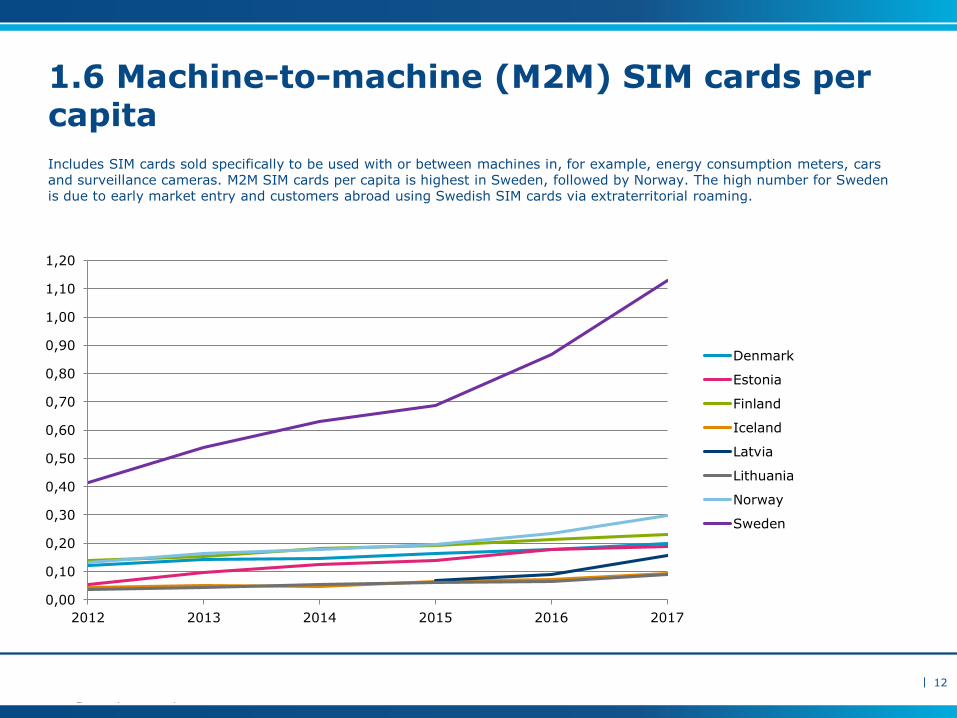
The number of machine-to-machine (M2M) SIM cards was growing in all of the countries. Sweden had far more M2M SIMs than any other country: over 1 per capita. This is a result of Telenor using Sweden has a hub for its international M2M business, which also means that an unknown number of these SIM cards are actually used by customers abroad rather than in Sweden.
6
|
1.1 Mobile subscriptions per capitaNumber of mobile subscriptions (GSM/UMTS/LTE) for voice and data divided by population.
Pre-paid subscriptions are included and must have been active within the last 3 months of the period. M2M subscriptions are not included.
7
0,00
0,20
0,40
0,60
0,80
1,00
1,20
1,40
1,60
1,80
2,00
2012 2013 2014 2015 2016 2017
Denmark
Estonia
Finland
Iceland
Latvia
Lithuania
Norway
Sweden
|
1.2 Mobile call minutes per capita in a month
8
Most of the mobile subscriptions today include unlimited minutes or at least a very large number of minutes. The figures exclude international roaming.
0
20
40
60
80
100
120
140
160
180
200
220
240
260
280
300
320
2012 2013 2014 2015 2016 2017
Denmark
Estonia
Finland
Iceland
Latvia
Lithuania
Norway
Sweden
|
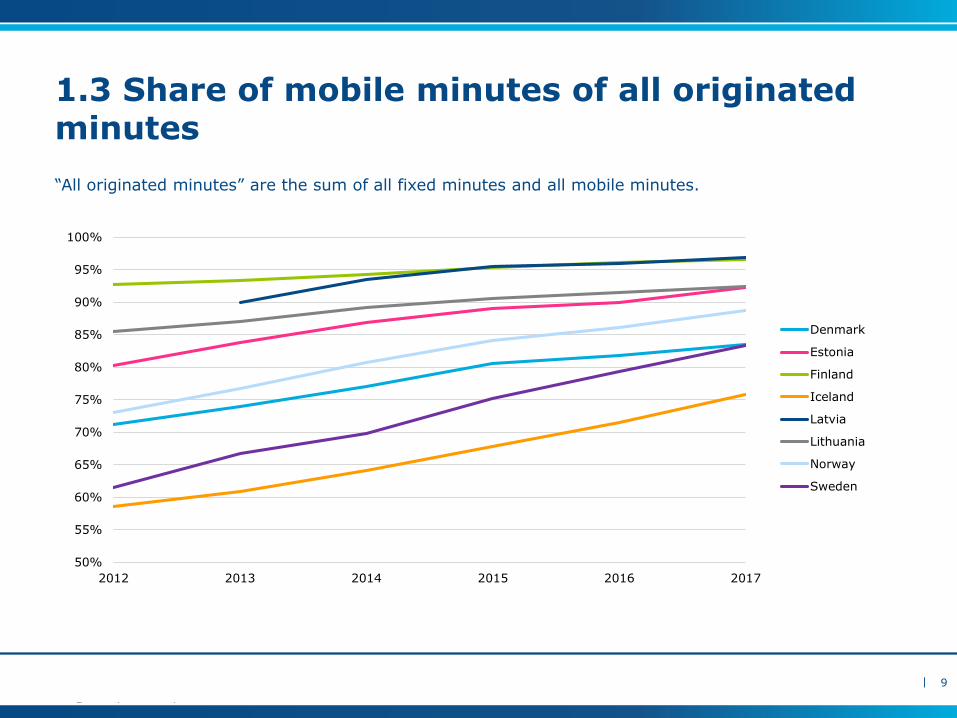
1.3 Share of mobile minutes of all originated minutes
“All originated minutes” are the sum of all fixed minutes and all mobile minutes.
9
50%
55%
60%
65%
70%
75%
80%
85%
90%
95%
100%
2012 2013 2014 2015 2016 2017
Denmark
Estonia
Finland
Iceland
Latvia
Lithuania
Norway
Sweden
|
1.4 Average number of SMS messages sent per capita in a month
10
0
50
100
150
200
250
2012 2013 2014 2015 2016 2017
Denmark
Estonia
Finland
Iceland
Latvia
Lithuania
Norway
Sweden
|
1.5 Data transferred over mobile networks per capita in a month (Gbytes)
11
Includes both uploaded and downloaded traffic. Data roaming abroad is not included.
0
5
10
15
20
25
30
2012 2013 2014 2015 2016 2017
Denmark
Estonia
Finland
Iceland
Latvia
Lithuania
Norway
Sweden
|
1.6 Machine-to-machine (M2M) SIM cards per capita
Includes SIM cards sold specifically to be used with or between machines in, for example, energy consumption meters, cars and surveillance cameras. M2M SIM cards per capita is highest in Sweden, followed by Norway. The high number for Sweden is due to early market entry and customers abroad using Swedish SIM cards via extraterritorial roaming.
12
0,00
0,10
0,20
0,30
0,40
0,50
0,60
0,70
0,80
0,90
1,00
1,10
1,20
2012 2013 2014 2015 2016 2017
Denmark
Estonia
Finland
Iceland
Latvia
Lithuania
Norway
Sweden

2. Fixed call services
13
|
Development of fixed call services
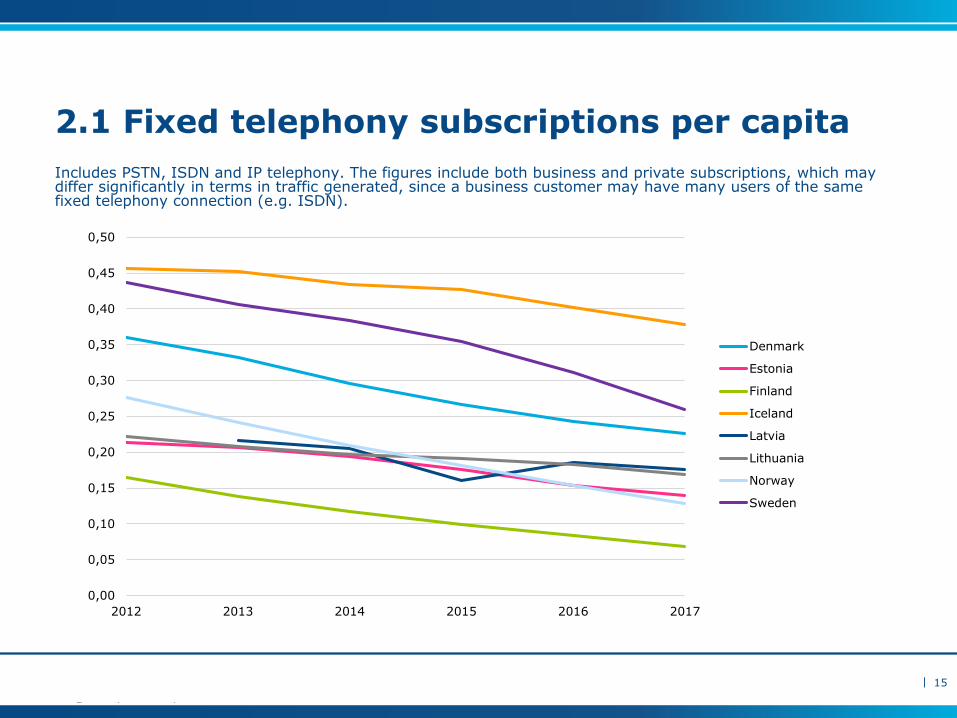
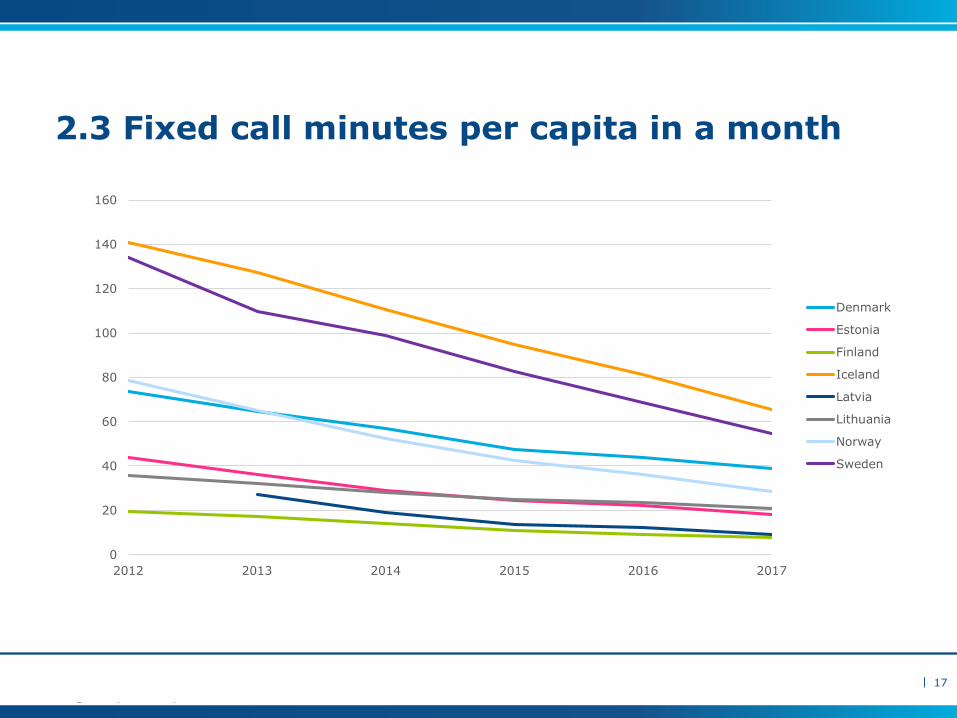
The number of fixed telephony subscriptions per capita as well as the number of fixed call minutes was decreasing in all countries, and there is no sign to indicate any change in the future. Though the share of mobile minutes of all originated minutes varied between 76 and 97 percent in 2017, the relative amount of fixed call minutes is steadily decreasing in all countries.
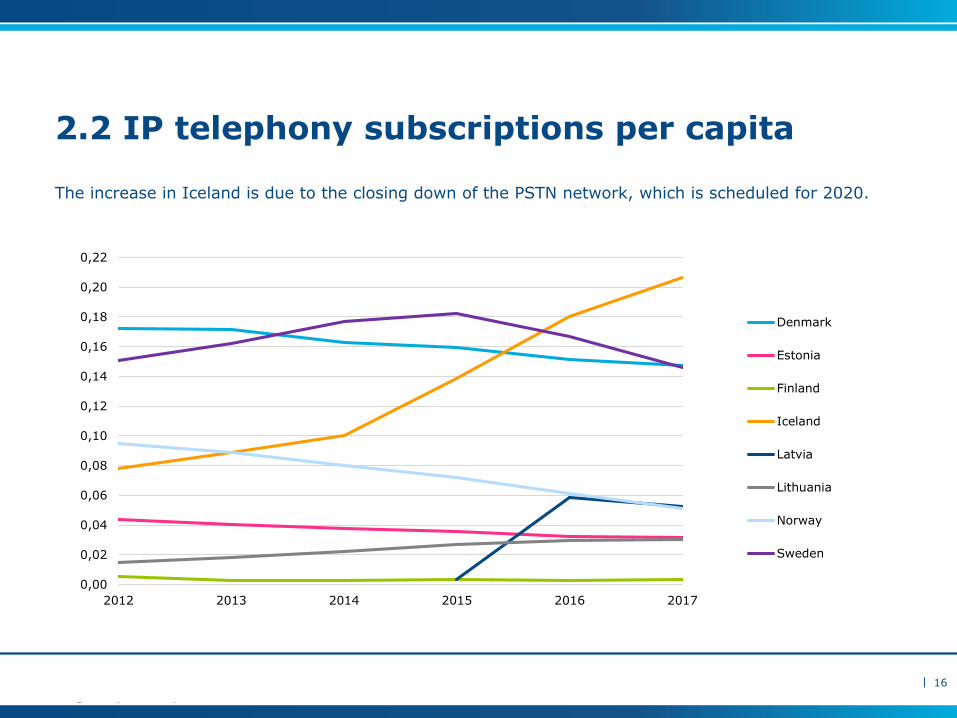
There are major differences between the countries in the number of IP telephony (managed VoIP) subscriptions per capita and the numbers are developing differently to some degree as well. The Danish figures include both managed and unmanaged VoIP.
In Sweden, Denmark and Iceland there were well above 0,1 IP telephony subscriptions per capita. However, Iceland was the only country where subscriptions continued to grow. In Estonia, Finland, Lithuania and Norway, the number of VoIP subscriptions per capita was 0,05 or lower.
The Latvian and Icelandic incumbents plan to gradually switch their entire fixed networks over to IP technology and eventually shut down the PSTN networks. IP telephony is often bundled with other services such as fixed broadband and TV. In those cases the IP telephony part of the bundle may be inactive.
14
|
2.1 Fixed telephony subscriptions per capita
Includes PSTN, ISDN and IP telephony. The figures include both business and private subscriptions, which may differ significantly in terms in traffic generated, since a business customer may have many users of the same fixed telephony connection (e.g. ISDN).
15
0,00
0,05
0,10
0,15
0,20
0,25
0,30
0,35
0,40
0,45
0,50
2012 2013 2014 2015 2016 2017
Denmark
Estonia
Finland
Iceland
Latvia
Lithuania
Norway
Sweden
|
2.2 IP telephony subscriptions per capita
16
The increase in Iceland is due to the closing down of the PSTN network, which is scheduled for 2020.
0,00
0,02
0,04
0,06
0,08
0,10
0,12
0,14
0,16
0,18
0,20
0,22
2012 2013 2014 2015 2016 2017
Denmark
Estonia
Finland
Iceland
Latvia
Lithuania
Norway
Sweden
|
2.3 Fixed call minutes per capita in a month
17
0
20
40
60
80
100
120
140
160
2012 2013 2014 2015 2016 2017
Denmark
Estonia
Finland
Iceland
Latvia
Lithuania
Norway
Sweden
3. Broadband services
18
|
Development of broadband services
Denmark had most fixed broadband subscriptions: 0,43 per capita in 2017. The share was over 0,25 in all of the countries.
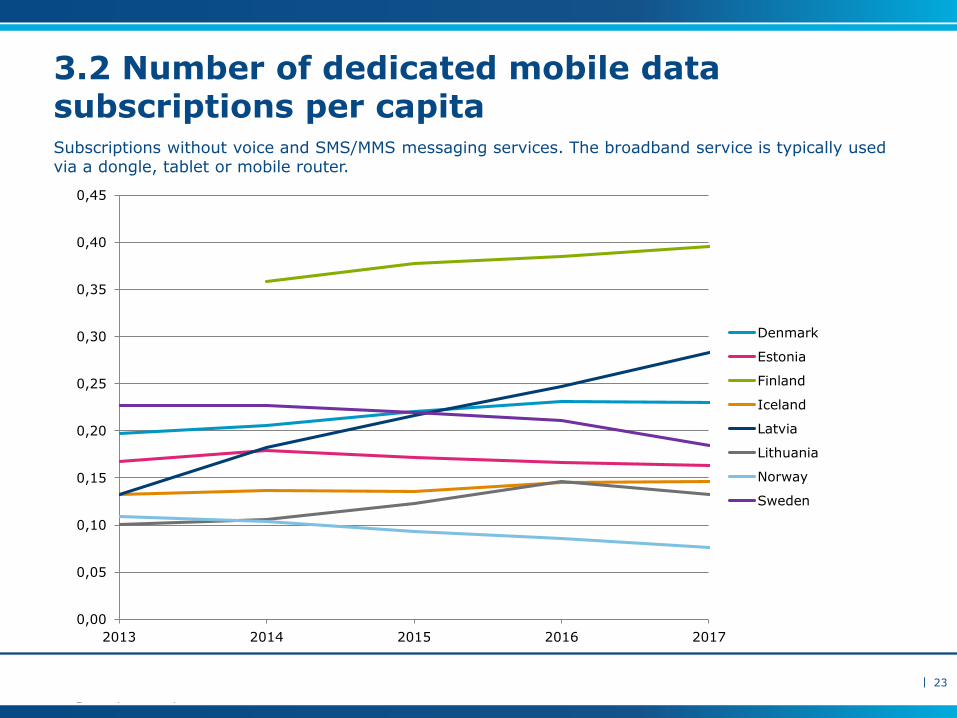
When comparing the penetration of dedicated mobile data subscriptions, Finland was well above the rest of the countries with 0,4 subscriptions per capita. Latvia had the second highest penetration at 28 percent, followed by Denmark at 0,23.
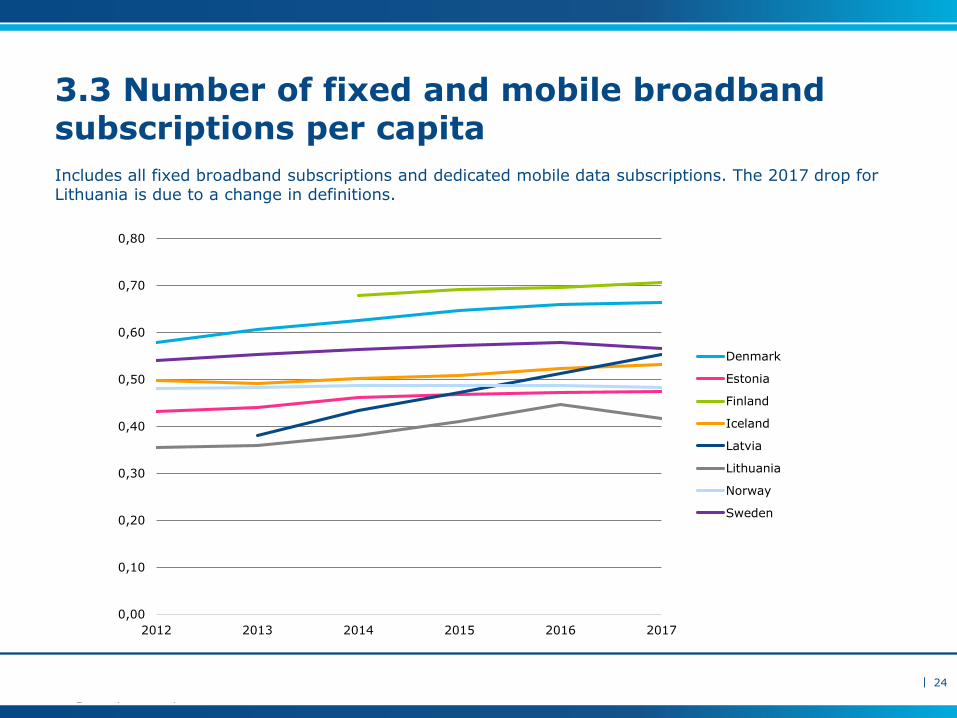
When adding dedicated mobile broadband subscriptions to fixed broadband subscriptions, Finland had a penetration rate of 0,71 subscriptions per capita, followed by Denmark with 0,66 and Sweden with 0,57 subscriptions per capita.
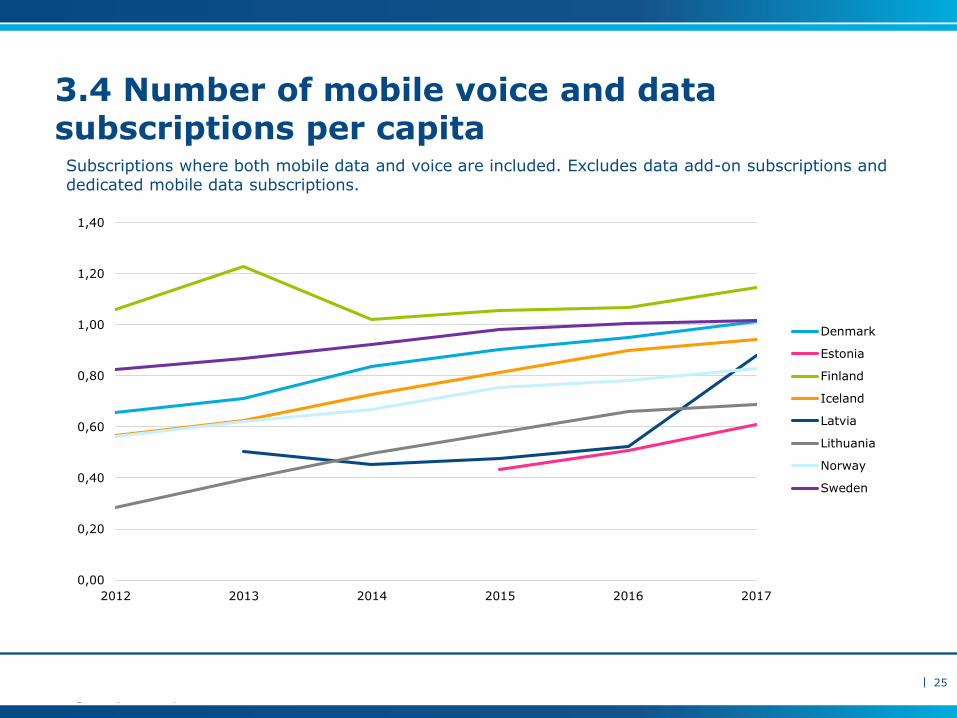
The highest penetration rate for mobile voice and data subscriptions, 1,15 per capita, was found in Finland. Denmark and Sweden had a penetration rate of around 1,0 while the other countries ranged from 0,61 to 0,94 subscriptions per capita.
19
|
Development of the fastest broadbandservices
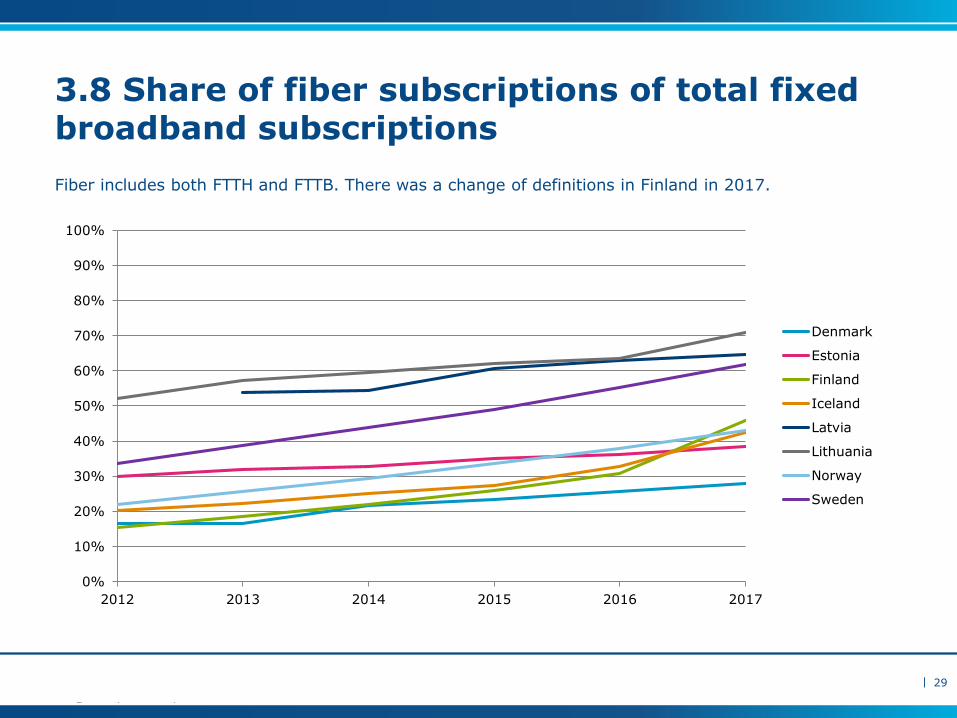
The share of fiber subscriptions of all fixed broadband subscriptions was highest in Lithuania at 71 percent followed by Latvia with 65 percent and Sweden at 62 percent in 2017.
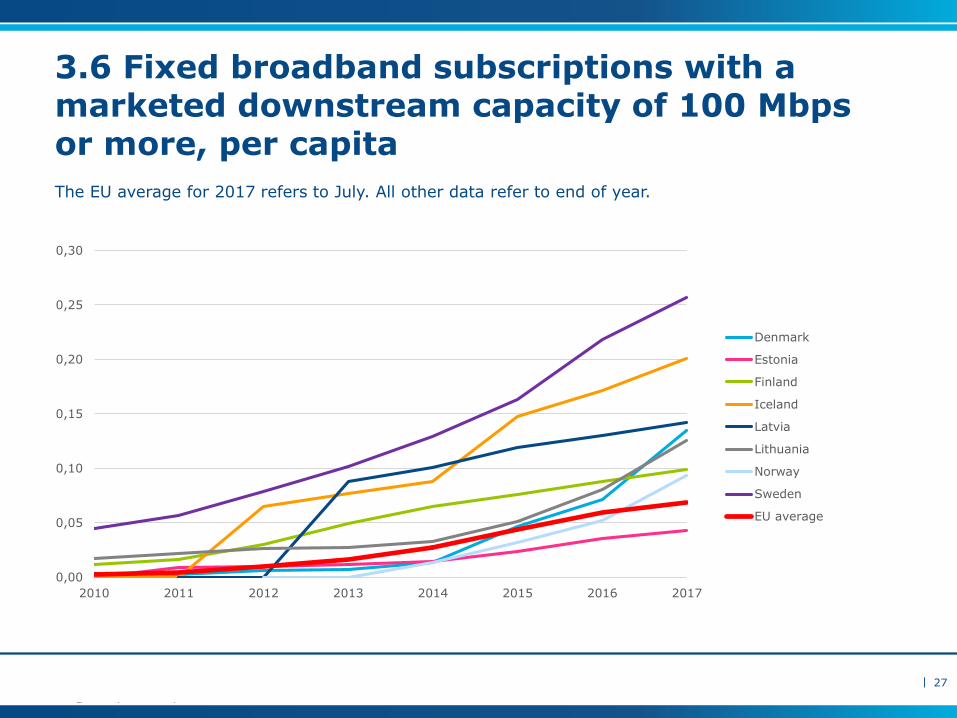
Sweden was well above the other countries in terms of broadband subscriptions with speeds of 100 Mbps or more downstream. The Swedish penetration rate for 100 Mbps or more reached 0,26 subscriptions per capita, while the second highest penetration rate (0,20) was found in Iceland. The penetration rate continued to increase in all of the countries during 2017.
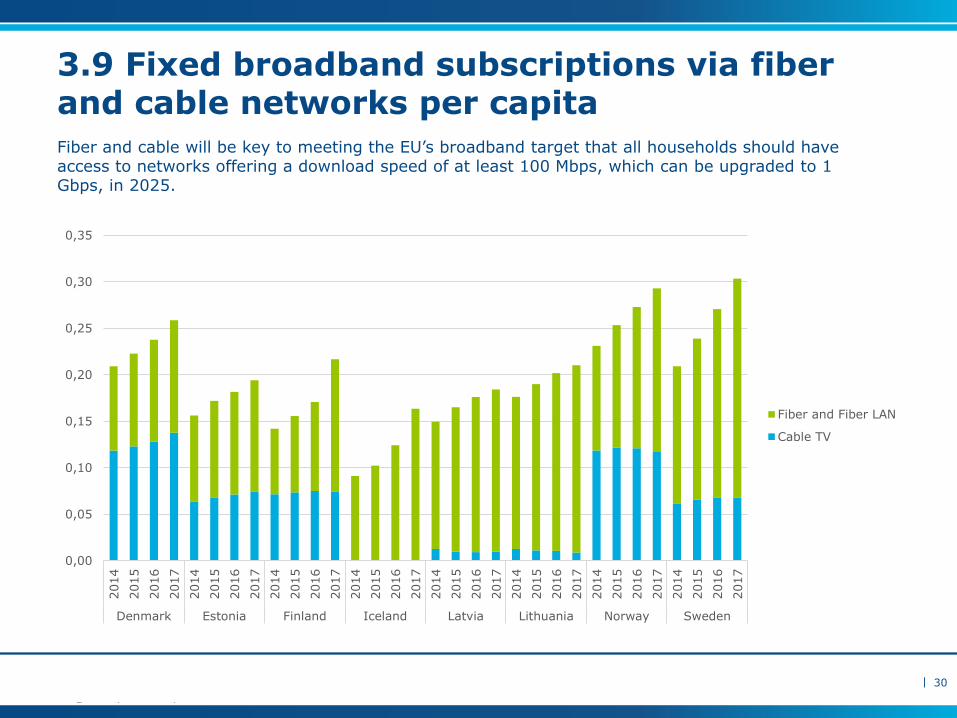
When combining fiber and cable subscriptions per capita, Sweden had the highest penetration rate, 0,31, followed by Norway with 0,29 and Denmark with 0,26 subscriptions per capita. The combined penetration rate for cable and fiber was increasing in all countries, mostly due to growth in fiber subscriptions. Iceland has no cable networks.
20
|
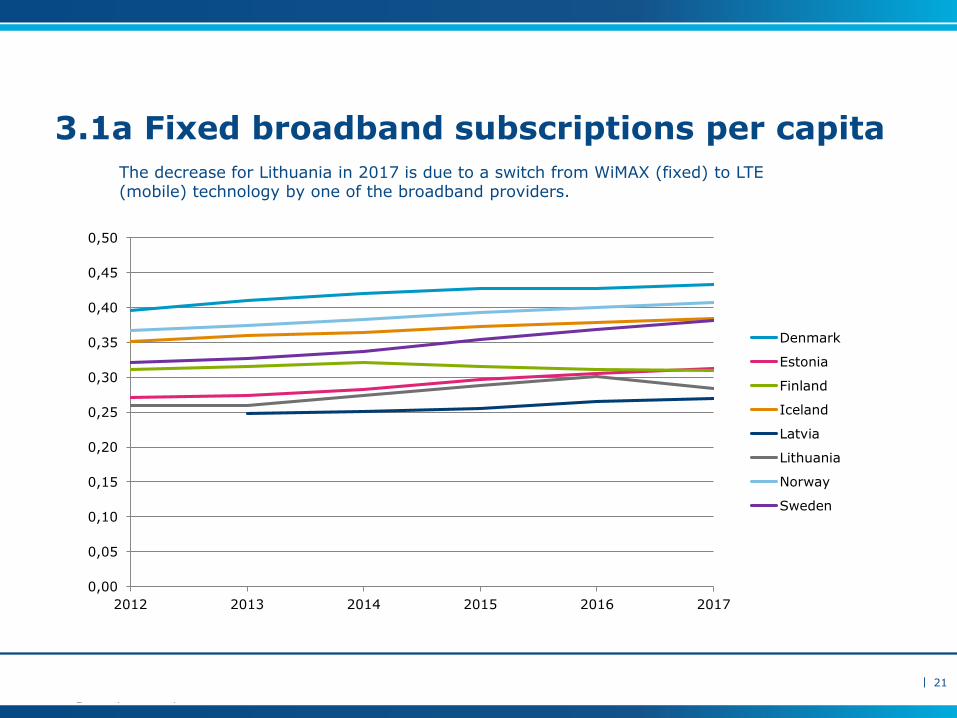
3.1a Fixed broadband subscriptions per capita
21
0,00
0,05
0,10
0,15
0,20
0,25
0,30
0,35
0,40
0,45
0,50
2012 2013 2014 2015 2016 2017
Denmark
Estonia
Finland
Iceland
Latvia
Lithuania
Norway
Sweden
The decrease for Lithuania in 2017 is due to a switch from WiMAX (fixed) to LTE (mobile) technology by one of the broadband providers.
|
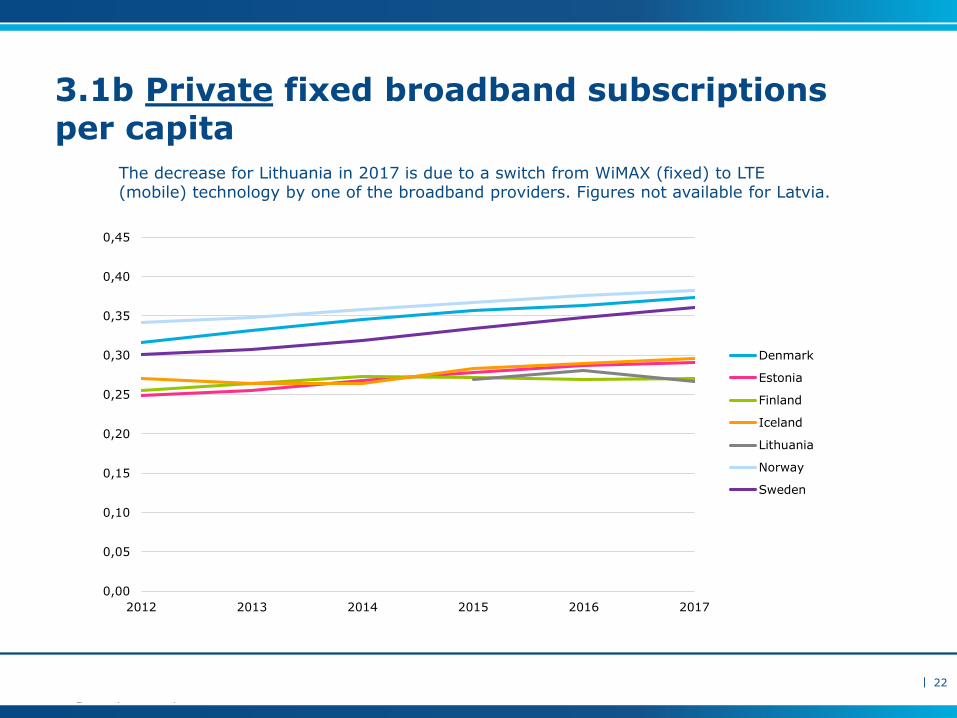
3.1b Private fixed broadband subscriptions per capita
22
The decrease for Lithuania in 2017 is due to a switch from WiMAX (fixed) to LTE(mobile) technology by one of the broadband providers. Figures not available for Latvia.
0,00
0,05
0,10
0,15
0,20
0,25
0,30
0,35
0,40
0,45
2012 2013 2014 2015 2016 2017
Denmark
Estonia
Finland
Iceland
Lithuania
Norway
Sweden
|
3.2 Number of dedicated mobile data subscriptions per capitaSubscriptions without voice and SMS/MMS messaging services. The broadband service is typically used via a dongle, tablet or mobile router.
23
0,00
0,05
0,10
0,15
0,20
0,25
0,30
0,35
0,40
0,45
2013 2014 2015 2016 2017
Denmark
Estonia
Finland
Iceland
Latvia
Lithuania
Norway
Sweden
|
3.3 Number of fixed and mobile broadband subscriptions per capita
Includes all fixed broadband subscriptions and dedicated mobile data subscriptions. The 2017 drop for Lithuania is due to a change in definitions.
24
0,00
0,10
0,20
0,30
0,40
0,50
0,60
0,70
0,80
2012 2013 2014 2015 2016 2017
Denmark
Estonia
Finland
Iceland
Latvia
Lithuania
Norway
Sweden
|
3.4 Number of mobile voice and data subscriptions per capita
Subscriptions where both mobile data and voice are included. Excludes data add-on subscriptions and dedicated mobile data subscriptions.
25
0,00
0,20
0,40
0,60
0,80
1,00
1,20
1,40
2012 2013 2014 2015 2016 2017
Denmark
Estonia
Finland
Iceland
Latvia
Lithuania
Norway
Sweden
|
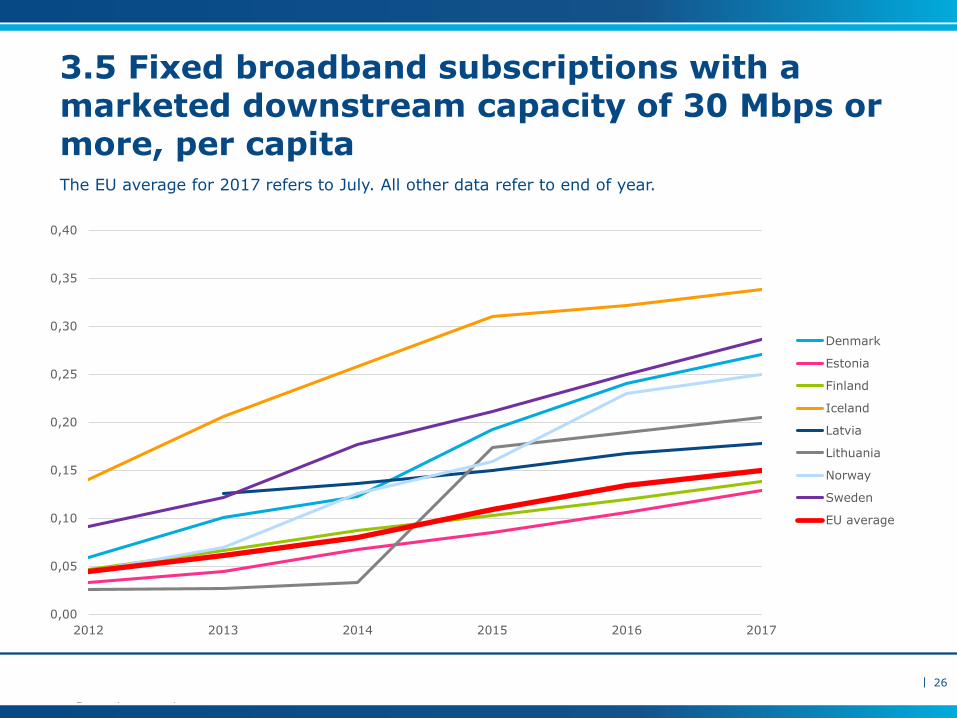
3.5 Fixed broadband subscriptions with a marketed downstream capacity of 30 Mbps or more, per capita
26
0,00
0,05
0,10
0,15
0,20
0,25
0,30
0,35
0,40
2012 2013 2014 2015 2016 2017
Denmark
Estonia
Finland
Iceland
Latvia
Lithuania
Norway
Sweden
EU average
The EU average for 2017 refers to July. All other data refer to end of year.
|
3.6 Fixed broadband subscriptions with a marketed downstream capacity of 100 Mbps or more, per capita
27
0,00
0,05
0,10
0,15
0,20
0,25
0,30
2010 2011 2012 2013 2014 2015 2016 2017
Denmark
Estonia
Finland
Iceland
Latvia
Lithuania
Norway
Sweden
EU average
The EU average for 2017 refers to July. All other data refer to end of year.
|
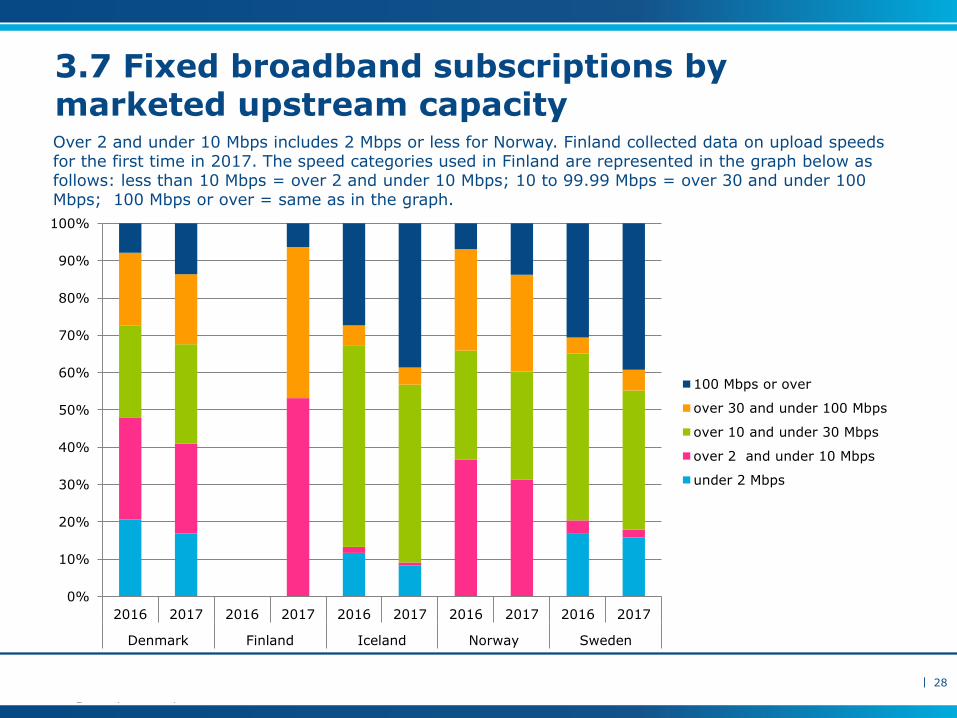
3.7 Fixed broadband subscriptions by marketed upstream capacity
28
Over 2 and under 10 Mbps includes 2 Mbps or less for Norway. Finland collected data on upload speeds for the first time in 2017. The speed categories used in Finland are represented in the graph below as follows: less than 10 Mbps = over 2 and under 10 Mbps; 10 to 99.99 Mbps = over 30 and under 100 Mbps; 100 Mbps or over = same as in the graph.
0%
10%
20%
30%
40%
50%
60%
70%
80%
90%
100%
2016 2017 2016 2017 2016 2017 2016 2017 2016 2017
Denmark Finland Iceland Norway Sweden
100 Mbps or over
over 30 and under 100 Mbps
over 10 and under 30 Mbps
over 2 and under 10 Mbps
under 2 Mbps
|
3.8 Share of fiber subscriptions of total fixed broadband subscriptions
Fiber includes both FTTH and FTTB. There was a change of definitions in Finland in 2017.
29
0%
10%
20%
30%
40%
50%
60%
70%
80%
90%
100%
2012 2013 2014 2015 2016 2017
Denmark
Estonia
Finland
Iceland
Latvia
Lithuania
Norway
Sweden
|
3.9 Fixed broadband subscriptions via fiber and cable networks per capita
30
Fiber and cable will be key to meeting the EU’s broadband target that all households should have access to networks offering a download speed of at least 100 Mbps, which can be upgraded to 1 Gbps, in 2025.
0,00
0,05
0,10
0,15
0,20
0,25
0,30
0,35
2014
2015
2016
2017
2014
2015
2016
2017
2014
2015
2016
2017
2014
2015
2016
2017
2014
2015
2016
2017
2014
2015
2016
2017
2014
2015
2016
2017
2014
2015
2016
2017
Denmark Estonia Finland Iceland Latvia Lithuania Norway Sweden
Fiber and Fiber LAN
Cable TV
4. TV services
31
|
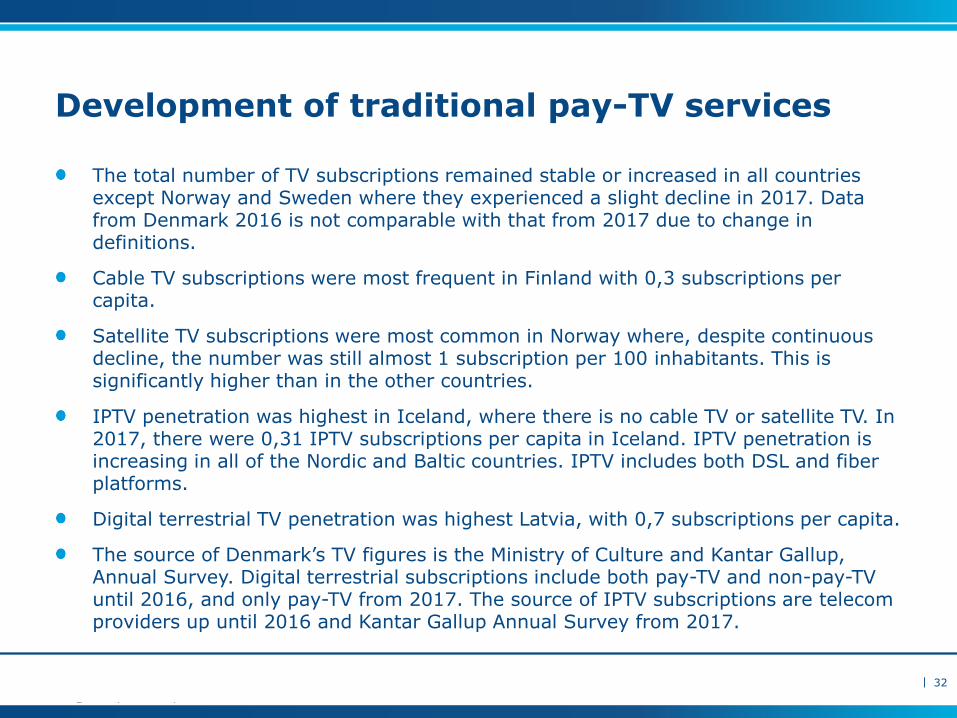
Development of traditional pay-TV services
The total number of TV subscriptions remained stable or increased in all countries except Norway and Sweden where they experienced a slight decline in 2017. Data from Denmark 2016 is not comparable with that from 2017 due to change in definitions.
Cable TV subscriptions were most frequent in Finland with 0,3 subscriptions per capita.
Satellite TV subscriptions were most common in Norway where, despite continuous decline, the number was still almost 1 subscription per 100 inhabitants. This is significantly higher than in the other countries.
IPTV penetration was highest in Iceland, where there is no cable TV or satellite TV. In 2017, there were 0,31 IPTV subscriptions per capita in Iceland. IPTV penetration is increasing in all of the Nordic and Baltic countries. IPTV includes both DSL and fiber platforms.
Digital terrestrial TV penetration was highest Latvia, with 0,7 subscriptions per capita.
The source of Denmark’s TV figures is the Ministry of Culture and Kantar Gallup, Annual Survey. Digital terrestrial subscriptions include both pay-TV and non-pay-TV until 2016, and only pay-TV from 2017. The source of IPTV subscriptions are telecom providers up until 2016 and Kantar Gallup Annual Survey from 2017.
32
|
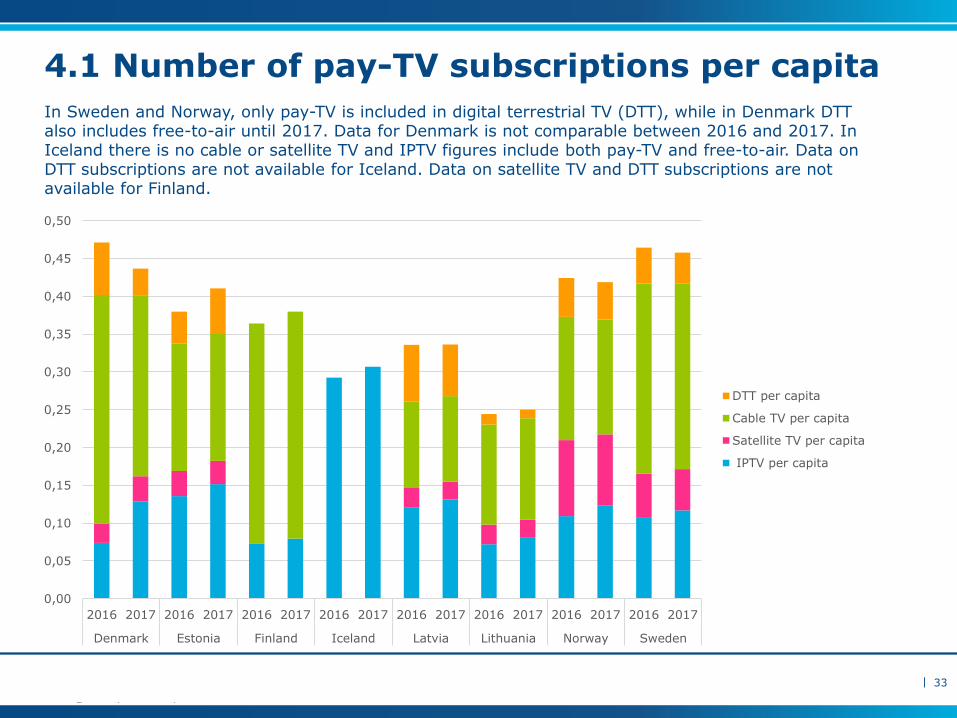
4.1 Number of pay-TV subscriptions per capita
In Sweden and Norway, only pay-TV is included in digital terrestrial TV (DTT), while in Denmark DTT also includes free-to-air until 2017. Data for Denmark is not comparable between 2016 and 2017. In Iceland there is no cable or satellite TV and IPTV figures include both pay-TV and free-to-air. Data on DTT subscriptions are not available for Iceland. Data on satellite TV and DTT subscriptions are not available for Finland.
33
0,00
0,05
0,10
0,15
0,20
0,25
0,30
0,35
0,40
0,45
0,50
2016 2017 2016 2017 2016 2017 2016 2017 2016 2017 2016 2017 2016 2017 2016 2017
Denmark Estonia Finland Iceland Latvia Lithuania Norway Sweden
DTT per capita
Cable TV per capita
Satellite TV per capita
IPTV per capita
5. Market shares
34
|
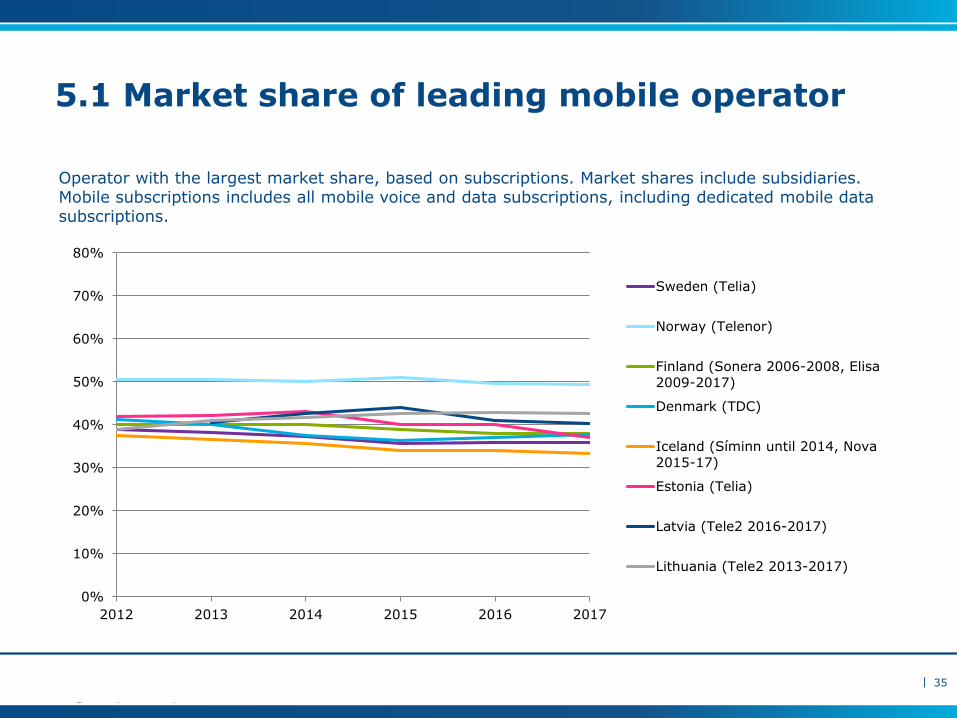
5.1 Market share of leading mobile operator
Operator with the largest market share, based on subscriptions. Market shares include subsidiaries. Mobile subscriptions includes all mobile voice and data subscriptions, including dedicated mobile data subscriptions.
35
0%
10%
20%
30%
40%
50%
60%
70%
80%
2012 2013 2014 2015 2016 2017
Sweden (Telia)
Norway (Telenor)
Finland (Sonera 2006-2008, Elisa
2009-2017)
Denmark (TDC)
Iceland (Síminn until 2014, Nova
2015-17)
Estonia (Telia)
Latvia (Tele2 2016-2017)
Lithuania (Tele2 2013-2017)
|
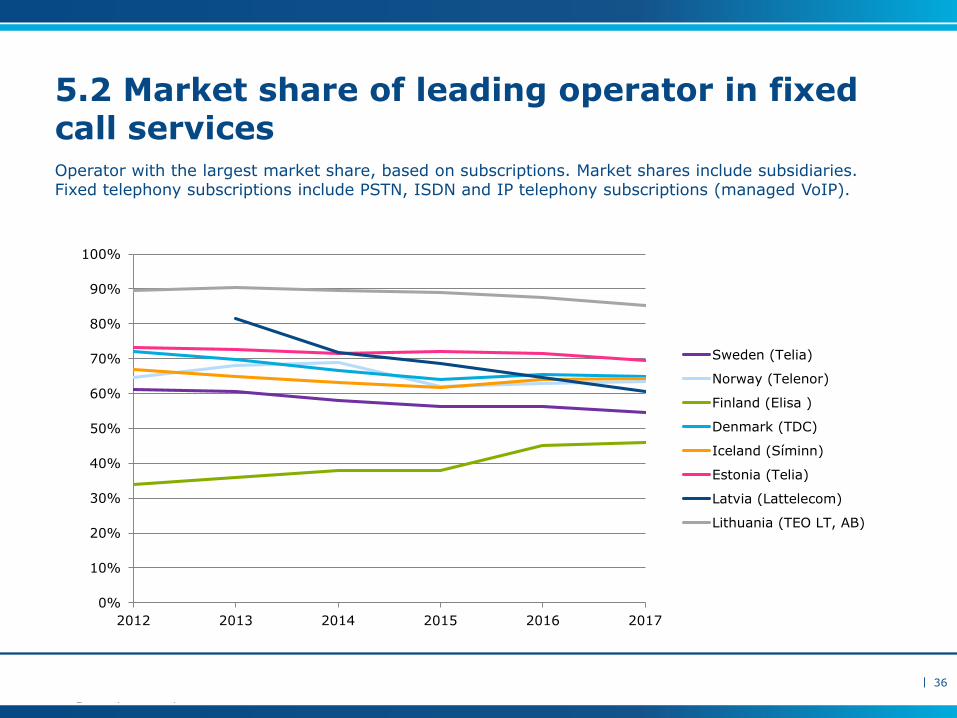
5.2 Market share of leading operator in fixed call servicesOperator with the largest market share, based on subscriptions. Market shares include subsidiaries. Fixed telephony subscriptions include PSTN, ISDN and IP telephony subscriptions (managed VoIP).
36
0%
10%
20%
30%
40%
50%
60%
70%
80%
90%
100%
2012 2013 2014 2015 2016 2017
Sweden (Telia)
Norway (Telenor)
Finland (Elisa )
Denmark (TDC)
Iceland (Síminn)
Estonia (Telia)
Latvia (Lattelecom)
Lithuania (TEO LT, AB)
|
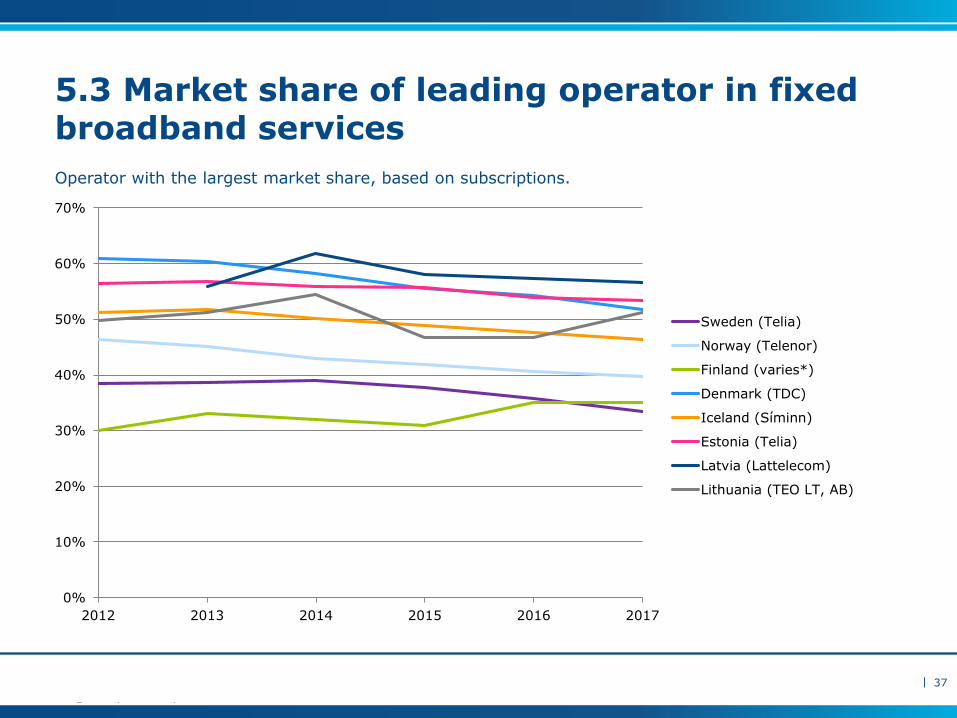
5.3 Market share of leading operator in fixed broadband services
Operator with the largest market share, based on subscriptions.
37
0%
10%
20%
30%
40%
50%
60%
70%
2012 2013 2014 2015 2016 2017
Sweden (Telia)
Norway (Telenor)
Finland (varies*)
Denmark (TDC)
Iceland (Síminn)
Estonia (Telia)
Latvia (Lattelecom)
Lithuania (TEO LT, AB)

6. Investments and revenues
38
|
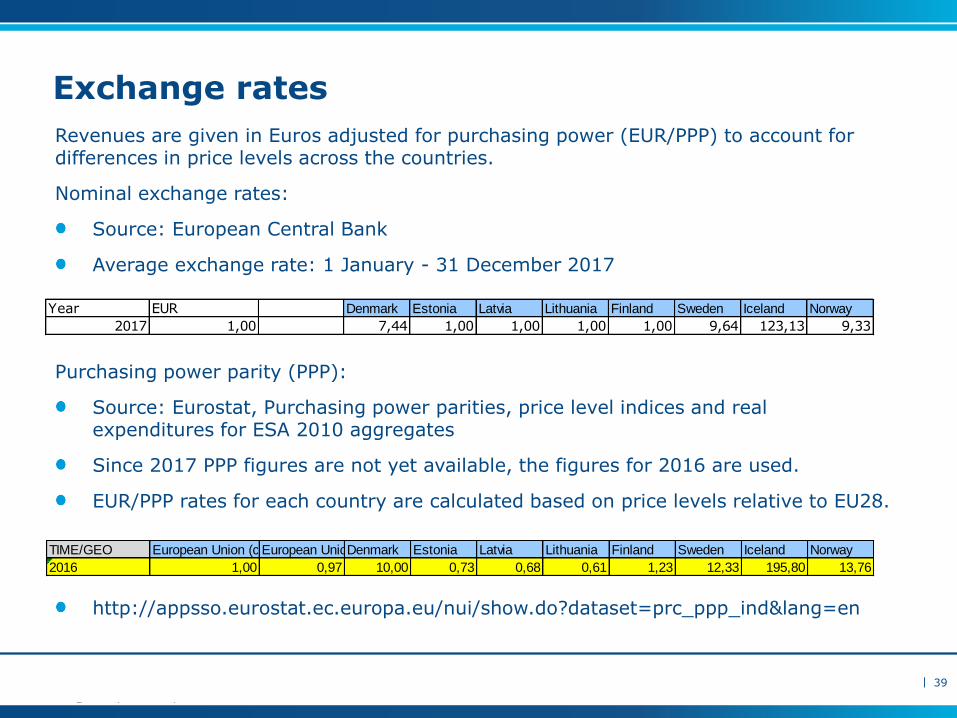
Exchange rates
Revenues are given in Euros adjusted for purchasing power (EUR/PPP) to account for differences in price levels across the countries.
Nominal exchange rates:
Source: European Central Bank
Average exchange rate: 1 January - 31 December 2017
Purchasing power parity (PPP):
Source: Eurostat, Purchasing power parities, price level indices and real expenditures for ESA 2010 aggregates
Since 2017 PPP figures are not yet available, the figures for 2016 are used.
EUR/PPP rates for each country are calculated based on price levels relative to EU28.
http://appsso.eurostat.ec.europa.eu/nui/show.do?dataset=prc_ppp_ind&lang=en
39
Year EUR Denmark Estonia Latvia Lithuania Finland Sweden Iceland Norway
2017 1,00 7,44 1,00 1,00 1,00 1,00 9,64 123,13 9,33
TIME/GEO European Union (current composition)European Union (without United Kingdom)Denmark Estonia Latvia Lithuania Finland Sweden Iceland Norway
2016 1,00 0,97 10,00 0,73 0,68 0,61 1,23 12,33 195,80 13,76
|
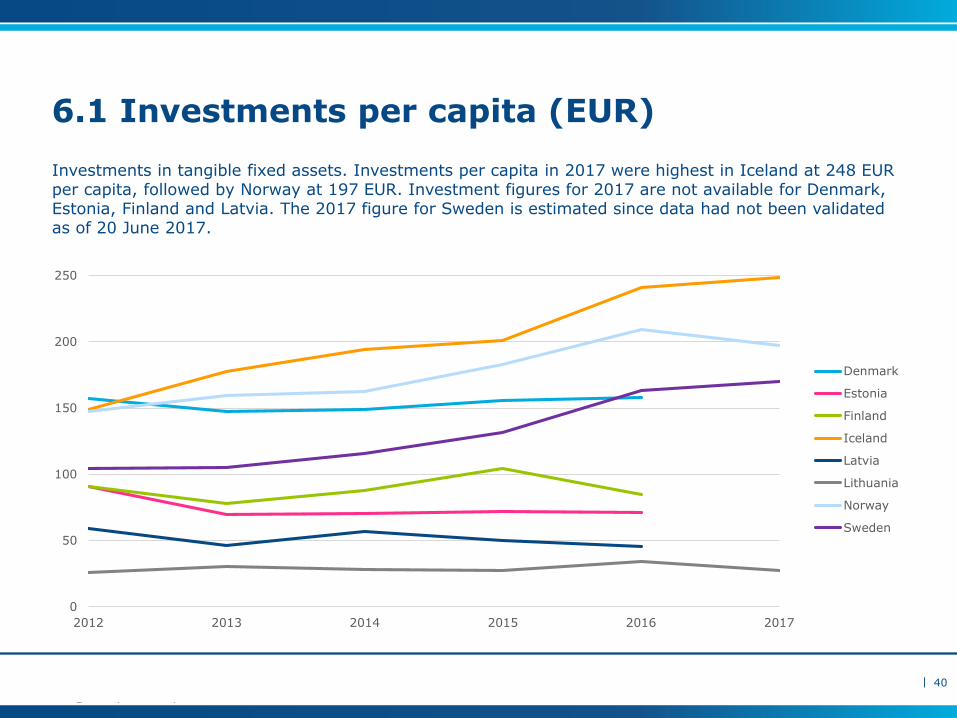
6.1 Investments per capita (EUR)
40
Investments in tangible fixed assets. Investments per capita in 2017 were highest in Iceland at 248 EUR per capita, followed by Norway at 197 EUR. Investment figures for 2017 are not available for Denmark, Estonia, Finland and Latvia. The 2017 figure for Sweden is estimated since data had not been validated as of 20 June 2017.
0
50
100
150
200
250
2012 2013 2014 2015 2016 2017
Denmark
Estonia
Finland
Iceland
Latvia
Lithuania
Norway
Sweden
|
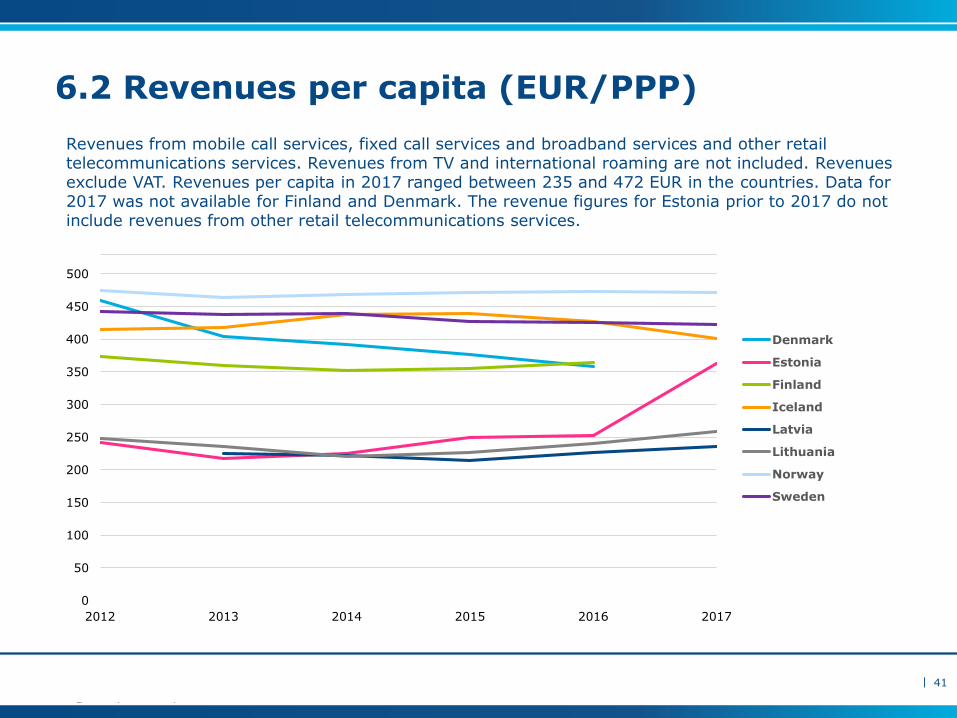
6.2 Revenues per capita (EUR/PPP)
41
Revenues from mobile call services, fixed call services and broadband services and other retail telecommunications services. Revenues from TV and international roaming are not included. Revenues exclude VAT. Revenues per capita in 2017 ranged between 235 and 472 EUR in the countries. Data for 2017 was not available for Finland and Denmark. The revenue figures for Estonia prior to 2017 do not include revenues from other retail telecommunications services.
0
50
100
150
200
250
300
350
400
450
500
2012 2013 2014 2015 2016 2017
Denmark
Estonia
Finland
Iceland
Latvia
Lithuania
Norway
Sweden
7. Broadband coverage
42
|
Definitions of broadband coverage
In this publication, broadband coverage refers the proportion of households(permanent dwellings) who can get broadband access with certain characteristics.
This includes households with physical broadband access (“homes connected”). It also includes households without physical broadband access that can order a broadband connection and get it installed by a broadband provider under certain, reasonable conditions (“homes passed”). Hence, the definition of broadband coverage in this publication aims to provide a measure of the total availability of broadband.
The figures for Iceland refers only to the proportion of households with physical broadband access (“homes connected”). Data for Latvia and Lithuania are not available.
The calculation of broadband coverage is based on data from broadband providers in each country.
Data for each country has been collected at different times in 2017 and published in the autumn of 2017 to spring 2018.
Methods and definitions vary to some extent between the countries. Numbers that are close to each other should therefore not be interpreted as significant differences in coverage.
43
|
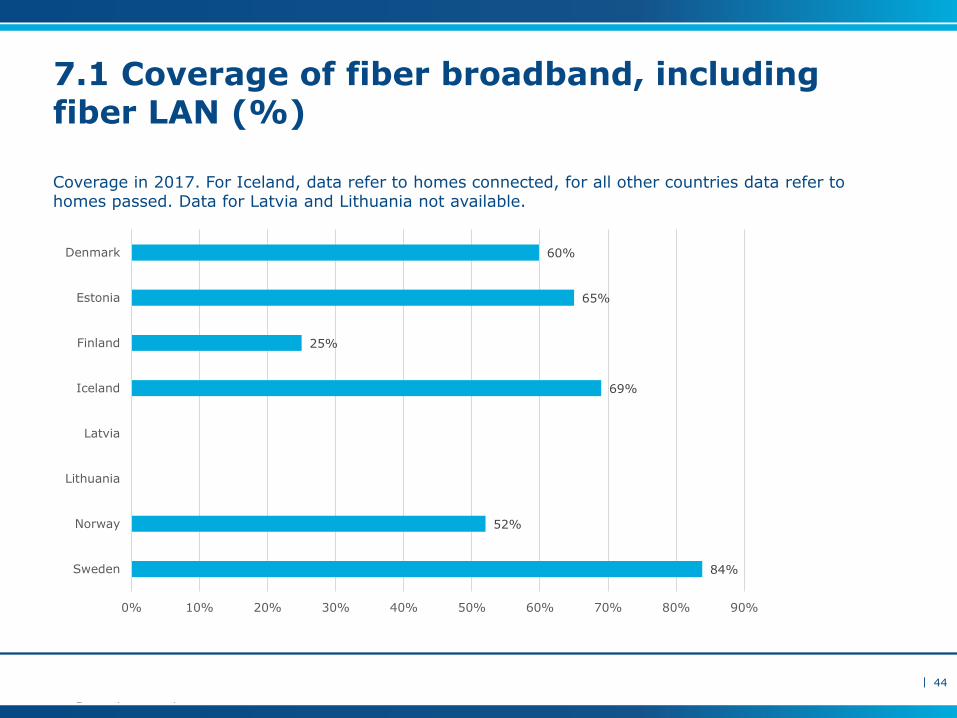
7.1 Coverage of fiber broadband, including fiber LAN (%)
44
Coverage in 2017. For Iceland, data refer to homes connected, for all other countries data refer to homes passed. Data for Latvia and Lithuania not available.
84%
52%
69%
25%
65%
60%
0% 10% 20% 30% 40% 50% 60% 70% 80% 90%
Sweden
Norway
Lithuania
Latvia
Iceland
Finland
Estonia
Denmark
|
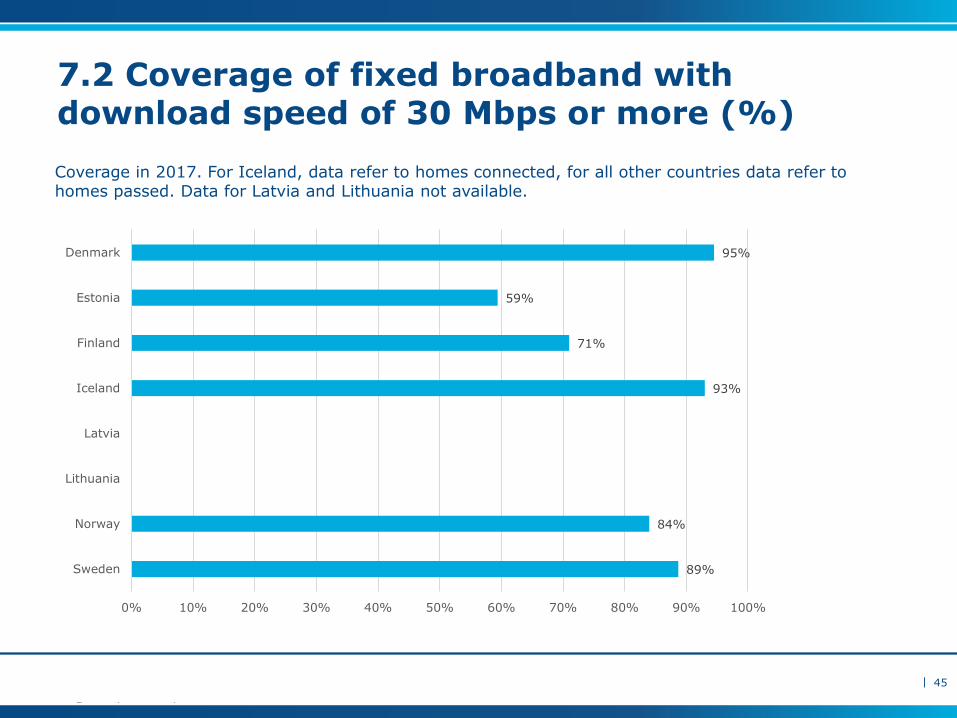
7.2 Coverage of fixed broadband with download speed of 30 Mbps or more (%)
45
Coverage in 2017. For Iceland, data refer to homes connected, for all other countries data refer to homes passed. Data for Latvia and Lithuania not available.
89%
84%
93%
71%
59%
95%
0% 10% 20% 30% 40% 50% 60% 70% 80% 90% 100%
Sweden
Norway
Lithuania
Latvia
Iceland
Finland
Estonia
Denmark
|
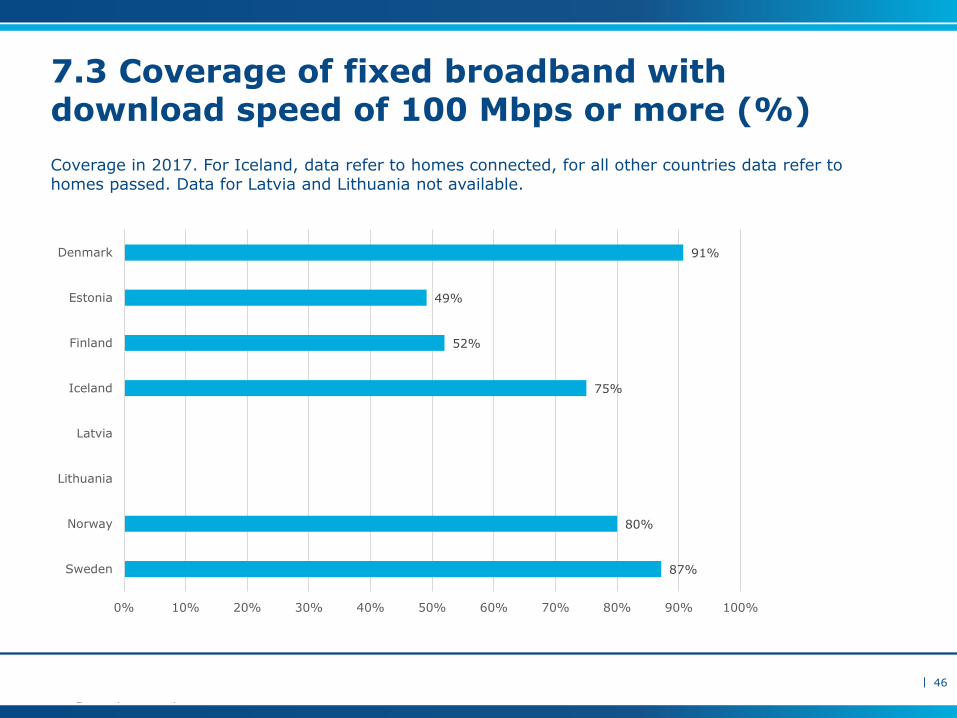
7.3 Coverage of fixed broadband with download speed of 100 Mbps or more (%)
46
Coverage in 2017. For Iceland, data refer to homes connected, for all other countries data refer to homes passed. Data for Latvia and Lithuania not available.
87%
80%
75%
52%
49%
91%
0% 10% 20% 30% 40% 50% 60% 70% 80% 90% 100%
Sweden
Norway
Lithuania
Latvia
Iceland
Finland
Estonia
Denmark