Embed Size (px)
Citation preview

Telecom Regulatory and Policy Environment
in the Philippines:
Results and Analysis of the 2008 TRE Survey
Erwin A. Alampay Associate Professor
National College of Public Administration and Governance University of the Philippines

Table of Contents
Summary ....................................................................................................................................................... 4 Development of the Regulatory and Policy Environment ............................................................................ 4
Pre‐Reform Environment in the Philippines ............................................................................................. 4 Post‐Reform Environment in the Philippines............................................................................................ 5
Telecommunications Regulatory Environment (TRE) ................................................................................... 8 1. Market Entry ......................................................................................................................................... 8
1.1 Market Entry ‐ Mobile..................................................................................................................... 9 1.2 Market Entry – Fixed.....................................................................................................................10 1.3 Market Entry – Broadband............................................................................................................10
2. Access to Scarce Resources.................................................................................................................11 3. Interconnection...................................................................................................................................13 4. Tariff Regulation..................................................................................................................................16 5. Regulation of anti‐competitive practices............................................................................................20 6. Universal Service Obligations..............................................................................................................22 7. Quality of Service ................................................................................................................................24
Conclusions and Recommendations ...........................................................................................................26 Methodology...............................................................................................................................................28 Acknowledgements.....................................................................................................................................29 Annex 1: Summary of Regulatory Events for the Philippines ....................................................................30 Annex 2: References ...................................................................................................................................32

List of Figures and Tables
Figure 1: Policy, technology & access timeline ............................................................................................. 5 Table 1: Regional Teledensity Across the Philippines (as of December 2005) ............................................. 6 Table 2: No. of Internet Subscribers and Registered ISPs (2001‐06) ............................................................ 7 Figure 2: TRE Market Entry perceptions (2006 and 2008)............................................................................ 8 Table 3: Market Share among mobile providers (2007) ............................................................................... 9 Table 4: Market Share among fixed phone providers ................................................................................10 Figure 3: TRE Access to scarce resources perceptions (2006 and 2008) ....................................................12 Figure 4: TRE Interconnection (2006 and 2008) .........................................................................................13 Figure 5: TRE Tarrifs (2006 and 2008).........................................................................................................17 Table 5: Mobile Service Rates for Pre‐paid Users.......................................................................................18 Figure 6: TRE Anti‐competitive practices (2006 and 2008) ........................................................................20 Figure 7: TRE Universal Service Obligation (2006 and 2008)......................................................................23 Table 6: Provision of Broadband Connectivity‐ Number of Public Access Points.......................................24 Figure 8: TRE Quality of Services (2008) .....................................................................................................25 Figure 9: TRE 2008 Summary Results..........................................................................................................26 Table 7 : Composition of respondents by category and assigned weights.................................................28
Summary
The TRE survey was conducted from May 17 to July 7, 2008. Sixty-six (66) respondents comprised the three different stakeholder groups who participated in the study. Each group had at least 16 respondents who answered the survey.
Compared with the TRE in 2006 there were mixed results across the same dimensions surveyed in 2008. There are some dimensions that improved, and some that declined. Those that increased were perceptions about Universal Service Obligations, Regulation of anti-competitive practices and TRE for interconnection in the mobile sector in particular. Among those perceptions that declined were the TREs for Market Entry and Access to Scarce Resources. There was no change in perceptions on tariff regulation, which may be due to perceptions that declining tariffs are attributable more to market forces due to competition in both mobile and fixed lines, rather than direct rate regulations imposed by the state.
The broadband sector which was made part of the 2008 TRE had no comparative rating in 2006. However, on average, the scores obtained for broadband TRE was lower than the scores obtained for both mobiles and fixed line telephones. This suggests that informed stakeholders perceive that regulators have not been focusing on this sector as much as it has with voice services.
CDMA phones, also known as ‘wireless fixed line’ are considered part of the fixed line telephones. A seventh dimension, involving quality of service was introduced in the 2008 TRE. It is in this dimension that the mobile sector scored the highest, which implies (given how competition in the mobile sector is most intense) that competition can help spur improvement in services.
Development of the Regulatory and Policy Environment
Pre-Reform Environment in the Philippines Unlike many countries in the world, telecommunications services in the Philippines had
historically been provided by a private company, the Philippine Long Distance Telephone Company (PLDT). The PLDT was initially private and foreign-owned, and had the sole authority to operate a national communications network under government regulation. In 1967, Filipino businessmen with strong political ties took over its ownership. Over the years it consolidated its monopoly on the industry while having little incentive to expand its network and improve services (Salazar 2007). During those years, however, it was complemented by a government backbone that provided limited services to underserved regions in the country (Mendes, et. al 2007). This was the situation until the early 1990s.
In 1990, the government’s National Telecommunications Development Plan (1990-2010) sought to divest the state of its role in the delivery of telecommunications services through privatization and encouraging more competition. At the same time, however, the plan was for government to continue facilitating official development assistance (ODA) for telecom projects in underserved and economically unviable areas (Abrenica 2000:150).
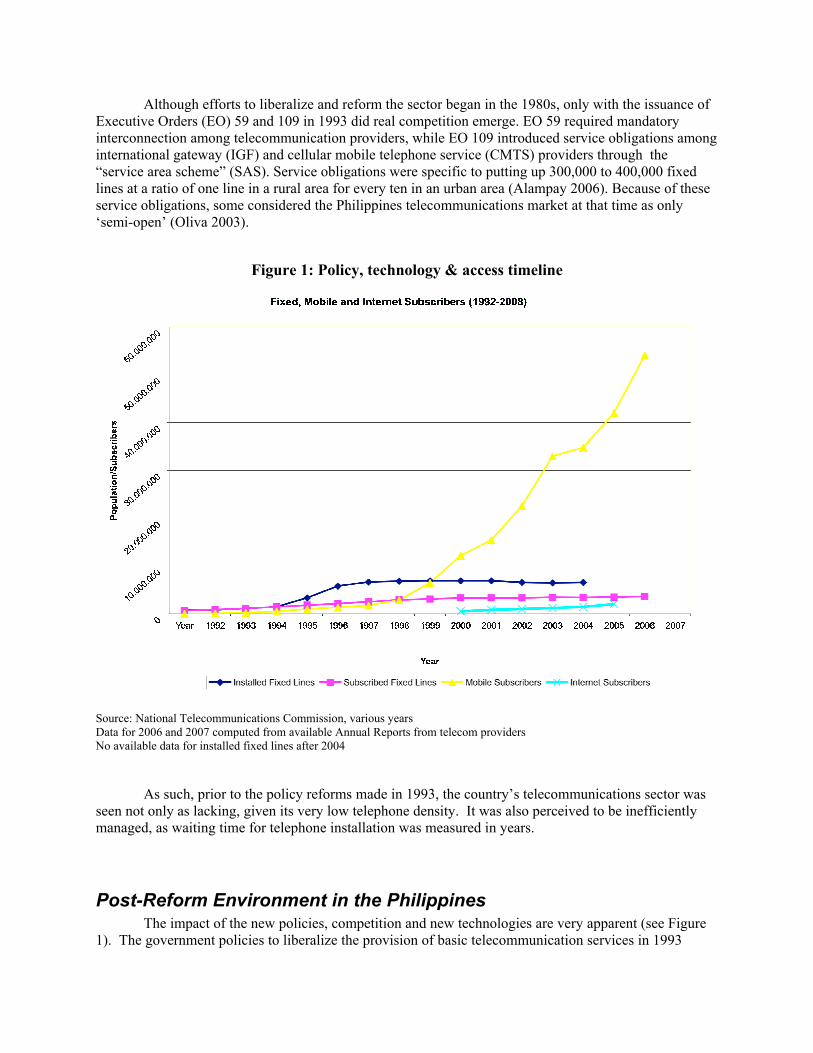
Although efforts to liberalize and reform the sector began in the 1980s, only with the issuance of Executive Orders (EO) 59 and 109 in 1993 did real competition emerge. EO 59 required mandatory interconnection among telecommunication providers, while EO 109 introduced service obligations among international gateway (IGF) and cellular mobile telephone service (CMTS) providers through the “service area scheme” (SAS). Service obligations were specific to putting up 300,000 to 400,000 fixed lines at a ratio of one line in a rural area for every ten in an urban area (Alampay 2006). Because of these service obligations, some considered the Philippines telecommunications market at that time as only ‘semi-open’ (Oliva 2003).
Figure 1: Policy, technology & access timeline
Source: National Telecommunications Commission, various years Data for 2006 and 2007 computed from available Annual Reports from telecom providers No available data for installed fixed lines after 2004
As such, prior to the policy reforms made in 1993, the country’s telecommunications sector was seen not only as lacking, given its very low telephone density. It was also perceived to be inefficiently managed, as waiting time for telephone installation was measured in years.
Post-Reform Environment in the Philippines The impact of the new policies, competition and new technologies are very apparent (see Figure
1). The government policies to liberalize the provision of basic telecommunication services in 1993
coupled with technological advances since then have contributed to the rapid expansion of ICT services in the Philippines.
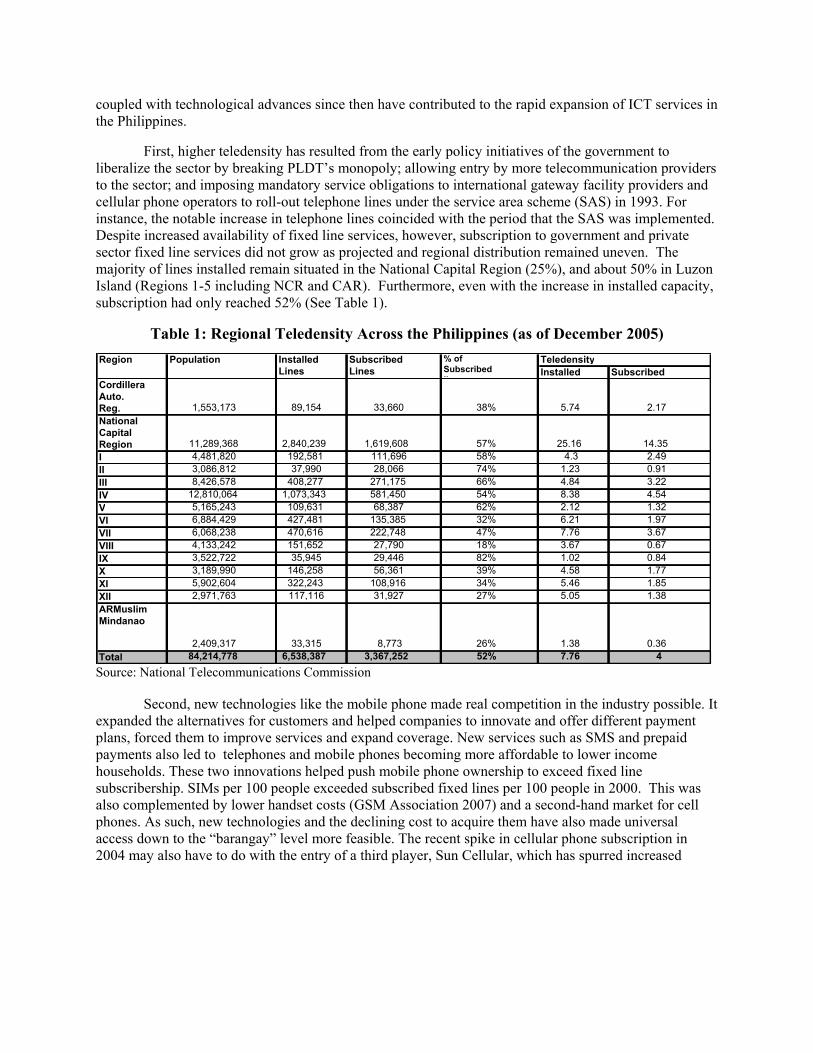
First, higher teledensity has resulted from the early policy initiatives of the government to liberalize the sector by breaking PLDT’s monopoly; allowing entry by more telecommunication providers to the sector; and imposing mandatory service obligations to international gateway facility providers and cellular phone operators to roll-out telephone lines under the service area scheme (SAS) in 1993. For instance, the notable increase in telephone lines coincided with the period that the SAS was implemented. Despite increased availability of fixed line services, however, subscription to government and private sector fixed line services did not grow as projected and regional distribution remained uneven. The majority of lines installed remain situated in the National Capital Region (25%), and about 50% in Luzon Island (Regions 1-5 including NCR and CAR). Furthermore, even with the increase in installed capacity, subscription had only reached 52% (See Table 1).
Table 1: Regional Teledensity Across the Philippines (as of December 2005)
Source: National Telecommunications Commission
Second, new technologies like the mobile phone made real competition in the industry possible. It expanded the alternatives for customers and helped companies to innovate and offer different payment plans, forced them to improve services and expand coverage. New services such as SMS and prepaid payments also led to telephones and mobile phones becoming more affordable to lower income households. These two innovations helped push mobile phone ownership to exceed fixed line subscribership. SIMs per 100 people exceeded subscribed fixed lines per 100 people in 2000. This was also complemented by lower handset costs (GSM Association 2007) and a second-hand market for cell phones. As such, new technologies and the declining cost to acquire them have also made universal access down to the “barangay” level more feasible. The recent spike in cellular phone subscription in 2004 may also have to do with the entry of a third player, Sun Cellular, which has spurred increased
Installed SubscribedCordilleraAuto. Reg. 1,553,173 89,154 33,660 38% 5.74 2.17National Capital Region 11,289,368 2,840,239 1,619,608 57% 25.16 14.35I 4,481,820 192,581 111,696 58% 4.3 2.49II 3,086,812 37,990 28,066 74% 1.23 0.91III 8,426,578 408,277 271,175 66% 4.84 3.22IV 12,810,064 1,073,343 581,450 54% 8.38 4.54V 5,165,243 109,631 68,387 62% 2.12 1.32VI 6,884,429 427,481 135,385 32% 6.21 1.97VII 6,068,238 470,616 222,748 47% 7.76 3.67VIII 4,133,242 151,652 27,790 18% 3.67 0.67IX 3,522,722 35,945 29,446 82% 1.02 0.84X 3,189,990 146,258 56,361 39% 4.58 1.77XI 5,902,604 322,243 108,916 34% 5.46 1.85XII 2,971,763 117,116 31,927 27% 5.05 1.38ARMuslim Mindanao
2,409,317 33,315 8,773 26% 1.38 0.36Total 84,214,778 6,538,387 3,367,252 52% 7.76 4
% of Subscribed li
TeledensityRegion Population Installed Lines
Subscribed Lines
competition for the lower segment of the market. Sun has offered very competitive pricing, including unlimited calls and unlimited texts for subscribers using it within its network for a fixed rate.1
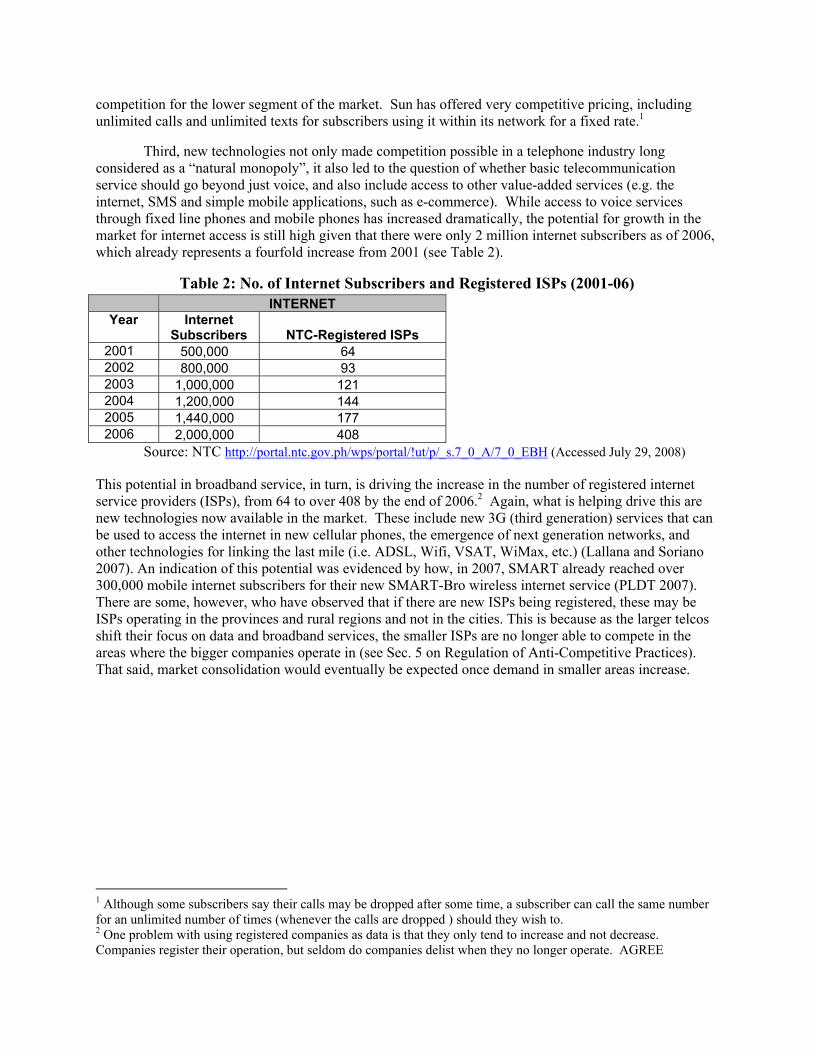
Third, new technologies not only made competition possible in a telephone industry long considered as a “natural monopoly”, it also led to the question of whether basic telecommunication service should go beyond just voice, and also include access to other value-added services (e.g. the internet, SMS and simple mobile applications, such as e-commerce). While access to voice services through fixed line phones and mobile phones has increased dramatically, the potential for growth in the market for internet access is still high given that there were only 2 million internet subscribers as of 2006, which already represents a fourfold increase from 2001 (see Table 2).
Table 2: No. of Internet Subscribers and Registered ISPs (2001-06) INTERNET
Year Internet Subscribers NTC-Registered ISPs
2001 500,000 64 2002 800,000 93 2003 1,000,000 121 2004 1,200,000 144 2005 1,440,000 177 2006 2,000,000 408
Source: NTC http://portal.ntc.gov.ph/wps/portal/!ut/p/_s.7_0_A/7_0_EBH (Accessed July 29, 2008)
This potential in broadband service, in turn, is driving the increase in the number of registered internet service providers (ISPs), from 64 to over 408 by the end of 2006.2 Again, what is helping drive this are new technologies now available in the market. These include new 3G (third generation) services that can be used to access the internet in new cellular phones, the emergence of next generation networks, and other technologies for linking the last mile (i.e. ADSL, Wifi, VSAT, WiMax, etc.) (Lallana and Soriano 2007). An indication of this potential was evidenced by how, in 2007, SMART already reached over 300,000 mobile internet subscribers for their new SMART-Bro wireless internet service (PLDT 2007). There are some, however, who have observed that if there are new ISPs being registered, these may be ISPs operating in the provinces and rural regions and not in the cities. This is because as the larger telcos shift their focus on data and broadband services, the smaller ISPs are no longer able to compete in the areas where the bigger companies operate in (see Sec. 5 on Regulation of Anti-Competitive Practices). That said, market consolidation would eventually be expected once demand in smaller areas increase.
1 Although some subscribers say their calls may be dropped after some time, a subscriber can call the same number for an unlimited number of times (whenever the calls are dropped ) should they wish to. 2 One problem with using registered companies as data is that they only tend to increase and not decrease. Companies register their operation, but seldom do companies delist when they no longer operate. AGREE
Telecommunications Regulatory Environment (TRE)
1. Market Entry
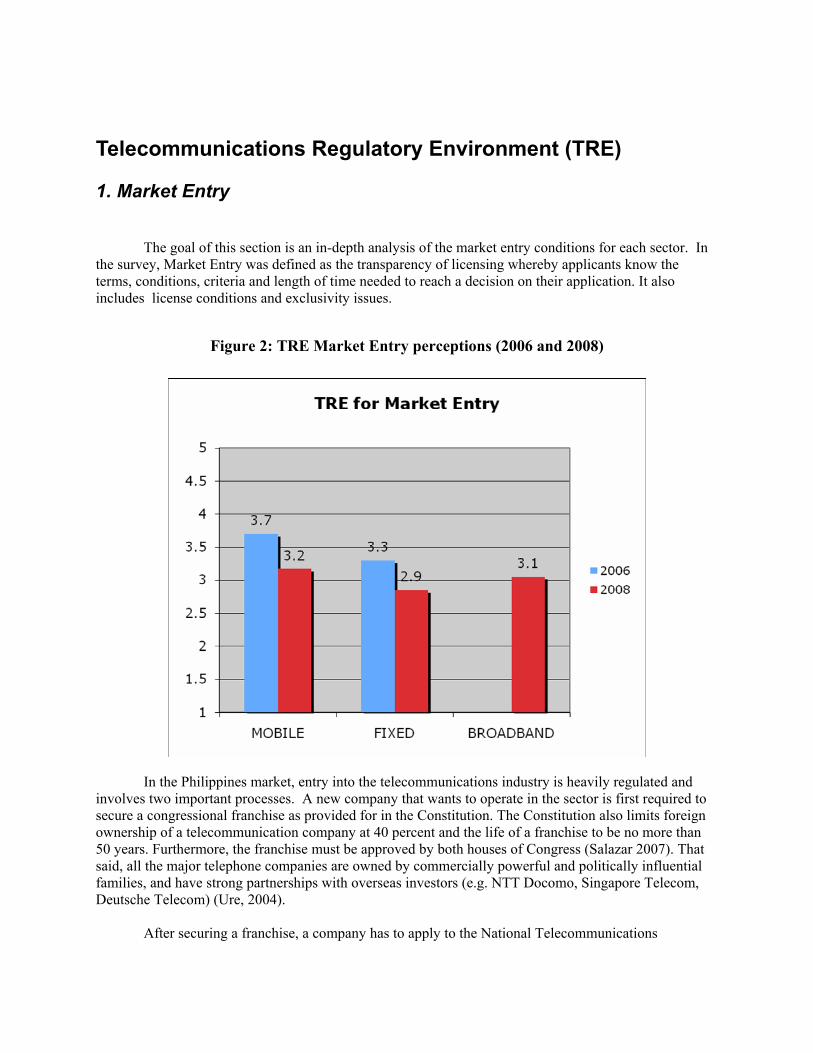
The goal of this section is an in-depth analysis of the market entry conditions for each sector. In the survey, Market Entry was defined as the transparency of licensing whereby applicants know the terms, conditions, criteria and length of time needed to reach a decision on their application. It also includes license conditions and exclusivity issues.
Figure 2: TRE Market Entry perceptions (2006 and 2008)
In the Philippines market, entry into the telecommunications industry is heavily regulated and involves two important processes. A new company that wants to operate in the sector is first required to secure a congressional franchise as provided for in the Constitution. The Constitution also limits foreign ownership of a telecommunication company at 40 percent and the life of a franchise to be no more than 50 years. Furthermore, the franchise must be approved by both houses of Congress (Salazar 2007). That said, all the major telephone companies are owned by commercially powerful and politically influential families, and have strong partnerships with overseas investors (e.g. NTT Docomo, Singapore Telecom, Deutsche Telecom) (Ure, 2004).
After securing a franchise, a company has to apply to the National Telecommunications
Commission (NTC) for a Certificate of Public Convenience and Necessity (CPCN) for the type of service that it wants to offer. Through the CPCN, the NTC assigns the area of operation, determines the allowable rate that could be charged for a service, and manages the allocation of radio spectrum or frequency.
Figure 2 shows that the perceived regulatory environment for market entry has declined from
2006. Market entry in the mobile sector is still perceived much better than the fixed line sector. Even the broadband sector is rated higher than the fixed line sector. These differences may also have a lot to do with perceived market potential, as growth in the fixed sector has been relatively flat, in comparison to both mobile and broadband. Also, providing internet access, which is classified as a value added service, is easier because it does not require a legislative franchise. The same goes with cable companies, which under Executive Order 436 of 1997 were recognized as being different from broadcasting and telecommunications. The requirement is only for a Provisional Authority of Certificate Authority from the NTC to operate.
1.1 Market Entry - Mobile
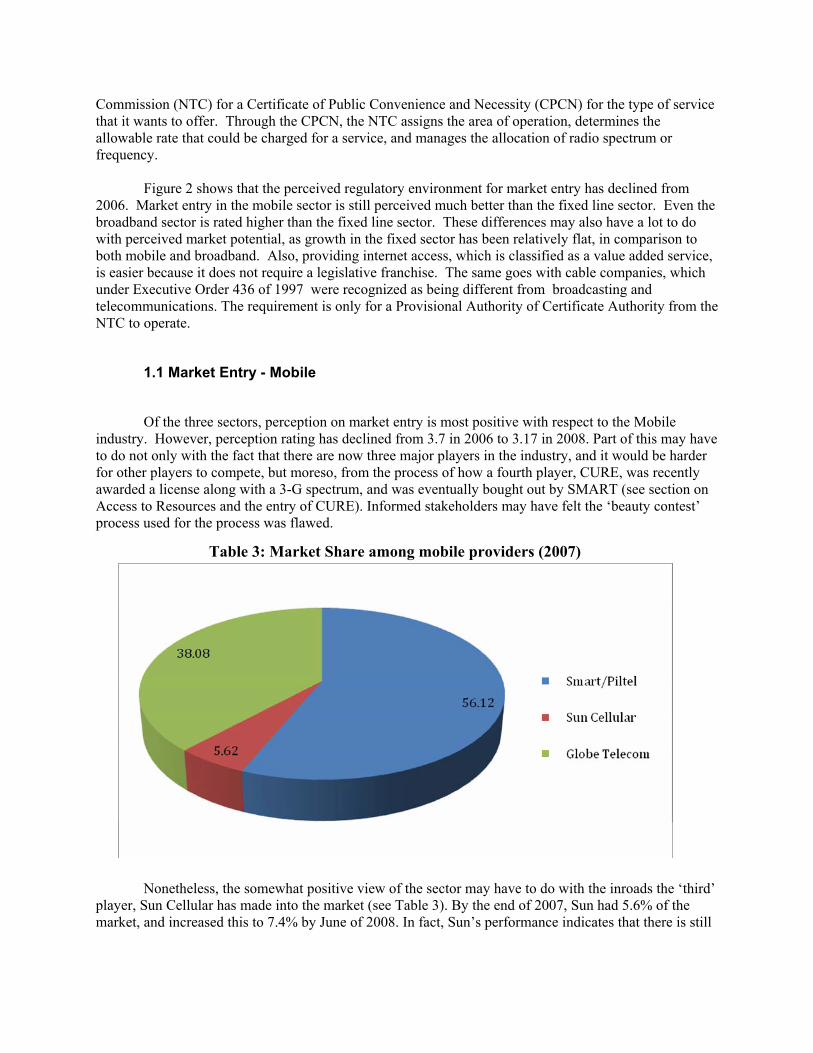
Of the three sectors, perception on market entry is most positive with respect to the Mobile industry. However, perception rating has declined from 3.7 in 2006 to 3.17 in 2008. Part of this may have to do not only with the fact that there are now three major players in the industry, and it would be harder for other players to compete, but moreso, from the process of how a fourth player, CURE, was recently awarded a license along with a 3-G spectrum, and was eventually bought out by SMART (see section on Access to Resources and the entry of CURE). Informed stakeholders may have felt the ‘beauty contest’ process used for the process was flawed.
Nonetheless, the somewhat positive view of the sector may have to do with the inroads the ‘third’ player, Sun Cellular has made into the market (see Table 3). By the end of 2007, Sun had 5.6% of the market, and increased this to 7.4% by June of 2008. In fact, Sun’s performance indicates that there is still
Table 3: Market Share among mobile providers (2007)
some room for competition and growth in the sector. From 2004-2007, year on year growth in number of subscribers in the industry has increased by 18.6% on average.
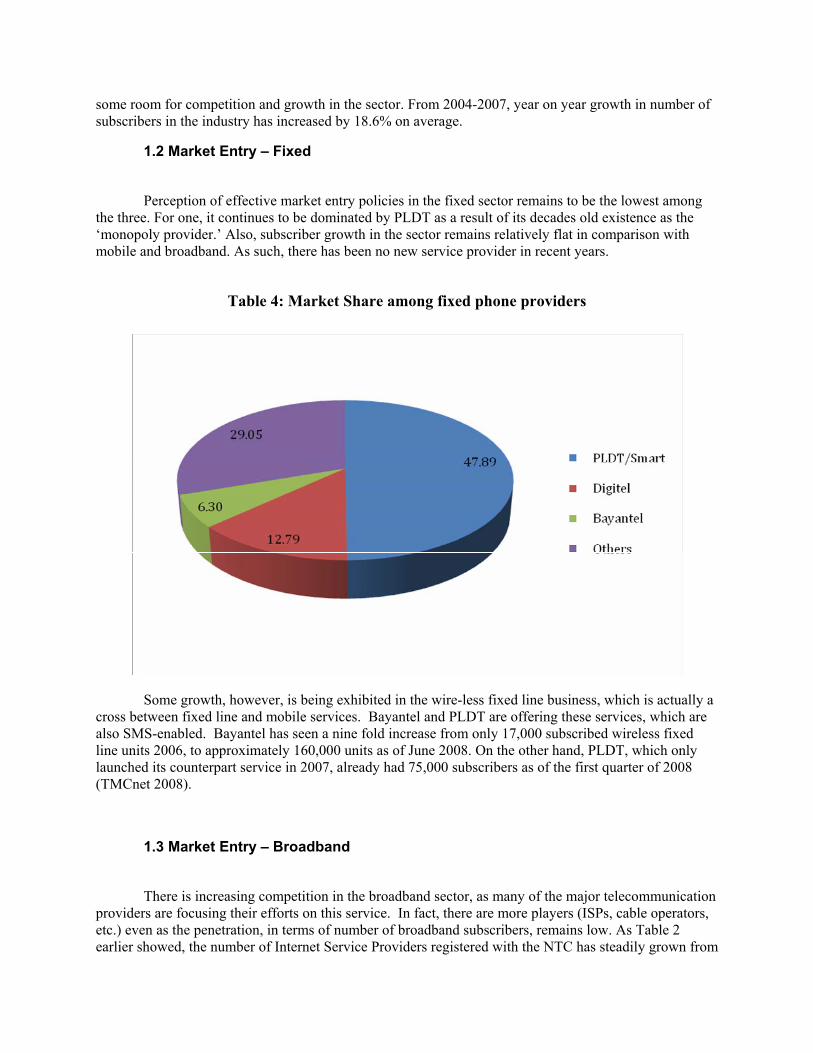
1.2 Market Entry – Fixed
Perception of effective market entry policies in the fixed sector remains to be the lowest among the three. For one, it continues to be dominated by PLDT as a result of its decades old existence as the ‘monopoly provider.’ Also, subscriber growth in the sector remains relatively flat in comparison with mobile and broadband. As such, there has been no new service provider in recent years.
Some growth, however, is being exhibited in the wire-less fixed line business, which is actually a cross between fixed line and mobile services. Bayantel and PLDT are offering these services, which are also SMS-enabled. Bayantel has seen a nine fold increase from only 17,000 subscribed wireless fixed line units 2006, to approximately 160,000 units as of June 2008. On the other hand, PLDT, which only launched its counterpart service in 2007, already had 75,000 subscribers as of the first quarter of 2008 (TMCnet 2008).
1.3 Market Entry – Broadband
There is increasing competition in the broadband sector, as many of the major telecommunication providers are focusing their efforts on this service. In fact, there are more players (ISPs, cable operators, etc.) even as the penetration, in terms of number of broadband subscribers, remains low. As Table 2 earlier showed, the number of Internet Service Providers registered with the NTC has steadily grown from
Table 4: Market Share among fixed phone providers

only 64 in 2001, to over 400 by 2006. Also, there were only 967,600 subscribers as of 2007, which is equivalent to only 1.1 subscribers per 100 (ITU 2008). While there was no indicator for broadband entry in the 2006 survey, a 3.05 rating is still a positive perception.
The positive perception on regulating market entry in the broadband sector may have to do with the fact that internet access is considered as a value-added service, and hence would not require an approval of the legislature in order to operate. Furthermore, tnvestment in broadband is not limited to the major telephone and mobile operators. Cable companies like Destiny and Skycable also provide internet services bundled with their fibre cables. Cable franchises are approved by the NTC and governs only specific areas (not national). Under EO 436 (issues by Ramos in 1997). It was made separate and istinct from telecpmmiunicatons and broadcasting. It only requires a certificate of authority from the NTC under EO 205 (of 1987).
As such, other companies, have reinvented their business to survive and have turned to Internet/broadband services. For instance, EasyCall, the largest paging system in the 1990s had to change course as it was severely affected by the popularity of SMS. It secured a license as a reseller of voice over Internet protocol or VoIP services to complement its Internet business (Olchondra 2008). On the other hand, ISM communications bought 78% of ETPI, an internet provider. In May it announced it was investing 2/3 of its $20 Million capex to finance the construction of a backhaul facility to support the broadband service of subsidiary Eastern Telecom Philippines, Inc. (ETPI) (Lorenzo 2008).
Perhaps, the perception on market entry into the broadband sector could have been more positive had it not been affected by political fallout with respect to the ZTE-National Broadband Network issue. Among the issues was the involvement of the son of the speaker of the house, as a a proponent in one of the projects. Also, another concern was the role of government in the provision of broadband services, whereas the policy direction had been to have it lead by the private sector. The 2006 Roadmap says that provision in major cities shall be left to the private sector, whereas those in municipalities and rural barangays will be a partnership between private and public sector organizations (CICT 2006).
2. Access to Scarce Resources This section analyses stakeholder’s perceptions with respect to regulating access to scarce
resources. Access to scarce resources is defined here as the timely, transparent and non-discriminatory access to spectrum allocation. It includes the numbering and rights of way, frequency allocation, telephone number allocation, and tower location rights.
Republic Act 7925 states that “radio frequency spectrum is a scarce public resource that shall
be administered in the public interest and in accordance with international agreements and conventions to which the Philippines is a party and granted to the best qualified. The government shall allocate the spectrum to service providers who will use it efficiently and effectively to meet public demand for telecommunications service and may avail of new and cost effective technologies in the use of methods for its utilization.” Furthermore, the allocation of radio frequency spectrum allocation and assignment shall be subject to periodic review and its use is subject to reasonable spectrum user fees. Where demand for specific frequencies exceeds availability, the open tenders for the same and ensure wider access to this limited resource (Sec 15) (Salazar 2007).
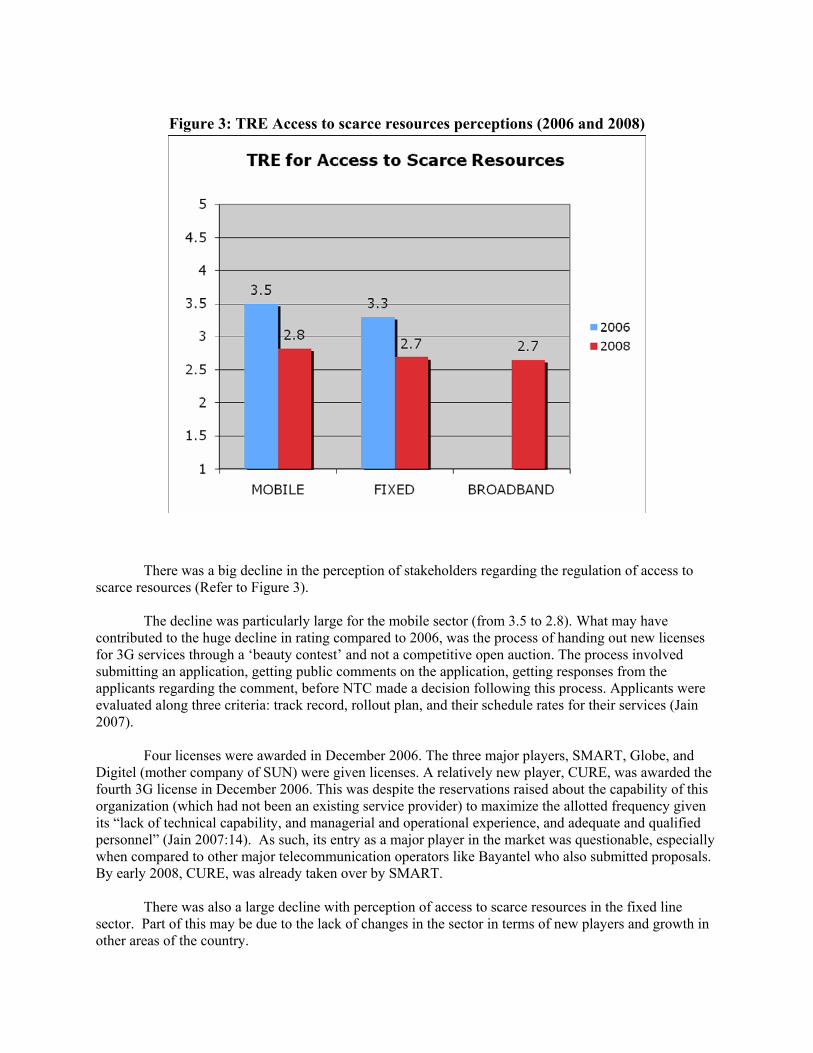
Figure 3: TRE Access to scarce resources perceptions (2006 and 2008)
There was a big decline in the perception of stakeholders regarding the regulation of access to scarce resources (Refer to Figure 3).
The decline was particularly large for the mobile sector (from 3.5 to 2.8). What may have
contributed to the huge decline in rating compared to 2006, was the process of handing out new licenses for 3G services through a ‘beauty contest’ and not a competitive open auction. The process involved submitting an application, getting public comments on the application, getting responses from the applicants regarding the comment, before NTC made a decision following this process. Applicants were evaluated along three criteria: track record, rollout plan, and their schedule rates for their services (Jain 2007).
Four licenses were awarded in December 2006. The three major players, SMART, Globe, and
Digitel (mother company of SUN) were given licenses. A relatively new player, CURE, was awarded the fourth 3G license in December 2006. This was despite the reservations raised about the capability of this organization (which had not been an existing service provider) to maximize the allotted frequency given its “lack of technical capability, and managerial and operational experience, and adequate and qualified personnel” (Jain 2007:14). As such, its entry as a major player in the market was questionable, especially when compared to other major telecommunication operators like Bayantel who also submitted proposals. By early 2008, CURE, was already taken over by SMART.
There was also a large decline with perception of access to scarce resources in the fixed line
sector. Part of this may be due to the lack of changes in the sector in terms of new players and growth in other areas of the country.
Even with the huge declines in the two sectors, the TRE rating of access to scarce resources was even lower in broadband. This was despite the NTC issuing two new Memorandum Circulars in June 2007 that allotted additional band allocations for broadband wireless access (see Annex 1). Perhaps, the impact of these policies, or band allocations have not yet been felt in the market. Also, it should be noted that during the Senate hearings on the National Broadband Network issue, some local stakeholders asked why local companies were not given the same opportunities to bid for the project.
3. Interconnection
This section looks at how interconnection issues are addressed by the regulator. Respondents were asked to rate whether interconnection with major operators are adequately ensured at any technically feasible point in the network. They were asked to consider whether there are reasonable rates for interconnection, there is unbundling of interconnection, and if these are offered without delay. Other interconnection issues that they were asked to consider include the sharing of incoming and outgoing IDD revenue, the payment for cost of interconnection links and switch interface and penalties for cost of technical disruption of interconnection.
One of the primary issues that had to be addressed when the industry was ‘liberalized’ and opened to more competition in 1993, was the issue of interconnection. In 2008, the TREs for all three sectors are closely bunched together (2.8-2.9). It is somewhat understandable given the convergence of the technologies. It is especially true when considering that interconnection does not only occur between mobile networks or between fixed networks but also between mobile and fixed networks. A recent example is the approval by the NTC for mandatory interconnection of wireless fixed line providers without access charges within local calling areas (NTC 2008) (See Annex 1).
Figure 4: TRE Interconnection (2006 and 2008)
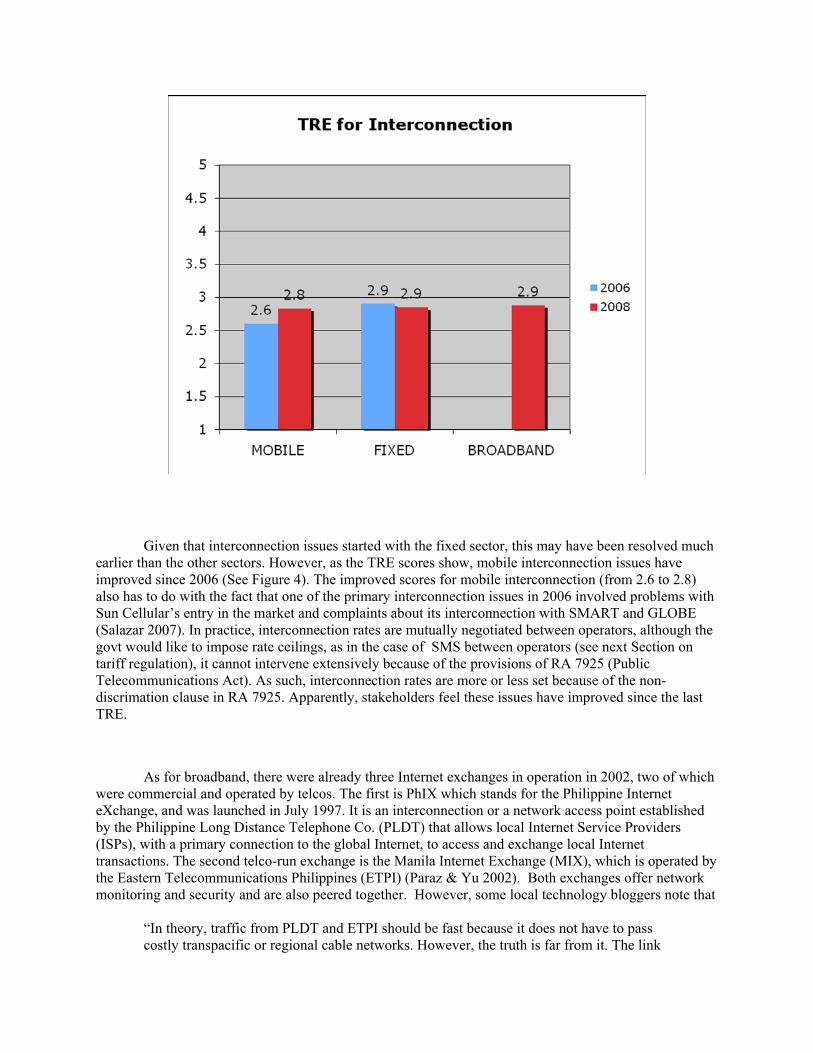
Given that interconnection issues started with the fixed sector, this may have been resolved much earlier than the other sectors. However, as the TRE scores show, mobile interconnection issues have improved since 2006 (See Figure 4). The improved scores for mobile interconnection (from 2.6 to 2.8) also has to do with the fact that one of the primary interconnection issues in 2006 involved problems with Sun Cellular’s entry in the market and complaints about its interconnection with SMART and GLOBE (Salazar 2007). In practice, interconnection rates are mutually negotiated between operators, although the govt would like to impose rate ceilings, as in the case of SMS between operators (see next Section on tariff regulation), it cannot intervene extensively because of the provisions of RA 7925 (Public Telecommunications Act). As such, interconnection rates are more or less set because of the non-discrimation clause in RA 7925. Apparently, stakeholders feel these issues have improved since the last TRE.
As for broadband, there were already three Internet exchanges in operation in 2002, two of which were commercial and operated by telcos. The first is PhIX which stands for the Philippine Internet eXchange, and was launched in July 1997. It is an interconnection or a network access point established by the Philippine Long Distance Telephone Co. (PLDT) that allows local Internet Service Providers (ISPs), with a primary connection to the global Internet, to access and exchange local Internet transactions. The second telco-run exchange is the Manila Internet Exchange (MIX), which is operated by the Eastern Telecommunications Philippines (ETPI) (Paraz & Yu 2002). Both exchanges offer network monitoring and security and are also peered together. However, some local technology bloggers note that
“In theory, traffic from PLDT and ETPI should be fast because it does not have to pass costly transpacific or regional cable networks. However, the truth is far from it. The link

between MIX and PHIX is so congested that it is actually faster if the traffic passed International cable networks!” 3 The third exchange was called CORE (Common Routing Exchange) which was operated
by the Philippine Internet Foundation (PHNet). It had a lower level of service, although it was completely free of charge. It was also actually the very first ISP in the Philippines, having started in 1994 (Paraz & Yu 2002).
A recent development to address the problem of network congestion was the initiative by
the Applied Science and Technology Institute (ASTI), the research and development arm of the Department of Science and Technology (DOST) to operate the Philippine Open Internet exchange (PHOPENIX). This newest Internet exchange is meant to be operated as a neutral institution, as it is maintained by a consortium of commercial, non-government, academic and government institutions. It was launched in January 2007, and operated in April of the same year. The significance of the project is that Philippine-based Internet service providers will be able to route their traffic locally without depending on their telecommunications providers, especially during major disasters as exemplified by problems that were encountered when an earthquake hit Taiwan that damaged undersea cables which served as one of the Philippines' telecommunications backbones (Vilafania 2007). According to ASTI’s Ms. May Celicious, among the bigger players, only PLDT has not joined PHOPENIX4.
Nonetheless, it is perhaps, because of this proactive initiative by a state institution that the broadband sector had the highest rating among the three sectors for this category, albeit marginally.
A more recent policy development on interconnection pertains to the circular for the mandatory interconnection backhaul operations to landing sites. It was drafted in by the NTC in April and formally approved and implemented in October 2008. Backhaul networks transmit traffic to and from international optical cable systems. It allows for faster communication not just within the country but also between the Philippines and other countries. Existing cable landing stations in the Philippines were established by Philippine Long Distance Telephone Co. in Nasugbu, Batangas and La Union; Globe Telecom, Inc. also in Nasugbu and soon in Cagayan Valley; and Digital Telecommunications Philippines, Inc. in Cavite. Each telco has separate backhaul facilities.
The NTC sees that the opening of backhaul-network services to other suppliers will bring down the prices to market levels to the benefit of the consumers. Since the backhaul networks are necessary to bring the traffic to and from the international optical submarine-cable systems, the cost of the backhaul networks is part of the prices of international circuits. Hence, according to NT Director Edgardo Cabarrios it can bring down prices of telco services that require international connections like fixed-line, mobile, and text messaging. It can benefit companies that do not have their own cable landing stations by providing them with the choice of backhaul network (Lectura 2008)
Whether this policy does reduce the fees paid by consumers who avail themselves of international telecommunication services should be evident by the next TRE.
3 See http://hip2b2.yutivo.org/2007/01/13/the-rebirth-of-philippine-internet-exchanges/ 4 Personal interview conducted at the ASTI office, U.P. Diliman, on September 18, 2008.

4. Tariff Regulation
There was no change in stakeholder perception from 2006 about the regulation of tariffs charged to consumers. Furthermore, there is little difference in the perception in all three sectors given that the scores given ranged from 2.8 to 2.9. This may be due to the ample competition in all three sectors. As a result, rates have been going down even without direct government intervention in tariffs. For instance, the price for a 3-minute local call during peak times went down from US$0.54 in 2000 to only US$0.32 in 2007. In fact, some companies like SUN Cellular, allow unlimited call times within networks for a fixed price, hence effectively lowering actual call rates. Furthermore, while it cost US$37.34 to have a mobile cellular connection in 2000, by 2007, with the technology that allows people to pass credit loads, one can already have a cellular connection for only US$0.04. As such, one respondent said, “The mobile sector of the telco industry is very competitive, with prices among the lowest in the world.”
This is why recent government proposals to regulate the price of SMS were peculiar. In late
May 2008, the government floated the idea of making text messaging free (Olchondra 2008, GMA 2008). A legislator also suggested that it be brought down from US$ 0.02 to US$0.003. This proposal may have been more politically motivated than rational, especially in light of rising inflation due to rising fuel costs. This eventually culminated in the President’s recent State of the Nation Address in Congress where she announced that she had convinced the telecommunications companies to lower standard SMS rates to US$0.01 instead. In reality, however, according to SMART’s spokesperson, the effective price of SMS has already been much lower, at US$0.002- US$0.004 or even lower in the case of unlimited text packages already offered in the market.
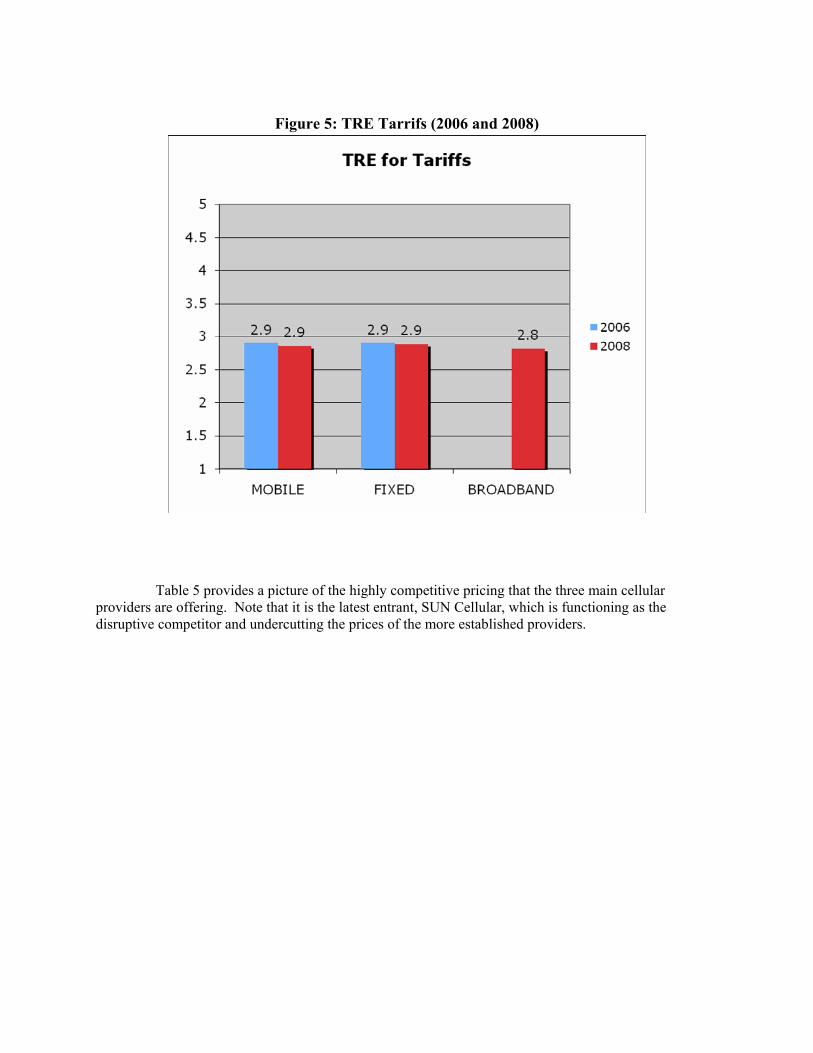
Figure 5: TRE Tarrifs (2006 and 2008)
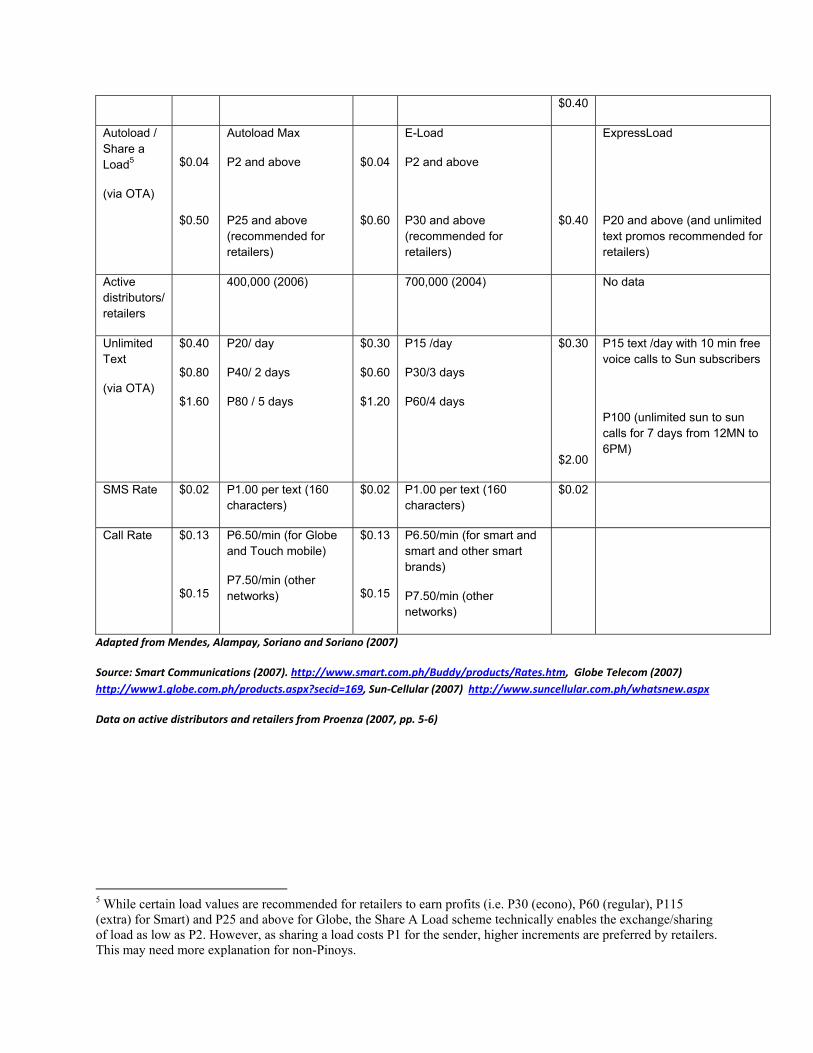
Table 5 provides a picture of the highly competitive pricing that the three main cellular
providers are offering. Note that it is the latest entrant, SUN Cellular, which is functioning as the disruptive competitor and undercutting the prices of the more established providers.

Table 5: Mobile Service Rates for Pre-paid Users
Globe Smart Sun Cellular
SIM $1.38
$1.00
$4.00
P69 - 64K SIM (G-cash ready)
P50 – (64K SIM with free 3 days unlimited text – current promo)
P200 - 128 XL SIM
$1.80
$3.00
$4.00
P90 Talk and Text Power SIM plus
P150 - SuperSIM-3 64K (P50 preload value)
P199 SuperSIM-3 64K (P100 preload value)
$1.00
$2.00
$3.00
P50 - Super Value SIM (w/ 2 day 24/7 unlimited call and text, 10msgs free to other networks)
P99 - Power SIM (w/ 4 days unlimited call and text, 15 SMS to other networks)
P150 - Supreme SIM (w/ 7 days unlimited call and text, 30 SMS free to other networks)
Prepaid Card (scratch)
$2.00
$5.00
$6.00
$10
$20
P100 (15 free SMS)
P250 (30 free SMS)
P300 (35 free SMS)
P500 (85 free SMS)
P1000 (250 free SMS)
(SMS/calls for all networks)
$6.00
$10
P300 (33 free SMS)
P500 (83 free SMS)
(SMS/calls for all networks possible)
$1.00
$3.00
$2.00
$3.00
$8.00
$3.00
$1.00
Regular:
P50
P150 (free 25 SMS to all networks)
Unlimited call & text cards
P100 (5 days, sun to sun)
P150 (7 days, sun to sun)
P400 (30 days, sun to sun)
Unlimited text (Sun to Sun)
P150 (unlimited text, 4 hours free call)
P50 (unlimited text, 7 days, 1 hour free call)
P20 (Textlite-2 days free text)
$0.40
Autoload / Share a Load5
(via OTA)
$0.04
$0.50
Autoload Max
P2 and above
P25 and above (recommended for retailers)
$0.04
$0.60
E-Load
P2 and above
P30 and above (recommended for retailers)
$0.40
ExpressLoad
P20 and above (and unlimited text promos recommended for retailers)
Active distributors/ retailers
400,000 (2006) 700,000 (2004) No data
Unlimited Text
(via OTA)
$0.40
$0.80
$1.60
P20/ day
P40/ 2 days
P80 / 5 days
$0.30
$0.60
$1.20
P15 /day
P30/3 days
P60/4 days
$0.30
$2.00
P15 text /day with 10 min free voice calls to Sun subscribers
P100 (unlimited sun to sun calls for 7 days from 12MN to 6PM)
SMS Rate $0.02 P1.00 per text (160 characters)
$0.02 P1.00 per text (160 characters)
$0.02
Call Rate $0.13
$0.15
P6.50/min (for Globe and Touch mobile)
P7.50/min (other networks)
$0.13
$0.15
P6.50/min (for smart and smart and other smart brands)
P7.50/min (other networks)
Adapted from Mendes, Alampay, Soriano and Soriano (2007)
Source: Smart Communications (2007). http://www.smart.com.ph/Buddy/products/Rates.htm, Globe Telecom (2007) http://www1.globe.com.ph/products.aspx?secid=169, Sun‐Cellular (2007) http://www.suncellular.com.ph/whatsnew.aspx
Data on active distributors and retailers from Proenza (2007, pp. 5‐6)
5 While certain load values are recommended for retailers to earn profits (i.e. P30 (econo), P60 (regular), P115 (extra) for Smart) and P25 and above for Globe, the Share A Load scheme technically enables the exchange/sharing of load as low as P2. However, as sharing a load costs P1 for the sender, higher increments are preferred by retailers. This may need more explanation for non-Pinoys.

5. Regulation of anti-competitive practices
Figure 6: TRE Anti-competitive practices (2006 and 2008)
Anti-competitive practices cover the use of information obtained from competitors with anti-
competitive results, and not making technical information about essential facilities and commercially relevant information available to competitors on a timely basis. It could also involve excessive prices, price discrimination and predatory low pricing. Other practices may be a company’s refusal to deal with operators and other parties, having vertical restraints, technical disruption of interconnection and sharing of towers and facilities by parent company and subsidiaries in different segments of the market.
In the survey, the scores for regulating anti-competitive practices were the lowest scores (among the dimensions) received for mobiles and fixed lines. However, the scores were higher than in the 2006 survey. This was also the only dimension where the regulation in the mobile industry ranked the lowest.
Much of this perception has to do with ‘sister companies’ being able to take advantage of their relationships in terms of interconnection agreements, so that they can provide lower fees for on-net calls/SMS. What is interesting, however, has been the ability of the newer entrant, Sun Cellular, to undercut prices, by offering unlimited text and call packages. In fact, in the last TRE, Salazar (2007) attributed the low marks for complaints about Sun’s unlimited text and calls within networks and how it could affect service quality in the long run. What has happened, however, is that the more established companies like Globe and SMART, have considered the same strategies for its special promotions.
As such, it can be argued that the low marks for the mobile sector may have to do with it being the most competitive sector. Companies are trying to leverage their existing strengths and advantages to get ahead of the competition. It is to the regulator’s credit, however, that perception has improved slightly on how they manage the highly competitive environment of the mobile sector.
In the broadband sector, the market is slowly being consolidated by the bigger players. According to ASTI’s Ms. Selicious, many ISPs are dying because they can not compete with the bigger providers. Others have been forced to reinvent their business and provide instead other services such as web-hosting, payment gateways, web development, systems development etc. and are no longer in the internet provision business. In fact, the Philippine Internet Service Organization (PISO), a consortia of small internet service providers, filed a complaint against PLDT with the NTC in 2002. They argued that PLDT had unreasonable, discriminatory and predatory pricing practices meant to kill the competition. PLDT, they also argued, was denying them access to some of its services and infrastructure, and was tantamount to denial of service.6
Even though the NTC provides a venue for airing such complaints, some respondents nonetheless, pointed to the lack of institutional capacity and weak laws that make regulating competition difficult. These is one area where there was strong sentiments expressed by respondents, as examples listed below would show:
“Regulation for anti-competitive practices does not reflect three major realities: (1) lack of institutional capacity of regulator (and courts) to enforce policy, (2) lack of incentive/motivation (e.g., enforceable sanctions, viable and appropriate business model, etc.) for market players to comply with policy, and (3) strong political backing of major carriers from the executive and legislative branches of government.”
“NTC has not been granted sufficient powers to regulate the players. To such extent it is deemed that it is the regulatee that regulates the regulator.”
“There are no clear and transparent measures of equalizing or leveling the playing field and a lot of politic influence market entry decision making. In terms of competition regulation anti-competitive practices continue because there are not enough trade laws that pertain and address competition specifically for the ICT and telco industry if there are any then they may need to be reviewed and updated in view of emerging disruptive technologies.”
6 Copy of the complaint can be found in http://www.piso.org.ph/ContentLoader?page=PISO_complaint
In a liberalized and competitive market, leveling the playing in order for players to compete fairly is among the bigger challenges that that regulators face.
6. Universal Service Obligations This section evaluates whether the administration of the universal service program is transparent,
non-discriminatory and competitively neutral and is not more burdensome than necessary for the kind of universal service defined by the policymakers. In the Philippines, the policy is not that of universal service, but that of universal access.

Figure 7: TRE Universal Service Obligation (2006 and 2008)
The Philippine government defines universal access as the availability of a minimum set of
reliable and affordable telecommunications services in all urban and rural areas (DOTC 2000). This definition seems to have been left intentionally broad/vague to allow for targets to be adjusted with technological and national developments. Based on nationally set indicators (MTPDP, ICT Strategic Roadmap of CICT), with a wide set of access types and services. Further, the purpose for access is defined as access to “basic government services”, information, and quality education through ICTs”. However, it is not very clear what constitutes the basic services and information that the government aims to provide (Lallana and Soriano 2007).
One respondent commented that “USO is not applicable for mobile and broadband in the
Philippines.” This remark is consistent with previous universal access policies which have been defined to mean access to fixed telephones. This bias can be seen with the service area scheme (SAS), whereby mobile phone providers were obliged to install 300,000 fixed lines. As such, while there is generally more access to mobile phones, historically, the government has had more proactive strategies to pursue fixed line telephones. Nonetheless, as shown in Figure 1, mobile phone density per 100 has already exceeded 60% whereas fixed line access has been flat at 4.3 per 100 inhabitants. Furthermore, the percentage of the population covered by mobile telephony signal has steadily increased from only 70% in 2000 to 92.5 in 2005 (World Bank 2005 as cited in Bautista 2008), and to 99% by 2007 (ITU 2008).
In recent years, the government has been revising this policy approach and moving towards
universal access targets pertaining to internet and broadband services. In the Philippines Strategic Roadmap released in October 2006, it targets 100% broadband connectivity in all cities down to fourth class municipalities. The government, through the Commission on Information and Communication
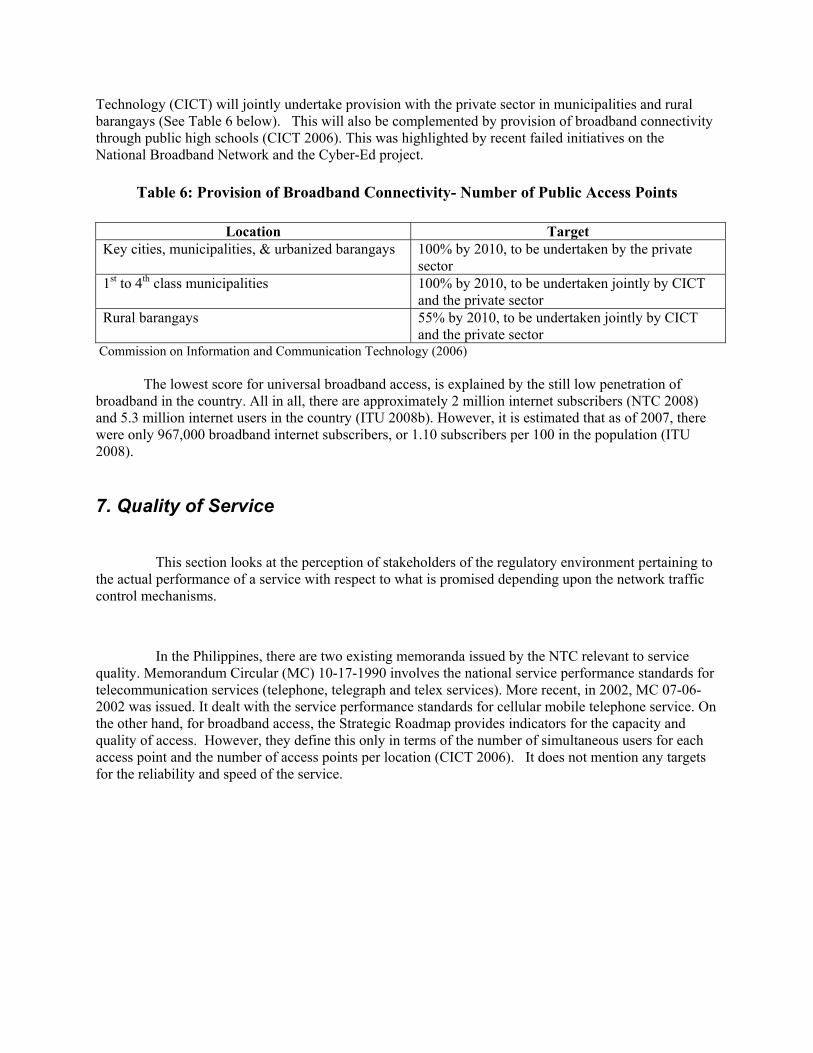
Technology (CICT) will jointly undertake provision with the private sector in municipalities and rural barangays (See Table 6 below). This will also be complemented by provision of broadband connectivity through public high schools (CICT 2006). This was highlighted by recent failed initiatives on the National Broadband Network and the Cyber-Ed project.
Table 6: Provision of Broadband Connectivity- Number of Public Access Points
Location Target Key cities, municipalities, & urbanized barangays 100% by 2010, to be undertaken by the private
sector 1st to 4th class municipalities 100% by 2010, to be undertaken jointly by CICT
and the private sector Rural barangays 55% by 2010, to be undertaken jointly by CICT
and the private sector Commission on Information and Communication Technology (2006)
The lowest score for universal broadband access, is explained by the still low penetration of
broadband in the country. All in all, there are approximately 2 million internet subscribers (NTC 2008) and 5.3 million internet users in the country (ITU 2008b). However, it is estimated that as of 2007, there were only 967,000 broadband internet subscribers, or 1.10 subscribers per 100 in the population (ITU 2008).
7. Quality of Service
This section looks at the perception of stakeholders of the regulatory environment pertaining to the actual performance of a service with respect to what is promised depending upon the network traffic control mechanisms.
In the Philippines, there are two existing memoranda issued by the NTC relevant to service quality. Memorandum Circular (MC) 10-17-1990 involves the national service performance standards for telecommunication services (telephone, telegraph and telex services). More recent, in 2002, MC 07-06-2002 was issued. It dealt with the service performance standards for cellular mobile telephone service. On the other hand, for broadband access, the Strategic Roadmap provides indicators for the capacity and quality of access. However, they define this only in terms of the number of simultaneous users for each access point and the number of access points per location (CICT 2006). It does not mention any targets for the reliability and speed of the service.

Figure 8: TRE Quality of Services (2008)
One problem with Quality of Service is the lack of regular measurement of indicators by the regulators that is available for the public to scrutinize.
Note that the Quality of Service dimension was not measured in the 2006 TRE. Liao (2006) reported that the NTC did a monitoring of cellular providers from October 16-27, 2005. They looked at call success rate, call completion rate and dropped- call rates. What stood out was Sun Cellular’s call success rate which was a low 66.6%; whereas Globe has 98.5% and Smart had 97.8%. There has been no available recent data to compare with. However, the relative high marks for quality of service in the mobile sector of 3.2 may be reflective of the perceived quality of services all three providers are delivering.7 However, actual monitoring of these services should be done more regularly over a random by the NTC and information made part of its annual reports.
Further, comparing the quality of service scores of the TRE against each sector, the highest score was that for mobiles, followed by fixed lines, and then by broadband. The high scores in the mobile sector may have to do with the occasional reports of testing mentioned in print media, along with clear indicators of quality (i.e. signal clarity, handover success rate, dropped calls). Standards do exist with fixed lines, but whether they are still monitored is not clear given the absence of reports. The lowest
7 NTC engineers conducted tests from Sept. 17 to Oct. 6, 2008 on three cellular service operators to measure the quality of services rendered, which was after the period covered in this study. Smart led the field on signal strength (91.81 percent), compared with Globe’s 86.58 percent and Sun’s 84.48 percent. In signal clarity, Smart rated 93 percent, slightly behind Globe (93.79 percent) and ahead of Sun (84.47 percent). In handover success rate, Smart led with 99.03 percent, followed by Globe (98.27 percent) and Sun (96.72 percent). High marks in these parameters reflect good network coverage, good signal quality and proper handover. Good performance in these areas should result in lower percentage of blocked and dropped calls. However, in terms of blocked calls, Smart registered 3.8%, Globe 2% and Sun18% respectively. On dropped calls, Smart registered 1.4 %, Globe 1.4%, and Sun 2%.

marks given to the broadband sector may have to do with the absence of clear guidelines and standards for measuring its quality.
Conclusions and Recommendations Three particular issues stood out during the period covered by the TRE survey: first, on the
allocation of scarce resources, particularly the contentious process of awarding a 3G license to a relatively new and untested telecommunications operator; second, was on tariff regulation, where the government was investigating the possibility of lowering access charges to SMS given the fact that the effective rates have been declining anyway; and finally on universal access to broadband services and the controversial contract with the Chinese company ZTE that was eventually rescinded. These importance of these events to stakeholders were manifested in the scores received for this TRE (See Figure 9).
Figure 9: TRE 2008 Summary Results
The overall average for the TRE in the Philippines in 2008 was 2.8. The highest marks were given for the Mobile sector (2.8), followed by fixed line (2.8) and last was broadband (2.7). The marks for the mobile sector and fixed line were lower than the 3.0 and 2.9 averages respectively from 2006. The lower averages was a result of the significant decline in scores for market entry and access to scarce resources. Furthermore, this average would have been lower had Quality of Service not been included in the TRE. Note also that like Quality of Service, and stakeholders’ perception about regulation of the broadband sector in general was not included in the 2006. The lowest average that the broadband sector received is reflective of the many issues that need to be resolved in this comparatively new area, foremost of which are Universal Service, Access to Resources and Quality of Service.
Compared with the TRE in 2006 there were mixed results across the same dimensions surveyed in 2008. Some dimensions had improved perception, while others declined. In only two items, Market Entry for Mobiles, and Quality of Service for Mobiles were rated higher than the middle score of 3. As

such, perception of the regulator was generally more negative. In fact, perceptions were lower for dimensions that scored highest in 2006, such as the environment for Market Entry and Regulation of Scarce Resources. Those that increased were perceptions about Universal Service Obligations (USO), Regulation of anti-competitive practices and TRE for interconnection in the mobile sector in particular. Nonetheless, USO and regulation of anti-competitive practices received the lowest scores. Hence, they pose the biggest challenges for regulators: (1) how to temper a vibrant and dynamic market in order to have fair competition; and (2) how to harness the private sector to bring services to rural areas and the marginalized.
Among those perceptions that declined were the TREs for Market Entry and Access to Scarce Resources. Partly, this may have to do with the perception that these were dimensions that where political influence seemed to affect the regulatory environment the most. In Market Entry, for instance, to obtain a franchise would require an Act of Congress. The same could be said with respect to allocation of 3G frequencies that occurred via ‘beauty contest.’ Alternatively, there was minimal change in the perception of tariff regulation, which may be due to perceived regulatory forbearance in this issue. Declining tariffs can be attributed more to market forces due to competition, rather than direct regulations imposed by the state. As such, perception has been better in areas where the market seems to work and politics is less involved. Ironically, overall, the highest mark for the Philippines’ TRE was also for Market Entry (See Figure 9). This may be reflective of the still positive policy environment for encouraging more players in the industry.
A caveat to comparisons with the 2006 TRE, however, would be some changes in how the survey was administered. In this case, a facility for answering the survey was made available online, of which majority of the respondents (82%, n=66) opted to do. Another difference would be the composition of the sample and a variation in how they were grouped (from four in 2006, to only three in 2008). Respondents were explicitly told that that they could opt not to not answer questions that they felt they did not know enough about. Items that were intentionally left unanswered were not made part of the score when computing for the averages.
Relatively higher marks were received for interconnection, tariff regulation and quality of service regulation. Further, Quality of Service Regulation is perceived better than other dimensions despite the absence of regular information about the regulator’s actual monitoring of the performance of telecommunication providers. This mark was also pulled up by good perception regarding the regulation of mobile phone service quality, where there are clear standards and occasional monitoring by NTC reported in the press. What is needed are more regular monitoring and reporting of all sectors, and in particular the development of clear and measurable indicators for broadband services.
The lowest marks overall were for anti-competitive practices and universal service obligation. In fact, the lowest ratings for the mobile sector were in the TRE of anti-competitive practices (followed by USO) even though it was already an improvement from the 2006 TRE survey. The capacity of the regulator to effectively manage this domain remains a major concern among stakeholders.
Finally, while still low, the USO score for fixed phones is highest in comparison because of service obligations that exist as a precondition to market entry. The low marks for universal broadband access, are also understandable given the low level of broadband penetration at present. The perception here would be that government is not doing the correct things that would lead to greater access to broadband services. It was the very low marks for this sector that pulled the USO average down. It would be interesting to see whether dramatic progress will be made in this area in the next TRE, as new 3G services roll out, and growth in mobile internet access is anticipated. Government should look into how the provision of these new technologies can be incorporated into policies that would encourage greater access to the unserved.
Methodology The methodology for this study on the Telecommunication Regulatory Environment (TRE)
survey was developed by LIRNEasia. It asks informed stakeholders to answer a brief survey on the telecom regulatory and policy environment along 7 dimensions, namely: Market allocation, Allocation of scarce resources, Interconnection, Regulation of anti-competitive practices, Universal service obligation, Tariff regulation, and Quality of service.
Respondents were asked assess the TRE by providing a score on a scale of 1 – 5 for each dimension, with 5 being the most positive and 1 the least favorable. Respondents were given the option to give a blank (no answer) to items the felt they had little knowledge to base their perceptions about. Blank items were not given a score in computing for the average for each dimension. The survey was conducted in the Philippines over a period of six weeks, from May 19 to July 7, 2008.
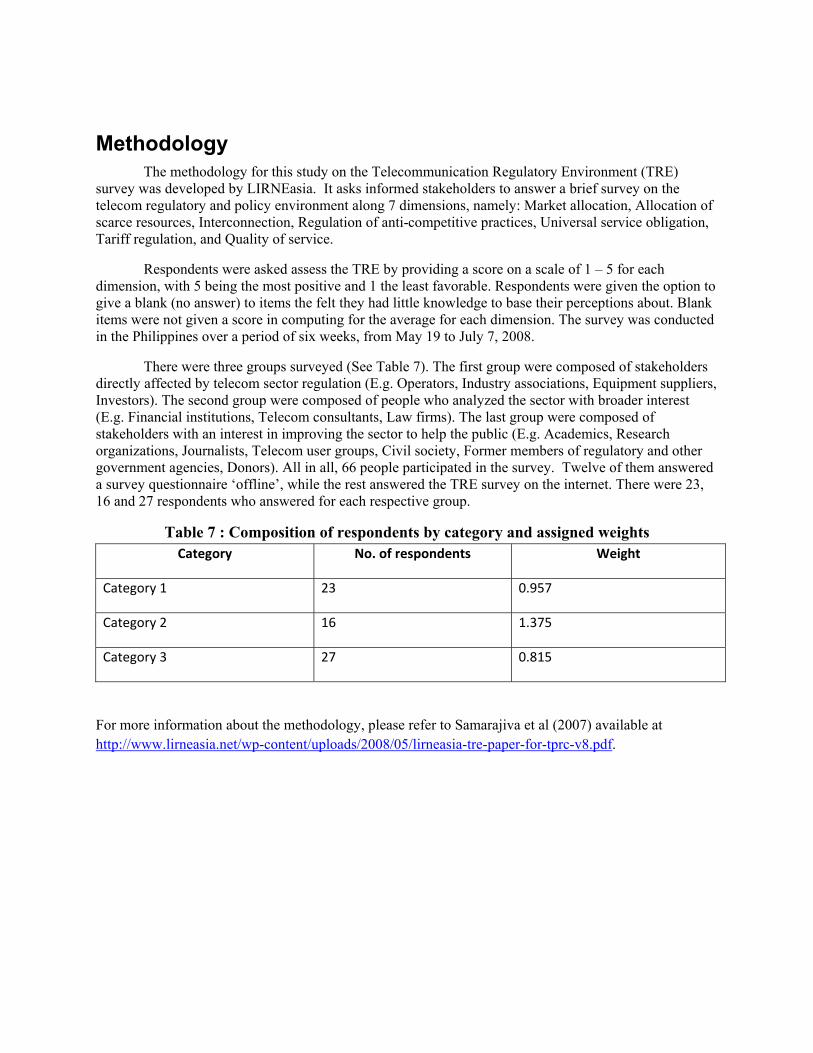
There were three groups surveyed (See Table 7). The first group were composed of stakeholders directly affected by telecom sector regulation (E.g. Operators, Industry associations, Equipment suppliers, Investors). The second group were composed of people who analyzed the sector with broader interest (E.g. Financial institutions, Telecom consultants, Law firms). The last group were composed of stakeholders with an interest in improving the sector to help the public (E.g. Academics, Research organizations, Journalists, Telecom user groups, Civil society, Former members of regulatory and other government agencies, Donors). All in all, 66 people participated in the survey. Twelve of them answered a survey questionnaire ‘offline’, while the rest answered the TRE survey on the internet. There were 23, 16 and 27 respondents who answered for each respective group.
Table 7 : Composition of respondents by category and assigned weights Category No. of respondents Weight
Category 1 23 0.957
Category 2 16 1.375
Category 3 27 0.815
For more information about the methodology, please refer to Samarajiva et al (2007) available at http://www.lirneasia.net/wp-content/uploads/2008/05/lirneasia-tre-paper-for-tprc-v8.pdf.
Acknowledgements This research was conducted as part of LIRNEasia’s Telecom Regulatory Environment Survey with research funding provided by the International Development Research Center (IDRC), Canada.
The author would like to acknowledge foremost Ms. Mae Ann Acha and Ms. Veronica Silva-Cusi for doing much of the physical work, identifying and following-up the respondents, both online and personally interviewing some of them, as well as gathering the indicative statistics available from various government and private agencies. Likewise, special acknowledgement to Lorraine Salazar, Grace Mirandilla and. Ranjit Rye for providing the research with leads from which a sampling frame could be based. Special thanks also to the people who took the time to answer and participate in the 2008 Telecommunication Regulatory Environment survey.
Finally, this paper would not have been possible without the able technical help and patience extended by Dimuthu Ratnadiwakara in the conduct of the online survey and calculations thereafter.

Annex 1: Summary of Regulatory Events for the Philippines TRE Summary of Regulatory Events in the Philippines
May 2007-May 2008
Date Subject
2007
May 2 A consortium of seventeen major international telecommunication operators, including PLDT, signed an agreement to build the first high-bandwidth optical fiber submarine cable system linking Southeast Asia and the U.S. The cable project, known as the Asia-America Gateway, will span 20,000 kilometers and will use the latest Dense Wavelength Division Multiplexing technology to provide upgradeable, future proof transmission facilities that will support bandwidth requirements for new and revolutionary broadband applications. It is expected that the Asia-America Gateway will cost approximately US$500 million and will be ready for service by the first quarter of 2009.
June 5 CICT Chairman Ramon Sales resigns.
June 8 NTC issued MC 0506 2007 - Consumer Protection Rights
June 12 NTC issues MC 0606 2007 giving “Additional Frequency Band Allocation, 2300-2400 MHz for Broadband Wireless Access”
July 19 NTC issues MC 07-07-2007 giving out “Additional Frequency Band Allocation, 410-430 MHz for Broadband Wireless Access”
July 19 NTC issues MC 09-07-2007 spelling out the “Rules on the Interconnection of Local Exchange Carriers (LECs) in Local Calling Areas,” stipulating that “there shall be no interconnection and access charges between interconnected LECs within a local calling area.”
July 19 NTC issues MC10-07-2007 “Mandating the development of Reference Access Offers (RAO) to facilitate fair and expeditious interconnection or access between service providers.” Per MC, all telcos are required to submit RAOs which “shall contain the terms and conditions for which an access provider is prepared to provide access to its telecommunications network or facility to any requesting service provider.”
July 30 The Department of Justice approves the National Broadband Network contract as legal and valid. Sept 11 The Supreme court issues a temporary restraining order against the NBN project Sept 23 President Arroyo orders indefinite suspension of ZTE contract for the National Broadband
Network.
Oct Community e-Center (CEC) Roadmap 2008-2010 was launched by the CICT October 3 President Arroyo scraps the ZTE contract.
Nov 22 The Department of Trade and Industry (DTI), the CICT, and the Business Processing Association of the Philippines (BPAP) sign a MOA agreeing to collaborate in the creation of an industry standard or scorecard to measure a location’s ICT investment viability, and attract more investments in ICT through marketing efforts.
2008

Feb 13 Adoption of Official Statistical Concepts and Definitions on ICT (PR-200801-NS1-04, Posted 07 January 2008)
The National Statistical Coordination Board (NSCB) approved the first batch of official concepts and definitions for statistical purposes for the information and communications technology sector for adoption by all concerned government agencies.
March The government established the National Public Key Infrastructure (PKI) To provide a secure online environment both for e-Commerce and e-Government. This is expected to boost e-commerce and enhance the country’s global competitiveness, particularly in the area of electronic trading and secured cross border transactions. The National PKI involves the establishment of a PKI Center and government Certification Authority (CA) by 2010, as well as adoption of licensing policies of private certification authorities. In March 2008, implementation took off with a US$3.5M grant from the Korea International Cooperation Agency (KOICA).
April 4 NTC issues Memorandum to all call center operators reminding them to source VoIP requirements
from registered VoIP providers
April 9 The NTC issues a draft of the proposed rules on the “Mandatory Interconnection of Backhaul Networks to the International Cable Landing Station” with public hearing set for April 17
April 15 The Final Draft of the Proposed Rules on Wireless Loop The NTC proposes to abolish access charges between phone firms that offer wireless fixed line in a local calling area. In their draft rules, ‘there shall be no interconnection access charges between interconnected LECs for calls originating from or terminating in wireless local loop (WLL) subscribers within a local calling area. This means all wireless fixed line calls made within a local calling area shall be considered local calls. Public hearing is set for April 29
May 17 DICT Bill passes in House of Representatives. Counterpart bill in Senate still has to schedule public hearings on it

Annex 2: References Abrenica, M. J. (2000). ‘Technological Convergence and Competition: The Telecommunications
Alampay, E. A. (2006). “Beyond access to ICTs: Measuring capabilities in the information society”. In International Journal of Education and Development using Information and Communication Technology, August 10, 2(3). Available from http://ijedict.dec.uwi.edu/viewarticle.php?id=196
Industry’, Philippine Review of Economics, Volume XXXVII, No. 1
Bautista, M. C. (2008) Philippine Art, Heritage and Religion in the Age of E-Culture, in del Pena and Diaz, P. (Eds.) Information and Communication Technology in Philippine Art, Heritage and Religion. DOST-IDRC, Taguig City.
Cuevas-Miel, L. (2008) Ongpin group gives up 3G business. Smart acquires smaller rivals. http://www.manilatimes.net/national/2008/apr/29/yehey/business/20080429bus1.html (accessed July 21, 2008)
Government of the Philippines (GoP) (1993). Executive Order 109
___________________ (1993). Executive Order 59
___________________ (1987). Philippine Constitution.
GMANews.tv (2008) ‘Free text messaging may force firms to cut service,’ http://www.gmanews.tv/story/97601/Free-text-messaging-may-force-firms-to-cut-service (accessed May 27, 2008)
GSM Association (2007), Universal Access – How Mobile Can Bring Communications to All, http://www.gsmworld.com/documents/universal_access_full_report.pdf.
International Telecommunications Union (ITU) (2006) World Communication/ICT Indicators Database
International Telecommunications Union (ITU) (2008) World Communication/ICT Indicators Database http://www.itu.int/ITU-D/icteye/DisplayCountry.aspx?countryId=184 (Accessed August 26, 2008)
International Telecommunications Union (ITU) (2008b) World Communication/ICT Indicators Database http://www.itu.int/ITU-D/icteye/Reporting/ShowReportFrame.aspx?ReportName=/WTI/InformationTechnologyPublic&RP_intYear=2007&RP_intLanguageID=1 (Accessed August 26, 2008)
Jain, R (2007) Spectrum Allocation for 3G in Philippines: Implications for Policy Makers and Regulators Working Paper No. 2007-10-02 (October 2007), Indian Institute of Management, Ahmedabad, India.

Liao, J. (2005) ‘Digital Citizens, Service performance standards for Mobile Phones’ in Manila Bulletin Online, Tech News http://www.mb.com.ph/issues/2006/02/09/TECH2006020955839.html (accessed July 29, 2008)
Lallana, E. and C. Soriano (2007) Towards Universal Internet Access in the Philippines. Ideacorp.
Lectura, L. (2008) Third-party link to cable project should get consortium approval, PLDT SAYS NTC PROPOSAL MUST HAVE FOREIGN PARTNERS’ CONCURRENCE. http://www.businessmirror.com.ph/06092008/companies01.html (accessed October 11, 2008)
Lorenzo, A.B.L. (2008) ‘Communications firm earmarks $12M for backhaul infra,’ Businessworld/GMAnews.tv http://www.gmanews.tv/story/98195/Communications-firm-earmarks-12M-for-backhaul-infra (accessed 9/12/08)
National Telecommunications Commission (NTC) (1990) Memorandum Circular (MC) 10-17-1990 National service performance standards for telecommunication services (Telephone, telegraph and telex services).
_____________ (2002) Memorandum Circular 07-06-2002, Service performance standards for cellular mobile telephone service.
Olchondra, R. (2008) ‘Telcos: No such thing as free SMS, not even in the US,’ http://newsinfo.inquirer.net/breakingnews/infotech/view_article.php?article_id=139996 (Accessed 5/31/2008)
Olchondra, R. (2008b) ‘The many phases of Easycall, ex-leader in pagers’, Money/Top Stories, Inquirer.net, http://business.inquirer.net/money/topstories/view_article.php?article_id=158886 (accessed 9/12/08)
Paraz, M. and W.E. Yu (2002) Philippine IX Information, in Asia Pacific Internet Associate Newsletter No. 8 January 2002.
Proenza (2007). Enhancing Rural Development through Improved Infrastructure and Innovative Information Applications. Philippines Country Report: Applications, June
Salazar, L (2007) LIRNEasia Six Country Multi-component Study 2006-2007: Philippines Report (January 2007). WDR Dialogue Theme 4th cycle Discussion Paper WDR0702.
TMCNet (2008) It’s a go for wireless landline interconnection (June 2, 2008) http://asia.tmcnet.com/news/2008/06/02/3476721.htm (accessed July 30, 2008).
Ure, J. (2004) Case Studies: Infrastructure in East Asia and the Pacific-The way Forward. The World Bank.
Vilafania, A. (2007) “‘RP gets first ‘open’ Internet exchange” , Inquirer.net , posted 1/24/2007. http://globalnation.inquirer.net/news/news/view_article.php?article_id=45408 (accessed September 11, 2008).


![3) Bangladesh Telecom Regulatory Commission [BTRC]](https://img.pdfslide.us/doc/110x75/577d23321a28ab4e1e993e55/3-bangladesh-telecom-regulatory-commission-btrc.jpg)