Embed Size (px)
Citation preview
Algeria Autorité de Régulation de la Poste et des Télécomm
unications - www.arpt.dz
Angola Angolan Institute of Comm
unications (INACOM) - www.inacom
.og.ao
Antigua and Barbuda Antigua Public Utilities Authorities www.apua.ag
Argentina Comisión Nacional de Com
unicaciones www.cnc.gov.ar
Australia Australian Comm
unication and Media Authority www.acm
a.gov.au
Azerbaijan Ministry of Com
munications and Inform
ation Technologies www.mincom
.gov.az
Bahamas Public Utilities Com
mission www.pucbaham
as.gov.bs
Bahrain Telecomm
unications Regulatory Authority (TRA) www.tra.org.bh
Bangladesh Bangladesh Telecomm
unication Regulatory Comm
ission www.btrc.gov.bd
Barbados Fair Trading Comm
ission – Telecoms Unit www.ftc.gov.bb
Bhutan Bhutan Infocomm
and Media Authority (BICM
A) www.bicma.gov.bt
Bolivia Dirección General de Telecomunicaciones www.sittel.gov.bo
Botswana Botswana Telecomm
unications Authority (BTA) www.bta.org.bw
Brazil Agencia Nacional de Telecomunicaciones www.anatel.gov.br
Brunei Darussalam Authority for Info-com
munications Technology www.aiti.gov.bn
Burkina Faso Autorité Nationale de Régulation des Télécomm
unications www.artel.bf
Cambodia M
inistry of Posts and Telecomm
unications of Cambodia www.m
ptc.gov.kh
Cameroon Agence de Regulation des Telecom
munications (ART) www.art.cm
Canada Canadian Radio-television and Telecomm
unication Comm
ission www.crtc.gc.ca
Cayman Islands Inform
ation and Comm
unications Technology Authority www.icta.ky
Chile Subsecretaría de Telecomunicaciones www.subtel.cl
Colombia Com
isión de Regulación de Telecomunicaciones www.crt.gov.co
Costa Rica Autoridad Reguladora de los Servicios Públicos www.aresep.go.cr
Cuba Dirección de Regulaciones y Normas - www.m
ic.gov.cu
Dominica National Telecom
munications Regulatory Com
mission www.ectel.int/ntrcdm
Dominican Republic Instituto Dom
inicano de las Telecomunicaciones www.indotel.gob.do
Ecuador Consejo Nacional de Telecomunicaciones www.conatel.gov.ec
Egypt National Telecomm
unication Regulatory Authority www.tra.gov.eg
El Salvador Superintendencia General de Electricidad y Telecomunicaciones www.siget.gob.sv
Ethiopia Ethiopian Telecomm
unications Corporation (ETC) www.ethionet.et
Gabon Agence de régulation des Télécomm
unications (ARTEL) www.artel.ga
Gambia Public Utilities Regulatory Authority www.pura.gm
Georgia Georgian National Comm
unications Comm
ission (GNCC) www.gncc.ge
Ghana National Comm
unications Authority www.nca.org.gh
Grenada National Telecomm
unications Regulatory Comm
ission www.ectel.int/grd/
Guatemala Superintendencia de Telecom
unicaciones www.sit.gob.gt
Honduras Comisión Nacional de Telecom
unicaciones www.conatel.hn
Hong Kong Office of the Telecomm
unications Authority (OFTA) www.ofta.gov.hk
India Telecom Regulatory Authority of India (TRAI) www.trai.gov.in
Israel Ministry of Com
munications www.m
oc.gov.il
Ivory Coast Agence des Télécomm
unications de Côte d’Ivoire www.atci.ci
Jamaica Office of Utilities Regulation (OUR) www.our.org.jm
Jordan Telecomm
unications Regulatory Comm
ission (TRC) www.trc.gov.jo
Kenya Comm
unications Comm
ission of Kenya www.cck.go.ke
Lebanon Ministry of Telecom
munications www.m
pt.gov.lb
Macau Bureau of Telecom
munications Regulation www.gdtti.gov.m
o
Madagascar Office M
alagasy d'Etudes et de Régulation des Télécomm
unications www.omert.m
g
Malawi M
alawi Comm
unications Regulatory Authority (MACRA) www.m
acra.org.mw
Malaysia M
alaysian Comm
unications and Multimedia Com
mission (M
CMC) www.skm
m.gov.m
y
Maldives Telecom
munications Authority of M
aldives www.tam.gov.m
v
Mauritania Autorité de Régulation www.are.m
r
Mauritius Inform
ation and Comm
unications Technology Authority (ICTA) www.icta.mu
Mexico Com
isión Federal de Telecomunicaciones www.cft.gob.m
x
NRA Benchmarking National Telecom Regulatory Authority Websites
WEBSITESWEBSITES

NRA WEBSITESBenchmarking National Telecom RegulatoryAuthority Websites
Edited by A.K. Mahan
TheWorld Dialogue on Regulation for Network Economies (WDR) facilitates an international dialogue togenerate and disseminate new knowledge on frontier issues in regulation and governance to support thedevelopment of network economies.WDR is a project of LIRNE.NET.
Learning Initiatives on Reforms for Network Economies (LIRNE.NET) is aninternational network for research, training, policy and regulatory advice ontelecom and information infrastructure reform and development.
Fundación Comunica managed global coordination of LIRNE.NET from2003-2009.
IDRC supports research activities at the LIRNE.NET regional centres andglobally at Fundación Comunica.
Contact information
Fundación ComunicaDr. Pablo de Maria 1036Montevideo, UruguayPhone: +598 2 4102979Fax: +44 870 759 8283E-mail: [email protected]
c 2009 Fundación Comunica. Some rights reserved. This work is licenced under a Creative CommonsBY-NC-ND 3.0 licence
Design and layout by Forma Estudio, Montevideo.www.formaestudio.com
Cover design: Enrique Zabala.
iii
In memoriam
AmyMahan(1961-2009)
Amy was the inspiration behind the idea of benchmarking national
implementing it. She planned, organized, contributed to and edited thispublication, working with a quiet determination until the end. All thatremained was to write the introduction and send it to the publisher.Amy is missed and remembered warmly.
With sadness we note the untimely death of Amy Mahan on 5 March 2009.
regulatory authority (NRA) websites and led the initiatives in

iv
v
Table of Contents
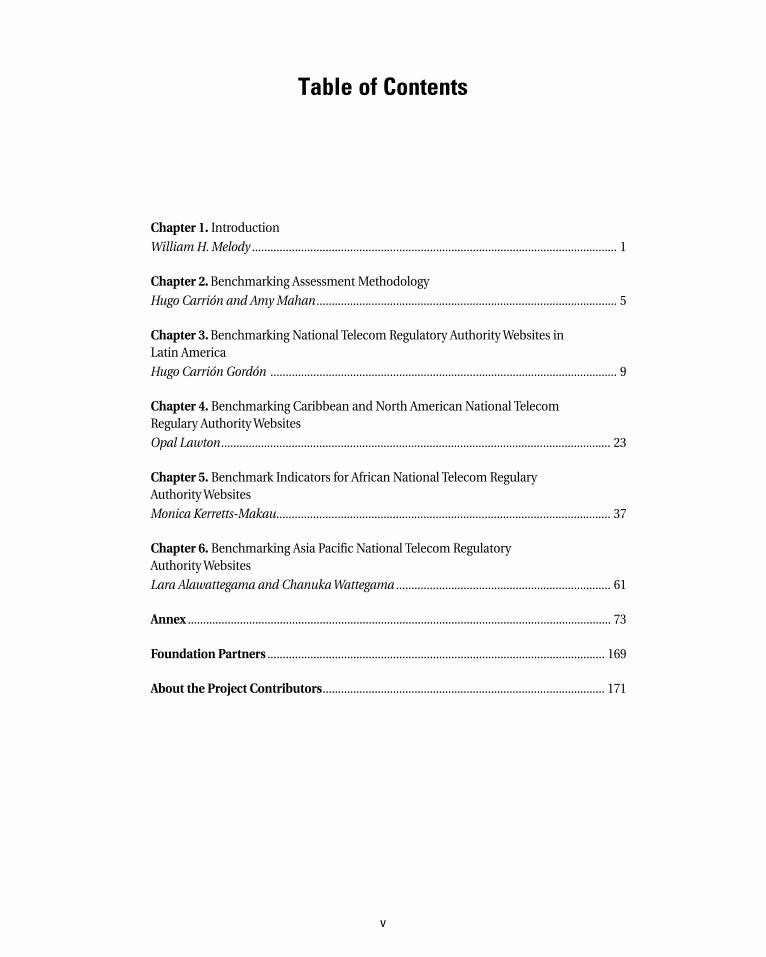
Chapter 1. IntroductionWilliam H.Melody ....................................................................................................................... 1
Chapter 2.Benchmarking Assessment Methodology
Hugo Carrión and AmyMahan.................................................................................................. 5
Chapter 3.Benchmarking National Telecom Regulatory AuthorityWebsites inLatin America
Hugo Carrión Gordón ................................................................................................................. 9
Chapter 4. Benchmarking Caribbean and North American National TelecomRegulary AuthorityWebsites
Opal Lawton............................................................................................................................... 23
Chapter 5. Benchmark Indicators for African National Telecom RegularyAuthorityWebsites
Monica Kerretts-Makau............................................................................................................. 37
Chapter 6. Benchmarking Asia Pacific National Telecom RegulatoryAuthorityWebsites
Lara Alawattegama and ChanukaWattegama ...................................................................... 61
Annex .......................................................................................................................................... 73
Foundation Partners .............................................................................................................. 169
About the Project Contributors............................................................................................ 171

1
Communication: Neglected Priorityof Communication Regulators
The telecom reform process is primarily about the implemen-tation of some fundamental policy and institutional changesby national governments with respect to the future direction ofthe telecom sector. The essential change is from a governmentdictated monopoly provider of telecom infrastructure andservices to a liberalized environment that allows, if not actual-ly encourages, widespread participation in sector develop-ment and in convergence with related sectors such ascomputing, electronics and digital content. To facilitate thistransition and guide its development, many National Regula-tory Authorities (NRAs) have been established to address themany complex issues that arise in this highly dynamic andoften unpredictable environment.To date the research and policy debates have focused almost
entirely on the substantive issues of policy and regulation, suchas license conditions for new operators and standards fordetermining reasonable prices. There has been relatively littleattention paid to the information and communication process-es necessary to ensure that the new NRAs can perform theirresponsibilities efficiently and effectively. In most countries,few people other than those business and government officialsdirectly involved in regulatorymatters have any real knowledgeabout what the NRA does or why. Even fewer understand theimplications of regulatory decisions. This limits access to infor-mation that is important to the business community, con-sumers, the public, and other government agencies, andrestricts participation in regulatory inquiries, debates and deci-sions that affect the communication environment for everyone.As a new institution in most countries, and a reformed one inothers, NRAs must establish responsive information and com-
munication networks with their constituents and the generalpublic if they wish to be effective. But the communicationeffectiveness of communication regulators has rarely beenattended to. It has never been a priority and is often not evenacknowledged or recognized.The pace of telecom reform has varied widely among coun-
tries depending heavily on local circumstances and politicalpriorities, including the prior state of general economic devel-opment and telecom sector development specifically, and theextent of near-term potential benefits from specific reforms.The telecom reformprocess began in theUSmore than a quar-ter century ago and some countries have yet to start. Althoughdeveloped countries generally have been the early reformersand developing countries the later ones, this is by no means aprecise distinction as there are overlaps, as well as large differ-ences among countries within these general classifications inthe timing, speed and priorities of reform.These significant differences have led to the adoption of a
variety of benchmark indicators to measure and compareprogress with reforms, to identify best (and worst) practices,and to stimulate greater progress with reforms. These indica-tors have focused on the extent of achievement of particularsteps in the reform process, e.g., interconnection and con-sumer prices, extent of access to particular services, extent ofcompetition in providing particular services, etc.. The Interna-tional Telecommunications Union (ITU) publishes statisticson a number of common indicators for most UN membercountries, but the quality of the reported data can vary widely.The Organisation for Economic Co-operation and Develop-ment (OECD) publishes a more comprehensive and reliableset of indicators with higher quality data, but coverage is nor-mally limited to OECD member countries. The EuropeanCommission has used a series of telecom reform indicators to
C H A P T E R 1
IntroductionWilliam H. Melody
1 . I N T R O D U C T I O N
identify leading countries and best practices on specificreforms, and used this evidence to actively encourage laggardcountries to improve their performance. Special interestgroups, regional associations and individual countries oftendevelop their own sets of benchmark indicators. In addition,within the broader context of ICT convergence and informa-tion society development, a variety of indicators of “e-readi-ness” and information society development have beenadopted. But none of these programs for measuring bench-mark indicators includes an indicator tomeasure the commu-nication effectiveness of national NRAs in implementing thereforms necessary to achieve e-readiness and informationsociety goals.
Evolution of NRA Website Benchmarking
LIRNE.NET has been providing training courses for executivesand senior staff of NRAs, and other participants in the regula-tory process, for more than a decade. These courses includethe use of benchmarks in key areas of substantive regulation,and the encouragement of NRAs to develop their own set ofbenchmark indicators and comparison countries as a guide toimproving their performance over time. Although we encour-aged NRAs to pay attention to the importance of informationsharing and effective communication with their constituentgroups and the public, we focused predominately on the sub-stantive issues that must be addressed by regulation.As the Internet grew rapidly during this period andwebsites
became common, Amy Mahan suggested that benchmarkingNRAwebsitesmight provide some good indicators of the effec-tiveness of NRAs in providing essential information and incommunication with their constituents and the public, andthereby the quality of their services. As the regulator of telecomnetworks and services, NRAs should be making active use ofthem in providing their own services. Early efforts at bench-marking NRA websites in Europe were restricted by the diver-sity of languages and constrained by limited data andexperience. But they provided useful teaching tools for thetraining courses, and were used by the Danish and Dutch reg-ulators in assessing their respective performance. As the Inter-net continued to grow, Amy turned her attention to developingcountries where it seemed NRA websites could not only facili-tate telecom reforms, but also provide a leading soource of bestpractices and demonstrate the wider potential of e-govern-ment.Amy’s initial regional benchmarking study of selected
African NRA websites was first used in a LIRNE.NET trainingcourse on telecom reform held at the University of Witwater-srand in Johannesburg. After the session examining the studyand discussing its implications, some course participants fromthe NRAs of countries that didn’t rank too well claimed thestudy was full of errors and could not be relied upon. At thelunch break we invited them to access their websites, and calltheir websitemanagers to identify where the study was wrong.
They reported back that they had not realized how unrespon-sive their websites were, and improvements would be madeimmediately.Building on this early experience and the continued growth
of the Internet and the potential capabilities of NRA websites,Amy has been able to improve the methodology, the data andthe quality of the benchmark comparisons in next stage stud-ies that she and colleagues have done covering differentregions of the world. The present publication is themost com-prehensive set of studies done to date.
Moving Closer to Global BenchmarkingIndicators
This is the first NRA Website Benchmarking report that pro-vides results from a near-global coverage for the same timeperiod. Studies cover Latin America, the Caribbean and NorthAmerica, Africa and the Asia Pacific region. Doing the studieswas not a straightforward exercise.They identify the enormousdifferences among countries. For example, at the time of datacollection, in Africa 45% of the countries surveyed didn’t haveNRA websites, and in Asia 29%. Some countries did not haveregulators. In others, some regulatory activities were beingperformed, but dispersed through different government agen-cies rather than established in an NRA. These study resultsdemonstrate very clearly the interdependent “chicken andegg” nature of network development. An Internet presencedoesn’t mean much unless others have an Internet presence.The value of an NRA website depends on access to the Inter-net, not only by theNRA but also by the network of constituentinterests that it needs to serve. Yet the pace of growth of Inter-net access is influenced by policy and regulation facilitatingtelecom infrastructure and services development and ICT con-vergence. Far too many countries are still struggling to estab-lish the foundation conditions for Internet access where thebenefits of network growth exceed the costs.InChapter 2,Benchmarking Assessment Methodology, Hugo
Carrion and Amy Mahan review the methodology of the stud-ies which has been refined and strengthened based on Amy’sexperience with her earlier research. Three of the four regionalstudies were able to follow the samemethodology for measur-ing the indicators, with the fourth (Asia-Pacific) adopting aparallel approach adapted to the particular circumstances ofthe countries being studied. This increases the possibilities fordrawing meaningful comparisons across countries andregions.The studies are not designed simply to fulfill the limited
objective of identifying leading and following countries, butrather to identify specific best practices, which are likely tovary among countries. Country ranking is done, as that is whatgets their attention, but then the studies identify where specif-ic strengths and weaknesses are and specific improvementswarranted. The studies adopt a classification scheme forassessing website performance that identifies four stages of
2
website development - emerging, enhanced, interactive andtransactional. Benchmark indicators are developed for fivemajor categories and 20 subcategories of website activitywhich individually and collectively measure performance.In Chapter 3, Benchmarking National Regulatory Authority
Websites in Latin America, Hugo Carrion shows the significantdiversity among the 21 countries examined by identifying thedifferent stages of telecom reform in the different countries,and the significant differences in the ages and roles of theNRAs. Specific areas of strength and weakness are identified.Although Latin American NRA website development is still inthe “emerging” category, the study also was able to documentsome improvements over time.Opal Lawton provides an interesting contrast between early
and late telecom reform countries, as well as rich and poorcountries, in Chapter 4,Benchmarking of Caribbean and NorthAmerican NRA Websites. Although the US and Canadian NRAwebsites are more advanced, as expected given their circum-stances, they did not have the best practice in all categories.The study shows that even the North American NRA websiteshaven’t reached the advanced transactional stage of websitedevelopment yet. Among the 12 countries, some had multipleagencies performing different functions, making indicatormeasurement more difficult.In Benchmark Indicators for African NRA Websites, Chapter
5, Monica Kerretts-Makau identifies a very wide diversityamong countries. Only 30 of 54 countries had NRAs with web-sites. Althoughmost countries were still at an early stage in thetelecom reform process and in NRA development generally,some countries scored well on specific indicators. In mostcountries, the limited development of the Internet, and NRAwebsites, suggests that the web is not themainmeans of com-munication access to or byNRAs. Local languages are extreme-ly important in some countries and the populations moredifficult and costly to serve as they require more advancedInternet development. NRA website development in mostcountries is often linked to developments in e-governmentgenerally and e-governance in particular. Thus at this earlystage of development, NRA website development for mostAfrican countries is a muchmore limited indicator of progressin implementing telecom reforms.In Chapter 6, Benchmarking Asia Pacific NTRA Websites,
Lara Alawattegama and Chanuka Wattegama examined thewidest diversity among counties ranging from the very poorand underdeveloped to the very rich and highly developed.Many of the samedifficulties thatwere identified in the Africanstudy were found here as only 31 of 62 countries had NRAswith websites that had a version in English, which was neces-sary to be included in the study. Thus a few important coun-tries, including China and South Korea, had to be droppedfrom the study. Given the greater extent of diversity among
countries, this study clustered the countries in groups asmeas-ured by access paths/100 population to facilitate proximatebenchmark comparisons. In addition, the primary focus wasshifted to regulatory functions rather than NRAs, as a numberof countries performed a number of regulatory functions butnot through an NRA.The studies have done a good job at showing the interrela-
tions between NRA website development and telecom net-work development by placing the research within the contextof overall telecom reform and ICT development. Their recom-mendations for improvement in responding to best practicesare especially significant as weakness on some individual indi-cators can significantly weaken the overall effectiveness of thewebsite for NRA communication with its constituents.Although the regional studies were all done by applying a
consistent methodology and covering the same time period,they were done by different researchers, each with specializedknowledge of their regions. But they wisely did not try to com-pare the basis of their professional judgments across theregions. Thus, the numerical scores are not comparable acrossregions. However the detailed assessments of specificstrengths and weaknesses as shown by particular indicatorsare generally comparable. For example, the common conclu-sion that the studies document that no country has an NRAwebsite that has reached the transactional stage of develop-ment yet is fully demonstratedby the data and the assessmentsfrom each region.After reviewing these studies in the context of Internet
development generally, it seems fair to observe that the resultsshowNRAs have not been leaders in the use of websites for ful-filling their mandates. They have not provided best practiceexamples in promoting their mission of stimulating Internetdevelopment. There is considerable room for improvement as
Although the speed of Internet growth rapidly dates the specif-ic data measurements used in these studies, it does not renderobsolete the best practice assessments, conclusions and rec-ommendations.An interactive and transactional Internet presence is rapidly
becoming essential for all organizations as the major instru-
For the future, the Internet makes possible major improve-ments in the international networking of NRAs among them-selves as part of a learning process of identifying and employingbest practices in all areas of regulation, not just website devel-
for this possibility. It provides a foundation for continuing
B E N C H M A R K I N G N A T I O N A L R E G U L A T O R Y A U T H O R I T Y W E B S I T E S
3
telecom reform and Internet development continue.
ment for effective information gathering and communication.
websites improve, and NRAs begin tomake effective use of thenext-generation Internet in fulfilling their mission.
opment. This report provides an important step in preparing
research on these issues as telecom reform proceeds, NRA

5
Introduction
Two methodologies are used to evaluate national regulatoryauthority (NRA) websites in this volume. The first is a bench-marking approach which focuses on best practices. Thismethodology is used for assessing Latin America, theCaribbeanand Africa (chapters 3-5) and is described below. The method-ology used for the assessment of Asian websites has a primaryfocus on ranking websites out of a score of 100. This methodol-ogy is described in the chapter for Asia (chapter 6).
Benchmarking methodology
LIRNE researchers first began assessing regulatory websites asdiscussion tools for courses for regulators. At the time, at theturn of the century, most regulators had only bare bones web-sites and there was little in the way of ‘best practice’ to guidetheir efforts. These early assessments identified categories ofinformation and reported on initiatives that regulators weretaking to make resources available in these categories via theirwebsites.As this work evolved, it also became apparent that different
categories of stakeholders who regulators could be reachingvia their websites (as well as other channels) needed to beidentified. Our question was whether equal efforts were beingmade, for example, to reach consumers as compared to busi-ness users.While rich in information, the tables used to describe the
different websites were difficult to summarize.Whatwas need-ed was an objective value that could be assigned, which wouldrank the different categories and provide a snapshot of howindividual websites performed, and which areas of informa-
tion required more attention or conversely, were evidence ofbest practice.The ranking system for the 2005 NRA benchmark study of
regulatory websites in Africa (Mahan 2005) was inspired by the2001 United Nations report, Benchmarking E-government(Ronaghan 2001) which identified five stages of electronic gov-ernment: emerging, expanded, interactive, transactional andseamless. These categories were used to evaluate the variousaspects of regulatory agencies’ websites to arrive at a consis-tent classification system for the various categories of infor-mation and characteristics of the websites analyzed.The qualitative requirements for the five stages were modi-
fied slightly for the NRA benchmarking studies to reflect theparticular nature of regulatory websites. The last category ofthe UN study, seamless, which refers to full integration of allelectronic functions and services across administrative anddepartmental boundaries, was excluded on the grounds that itwas not realistic for the subjects of this study — and, in fact, itwas not attained by any country in the worldwide study. Thestages were therefore defined as follows:
• Emerging: only basic,mostly static information is available.
• Enhanced: content and information are updated regularly,and the information is available not only in its original for-mat (for example, decrees and laws), but also in a simplifiedand explanatory manner.
• Interactive:users candownload forms, contact officials andfile requests. The available information has the added valueof being linked to relevant legislation or other points of ref-erence .
C H A P T E R 2
BenchmarkingAssessment Methodology
Hugo Carrión and Amy Mahan
2 . B E N C H M A R K I N G A S S E S S M E N T M E T H O D O L O G Y
• Transactional: users can request and submit onlinerequests for information or to complete other regulatoryprocesses such as licence requests or to participate in regu-latory forum discussions.
The subcategories were classified with each thematic ele-ment assigned a value from 1 to 4, based on the stagesdescribed above, andwith each category contributing to a finalscore.The classificationwas based on qualitative evidence, butsubjectivitywasminimizedby the use of the categories definedabove, rather than relying merely on perceptions.It should be noted that a value of 0 was used to indicate the
lack of information or a service. Intermediate scores were alsoused to provide a more precise assessment. For example, ifinformationwas available but it was not completely up-to-dateand lacked sufficient explanation, it received a score of 1.5.
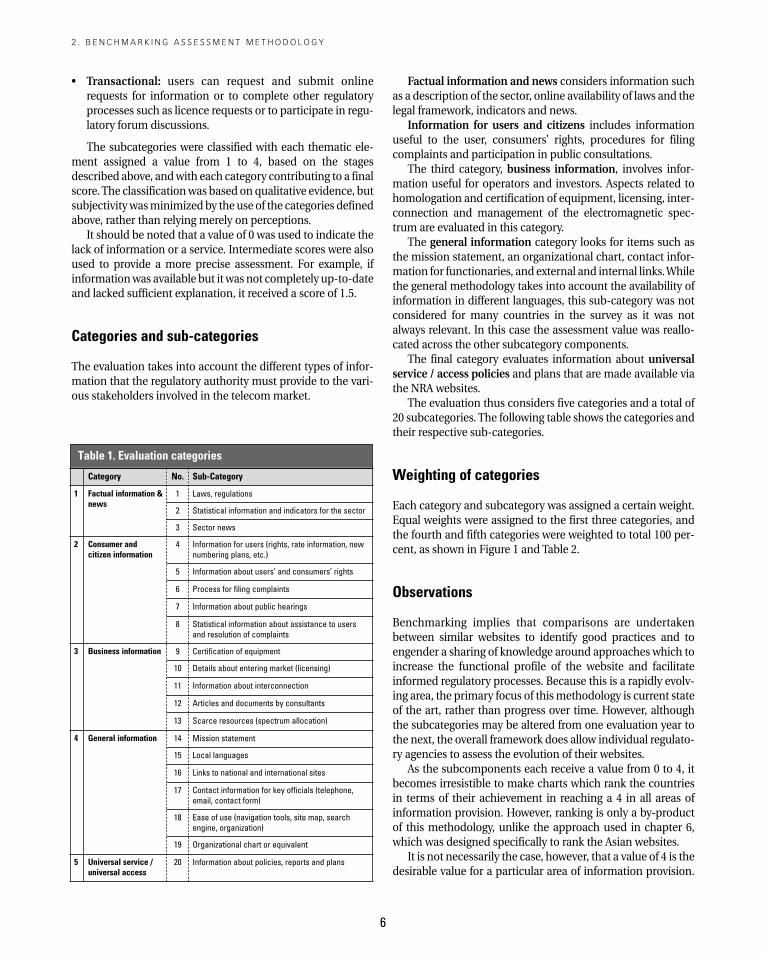
Categories and sub-categories
The evaluation takes into account the different types of infor-mation that the regulatory authority must provide to the vari-ous stakeholders involved in the telecommarket.
Factual information and news considers information suchas a description of the sector, online availability of laws and thelegal framework, indicators and news.
Information for users and citizens includes informationuseful to the user, consumers’ rights, procedures for filingcomplaints and participation in public consultations.The third category, business information, involves infor-
mation useful for operators and investors. Aspects related tohomologation and certification of equipment, licensing, inter-connection and management of the electromagnetic spec-trum are evaluated in this category.The general information category looks for items such as
the mission statement, an organizational chart, contact infor-mation for functionaries, and external and internal links.Whilethe general methodology takes into account the availability ofinformation in different languages, this sub-category was notconsidered for many countries in the survey as it was notalways relevant. In this case the assessment value was reallo-cated across the other subcategory components.The final category evaluates information about universal
service / access policies and plans that are made available viathe NRA websites.The evaluation thus considers five categories and a total of
20 subcategories. The following table shows the categories andtheir respective sub-categories.
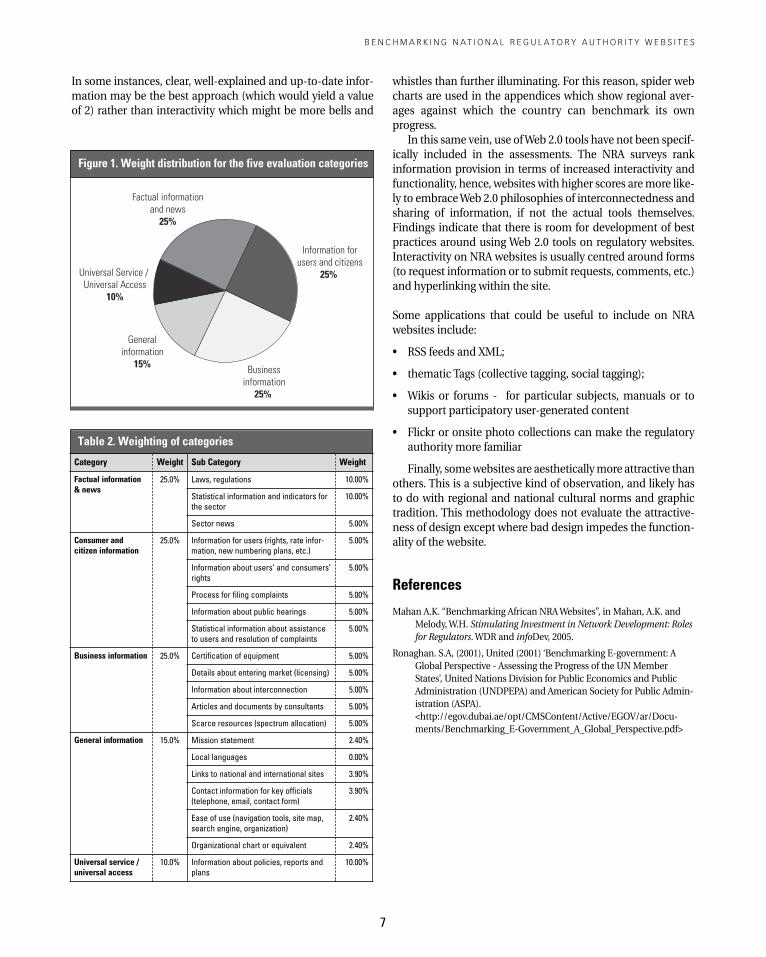
Weighting of categories
Each category and subcategory was assigned a certain weight.Equal weights were assigned to the first three categories, andthe fourth and fifth categories were weighted to total 100 per-cent, as shown in Figure 1 and Table 2.
Observations
Benchmarking implies that comparisons are undertakenbetween similar websites to identify good practices and toengender a sharing of knowledge around approaches which toincrease the functional profile of the website and facilitateinformed regulatory processes. Because this is a rapidly evolv-ing area, the primary focus of thismethodology is current stateof the art, rather than progress over time. However, althoughthe subcategories may be altered from one evaluation year tothe next, the overall framework does allow individual regulato-ry agencies to assess the evolution of their websites.As the subcomponents each receive a value from 0 to 4, it
becomes irresistible to make charts which rank the countriesin terms of their achievement in reaching a 4 in all areas ofinformation provision. However, ranking is only a by-productof this methodology, unlike the approach used in chapter 6,which was designed specifically to rank the Asian websites.It is not necessarily the case, however, that a value of 4 is the
desirable value for a particular area of information provision.
6
Category No. Sub-Category
1 Factual information &news
1 Laws, regulations
2 Statistical information and indicators for the sector
3 Sector news
2 Consumer andcitizen information
4 Information for users (rights, rate information, newnumbering plans, etc.)
5 Information about users’ and consumers’ rights
6 Process for filing complaints
7 Information about public hearings
8 Statistical information about assistance to usersand resolution of complaints
3 Business information 9 Certification of equipment
10 Details about entering market (licensing)
11 Information about interconnection
12 Articles and documents by consultants
13 Scarce resources (spectrum allocation)
4 General information 14 Mission statement
15 Local languages
16 Links to national and international sites
17 Contact information for key officials (telephone,email, contact form)
18 Ease of use (navigation tools, site map, searchengine, organization)
19 Organizational chart or equivalent
5 Universal service /universal access
20 Information about policies, reports and plans
Table 1. Evaluation categories
In some instances, clear, well-explained and up-to-date infor-mation may be the best approach (which would yield a valueof 2) rather than interactivity which might be more bells and
whistles than further illuminating. For this reason, spider webcharts are used in the appendices which show regional aver-ages against which the country can benchmark its ownprogress.In this same vein, use ofWeb 2.0 tools have not been specif-
ically included in the assessments. The NRA surveys rankinformation provision in terms of increased interactivity andfunctionality, hence, websites with higher scores aremore like-ly to embraceWeb 2.0 philosophies of interconnectedness andsharing of information, if not the actual tools themselves.Findings indicate that there is room for development of bestpractices around using Web 2.0 tools on regulatory websites.Interactivity on NRA websites is usually centred around forms(to request information or to submit requests, comments, etc.)and hyperlinking within the site.
Some applications that could be useful to include on NRAwebsites include:
• RSS feeds and XML;
• thematic Tags (collective tagging, social tagging);
• Wikis or forums - for particular subjects, manuals or tosupport participatory user-generated content
• Flickr or onsite photo collections can make the regulatoryauthority more familiar
Finally, somewebsites are aestheticallymore attractive thanothers. This is a subjective kind of observation, and likely hasto do with regional and national cultural norms and graphictradition. This methodology does not evaluate the attractive-ness of design except where bad design impedes the function-ality of the website.
References
Mahan A.K. “Benchmarking African NRAWebsites”, in Mahan, A.K. andMelody,W.H. Stimulating Investment in Network Development: Rolesfor Regulators.WDR and infoDev, 2005.
Ronaghan. S.A, (2001), United (2001) ‘Benchmarking E-government: AGlobal Perspective - Assessing the Progress of the UNMemberStates’, United Nations Division for Public Economics and PublicAdministration (UNDPEPA) and American Society for Public Admin-istration (ASPA).<http://egov.dubai.ae/opt/CMSContent/Active/EGOV/ar/Docu-ments/Benchmarking_E-Government_A_Global_Perspective.pdf>
B E N C H M A R K I N G N A T I O N A L R E G U L A T O R Y A U T H O R I T Y W E B S I T E S
7
Figure 1. Weight distribution for the five evaluation categories
Businessinformation
25%
Generalinformation
15%
Universal Service /Universal Access
10%
Information forusers and citizens
25%
Factual informationand news
25%
Category Weight Sub Category Weight
Factual information& news
25.0% Laws, regulations 10.00%
Statistical information and indicators forthe sector
10.00%
Sector news 5.00%
Consumer andcitizen information
25.0% Information for users (rights, rate infor-mation, new numbering plans, etc.)
5.00%
Information about users’ and consumers’rights
5.00%
Process for filing complaints 5.00%
Information about public hearings 5.00%
Statistical information about assistanceto users and resolution of complaints
5.00%
Business information 25.0% Certification of equipment 5.00%
Details about entering market (licensing) 5.00%
Information about interconnection 5.00%
Articles and documents by consultants 5.00%
Scarce resources (spectrum allocation) 5.00%
General information 15.0% Mission statement 2.40%
Local languages 0.00%
Links to national and international sites 3.90%
Contact information for key officials(telephone, email, contact form)
3.90%
Ease of use (navigation tools, site map,search engine, organization)
2.40%
Organizational chart or equivalent 2.40%
Universal service /universal access
10.0% Information about policies, reports andplans
10.00%
Table 2. Weighting of categories

9
Introduction
With the increased privatization of telecommunications andthe liberalization of the telecom sector, the role of national reg-ulatory authorities (NRAs) has become ever more importantbecause of their responsibility for ensuring the harmoniousco-existence of converging technologies and services, as wellas ensuring equitable access to the benefits of the informationsociety. Among themain protagonists of the technological rev-olution of the past few decades are the internet and WorldWideWeb. Nowadays, businesses and organizations that wantto be competitive and develop close relationships with theircustomers, and which seek to add value to the informationthey distribute, must have a network presence. Websites noware not only amedium for disseminating information, but alsoinvolve key strategies for handling relations with customersand providers. For government institutions, internet presencehas become a powerful device for ensuring accountability andthe transparency of information, fostering citizen participa-tion and also for providing online services and transactions.The information and knowledge society brings innumer-
able changes, including citizens’ demands on their authorities.Citizens want to knowwhat their governments are doing. Theydemand transparency as a way of monitoring governmentactivities, because it is understood that access to and trans-parency of public information are rights, and it is the govern-ment’s responsibility to respond to citizens’ expectations.Technology allows the NRA websites to become instru-
ments for effective communication, producing and reproduc-ing information for the benefit of citizens, operatingcompanies, private enterprise, non-governmental organiza-tions, government agencies, etc. The sites must therefore bedesigned to be functional and accessible to the general public,
and must take into consideration such factors as users’ needs,educational levels,1 and physical disabilities that are barriersthat limit access. Failure to take these into consideration whena website is designed could constitute discrimination.The content must be clear, current and complete, and the
information must meet the user’s needs, facilitating good gov-ernance and public administration. Well-implemented tech-nology can foster and promote electronic government andelectronic commerce, new forms of communication and rela-tionship that are the result of the information-driven society inwhich we find ourselves.Regulatory entities are responsible for issuing clear public
information about the sector, overseeing compliance of regula-tions, and facilitating more democratic access. Regulationsshould serve as incentives for the development and implemen-tation of new communications and information technologies.It is important to take into account the role that statesmust playin a changing society, where the speed of technological devel-opment makes the implementation of laws or rules for timelyregulation of new technological options very difficult, if notimpossible. Nevertheless, the state must monitor, regulate andguarantee the quality and accessibility of services.Usersmust understand that regulatory bodies are in charge
of looking out for their interests, but are also responsible forensuring that the rules for operators and private companiesare clear, which creates confidence in their operations andstimulates investment in the sector.
C H A P T E R 3
Benchmarking National TelecomRegulatory Authority Websites
in Latin America*
* Special thanks to Rossana Flores of Imaginar for her assistance in com-piling information and revising the final report.Translation from Spanish to English was by Barbara Fraser.
Hugo Carrión
3 . L A T I N A M E R I C A
For these reasons, NRAs cannot be sidelined from theopportunities offered by the internet and its applications. Theresponsibility to provide current, complete and reliable infor-mation to users, telecom operators, potential investors, themedia, researchers and the government can be facilitated bythe use of websites that combine appropriate informationarchitecture and functionality. The use of websites should beviewed not only from an instrumental standpoint, as a way ofincreasing competitiveness, but also from a global standpointof enhancing governance in the telecom sector.Because of the close relationship among telecoms, infor-
mation and communications technologies, and the internet,the regulatory entities’ websites should be a model of trans-parency, access, inclusion, quality of content, and useful andup-to-date information for the benefit of all who seek servicesand information.This study consists of four sections:
• General overview of Latin America: The first section pro-vides a summary of the telecommunications market in theregion, describing the role of the various national regulato-ry agencies and the evolution of privatization and liberal-ization processes
• Evaluation of websites:This sectionpresents the challengesin applying evaluation methodology. It also examines theimportance of the role played by websites in the work ofregulatory entities.
• Benchmarking Latin America’s national regulatoryauthorities: The third section presents the results of theevaluation of 20 regulatory entities in the region, includingthree Caribbean countries. All of the countries evaluatedhave websites in Spanish, except for Brazil, where Por-tuguese is spoken.
• Conclusions: Various conclusions are presented and rec-ommendations are offered to help NRA take steps towardthe enhancement and evolution of their websites.
General Overview of Latin America
Regional bodiesDuring the 1980s and 1990s, Latin America adopted a series ofneoliberal economic measures that tended toward liberaliza-tion and deregulation of markets. Thesemeasures were toutedby world leaders,2 international finance and multilateralorganizations, andwere promoted at international forums andevents where the economic policies that countries wouldadopt were discussed.Themost significant initiative implemented by Latin Amer-
ican countries grew out of theWashington Consensus,3 whichwas backed by international finance bodies such as theWorldBank and International Monetary Fund and recommended toother countries around the world.
Fiscal austerity, privatization, and market liberalization were thethree pillars of Washington Consensus advice throughout the1980s and 1990s. The Washington Consensus policies weredesigned to respond to the very real problems in Latin America,and made considerable sense. In the 1980s, the governments ofthose countries had often run huge deficits. Losses in inefficientgovernment enterprises contributed to those deficits. Insulatedfrom competition by protectionist measures, inefficient privatefirms forced customers to pay high prices. Loose monetary poli-cy led to inflation running out of control. Countries cannot per-sistently run large deficits; and sustained growth is not possiblewith hyperinflation. Some level of fiscal discipline is required.Most countries would be better off with governments focusing onproviding essential public services rather than running enterpris-es that would arguably perform better in the private sector, andso privatization often makes sense (Stiglitz 2003:53).
To a certain extent, these policies adopted by Latin Ameri-can countries had some logic. “In many developed — anddeveloped — countries, governments all too often spend toomuch energy doing things they shouldn’t do. This distractsthem from what they should be doing. The problem is not somuch that the government is too big, but that it is not doing theright thing.” (ibid.: 54). It was argued that the state should leavethe management and control of companies that were oncenatural state-run monopolies in the hands of the private sec-tor. Often the management of these companies was the resultof political appointments with few technical qualifications. “Ingeneral, competing private enterprises can perform such func-tionsmore efficiently.This is the argument for privatization…”(ibid.: 54) Private companies would be responsible for efficientmanagement of the services acquired, and users would bene-fit, especially in the cost and quality of these services. Unfortu-nately, the privatization process was not necessarilyaccompanied by strong, effective regulation to control the newprivate companies.Another place for dialogue and agreement, where the liber-
alization and deregulation of markets became important, wasthe Uruguay Round,4 in which there was international discus-sion of mechanisms for developing worldwide free trade. Oneof the topics was telecommunications and transportationservices. These initiatives show that during the 1980s and1990s, a new international order was taking shape, in whichthe neoliberal policies that countries imposed on theireconomies took priority. In the international context of inter-dependence, these initiatives responded to the interests ofinternational private enterprise, which neededmarket deregu-lation and elimination of state-run enterprises in variouscountries in order to expand. Unfortunately, this was notaccompanied by an equitable process in developing countries;in many cases, after implementing the policies recommendedby multilateral bodies, these countries experienced seriouseconomic crises that destabilized their governments.The much heralded benefits of privatization were not evi-
dent in practice, and the process did much harm to societies.
10
Jobs were not created, instead, employees who were laid offfrom the privatized companies swelled the ranks of the unem-ployed. Privatization was supposed to eliminate corruption, or“what economists call the ‘rent-seeking’ activity of governmentofficials who either skim off the profits of government enter-prises or award contracts and jobs to their friends. But in con-trast to what it was supposed to do, privatization has madematters so much worse that in many countries today privati-zation is jokingly referred to as ‘briberization’” (Stiglitz2003:53). In some Latin American countries, presidents havehad to resign because of corruption charges. If a government iscorrupt or its officials engage in practices that run counter tothe public good, privatization does not guarantee that thosepractices will change. If a government is corrupt, that samegovernment will handle the privatization process.It is important to clarify that themeasures taken responded
to the fact that in the 1980s, which is known as the ‘lost decade’because of its countless economic crises, state-run companiesoften operated at a loss because of poor management. Thetechnological model adopted by these companies did not takeadvantage of technological advances being implemented inother countries and accentuated the digital divide.These changes required clear legal structures and strong,
efficient regulatory mechanisms to stimulate expansion of themarket and efficiency in the companies, rather than whatactually happened—distrust ofmarkets and democratic insti-tutions. Unfortunately, in many cases poorly managed state-run companies operating at a loss gave way to privatecompanies that imposed their interests, and which the statecould not control, to the detriment of society.In the privatization and market deregulation that occurred
in Latin America, telecom companies andmarkets were covet-ed by foreign and national private investors.During the 1990s, the telecom sector in Latin America
showed significant growth,mainly because of amodernizationprocess that would turn over the administration, managementand control of what had been state-run monopolies to privateforeign companies (in other words, privatization) that imple-mented new technologies, especially in fixed and mobiletelephony and internet access.
The striking development of telecommunications in the region’scountries is partly due to thematuration of the business in devel-oped countries and partly to the difficulties in implementingreforms conducive to modernization and development of thesector in the poorest, most backward countries in the world;above all, though, it is due to structural transformations of thetelecommunications industry and reforms implemented in LatinAmerica and the Caribbean during the 1990s, which had signifi-cant consequences in the region’s telecommunications sector.[…] In the 1990s, significant institutional changes occurred inLatin America that had a strong impact on the performance ofthe telecommunications industry. The major basic telephonycompanies in the region were transferred to international eco-nomic agents, and legal frameworks were radically modified to
allow segmentation of the industry, aswell as the incorporation ofnew technologies, the development of lines of business that hadnot existed before, and the entry of new players into the respec-tive markets. Nevertheless, in the various scenarios that emergedafter the reforms, the State has continued to play an importantrole in developing this area, strengthening its role as guarantor ofthe efficient provision of telecommunications services in accor-dance with the needs of each country, within the framework ofthe new international economic orders (Rozas 2003).
The privatization process in Latin America during the 1990swas intense and accellerated. More than two-thirds of thecountries in the Latin American region had already partially orcompletely privatized their telecommunications companies(ibid.). The privatization process also was extremely varied,because it depended on each country and its market, thedegree of openness to new economic stakeholders, and theimplementation and planning of public telecommunicationspolicies that provided incentives or disincentives to thetelecommunications services industry. It is important toremember that telecom companies were the most highly val-ued in the privatization process. “According to data from theWorld Bank, the sale of state-run telecommunications compa-nies worldwide during the 1990s generated revenues of US$76billion, equivalent to 24 percent of all revenues from thisprocess. The bank determined that telecommunications com-panies were the sector that generated the greatest revenuefrom privatizations, surpassing companies in the electricitysector”(ibid.).The initial benefits of privatization made many people
believe that the principal problems5 in the telecom sectorwould be overcome. Unfortunately, although significantprogress has beenmade, there are still regions that lack accessto basic telecommunications services, which increases the dig-ital divide in the region.It is also important to note that while some Latin American
countries did not begin privatization processes, they also optedfor structural forms in which the regulatory framework wasmodified, allowing the entry of private operators who diversi-fied the range of services and access to new technologies.
Regulatory authorities in Latin AmericaWith the privatization process, many Latin American countriesestablished telecom regulatory authorities for oversight, man-agement and implementation of new regulations for thismarket.During the late 1990s, regional initiatives arose that allowed
the sharing of experiences, fostering cooperation in informa-tion about regulation of the telecom market. One such initia-tive was Regulatel, the Foro Latinoamericano de EntesReguladores de Telecomunicaciones (Latin American Forum ofTelecommunications Regulatory Authorities). Regulatel iscomprised of 20 regulatory agencies from Latin America, aswell as European regulatory entities, which act as observers.The first initiative arose in 1997, in Cancún, Mexico. The effortwas subsequently reinforced and the forum became more
B E N C H M A R K I N G N A T I O N A L T E L E C O M R E G U L A T O R Y A U T H O R I T Y W E B S I T E S
11
12
structured so as to project an image of Latin American unity onissues related to the regulation of telecommunications andtechnological advances in the field.Another organization, the Inter-AmericanTelecommunica-
tion Commission (CITEL) “…endeavors to make telecommu-nications a catalyst for the dynamic development of theAmericas by working with governments and the private sector.Under the auspices of the Organization of American States, itresides inWashington, DC, USA. It has 35 Member States andover 200 Associate Members. It has been entrusted by theHeads of State at the Summits of the Americas with specificmandates to intensify its activities in key areas …”6 This bodyis autonomous under the OAS Charter, statutes and mandatesof the General Assembly. Its goals include facilitating and pro-moting the development of telecommunications in the region.Finally, to facilitate regional efforts and promote the devel-
opment of telecommunications in the region, efforts have aris-en such as the Connectivity Agenda for the Americas, which isa “… conceptual framework that can be envisioned as anational, regional or sub-regional strategy for transforming thehemisphere’s countries into a knowledge-based society. TheAction Plan offers a basic three-step process for countriesinterested in formulating and implementing a connectivitystrategy. These are: evaluation and planning, implementationand valuation….”7
Regulatory challenges in the regionAs noted above, the privatization process in Latin Americaresponded to a decade, the 1980s, in which economic growthstagnated, countries’ indebtedness and default on credit obli-gations reached alarming levels, and governments soughtmechanisms for resolving the crisis.The responsewas found inthe Washington Consensus policies, which were backed byinternational finance bodies and recommended market liber-alization, fiscal austerity and privatization. In this process, thetelecom companies were themost coveted, and it was thoughtthat the arrival of outside economic agents bringing new tech-nology would narrow the technology gap.To a certain extent, the new technology that was imple-
mented and new services, such as mobile telephony, helpedmodernize the sector. Unfortunately, however, the access-related technology gaphas not yet been closed, as there are stillcountries in the region that lack generalized access to fixedtelephony. When countries set up their state-run enterprises,they subsidized service in areas with low population densitiesand remote areas far from cities. To a certain extent, this ful-filled a social function. Private enterprise, however, respondsto different requirements, and from the standpoint of this newmodel, funds established to develop universal service havemet expectations.The entry of private companies, most with foreign capital,
helped create a market of free competition, especially in serv-ices such as mobile telephony, internet service provision andcurrent converged services such as IPTV. Operators fight formarket share, and in many cases costs have come down, qual-
ity has improved and new services have been offered, enablingusers to choose the ones that best meet their needs.In this process, the creation of national regulatory authori-
ties has played an important role in oversight of companiesand consumer defense. The regulatory process did not accom-pany the privatization process from the start, but it is impor-tant to note the regional initiatives that have allowed theexchange of information and cooperation between successfulexperiences to achieve consistency in telecommunicationsregulatory policies.
Evaluation of Websites
Challenges in application of the methodologyThe methodology used in this study to evaluate the nationaltelecom regulatory authority websites in Latin America clearlydefines the aspects to be evaluated and the levels towhich theyshould be assigned based on real observation. The methodol-ogy is intended to minimise the evaluator’s subjectivity in theevaluation. As with any evaluation, however, this poses chal-lenges. The following describes these challenges and thestrategies used to address them.Using numerical categories for the evaluation, in this case 1
to 4, gives the observer the erroneous idea that the highestscore represents the ideal situation. It is therefore important toclarify that the assigned value does not rate the efficiency of thesite, but describes it and places it on a scale in terms of certainlevels of development from an emerging level to a transaction-al level, passing through more enhanced and interactivestages. It is important to clarify this aspect, because several cat-egories, by their nature, cannot reach the transactional level.For example, the mission statement and news cannot provideonline services (level 4). They could however, contain updatedinformation and a detailed explanation (level 2), and eveninclude elements that facilitate interactivity and user feedback(level 3).Another challenge posed by numerical scale is the limited
number of levels for describing intermediate stages. In this
3 . L A T I N A M E R I C A
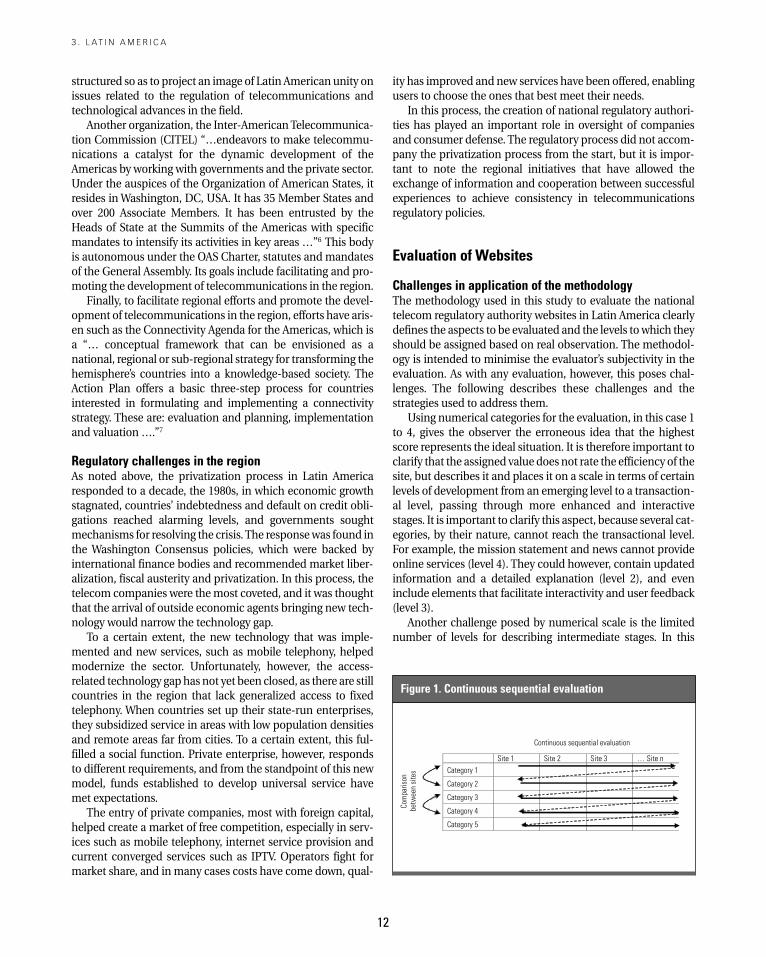
Figure 1. Continuous sequential evaluation
Continuous sequential evaluation
Com
paris
onbe
twee
nsi
tes
Site 1 Site 2 Site 3 … Site nCategory 1
Category 2
Category 3
Category 4
Category 5
case, therefore, intermediate scoreswere used. For example, if asite included sufficiently detailed explanations or completelyupdated information (level 2), but only took these factors part-ly into account, it received a score of 1.5. This helped make theevaluationmore precise, though it might lower the site’s overallscore, which otherwise would have received a rating of 2.One challenge posed by the evaluation of various sites is
that of equality — maintaining the same weighting criteriaregardless of the object being evaluated. One strategy used toensure equitable evaluationwas the application of the analysisto the entire set of sites only once,within a short period of time,to ensure that the evaluation criteria would not be affectedover time. For this study, the websites were reviewed between28 April and 2 May.
Another useful strategy for adjusting the evaluation is peercomparison, in which two sites are randomly compared andthe evaluation is applied again to a certain aspect. When theevaluation is finished, this can be useful for comparing thesites with the highest scores and adjusting for possible imbal-ances. This enables the researcher to ensure that the weightinghas been done correctly.The evaluation was relatively agile for the most advanced
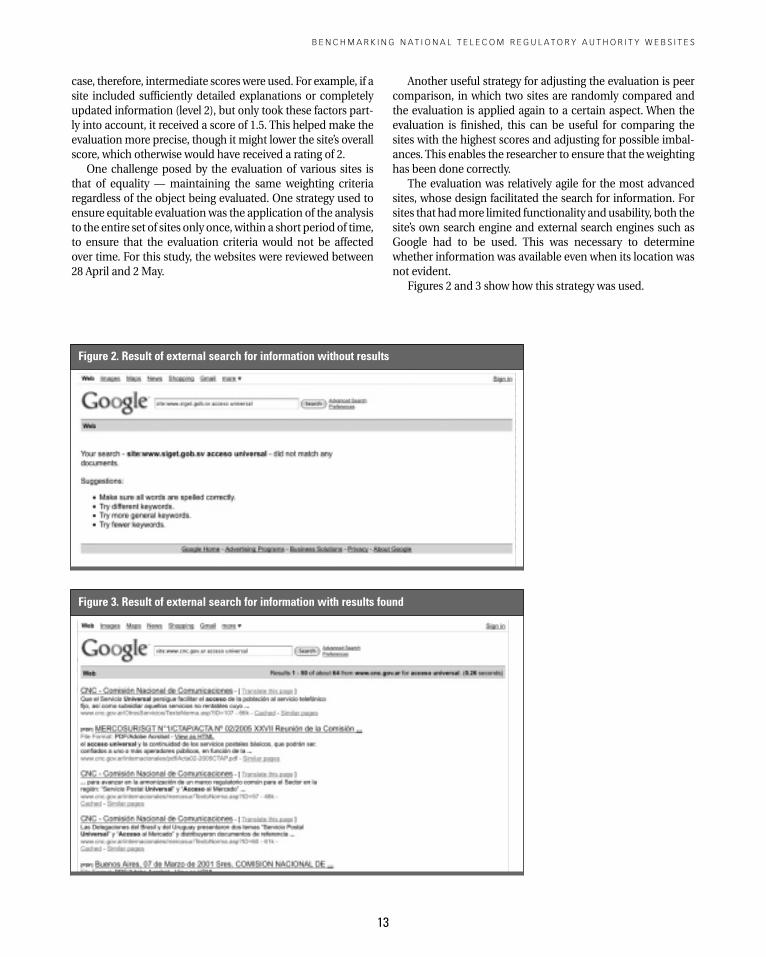
sites, whose design facilitated the search for information. Forsites that hadmore limited functionality andusability, both thesite’s own search engine and external search engines such asGoogle had to be used. This was necessary to determinewhether information was available even when its location wasnot evident.Figures 2 and 3 show how this strategy was used.
B E N C H M A R K I N G N A T I O N A L T E L E C O M R E G U L A T O R Y A U T H O R I T Y W E B S I T E S
13
Figure 3. Result of external search for information with results found
Figure 2. Result of external search for information without results
14
Finally, one obvious limitation of an evaluation such as thisis that it is done at one point in time; the scores show the situ-ation of the website on the date of the evaluation. Subsequentreview of thewebsites (twoweeks later) revealed that several ofthe sites had been updated, display of indicators wasenhanced, etc. To maintain the objectivity of the evaluation,however, the results described are those of the evaluation doneon the common review date.
Benchmarking NRA Websites in Latin America
This section presents the results of the evaluation of the web-sites of 20 national regulatory authorities in Latin America.Thegraphs show the countries in descending order, from the high-est score to the lowest. The average score for the region is
shown in a different color. As noted above, during the period ofevaluation, the Guatemalan website was not available.
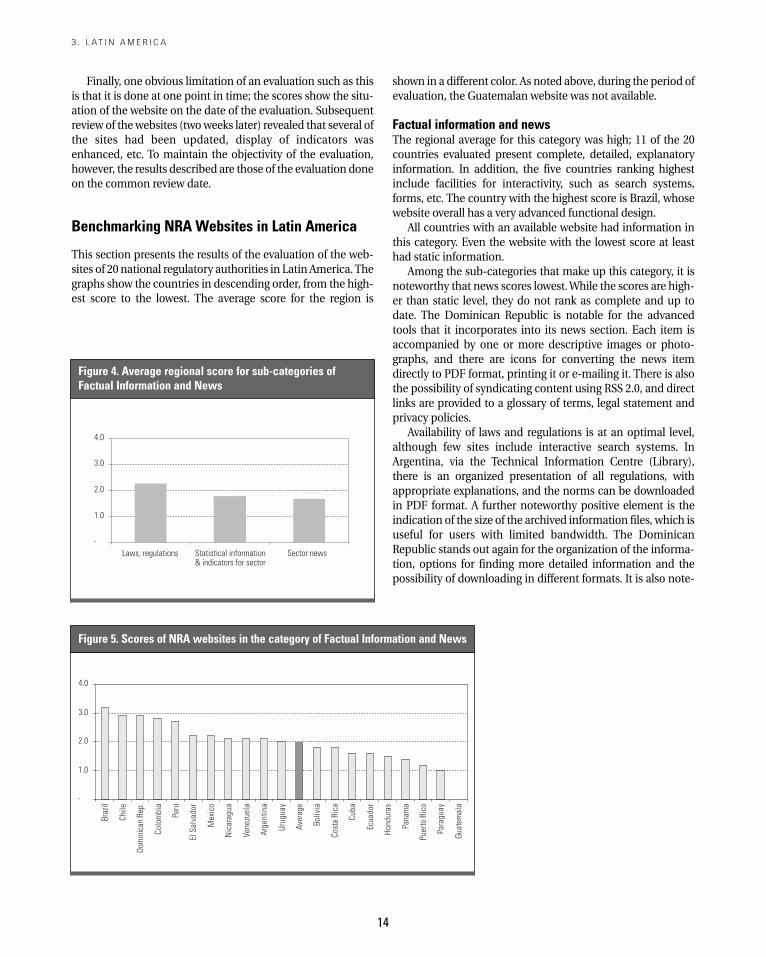
Factual information and newsThe regional average for this category was high; 11 of the 20countries evaluated present complete, detailed, explanatoryinformation. In addition, the five countries ranking highestinclude facilities for interactivity, such as search systems,forms, etc. The country with the highest score is Brazil, whosewebsite overall has a very advanced functional design.All countries with an available website had information in
this category. Even the website with the lowest score at leasthad static information.Among the sub-categories that make up this category, it is
noteworthy that news scores lowest.While the scores are high-er than static level, they do not rank as complete and up todate. The Dominican Republic is notable for the advancedtools that it incorporates into its news section. Each item isaccompanied by one or more descriptive images or photo-graphs, and there are icons for converting the news itemdirectly to PDF format, printing it or e-mailing it. There is alsothe possibility of syndicating content using RSS 2.0, and directlinks are provided to a glossary of terms, legal statement andprivacy policies.Availability of laws and regulations is at an optimal level,
although few sites include interactive search systems. InArgentina, via the Technical Information Centre (Library),there is an organized presentation of all regulations, withappropriate explanations, and the norms can be downloadedin PDF format. A further noteworthy positive element is theindication of the size of the archived information files, which isuseful for users with limited bandwidth. The DominicanRepublic stands out again for the organization of the informa-tion, options for finding more detailed information and thepossibility of downloading in different formats. It is also note-
3 . L A T I N A M E R I C A
Figure 4. Average regional score for sub-categories ofFactual Information and News
-
1.0
2.0
3.0
4.0
Laws, regulations Statistical information& indicators for sector
Sector news
Figure 5. Scores of NRA websites in the category of Factual Information and News
-
1.0
2.0
3.0
4.0
Braz
il
Chile
Dom
inic
anRe
p.
Colo
mbi
a
Peru
ElSa
lvad
or
Mex
ico
Nic
arag
ua
Vene
zuel
a
Arge
ntin
a
Urug
uay
Aver
age
Boliv
ia
Cost
aRi
ca
Cuba
Ecua
dor
Hond
uras
Pana
ma
Puer
toRi
co
Para
guay
Guat
emal
a
worthy that visitors to the site can download the programsneeded for viewing the documents, specifically Acrobat Read-er for PDF files andWordViewer for DOC files.Finally, the statistical and sector information on the sites
tends to be complete, with only a few cases of very outdatedinformation. Several sites had information from 2007. Somesites had detailed information broken down sufficiently formore in-depth analysis. The Peruvian site stood out because itgave the user access to statistical information in spreadsheetformat. Colombia is also noteworthy, as it uses the UnifiedInformation System for the Telecommunications Sector (Sis-tema de Información Unificado del Sector de Telecomunica-ciones, SIUST), a specialized application for statistical queriesof indicators. Brazil also uses several advanced query systems.In conclusion, there is a small group of countries that have
little to improve in this area and some sites have reached a fair-ly optimal level of interactivity. Most countries, however, have
many opportunities to enhance, complete and update infor-mation and incorporate advanced tools to facilitate user par-ticipation.
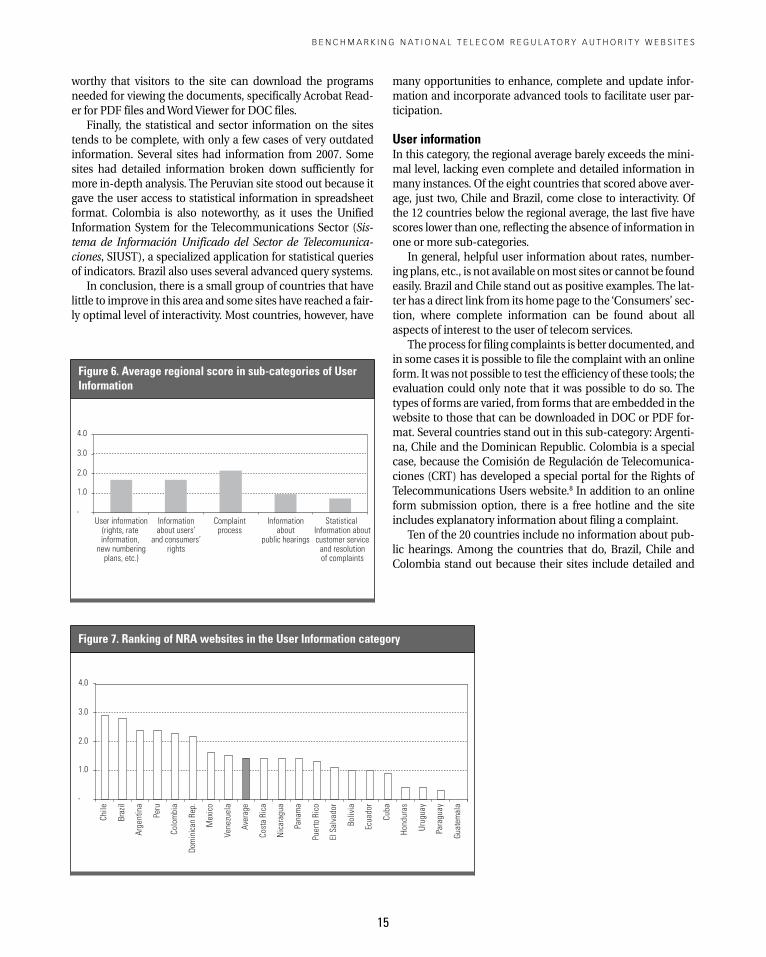
User informationIn this category, the regional average barely exceeds the mini-mal level, lacking even complete and detailed information inmany instances. Of the eight countries that scored above aver-age, just two, Chile and Brazil, come close to interactivity. Ofthe 12 countries below the regional average, the last five havescores lower than one, reflecting the absence of information inone or more sub-categories.In general, helpful user information about rates, number-
ing plans, etc., is not available onmost sites or cannot be foundeasily. Brazil and Chile stand out as positive examples. The lat-ter has a direct link from its home page to the ‘Consumers’ sec-tion, where complete information can be found about allaspects of interest to the user of telecom services.The process for filing complaints is better documented, and
in some cases it is possible to file the complaint with an onlineform. It was not possible to test the efficiency of these tools; theevaluation could only note that it was possible to do so. Thetypes of forms are varied, from forms that are embedded in thewebsite to those that can be downloaded in DOC or PDF for-mat. Several countries stand out in this sub-category: Argenti-na, Chile and the Dominican Republic. Colombia is a specialcase, because the Comisión de Regulación de Telecomunica-ciones (CRT) has developed a special portal for the Rights ofTelecommunications Users website.8 In addition to an onlineform submission option, there is a free hotline and the siteincludes explanatory information about filing a complaint.Ten of the 20 countries include no information about pub-
lic hearings. Among the countries that do, Brazil, Chile andColombia stand out because their sites include detailed and
B E N C H M A R K I N G N A T I O N A L T E L E C O M R E G U L A T O R Y A U T H O R I T Y W E B S I T E S
15
Figure 7. Ranking of NRA websites in the User Information category
-
1.0
2.0
3.0
4.0
Chile
Braz
il
Arge
ntin
a
Peru
Colo
mbi
a
Dom
inic
anRe
p.
Mex
ico
Vene
zuel
a
Aver
age
Cost
aRi
ca
Nic
arag
ua
Pana
ma
Puer
toRi
co
ElSa
lvad
or
Boliv
ia
Ecua
dor
Cuba
Hond
uras
Urug
uay
Para
guay
Guat
emal
a
Figure 6. Average regional score in sub-categories of UserInformation
-
1.0
2.0
3.0
4.0
User information(rights, rateinformation,
new numberingplans, etc.)
Informationabout users’
and consumers’rights
Complaintprocess
Informationabout
public hearings
StatisticalInformation aboutcustomer service
and resolutionof complaints
16
even historical information about consultation processes andpublic debate.Statistical information about customer service and resolu-
tion of complaints is generally inadequate. Twelve countrieslack such information. Of the others, Peru and Brazil have paidmore attention to the topic. Perumaybe the only case inwhichinformation is provided about the office that resolves com-plaints. Statistical information is available in spreadsheet for-mat. Perhaps the only limitation of Peru’s site is that there areproblems displaying the page with browsers other than Inter-net Explorer (such as Mozilla Firefox, SeaMonkey or Opera).
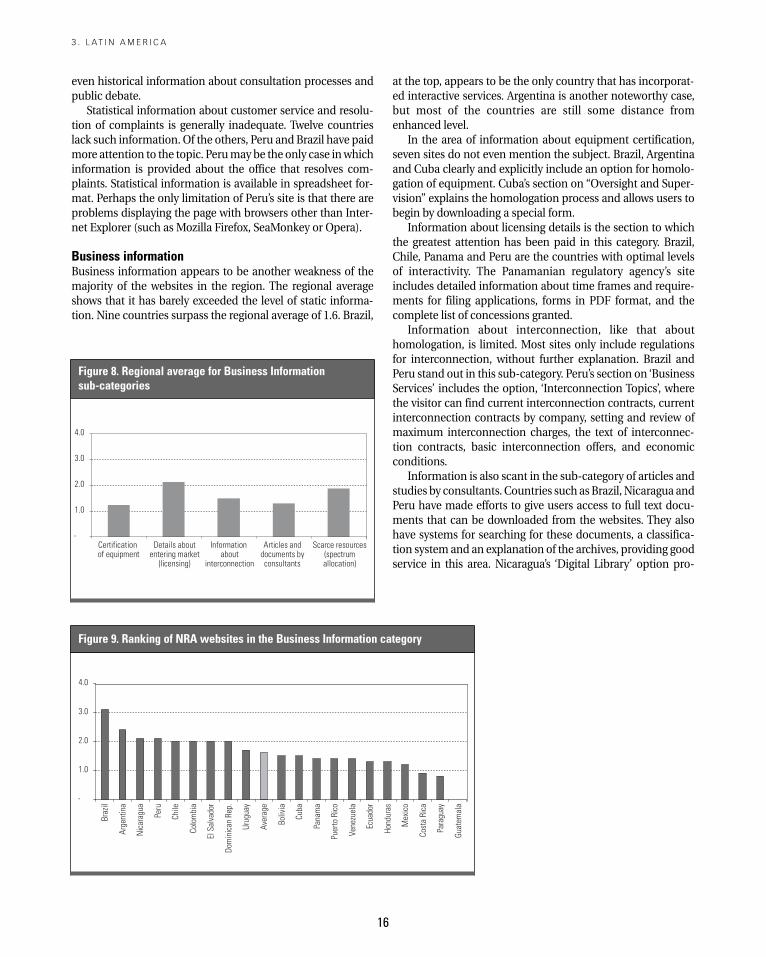
Business informationBusiness information appears to be another weakness of themajority of the websites in the region. The regional averageshows that it has barely exceeded the level of static informa-tion. Nine countries surpass the regional average of 1.6. Brazil,
at the top, appears to be the only country that has incorporat-ed interactive services. Argentina is another noteworthy case,but most of the countries are still some distance fromenhanced level.In the area of information about equipment certification,
seven sites do not even mention the subject. Brazil, Argentinaand Cuba clearly and explicitly include an option for homolo-gation of equipment. Cuba’s section on “Oversight and Super-vision” explains the homologation process and allows users tobegin by downloading a special form.Information about licensing details is the section to which
the greatest attention has been paid in this category. Brazil,Chile, Panama and Peru are the countries with optimal levelsof interactivity. The Panamanian regulatory agency’s siteincludes detailed information about time frames and require-ments for filing applications, forms in PDF format, and thecomplete list of concessions granted.Information about interconnection, like that about
homologation, is limited. Most sites only include regulationsfor interconnection, without further explanation. Brazil andPeru stand out in this sub-category. Peru’s section on ‘BusinessServices’ includes the option, ‘Interconnection Topics’, wherethe visitor can find current interconnection contracts, currentinterconnection contracts by company, setting and review ofmaximum interconnection charges, the text of interconnec-tion contracts, basic interconnection offers, and economicconditions.Information is also scant in the sub-category of articles and
studies by consultants. Countries such asBrazil, Nicaragua andPeru have made efforts to give users access to full text docu-ments that can be downloaded from the websites. They alsohave systems for searching for these documents, a classifica-tion system and an explanation of the archives, providing goodservice in this area. Nicaragua’s ‘Digital Library’ option pro-
3 . L A T I N A M E R I C A
Figure 9. Ranking of NRA websites in the Business Information category
-
1.0
2.0
3.0
4.0
Braz
il
Arge
ntin
a
Nic
arag
ua
Peru
Chile
Colo
mbi
a
ElSa
lvad
or
Dom
inic
anRe
p.
Urug
uay
Aver
age
Boliv
ia
Cuba
Pana
ma
Puer
toRi
co
Vene
zuel
a
Ecua
dor
Hond
uras
Mex
ico
Cost
aRi
ca
Para
guay
Guat
emal
a
Figure 8. Regional average for Business Informationsub-categories
-
1.0
2.0
3.0
4.0
Certification of equipment
Details aboutentering market
(licensing)
Informationabout
interconnection
Articles anddocuments byconsultants
Scarce resources(spectrumallocation)
vides access to specialized studies and articles about the sectorthat can be downloaded in PDF format.Finally, all of the sites include information about spectrum
management and allocation of scarce resources, although theinformation is mainly static. Argentina, Brazil and El Salvadornot only have complete information, but also facilitate accessto it using interactive tools. In the ‘Telecommunications Sector’section of El Salvador’s website, the ‘Spectrum’ option containscomplete information about the frequency allocation chart,bulletins, instructions, concession procedures, regulations,etc.
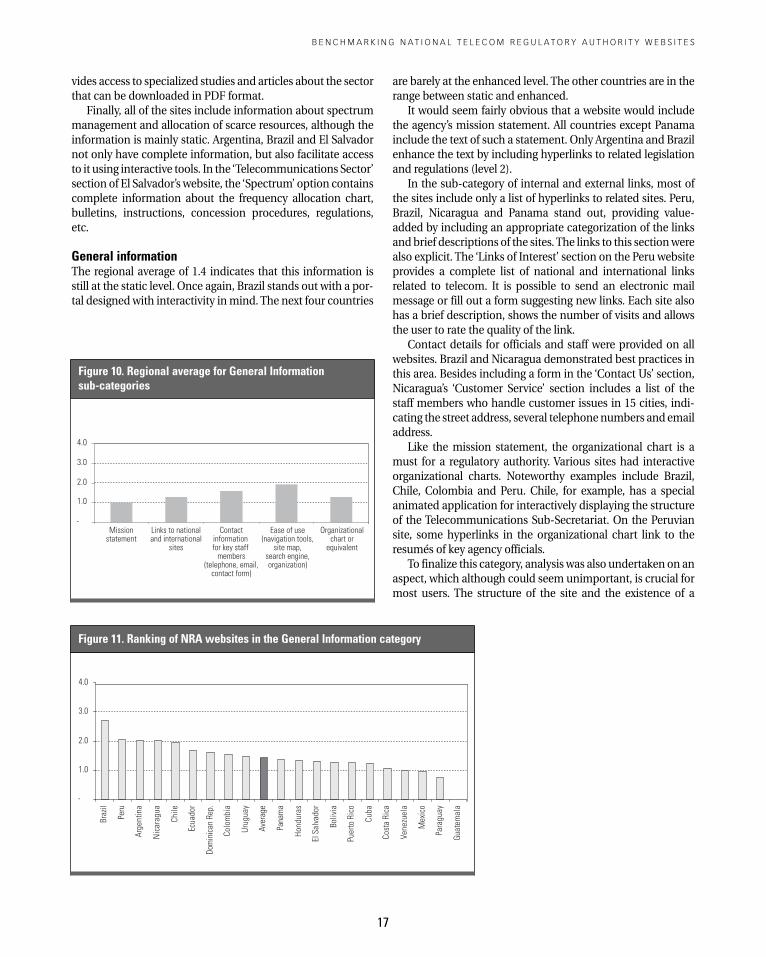
General informationThe regional average of 1.4 indicates that this information isstill at the static level. Once again, Brazil stands out with a por-tal designedwith interactivity inmind. The next four countries
are barely at the enhanced level. The other countries are in therange between static and enhanced.It would seem fairly obvious that a website would include
the agency’s mission statement. All countries except Panamainclude the text of such a statement. Only Argentina and Brazilenhance the text by including hyperlinks to related legislationand regulations (level 2).In the sub-category of internal and external links, most of
the sites include only a list of hyperlinks to related sites. Peru,Brazil, Nicaragua and Panama stand out, providing value-added by including an appropriate categorization of the linksandbrief descriptions of the sites.The links to this sectionwerealso explicit. The ‘Links of Interest’ section on the Peru websiteprovides a complete list of national and international linksrelated to telecom. It is possible to send an electronic mailmessage or fill out a form suggesting new links. Each site alsohas a brief description, shows the number of visits and allowsthe user to rate the quality of the link.Contact details for officials and staff were provided on all
websites. Brazil and Nicaragua demonstrated best practices inthis area. Besides including a form in the ‘Contact Us’ section,Nicaragua’s ‘Customer Service’ section includes a list of thestaff members who handle customer issues in 15 cities, indi-cating the street address, several telephonenumbers and emailaddress.Like the mission statement, the organizational chart is a
must for a regulatory authority. Various sites had interactiveorganizational charts. Noteworthy examples include Brazil,Chile, Colombia and Peru. Chile, for example, has a specialanimated application for interactively displaying the structureof the Telecommunications Sub-Secretariat. On the Peruviansite, some hyperlinks in the organizational chart link to theresumés of key agency officials.To finalize this category, analysis was also undertaken on an
aspect, which although could seem unimportant, is crucial formost users. The structure of the site and the existence of a
B E N C H M A R K I N G N A T I O N A L T E L E C O M R E G U L A T O R Y A U T H O R I T Y W E B S I T E S
17
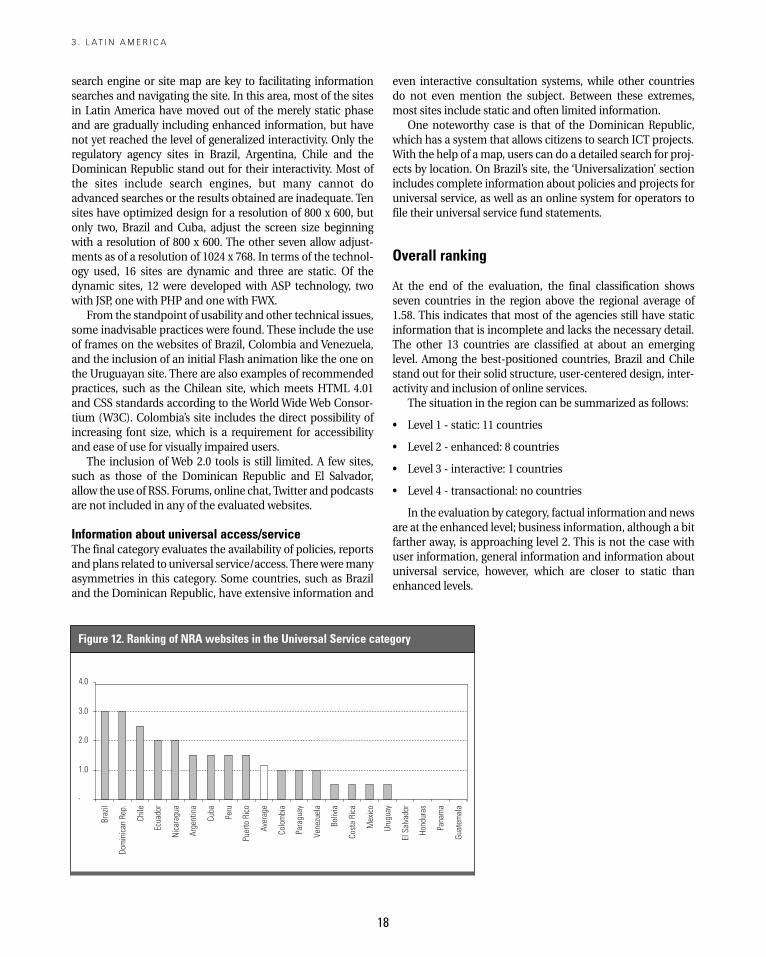
Figure 11. Ranking of NRA websites in the General Information category
-
1.0
2.0
3.0
4.0
Braz
il
Peru
Arge
ntin
a
Nic
arag
ua
Chile
Ecua
dor
Dom
inic
anRe
p.
Colo
mbi
a
Urug
uay
Aver
age
Pana
ma
Hond
uras
ElSa
lvad
or
Boliv
ia
Puer
toRi
co
Cuba
Cost
aRi
ca
Vene
zuel
a
Mex
ico
Para
guay
Guat
emal
a
Figure 10. Regional average for General Informationsub-categories
-
1.0
2.0
3.0
4.0
Missionstatement
Links to nationaland international
sites
Contactinformationfor key staff
members(telephone, email,
contact form)
Ease of use(navigation tools,
site map,search engine,organization)
Organizationalchart or
equivalent
18
search engine or site map are key to facilitating informationsearches and navigating the site. In this area, most of the sitesin Latin America have moved out of the merely static phaseand are gradually including enhanced information, but havenot yet reached the level of generalized interactivity. Only theregulatory agency sites in Brazil, Argentina, Chile and theDominican Republic stand out for their interactivity. Most ofthe sites include search engines, but many cannot doadvanced searches or the results obtained are inadequate. Tensites have optimized design for a resolution of 800 x 600, butonly two, Brazil and Cuba, adjust the screen size beginningwith a resolution of 800 x 600. The other seven allow adjust-ments as of a resolution of 1024 x 768. In terms of the technol-ogy used, 16 sites are dynamic and three are static. Of thedynamic sites, 12 were developed with ASP technology, twowith JSP, one with PHP and one with FWX.From the standpoint of usability and other technical issues,
some inadvisable practices were found. These include the useof frames on the websites of Brazil, Colombia and Venezuela,and the inclusion of an initial Flash animation like the one onthe Uruguayan site. There are also examples of recommendedpractices, such as the Chilean site, which meets HTML 4.01and CSS standards according to theWorld WideWeb Consor-tium (W3C). Colombia’s site includes the direct possibility ofincreasing font size, which is a requirement for accessibilityand ease of use for visually impaired users.The inclusion of Web 2.0 tools is still limited. A few sites,
such as those of the Dominican Republic and El Salvador,allow the use of RSS. Forums, online chat, Twitter and podcastsare not included in any of the evaluated websites.
Information about universal access/serviceThe final category evaluates the availability of policies, reportsand plans related to universal service/access.Thereweremanyasymmetries in this category. Some countries, such as Braziland the Dominican Republic, have extensive information and
even interactive consultation systems, while other countriesdo not even mention the subject. Between these extremes,most sites include static and often limited information.One noteworthy case is that of the Dominican Republic,
which has a system that allows citizens to search ICT projects.With the help of amap, users can do a detailed search for proj-ects by location. On Brazil’s site, the ‘Universalization’ sectionincludes complete information about policies and projects foruniversal service, as well as an online system for operators tofile their universal service fund statements.
Overall ranking
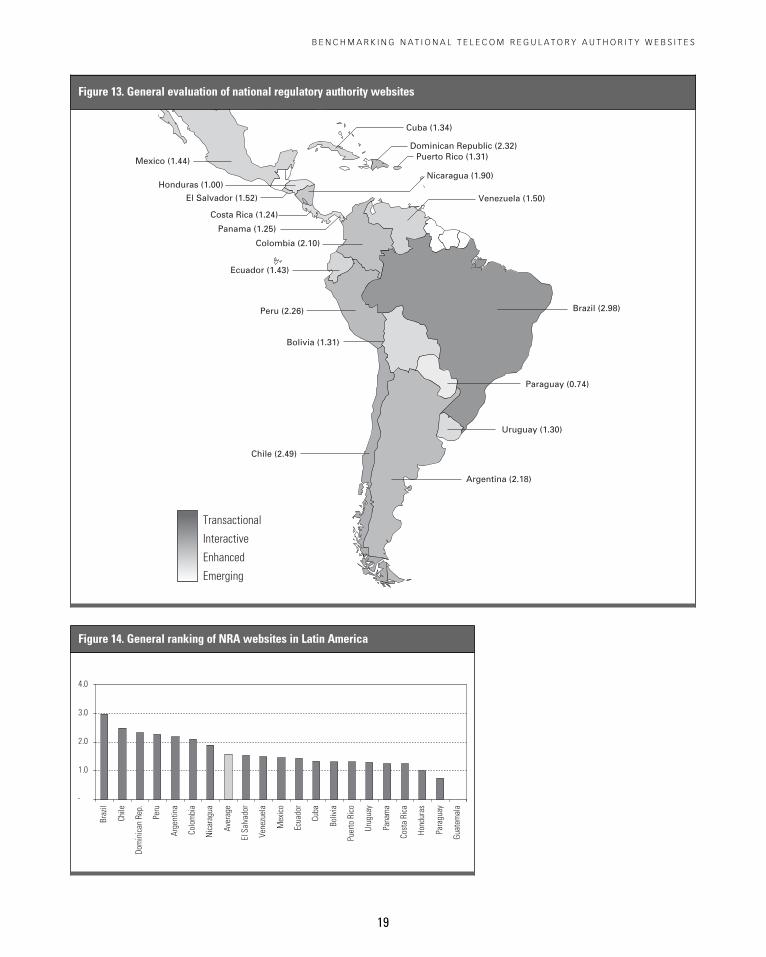
At the end of the evaluation, the final classification showsseven countries in the region above the regional average of1.58. This indicates that most of the agencies still have staticinformation that is incomplete and lacks the necessary detail.The other 13 countries are classified at about an emerginglevel. Among the best-positioned countries, Brazil and Chilestand out for their solid structure, user-centered design, inter-activity and inclusion of online services.The situation in the region can be summarized as follows:
• Level 1 - static: 11 countries
• Level 2 - enhanced: 8 countries
• Level 3 - interactive: 1 countries
• Level 4 - transactional: no countries
In the evaluation by category, factual information and newsare at the enhanced level; business information, although a bitfarther away, is approaching level 2. This is not the case withuser information, general information and information aboutuniversal service, however, which are closer to static thanenhanced levels.
3 . L A T I N A M E R I C A
Figure 12. Ranking of NRA websites in the Universal Service category
-
1.0
2.0
3.0
4.0
Braz
il
Dom
inic
anRe
p.
Chile
Ecua
dor
Nic
arag
ua
Arge
ntin
a
Cuba
Peru
Puer
toRi
co
Aver
age
Colo
mbi
a
Para
guay
Vene
zuel
a
Boliv
ia
Cost
aRi
ca
Mex
ico
Urug
uay
ElSa
lvad
or
Hond
uras
Pana
ma
Guat
emal
a
B E N C H M A R K I N G N A T I O N A L T E L E C O M R E G U L A T O R Y A U T H O R I T Y W E B S I T E S
19
Figure 13. General evaluation of national regulatory authority websites
Cuba (1.34)
Colombia (2.10)
Peru (2.26)
Bolivia (1.31)
Chile (2.49)
Mexico (1.44)
Honduras (1.00)Nicaragua (1.90)
El Salvador (1.52)
Costa Rica (1.24)
Panama (1.25)
Dominican Republic (2.32)
Paraguay (0.74)
Brazil (2.98)
Uruguay (1.30)
Ecuador (1.43)
Argentina (2.18)
Venezuela (1.50)
Puerto Rico (1.31)
Transactional
Interactive
Enhanced
Emerging
Figure 14. General ranking of NRA websites in Latin America
-
1.0
2.0
3.0
4.0
Braz
il
Chile
Dom
inic
anRe
p.
Peru
Arge
ntin
a
Colo
mbi
a
Nic
arag
ua
Aver
age
ElSa
lvad
or
Vene
zuel
a
Mex
ico
Ecua
dor
Cuba
Boliv
ia
Puer
toRi
co
Urug
uay
Pana
ma
Cost
aRi
ca
Hond
uras
Para
guay
Guat
emal
a
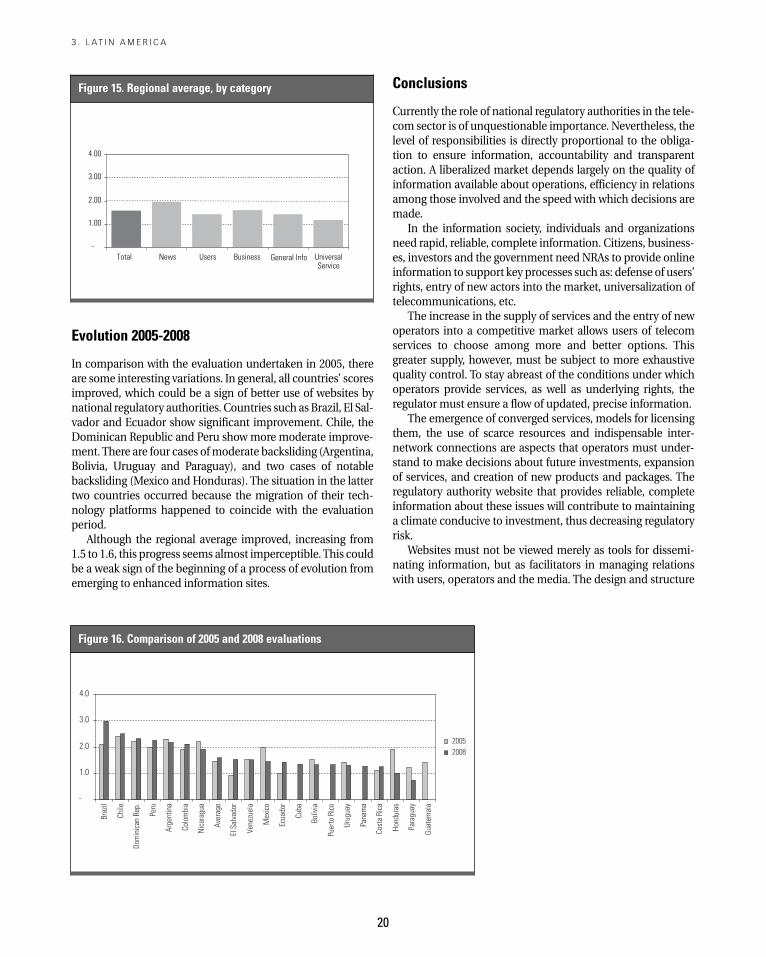
20
Evolution 2005-2008
In comparison with the evaluation undertaken in 2005, thereare some interesting variations. In general, all countries’ scoresimproved, which could be a sign of better use of websites bynational regulatory authorities. Countries such asBrazil, El Sal-vador and Ecuador show significant improvement. Chile, theDominican Republic and Peru showmore moderate improve-ment.There are four cases ofmoderate backsliding (Argentina,Bolivia, Uruguay and Paraguay), and two cases of notablebacksliding (Mexico and Honduras). The situation in the lattertwo countries occurred because the migration of their tech-nology platforms happened to coincide with the evaluationperiod.Although the regional average improved, increasing from
1.5 to 1.6, this progress seems almost imperceptible.This couldbe a weak sign of the beginning of a process of evolution fromemerging to enhanced information sites.
Conclusions
Currently the role of national regulatory authorities in the tele-com sector is of unquestionable importance. Nevertheless, thelevel of responsibilities is directly proportional to the obliga-tion to ensure information, accountability and transparentaction. A liberalized market depends largely on the quality ofinformation available about operations, efficiency in relationsamong those involved and the speed with which decisions aremade.In the information society, individuals and organizations
need rapid, reliable, complete information. Citizens, business-es, investors and the government need NRAs to provide onlineinformation to support key processes such as: defense of users’rights, entry of new actors into the market, universalization oftelecommunications, etc.The increase in the supply of services and the entry of new
operators into a competitive market allows users of telecomservices to choose among more and better options. Thisgreater supply, however, must be subject to more exhaustivequality control. To stay abreast of the conditions under whichoperators provide services, as well as underlying rights, theregulator must ensure a flow of updated, precise information.The emergence of converged services, models for licensing
them, the use of scarce resources and indispensable inter-network connections are aspects that operators must under-stand to make decisions about future investments, expansionof services, and creation of new products and packages. Theregulatory authority website that provides reliable, completeinformation about these issues will contribute to maintaininga climate conducive to investment, thus decreasing regulatoryrisk.Websites must not be viewed merely as tools for dissemi-
nating information, but as facilitators in managing relationswith users, operators and the media. The design and structure
3 . L A T I N A M E R I C A
Figure 16. Comparison of 2005 and 2008 evaluations
-
1.0
2.0
3.0
4.0
2005 2008
Braz
il
Chile
Dom
inic
anRe
p.
Peru
Arge
ntin
a
Colo
mbi
a
Nic
arag
ua
Aver
age
ElSa
lvad
or
Vene
zuel
a
Mex
ico
Ecua
dor
Cuba
Boliv
ia
Puer
toRi
co
Urug
uay
Pana
ma
Cost
aRi
ca
Hond
uras
Para
guay
Guat
emal
a
Figure 15. Regional average, by category
-
1.00
2.00
3.00
4.00
Total News Users Business General Info UniversalService
of a website, therefore, must not be accidental, but mustrespond to the needs of the various stakeholders in the sector.In Latin America, the national regulatory authorities have
much room for improvement. They are still considered as‘emerging’. Excellent individual practices explain certain spe-cific initiatives, but do not add up to a regional process of evo-lution toward the subsequent stages of efficient use oftechnology. The goals of interactivity, and even more of trans-actionality, still seem a long way off in most countries. More-over, the lag in several countries is alarming, and telecomregulators should become pioneers in the efficient use of ICTsin their own administration.
Recommendations
• National regulatory authorities must clearly identify thebenefits that result from strategic use of their organization-al websites, so as to allocate sufficient effort and resourcesto ensure the availability of the site, updating of informa-tion, quality of content and interactivity of the services.
• In function and outcomes obtained, national regulatoryauthorities should place greater emphasis on includinginformation about the rights of users and consumers. Theyshould also improve the quality and level of detail of thebasic information needed by businesses and investors.
• Plans andpolicies for universal telecomservice should havea prominent place on regulatory agencies’ websites, partic-ularly because these public policies and their implementa-tion will contribute to an increase in the number of peoplewho have access to information and online services.
• It is important to keep inmind that the correct definition ofthe information architecture for a website, as well as itsfunctional design, require a user-centered strategy thatmakes it easy to find information, leverages participatoryprocesses and includes interactive services supported bymodern technologies that are currently available, but areunder-used.
• Compliance with standards, use of open formats and com-pliance with norms for accessibility should also be takeninto consideration in the design or redesign of a website. Allof these conditions help ensure that the website facilitatesthe process of mediation between information and user.
• The results of this evaluation should be shared with thenational regulatory authorities so that they can serve asinput for beginning the enhancement of the structure andthe redesign of agency websites.
Notes1 Interview with Manuel Castells by Milagros Pérez Oliva, published by thedaily El País of Madrid and entitled, “El Poder tiene miedo de Internet”(“Power Fears the Internet”). The interview highlights the importance ofeducation: “(...) without education, technology is useless. In Spain, the so-called digital divide is a matter of age. The data are very clear: amongthose over age 55, only 9 percent are Internet users, but among thoseunder 25, the figure is 90 percent (…)Whenmy generation is gone, therewill be no digital divide in access. In the Internet society, however, thecomplicated thing is not learning to navigate, but knowing where to go,where to look for what you want to find, and what to do with what youfind. That requires education. In fact, the Internet amplifies the oldestsocial divide in history, which is in levels of education. The fact that 55percent of adults in Spain have not completed secondary school — that isthe real digital divide.” http://portal.educ.ar
2World leaders who promoted neoliberal policies, such as U.S. PresidentRonald Regan and British PrimeMinister Margaret Thatcher, who gov-erned in the 1980s.
3WhatWashington Means by Policy Reform, which became known as “TheWashington Consensus,” was drafted by JohnWilliamson in 1989 for aconference organized by the Institute for International Economics.
4 Multilateral Trade Negotiations – Uruguay Round – Trade NegotiationsCommittee. The Final Act Embodying the Results of the Uruguay Round ofMultilateral Trade Negotiations, Marrakesh, 15 April 1994. The issues ofFinancial Services and Information Technology are introduced.
5 “…low telephone penetration, inadequate levels of investment, serioustechnological backwardness and poor quality of services…” Informationtaken from the study by Rozas (2005).
6 http://www.citel.oas.org/what_is_citel.asp
7 http://www.citel.oas.org/sp/Connectividad/Final%20Spanish%20ACA-PAO-march-5-2003-v3_e.pdf
8 See: http://www.comusuarios.gov.co
B E N C H M A R K I N G N A T I O N A L T E L E C O M R E G U L A T O R Y A U T H O R I T Y W E B S I T E S
21
22
Bibliography
CITE (2003). Agenda de Conectividad para las Américas: Plan de Quito.March.
ECLAC, ICA IDRC- CRDI, @LIS EUROPEAID (2005). ¿En qué situación seencuentra América Latina y el Caribe en relación con el Plan deAcción eLAC 2007? Información disponible. Observatorio para laSociedad de la Información en Latinoamérica y el Caribe (OSILAC),November.
Mahan A.K. (2005) “Benchmarking African NRAWebsites”, in Mahan, A.K.and MelodyW.H. Stimulating Investment in Network Development:Roles for Regulators.WDR and infoDev.
Rozas Balbontín, Patriciom (2002). Competencia y conflictos regulatoriosen la industria de las telecomunicaciones de América Latina. GestiónPública Series. Santiago: ECLAC – ILPES.
Rozas Balbontín, Patricio (2005). Privatizaciones, reestructuración industri-al y prácticas regulatorias en el sector telecomunicaciones. Santiago:ECLAC Human Resources and Infrastructure Division, June.
Stiglitz, Joseph E. (2003). Globalization and Its Discontents. NewYork: Nor-ton.
Stiglitz, Joseph E. (2004) El Consenso Post- Consenso deWashington.Barcelona.
Walter, Jorge, and Senén, Cecilia. (2008) La privatización de las telecomu-nicaciones en América Latina. Estudio comparado. Paper preparedfor ECLAC.
Online resources
Inter-American Telecommunications Commissionhttp://www.citel.oas.org
Economic Commission for Latin America and the Caribbeanhttp://www.eclac.org/analisis/
Foro Latinoamericano de Entes Reguladores de Telecomunicacioneshttp://www.regulatel.org
World Dialogue on Regulations (WDR)http://www.regulateonline.org
Universidad de San Andrés – Argentinahttp://www.udesa.edu.ar
3 . L A T I N A M E R I C A
23
C H A P T E R 4
Benchmarking Caribbean andNorth American National Telecom
Regulary Authority WebsitesOpal Lawton
Introduction
In the post privatisation and competition era the telecommu-nications industry has entered a new phase of evolution, theconverging of the once separate industries of telecommunica-tions, information technology (internet) and broadcasting(cable television). This convergence has ushered in the infor-mation age where information communication and technolo-gy (ICT) is the new development mantra.ICT is recognised globally as a key vehicle to foster eco-
nomic development. As a result of this international develop-ment agencies such as the United Nations (UN) are focussingon ICT as a critical component of the overall developmentagenda.The UN General Assembly in the World Summit on the
Information Society (WSIS) clearly articulated the role ICT isexpected to play in the new information society. As a conse-quence of this, action line C7 of WSIS Implementation Planrelates specifically to the role of ICT applications in a range ofe-initiatives, including e-government. Governments aroundthe globe have been developing e-government strategies withthe hope of putting their countries on the path to reap the ben-efits of the information society.As the implementing agency for government telecommuni-
cations policies national regulatory agencies (NRAs) are pre-sented with new challenges and opportunities as they seek toensure the orderly and sustainable development of the ICTsector.In discharging their responsibilities the NRA can potential-
ly use their online presence via website to:
1) Provide access to information and services.
2) Address the needs of their various stakeholders; includingcitizens, service providers, investors and the government.
3) Allow greater participation in the regulatory processes.
4) Demonstrate transparency in processes and transactions.
The effectiveness of NRA websites will depend on factorssuch as:
1) The level of access the general population has to ICTresources such as internet access and computers.
2) The literacy level and computer literacy of the population.
3) The availability of skilled resources to the NRA.
4) Overall transparency in the sector and access to operatorinformation.
5) The extent to which the media and other intermediaries,such asNGOs, further diffuse the regulatory news andotherinformation available on websites.
Given the link between economic development and accessto and the use of ICT, governments and government agenciesneed to find the resources to invest in the infrastructure andother capacities to ensure that citizens have access to and thecapability to use the technology.Equally important, websites need to be effectively designed
so that they can in fact enhance service delivery. Most NRAs dohave a website. Very few, particularly in Africa, do not. But,some NRAs although they have websites, don’t use them in aneffectiveway and don’t allocate resources to their development.
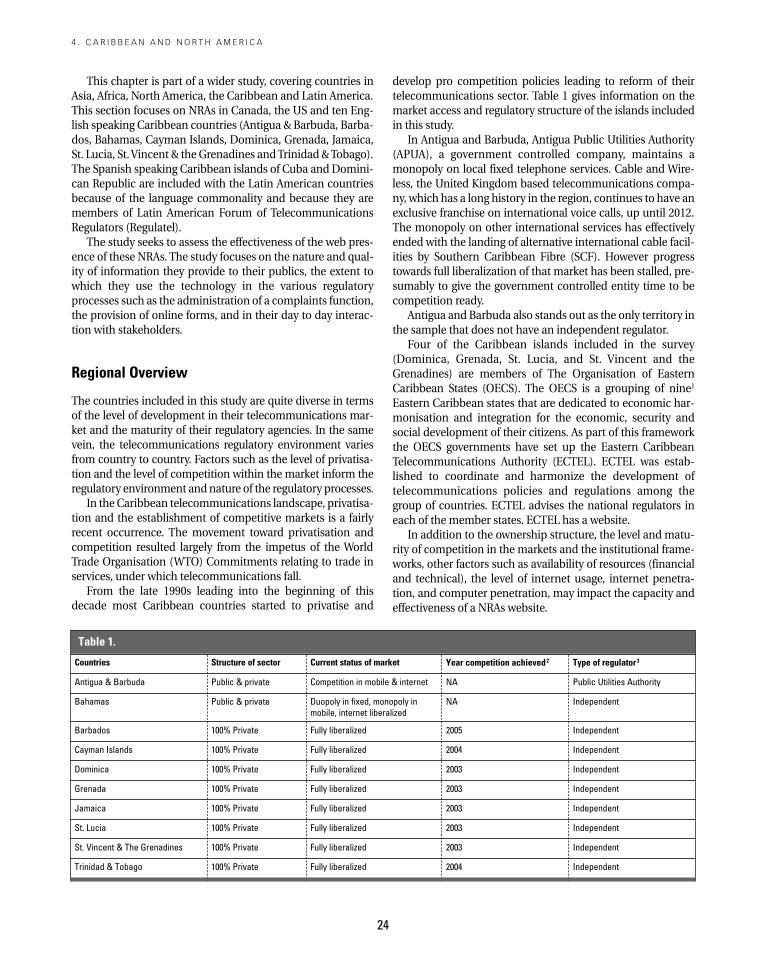
4 . C A R I B B E A N A N D N O R T H A M E R I C A
This chapter is part of a wider study, covering countries inAsia, Africa, North America, the Caribbean and Latin America.This section focuses on NRAs in Canada, the US and ten Eng-lish speaking Caribbean countries (Antigua & Barbuda, Barba-dos, Bahamas, Cayman Islands, Dominica, Grenada, Jamaica,St. Lucia, St.Vincent & theGrenadines andTrinidad&Tobago).The Spanish speaking Caribbean islands of Cuba and Domini-can Republic are included with the Latin American countriesbecause of the language commonality and because they aremembers of Latin American Forum of TelecommunicationsRegulators (Regulatel).The study seeks to assess the effectiveness of the web pres-
ence of these NRAs. The study focuses on the nature and qual-ity of information they provide to their publics, the extent towhich they use the technology in the various regulatoryprocesses such as the administration of a complaints function,the provision of online forms, and in their day to day interac-tion with stakeholders.
Regional Overview
The countries included in this study are quite diverse in termsof the level of development in their telecommunications mar-ket and the maturity of their regulatory agencies. In the samevein, the telecommunications regulatory environment variesfrom country to country. Factors such as the level of privatisa-tion and the level of competition within the market inform theregulatory environment and nature of the regulatory processes.In theCaribbean telecommunications landscape, privatisa-
tion and the establishment of competitive markets is a fairlyrecent occurrence. The movement toward privatisation andcompetition resulted largely from the impetus of the WorldTrade Organisation (WTO) Commitments relating to trade inservices, under which telecommunications fall.From the late 1990s leading into the beginning of this
decade most Caribbean countries started to privatise and
develop pro competition policies leading to reform of theirtelecommunications sector. Table 1 gives information on themarket access and regulatory structure of the islands includedin this study.In Antigua and Barbuda, Antigua Public Utilities Authority
(APUA), a government controlled company, maintains amonopoly on local fixed telephone services. Cable and Wire-less, the United Kingdom based telecommunications compa-ny, which has a long history in the region, continues to have anexclusive franchise on international voice calls, up until 2012.The monopoly on other international services has effectivelyended with the landing of alternative international cable facil-ities by Southern Caribbean Fibre (SCF). However progresstowards full liberalization of that market has been stalled, pre-sumably to give the government controlled entity time to becompetition ready.Antigua and Barbuda also stands out as the only territory in
the sample that does not have an independent regulator.Four of the Caribbean islands included in the survey
(Dominica, Grenada, St. Lucia, and St. Vincent and theGrenadines) are members of The Organisation of EasternCaribbean States (OECS). The OECS is a grouping of nine1
Eastern Caribbean states that are dedicated to economic har-monisation and integration for the economic, security andsocial development of their citizens. As part of this frameworkthe OECS governments have set up the Eastern CaribbeanTelecommunications Authority (ECTEL). ECTEL was estab-lished to coordinate and harmonize the development oftelecommunications policies and regulations among thegroup of countries. ECTEL advises the national regulators ineach of the member states. ECTEL has a website.In addition to the ownership structure, the level and matu-
rity of competition in the markets and the institutional frame-works, other factors such as availability of resources (financialand technical), the level of internet usage, internet penetra-tion, and computer penetration, may impact the capacity andeffectiveness of a NRAs website.
24
Countries Structure of sector Current status of market Year competition achieved2 Type of regulator3
Antigua & Barbuda Public & private Competition in mobile & internet NA Public Utilities Authority
Bahamas Public & private Duopoly in fixed, monopoly inmobile, internet liberalized
NA Independent
Barbados 100% Private Fully liberalized 2005 Independent
Cayman Islands 100% Private Fully liberalized 2004 Independent
Dominica 100% Private Fully liberalized 2003 Independent
Grenada 100% Private Fully liberalized 2003 Independent
Jamaica 100% Private Fully liberalized 2003 Independent
St. Lucia 100% Private Fully liberalized 2003 Independent
St. Vincent & The Grenadines 100% Private Fully liberalized 2003 Independent
Trinidad & Tobago 100% Private Fully liberalized 2004 Independent
Table 1.
Table 2 gives some key ICT indicators for the islands includ-ed in the survey.As is the casewith sector reformwhere the successes to date
are varied, access to ICT infrastructure is varied. It is also low incomparison to the levels in developedmarkets. As small islandeconomies with limited financial, technical and skilled humanresources, regulators face challenges in terms of resourcesavailable to allocate to the development and maintenance ofwebsites. Regulators with more resources are likely to developbetter websites.In terms of the current regulatory agenda, Caribbean regu-
lators are focussing on developing regulatory policies such asinterconnection, price regulation, cost separation, numberportability, quality of service, indirect access and universalservice.Governments and NRAs are also concerned about putting
in place regulatory policies that encourage investments in ICTand ensuring that citizens have access to affordable internet(in particular broadband) access.In comparison to the Caribbean region, North America
markets have less resource constraints and have had a longhistory of privatisation and competition. In the case of USA,this dates back to the divestiture of The Bell System in 1984.The divestiture allowed for:
• The deregulation of the telephone equipment market;
• The establishment of a competitive long distance callingmarket;
• The requirement of equal access, where local telephonecompanies were able to provide their customers with equalaccess to national long distance and international servicesprovided by the former Bell companies.
The 1996 Telecommunications Act ushered in a greaterlevel of market competition as long distance carriers were no
longer required to file tariffs with the Federal Communication(FCC), in order to effect rate changes. The FCC is an independ-ent government agency that regulates interstate and interna-tional telecommunications and other media in the USmarket.In as much as the regulatory environment is the product of
the legislative and policy positions of respective governments,these legal and regulatory prescriptions are established withinthe context of social, economic and business imperatives.The telecommunications industry is characterised by
change. Technology has been a key change driver. The internethas revolutionized the industry at several levels: the way infor-mation is transported, the way we interface with the technolo-gy and the applications and services that can be provided.Today, as a consequence of several industry drivers (privati-
sation, competition, technology changes) the US market ischaracterized by robust competition in all market segments.4
Over 93% of US households are served by three or more wireline providers and 98% of the population is served by three ormorewireless carriers. TheUS boasts 142million internet con-nections which is one of the highest in the world. The regula-tory agenda of the FCC includes:
• Ensuring access to reliable and affordable broadbandservices;
• Fostering innovation and offering customers reliable andmeaningful service choices;
• Promoting efficient and effective use of scarce recoursessuch as spectrum.
The Canadian Radio-television and TelecommunicationsCommission (CRTC), like the FCC, is an independent regulato-ry agency, whose role is to interpret and apply telecommunica-tions legislation within that market. The CRTC is a multi sectorregulator and regulates the broadcasting industry as well.
B E N C H M A R K I N G N A T I O N A L T E L E C O M R E G U L A T O R Y A U T H O R I T Y W E B S I T E S
25
Countries Fixed linesper 100 inhabitants
Mobile per100 inhabitants
Internet per100 inhabitants
Broadband per100 inhabitants
Antigua & Barbuda 45.45 133.55 13.75 8.23
Bahamas 40.10 112.90 7.62 3.93
Barbados 50.14 87.76 20.45
Cayman Islands 76.64 Not available Not available
Dominica 29.40 58.68 8.44 4.56
Grenada 26.74 44.59 7.03 5.35
Jamaica 12.85 93.74 3.19 2.97
St. Lucia 65.72 Not available Not available
St. Vincent & The Grenadines 18.93 86.34 6.16 5.70
Trinidad & Tobago 24.29 70.58 4.75 1.17
Table 2. Key ICT indicators
Source: ITU (data for 2007)
26
The passage of the 1993 Telecommunications Act, laid theframework for a more competitive market in Canada. At thattime, all markets which were not subject to competition wereopened to competition. Today the market is very competitiveand has a variety of network service providers (wire line, wire-less and IP based carriers), as well a wide array of telecommu-nications service providers.Recent statistics show Canada placed at tenth in the world
for the number of broadband connections per 100 inhabitants.The areas of focus included in the Canadian regulatory
agenda are:
• Ensuring that market forces prevail and the population hasaccess to high quality and affordable services;
• Ensuring that as far as is possiblemarket forces are relied onto achieve telecommunications policy objectives;
• Establishing a consumer protection agency;
• Reviewing the regulatory framework for wholesale servicesand the definition of essential services.
The market and the regulatory landscape of the countriesincluded in this study are at varying levels ofmaturity. This exer-cise is seeks to determine how effectively they are using theirwebsites to take forward their respective regulatory agendas.
Benchmarking
Methodological CommentsAs described in Chapter 2, this study is designed to obtain anobjective measure of NRA websites in terms of the depth andrange of information provided across particular regulatorythematic areas, and in terms of the overall functionality of thewebsite in supporting regulatory processes. Applying themethodology also used to assess Latin American and Africanwebsites in this volume, this chapter aims to measure theextent to which telecom regulators in North America and theCaribbean use their online presence to serve their variousstakeholders.The survey of thewebsites was done during the period of 14
April 2008 to 10 May 2008. In applying the methodology to thecountries included in this assessment, there were several fac-tors that could impact the results of the study. These areexplained below with the hope of enhancing the quantitativeassessment with a qualitative gauge.The initial list of countries also included Guyana and St.
Kitts & Nevis. Guyana has a Public Utilities Commission (PUC)but no web presence was identified and was therefore exclud-ed from the study. The website for the NRA in St. Kitts & Neviswas not operational during the period of the assessment.During the period of the survey, the Jamaican NRA, the
Office of Utility Regulation (OUR), was in the process of re-launching their site. The site address remains the same; how-ever, an advisory on the site indicated that the site was under
construction and that there are some errors and omissions.Over the period of the survey it was obvious that more infor-mation was being added to the site. While there was no infor-mation on the site itself indicating why it was beingre-launched, when contacted, an official at the agency indicat-ed that over time it had become difficult to locate informationon the site. He further indicated that the overhauling exerciseis intended to improve the accessibility of information on thesite and to generally allow for a better navigation experience.TheECTELmembers included in the survey have their indi-
vidual websites. ECTEL also has a site. For the purpose of thisstudy, the primary survey was carried out on the site of theindividual NRAs. Where the relevant information resided onthe ECTEL site and a link was established from the membercountry site, that information or process was treated as if itwere on the site of the member country.Where there are multiple agencies with responsibility for
regulating different areas of the market, as in the case ofJamaica and Barbados the assessment includes the varioussites.
Factual Information and News
Figure 1 shows the scores for the individual NRAs, both interms of the overall score and the contribution of each of theitems included in that category.With the exception of Antigua and Barbuda, the other NRAs
had information about their legislation and regulatory rules.This information was found to be up-to-date. For theCaribbean regulators this was in the form of copies of docu-ments such as the telecommunications laws and other rulings.The information is presented in the form of PDF orWord doc-ument copies of the original. In comparison, the North Amer-ican regulators present the information in web format ratherthan as copies of original documents. In the case of Canada,the CRTC site is linked to that of the Department of Justice,where the information is presented in a web page format witha table of contents. This allows the user to quickly identify andaccess the specific information required.There are also links torelated information. The FCC uses a similar approach to pres-ent the rules and regulations on their website.For the news sub-category, with the exception of Antigua
and Barbuda, all the sites surveyed have a section for news onthe main page. The information included are largely pressreleases from the agencies. The OUR in Jamaica has quite anextensive and varied news component. From the main pageyou can access the press releases page. From here you canaccess details of the various press releases. There is also anaudio-visual section, where the user can access copies of pre-sentations, audio files of the OUR’s weekly radio programme,and video files of several press conferences. In the case of someof the smaller jurisdictions such as St. Vincent & TheGrenadines, Grenada and Dominica the news component isactually a link to the news section of the ITU website.
4 . C A R I B B E A N A N D N O R T H A M E R I C A
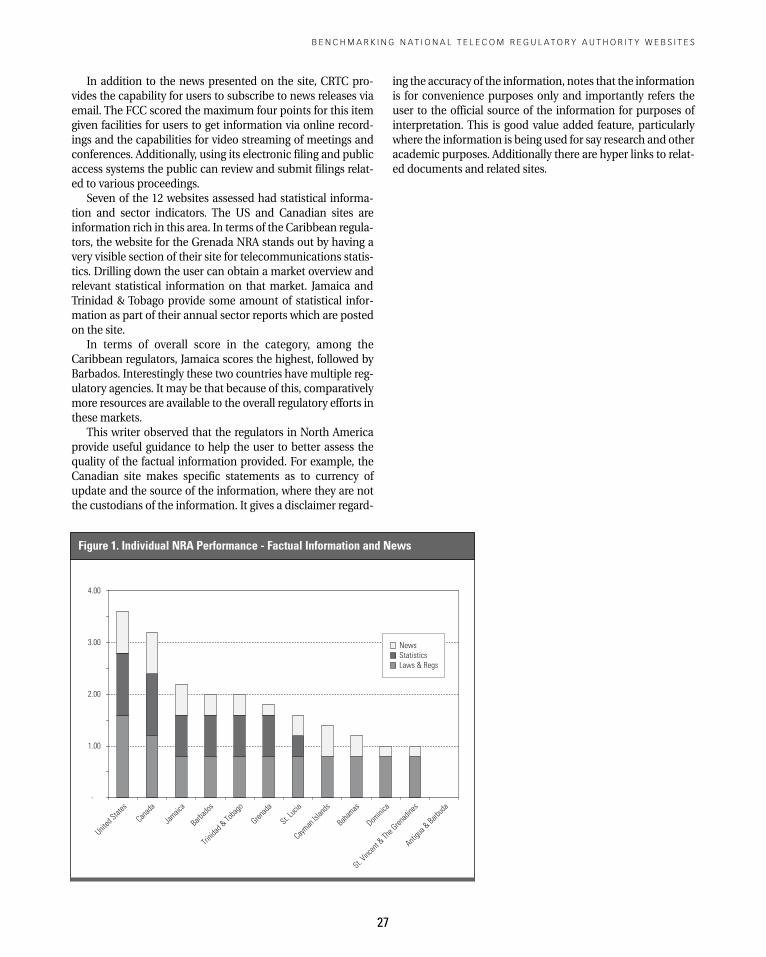
In addition to the news presented on the site, CRTC pro-vides the capability for users to subscribe to news releases viaemail. The FCC scored the maximum four points for this itemgiven facilities for users to get information via online record-ings and the capabilities for video streaming of meetings andconferences. Additionally, using its electronic filing and publicaccess systems the public can review and submit filings relat-ed to various proceedings.Seven of the 12 websites assessed had statistical informa-
tion and sector indicators. The US and Canadian sites areinformation rich in this area. In terms of the Caribbean regula-tors, the website for the Grenada NRA stands out by having avery visible section of their site for telecommunications statis-tics. Drilling down the user can obtain a market overview andrelevant statistical information on that market. Jamaica andTrinidad & Tobago provide some amount of statistical infor-mation as part of their annual sector reports which are postedon the site.In terms of overall score in the category, among the
Caribbean regulators, Jamaica scores the highest, followed byBarbados. Interestingly these two countries have multiple reg-ulatory agencies. It may be that because of this, comparativelymore resources are available to the overall regulatory efforts inthese markets.This writer observed that the regulators in North America
provide useful guidance to help the user to better assess thequality of the factual information provided. For example, theCanadian site makes specific statements as to currency ofupdate and the source of the information, where they are notthe custodians of the information. It gives a disclaimer regard-
ing the accuracy of the information, notes that the informationis for convenience purposes only and importantly refers theuser to the official source of the information for purposes ofinterpretation. This is good value added feature, particularlywhere the information is being used for say research and otheracademic purposes. Additionally there are hyper links to relat-ed documents and related sites.
B E N C H M A R K I N G N A T I O N A L T E L E C O M R E G U L A T O R Y A U T H O R I T Y W E B S I T E S
27
Figure 1. Individual NRA Performance - Factual Information and News
-
1.00
2.00
3.00
4.00
United
States
Canad
a
Jamaic
a
Barbad
os
Trinid
ad&
Toba
go
Grenad
a
St. Luc
ia
Cayman
Islan
ds
Baham
as
Domini
ca
St. Vinc
ent &
The Gren
adine
s
Antigu
a &Barb
uda
NewsStatisticsLaws & Regs
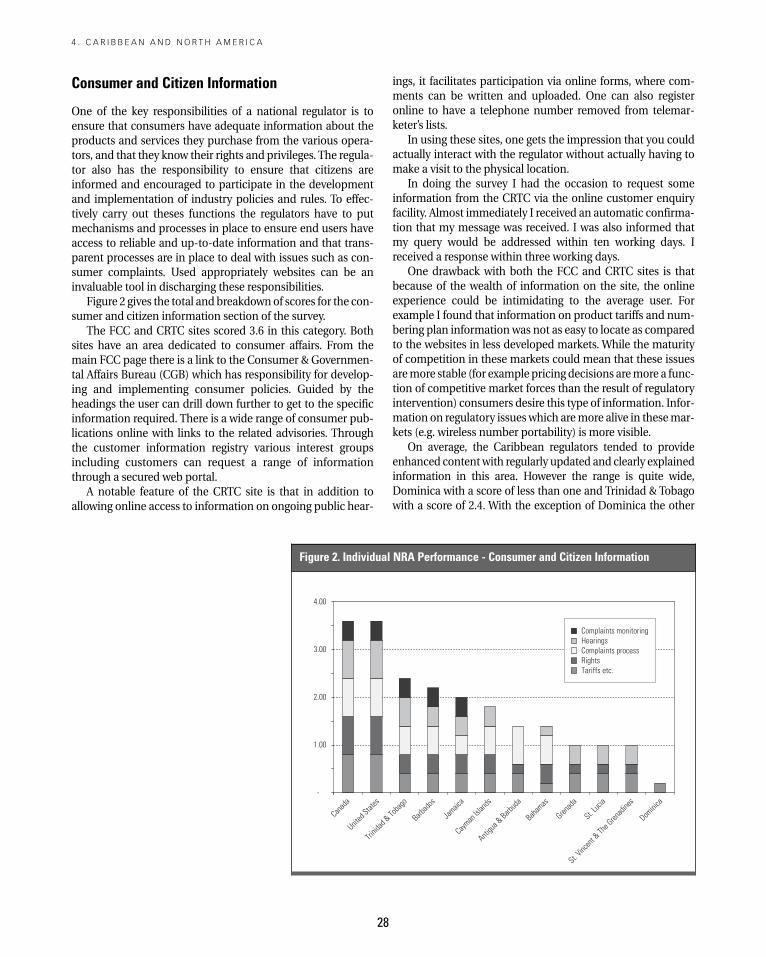
28
Consumer and Citizen Information
One of the key responsibilities of a national regulator is toensure that consumers have adequate information about theproducts and services they purchase from the various opera-tors, and that they know their rights and privileges. The regula-tor also has the responsibility to ensure that citizens areinformed and encouraged to participate in the developmentand implementation of industry policies and rules. To effec-tively carry out theses functions the regulators have to putmechanisms and processes in place to ensure end users haveaccess to reliable and up-to-date information and that trans-parent processes are in place to deal with issues such as con-sumer complaints. Used appropriately websites can be aninvaluable tool in discharging these responsibilities.Figure 2 gives the total and breakdownof scores for the con-
sumer and citizen information section of the survey.The FCC and CRTC sites scored 3.6 in this category. Both
sites have an area dedicated to consumer affairs. From themain FCC page there is a link to the Consumer & Governmen-tal Affairs Bureau (CGB) which has responsibility for develop-ing and implementing consumer policies. Guided by theheadings the user can drill down further to get to the specificinformation required. There is a wide range of consumer pub-lications online with links to the related advisories. Throughthe customer information registry various interest groupsincluding customers can request a range of informationthrough a secured web portal.A notable feature of the CRTC site is that in addition to
allowing online access to information on ongoing public hear-
ings, it facilitates participation via online forms, where com-ments can be written and uploaded. One can also registeronline to have a telephone number removed from telemar-keter’s lists.In using these sites, one gets the impression that you could
actually interact with the regulator without actually having tomake a visit to the physical location.In doing the survey I had the occasion to request some
information from the CRTC via the online customer enquiryfacility. Almost immediately I received an automatic confirma-tion that my message was received. I was also informed thatmy query would be addressed within ten working days. Ireceived a response within three working days.One drawback with both the FCC and CRTC sites is that
because of the wealth of information on the site, the onlineexperience could be intimidating to the average user. Forexample I found that information on product tariffs and num-bering plan information was not as easy to locate as comparedto the websites in less developed markets. While the maturityof competition in these markets could mean that these issuesaremore stable (for example pricing decisions aremore a func-tion of competitive market forces than the result of regulatoryintervention) consumers desire this type of information. Infor-mation on regulatory issueswhich aremore alive in thesemar-kets (e.g. wireless number portability) is more visible.On average, the Caribbean regulators tended to provide
enhanced content with regularly updated and clearly explainedinformation in this area. However the range is quite wide,Dominica with a score of less than one and Trinidad & Tobagowith a score of 2.4. With the exception of Dominica the other
4 . C A R I B B E A N A N D N O R T H A M E R I C A
Figure 2. Individual NRA Performance - Consumer and Citizen Information
-
1.00
2.00
3.00
Canad
a
United
States
Trinid
ad& To
bago
Barbad
os
Jamaic
a
Cayman
Islan
ds
Antigu
a & Barbud
a
Baham
as
Grenad
a
St. Luci
a
St. Vinc
ent & Th
e Grenad
ines
Domini
ca
Complaints monitoringHearingsComplaints processRightsTariffs etc.
4.00
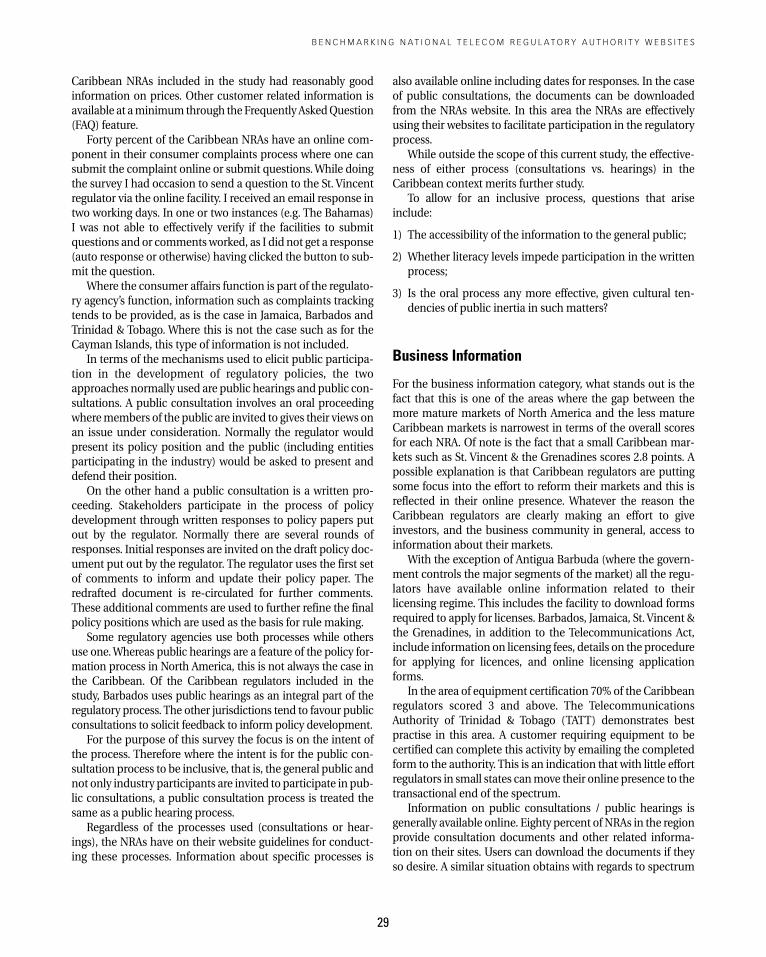
Caribbean NRAs included in the study had reasonably goodinformation on prices. Other customer related information isavailable at aminimum through the Frequently AskedQuestion(FAQ) feature.Forty percent of the Caribbean NRAs have an online com-
ponent in their consumer complaints process where one cansubmit the complaint online or submit questions.While doingthe survey I had occasion to send a question to the St. Vincentregulator via the online facility. I received an email response intwo working days. In one or two instances (e.g. The Bahamas)I was not able to effectively verify if the facilities to submitquestions and or commentsworked, as I did not get a response(auto response or otherwise) having clicked the button to sub-mit the question.Where the consumer affairs function is part of the regulato-
ry agency’s function, information such as complaints trackingtends to be provided, as is the case in Jamaica, Barbados andTrinidad & Tobago. Where this is not the case such as for theCayman Islands, this type of information is not included.In terms of the mechanisms used to elicit public participa-
tion in the development of regulatory policies, the twoapproaches normally used are public hearings and public con-sultations. A public consultation involves an oral proceedingwheremembers of the public are invited to gives their views onan issue under consideration. Normally the regulator wouldpresent its policy position and the public (including entitiesparticipating in the industry) would be asked to present anddefend their position.On the other hand a public consultation is a written pro-
ceeding. Stakeholders participate in the process of policydevelopment through written responses to policy papers putout by the regulator. Normally there are several rounds ofresponses. Initial responses are invited on the draft policy doc-ument put out by the regulator. The regulator uses the first setof comments to inform and update their policy paper. Theredrafted document is re-circulated for further comments.These additional comments are used to further refine the finalpolicy positions which are used as the basis for rule making.Some regulatory agencies use both processes while others
use one.Whereas public hearings are a feature of the policy for-mation process in North America, this is not always the case inthe Caribbean. Of the Caribbean regulators included in thestudy, Barbados uses public hearings as an integral part of theregulatory process. The other jurisdictions tend to favour publicconsultations to solicit feedback to inform policy development.For the purpose of this survey the focus is on the intent of
the process. Therefore where the intent is for the public con-sultation process to be inclusive, that is, the general public andnot only industry participants are invited to participate in pub-lic consultations, a public consultation process is treated thesame as a public hearing process.Regardless of the processes used (consultations or hear-
ings), the NRAs have on their website guidelines for conduct-ing these processes. Information about specific processes is
also available online including dates for responses. In the caseof public consultations, the documents can be downloadedfrom the NRAs website. In this area the NRAs are effectivelyusing their websites to facilitate participation in the regulatoryprocess.While outside the scope of this current study, the effective-
ness of either process (consultations vs. hearings) in theCaribbean context merits further study.To allow for an inclusive process, questions that arise
include:
1) The accessibility of the information to the general public;
2) Whether literacy levels impede participation in the writtenprocess;
3) Is the oral process any more effective, given cultural ten-dencies of public inertia in such matters?
Business Information
For the business information category, what stands out is thefact that this is one of the areas where the gap between themore mature markets of North America and the less matureCaribbean markets is narrowest in terms of the overall scoresfor each NRA. Of note is the fact that a small Caribbean mar-kets such as St. Vincent & the Grenadines scores 2.8 points. Apossible explanation is that Caribbean regulators are puttingsome focus into the effort to reform their markets and this isreflected in their online presence. Whatever the reason theCaribbean regulators are clearly making an effort to giveinvestors, and the business community in general, access toinformation about their markets.With the exception of Antigua Barbuda (where the govern-
ment controls the major segments of the market) all the regu-lators have available online information related to theirlicensing regime. This includes the facility to download formsrequired to apply for licenses. Barbados, Jamaica, St.Vincent &the Grenadines, in addition to the Telecommunications Act,include information on licensing fees, details on the procedurefor applying for licences, and online licensing applicationforms.In the area of equipment certification 70% of the Caribbean
regulators scored 3 and above. The TelecommunicationsAuthority of Trinidad & Tobago (TATT) demonstrates bestpractise in this area. A customer requiring equipment to becertified can complete this activity by emailing the completedform to the authority. This is an indication that with little effortregulators in small states canmove their online presence to thetransactional end of the spectrum.Information on public consultations / public hearings is
generally available online. Eighty percent of NRAs in the regionprovide consultation documents and other related informa-tion on their sites. Users can download the documents if theyso desire. A similar situation obtains with regards to spectrum
B E N C H M A R K I N G N A T I O N A L T E L E C O M R E G U L A T O R Y A U T H O R I T Y W E B S I T E S
29
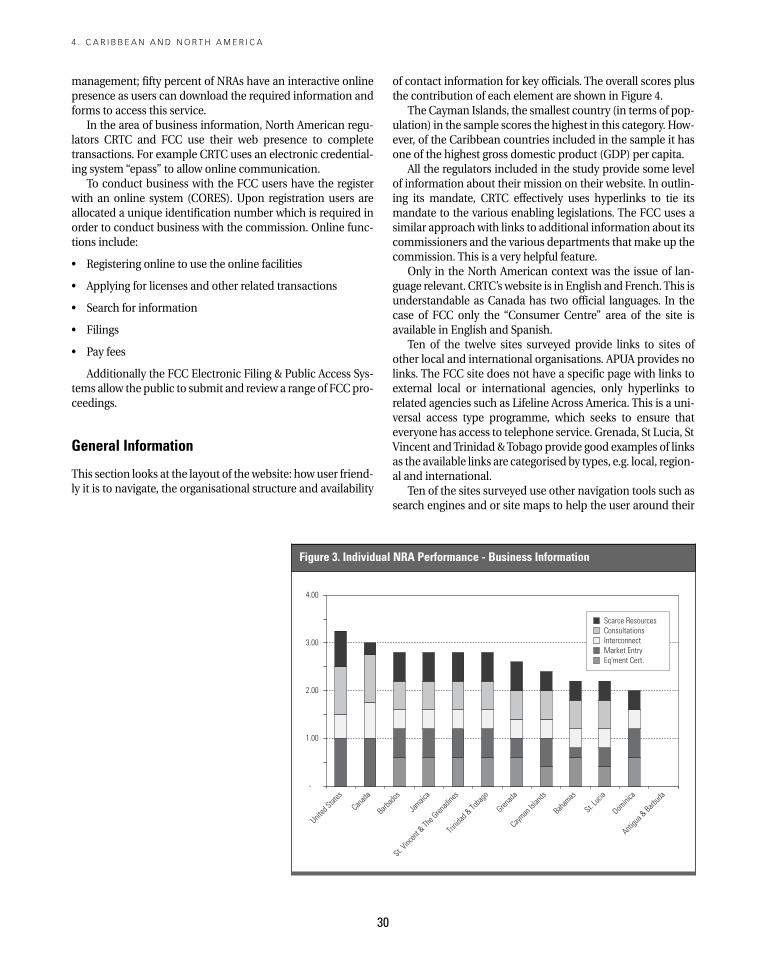
30
management; fifty percent of NRAs have an interactive onlinepresence as users can download the required information andforms to access this service.In the area of business information, North American regu-
lators CRTC and FCC use their web presence to completetransactions. For example CRTC uses an electronic credential-ing system “epass” to allow online communication.To conduct business with the FCC users have the register
with an online system (CORES). Upon registration users areallocated a unique identification number which is required inorder to conduct business with the commission. Online func-tions include:
• Registering online to use the online facilities
• Applying for licenses and other related transactions
• Search for information
• Filings
• Pay fees
Additionally the FCC Electronic Filing & Public Access Sys-tems allow the public to submit and review a range of FCCpro-ceedings.
General Information
This section looks at the layout of thewebsite: howuser friend-ly it is to navigate, the organisational structure and availability
of contact information for key officials. The overall scores plusthe contribution of each element are shown in Figure 4.The Cayman Islands, the smallest country (in terms of pop-
ulation) in the sample scores the highest in this category. How-ever, of the Caribbean countries included in the sample it hasone of the highest gross domestic product (GDP) per capita.All the regulators included in the study provide some level
of information about their mission on their website. In outlin-ing its mandate, CRTC effectively uses hyperlinks to tie itsmandate to the various enabling legislations. The FCC uses asimilar approachwith links to additional information about itscommissioners and the various departments that make up thecommission. This is a very helpful feature.Only in the North American context was the issue of lan-
guage relevant. CRTC’s website is in English and French.This isunderstandable as Canada has two official languages. In thecase of FCC only the “Consumer Centre” area of the site isavailable in English and Spanish.Ten of the twelve sites surveyed provide links to sites of
other local and international organisations. APUA provides nolinks. The FCC site does not have a specific page with links toexternal local or international agencies, only hyperlinks torelated agencies such as Lifeline Across America. This is a uni-versal access type programme, which seeks to ensure thateveryone has access to telephone service. Grenada, St Lucia, StVincent andTrinidad &Tobago provide good examples of linksas the available links are categorised by types, e.g. local, region-al and international.Ten of the sites surveyed use other navigation tools such as
search engines and or site maps to help the user around their
4 . C A R I B B E A N A N D N O R T H A M E R I C A
Figure 3. Individual NRA Performance - Business Information
-
1.00
2.00
3.00
4.00
United
States
Canad
a
Barbad
os
Jamaic
a
St. Vinc
ent &
The Gren
adine
s
Trinid
ad&
Toba
go
Grenad
a
Cayman
Islan
ds
Baham
as
St. Luc
ia
Domini
ca
Antigu
a &Barb
uda
Scarce ResourcesConsultationsInterconnectMarket EntryEq'ment Cert.
f
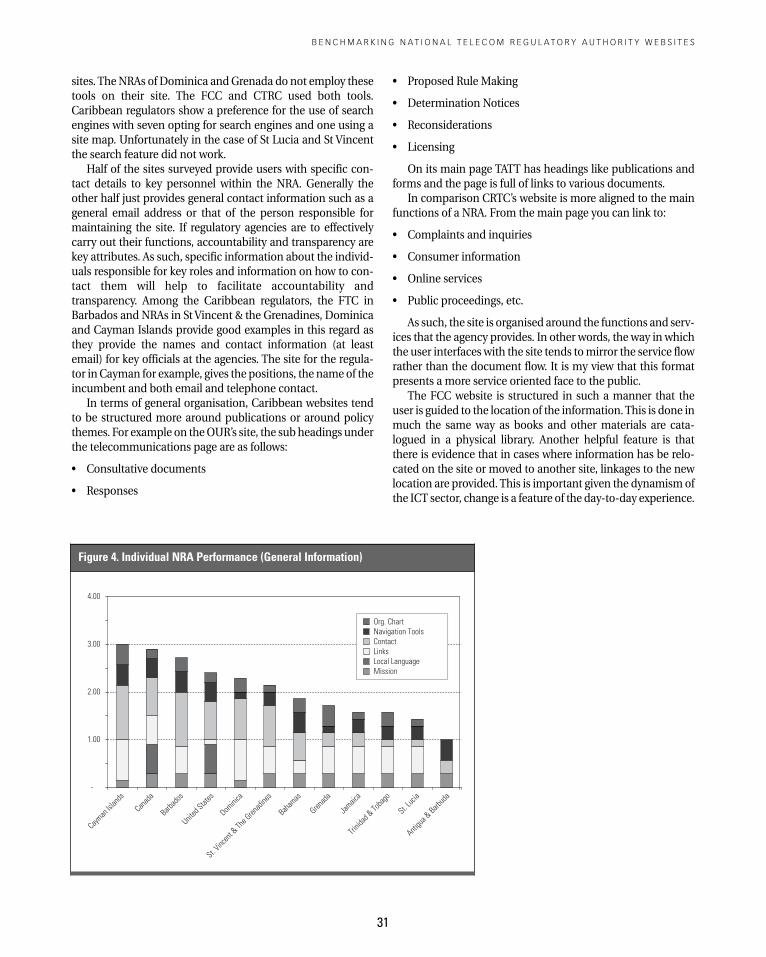
sites. TheNRAs of Dominica andGrenada do not employ thesetools on their site. The FCC and CTRC used both tools.Caribbean regulators show a preference for the use of searchengines with seven opting for search engines and one using asite map. Unfortunately in the case of St Lucia and St Vincentthe search feature did not work.Half of the sites surveyed provide users with specific con-
tact details to key personnel within the NRA. Generally theother half just provides general contact information such as ageneral email address or that of the person responsible formaintaining the site. If regulatory agencies are to effectivelycarry out their functions, accountability and transparency arekey attributes. As such, specific information about the individ-uals responsible for key roles and information on how to con-tact them will help to facilitate accountability andtransparency. Among the Caribbean regulators, the FTC inBarbados and NRAs in StVincent & the Grenadines, Dominicaand Cayman Islands provide good examples in this regard asthey provide the names and contact information (at leastemail) for key officials at the agencies. The site for the regula-tor inCayman for example, gives the positions, the nameof theincumbent and both email and telephone contact.In terms of general organisation, Caribbean websites tend
to be structured more around publications or around policythemes. For example on theOUR’s site, the subheadings underthe telecommunications page are as follows:
• Consultative documents
• Responses
• Proposed Rule Making
• Determination Notices
• Reconsiderations
• Licensing
On its main page TATT has headings like publications andforms and the page is full of links to various documents.In comparison CRTC’s website is more aligned to the main
functions of a NRA. From the main page you can link to:
• Complaints and inquiries
• Consumer information
• Online services
• Public proceedings, etc.
As such, the site is organised around the functions and serv-ices that the agency provides. In other words, the way in whichthe user interfaces with the site tends tomirror the service flowrather than the document flow. It is my view that this formatpresents a more service oriented face to the public.The FCC website is structured in such a manner that the
user is guided to the location of the information.This is done inmuch the same way as books and other materials are cata-logued in a physical library. Another helpful feature is thatthere is evidence that in cases where information has be relo-cated on the site or moved to another site, linkages to the newlocation are provided. This is important given the dynamism ofthe ICT sector, change is a feature of the day-to-day experience.
B E N C H M A R K I N G N A T I O N A L T E L E C O M R E G U L A T O R Y A U T H O R I T Y W E B S I T E S
31
Figure 4. Individual NRA Performance (General Information)
-
1.00
2.00
3.00
4.00
Cayman
Islan
ds
Canad
a
Barbad
os
United
States
Domini
ca
St. Vinc
ent &
The Gren
adine
s
Baham
as
Grenad
a
Jamaic
a
Trinid
ad&
Toba
go
St. Luc
ia
Antigu
a &Barb
uda
Org. ChartNavigation ToolsContactLinksLocal LanguageMission
32
Universal Service / Universal Access
Of all the categories surveyed, this proved the most challeng-ing to source a meaningful body of information. Eleven of thetwelve sites provide varying levels of information on this area.The overall scores are shown in Figure 5.Generally the Caribbean regulators provide such informa-
tion in the form of past consultations or draft policy docu-ments. The Dominica NRA simply has a general link to theECTEL site, no specific reference to this and other consulta-tions aremade on the site, despite the fact that there is an areamarked for current consultations and recent documents.The websites of the other ECTEL members provide infor-
mation on a recently concluded public consultation on uni-versal service regulations. A copy of the draft policy documentwas either on the website of the individual member states or alink was provided to the document or just to the ECTEL site inthe case of Dominica.In Trinidad & Tobago the work done to date on the issue of
universal service or universal access has been carried out bytheministry with responsibility for telecommunications. TATThas made comments on the issue in various consultation doc-uments and is expected to commence consultation on theissueThe FCC provides information on policy and provided a
link to Universal Service Administrative Company that givesinformation on various programmes. CRTC also provide poli-cy information in various documents.With market convergence, the concept of universal service
or universal access is also undergoing change. The current dis-course speaks of universal service in terms of the availabilityand affordability of broadband access. This may to someextent explain the generally outdated and or fragmented viewof this type of information.
Overall Scores
Both FCC and CRTC have scored above 3, firmly identifyingtheir respective websites as being at the interactive level and insome areas they operate at the transactional level. Three of theten Caribbean countries (Barbados, Jamaica and Trinidad &Tobago) score just above 2, indicating that overall the onlinepresence in these jurisdictions are at the enhanced level, whereupdated information is available in the web environment.There are also some interactive capabilities being developed.The Cayman Islands score slightly below 2, and is essentially ata comparable stage as the first three. The NRAs in the OECScountries of Grenada, St Vincent & the Grenadines and St.Lucia score over 1.5. The score for The Bahamas is also in thatrange. The other OECS country in the sample score about 1.2.Antigua & Barbuda receives the lowest overall score, which isbelow 1.
Figures 7 - 9 show how the regulators in various groupings(ECTELmembers, other Caribbean andNorth AmericanNRAs)score against the ideal framework developed for this study.The overall score is intended to get to a quantitative meas-
ure to capture the overall effectiveness of the websites in thevarious countries. However this one value does not portraysome notable features on the various sites.
Conclusions & Recommendations
Fourteen websites from twelve countries or markets werereviewed. Of the twelve markets assessed, ten are fully liber-alised while two are predominantly government controlled,with pockets of competition in some segments of the market.Eleven of themarkets surveyed have an independent regulato-ry agency and in some cases multiple agencies.Antigua & Barbuda is not fully liberalised and the onlymar-
ketwithout an independent regulator. It is also themarketwiththe lowest overall score. The score is also markedly below thatof other similar size economies andmarkets within the region.Although this one instance is not adequate to make a gener-alised observation, it does tend to support the view that wherethe government performs the role of owner and operator oftelecommunications networks and services plus determinesand implements policies, the level of regulatory oversight islimited at best. This seems to extend to the online presence aswell.Of note too is the fact that Guyana, which still has signifi-
cant government ownership and control in major market seg-ments, does not have a knownonline regulatory presence.Thisfurther supports the view that there is a direct correlationbetween level of privatization and competition in amarket andthe rigour and transparency of the regulatory processes. Thisseems to obtain even in the face of online capabilities, whichcan be used to improve the transparency and accountability inthe regulatory processes.With regards to regulatory models, of the ten Caribbean
NRAs included in this study, only the Cayman Islands andTrinidad & Tobago have a single regulator covering the fullrange of regulatory issues; economic, technical and consumeraffairs. For the other islands there are multiple agencies withresponsibility for specific areas. Based on the results the regu-latory model (single vs. multiple agencies) did not seem tohave an impact on the level of development and effectivenessof the NRAs websites. Maybe the fact that an effort was madeto include all the relevant agencies where multiple agenciesexist would mask any potential differences.A notable observation is that in multi agency environment
in the Caribbean, features such as hyperlinks are not used suf-ficiently if at all to provide the user with ready access to infor-mation on separate sites. In the case of Jamaica, for example,there are three regulatory bodies (OUR, Spectrum Manage-ment Authority (SMA) and Fair Trading Commission (FTC).5
4 . C A R I B B E A N A N D N O R T H A M E R I C A
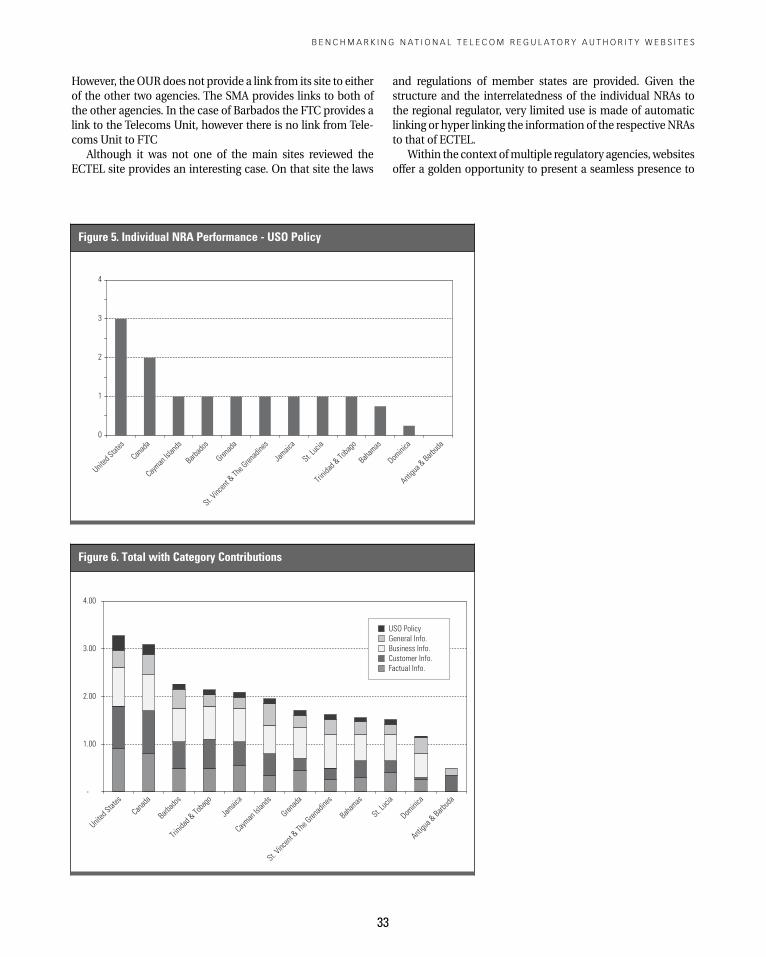
However, theOURdoes not provide a link from its site to eitherof the other two agencies. The SMA provides links to both ofthe other agencies. In the case of Barbados the FTC provides alink to the Telecoms Unit, however there is no link from Tele-coms Unit to FTCAlthough it was not one of the main sites reviewed the
ECTEL site provides an interesting case. On that site the laws
and regulations of member states are provided. Given thestructure and the interrelatedness of the individual NRAs tothe regional regulator, very limited use is made of automaticlinking or hyper linking the information of the respectiveNRAsto that of ECTEL.Within the context ofmultiple regulatory agencies, websites
offer a golden opportunity to present a seamless presence to
B E N C H M A R K I N G N A T I O N A L T E L E C O M R E G U L A T O R Y A U T H O R I T Y W E B S I T E S
33
Figure 5. Individual NRA Performance - USO Policy
0
1
2
3
4
United
States
Canad
a
Cayman
Islan
ds
Barbad
os
Grenad
a
St. Vinc
ent &
The Gren
adine
s
Jamaic
a
St. Luc
ia
Trinid
ad&
Toba
go
Baham
as
Domini
ca
Antigu
a &Barb
uda
Figure 6. Total with Category Contributions
-
1.00
2.00
3.00
4.00
United
States
Canad
a
Barbad
os
Trinid
ad&
Toba
go
Jamaic
a
Cayman
Islan
ds
Grenad
a
St. Vinc
ent &
The Gren
adine
s
Baham
as
St. Luc
ia
Domini
ca
Antigu
a &Barb
uda
USO PolicyGeneral Info.Business Info.Customer Info.Factual Info.
-
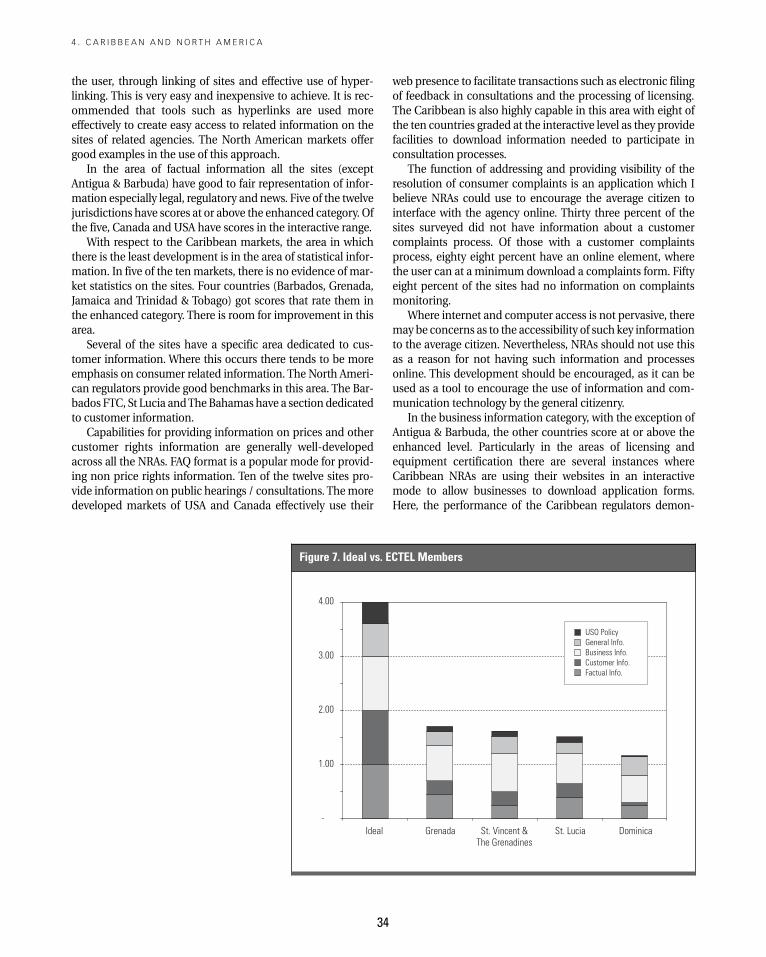
34
the user, through linking of sites and effective use of hyper-linking. This is very easy and inexpensive to achieve. It is rec-ommended that tools such as hyperlinks are used moreeffectively to create easy access to related information on thesites of related agencies. The North American markets offergood examples in the use of this approach.In the area of factual information all the sites (except
Antigua & Barbuda) have good to fair representation of infor-mation especially legal, regulatory and news. Five of the twelvejurisdictions have scores at or above the enhanced category. Ofthe five, Canada and USA have scores in the interactive range.With respect to the Caribbean markets, the area in which
there is the least development is in the area of statistical infor-mation. In five of the tenmarkets, there is no evidence of mar-ket statistics on the sites. Four countries (Barbados, Grenada,Jamaica and Trinidad & Tobago) got scores that rate them inthe enhanced category. There is room for improvement in thisarea.Several of the sites have a specific area dedicated to cus-
tomer information. Where this occurs there tends to be moreemphasis on consumer related information. The North Ameri-can regulators provide good benchmarks in this area. The Bar-bados FTC, St Lucia andTheBahamas have a section dedicatedto customer information.Capabilities for providing information on prices and other
customer rights information are generally well-developedacross all the NRAs. FAQ format is a popular mode for provid-ing non price rights information. Ten of the twelve sites pro-vide information on public hearings / consultations. Themoredeveloped markets of USA and Canada effectively use their
web presence to facilitate transactions such as electronic filingof feedback in consultations and the processing of licensing.The Caribbean is also highly capable in this area with eight ofthe ten countries graded at the interactive level as they providefacilities to download information needed to participate inconsultation processes.The function of addressing and providing visibility of the
resolution of consumer complaints is an application which Ibelieve NRAs could use to encourage the average citizen tointerface with the agency online. Thirty three percent of thesites surveyed did not have information about a customercomplaints process. Of those with a customer complaintsprocess, eighty eight percent have an online element, wherethe user can at a minimum download a complaints form. Fiftyeight percent of the sites had no information on complaintsmonitoring.Where internet and computer access is not pervasive, there
may be concerns as to the accessibility of such key informationto the average citizen. Nevertheless, NRAs should not use thisas a reason for not having such information and processesonline. This development should be encouraged, as it can beused as a tool to encourage the use of information and com-munication technology by the general citizenry.In the business information category, with the exception of
Antigua & Barbuda, the other countries score at or above theenhanced level. Particularly in the areas of licensing andequipment certification there are several instances whereCaribbean NRAs are using their websites in an interactivemode to allow businesses to download application forms.Here, the performance of the Caribbean regulators demon-
4 . C A R I B B E A N A N D N O R T H A M E R I C A
Figure 7. Ideal vs. ECTEL Members
-
1.00
2.00
3.00
4.00
Ideal Grenada St. Vincent &The Grenadines
St. Lucia Dominica
USO PolicyGeneral Info.Business Info.Customer Info.Factual Info.
U
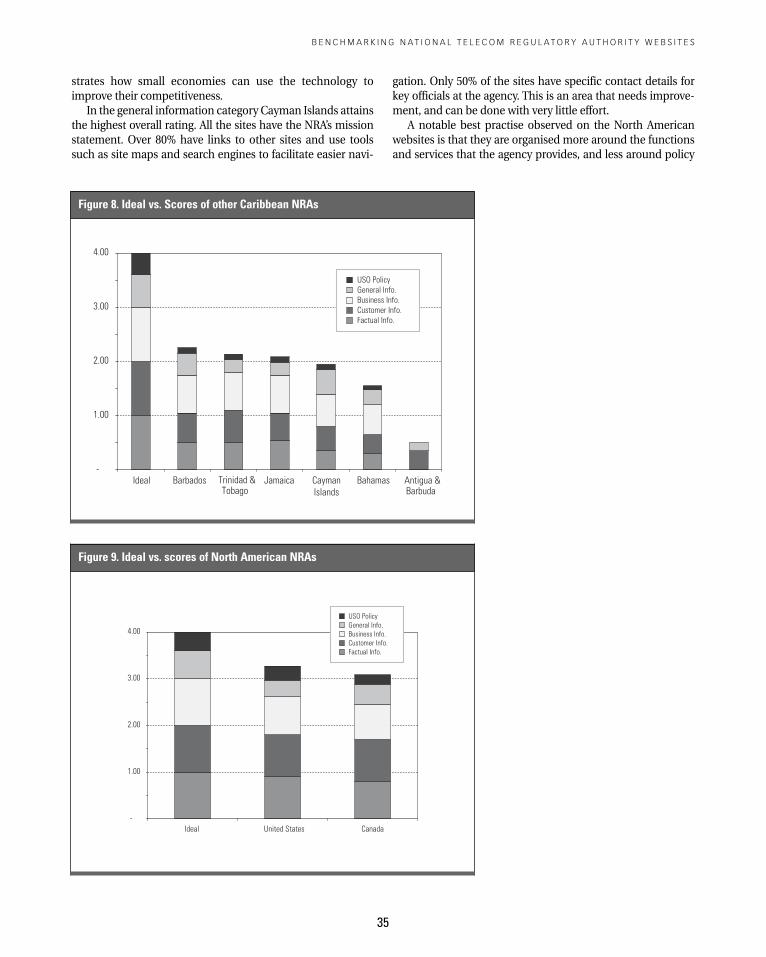
strates how small economies can use the technology toimprove their competitiveness.In the general information category Cayman Islands attains
the highest overall rating. All the sites have the NRA’s missionstatement. Over 80% have links to other sites and use toolssuch as site maps and search engines to facilitate easier navi-
gation. Only 50% of the sites have specific contact details forkey officials at the agency. This is an area that needs improve-ment, and can be done with very little effort.A notable best practise observed on the North American
websites is that they are organised more around the functionsand services that the agency provides, and less around policy
B E N C H M A R K I N G N A T I O N A L T E L E C O M R E G U L A T O R Y A U T H O R I T Y W E B S I T E S
35
Figure 8. Ideal vs. Scores of other Caribbean NRAs
-
1.00
2.00
3.00
4.00
Ideal Barbados Trinidad &Tobago
Jamaica CaymanIslands
Bahamas Antigua &Barbuda
USO PolicyGeneral Info.Business Info.Customer Info.Factual Info.
U
Figure 9. Ideal vs. scores of North American NRAs
-
1.00
2.00
3.00
4.00
Ideal United States Canada
USO PolicyGeneral Info.Business Info.Customer Info.Factual Info.
4
36
themes and publications. This structure more effectively cap-tures the process flow in terms of how the various publicsinteract with the regulator. As such, they present a more serv-ice oriented face to the public. I would therefore recommendthis approach to NRAs that are redesigning their sites or thoseestablishing sites for the first time.From the survey it is clear that all the NRAs are using their
web presence to enhance their service delivery. They areachieving varying levels of success. Individual agencies canimprove their website by adopting the best practises fromother agencies.
Notes1 The OECS countries are Antigua & Barbuda, The Commonwealth ofDominica, Grenada, Montserrat, St Kitts & Nevis, St. Lucia, St. Vincent andthe Grenadines. Anguilla and BritishVirgin Island are associate members.
2 The year in which full market access was legally permitted.
3 The way in which the independent regulatory institutions have beenestablished in these markets vary. In Barbados the FTC is responsible forprice regulation, competition issues and consumer protection, while theTelecommunications Unit in the Ministry of Energy and Public Utilities isresponsible for regulating the technical aspects of the sector.In Jamaica the responsibilities are shared among the OUR, FTC and theSMA. The OUR has responsibility for economic regulations (price, qualityetc), FTC for general competition issues and SMA has responsibility forradio frequency and spectrum.In Cayman Islands ICTA regulates the entire industry. In Trinidad & Toba-go TATT also regulates the entire industry. In the OECS, there is a regionalbody, ECTEL, which is responsible for coordinating and harmonising thepolicies and regulations of the five member states, Dominica, Grenada, St.Lucia, St. Kitts & Nevis and St. Vincent & the Grenadines.
4 http://www.fcc.gov/Reports/ar2007.pdf
5 The Fair Trading Commission in Jamaica has responsibility for generalcompetition issues and is not an industry specific regulator. However, theOUR is expected to collaborate with the FTC on issues that touch on gen-eral competition rules.
Bibliography
Federal Communications Commission (2007). Fiscal Year 2007 Perform-ance & Accountability Reporting: October 1, 2006 - September 30,2007.http://www.fcc.gov/Reports/ar2007.pdf
Intven, Hank, Oliver, Jeremy & Edgardo Sepulveda (2000). Telecommuni-cations Regulations Handbook. TheWorld Bank infoDev Programme.
International Telecommunication Union (ITU) TelecommunicationsDevelopment Sector (ITU-D) (n.d.). ITU ICT EYE.http://www.itu.int/ITU-D/icteye/Default.aspx.
Mahan A.K. (2005) “Benchmarking African NRAWebsites”, in Mahan, A.K.andMelodyW.H. Stimulating Investment in Network Development:Roles for Regulators.WDR and infoDev.
Organisation for Economic Co-operation and Development (OECD) (n.d.)Broadband Statistics. Directorate for Science, Technology and Indus-try: OECD Broadband Portal. OECD.http://www.oecd.org/sti/ict/broadband
Schoening, Heinrich M. (2005). Business Management of Telecommunica-tions. Pearson Prentice Hall, Upper Saddle River, New Jersey, Colum-bus, Ohio.
Shapiro, Stuart & Coglianese, Cary (2007). First Generation Rulemaking: AnAssessment of Regulatory AgencyWebsites.University of PennsylvaniaLaw School. Public Law Research Paper No.7-15. 11 April.http://lsr.nellco.org/cgi/viewcontent.cgi?article=1157&context=upenn/wps.
Stern, Peter A. (2006). Economic and Sector Study Series: Promoting Invest-ment in Information and Communication Technologies in theCaribbean. Inter-American Development Bank.
4 . C A R I B B E A N A N D N O R T H A M E R I C A
37
C H A P T E R 5
Benchmark Indicators forAfrican National Telecom
Regulary Authority WebsitesMonica Kerretts-Makau*
Introduction
The concept of governance in recent years has evolvedwith theintroduction of information and communication technologies(ICT). Governments can now provide services without theneed for the traditional face-to-face interaction.This undoubt-edly represents a marked change; more so, for African coun-tries whose governance measures are increasingly measuredby their ability to reduce bureaucracy levels through the use ofe-governance.1 In this model, a government is expected toincorporate three types of interactions namely: government-to-government (G2G), government-to-business (G2B) andgovernment-to-citizen (G2C).It is not surprising therefore that e-government has become
an important theme and benchmark for the assessment ofdevelopment via the ability to facilitate government servicesthrough ICT initiatives such as web portals. As most Africannational regulatory authorities (NRAs) already have a websiteor are in the process of establishing one, it is clear that this isviewed as an important or necessary activity. A website pro-vides a fundamental window to realise the true spirit of e-government. A properly built website provides citizens andother stakeholders with one of the best interfaces to the regula-tory agency. It allows for self-service around the clock andreduces long queues and time as is evident in many Africangovernment agencies. In addition, international and local busi-nesses can search for and even apply for certain facilities onlinewithout having to make a physical journey to the governmentagency. A website thus becomes a virtual representation of theentire organization in cyberspace (Wattegama 2007).As Mahan (2005) correctly observes, the importance of a
national telecom regulatory authority website can never beunderestimated. A NRA is one of the key government agencies
in any country. It is the apex body that is largely responsible forthe healthy growth of the telecom sector and the diffusion oftelecom services to the public at all levels. It serves a largegroup of stakeholders varying from citizens and consumers toincumbent operators and prospective investors. Regulators setstandards for transparency and accountability and thus, awell-designed and informative website will also demonstratethe extent and facility with which the NRA uses the technolo-gies and services it regulates. A well-maintained websiteincreases confidence in the regulator’s skills and capabilitiesand thus provides a window upon which to evaluate the levelof e-governance within a country.While there exists a plethora of e-government initiatives
taking place within African governments, supported by inter-national agencies, actual analysis of the type of services pro-vided using e-based technologies has received little attentionor speculation as to what constitutes effective components.Focusing onAfrican telecom regulatory authorities, this surveyfollows from a similar study carried out during March-April2004 (Mahan 2005) which focused on 22 AfricanNRAwebsites.Unlike the previous study however, this study evaluates a totalof 30 countries out of 54 countries in Africa. The increase innumber no doubts marks an increase over the past four yearsin the use of websites as a tool in regulation.
* Special thanks to Alvaro Mailhos who was responsible for putting theanalyzed data sets together and ensuring that all figures were correctlyformatted and calculated. Special mention is also extended to AlbertNsengiyumva for his contribution on the regional overview of North andWest Africa; and to Dongola Kikuni who ensured that content fromFrench websites had been analyzed correctly.
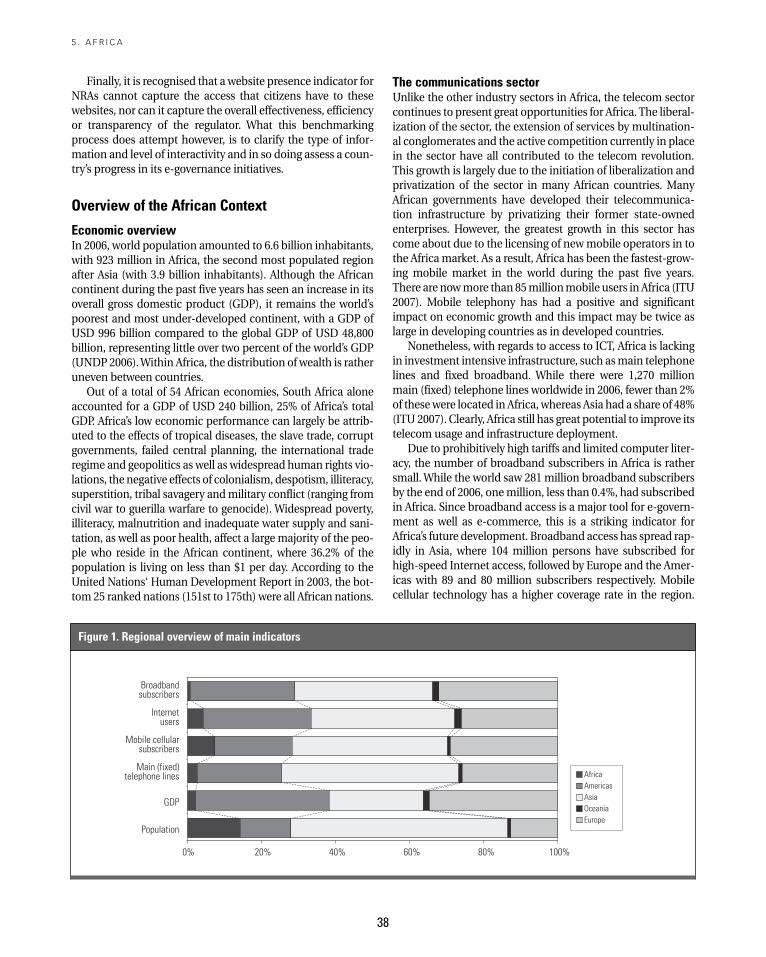
5 . A F R I C A
Finally, it is recognised that a website presence indicator forNRAs cannot capture the access that citizens have to thesewebsites, nor can it capture the overall effectiveness, efficiencyor transparency of the regulator. What this benchmarkingprocess does attempt however, is to clarify the type of infor-mation and level of interactivity and in so doing assess a coun-try’s progress in its e-governance initiatives.
Overview of the African Context
Economic overviewIn 2006, world population amounted to 6.6 billion inhabitants,with 923 million in Africa, the second most populated regionafter Asia (with 3.9 billion inhabitants). Although the Africancontinent during the past five years has seen an increase in itsoverall gross domestic product (GDP), it remains the world’spoorest and most under-developed continent, with a GDP ofUSD 996 billion compared to the global GDP of USD 48,800billion, representing little over two percent of the world’s GDP(UNDP 2006).Within Africa, the distribution of wealth is ratheruneven between countries.Out of a total of 54 African economies, South Africa alone
accounted for a GDP of USD 240 billion, 25% of Africa’s totalGDP. Africa’s low economic performance can largely be attrib-uted to the effects of tropical diseases, the slave trade, corruptgovernments, failed central planning, the international traderegime and geopolitics as well as widespread human rights vio-lations, the negative effects of colonialism, despotism, illiteracy,superstition, tribal savagery andmilitary conflict (ranging fromcivil war to guerilla warfare to genocide). Widespread poverty,illiteracy, malnutrition and inadequate water supply and sani-tation, as well as poor health, affect a large majority of the peo-ple who reside in the African continent, where 36.2% of thepopulation is living on less than $1 per day. According to theUnited Nations‘ Human Development Report in 2003, the bot-tom 25 ranked nations (151st to 175th) were all African nations.
The communications sectorUnlike the other industry sectors in Africa, the telecom sectorcontinues to present great opportunities for Africa. The liberal-ization of the sector, the extension of services by multination-al conglomerates and the active competition currently in placein the sector have all contributed to the telecom revolution.This growth is largely due to the initiation of liberalization andprivatization of the sector in many African countries. ManyAfrican governments have developed their telecommunica-tion infrastructure by privatizing their former state-ownedenterprises. However, the greatest growth in this sector hascome about due to the licensing of newmobile operators in tothe Africamarket. As a result, Africa has been the fastest-grow-ing mobile market in the world during the past five years.There are nowmore than 85millionmobile users in Africa (ITU2007). Mobile telephony has had a positive and significantimpact on economic growth and this impact may be twice aslarge in developing countries as in developed countries.Nonetheless, with regards to access to ICT, Africa is lacking
in investment intensive infrastructure, such asmain telephonelines and fixed broadband. While there were 1,270 millionmain (fixed) telephone lines worldwide in 2006, fewer than 2%of thesewere located in Africa, whereas Asia had a share of 48%(ITU2007). Clearly, Africa still has great potential to improve itstelecom usage and infrastructure deployment.Due to prohibitively high tariffs and limited computer liter-
acy, the number of broadband subscribers in Africa is rathersmall.While the world saw 281 million broadband subscribersby the end of 2006, onemillion, less than 0.4%, had subscribedin Africa. Since broadband access is a major tool for e-govern-ment as well as e-commerce, this is a striking indicator forAfrica’s future development. Broadband access has spread rap-idly in Asia, where 104 million persons have subscribed forhigh-speed Internet access, followed by Europe and the Amer-icas with 89 and 80 million subscribers respectively. Mobilecellular technology has a higher coverage rate in the region.
38
Figure 1. Regional overview of main indicators
Broadbandsubscribers
Internetusers
Mobile cellularsubscribers
Main (fixed)telephone lines
GDP
Population
0% 20% 40% 60% 80% 100%
AfricaAmericasAsiaOceaniaEurope
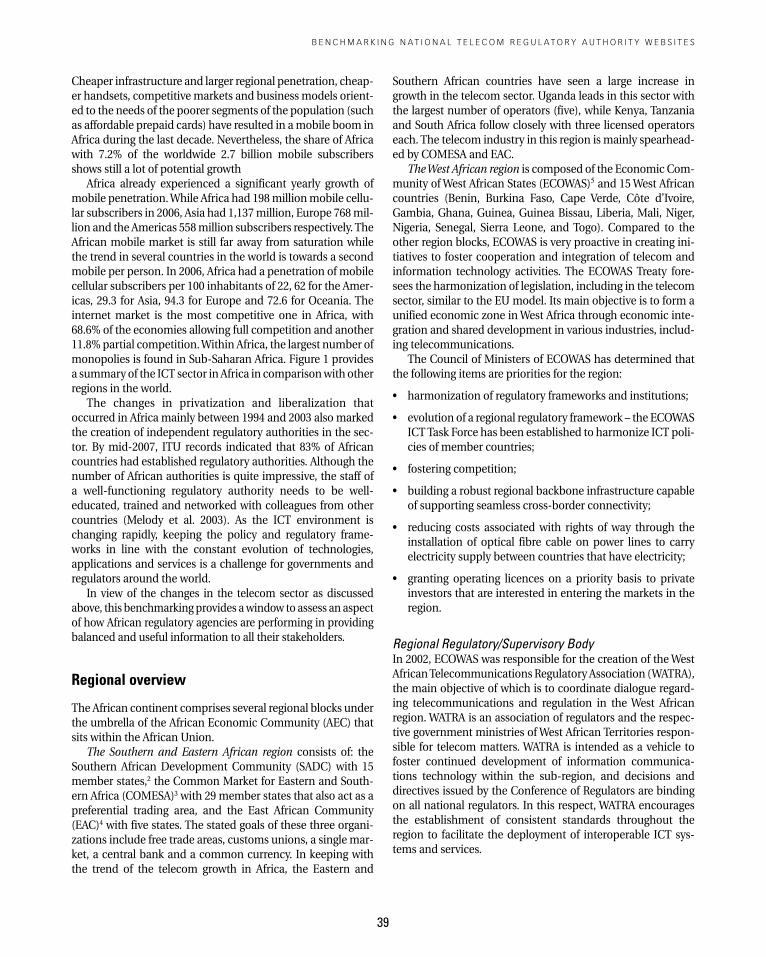
Cheaper infrastructure and larger regional penetration, cheap-er handsets, competitive markets and business models orient-ed to the needs of the poorer segments of the population (suchas affordable prepaid cards) have resulted in amobile boom inAfrica during the last decade. Nevertheless, the share of Africawith 7.2% of the worldwide 2.7 billion mobile subscribersshows still a lot of potential growthAfrica already experienced a significant yearly growth of
mobile penetration.While Africa had 198millionmobile cellu-lar subscribers in 2006, Asia had 1,137million, Europe 768mil-lion and the Americas 558million subscribers respectively.TheAfrican mobile market is still far away from saturation whilethe trend in several countries in the world is towards a secondmobile per person. In 2006, Africa had a penetration of mobilecellular subscribers per 100 inhabitants of 22, 62 for the Amer-icas, 29.3 for Asia, 94.3 for Europe and 72.6 for Oceania. Theinternet market is the most competitive one in Africa, with68.6% of the economies allowing full competition and another11.8%partial competition.Within Africa, the largest number ofmonopolies is found in Sub-Saharan Africa. Figure 1 providesa summary of the ICT sector in Africa in comparisonwith otherregions in the world.The changes in privatization and liberalization that
occurred in Africa mainly between 1994 and 2003 also markedthe creation of independent regulatory authorities in the sec-tor. By mid-2007, ITU records indicated that 83% of Africancountries had established regulatory authorities. Although thenumber of African authorities is quite impressive, the staff ofa well-functioning regulatory authority needs to be well-educated, trained and networked with colleagues from othercountries (Melody et al. 2003). As the ICT environment ischanging rapidly, keeping the policy and regulatory frame-works in line with the constant evolution of technologies,applications and services is a challenge for governments andregulators around the world.In view of the changes in the telecom sector as discussed
above, this benchmarking provides awindow to assess an aspectof how African regulatory agencies are performing in providingbalanced and useful information to all their stakeholders.
Regional overview
The African continent comprises several regional blocks underthe umbrella of the African Economic Community (AEC) thatsits within the African Union.
The Southern and Eastern African region consists of: theSouthern African Development Community (SADC) with 15member states,2 the Common Market for Eastern and South-ern Africa (COMESA)3 with 29 member states that also act as apreferential trading area, and the East African Community(EAC)4 with five states. The stated goals of these three organi-zations include free trade areas, customs unions, a single mar-ket, a central bank and a common currency. In keeping withthe trend of the telecom growth in Africa, the Eastern and
Southern African countries have seen a large increase ingrowth in the telecom sector. Uganda leads in this sector withthe largest number of operators (five), while Kenya, Tanzaniaand South Africa follow closely with three licensed operatorseach. The telecom industry in this region is mainly spearhead-ed by COMESA and EAC.
TheWest African region is composed of the Economic Com-munity ofWest African States (ECOWAS)5 and 15West Africancountries (Benin, Burkina Faso, Cape Verde, Côte d’Ivoire,Gambia, Ghana, Guinea, Guinea Bissau, Liberia, Mali, Niger,Nigeria, Senegal, Sierra Leone, and Togo). Compared to theother region blocks, ECOWAS is very proactive in creating ini-tiatives to foster cooperation and integration of telecom andinformation technology activities. The ECOWAS Treaty fore-sees the harmonization of legislation, including in the telecomsector, similar to the EUmodel. Its main objective is to form aunified economic zone inWest Africa through economic inte-gration and shared development in various industries, includ-ing telecommunications.The Council of Ministers of ECOWAS has determined that
the following items are priorities for the region:
• harmonization of regulatory frameworks and institutions;
• evolution of a regional regulatory framework – the ECOWASICTTask Force has been established to harmonize ICT poli-cies of member countries;
• fostering competition;
• building a robust regional backbone infrastructure capableof supporting seamless cross-border connectivity;
• reducing costs associated with rights of way through theinstallation of optical fibre cable on power lines to carryelectricity supply between countries that have electricity;
• granting operating licences on a priority basis to privateinvestors that are interested in entering the markets in theregion.
Regional Regulatory/Supervisory BodyIn 2002, ECOWAS was responsible for the creation of theWestAfricanTelecommunicationsRegulatory Association (WATRA),the main objective of which is to coordinate dialogue regard-ing telecommunications and regulation in the West Africanregion. WATRA is an association of regulators and the respec-tive government ministries ofWest African Territories respon-sible for telecom matters. WATRA is intended as a vehicle tofoster continued development of information communica-tions technology within the sub-region, and decisions anddirectives issued by the Conference of Regulators are bindingon all national regulators. In this respect, WATRA encouragesthe establishment of consistent standards throughout theregion to facilitate the deployment of interoperable ICT sys-tems and services.
B E N C H M A R K I N G N A T I O N A L T E L E C O M R E G U L A T O R Y A U T H O R I T Y W E B S I T E S
39
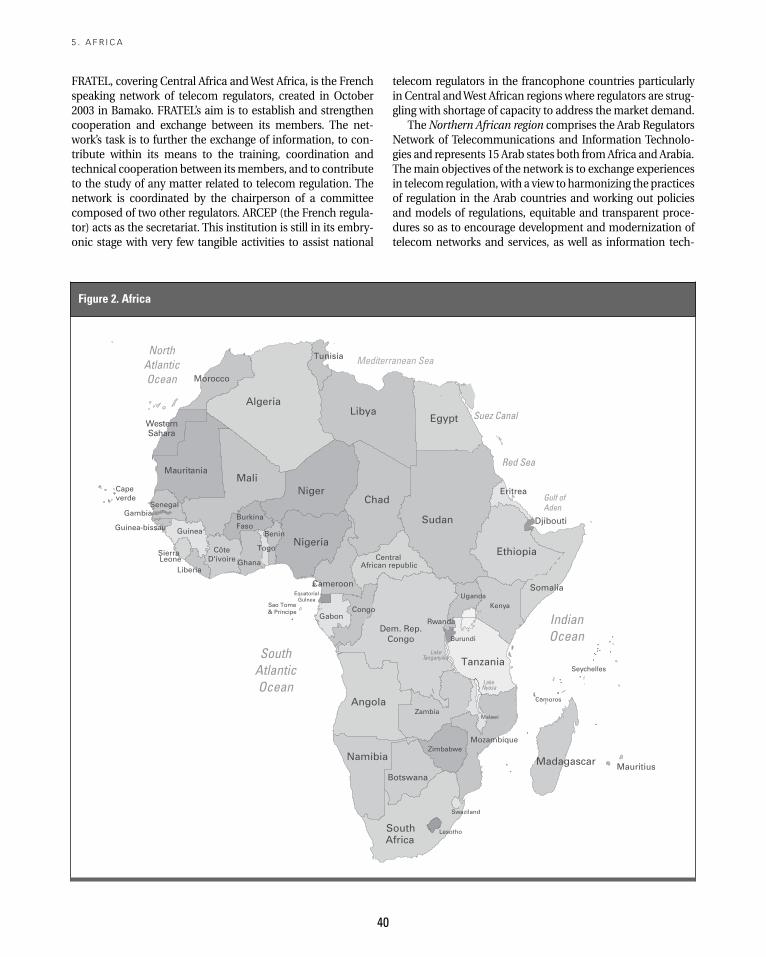
40
FRATEL, covering Central Africa andWest Africa, is the Frenchspeaking network of telecom regulators, created in October2003 in Bamako. FRATEL’s aim is to establish and strengthencooperation and exchange between its members. The net-work’s task is to further the exchange of information, to con-tribute within its means to the training, coordination andtechnical cooperation between itsmembers, and to contributeto the study of any matter related to telecom regulation. Thenetwork is coordinated by the chairperson of a committeecomposed of two other regulators. ARCEP (the French regula-tor) acts as the secretariat. This institution is still in its embry-onic stage with very few tangible activities to assist national
telecom regulators in the francophone countries particularlyin Central andWest African regions where regulators are strug-gling with shortage of capacity to address the market demand.TheNorthern African region comprises the Arab Regulators
Network of Telecommunications and Information Technolo-gies and represents 15 Arab states both fromAfrica and Arabia.Themain objectives of the network is to exchange experiencesin telecom regulation,with a view toharmonizing the practicesof regulation in the Arab countries and working out policiesand models of regulations, equitable and transparent proce-dures so as to encourage development and modernization oftelecom networks and services, as well as information tech-
5 . A F R I C A
Figure 2. Africa
SouthAtlanticOcean
NorthAtlanticOcean
IndianOcean
LakeTanganyika
Mediterranean Sea
Red Sea
Suez Canal
LakeNyasa
Gulf ofAden
Gambia
Swaziland
Zimbabwe
ZambiaAngola Comoros
SeychellesTanzania
AfricaSouth
KenyaUganda
African republicCentral
Niger
Liberia
Cameroon
Gabon
EquatorialGuinea
Guinea
BurkinaFasoGuinea-bissau
MaliMauritania
Senegal
Tunisia
Morocco
AlgeriaLibya
Egypt
Nigeria
Djibouti
Botswana
Namibia
Benin
TogoCôteD'ivoire
SierraLeone
Eritrea
MauritiusMadagascar
Lesotho
Chad
Ghana
Sudan
Burundi
Malawi
Mozambique
Ethiopia
Somalia
Congo
Dem. Rep.Congo
Rwanda
Sao Tome& Principe
WesternSahara
Capeverde
nologies in the Arab world. It is evident that the North Africanregion is shifting from an African based regulatory perspectiveto an Arabic based regulatory network through leadershipfrom United Arabic Emirates and Saudi Arabia.
Methodology
Country selectionFor the purpose of this survey, Africa was broadly defined asthe group of countries or region as recognized by the UnitedNations (UN), whose boundaries were used to recognize acountry as an independent territory or not. The countriescomprising Africa is thus depicted in figure 2.Given the large number of countries, for evaluation purpos-
es the clustering of countries was thought to be necessary. Thiswas seen as a means of fairly evaluating each country on thebenchmark criteria and at the same time providing compar-isons within each cluster grouping. Although this surveysought to reveal best practices in each country, ranking per sewas only a byproduct of the exercise. Table 1 illustrates theconsidered comparative evaluative criteria and reason forelimination.The choicemadewas to use the regional grouping based on
geographical location. This was found to be the best means ofgrouping the NRAs as there was no pre-defined category suchas income levels. The geographical clusters used for the evalu-ation are listed in table 2 and rely heavily on the UN countryclassification.
• Southern Africa: Angola, Botswana, Lesotho, Malawi,Mozambique, Namibia, South Africa, Swaziland, Zambiaand Zimbabwe.
• Eastern Africa: Burundi, Djibouti, Eritrea, Ethiopia, Kenya,Rwanda, Somalia, Sudan, Tanzania and Uganda.
• Island countries: Comoros, Madagascar, Mauritius, Sey-chelles and Reunion
• Central Africa: Cameroon, Central African Republic, Chad,Congo, Congo DRC, Equatorial Guinea and Gabon.
• Northern Africa: Algeria, Egypt, Libya, Mauritania, Moroc-co, Tunisia andWestern Sahara.
• West Africa: Benin, Burkina Faso, Cape Verde, Gambia,Ghana, Guinea, Guinea Bissau, Ivory Coast, Liberia, Mali,Niger, Nigeria, Senegal, Togo, and Sierre Leone.
Each of the 54 countries within these clusters was thenchecked for the telecom regulator information at the Interna-tional Telecommunication Union (ITU) website, or throughthe regional groupings such as ECOWAS, EAC, COMESA, SADCand AU. As noted by Hargittai (2000), assessing for presencethrough search engines can be deceptive and therefore everyeffort was made to contact the regional groupings or sendemail to contacts residing in those countries to ascertain themissing gaps.An initial attempt was made to determine whether an NRA
was independent but it became quickly apparent that it wasdifficult to draw the line between the independent and quasi-independent. The second and perhapsmore important reasonwas that the methodology of this survey is not intended toevaluate the performance of theNRAper se, but rather the per-formance of the NRA’s website. It was therefore decided that acountry’s inclusion would be based on the country having anindependent regulatory authority not linked to the operator orministry and having a functioning website.Each website was then checked to see if it was at a stage in
which it was productive to evaluate for a comparative survey.In a few instances, websites were still under construction andthus were not included. Also, if a government agency (usuallya ministry) is engaged in carrying out the duties of the nation-al regulator, it was not considered for benchmarking purposes,and likewise if the regulatory function was combined with thefixed line telecom operator’s website. Figure 3 indicates thepercentage of countries included in this study.
B E N C H M A R K I N G N A T I O N A L T E L E C O M R E G U L A T O R Y A U T H O R I T Y W E B S I T E S
41
Method Reason for elimination or selection Selected or eliminated
Human Development Index As clearly evidenced from the Human Development indices of UNDP, the income of a country is not directlyco-related to its living standards and or whether the community will have available ICT technologies.
Eliminated
Based on e-government index ofthe UN
This was deemed reasonable as it indicates how each NRA is using its web presence in providing itsservices compared to other government organizations. However, for evaluation purposes there is lessreason to compare the NRA to other government agencies and in addition the data was outdated (2001),nonetheless it does provide an indication of e-government presence.
Eliminated
African ranking 2005 (Mahan) A total of 22 NRA were surveyed. Given that the criteria used in this study is drawn from this previousstudy this survey was seen as a good comparative measure of progress.
Eliminated
Regional economic groupings The choice of selecting regional groupings was drawn from the African Economic Community (AEC), anorganization of African Union states establishing grounds for mutual economic development among themajority of African states. These groupings provide substantive evaluative criteria as member countriesare responsible for enforcing agreed frameworks within each grouping and providing a unified means ofcohesion on policy ideas and implementation.
Eliminated
Table 1. Clustering considerations
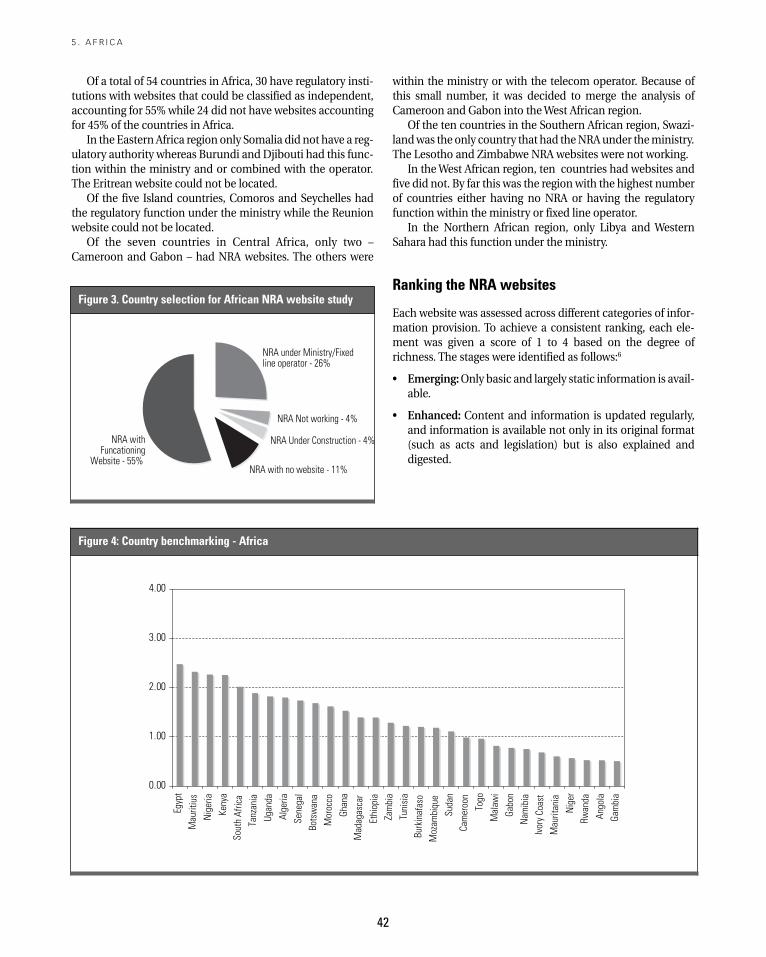
42
Of a total of 54 countries in Africa, 30 have regulatory insti-tutions with websites that could be classified as independent,accounting for 55%while 24 did not have websites accountingfor 45% of the countries in Africa.In the Eastern Africa region only Somalia did not have a reg-
ulatory authority whereas Burundi and Djibouti had this func-tion within the ministry and or combined with the operator.The Eritrean website could not be located.Of the five Island countries, Comoros and Seychelles had
the regulatory function under the ministry while the Reunionwebsite could not be located.Of the seven countries in Central Africa, only two –
Cameroon and Gabon – had NRA websites. The others were
within the ministry or with the telecom operator. Because ofthis small number, it was decided to merge the analysis ofCameroon and Gabon into theWest African region.Of the ten countries in the Southern African region, Swazi-
landwas the only country that had theNRAunder theministry.The Lesotho and Zimbabwe NRA websites were not working.In theWest African region, ten countries had websites and
five did not. By far this was the regionwith the highest numberof countries either having no NRA or having the regulatoryfunction within the ministry or fixed line operator.In the Northern African region, only Libya and Western
Sahara had this function under the ministry.
Ranking the NRA websites
Each website was assessed across different categories of infor-mation provision. To achieve a consistent ranking, each ele-ment was given a score of 1 to 4 based on the degree ofrichness. The stages were identified as follows:6
• Emerging:Only basic and largely static information is avail-able.
• Enhanced: Content and information is updated regularly,and information is available not only in its original format(such as acts and legislation) but is also explained anddigested.
5 . A F R I C A
Figure 4: Country benchmarking - Africa
0.00
1.00
2.00
3.00
4.00
Egyp
tM
aurit
ius
Nig
eria
Keny
aSo
uth
Afric
aTa
nzan
iaUg
anda
Alge
riaSe
nega
lBo
tsw
ana
Mor
occo
Ghan
aM
adag
asca
rEt
hiop
iaZa
mbi
aTu
nisi
aBu
rkin
afas
oM
ozam
biqu
eSu
dan
Cam
eroo
nTo
goM
alaw
iGa
bon
Nam
ibia
Ivor
yCo
ast
Mau
ritan
iaN
iger
Rwan
daAn
gola
Gam
bia
Figure 3. Country selection for African NRA website study
NRA under Ministry/Fixedline operator - 26%
NRA Not working - 4%
NRA Under Construction - 4%
NRA with no website - 11%
NRA withFuncationing
Website - 55%
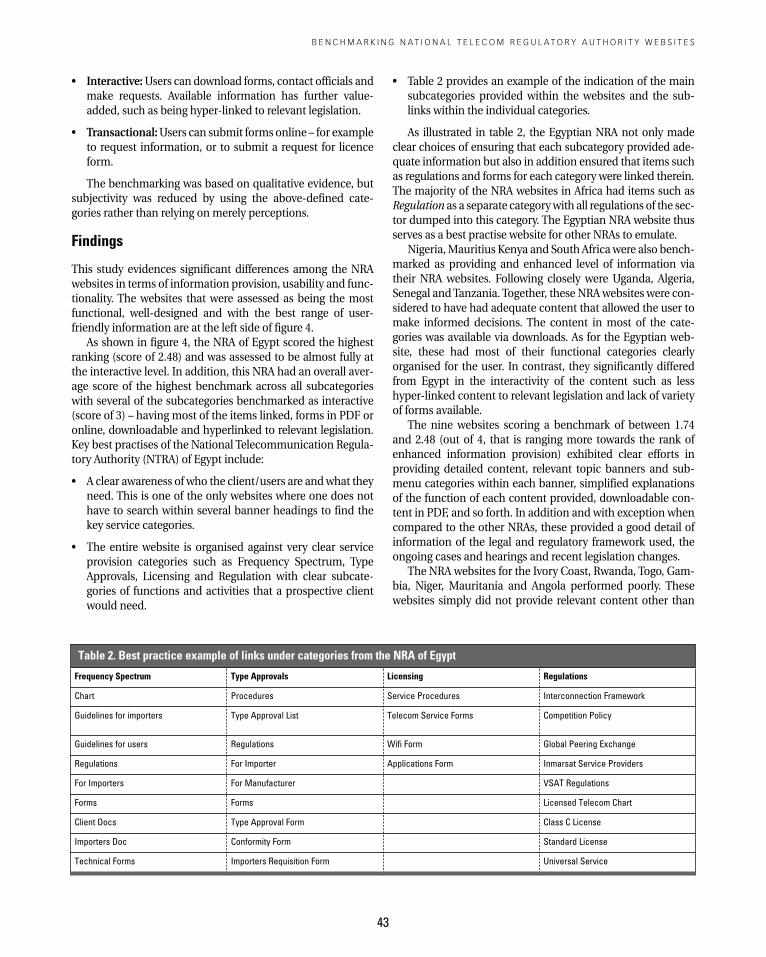
• Interactive:Users can download forms, contact officials andmake requests. Available information has further value-added, such as being hyper-linked to relevant legislation.
• Transactional:Users can submit forms online – for exampleto request information, or to submit a request for licenceform.
The benchmarking was based on qualitative evidence, butsubjectivity was reduced by using the above-defined cate-gories rather than relying on merely perceptions.
Findings
This study evidences significant differences among the NRAwebsites in terms of information provision, usability and func-tionality. The websites that were assessed as being the mostfunctional, well-designed and with the best range of user-friendly information are at the left side of figure 4.As shown in figure 4, the NRA of Egypt scored the highest
ranking (score of 2.48) and was assessed to be almost fully atthe interactive level. In addition, this NRA had an overall aver-age score of the highest benchmark across all subcategorieswith several of the subcategories benchmarked as interactive(score of 3) – having most of the items linked, forms in PDF oronline, downloadable and hyperlinked to relevant legislation.Key best practises of the National Telecommunication Regula-tory Authority (NTRA) of Egypt include:
• A clear awareness of who the client/users are andwhat theyneed. This is one of the only websites where one does nothave to search within several banner headings to find thekey service categories.
• The entire website is organised against very clear serviceprovision categories such as Frequency Spectrum, TypeApprovals, Licensing and Regulation with clear subcate-gories of functions and activities that a prospective clientwould need.
• Table 2 provides an example of the indication of the mainsubcategories provided within the websites and the sub-links within the individual categories.
As illustrated in table 2, the Egyptian NRA not only madeclear choices of ensuring that each subcategory provided ade-quate information but also in addition ensured that items suchas regulations and forms for each category were linked therein.The majority of the NRA websites in Africa had items such asRegulation as a separate categorywith all regulations of the sec-tor dumped into this category. The Egyptian NRA website thusserves as a best practise website for other NRAs to emulate.Nigeria,Mauritius Kenya and South Africawere also bench-
marked as providing and enhanced level of information viatheir NRA websites. Following closely were Uganda, Algeria,Senegal andTanzania. Together, these NRAwebsites were con-sidered to have had adequate content that allowed the user tomake informed decisions. The content in most of the cate-gories was available via downloads. As for the Egyptian web-site, these had most of their functional categories clearlyorganised for the user. In contrast, they significantly differedfrom Egypt in the interactivity of the content such as lesshyper-linked content to relevant legislation and lack of varietyof forms available.The nine websites scoring a benchmark of between 1.74
and 2.48 (out of 4, that is ranging more towards the rank ofenhanced information provision) exhibited clear efforts inproviding detailed content, relevant topic banners and sub-menu categories within each banner, simplified explanationsof the function of each content provided, downloadable con-tent in PDF, and so forth. In addition and with exception whencompared to the other NRAs, these provided a good detail ofinformation of the legal and regulatory framework used, theongoing cases and hearings and recent legislation changes.The NRA websites for the Ivory Coast, Rwanda, Togo, Gam-
bia, Niger, Mauritania and Angola performed poorly. Thesewebsites simply did not provide relevant content other than
B E N C H M A R K I N G N A T I O N A L T E L E C O M R E G U L A T O R Y A U T H O R I T Y W E B S I T E S
43
Frequency Spectrum Type Approvals Licensing Regulations
Chart Procedures Service Procedures Interconnection Framework
Guidelines for importers Type Approval List Telecom Service Forms Competition Policy
Guidelines for users Regulations Wifi Form Global Peering Exchange
Regulations For Importer Applications Form Inmarsat Service Providers
For Importers For Manufacturer VSAT Regulations
Forms Forms Licensed Telecom Chart
Client Docs Type Approval Form Class C License
Importers Doc Conformity Form Standard License
Technical Forms Importers Requisition Form Universal Service
Table 2. Best practice example of links under categories from the NRA of Egypt
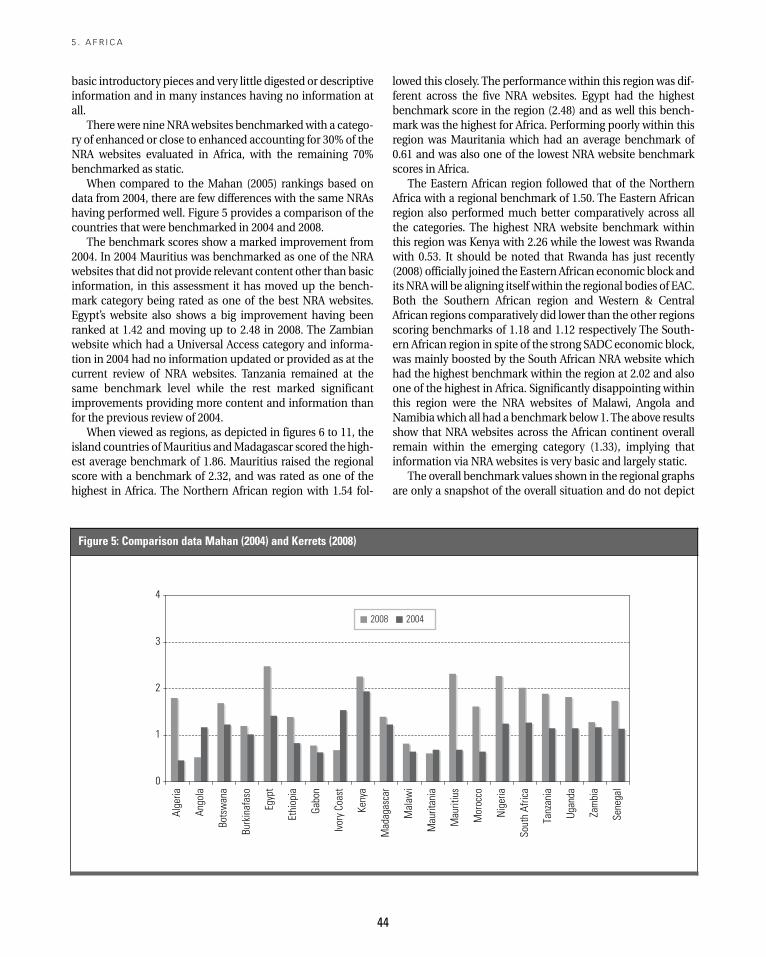
44
basic introductory pieces and very little digested or descriptiveinformation and in many instances having no information atall.Therewere nineNRAwebsites benchmarkedwith a catego-
ry of enhanced or close to enhanced accounting for 30% of theNRA websites evaluated in Africa, with the remaining 70%benchmarked as static.When compared to the Mahan (2005) rankings based on
data from 2004, there are few differences with the same NRAshaving performed well. Figure 5 provides a comparison of thecountries that were benchmarked in 2004 and 2008.The benchmark scores show a marked improvement from
2004. In 2004 Mauritius was benchmarked as one of the NRAwebsites that did not provide relevant content other than basicinformation, in this assessment it has moved up the bench-mark category being rated as one of the best NRA websites.Egypt’s website also shows a big improvement having beenranked at 1.42 and moving up to 2.48 in 2008. The Zambianwebsite which had a Universal Access category and informa-tion in 2004 had no information updated or provided as at thecurrent review of NRA websites. Tanzania remained at thesame benchmark level while the rest marked significantimprovements providing more content and information thanfor the previous review of 2004.When viewed as regions, as depicted in figures 6 to 11, the
island countries ofMauritius andMadagascar scored the high-est average benchmark of 1.86. Mauritius raised the regionalscore with a benchmark of 2.32, and was rated as one of thehighest in Africa. The Northern African region with 1.54 fol-
lowed this closely. The performance within this region was dif-ferent across the five NRA websites. Egypt had the highestbenchmark score in the region (2.48) and as well this bench-mark was the highest for Africa. Performing poorly within thisregion was Mauritania which had an average benchmark of0.61 and was also one of the lowest NRA website benchmarkscores in Africa.The Eastern African region followed that of the Northern
Africa with a regional benchmark of 1.50. The Eastern Africanregion also performed much better comparatively across allthe categories. The highest NRA website benchmark withinthis region was Kenya with 2.26 while the lowest was Rwandawith 0.53. It should be noted that Rwanda has just recently(2008) officially joined the Eastern African economic block andits NRAwill be aligning itself within the regional bodies of EAC.Both the Southern African region and Western & CentralAfrican regions comparatively did lower than the other regionsscoring benchmarks of 1.18 and 1.12 respectively The South-ern African region in spite of the strong SADC economic block,was mainly boosted by the South African NRA website whichhad the highest benchmark within the region at 2.02 and alsoone of the highest in Africa. Significantly disappointing withinthis region were the NRA websites of Malawi, Angola andNamibiawhich all had a benchmark below 1.The above resultsshow that NRA websites across the African continent overallremain within the emerging category (1.33), implying thatinformation via NRA websites is very basic and largely static.The overall benchmark values shown in the regional graphs
are only a snapshot of the overall situation and do not depict
5 . A F R I C A
Figure 5: Comparison data Mahan (2004) and Kerrets (2008)
0
1
2
3
4
Alge
ria
Ango
la
Bots
wan
a
Burk
inaf
aso
Egyp
t
Ethi
opia
Gabo
n
Ivor
yCo
ast
Keny
a
Mad
agas
car
Mal
awi
Mau
ritan
ia
Mau
ritiu
s
Mor
occo
Nig
eria
Sout
hAf
rica
Tanz
ania
Ugan
da
Zam
bia
Sene
gal
2008 2004
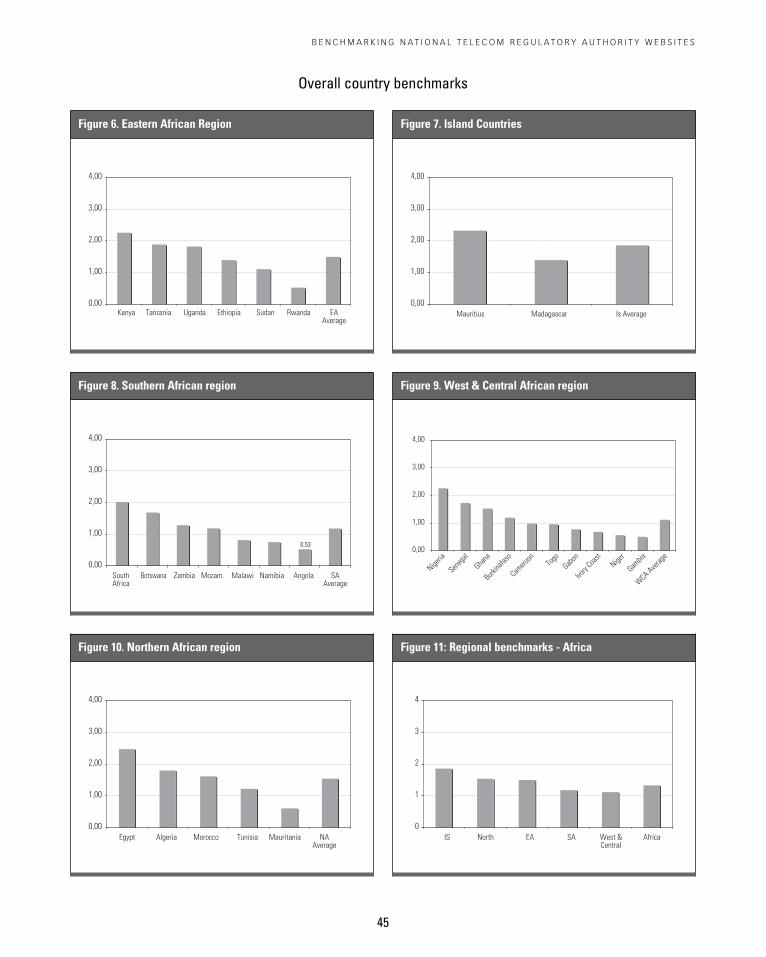
B E N C H M A R K I N G N A T I O N A L T E L E C O M R E G U L A T O R Y A U T H O R I T Y W E B S I T E S
45
Figure 7. Island Countries
0,00
1,00
2,00
3,00
4,00
Mauritius Madagascar Is Average
Figure 6. Eastern African Region
0,00
1,00
2,00
3,00
4,00
Kenya Tanzania Uganda Ethiopia Sudan Rwanda EAAverage
Overall country benchmarks
Figure 9. West & Central African region
0,00
1,00
2,00
3,00
4,00
Nigeria
Seneg
al
Ghana
Burkina
faso
Camero
onTo
goGab
on
Ivory
Coast
Niger
Gambia
WCA Ave
rage
Figure 10. Northern African region
0,00
1,00
2,00
3,00
4,00
Egypt Algeria Morocco Tunisia Mauritania NAAverage
Figure 8. Southern African region
0,53
0,00
1,00
2,00
3,00
4,00
SouthAfrica
Botswana Zambia Mozam. Malawi Namibia Angola SAAverage
Figure 11: Regional benchmarks - Africa
0
1
2
3
4
IS North EA SA West &Central
Africa
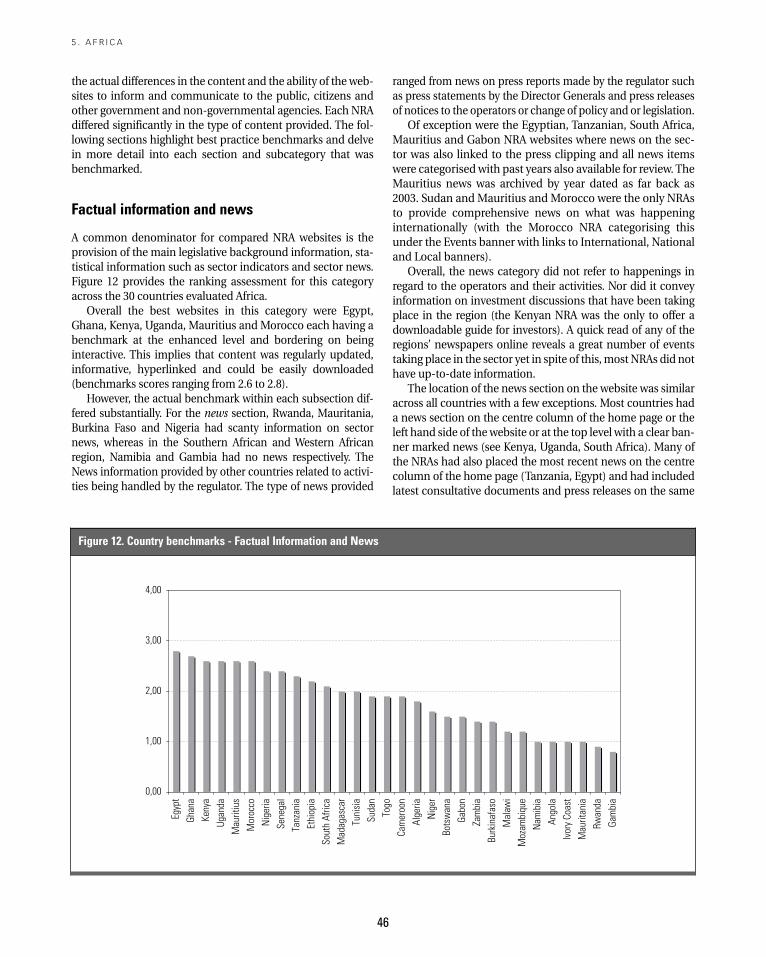
46
the actual differences in the content and the ability of the web-sites to inform and communicate to the public, citizens andother government and non-governmental agencies. Each NRAdiffered significantly in the type of content provided. The fol-lowing sections highlight best practice benchmarks and delvein more detail into each section and subcategory that wasbenchmarked.
Factual information and news
A common denominator for compared NRA websites is theprovision of the main legislative background information, sta-tistical information such as sector indicators and sector news.Figure 12 provides the ranking assessment for this categoryacross the 30 countries evaluated Africa.Overall the best websites in this category were Egypt,
Ghana, Kenya, Uganda, Mauritius and Morocco each having abenchmark at the enhanced level and bordering on beinginteractive. This implies that content was regularly updated,informative, hyperlinked and could be easily downloaded(benchmarks scores ranging from 2.6 to 2.8).However, the actual benchmark within each subsection dif-
fered substantially. For the news section, Rwanda, Mauritania,Burkina Faso and Nigeria had scanty information on sectornews, whereas in the Southern African and Western Africanregion, Namibia and Gambia had no news respectively. TheNews information provided by other countries related to activi-ties being handled by the regulator. The type of news provided
ranged from news on press reports made by the regulator suchas press statements by the Director Generals and press releasesof notices to the operators or change of policy and or legislation.Of exception were the Egyptian, Tanzanian, South Africa,
Mauritius and Gabon NRA websites where news on the sec-tor was also linked to the press clipping and all news itemswere categorisedwith past years also available for review.TheMauritius news was archived by year dated as far back as2003. Sudan andMauritius and Morocco were the only NRAsto provide comprehensive news on what was happeninginternationally (with the Morocco NRA categorising thisunder the Events banner with links to International, Nationaland Local banners).Overall, the news category did not refer to happenings in
regard to the operators and their activities. Nor did it conveyinformation on investment discussions that have been takingplace in the region (the Kenyan NRA was the only to offer adownloadable guide for investors). A quick read of any of theregions’ newspapers online reveals a great number of eventstaking place in the sector yet in spite of this,most NRAs did nothave up-to-date information.The location of the news section on the website was similar
across all countries with a few exceptions. Most countries hada news section on the centre column of the home page or theleft hand side of thewebsite or at the top level with a clear ban-ner marked news (see Kenya, Uganda, South Africa). Many ofthe NRAs had also placed the most recent news on the centrecolumn of the home page (Tanzania, Egypt) and had includedlatest consultative documents and press releases on the same
5 . A F R I C A
Figure 12. Country benchmarks - Factual Information and News
0,00
1,00
2,00
3,00
4,00
Egyp
t
Ghan
a
Keny
a
Ugan
da
Mau
ritiu
s
Mor
occo
Nig
eria
Sene
gal
Tanz
ania
Ethi
opia
Sout
hAf
rica
Mad
agas
car
Tuni
sia
Suda
n
Togo
Cam
eroo
n
Alge
ria
Nig
er
Bots
wan
a
Gabo
n
Zam
bia
Burk
inaf
aso
Mal
awi
Moz
ambi
que
Nam
ibia
Ango
la
Ivor
yCo
ast
Mau
ritan
ia
Rwan
da
Gam
bia
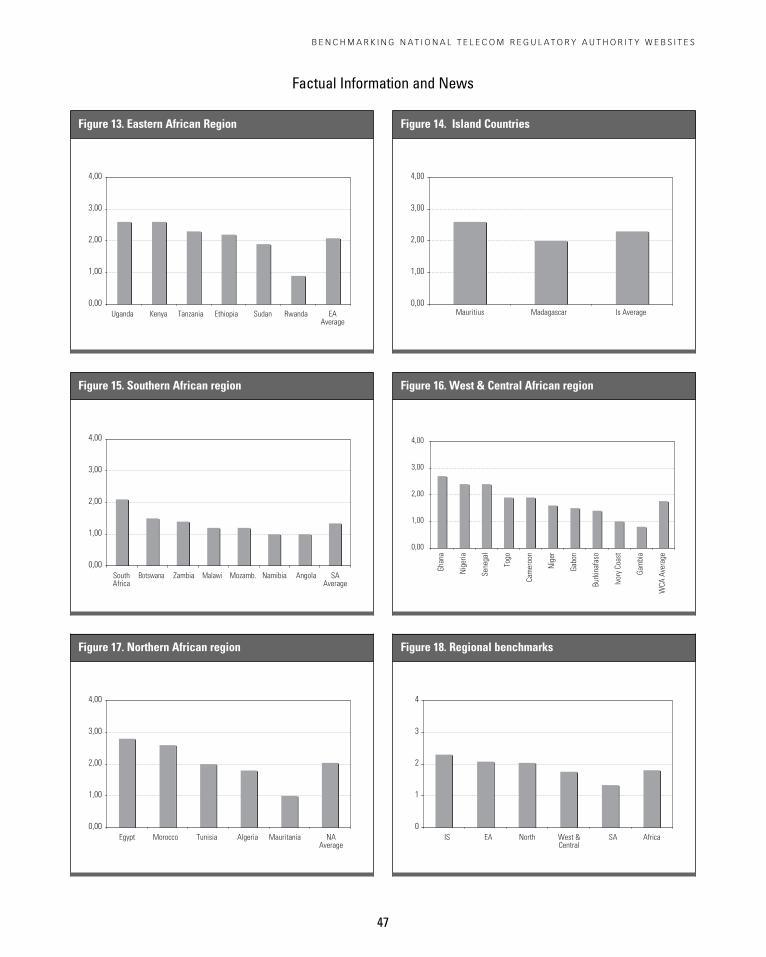
B E N C H M A R K I N G N A T I O N A L T E L E C O M R E G U L A T O R Y A U T H O R I T Y W E B S I T E S
47
Figure 14. Island Countries
0,00
1,00
2,00
3,00
4,00
Mauritius Madagascar Is Average
f
Figure 13. Eastern African Region
0,00
1,00
2,00
3,00
4,00
Uganda Kenya Tanzania Ethiopia Sudan Rwanda EAAverage
Figure 17. Northern African region
0,00
1,00
2,00
3,00
4,00
Egypt Morocco Tunisia Algeria Mauritania NAAverage
Figure 18. Regional benchmarks
0
1
2
3
4
IS EA North West &Central
SA Africa
Figure 15. Southern African region
0,00
1,00
2,00
3,00
4,00
SouthAfrica
Botswana Zambia Malawi Mozamb. Namibia Angola SAAverage
Figure 16. West & Central African region
0,00
1,00
2,00
3,00
4,00Gh
ana
Nig
eria
Sene
gal
Togo
Cam
eroo
n
Nig
er
Gabo
n
Burk
inaf
aso
Ivor
yCo
ast
Gam
bia
WCA
Aver
age
Factual Information and News
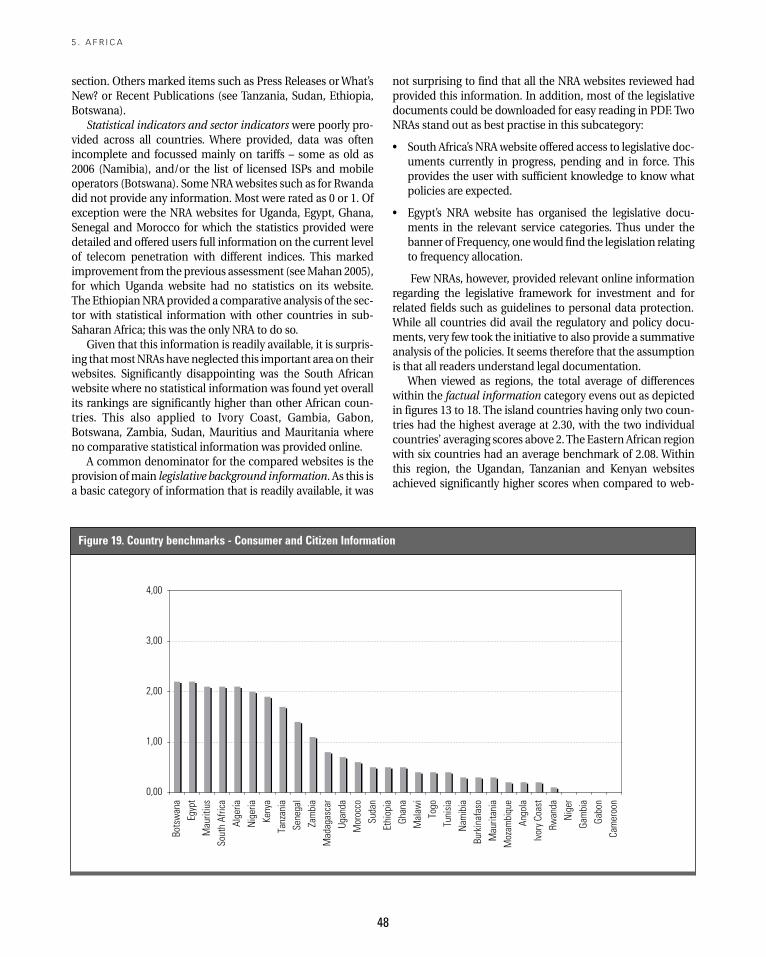
48
section. Others marked items such as Press Releases orWhat’sNew? or Recent Publications (see Tanzania, Sudan, Ethiopia,Botswana).
Statistical indicators and sector indicators were poorly pro-vided across all countries. Where provided, data was oftenincomplete and focussed mainly on tariffs – some as old as2006 (Namibia), and/or the list of licensed ISPs and mobileoperators (Botswana). SomeNRAwebsites such as for Rwandadid not provide any information. Most were rated as 0 or 1. Ofexception were the NRA websites for Uganda, Egypt, Ghana,Senegal and Morocco for which the statistics provided weredetailed and offered users full information on the current levelof telecom penetration with different indices. This markedimprovement from the previous assessment (seeMahan 2005),for which Uganda website had no statistics on its website.The EthiopianNRAprovided a comparative analysis of the sec-tor with statistical information with other countries in sub-Saharan Africa; this was the only NRA to do so.Given that this information is readily available, it is surpris-
ing thatmostNRAs have neglected this important area on theirwebsites. Significantly disappointing was the South Africanwebsite where no statistical information was found yet overallits rankings are significantly higher than other African coun-tries. This also applied to Ivory Coast, Gambia, Gabon,Botswana, Zambia, Sudan, Mauritius and Mauritania whereno comparative statistical information was provided online.A common denominator for the compared websites is the
provision ofmain legislative background information. As this isa basic category of information that is readily available, it was
not surprising to find that all the NRA websites reviewed hadprovided this information. In addition, most of the legislativedocuments could be downloaded for easy reading in PDF. TwoNRAs stand out as best practise in this subcategory:
• South Africa’s NRAwebsite offered access to legislative doc-uments currently in progress, pending and in force. Thisprovides the user with sufficient knowledge to know whatpolicies are expected.
• Egypt’s NRA website has organised the legislative docu-ments in the relevant service categories. Thus under thebanner of Frequency, onewould find the legislation relatingto frequency allocation.
Few NRAs, however, provided relevant online informationregarding the legislative framework for investment and forrelated fields such as guidelines to personal data protection.While all countries did avail the regulatory and policy docu-ments, very few took the initiative to also provide a summativeanalysis of the policies. It seems therefore that the assumptionis that all readers understand legal documentation.When viewed as regions, the total average of differences
within the factual information category evens out as depictedin figures 13 to 18. The island countries having only two coun-tries had the highest average at 2.30, with the two individualcountries’ averaging scores above 2.The Eastern African regionwith six countries had an average benchmark of 2.08. Withinthis region, the Ugandan, Tanzanian and Kenyan websitesachieved significantly higher scores when compared to web-
5 . A F R I C A
Figure 19. Country benchmarks - Consumer and Citizen Information
0,00
1,00
2,00
3,00
4,00
Bots
wan
a
Egyp
t
Mau
ritiu
s
Sout
hAf
rica
Alge
ria
Nig
eria
Keny
a
Tanz
ania
Sene
gal
Zam
bia
Mad
agas
car
Ugan
da
Mor
occo
Suda
n
Ethi
opia
Ghan
a
Mal
awi
Togo
Tuni
sia
Nam
ibia
Burk
inaf
aso
Mau
ritan
ia
Moz
ambi
que
Ango
la
Ivor
yCo
ast
Rwan
da
Nig
er
Gam
bia
Gabo
n
Cam
eroo
n
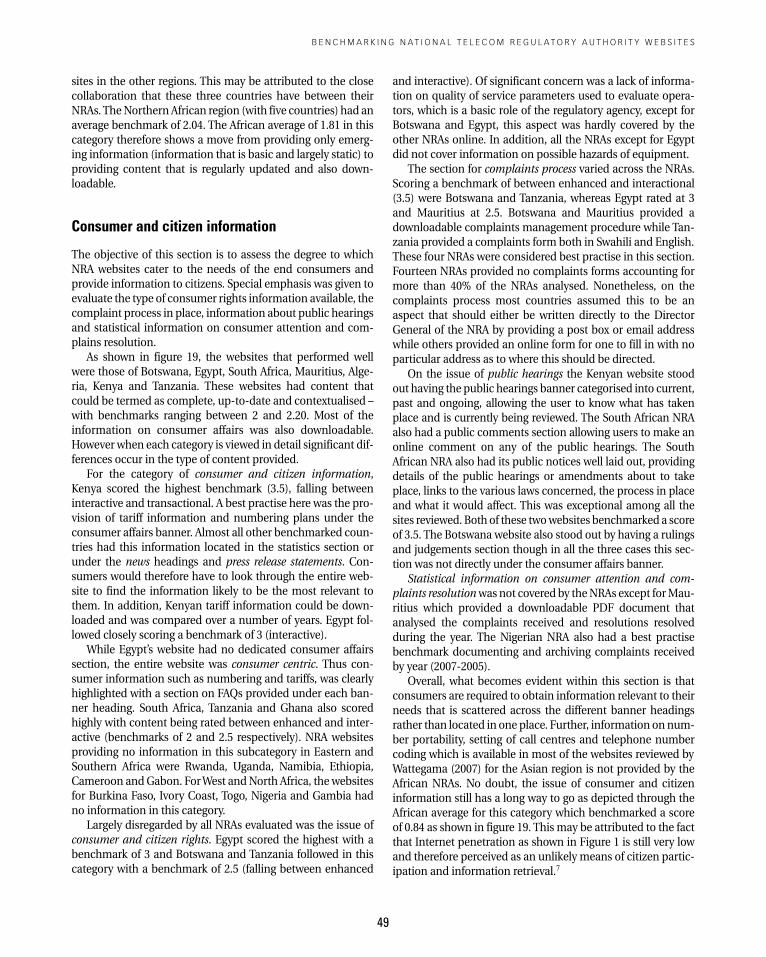
sites in the other regions. This may be attributed to the closecollaboration that these three countries have between theirNRAs.TheNorthern African region (with five countries) had anaverage benchmark of 2.04. The African average of 1.81 in thiscategory therefore shows a move from providing only emerg-ing information (information that is basic and largely static) toproviding content that is regularly updated and also down-loadable.
Consumer and citizen information
The objective of this section is to assess the degree to whichNRA websites cater to the needs of the end consumers andprovide information to citizens. Special emphasis was given toevaluate the type of consumer rights information available, thecomplaint process in place, information about public hearingsand statistical information on consumer attention and com-plains resolution.As shown in figure 19, the websites that performed well
were those of Botswana, Egypt, South Africa, Mauritius, Alge-ria, Kenya and Tanzania. These websites had content thatcould be termed as complete, up-to-date and contextualised –with benchmarks ranging between 2 and 2.20. Most of theinformation on consumer affairs was also downloadable.However when each category is viewed in detail significant dif-ferences occur in the type of content provided.For the category of consumer and citizen information,
Kenya scored the highest benchmark (3.5), falling betweeninteractive and transactional. A best practise here was the pro-vision of tariff information and numbering plans under theconsumer affairs banner. Almost all other benchmarked coun-tries had this information located in the statistics section orunder the news headings and press release statements. Con-sumers would therefore have to look through the entire web-site to find the information likely to be the most relevant tothem. In addition, Kenyan tariff information could be down-loaded and was compared over a number of years. Egypt fol-lowed closely scoring a benchmark of 3 (interactive).While Egypt’s website had no dedicated consumer affairs
section, the entire website was consumer centric. Thus con-sumer information such as numbering and tariffs, was clearlyhighlighted with a section on FAQs provided under each ban-ner heading. South Africa, Tanzania and Ghana also scoredhighly with content being rated between enhanced and inter-active (benchmarks of 2 and 2.5 respectively). NRA websitesproviding no information in this subcategory in Eastern andSouthern Africa were Rwanda, Uganda, Namibia, Ethiopia,Cameroon andGabon. ForWest andNorth Africa, the websitesfor Burkina Faso, Ivory Coast, Togo, Nigeria and Gambia hadno information in this category.Largely disregarded by all NRAs evaluated was the issue of
consumer and citizen rights. Egypt scored the highest with abenchmark of 3 and Botswana and Tanzania followed in thiscategory with a benchmark of 2.5 (falling between enhanced
and interactive). Of significant concern was a lack of informa-tion on quality of service parameters used to evaluate opera-tors, which is a basic role of the regulatory agency, except forBotswana and Egypt, this aspect was hardly covered by theother NRAs online. In addition, all the NRAs except for Egyptdid not cover information on possible hazards of equipment.The section for complaints process varied across the NRAs.
Scoring a benchmark of between enhanced and interactional(3.5) were Botswana and Tanzania, whereas Egypt rated at 3and Mauritius at 2.5. Botswana and Mauritius provided adownloadable complaints management procedure while Tan-zania provided a complaints form both in Swahili and English.These four NRAs were considered best practise in this section.Fourteen NRAs provided no complaints forms accounting formore than 40% of the NRAs analysed. Nonetheless, on thecomplaints process most countries assumed this to be anaspect that should either be written directly to the DirectorGeneral of the NRA by providing a post box or email addresswhile others provided an online form for one to fill in with noparticular address as to where this should be directed.On the issue of public hearings the Kenyan website stood
out having the public hearings banner categorised into current,past and ongoing, allowing the user to know what has takenplace and is currently being reviewed. The South African NRAalso had a public comments section allowing users to make anonline comment on any of the public hearings. The SouthAfrican NRA also had its public notices well laid out, providingdetails of the public hearings or amendments about to takeplace, links to the various laws concerned, the process in placeand what it would affect. This was exceptional among all thesites reviewed. Both of these twowebsites benchmarked a scoreof 3.5. The Botswana website also stood out by having a rulingsand judgements section though in all the three cases this sec-tion was not directly under the consumer affairs banner.
Statistical information on consumer attention and com-plaints resolutionwasnot covered by theNRAs except forMau-ritius which provided a downloadable PDF document thatanalysed the complaints received and resolutions resolvedduring the year. The Nigerian NRA also had a best practisebenchmark documenting and archiving complaints receivedby year (2007-2005).Overall, what becomes evident within this section is that
consumers are required to obtain information relevant to theirneeds that is scattered across the different banner headingsrather than located in one place. Further, information onnum-ber portability, setting of call centres and telephone numbercoding which is available in most of the websites reviewed byWattegama (2007) for the Asian region is not provided by theAfrican NRAs. No doubt, the issue of consumer and citizeninformation still has a long way to go as depicted through theAfrican average for this category which benchmarked a scoreof 0.84 as shown in figure 19. This may be attributed to the factthat Internet penetration as shown in Figure 1 is still very lowand therefore perceived as an unlikely means of citizen partic-ipation and information retrieval.7
B E N C H M A R K I N G N A T I O N A L T E L E C O M R E G U L A T O R Y A U T H O R I T Y W E B S I T E S
49
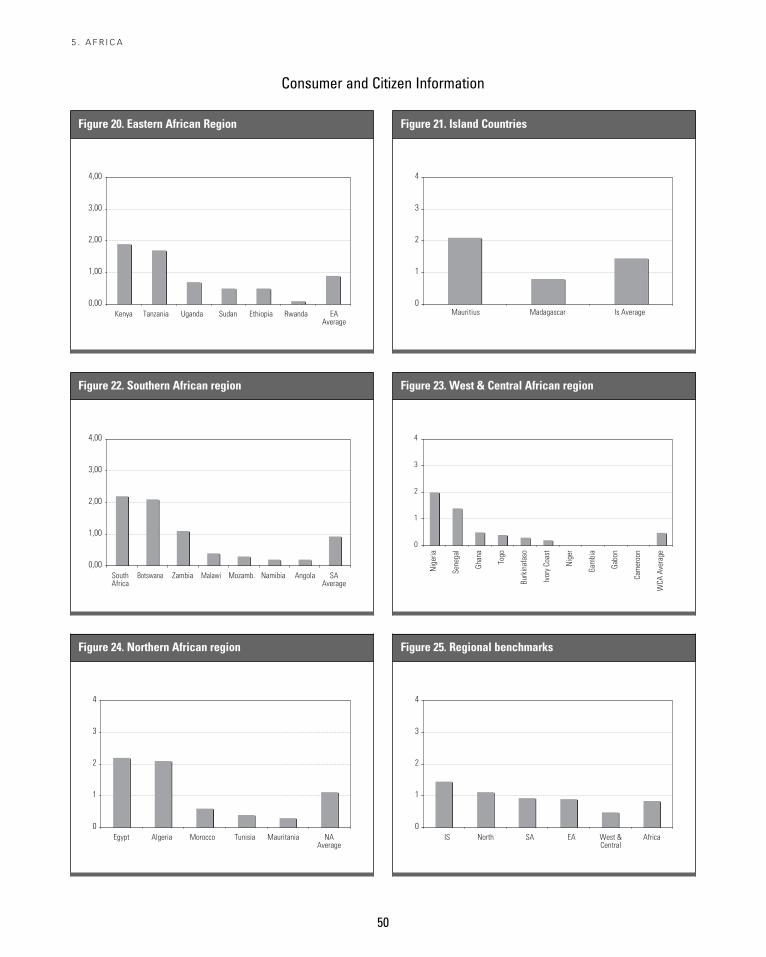
50
5 . A F R I C A
Figure 20. Eastern African Region
0,00
1,00
2,00
3,00
4,00
Kenya Tanzania Uganda Sudan Ethiopia Rwanda EAAverage
Figure 24. Northern African region
0
1
2
3
4
Egypt Algeria Morocco Tunisia Mauritania NAAverage
Figure 22. Southern African region
0,00
1,00
2,00
3,00
4,00
SouthAfrica
Botswana Zambia Malawi Mozamb. Namibia Angola SAAverage
Figure 25. Regional benchmarks
0
1
2
3
4
IS North SA EA West &Central
Africa
Figure 21. Island Countries
0
1
2
3
4
Mauritius Madagascar Is Average
Figure 23. West & Central African region
0
1
2
3
4N
iger
ia
Sene
gal
Ghan
a
Togo
Burk
inaf
aso
Ivor
yCo
ast
Nig
er
Gam
bia
Gabo
n
Cam
eroo
n
WCA
Aver
age
Consumer and Citizen Information
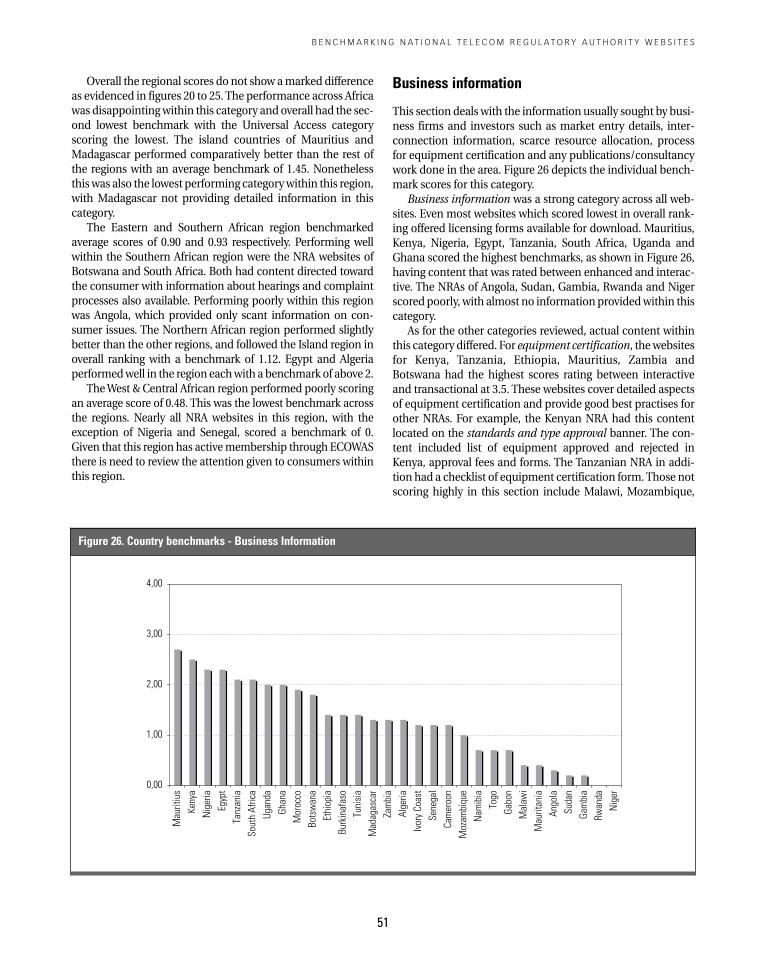
Overall the regional scores do not show amarked differenceas evidenced in figures 20 to 25. The performance across Africawas disappointingwithin this category and overall had the sec-ond lowest benchmark with the Universal Access categoryscoring the lowest. The island countries of Mauritius andMadagascar performed comparatively better than the rest ofthe regions with an average benchmark of 1.45. Nonethelessthiswas also the lowest performing categorywithin this region,with Madagascar not providing detailed information in thiscategory.The Eastern and Southern African region benchmarked
average scores of 0.90 and 0.93 respectively. Performing wellwithin the Southern African region were the NRA websites ofBotswana and South Africa. Both had content directed towardthe consumer with information about hearings and complaintprocesses also available. Performing poorly within this regionwas Angola, which provided only scant information on con-sumer issues. The Northern African region performed slightlybetter than the other regions, and followed the Island region inoverall ranking with a benchmark of 1.12. Egypt and Algeriaperformedwell in the region eachwith a benchmark of above 2.TheWest & Central African region performed poorly scoring
an average score of 0.48. This was the lowest benchmark acrossthe regions. Nearly all NRA websites in this region, with theexception of Nigeria and Senegal, scored a benchmark of 0.Given that this region has activemembership through ECOWASthere is need to review the attention given to consumers withinthis region.
Business information
This section deals with the information usually sought by busi-ness firms and investors such as market entry details, inter-connection information, scarce resource allocation, processfor equipment certification and any publications/consultancywork done in the area. Figure 26 depicts the individual bench-mark scores for this category.
Business information was a strong category across all web-sites. Even most websites which scored lowest in overall rank-ing offered licensing forms available for download. Mauritius,Kenya, Nigeria, Egypt, Tanzania, South Africa, Uganda andGhana scored the highest benchmarks, as shown in Figure 26,having content that was rated between enhanced and interac-tive. The NRAs of Angola, Sudan, Gambia, Rwanda and Nigerscored poorly, with almost no information providedwithin thiscategory.As for the other categories reviewed, actual content within
this category differed. For equipment certification, thewebsitesfor Kenya, Tanzania, Ethiopia, Mauritius, Zambia andBotswana had the highest scores rating between interactiveand transactional at 3.5. These websites cover detailed aspectsof equipment certification and provide good best practises forother NRAs. For example, the Kenyan NRA had this contentlocated on the standards and type approval banner. The con-tent included list of equipment approved and rejected inKenya, approval fees and forms. The Tanzanian NRA in addi-tion had a checklist of equipment certification form.Those notscoring highly in this section include Malawi, Mozambique,
B E N C H M A R K I N G N A T I O N A L T E L E C O M R E G U L A T O R Y A U T H O R I T Y W E B S I T E S
51
Figure 26. Country benchmarks - Business Information
0,00
1,00
2,00
3,00
4,00
Mau
ritiu
s
Keny
a
Nig
eria
Egyp
t
Tanz
ania
Sout
hAf
rica
Ugan
da
Ghan
a
Mor
occo
Bots
wan
a
Ethi
opia
Burk
inaf
aso
Tuni
sia
Mad
agas
car
Zam
bia
Alge
ria
Ivor
yCo
ast
Sene
gal
Cam
eroo
n
Moz
ambi
que
Nam
ibia
Togo
Gabo
n
Mal
awi
Mau
ritan
ia
Ango
la
Suda
n
Gam
bia
Rwan
da
Nig
er
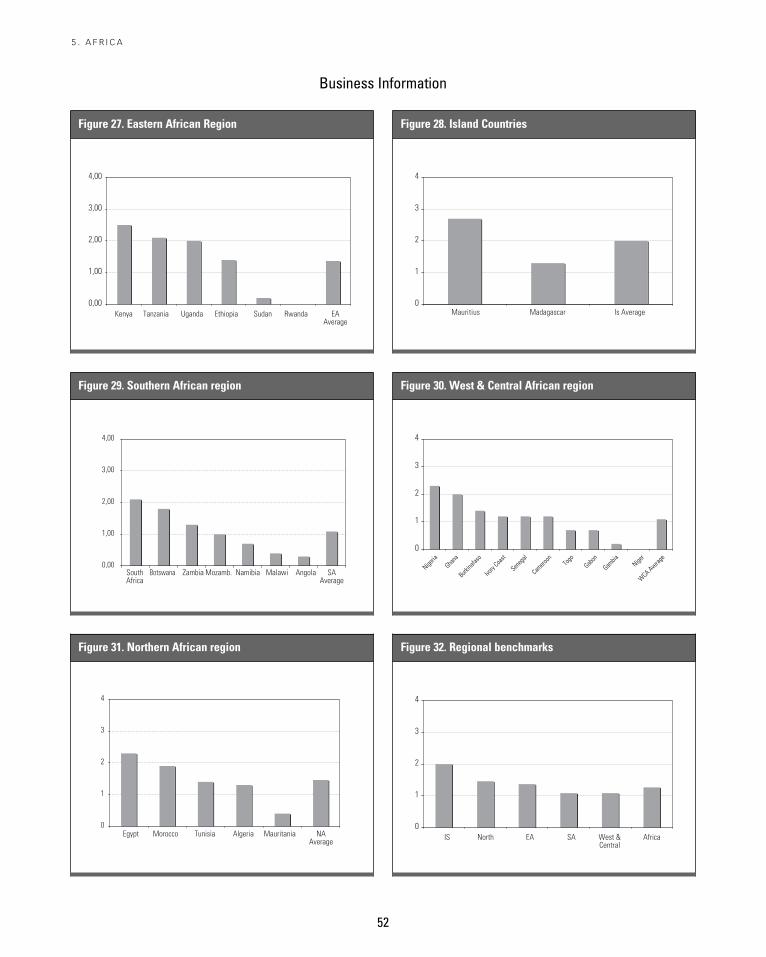
52
5 . A F R I C A
Figure 27. Eastern African Region
0,00
1,00
2,00
3,00
4,00
Kenya Tanzania Uganda Ethiopia Sudan Rwanda EAAverage
Figure 31. Northern African region
0
1
2
3
4
Egypt Morocco Tunisia Algeria Mauritania NAAverage
Figure 29. Southern African region
0,00
1,00
2,00
3,00
4,00
SouthAfrica
Botswana Zambia Mozamb. Namibia Malawi Angola SAAverage
Figure 32. Regional benchmarks
0
1
2
3
4
IS North EA SA West &Central
Africa
Figure 28. Island Countries
0
1
2
3
4
Mauritius Madagascar Is Average
Figure 30. West & Central African region
0
1
2
3
4
Nigeria
Ghana
Burkina
faso
Ivory
Coast
Seneg
al
Camero
onTo
goGab
on
Gambia
Niger
WCA Ave
rage
Business Information
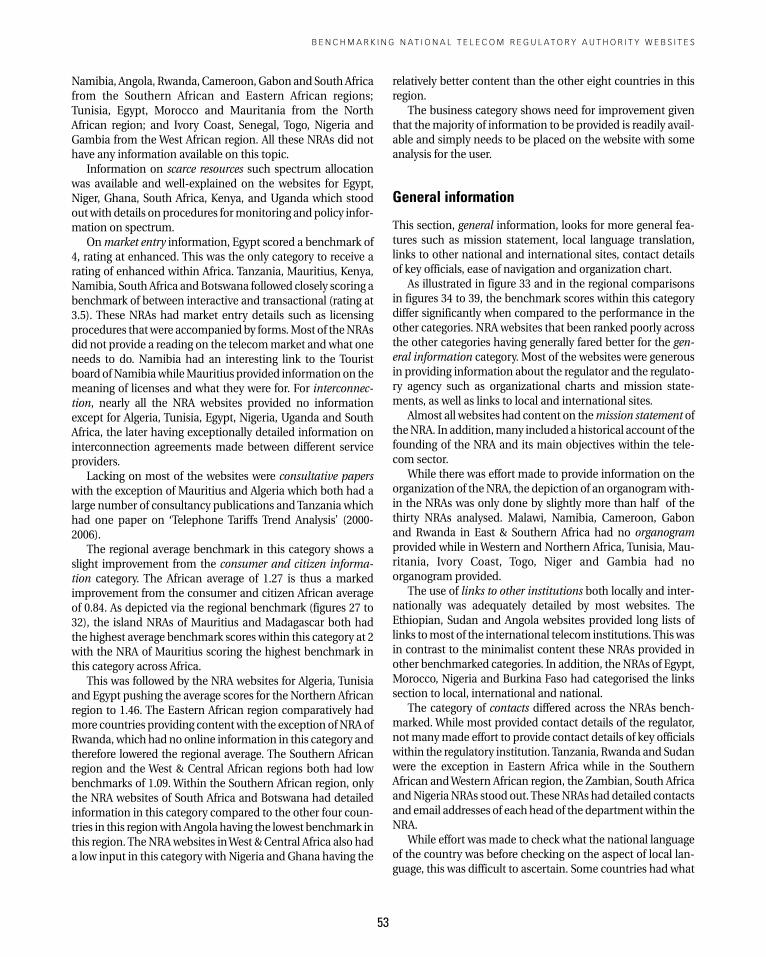
Namibia, Angola, Rwanda, Cameroon,Gabon and SouthAfricafrom the Southern African and Eastern African regions;Tunisia, Egypt, Morocco and Mauritania from the NorthAfrican region; and Ivory Coast, Senegal, Togo, Nigeria andGambia from the West African region. All these NRAs did nothave any information available on this topic.Information on scarce resources such spectrum allocation
was available and well-explained on the websites for Egypt,Niger, Ghana, South Africa, Kenya, and Uganda which stoodoutwith details on procedures formonitoring andpolicy infor-mation on spectrum.Onmarket entry information, Egypt scored a benchmark of
4, rating at enhanced. This was the only category to receive arating of enhanced within Africa. Tanzania, Mauritius, Kenya,Namibia, South Africa andBotswana followed closely scoring abenchmark of between interactive and transactional (rating at3.5). These NRAs had market entry details such as licensingprocedures thatwere accompaniedby forms.Most of theNRAsdid not provide a reading on the telecommarket andwhat oneneeds to do. Namibia had an interesting link to the Touristboard ofNamibiawhileMauritius provided information on themeaning of licenses and what they were for. For interconnec-tion, nearly all the NRA websites provided no informationexcept for Algeria, Tunisia, Egypt, Nigeria, Uganda and SouthAfrica, the later having exceptionally detailed information oninterconnection agreements made between different serviceproviders.Lacking on most of the websites were consultative papers
with the exception of Mauritius and Algeria which both had alarge number of consultancy publications andTanzania whichhad one paper on ‘Telephone Tariffs Trend Analysis’ (2000-2006).The regional average benchmark in this category shows a
slight improvement from the consumer and citizen informa-tion category. The African average of 1.27 is thus a markedimprovement from the consumer and citizen African averageof 0.84. As depicted via the regional benchmark (figures 27 to32), the island NRAs of Mauritius and Madagascar both hadthe highest average benchmark scores within this category at 2with the NRA of Mauritius scoring the highest benchmark inthis category across Africa.This was followed by the NRA websites for Algeria, Tunisia
and Egypt pushing the average scores for the Northern Africanregion to 1.46. The Eastern African region comparatively hadmore countries providing contentwith the exception ofNRAofRwanda, which had no online information in this category andtherefore lowered the regional average. The Southern Africanregion and the West & Central African regions both had lowbenchmarks of 1.09. Within the Southern African region, onlythe NRA websites of South Africa and Botswana had detailedinformation in this category compared to the other four coun-tries in this regionwith Angola having the lowest benchmark inthis region. TheNRAwebsites inWest & Central Africa also hada low input in this category with Nigeria and Ghana having the
relatively better content than the other eight countries in thisregion.The business category shows need for improvement given
that themajority of information to be provided is readily avail-able and simply needs to be placed on the website with someanalysis for the user.
General information
This section, general information, looks for more general fea-tures such as mission statement, local language translation,links to other national and international sites, contact detailsof key officials, ease of navigation and organization chart.As illustrated in figure 33 and in the regional comparisons
in figures 34 to 39, the benchmark scores within this categorydiffer significantly when compared to the performance in theother categories. NRAwebsites that been ranked poorly acrossthe other categories having generally fared better for the gen-eral information category. Most of the websites were generousin providing information about the regulator and the regulato-ry agency such as organizational charts and mission state-ments, as well as links to local and international sites.Almost all websites had content on themission statement of
theNRA. In addition,many included ahistorical account of thefounding of the NRA and its main objectives within the tele-com sector.While there was effort made to provide information on the
organization of theNRA, the depiction of an organogramwith-in the NRAs was only done by slightly more than half of thethirty NRAs analysed. Malawi, Namibia, Cameroon, Gabonand Rwanda in East & Southern Africa had no organogramprovided while inWestern and Northern Africa, Tunisia, Mau-ritania, Ivory Coast, Togo, Niger and Gambia had noorganogram provided.The use of links to other institutions both locally and inter-
nationally was adequately detailed by most websites. TheEthiopian, Sudan and Angola websites provided long lists oflinks tomost of the international telecom institutions.Thiswasin contrast to the minimalist content these NRAs provided inother benchmarked categories. In addition, the NRAs of Egypt,Morocco, Nigeria and Burkina Faso had categorised the linkssection to local, international and national.The category of contacts differed across the NRAs bench-
marked. While most provided contact details of the regulator,notmanymade effort to provide contact details of key officialswithin the regulatory institution.Tanzania, Rwanda and Sudanwere the exception in Eastern Africa while in the SouthernAfrican andWestern African region, the Zambian, South AfricaandNigeriaNRAs stood out. TheseNRAs had detailed contactsand email addresses of each head of the departmentwithin theNRA.While effort was made to check what the national language
of the country was before checking on the aspect of local lan-guage, this was difficult to ascertain. Some countries had what
B E N C H M A R K I N G N A T I O N A L T E L E C O M R E G U L A T O R Y A U T H O R I T Y W E B S I T E S
53
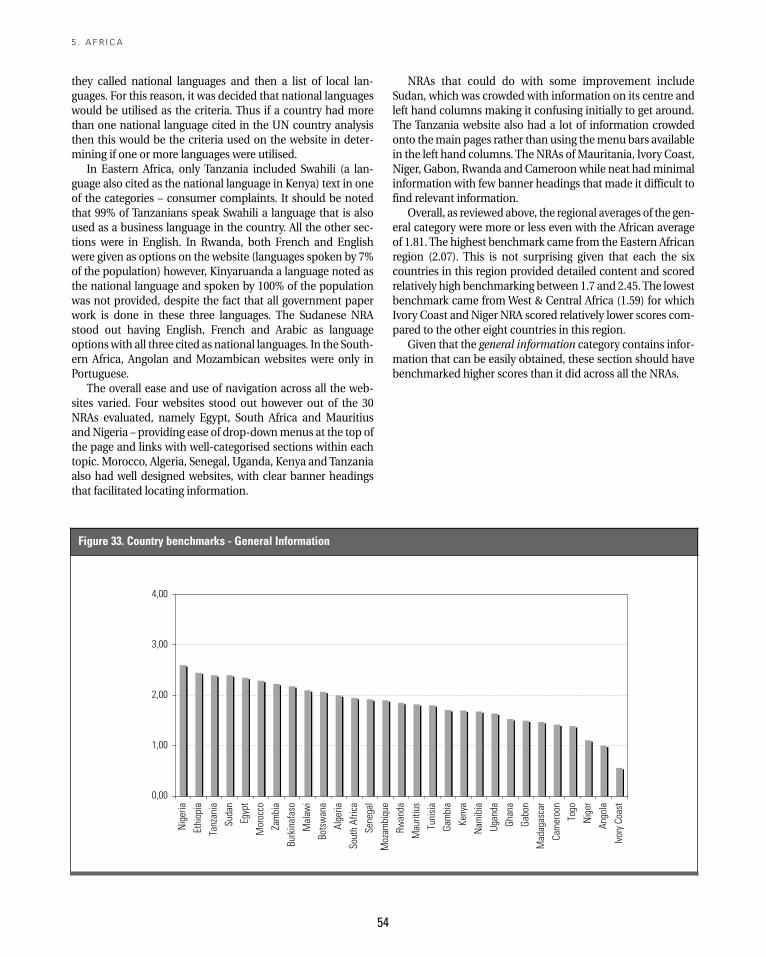
54
they called national languages and then a list of local lan-guages. For this reason, it was decided that national languageswould be utilised as the criteria. Thus if a country had morethan one national language cited in the UN country analysisthen this would be the criteria used on the website in deter-mining if one or more languages were utilised.In Eastern Africa, only Tanzania included Swahili (a lan-
guage also cited as the national language in Kenya) text in oneof the categories – consumer complaints. It should be notedthat 99% of Tanzanians speak Swahili a language that is alsoused as a business language in the country. All the other sec-tions were in English. In Rwanda, both French and Englishwere given as options on the website (languages spoken by 7%of the population) however, Kinyaruanda a language noted asthe national language and spoken by 100% of the populationwas not provided, despite the fact that all government paperwork is done in these three languages. The Sudanese NRAstood out having English, French and Arabic as languageoptionswith all three cited as national languages. In the South-ern Africa, Angolan and Mozambican websites were only inPortuguese.The overall ease and use of navigation across all the web-
sites varied. Four websites stood out however out of the 30NRAs evaluated, namely Egypt, South Africa and MauritiusandNigeria – providing ease of drop-downmenus at the top ofthe page and links with well-categorised sections within eachtopic. Morocco, Algeria, Senegal, Uganda, Kenya and Tanzaniaalso had well designed websites, with clear banner headingsthat facilitated locating information.
NRAs that could do with some improvement includeSudan, which was crowded with information on its centre andleft hand columns making it confusing initially to get around.The Tanzania website also had a lot of information crowdedonto themain pages rather than using themenu bars availablein the left hand columns. The NRAs ofMauritania, Ivory Coast,Niger, Gabon, Rwanda and Cameroon while neat hadminimalinformation with few banner headings that made it difficult tofind relevant information.Overall, as reviewed above, the regional averages of the gen-
eral category were more or less even with the African averageof 1.81. The highest benchmark came from the Eastern Africanregion (2.07). This is not surprising given that each the sixcountries in this region provided detailed content and scoredrelatively high benchmarking between 1.7 and 2.45. The lowestbenchmark came fromWest & Central Africa (1.59) for whichIvory Coast and Niger NRA scored relatively lower scores com-pared to the other eight countries in this region.Given that the general information category contains infor-
mation that can be easily obtained, these section should havebenchmarked higher scores than it did across all the NRAs.
5 . A F R I C A
Figure 33. Country benchmarks - General Information
0,00
1,00
2,00
3,00
4,00
Nig
eria
Ethi
opia
Tanz
ania
Suda
n
Egyp
t
Mor
occo
Zam
bia
Burk
inaf
aso
Mal
awi
Bots
wan
a
Alge
ria
Sout
hAf
rica
Sene
gal
Moz
ambi
que
Rwan
da
Mau
ritiu
s
Tuni
sia
Gam
bia
Keny
a
Nam
ibia
Ugan
da
Ghan
a
Gabo
n
Mad
agas
car
Cam
eroo
n
Togo
Nig
er
Ango
la
Ivor
yCo
ast
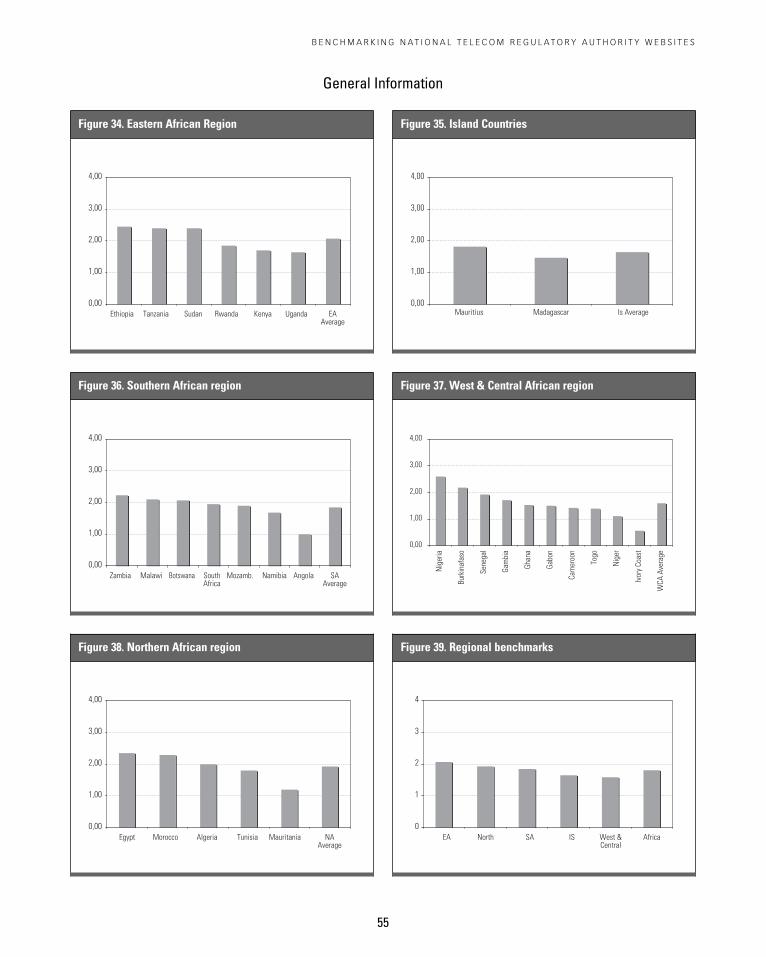
B E N C H M A R K I N G N A T I O N A L T E L E C O M R E G U L A T O R Y A U T H O R I T Y W E B S I T E S
55
Figure 34. Eastern African Region
0,00
1,00
2,00
3,00
4,00
Ethiopia Tanzania Sudan Rwanda Kenya Uganda EAAverage
Figure 38. Northern African region
0,00
1,00
2,00
3,00
4,00
Egypt Morocco Algeria Tunisia Mauritania NAAverage
Figure 36. Southern African region
0,00
1,00
2,00
3,00
4,00
Zambia Malawi Botswana SouthAfrica
Mozamb. Namibia Angola SAAverage
Figure 39. Regional benchmarks
0
1
2
3
4
EA North SA IS West &Central
Africa
Figure 35. Island Countries
0,00
1,00
2,00
3,00
4,00
Mauritius Madagascar Is Average
Figure 37. West & Central African region
0,00
1,00
2,00
3,00
4,00N
iger
ia
Burk
inaf
aso
Sene
gal
Gam
bia
Ghan
a
Gabo
n
Cam
eroo
n
Togo
Nig
er
Ivor
yCo
ast
WCA
Aver
age
General Information
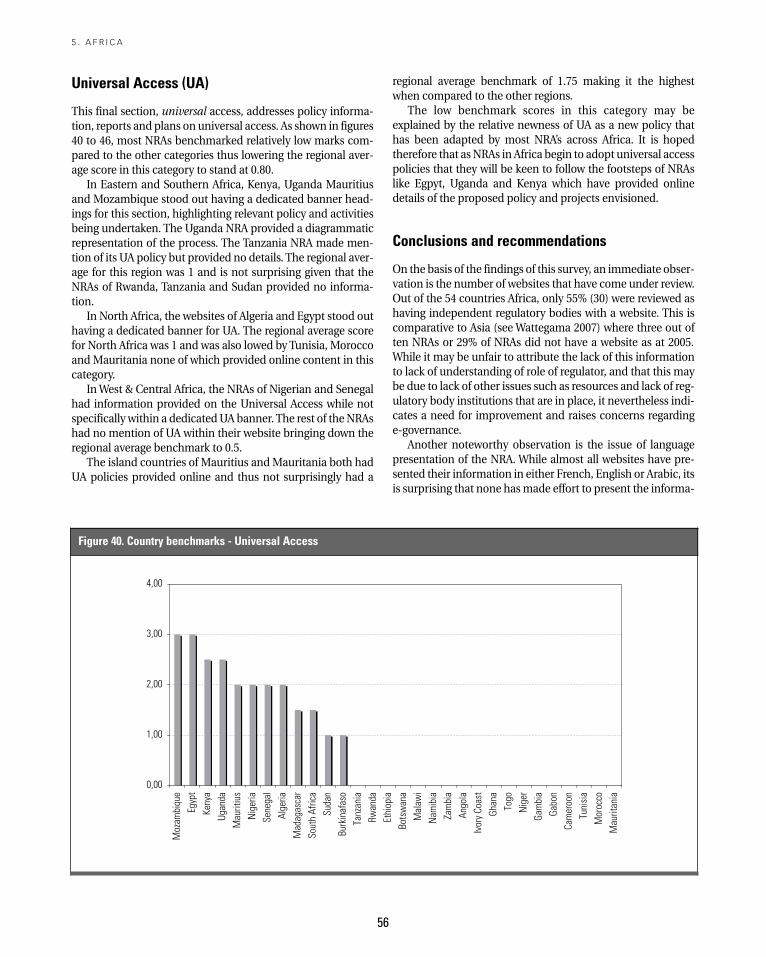
56
Universal Access (UA)
This final section, universal access, addresses policy informa-tion, reports and plans on universal access. As shown in figures40 to 46, most NRAs benchmarked relatively low marks com-pared to the other categories thus lowering the regional aver-age score in this category to stand at 0.80.In Eastern and Southern Africa, Kenya, Uganda Mauritius
and Mozambique stood out having a dedicated banner head-ings for this section, highlighting relevant policy and activitiesbeing undertaken. The Uganda NRA provided a diagrammaticrepresentation of the process. The Tanzania NRA made men-tion of its UA policy but provided no details. The regional aver-age for this region was 1 and is not surprising given that theNRAs of Rwanda, Tanzania and Sudan provided no informa-tion.In North Africa, the websites of Algeria and Egypt stood out
having a dedicated banner for UA. The regional average scorefor North Africa was 1 and was also lowed by Tunisia, MoroccoandMauritania none of which provided online content in thiscategory.InWest & Central Africa, the NRAs of Nigerian and Senegal
had information provided on the Universal Access while notspecifically within a dedicatedUAbanner. The rest of theNRAshad no mention of UA within their website bringing down theregional average benchmark to 0.5.The island countries of Mauritius andMauritania both had
UA policies provided online and thus not surprisingly had a
regional average benchmark of 1.75 making it the highestwhen compared to the other regions.The low benchmark scores in this category may be
explained by the relative newness of UA as a new policy thathas been adapted by most NRA’s across Africa. It is hopedtherefore that asNRAs in Africa begin to adopt universal accesspolicies that they will be keen to follow the footsteps of NRAslike Egpyt, Uganda and Kenya which have provided onlinedetails of the proposed policy and projects envisioned.
Conclusions and recommendations
On the basis of the findings of this survey, an immediate obser-vation is the number of websites that have come under review.Out of the 54 countries Africa, only 55% (30) were reviewed ashaving independent regulatory bodies with a website. This iscomparative to Asia (see Wattegama 2007) where three out often NRAs or 29% of NRAs did not have a website as at 2005.While it may be unfair to attribute the lack of this informationto lack of understanding of role of regulator, and that this maybe due to lack of other issues such as resources and lack of reg-ulatory body institutions that are in place, it nevertheless indi-cates a need for improvement and raises concerns regardinge-governance.Another noteworthy observation is the issue of language
presentation of the NRA. While almost all websites have pre-sented their information in either French, English or Arabic, itsis surprising that none hasmade effort to present the informa-
5 . A F R I C A
Figure 40. Country benchmarks - Universal Access
0,00
1,00
2,00
3,00
4,00
Moz
ambi
que
Egyp
t
Keny
a
Ugan
da
Mau
ritiu
s
Nig
eria
Sene
gal
Alge
ria
Mad
agas
car
Sout
hAf
rica
Suda
n
Burk
inaf
aso
Tanz
ania
Rwan
da
Ethi
opia
Bots
wan
a
Mal
awi
Nam
ibia
Zam
bia
Ango
la
Ivor
yCo
ast
Ghan
a
Togo
Nig
er
Gam
bia
Gabo
n
Cam
eroo
n
Tuni
sia
Mor
occo
Mau
ritan
ia
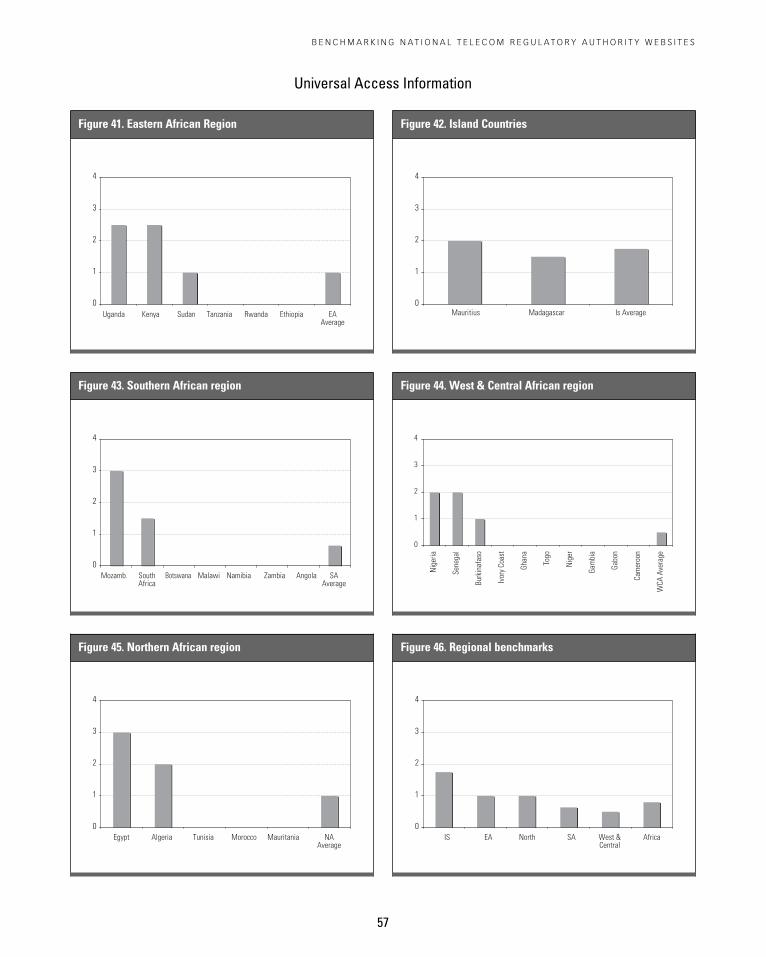
B E N C H M A R K I N G N A T I O N A L T E L E C O M R E G U L A T O R Y A U T H O R I T Y W E B S I T E S
57
Figure 42. Island Countries
0
1
2
3
4
Mauritius Madagascar Is Average
f
Figure 46. Regional benchmarks
0
1
2
3
4
IS EA North SA West &Central
Africa
Figure 44. West & Central African region
0
1
2
3
4N
iger
ia
Sene
gal
Burk
inaf
aso
Ivor
yCo
ast
Ghan
a
Togo
Nig
er
Gam
bia
Gabo
n
Cam
eroo
n
WCA
Aver
age
Figure 41. Eastern African Region
0
1
2
3
4
Uganda Kenya Sudan Tanzania Rwanda Ethiopia EAAverage
Figure 43. Southern African region
0
1
2
3
4
Mozamb. SouthAfrica
Botswana Malawi Namibia Zambia Angola SAAverage
Figure 45. Northern African region
0
1
2
3
4
Egypt Algeria Tunisia Morocco Mauritania NAAverage
Universal Access Information
58
tion in local languages given that majority of the African pop-ulace speak at least more than one local language and have acommon local language understood bymany. This is thereforean issue for reconciliation given that the issue of literacy whileclassified in the international languages has a different bearingwhen taken in the context of local languages.In addition, given the three main international languages
dominate Africa (English, French and Arabic) effort should bemade to ensure that the options for viewing the NRA websitesin other languages is available. Of exception are the NorthAfrican NRA websites who all provided options for English orFrench as an alternative to Arabic. It is recommended thatAfrican NRAs make effort to provide these two languagesoptions in their websites.The type of information provided across the African sites
also raises issues of concern. While there is a remarkableimprovement from the last review done by Mahan (2005),information still remains largely factual with very little effortmade to explain and allow the reader to digest the informationprovided. Where information was available for downloading,this was mostly for legal and policy documentation. Nonethe-less even this was explained separately. Disappointing acrossall the sites was a lack of effort made to analyse the statisticalinformation that was laid out on the websites. Most of theinformation was laid out without any effort for comparativeanalysis across all the years. This type of information would bevery informative to many stakeholders and in addition pro-vides information for researchers and journalists internation-ally on the development growth of a country.In addition, except for information regarding licensing pro-
cedures, many websites lacked the information usually soughtby businesses and investors. For example, none of thewebsiteshad a list of equipment that was prohibited in the country nordid they have an analysis of the telecom environment in theirrespective countries.Presenting information that was useful to consumers is
another category that was also neglected by themajority of theAfrican NRA’s. For example information about consumer com-plaints was scantily available with a few lines rather than anexplanation of what one needs to do in different scenarios.The Kenyan NRA website offers a section on consumer com-plaints procedures and information on current and ongoingcomplaints. Most of the NRA’s therefore neglected informationon the type of complaints a consumer can make, whom tocontact in the different scenarios and toll-free numbers formaking complaints (not one NRA had a free toll number avail-able). Given the prevalence of mobile phones now in Africa, itwould be expected that the regulators in conjunction with theoperators provide a toll-free number for handling complaintsprocedures.In addition, content on quality of service (QoS) parameters
and health and environment issues were covered by fewer thanthree of the 30NRAs reviewed. Given thatwebsites aremeant tobe a window into what is happening both within the internalregulatory environment and external environment, these two
aspects are strongly encouraged as content that should be read-ily available for consumers to make well-informed decisions.Revealing and in need of improvement was the level of the
NRA to participate as a vehicle for participating in regulatoryprocesses. Nearly all the websites could be overall ranked asbetween the emerging and enhanced levels – i.e. as havinglargely static information that is updated regularly but notexplained and digested.Where informationwas downloadablethis wasmostly limited to policy and legal documents. None ofthe African NRA websites could overall be considered as at theinteractive and transactional levels – i.e. with information hav-ing further value-added such as being hyperlinked to relevantlegislation, facilitating real-time online submission of formsand emails, and so forth.NRAs should be aware that a valuable amount of traffic will
be from researchers, journalists and international investorswho further broker information to the general public. Thus anewsroom feature or consumer information banner that hasfurther links to information within the website is very impor-tant for facilitating information dissemination via these users.As noted in the introductory section of this chapter, the
most important message this survey could communicatewould be that all African NRA sites could be improved with lit-tle effort.While in the past blame has been placed on the lackof human and financial resources this argument is no longerwarranted. Given that the websites already exist, specificimprovements needed relate mainly to the uploading of rele-vant information and as well making it more functional.Nonetheless, a number of assumptions need to be
addressed by regulators in order to fulfil basic conditions forweb presence success – that is, a websites’ ability to be interac-tive and dynamic. This includes but is not limited to:
• common understanding of the role and opportunities toapply ICT in general and web presence in particular incommunicating to the various stakeholders in the sector;
• existence of human resources within the agency to supportcontent development and technical know-how to ensurethat the website is accessible, user-friendly, up-to-date andmost importantly that the relevant content is continuouslyprovided;
• basic conditions of ICT access and usage within the coun-try in particular to connectivity to the Internet. Content rel-evancy and actual effectiveness of the website will not beachieved readily without this factor being addressed.
Perhaps, the most important lesson that African NRAs canlearn is that there is no need to reinvent the wheel. Other NRAwebsites exist that are open to the public for any NRA to copyand learn from in improving the effectiveness of their ownwebsites. We hope that this study has contributed to thisprocess by pointing to some of the best practices in the region.
5 . A F R I C A
Future studies
This study sought to focus on the available informationuploaded as content in NRAwebsites. It sought to focus on therelevance of the information in providing informed decisionmaking for the would-be user. However, this study did notdelve into the actual process of choice of content and whetherin actual fact these websites are frequently visited and for whattype of information. Such a study, in the form of a qualitativeand quantitative questionnaire to NRAs, would enhance thisstudy by providing useful feedback on what users expect NRAsto provide.In the same vein, it would be useful to initiate a study that
focused on the de facto interactivity of the websites. What isthe response time for queries made online? What type ofonline queries can one make? An email sent to a number ofNRAs during this study to clarify location of informationreceived no feedback revealing a need to ensure that featuresmade available via the NRA websites are in use.In conclusion, websites are increasingly a key element in
evaluations of NRA performance. For the future, website con-tent and interactivitywill be a progressively important factor inassessing regulatory effectiveness. NRAs therefore need toensure that websites are up-to-date and relevant. One way todo this is to keep seeking feedback from their clients (journal-ists, researchers, businessmen, government and non-govern-ment institutions) and as well share their experiences withother NRAs both in the region and internationally.
Notes1 Most lending institutions such as theWorld Bank and InternationalMonetary Fund (IMF) now use e-governance as a measure in determiningfinancing and development improvement within a country.
2 http://www.sadc.int/
3 http://www.comesa.int/
4 http://www.eac.int/
5 http://www.ecowas.int
6 See Chapter 2 for a full description of the NRA benchmarkingmethodology.
7 However, this presumes that only individuals are obtaining and usingsuch information. In reality, NGOs, the media and other community inter-mediaries may use the NRA website to obtain information to be morewidely diffused.
References
Hargittai, E. (2000). Open Portals or Closed Gates? Channeling Content ontheWorldWideWeb, Poetics.27(4):233-254.http://www.eszter.com/research/pubs/hargittai-portals.pdf
International Telecommunication Union (ITU) (2007). Online statisticalindicators. http://www.itu.int/ITU-D/ict/index.html
Mahan A.K. (2005). Benchmarking African NRAWebsites, in Mahan, A.K.andMelodyW.H. Stimulating Investment in Network Development:Roles for Regulators.World Dialogue on Regulation (WDR) andinfoDev.
Melody,W.H Schneider, M. and A. Mahan (2003). “Benchmark indicatorsfor Regulator NRA’s: Results of a preliminary Survey of NRA websites.Telecom Reform in Latin America: Regulatory Issues and Implica-tions”, La Antigua, Guatemala, September.
Wattegama, C. (2007). Benchmarking National Telecom RegulatoryAuthorityWebsites of the Asia-Pacific Region, in Mahan, A.K. andMelody,W.H.,Diversifying Participation in Network Development.infoDev and Comunica. http://www.regulateonline.org/diversify-ing/Diversifying-133-150-Chapter-10.pdf
B E N C H M A R K I N G N A T I O N A L T E L E C O M R E G U L A T O R Y A U T H O R I T Y W E B S I T E S
59

61
Introduction
A national telecommunication regulatory authority, like anyother government organisation, uses its website not only todeliver citizen services but also to improve transparency andeffectiveness in its regulatory functions. This study bench-marks the way in which national regulatory authorities (NRAs)use their websites to improve their overarching objectives per-taining to regulatory affairs. The survey intends to evaluatehowwell Asian NRAs achieve this objective with regard to tele-comoperators, investors, consumers, researchers and the gen-eral public. The results of the survey provide a useful tool forregulators to improve their websites.
Previous initiatives similar to this studyThe methodology and structure for this website survey havebeen largely guided by previous studies, the key of which aresummarised below:
• A study jointly undertaken by the United Nations (UN) andthe American Society for Public Administration (Ronaghan2001), inwhich the goal of the studywas to objectively pres-ent facts and conclusions defining a country’s e-govern-ment environment and demonstrate its capacity to sustainonline development. This was accomplished by a compar-ative analysis of fundamental ICT indicators and criticalhuman capital measures for each UN Member State. Animportant outcome of this study was a final measure, theE-Government Index, a useful tool for policy-planners.
• LIRNE.NET (Mahan 2005) conducted a study focussing onthe African region. This survey which is more relevant tothis website survey, benchmarks the websites of independ-ent NRAs of 22 African states. This study has grown out of a
collection of preliminary regional surveys examining theextent to which NRAs were using websites to inform andcommunicate with stakeholders – including citizens, busi-nesses and other governmental and non-governmentalorganizations.
• A study by LIRNEasia (Wattegama 2007) created amethod-ology to benchmark the NRA websites in the Asia-Pacificregion, evaluating their usefulness in providing e-govern-ment services to telecom operators, investors, consumers,researchers and even the general public. Each website isawarded marks for quality of the e-government portal thatit provides to its stakeholders. The study evaluated 27 NRAwebsites of out a total of 62 economies.
As an improvement to the LIRNEasia methodology, thisstudy focused more on the regulatory functions of an NRAwithout focussing on the e-government angle. NRAs need toplace greater importance on their regulatory functions. There-fore, the study took a more regulatory focus with an emphasison transparency and accountability while also assessing andranking the provision of relevant information to stakeholders,including consumers.
Selection of economies and websitesThe selection of economies to include in the survey was basedon aminimal criterion to ensure themaximumnumber ofNRAwebsites within the Asia-Pacific region could be included. Itdoes not discriminate based on geographywithin the region, oron levels of economic or human development achievements.The criteria are as follows:
C H A P T E R 6
Benchmarking Asia PacificNational Telecom Regulatory
Authority WebsitesLara Alawattegama and Chanuka Wattegama
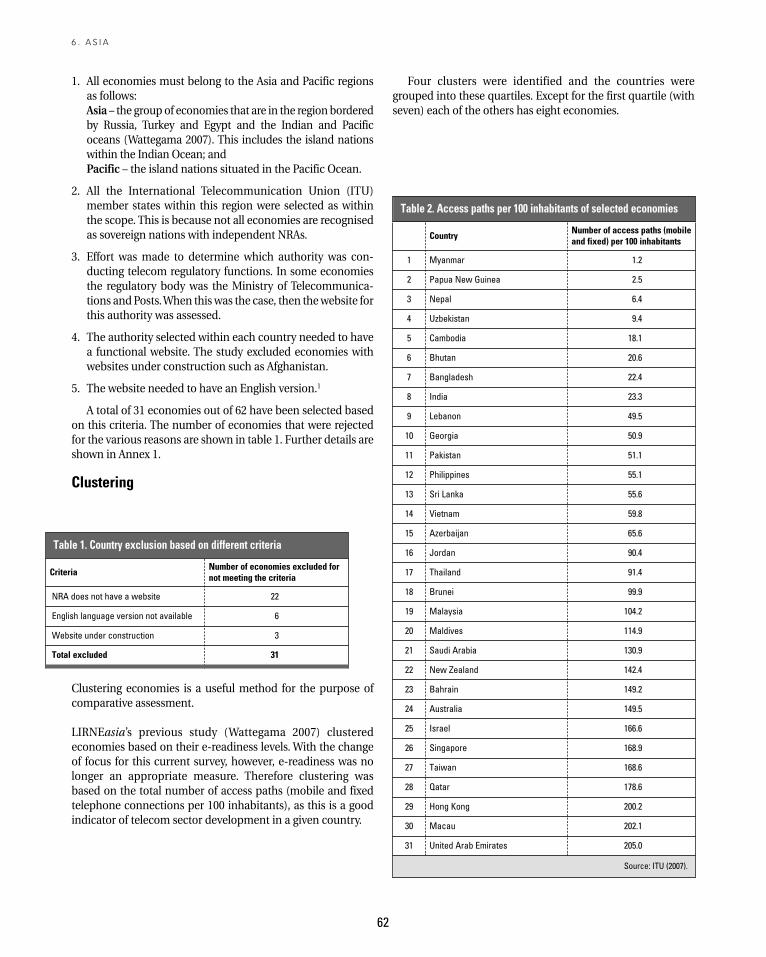
6 . A S I A
1. All economies must belong to the Asia and Pacific regionsas follows:Asia – the groupof economies that are in the region borderedby Russia, Turkey and Egypt and the Indian and Pacificoceans (Wattegama 2007). This includes the island nationswithin the Indian Ocean; andPacific – the island nations situated in the Pacific Ocean.
2. All the International Telecommunication Union (ITU)member states within this region were selected as withinthe scope. This is because not all economies are recognisedas sovereign nations with independent NRAs.
3. Effort was made to determine which authority was con-ducting telecom regulatory functions. In some economiesthe regulatory body was the Ministry of Telecommunica-tions andPosts.When thiswas the case, then thewebsite forthis authority was assessed.
4. The authority selected within each country needed to havea functional website. The study excluded economies withwebsites under construction such as Afghanistan.
5. The website needed to have an English version.1
A total of 31 economies out of 62 have been selected basedon this criteria. The number of economies that were rejectedfor the various reasons are shown in table 1. Further details areshown in Annex 1.
Clustering
Clustering economies is a useful method for the purpose ofcomparative assessment.
LIRNEasia’s previous study (Wattegama 2007) clusteredeconomies based on their e-readiness levels. With the changeof focus for this current survey, however, e-readiness was nolonger an appropriate measure. Therefore clustering wasbased on the total number of access paths (mobile and fixedtelephone connections per 100 inhabitants), as this is a goodindicator of telecom sector development in a given country.
Four clusters were identified and the countries weregrouped into these quartiles. Except for the first quartile (withseven) each of the others has eight economies.
62
CountryNumber of access paths (mobileand fixed) per 100 inhabitants
1 Myanmar 1.2
2 Papua New Guinea 2.5
3 Nepal 6.4
4 Uzbekistan 9.4
5 Cambodia 18.1
6 Bhutan 20.6
7 Bangladesh 22.4
8 India 23.3
9 Lebanon 49.5
10 Georgia 50.9
11 Pakistan 51.1
12 Philippines 55.1
13 Sri Lanka 55.6
14 Vietnam 59.8
15 Azerbaijan 65.6
16 Jordan 90.4
17 Thailand 91.4
18 Brunei 99.9
19 Malaysia 104.2
20 Maldives 114.9
21 Saudi Arabia 130.9
22 New Zealand 142.4
23 Bahrain 149.2
24 Australia 149.5
25 Israel 166.6
26 Singapore 168.9
27 Taiwan 168.6
28 Qatar 178.6
29 Hong Kong 200.2
30 Macau 202.1
31 United Arab Emirates 205.0
Table 2. Access paths per 100 inhabitants of selected economies
Source: ITU (2007).
CriteriaNumber of economies excluded fornot meeting the criteria
NRA does not have a website 22
English language version not available 6
Website under construction 3
Total excluded 31
Table 1. Country exclusion based on different criteria
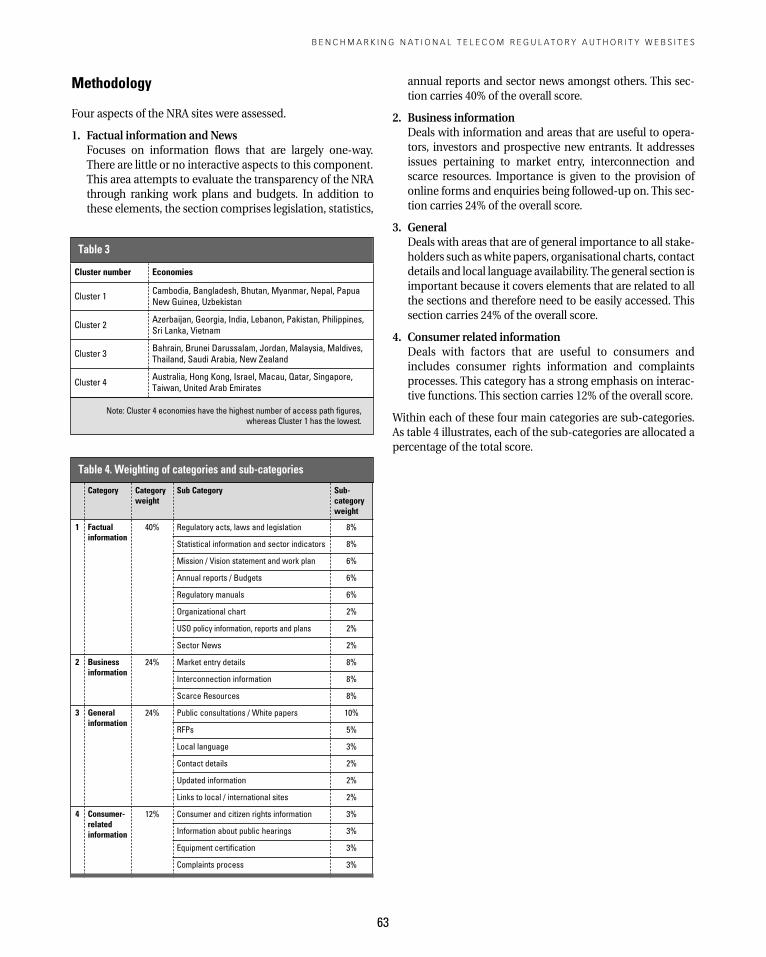
Methodology
Four aspects of the NRA sites were assessed.
1. Factual information and NewsFocuses on information flows that are largely one-way.There are little or no interactive aspects to this component.This area attempts to evaluate the transparency of the NRAthrough ranking work plans and budgets. In addition tothese elements, the section comprises legislation, statistics,
annual reports and sector news amongst others. This sec-tion carries 40% of the overall score.
2. Business informationDeals with information and areas that are useful to opera-tors, investors and prospective new entrants. It addressesissues pertaining to market entry, interconnection andscarce resources. Importance is given to the provision ofonline forms and enquiries being followed-up on. This sec-tion carries 24% of the overall score.
3. GeneralDeals with areas that are of general importance to all stake-holders such aswhite papers, organisational charts, contactdetails and local language availability.The general section isimportant because it covers elements that are related to allthe sections and therefore need to be easily accessed. Thissection carries 24% of the overall score.
4. Consumer related informationDeals with factors that are useful to consumers andincludes consumer rights information and complaintsprocesses. This category has a strong emphasis on interac-tive functions. This section carries 12% of the overall score.
Within each of these four main categories are sub-categories.As table 4 illustrates, each of the sub-categories are allocated apercentage of the total score.
B E N C H M A R K I N G N A T I O N A L T E L E C O M R E G U L A T O R Y A U T H O R I T Y W E B S I T E S
63
Cluster number Economies
Cluster 1 Cambodia, Bangladesh, Bhutan, Myanmar, Nepal, PapuaNew Guinea, Uzbekistan
Cluster 2 Azerbaijan, Georgia, India, Lebanon, Pakistan, Philippines,Sri Lanka, Vietnam
Cluster 3 Bahrain, Brunei Darussalam, Jordan, Malaysia, Maldives,Thailand, Saudi Arabia, New Zealand
Cluster 4 Australia, Hong Kong, Israel, Macau, Qatar, Singapore,Taiwan, United Arab Emirates
Table 3
Note: Cluster 4 economies have the highest number of access path figures,whereas Cluster 1 has the lowest.
Category Categoryweight
Sub Category Sub-categoryweight
1 Factualinformation
40% Regulatory acts, laws and legislation 8%
Statistical information and sector indicators 8%
Mission / Vision statement and work plan 6%
Annual reports / Budgets 6%
Regulatory manuals 6%
Organizational chart 2%
USO policy information, reports and plans 2%
Sector News 2%
2 Businessinformation
24% Market entry details 8%
Interconnection information 8%
Scarce Resources 8%
3 Generalinformation
24% Public consultations / White papers 10%
RFPs 5%
Local language 3%
Contact details 2%
Updated information 2%
Links to local / international sites 2%
4 Consumer-relatedinformation
12% Consumer and citizen rights information 3%
Information about public hearings 3%
Equipment certification 3%
Complaints process 3%
Table 4. Weighting of categories and sub-categories
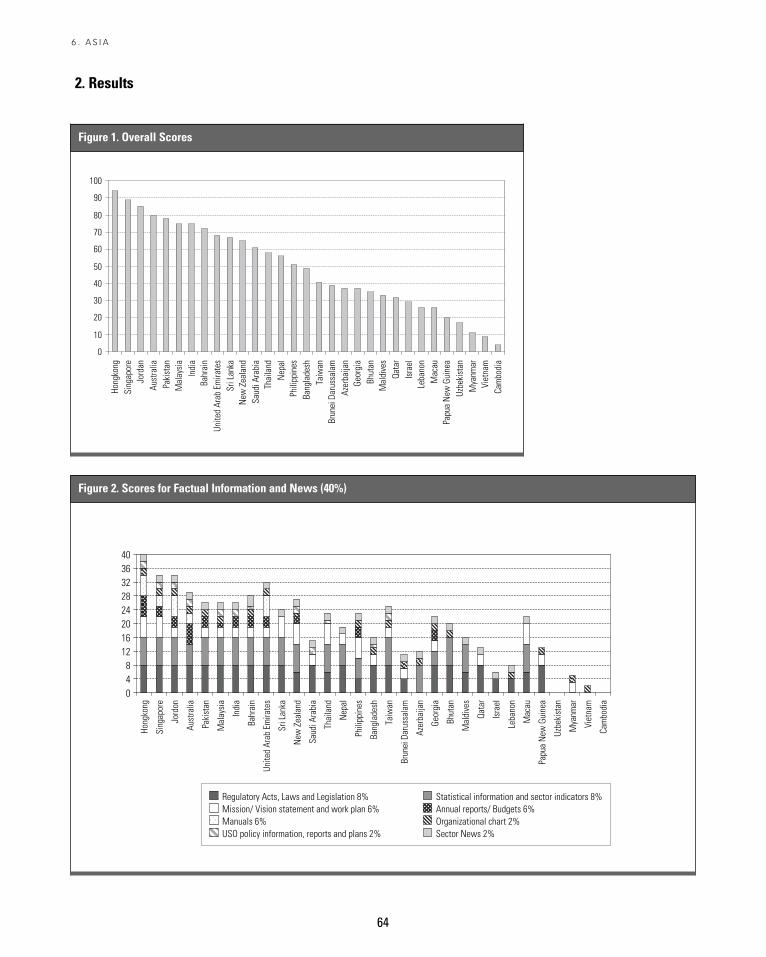
64
2. Results
6 . A S I A
Figure 1. Overall Scores
0
10
20
30
40
50
60
70
80
90
100
Hong
kong
Sing
apor
eJo
rdan
Aust
ralia
Paki
stan
Mal
aysi
aIn
dia
Bahr
ain
Unite
dAr
abEm
irate
sSr
iLan
kaN
ewZe
alan
dSa
udiA
rabi
aTh
aila
ndN
epal
Phili
ppin
esBa
ngla
desh
Taiw
anBr
unei
Daru
ssal
amAz
erba
ijan
Geor
gia
Bhut
anM
aldi
ves
Qata
rIs
rael
Leba
non
Mac
auPa
pua
New
Guin
eaUz
beki
stan
Mya
nmar
Viet
nam
Cam
bodi
aFigure 2. Scores for Factual Information and News (40%)
048
1216202428323640
Hong
kong
Sing
apor
e
Jord
on
Aust
ralia
Paki
stan
Mal
aysi
a
Indi
a
Bahr
ain
Unite
dAr
abEm
irate
s
SriL
anka
New
Zeal
and
Saud
iAra
bia
Thai
land
Nep
al
Phili
ppin
es
Bang
lade
sh
Taiw
an
Brun
eiDa
russ
alam
Azer
baija
n
Geor
gia
Bhut
an
Mal
dive
s
Qata
r
Isra
el
Leba
non
Mac
au
Papu
aN
ewGu
inea
Uzbe
kist
an
Mya
nmar
Viet
nam
Cam
bodi
a
Regulatory Acts, Laws and Legislation 8% Statistical information and sector indicators 8%Mission/ Vision statement and work plan 6% Annual reports/ Budgets 6%Manuals 6% Organizational chart 2%USO policy information, reports and plans 2% Sector News 2%
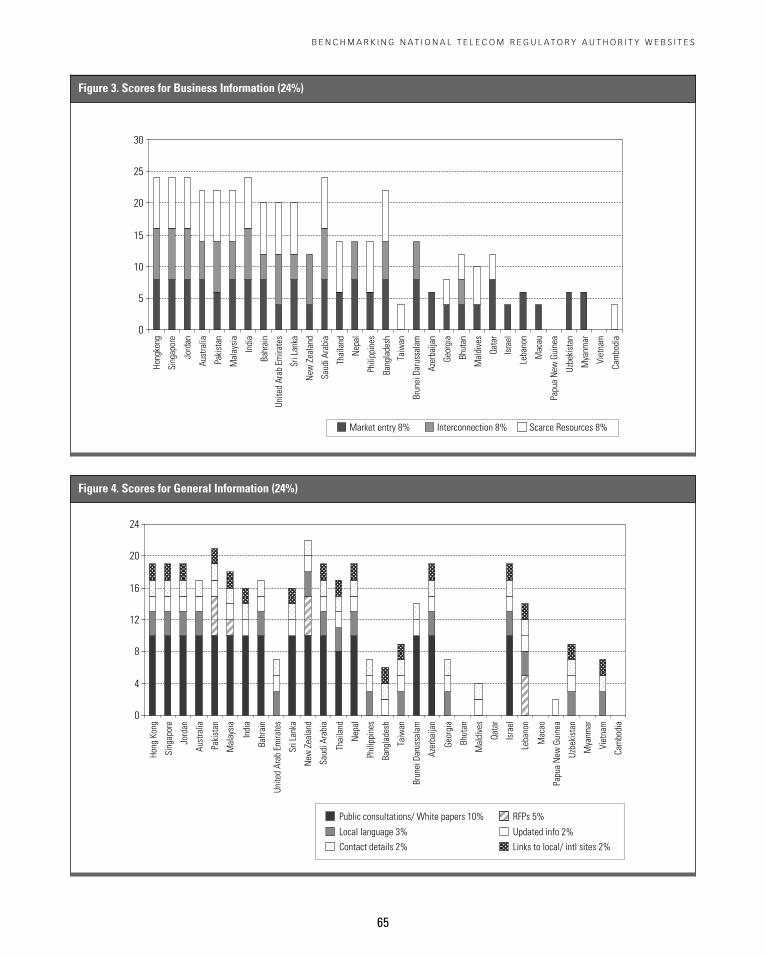
B E N C H M A R K I N G N A T I O N A L T E L E C O M R E G U L A T O R Y A U T H O R I T Y W E B S I T E S
65
Figure 3. Scores for Business Information (24%)
0
5
10
15
20
25
30Ho
ngko
ng
Sing
apor
e
Jord
an
Aust
ralia
Paki
stan
Mal
aysi
a
Indi
a
Bahr
ain
Unite
dAr
abEm
irate
s
SriL
anka
New
Zeal
and
Saud
iAra
bia
Thai
land
Nep
al
Phili
ppin
es
Bang
lade
sh
Taiw
an
Brun
eiDa
russ
alam
Azer
baija
n
Geor
gia
Bhut
an
Mal
dive
s
Qata
r
Isra
el
Leba
non
Mac
au
Papu
aN
ewGu
inea
Uzbe
kist
an
Mya
nmar
Viet
nam
Cam
bodi
a
Market entry 8% Interconnection 8% Scarce Resources 8%
Figure 4. Scores for General Information (24%)
0
4
8
12
16
20
24
Hong
Kong
Sing
apor
e
Jord
an
Aust
ralia
Paki
stan
Mal
aysi
a
Indi
a
Bahr
ain
Unite
dAr
abEm
irate
s
SriL
anka
New
Zeal
and
Saud
iAra
bia
Thai
land
Nep
al
Phili
ppin
es
Bang
lade
sh
Taiw
an
Brun
eiDa
russ
alam
Azer
baija
n
Geor
gia
Bhut
an
Mal
dive
s
Qata
r
Isra
el
Leba
non
Mac
ao
Papu
aN
ewGu
inea
Uzbe
kist
an
Mya
nmar
Viet
nam
Cam
bodi
a
Public consultations/ White papers 10% RFPs 5%
Local language 3% Updated info 2%
Contact details 2% Links to local/ intl sites 2%
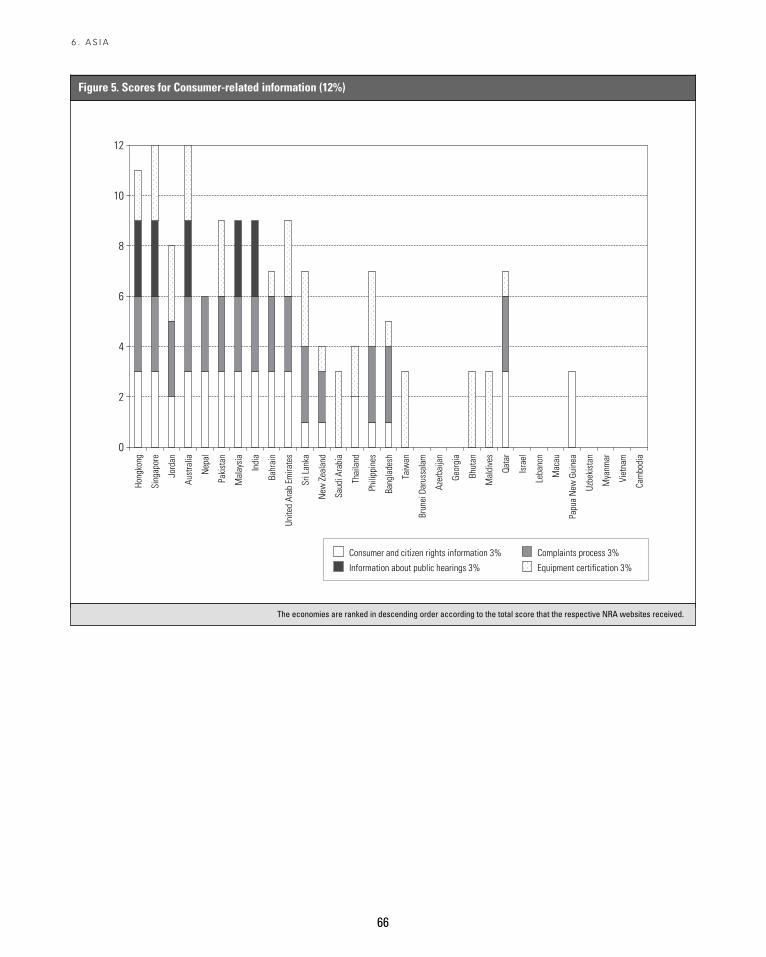
66
6 . A S I A
Figure 5. Scores for Consumer-related information (12%)
0
2
4
6
8
10
12
Consumer and citizen rights information 3% Complaints process 3%
Information about public hearings 3% Equipment certification 3%
Hong
kong
Sing
apor
e
Jord
an
Aust
ralia
Nep
al
Paki
stan
Mal
aysi
a
Indi
a
Bahr
ain
Unite
dAr
abEm
irate
s
SriL
anka
New
Zeal
and
Saud
iAra
bia
Thai
land
Phili
ppin
es
Bang
lade
sh
Taiw
an
Brun
eiDa
russ
alam
Azer
baija
n
Geor
gia
Bhut
an
Mal
dive
s
Qata
r
Isra
el
Leba
non
Mac
au
Papu
aN
ewGu
inea
Uzbe
kist
an
Mya
nmar
Viet
nam
Cam
bodi
a
The economies are ranked in descending order according to the total score that the respective NRA websites received.
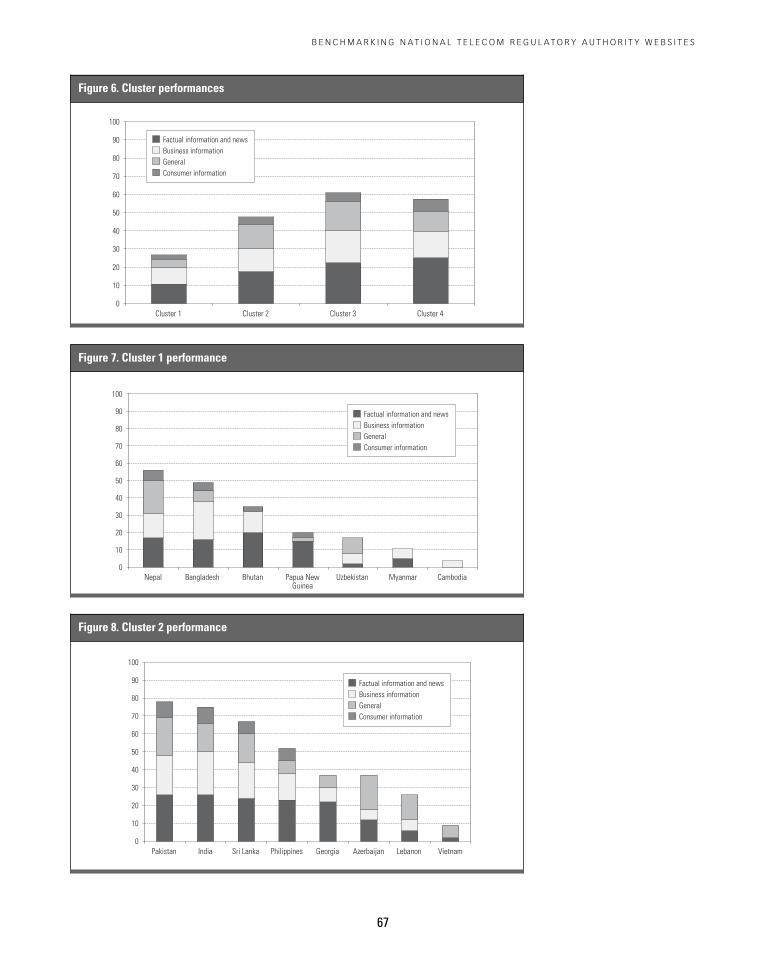
B E N C H M A R K I N G N A T I O N A L T E L E C O M R E G U L A T O R Y A U T H O R I T Y W E B S I T E S
67
Figure 6. Cluster performances
0
10
20
30
40
50
60
70
80
90
100
Cluster 1 Cluster 2 Cluster 3 Cluster 4
Factual information and newsBusiness informationGeneralConsumer information
Figure 7. Cluster 1 performance
0
10
20
30
40
50
60
70
80
90
100
Nepal Bangladesh Bhutan Papua NewGuinea
Uzbekistan Myanmar Cambodia
Factual information and newsBusiness informationGeneralConsumer information
Figure 8. Cluster 2 performance
0
10
20
30
40
50
60
70
80
90
100
Pakistan India Sri Lanka Philippines Georgia Azerbaijan Lebanon Vietnam
Factual information and newsBusiness informationGeneralConsumer information
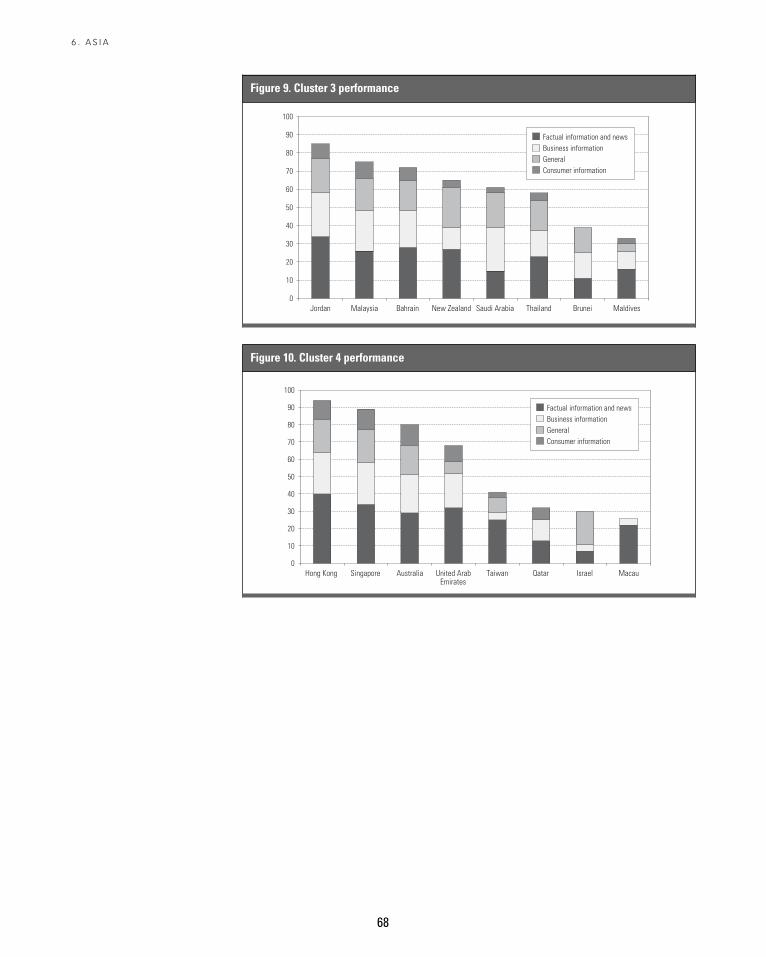
68
6 . A S I A
Figure 9. Cluster 3 performance
0
10
20
30
40
50
60
70
80
90
100
Jordan Malaysia Bahrain New Zealand Saudi Arabia Thailand Brunei Maldives
Factual information and newsBusiness informationGeneralConsumer information
Figure 10. Cluster 4 performance
0
10
20
30
40
50
60
70
80
90
100
Hong Kong Singapore Australia United ArabEmirates
Taiwan Qatar Israel Macau
Factual information and newsBusiness informationGeneralConsumer information
3. Limitations
This website survey attempts to capture asmany aspects of theNRA websites as possible, however, there are still some limita-tions to themethodology. The following briefly describes theselimitations and also explains how they were addressed.
The weighting of the sub-categories has been point of acommon criticism. Given that there are no concrete rules gov-erning howweights should be applied to the different features,there is a degree of ambiguity about theway they are allocated.
Another difficulty concerns the differences in the rolesplayed by the NRAs. They do not all perform exactly the samefunctions. For example, a challenge faced by the researcherswas to assess areaswhichwere perhaps notwithin the purviewof a particular NRA. Thus, it was decided to verify whether theNRAwebsite presented a link to the agency responsible for thatspecific function and award full marks if so. Therefore someNRA sites could score goodmarks even if the regulator did notperform certain key functions.
The inability to review non-English websites was anotherlimitation of this study. Many economies in Asia Pacific do notuse English for their day-to-day activities. Depending on theneeds, a regulator may choose not to have an English versionof the website. Six economies namely Yemen, South Korea,Mongolia, Indonesia, Kuwait and China were eliminated fromthe study for this reason. This study assessed only 31 (50%) ofa total of 62 economies. For this reason it can be argued it is notrepresentative of the region. However one-third of theeconomies in the region do not have NRA sites (some of theseare micro states) so the exclusion due to language is not aslarge as it may seem.
4. Conclusion
Overall the websites performed relatively well in the factualinformation and news section with some exceptions. Of the 31sites that were reviewed 58% obtained total marks and 93%scored at least half the marks allocated for the section regula-tory acts, laws and legislature. In the statistical informationand sector indicators section, 55% scored total marks whilst68% obtained at least half of the possible maximum score.Overall, 55% of the economies obtained at least half of themarks allocated for that category. Of the total 31 economiesincluded in the study, 80% had sector news made available viatheir websites. With regard to the clusters, the four clustersobtained the following average scores of 10.7, 17.6, 22.5 and 25respectively out of a total of 40.
The section that focused on present and future operatorsand investors was called business information and carried 24% of the total score. Most of the websites appear to have a sat-isfactory amount of data onmarket entry, interconnection andscarce resources. 42% obtained full scores for market entryinformation with 74% obtaining at least half the score. 26% of
the economies received full scores for the interconnection sec-tion with 52% obtaining at least half the score. 45% of theeconomies reviewed obtained full marks for scarce resourceswhilst 65% obtained at least half of the marks allocated for thesection. An admirable fact is that 80% of the economies pro-vided contact information and the same number providedupdated information on the website. It can be agued thatupdated information should be given importancewithin everysection but this would make allocating scores a more tedioustask. The clusters obtained 9, 12.5, 17.5 and 14 respectively. It isuseful to note that cluster 3 has obtained a higher score thancluster 4, which is against the expected pattern. This could bedue to the fact the economies in cluster 3 have economies thatare growing and hence placemore importance on informationprovision to these stakeholders.
The general category is important as it includes sectionsthat are of general significance across all activities of the NRA.Within this category, 49% of the economies scored full marksfor the provision of public consultation and white papers. 55%of the economies reviewed obtained at least half of the totalmarks allocated for the section. The clusters obtained the fol-lowing scores: 4.5, 13.4, 16 and 11 out of a total of 24%. It isinteresting to note that 58% of the economies had a local lan-guage version of their site as well. This adds value to the argu-ment for local languages. Cluster 3 has obtained the highestscore for this category. It is unusual for cluster 4 to obtain thesecond lowest score for this category but this is perhaps causedby the emphasis that the websites place on consumer affairs.
Consumer-related information carries a total of 12%. Thiscategory comprises four sections that were allocated 3% each.Under consumer and citizen rights information 39% of theeconomies obtained full scores. 41% of the economies havecomprehensive information on the complaint process. How-ever, countries scored low marks on the sections for equip-ment certification and information on public hearings, withonly 35% and 16% obtaining full marks for the sections respec-tively. Most of the websites did not have any information forthese two sections. However, it must be noted that equipmentcertification may not be in the domain of all NRAs such asIndia. As noted above, in the rare instances that this situationarose, if thewebsite provided a link to the relevant authority forthis function, full marks were accorded. The clusters obtainedthe following marks: 2.4, 4, 4.8 and 6.8. Here it can be notedthat the margin between clusters 3 and 4 are greater than forthe others. This is because the economies that belong to thiscluster all have mature markets that place more emphasis onconsumer affairs.
As figure 6 shows cluster 3 obtained an overall score higherthan that of cluster 4. Cluster 3 scored the highest score underbusiness information and general.
Within each cluster, economies performeddifferently in thefour categories, with some scoring more points for one andless for another. In cluster 1, Nepal proves to be the best per-former with an overall score of 56/100. However, all six other
B E N C H M A R K I N G N A T I O N A L T E L E C O M R E G U L A T O R Y A U T H O R I T Y W E B S I T E S
69
70
economies within this cluster score less than 50% this reducesthe overall cluster average to 26.8 percent. Overall, the clusterseems to score the least for the consumer-related informationcategory and perform best in the business information sec-tion. This could be explained by the relative early stage ofdevelopment the sectors in these economies are in. The NRAwill place more focus on factors such as licensing, frequencyallocation and interconnection details, whilst the NRA’s withmore mature sectors place greater focus on consumer affairsas the other areas have already been developed.
Cluster 2 performs overall better than cluster 1 which doesnot prove to be surprising. The economies in cluster 2 havemore sophisticated regulation regimes than cluster 1 andhence will perform better in the survey. The cluster averagewas 47.6.The top three performerswere Pakistan, India and SriLanka scoring 78, 75 and 67 respectively. Cluster 2 scores thelowest for the consumer related information category like incluster 1. However, it scores the highest marks in the generalcategory.
The average score for cluster 3 which is 61/100 is the high-est of all four clusters. This is unusual as one would assumecluster 4 to have the best results. It could be argued that clus-ter 3 economies are those that have the highest growth ratesand this is shown through the survey results.The top three per-formers are Jordan, Malaysia and Bahrain which scores of 85,75 and 72 respectively. The cluster scores the lowest points forconsumer related information and highest points for the busi-ness information category.
The fourth cluster consists of the economies with the high-est number of access lines per 100 inhabitants. The clusteraverage was 57.5 percent. The top three performers were HongKong, Singapore and Australia with scores of 94, 89 and 80.Cluster 4 performed best in the factual information and newscategory and scored the lowest in the general category.
To reduce the subjective element, this study did not placeany importance on the usability and aesthetics of thewebsites.But it needs to be noted that websites such as those belongingto regulatory agencies of Singapore, Hong Kong, Pakistan andAustralia were user-friendly. The sections were clearly labelledand did not require much searching to obtain the requiredinformation whilst other sites required the constant use of thesearch function (where available) to obtain information.
The researchers notedmany of the websites havemade sig-nificant progress since the last survey that was carried out in2005, although a more substantive comparison is not possibledue to the changes in the methodology. The number of NRAshaving a website also has increased. It has been noted thatmany sites obtained low scores for not having basic informa-tion, they can provide with least effort. The top few websitescan be recommended as benchmarks, and should be used asguides for others who are looking to improve their websites.
Notes
1 This research does not suggest that every NRA should have a website inEnglish. If not for the practical difficulty we faced to evaluate sites withnon-English versions, the number of websites surveyed would have beenhigher. In the future we will attempt also to evaluate the non-English siteswith the assistance of local research partners.
References
International Telecommunication Union (ITU) (2007). Online statisticalindicators. http://www.itu.int/ITU-D/ict/index.html
Mahan A.K. (2005). Benchmarking African NRAWebsites, in Mahan, A.K.andMelodyW.H. Stimulating Investment in Network Development:Roles for Regulators.World Dialogue on Regulation (WDR) andinfoDev.
Ronaghan. S.A, (2001), Benchmarking E-government: A Global Perspective:Assessing the Progress of the UN Member States. United Nations Divi-sion for Public Economics and Public Administration (UN-DPEPA)and American Society for Public Administration (ASPA).
Wattegama, C. (2007). Benchmarking National Telecom RegulatoryAuthorityWebsites of the Asia-Pacific Region, in Mahan, A.K. andMelody,W.H.,Diversifying Participation in Network Development.infoDev and Comunica. http://www.regulateonline.org/diversify-ing/Diversifying-133-150-Chapter-10.pdf
6 . A S I A
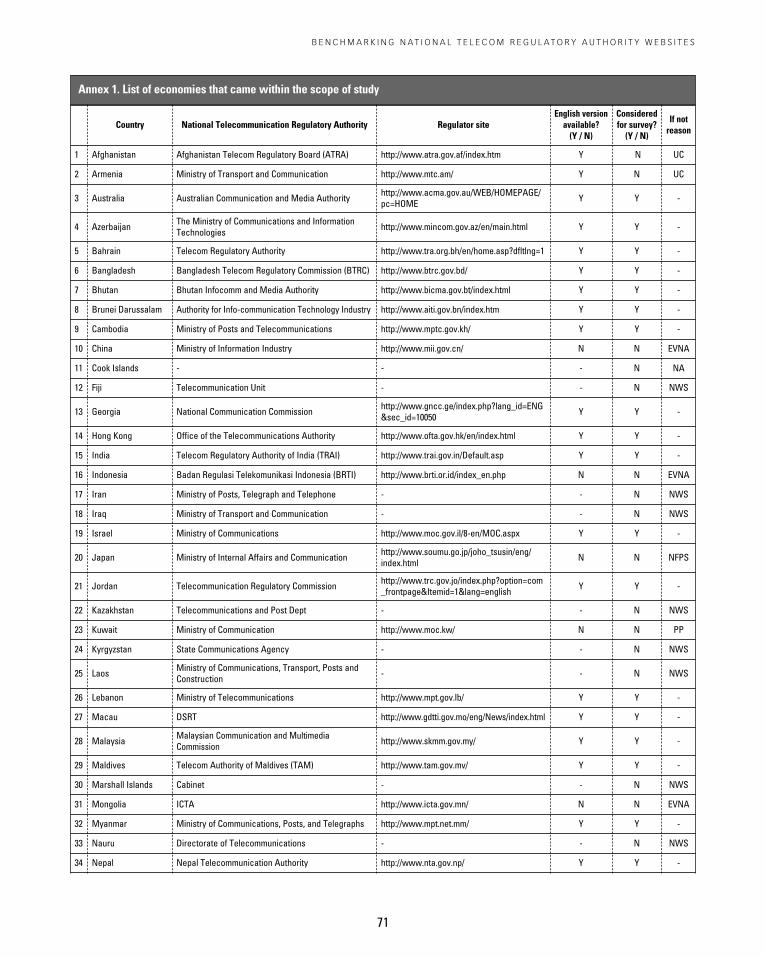
B E N C H M A R K I N G N A T I O N A L T E L E C O M R E G U L A T O R Y A U T H O R I T Y W E B S I T E S
71
Country National Telecommunication Regulatory Authority Regulator siteEnglish versionavailable?(Y / N)
Consideredfor survey?(Y / N)
If notreason
1 Afghanistan Afghanistan Telecom Regulatory Board (ATRA) http://www.atra.gov.af/index.htm Y N UC
2 Armenia Ministry of Transport and Communication http://www.mtc.am/ Y N UC
3 Australia Australian Communication and Media Authority http://www.acma.gov.au/WEB/HOMEPAGE/pc=HOME Y Y -
4 Azerbaijan The Ministry of Communications and InformationTechnologies http://www.mincom.gov.az/en/main.html Y Y -
5 Bahrain Telecom Regulatory Authority http://www.tra.org.bh/en/home.asp?dfltlng=1 Y Y -
6 Bangladesh Bangladesh Telecom Regulatory Commission (BTRC) http://www.btrc.gov.bd/ Y Y -
7 Bhutan Bhutan Infocomm and Media Authority http://www.bicma.gov.bt/index.html Y Y -
8 Brunei Darussalam Authority for Info-communication Technology Industry http://www.aiti.gov.bn/index.htm Y Y -
9 Cambodia Ministry of Posts and Telecommunications http://www.mptc.gov.kh/ Y Y -
10 China Ministry of Information Industry http://www.mii.gov.cn/ N N EVNA
11 Cook Islands - - - N NA
12 Fiji Telecommunication Unit - - N NWS
13 Georgia National Communication Commission http://www.gncc.ge/index.php?lang_id=ENG&sec_id=10050 Y Y -
14 Hong Kong Office of the Telecommunications Authority http://www.ofta.gov.hk/en/index.html Y Y -
15 India Telecom Regulatory Authority of India (TRAI) http://www.trai.gov.in/Default.asp Y Y -
16 Indonesia Badan Regulasi Telekomunikasi Indonesia (BRTI) http://www.brti.or.id/index_en.php N N EVNA
17 Iran Ministry of Posts, Telegraph and Telephone - - N NWS
18 Iraq Ministry of Transport and Communication - - N NWS
19 Israel Ministry of Communications http://www.moc.gov.il/8-en/MOC.aspx Y Y -
20 Japan Ministry of Internal Affairs and Communication http://www.soumu.go.jp/joho_tsusin/eng/index.html N N NFPS
21 Jordan Telecommunication Regulatory Commission http://www.trc.gov.jo/index.php?option=com_frontpage&Itemid=1&lang=english Y Y -
22 Kazakhstan Telecommunications and Post Dept - - N NWS
23 Kuwait Ministry of Communication http://www.moc.kw/ N N PP
24 Kyrgyzstan State Communications Agency - - N NWS
25 Laos Ministry of Communications, Transport, Posts andConstruction - - N NWS
26 Lebanon Ministry of Telecommunications http://www.mpt.gov.lb/ Y Y -
27 Macau DSRT http://www.gdtti.gov.mo/eng/News/index.html Y Y -
28 Malaysia Malaysian Communication and MultimediaCommission http://www.skmm.gov.my/ Y Y -
29 Maldives Telecom Authority of Maldives (TAM) http://www.tam.gov.mv/ Y Y -
30 Marshall Islands Cabinet - - N NWS
31 Mongolia ICTA http://www.icta.gov.mn/ N N EVNA
32 Myanmar Ministry of Communications, Posts, and Telegraphs http://www.mpt.net.mm/ Y Y -
33 Nauru Directorate of Telecommunications - - N NWS
34 Nepal Nepal Telecommunication Authority http://www.nta.gov.np/ Y Y -
Annex 1. List of economies that came within the scope of study
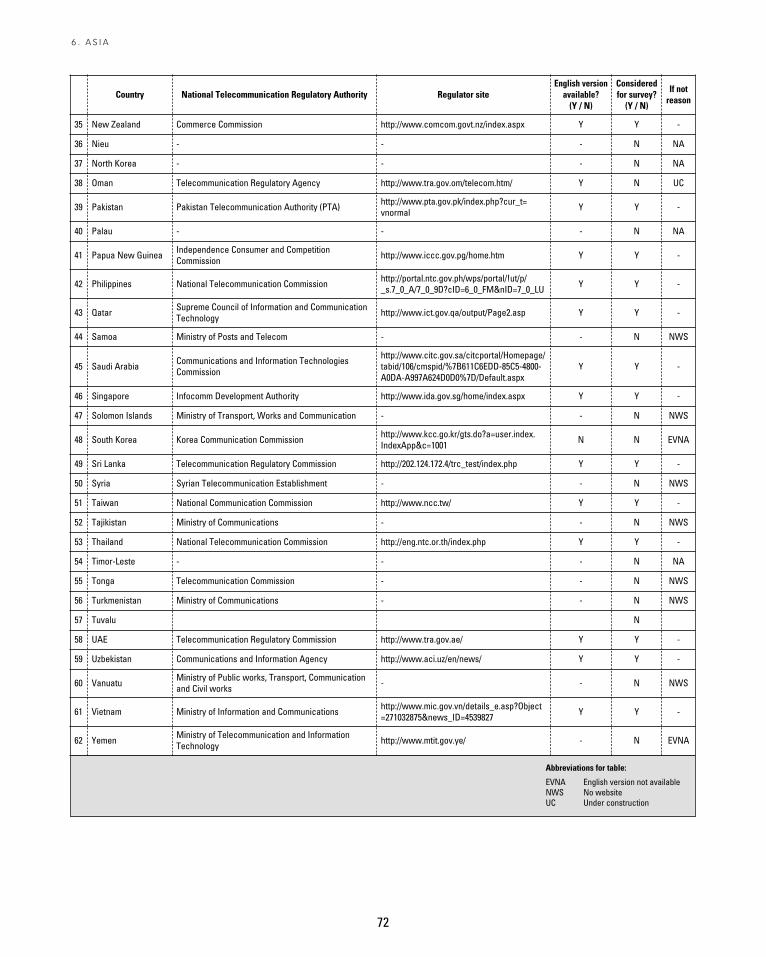
72
6 . A S I A
Abbreviations for table:
EVNA English version not availableNWS No websiteUC Under construction
Country National Telecommunication Regulatory Authority Regulator siteEnglish versionavailable?(Y / N)
Consideredfor survey?(Y / N)
If notreason
35 New Zealand Commerce Commission http://www.comcom.govt.nz/index.aspx Y Y -
36 Nieu - - - N NA
37 North Korea - - - N NA
38 Oman Telecommunication Regulatory Agency http://www.tra.gov.om/telecom.htm/ Y N UC
39 Pakistan Pakistan Telecommunication Authority (PTA) http://www.pta.gov.pk/index.php?cur_t=vnormal Y Y -
40 Palau - - - N NA
41 Papua New Guinea Independence Consumer and CompetitionCommission http://www.iccc.gov.pg/home.htm Y Y -
42 Philippines National Telecommunication Commission http://portal.ntc.gov.ph/wps/portal/!ut/p/_s.7_0_A/7_0_9D?cID=6_0_FM&nID=7_0_LU Y Y -
43 Qatar Supreme Council of Information and CommunicationTechnology http://www.ict.gov.qa/output/Page2.asp Y Y -
44 Samoa Ministry of Posts and Telecom - - N NWS
45 Saudi Arabia Communications and Information TechnologiesCommission
http://www.citc.gov.sa/citcportal/Homepage/tabid/106/cmspid/%7B611C6EDD-85C5-4800-A0DA-A997A624D0D0%7D/Default.aspx
Y Y -
46 Singapore Infocomm Development Authority http://www.ida.gov.sg/home/index.aspx Y Y -
47 Solomon Islands Ministry of Transport, Works and Communication - - N NWS
48 South Korea Korea Communication Commission http://www.kcc.go.kr/gts.do?a=user.index.IndexApp&c=1001 N N EVNA
49 Sri Lanka Telecommunication Regulatory Commission http://202.124.172.4/trc_test/index.php Y Y -
50 Syria Syrian Telecommunication Establishment - - N NWS
51 Taiwan National Communication Commission http://www.ncc.tw/ Y Y -
52 Tajikistan Ministry of Communications - - N NWS
53 Thailand National Telecommunication Commission http://eng.ntc.or.th/index.php Y Y -
54 Timor-Leste - - - N NA
55 Tonga Telecommunication Commission - - N NWS
56 Turkmenistan Ministry of Communications - - N NWS
57 Tuvalu N
58 UAE Telecommunication Regulatory Commission http://www.tra.gov.ae/ Y Y -
59 Uzbekistan Communications and Information Agency http://www.aci.uz/en/news/ Y Y -
60 Vanuatu Ministry of Public works, Transport, Communicationand Civil works - - N NWS
61 Vietnam Ministry of Information and Communications http://www.mic.gov.vn/details_e.asp?Object=271032875&news_ID=4539827 Y Y -
62 Yemen Ministry of Telecommunication and InformationTechnology http://www.mtit.gov.ye/ - N EVNA
Annex

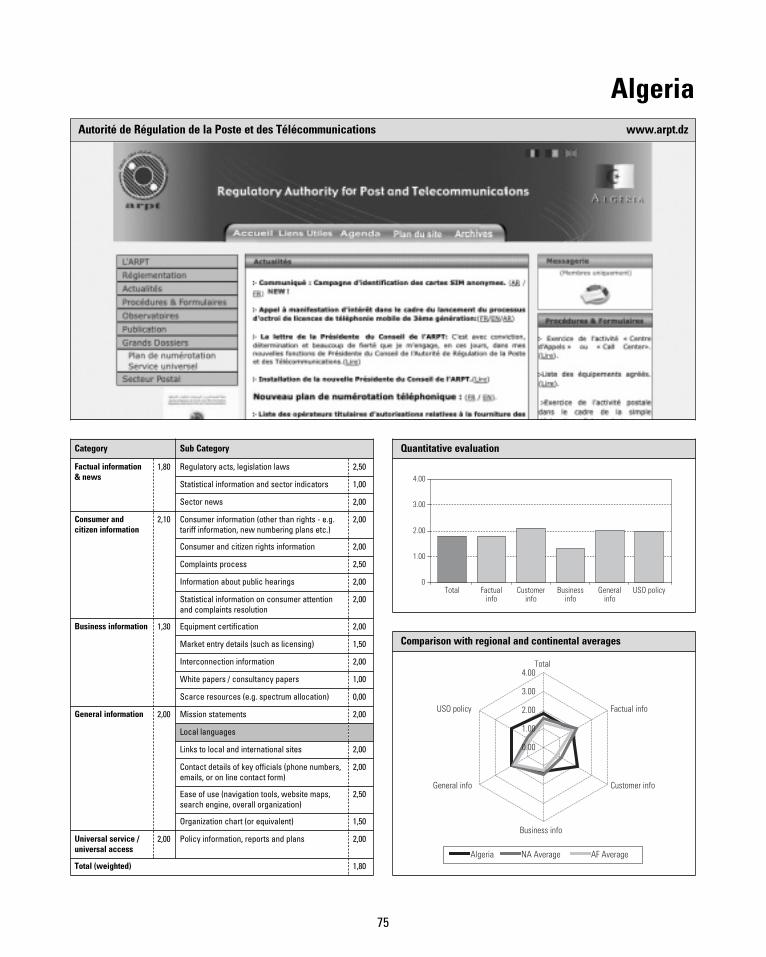
75
AlgeriaAutorité de Régulation de la Poste et des Télécommunications www.arpt.dz
Quantitative evaluation
Total Factualinfo
Customerinfo
Businessinfo
Generalinfo
USO policy0
1.00
2.00
3.00
4.00
Comparison with regional and continental averages
Algeria NA Average AF Average
0.00
1.00
2.00
3.00
4.00Total
Factual info
Customer info
Business info
General info
USO policy
Category Sub Category
Factual information& news
1,80 Regulatory acts, legislation laws 2,50
Statistical information and sector indicators 1,00
Sector news 2,00
Consumer andcitizen information
2,10 Consumer information (other than rights - e.g.tariff information, new numbering plans etc.)
2,00
Consumer and citizen rights information 2,00
Complaints process 2,50
Information about public hearings 2,00
Statistical information on consumer attentionand complaints resolution
2,00
Business information 1,30 Equipment certification 2,00
Market entry details (such as licensing) 1,50
Interconnection information 2,00
White papers / consultancy papers 1,00
Scarce resources (e.g. spectrum allocation) 0,00
General information 2,00 Mission statements 2,00
Local languages
Links to local and international sites 2,00
Contact details of key officials (phone numbers,emails, or on line contact form)
2,00
Ease of use (navigation tools, website maps,search engine, overall organization)
2,50
Organization chart (or equivalent) 1,50
Universal service /universal access
2,00 Policy information, reports and plans 2,00
Total (weighted) 1,80
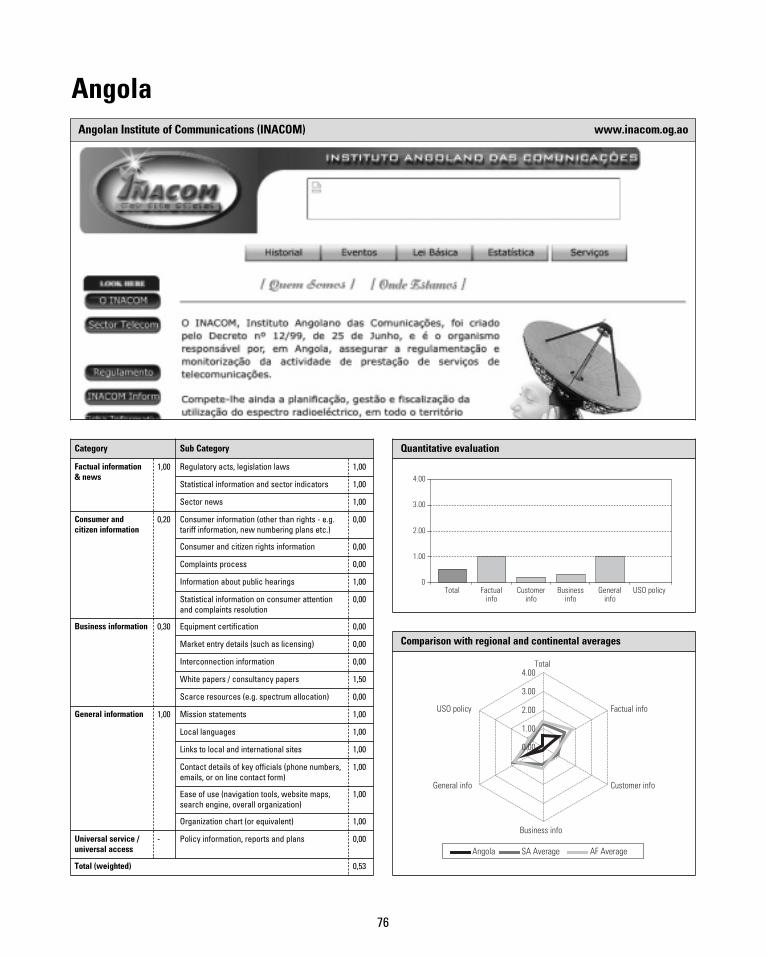
76
AngolaAngolan Institute of Communications (INACOM) www.inacom.og.ao
Quantitative evaluation
Total Factualinfo
Customerinfo
Businessinfo
Generalinfo
USO policy0
1.00
2.00
3.00
4.00
Comparison with regional and continental averages
Angola SA Average AF Average
0.00
1.00
2.00
3.00
4.00Total
Factual info
Customer info
Business info
General info
USO policy
Category Sub Category
Factual information& news
1,00 Regulatory acts, legislation laws 1,00
Statistical information and sector indicators 1,00
Sector news 1,00
Consumer andcitizen information
0,20 Consumer information (other than rights - e.g.tariff information, new numbering plans etc.)
0,00
Consumer and citizen rights information 0,00
Complaints process 0,00
Information about public hearings 1,00
Statistical information on consumer attentionand complaints resolution
0,00
Business information 0,30 Equipment certification 0,00
Market entry details (such as licensing) 0,00
Interconnection information 0,00
White papers / consultancy papers 1,50
Scarce resources (e.g. spectrum allocation) 0,00
General information 1,00 Mission statements 1,00
Local languages 1,00
Links to local and international sites 1,00
Contact details of key officials (phone numbers,emails, or on line contact form)
1,00
Ease of use (navigation tools, website maps,search engine, overall organization)
1,00
Organization chart (or equivalent) 1,00
Universal service /universal access
- Policy information, reports and plans 0,00
Total (weighted) 0,53
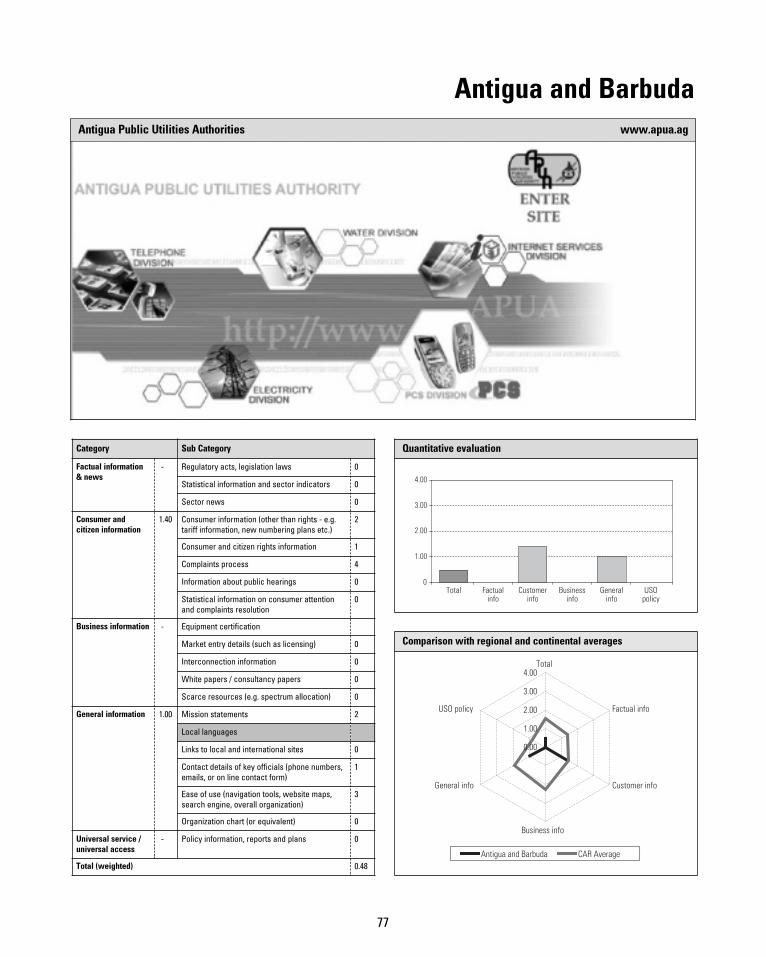
77
Antigua and BarbudaAntigua Public Utilities Authorities www.apua.ag
Quantitative evaluation
Total Factualinfo
Customerinfo
Businessinfo
Generalinfo
USOpolicy
0
1.00
2.00
3.00
4.00
Comparison with regional and continental averages
Antigua and Barbuda CAR Average
0.00
1.00
2.00
3.00
4.00Total
Factual info
Customer info
Business info
General info
USO policy
0
Category Sub Category
Factual information& news
- Regulatory acts, legislation laws 0
Statistical information and sector indicators 0
Sector news 0
Consumer andcitizen information
1.40 Consumer information (other than rights - e.g.tariff information, new numbering plans etc.)
2
Consumer and citizen rights information 1
Complaints process 4
Information about public hearings 0
Statistical information on consumer attentionand complaints resolution
0
Business information - Equipment certification
Market entry details (such as licensing) 0
Interconnection information 0
White papers / consultancy papers 0
Scarce resources (e.g. spectrum allocation) 0
General information 1.00 Mission statements 2
Local languages
Links to local and international sites 0
Contact details of key officials (phone numbers,emails, or on line contact form)
1
Ease of use (navigation tools, website maps,search engine, overall organization)
3
Organization chart (or equivalent) 0
Universal service /universal access
- Policy information, reports and plans 0
Total (weighted) 0.48
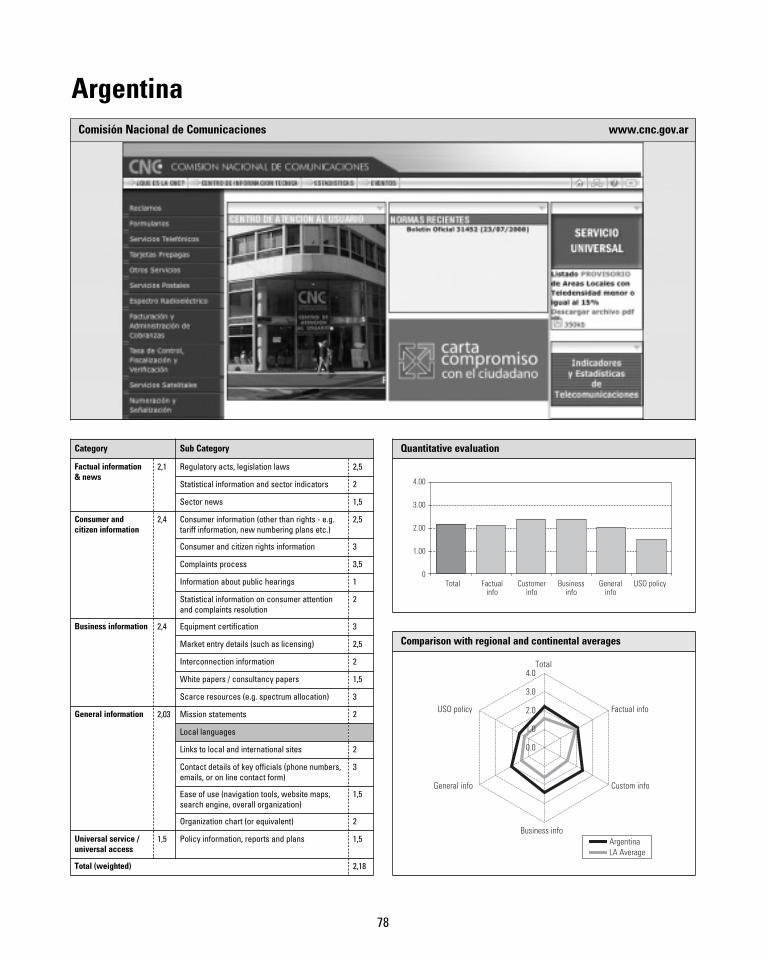
78
ArgentinaComisión Nacional de Comunicaciones www.cnc.gov.ar
Quantitative evaluation
Total Factualinfo
Customerinfo
Businessinfo
Generalinfo
USO policy0
1.00
2.00
3.00
4.00
Comparison with regional and continental averages
ArgentinaLA Average
Total
Factual info
Custom info
Business info
General info
USO policy
0.0
1.0
2.0
3.0
4.0
Category Sub Category
Factual information& news
2,1 Regulatory acts, legislation laws 2,5
Statistical information and sector indicators 2
Sector news 1,5
Consumer andcitizen information
2,4 Consumer information (other than rights - e.g.tariff information, new numbering plans etc.)
2,5
Consumer and citizen rights information 3
Complaints process 3,5
Information about public hearings 1
Statistical information on consumer attentionand complaints resolution
2
Business information 2,4 Equipment certification 3
Market entry details (such as licensing) 2,5
Interconnection information 2
White papers / consultancy papers 1,5
Scarce resources (e.g. spectrum allocation) 3
General information 2,03 Mission statements 2
Local languages
Links to local and international sites 2
Contact details of key officials (phone numbers,emails, or on line contact form)
3
Ease of use (navigation tools, website maps,search engine, overall organization)
1,5
Organization chart (or equivalent) 2
Universal service /universal access
1,5 Policy information, reports and plans 1,5
Total (weighted) 2,18
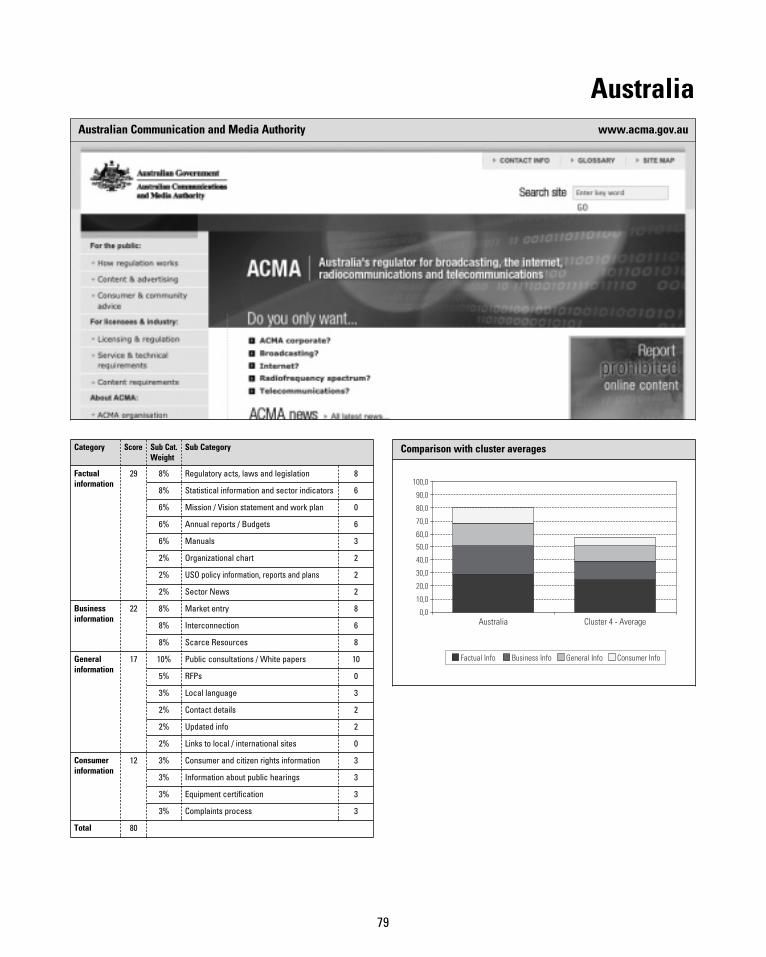
79
AustraliaAustralian Communication and Media Authority www.acma.gov.au
Category Score Sub Cat.Weight
Sub Category
Factualinformation
29 8% Regulatory acts, laws and legislation 8
8% Statistical information and sector indicators 6
6% Mission / Vision statement and work plan 0
6% Annual reports / Budgets 6
6% Manuals 3
2% Organizational chart 2
2% USO policy information, reports and plans 2
2% Sector News 2
Businessinformation
22 8% Market entry 8
8% Interconnection 6
8% Scarce Resources 8
Generalinformation
17 10% Public consultations / White papers 10
5% RFPs 0
3% Local language 3
2% Contact details 2
2% Updated info 2
2% Links to local / international sites 0
Consumerinformation
12 3% Consumer and citizen rights information 3
3% Information about public hearings 3
3% Equipment certification 3
3% Complaints process 3
Total 80
Comparison with cluster averages
0,0
10,0
20,0
30,0
40,0
50,0
60,0
70,0
80,0
90,0
100,0
0
Australia Cluster 4 - Average
Factual Info Business Info General Info Consumer Info
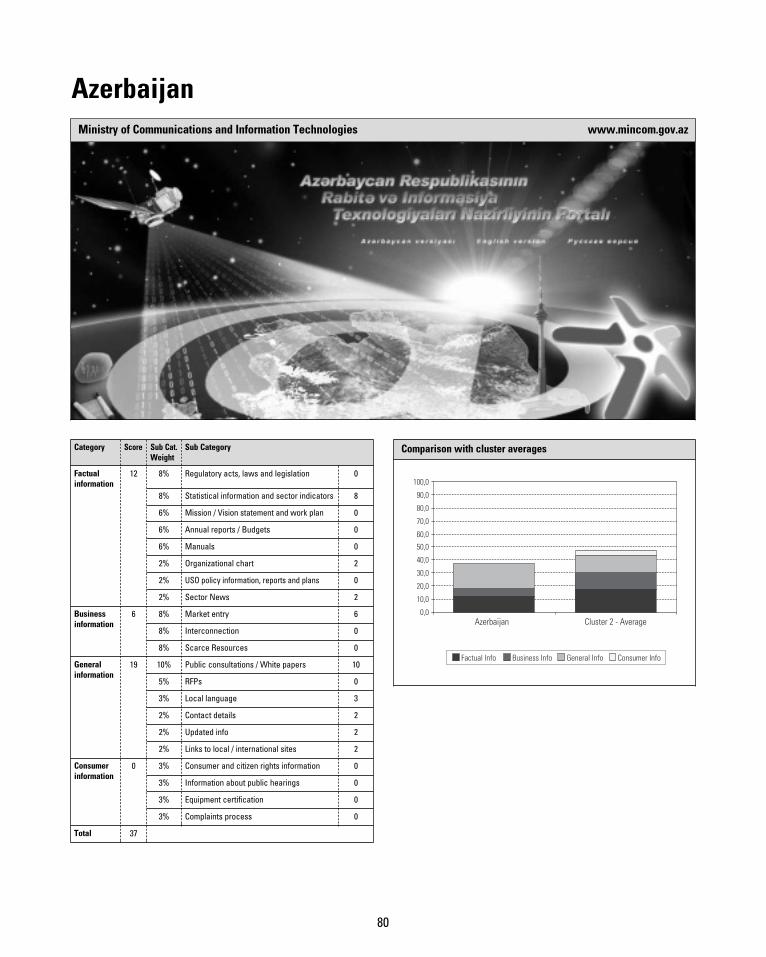
80
AzerbaijanMinistry of Communications and Information Technologies www.mincom.gov.az
Category Score Sub Cat.Weight
Sub Category
Factualinformation
12 8% Regulatory acts, laws and legislation 0
8% Statistical information and sector indicators 8
6% Mission / Vision statement and work plan 0
6% Annual reports / Budgets 0
6% Manuals 0
2% Organizational chart 2
2% USO policy information, reports and plans 0
2% Sector News 2
Businessinformation
6 8% Market entry 6
8% Interconnection 0
8% Scarce Resources 0
Generalinformation
19 10% Public consultations / White papers 10
5% RFPs 0
3% Local language 3
2% Contact details 2
2% Updated info 2
2% Links to local / international sites 2
Consumerinformation
0 3% Consumer and citizen rights information 0
3% Information about public hearings 0
3% Equipment certification 0
3% Complaints process 0
Total 37
Comparison with cluster averages
0,0
10,0
20,0
30,0
40,0
50,0
60,0
70,0
80,0
90,0
100,0
0
Azerbaijan Cluster 2 - Average
Factual Info Business Info General Info Consumer Info
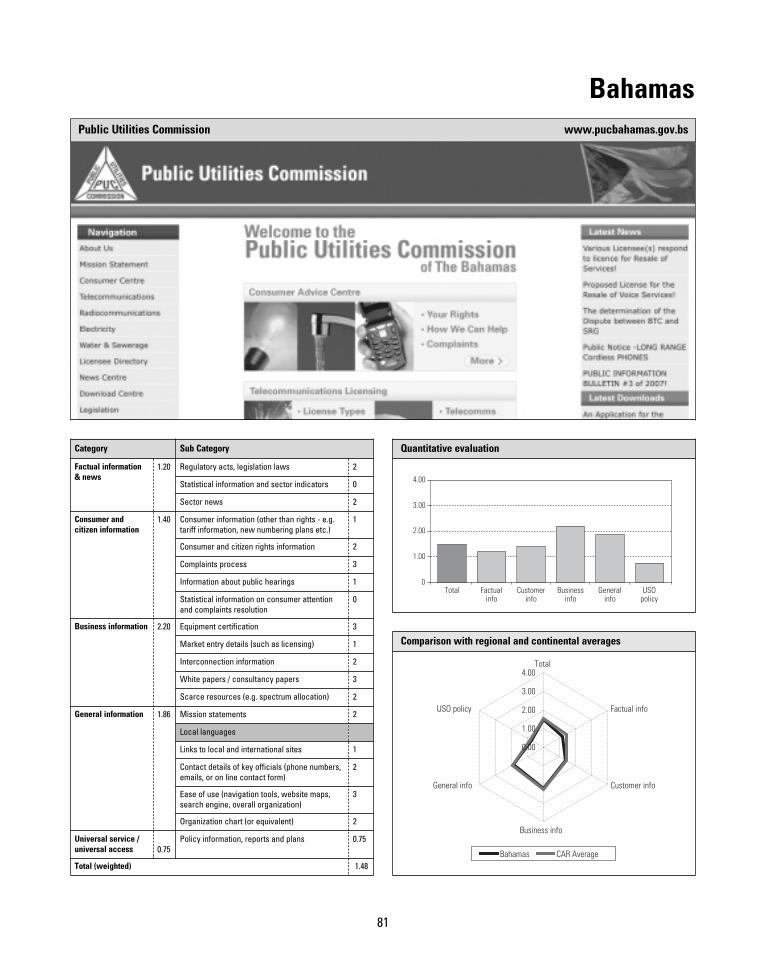
81
BahamasPublic Utilities Commission www.pucbahamas.gov.bs
Quantitative evaluation
Total Factualinfo
Customerinfo
Businessinfo
Generalinfo
USOpolicy
0
1.00
2.00
3.00
4.00
Comparison with regional and continental averages
Bahamas CAR Average
0.00
1.00
2.00
3.00
4.00Total
Factual info
Customer info
Business info
General info
USO policy
0
Category Sub Category
Factual information& news
1.20 Regulatory acts, legislation laws 2
Statistical information and sector indicators 0
Sector news 2
Consumer andcitizen information
1.40 Consumer information (other than rights - e.g.tariff information, new numbering plans etc.)
1
Consumer and citizen rights information 2
Complaints process 3
Information about public hearings 1
Statistical information on consumer attentionand complaints resolution
0
Business information 2.20 Equipment certification 3
Market entry details (such as licensing) 1
Interconnection information 2
White papers / consultancy papers 3
Scarce resources (e.g. spectrum allocation) 2
General information 1.86 Mission statements 2
Local languages
Links to local and international sites 1
Contact details of key officials (phone numbers,emails, or on line contact form)
2
Ease of use (navigation tools, website maps,search engine, overall organization)
3
Organization chart (or equivalent) 2
Universal service /universal access 0.75
Policy information, reports and plans 0.75
Total (weighted) 1.48
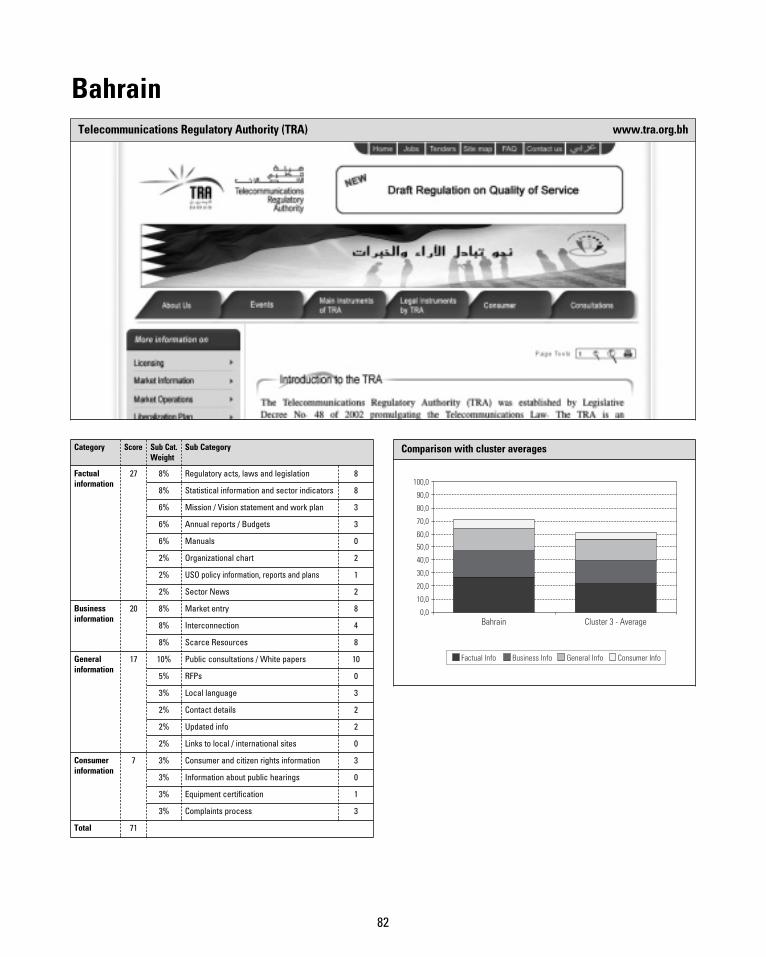
82
BahrainTelecommunications Regulatory Authority (TRA) www.tra.org.bh
Category Score Sub Cat.Weight
Sub Category
Factualinformation
27 8% Regulatory acts, laws and legislation 8
8% Statistical information and sector indicators 8
6% Mission / Vision statement and work plan 3
6% Annual reports / Budgets 3
6% Manuals 0
2% Organizational chart 2
2% USO policy information, reports and plans 1
2% Sector News 2
Businessinformation
20 8% Market entry 8
8% Interconnection 4
8% Scarce Resources 8
Generalinformation
17 10% Public consultations / White papers 10
5% RFPs 0
3% Local language 3
2% Contact details 2
2% Updated info 2
2% Links to local / international sites 0
Consumerinformation
7 3% Consumer and citizen rights information 3
3% Information about public hearings 0
3% Equipment certification 1
3% Complaints process 3
Total 71
Comparison with cluster averages
0,0
10,0
20,0
30,0
40,0
50,0
60,0
70,0
80,0
90,0
100,0
0
Bahrain Cluster 3 - Average
Factual Info Business Info General Info Consumer Info
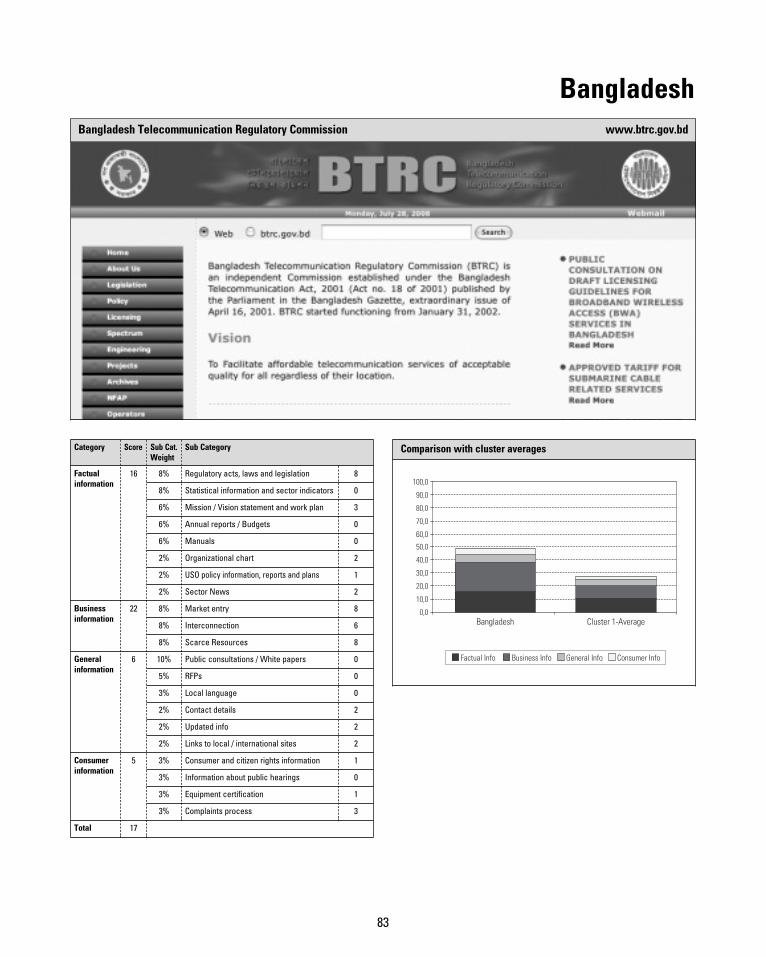
83
BangladeshBangladesh Telecommunication Regulatory Commission www.btrc.gov.bd
Category Score Sub Cat.Weight
Sub Category
Factualinformation
16 8% Regulatory acts, laws and legislation 8
8% Statistical information and sector indicators 0
6% Mission / Vision statement and work plan 3
6% Annual reports / Budgets 0
6% Manuals 0
2% Organizational chart 2
2% USO policy information, reports and plans 1
2% Sector News 2
Businessinformation
22 8% Market entry 8
8% Interconnection 6
8% Scarce Resources 8
Generalinformation
6 10% Public consultations / White papers 0
5% RFPs 0
3% Local language 0
2% Contact details 2
2% Updated info 2
2% Links to local / international sites 2
Consumerinformation
5 3% Consumer and citizen rights information 1
3% Information about public hearings 0
3% Equipment certification 1
3% Complaints process 3
Total 17
Comparison with cluster averages
0,0
10,0
20,0
30,0
40,0
50,0
60,0
70,0
80,0
90,0
100,0
0Bangladesh Cluster 1-Average
Factual Info Business Info General Info Consumer Info
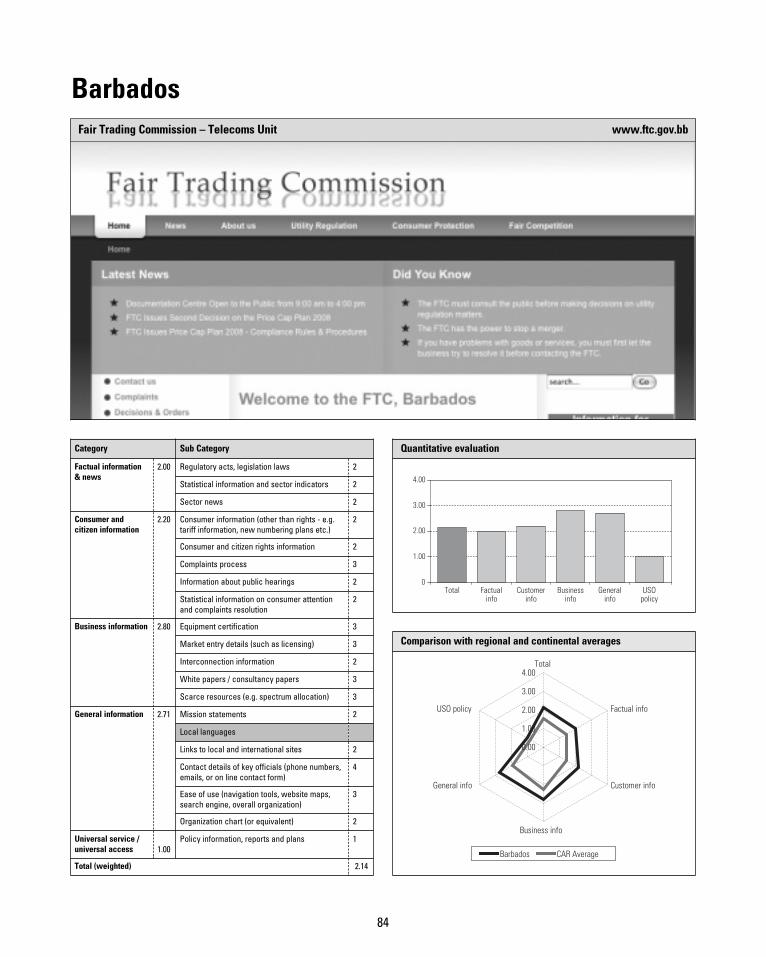
84
BarbadosFair Trading Commission – Telecoms Unit www.ftc.gov.bb
Quantitative evaluation
Total Factualinfo
Customerinfo
Businessinfo
Generalinfo
USOpolicy
0
1.00
2.00
3.00
4.00
Comparison with regional and continental averages
Barbados CAR Average
0.00
1.00
2.00
3.00
4.00Total
Factual info
Customer info
Business info
General info
USO policy
0
Category Sub Category
Factual information& news
2.00 Regulatory acts, legislation laws 2
Statistical information and sector indicators 2
Sector news 2
Consumer andcitizen information
2.20 Consumer information (other than rights - e.g.tariff information, new numbering plans etc.)
2
Consumer and citizen rights information 2
Complaints process 3
Information about public hearings 2
Statistical information on consumer attentionand complaints resolution
2
Business information 2.80 Equipment certification 3
Market entry details (such as licensing) 3
Interconnection information 2
White papers / consultancy papers 3
Scarce resources (e.g. spectrum allocation) 3
General information 2.71 Mission statements 2
Local languages
Links to local and international sites 2
Contact details of key officials (phone numbers,emails, or on line contact form)
4
Ease of use (navigation tools, website maps,search engine, overall organization)
3
Organization chart (or equivalent) 2
Universal service /universal access 1.00
Policy information, reports and plans 1
Total (weighted) 2.14
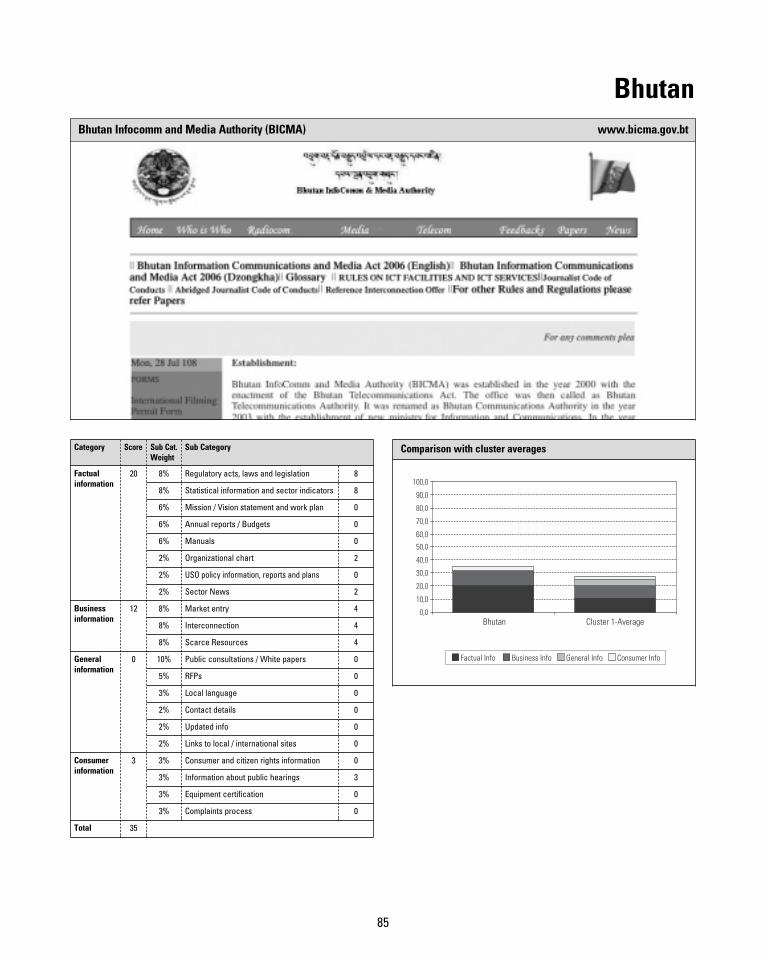
85
BhutanBhutan Infocomm and Media Authority (BICMA) www.bicma.gov.bt
Category Score Sub Cat.Weight
Sub Category
Factualinformation
20 8% Regulatory acts, laws and legislation 8
8% Statistical information and sector indicators 8
6% Mission / Vision statement and work plan 0
6% Annual reports / Budgets 0
6% Manuals 0
2% Organizational chart 2
2% USO policy information, reports and plans 0
2% Sector News 2
Businessinformation
12 8% Market entry 4
8% Interconnection 4
8% Scarce Resources 4
Generalinformation
0 10% Public consultations / White papers 0
5% RFPs 0
3% Local language 0
2% Contact details 0
2% Updated info 0
2% Links to local / international sites 0
Consumerinformation
3 3% Consumer and citizen rights information 0
3% Information about public hearings 3
3% Equipment certification 0
3% Complaints process 0
Total 35
Comparison with cluster averages
0,0
10,0
20,0
30,0
40,0
50,0
60,0
70,0
80,0
90,0
100,0
0
Bhutan Cluster 1-Average
Factual Info Business Info General Info Consumer Info
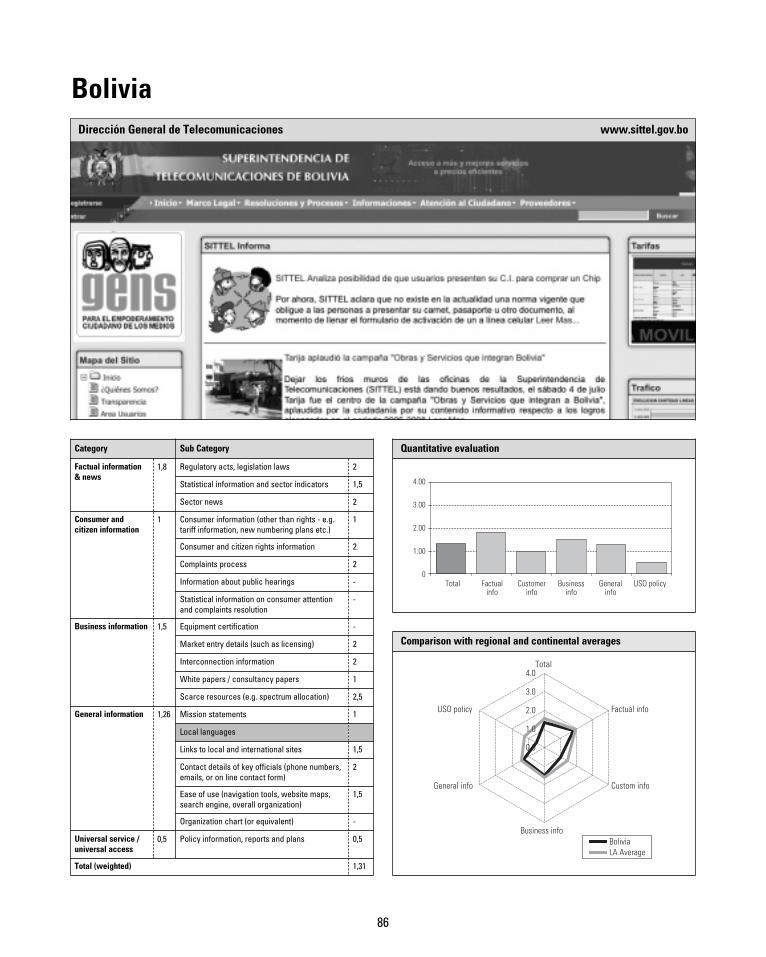
86
BoliviaDirección General de Telecomunicaciones www.sittel.gov.bo
Quantitative evaluation
Total Factualinfo
Customerinfo
Businessinfo
Generalinfo
USO policy0
1.00
2.00
3.00
4.00
Comparison with regional and continental averages
BoliviaLA Average
Total
Factual info
Custom info
Business info
General info
USO policy
0.0
1.0
2.0
3.0
4.0
Category Sub Category
Factual information& news
1,8 Regulatory acts, legislation laws 2
Statistical information and sector indicators 1,5
Sector news 2
Consumer andcitizen information
1 Consumer information (other than rights - e.g.tariff information, new numbering plans etc.)
1
Consumer and citizen rights information 2
Complaints process 2
Information about public hearings -
Statistical information on consumer attentionand complaints resolution
-
Business information 1,5 Equipment certification -
Market entry details (such as licensing) 2
Interconnection information 2
White papers / consultancy papers 1
Scarce resources (e.g. spectrum allocation) 2,5
General information 1,26 Mission statements 1
Local languages
Links to local and international sites 1,5
Contact details of key officials (phone numbers,emails, or on line contact form)
2
Ease of use (navigation tools, website maps,search engine, overall organization)
1,5
Organization chart (or equivalent) -
Universal service /universal access
0,5 Policy information, reports and plans 0,5
Total (weighted) 1,31
87
BotswanaBotswana Telecommunications Authority (BTA) www.bta.org.bw
Quantitative evaluation
Total Factualinfo
Customerinfo
Businessinfo
Generalinfo
USO policy0
1.00
2.00
3.00
4.00
Comparison with regional and continental averages
Botswana SA Average AF Average
0.00
1.00
2.00
3.00
4.00Total
Factual info
Customer info
Business info
General info
USO policy
Category Sub Category
Factual information& news
1,50 Regulatory acts, legislation laws 2,00
Statistical information and sector indicators 1,00
Sector news 1,50
Consumer andcitizen information
2,20 Consumer information (other than rights - e.g.tariff information, new numbering plans etc.)
2,00
Consumer and citizen rights information 2,50
Complaints process 3,50
Information about public hearings 3,00
Statistical information on consumer attentionand complaints resolution
0,00
Business information 1,80 Equipment certification 3,50
Market entry details (such as licensing) 3,50
Interconnection information 0,00
White papers / consultancy papers 0,00
Scarce resources (e.g. spectrum allocation) 2,00
General information 2,07 Mission statements 2,00
Local languages
Links to local and international sites 4,00
Contact details of key officials (phone numbers,emails, or on line contact form)
1,50
Ease of use (navigation tools, website maps,search engine, overall organization)
2,00
Organization chart (or equivalent) 0,00
Universal service /universal access
- Policy information, reports and plans 0,00
Total (weighted) 1,69
88
BrazilAgencia Nacional de Telecomunicaciones www.anatel.gov.br
Quantitative evaluation
Total Factualinfo
Customerinfo
Businessinfo
Generalinfo
USO policy0
1.00
2.00
3.00
4.00
Comparison with regional and continental averages
BrazilLA Average
Total
Factual info
Custom info
Business info
General info
USO policy
0.0
1.0
2.0
3.0
4.0
Category Sub Category
Factual information& news
3,2 Regulatory acts, legislation laws 3
Statistical information and sector indicators 3,5
Sector news 3
Consumer andcitizen information
2,8 Consumer information (other than rights - e.g.tariff information, new numbering plans etc.)
3
Consumer and citizen rights information 2,5
Complaints process 3
Information about public hearings 3
Statistical information on consumer attentionand complaints resolution
2,5
Business information 3,1 Equipment certification 3,5
Market entry details (such as licensing) 3
Interconnection information 3
White papers / consultancy papers 3
Scarce resources (e.g. spectrum allocation) 3
General information 2,71 Mission statements 2
Local languages
Links to local and international sites 2,5
Contact details of key officials (phone numbers,emails, or on line contact form)
3,0
Ease of use (navigation tools, website maps,search engine, overall organization)
3,5
Organization chart (or equivalent) 2,5
Universal service /universal access
3 Policy information, reports and plans 3
Total (weighted) 2,98
89
Brunei DarussalamAuthority for Info-communications Technology www.aiti.gov.bn
Category Score Sub Cat.Weight
Sub Category
Factualinformation
11 8% Regulatory acts, laws and legislation 4
8% Statistical information and sector indicators 0
6% Mission / Vision statement and work plan 3
6% Annual reports / Budgets 0
6% Manuals 0
2% Organizational chart 2
2% USO policy information, reports and plans 0
2% Sector News 2
Businessinformation
14 8% Market entry 8
8% Interconnection 6
8% Scarce Resources 0
Generalinformation
14 10% Public consultations / White papers 10
5% RFPs 0
3% Local language 0
2% Contact details 2
2% Updated info 2
2% Links to local / international sites 0
Consumerinformation
0 3% Consumer and citizen rights information 0
3% Information about public hearings 0
3% Equipment certification 0
3% Complaints process 0
Total 39
Comparison with cluster averages
0,0
10,0
20,0
30,0
40,0
50,0
60,0
70,0
80,0
90,0
100,0
0
Brunei Darussalam Cluster 3 - Average
Factual Info Business Info General Info Consumer Info
90
Burkina FasoAutorité Nationale de Régulation des Télécommunications www.artel.bf
Quantitative evaluation
Total Factualinfo
Customerinfo
Businessinfo
Generalinfo
USO policy0
1.00
2.00
3.00
4.00
Comparison with regional and continental averages
Burkinafaso WCA Average AF Average
0.00
1.00
2.00
3.00
4.00Total
Factual info
Customer info
Business info
General info
USO policy
0
Category Sub Category
Factual information& news
1,40 Regulatory acts, legislation laws 2,00
Statistical information and sector indicators 1,00
Sector news 1,00
Consumer andcitizen information
0,30 Consumer information (other than rights - e.g.tariff information, new numbering plans etc.)
0,00
Consumer and citizen rights information 0,00
Complaints process 0,00
Information about public hearings 1,50
Statistical information on consumer attentionand complaints resolution
0,00
Business information 1,40 Equipment certification 2,00
Market entry details (such as licensing) 1,00
Interconnection information 2,00
White papers / consultancy papers 0,00
Scarce resources (e.g. spectrum allocation) 2,00
General information 2,18 Mission statements 2,00
Local languages
Links to local and international sites 3,00
Contact details of key officials (phone numbers,emails, or on line contact form)
2,00
Ease of use (navigation tools, website maps,search engine, overall organization)
2,00
Organization chart (or equivalent) 1,50
Universal service /universal access
1,00 Policy information, reports and plans 1,00
Total (weighted) 1,20
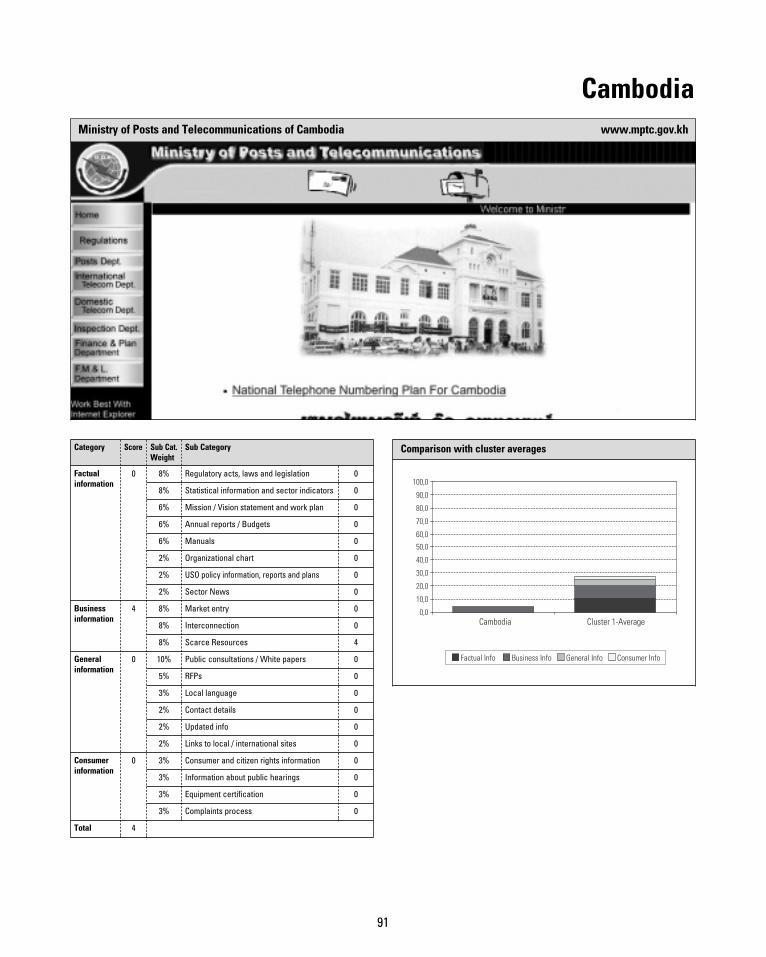
91
CambodiaMinistry of Posts and Telecommunications of Cambodia www.mptc.gov.kh
Category Score Sub Cat.Weight
Sub Category
Factualinformation
0 8% Regulatory acts, laws and legislation 0
8% Statistical information and sector indicators 0
6% Mission / Vision statement and work plan 0
6% Annual reports / Budgets 0
6% Manuals 0
2% Organizational chart 0
2% USO policy information, reports and plans 0
2% Sector News 0
Businessinformation
4 8% Market entry 0
8% Interconnection 0
8% Scarce Resources 4
Generalinformation
0 10% Public consultations / White papers 0
5% RFPs 0
3% Local language 0
2% Contact details 0
2% Updated info 0
2% Links to local / international sites 0
Consumerinformation
0 3% Consumer and citizen rights information 0
3% Information about public hearings 0
3% Equipment certification 0
3% Complaints process 0
Total 4
Comparison with cluster averages
0,0
10,0
20,0
30,0
40,0
50,0
60,0
70,0
80,0
90,0
100,0
0
Cambodia Cluster 1-Average
Factual Info Business Info General Info Consumer Info
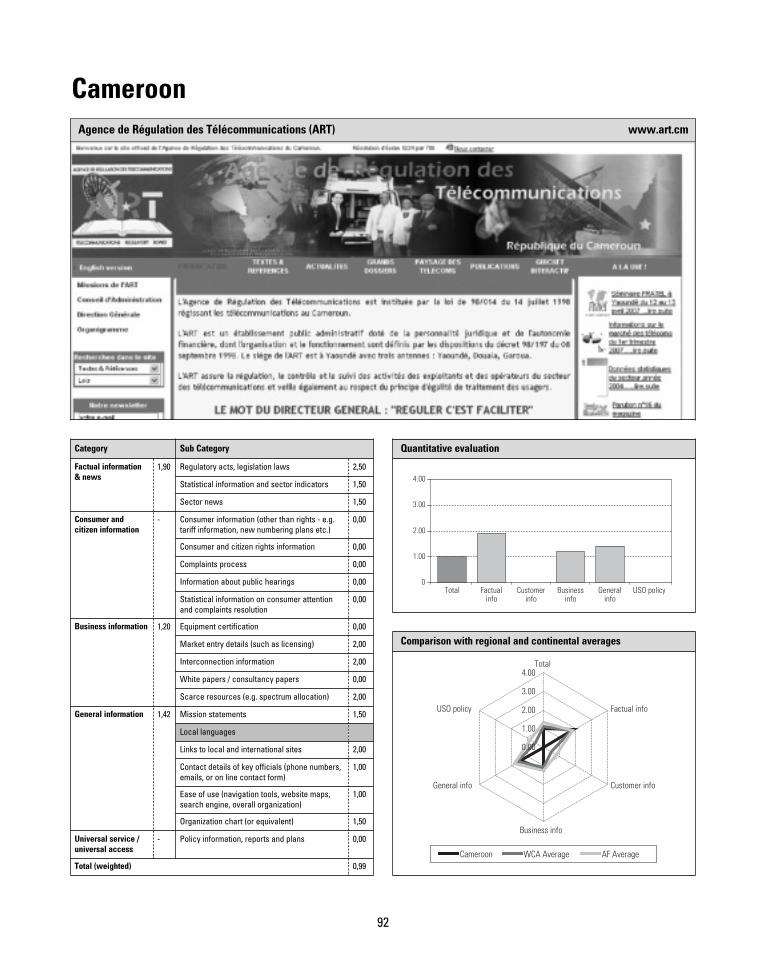
92
CameroonAgence de Régulation des Télécommunications (ART) www.art.cm
Quantitative evaluation
Total Factualinfo
Customerinfo
Businessinfo
Generalinfo
USO policy0
1.00
2.00
3.00
4.00
Comparison with regional and continental averages
Cameroon WCA Average AF Average
0.00
1.00
2.00
3.00
4.00Total
Factual info
Customer info
Business info
General info
USO policy
Category Sub Category
Factual information& news
1,90 Regulatory acts, legislation laws 2,50
Statistical information and sector indicators 1,50
Sector news 1,50
Consumer andcitizen information
- Consumer information (other than rights - e.g.tariff information, new numbering plans etc.)
0,00
Consumer and citizen rights information 0,00
Complaints process 0,00
Information about public hearings 0,00
Statistical information on consumer attentionand complaints resolution
0,00
Business information 1,20 Equipment certification 0,00
Market entry details (such as licensing) 2,00
Interconnection information 2,00
White papers / consultancy papers 0,00
Scarce resources (e.g. spectrum allocation) 2,00
General information 1,42 Mission statements 1,50
Local languages
Links to local and international sites 2,00
Contact details of key officials (phone numbers,emails, or on line contact form)
1,00
Ease of use (navigation tools, website maps,search engine, overall organization)
1,00
Organization chart (or equivalent) 1,50
Universal service /universal access
- Policy information, reports and plans 0,00
Total (weighted) 0,99
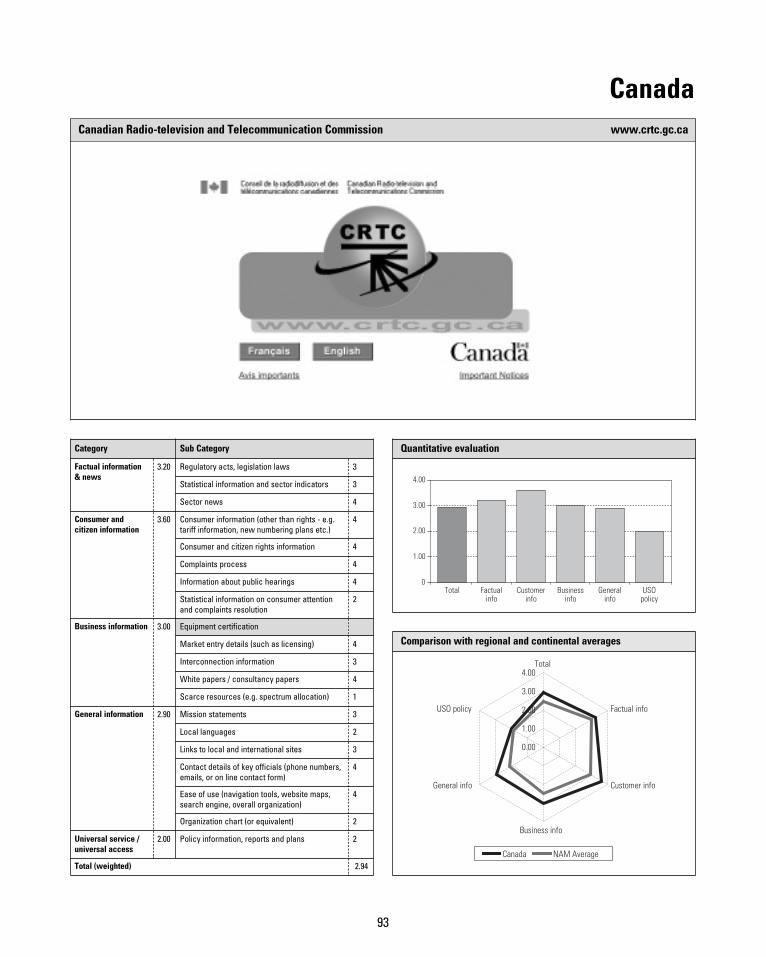
93
Canadian Radio-television and Telecommunication Commission www.crtc.gc.ca
Quantitative evaluation
Total Factualinfo
Customerinfo
Businessinfo
Generalinfo
USOpolicy
0
1.00
2.00
3.00
4.00
Comparison with regional and continental averages
Canada NAM Average
0.00
1.00
2.00
3.00
4.00Total
Factual info
Customer info
Business info
General info
USO policy
0
Category Sub Category
Factual information& news
3.20 Regulatory acts, legislation laws 3
Statistical information and sector indicators 3
Sector news 4
Consumer andcitizen information
3.60 Consumer information (other than rights - e.g.tariff information, new numbering plans etc.)
4
Consumer and citizen rights information 4
Complaints process 4
Information about public hearings 4
Statistical information on consumer attentionand complaints resolution
2
Business information 3.00 Equipment certification
Market entry details (such as licensing) 4
Interconnection information 3
White papers / consultancy papers 4
Scarce resources (e.g. spectrum allocation) 1
General information 2.90 Mission statements 3
Local languages 2
Links to local and international sites 3
Contact details of key officials (phone numbers,emails, or on line contact form)
4
Ease of use (navigation tools, website maps,search engine, overall organization)
4
Organization chart (or equivalent) 2
Universal service /universal access
2.00 Policy information, reports and plans 2
Total (weighted) 2.94
Canada
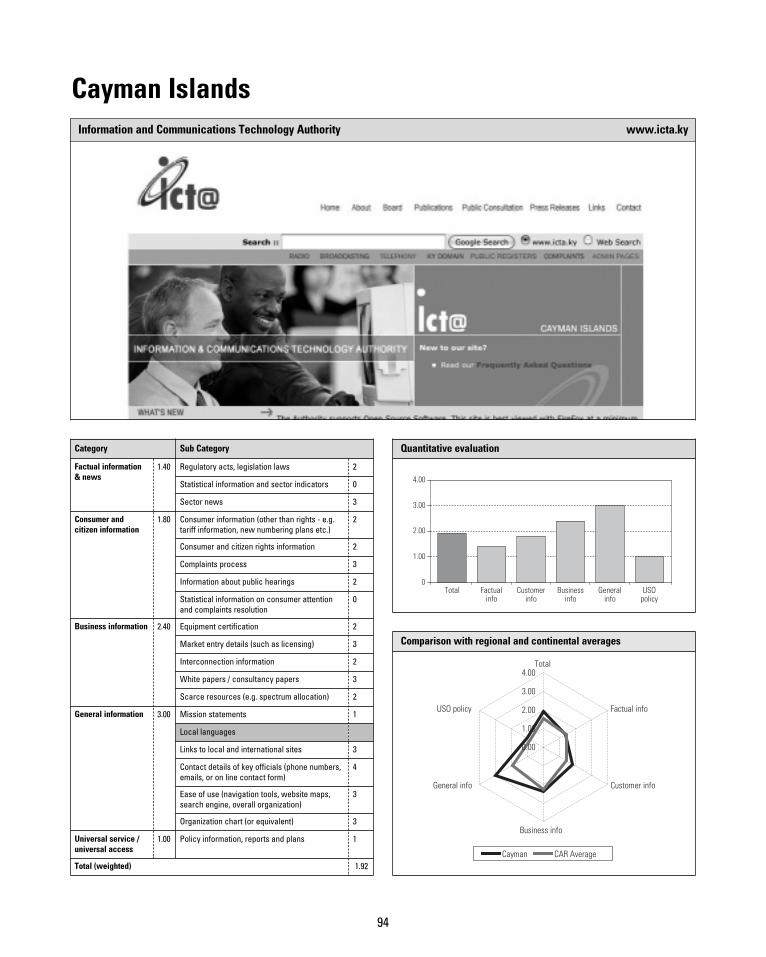
94
Cayman IslandsInformation and Communications Technology Authority www.icta.ky
Quantitative evaluation
Total Factualinfo
Customerinfo
Businessinfo
Generalinfo
USOpolicy
0
1.00
2.00
3.00
4.00
Comparison with regional and continental averages
Cayman CAR Average
0.00
1.00
2.00
3.00
4.00Total
Factual info
Customer info
Business info
General info
USO policy
0
Category Sub Category
Factual information& news
1.40 Regulatory acts, legislation laws 2
Statistical information and sector indicators 0
Sector news 3
Consumer andcitizen information
1.80 Consumer information (other than rights - e.g.tariff information, new numbering plans etc.)
2
Consumer and citizen rights information 2
Complaints process 3
Information about public hearings 2
Statistical information on consumer attentionand complaints resolution
0
Business information 2.40 Equipment certification 2
Market entry details (such as licensing) 3
Interconnection information 2
White papers / consultancy papers 3
Scarce resources (e.g. spectrum allocation) 2
General information 3.00 Mission statements 1
Local languages
Links to local and international sites 3
Contact details of key officials (phone numbers,emails, or on line contact form)
4
Ease of use (navigation tools, website maps,search engine, overall organization)
3
Organization chart (or equivalent) 3
Universal service /universal access
1.00 Policy information, reports and plans 1
Total (weighted) 1.92
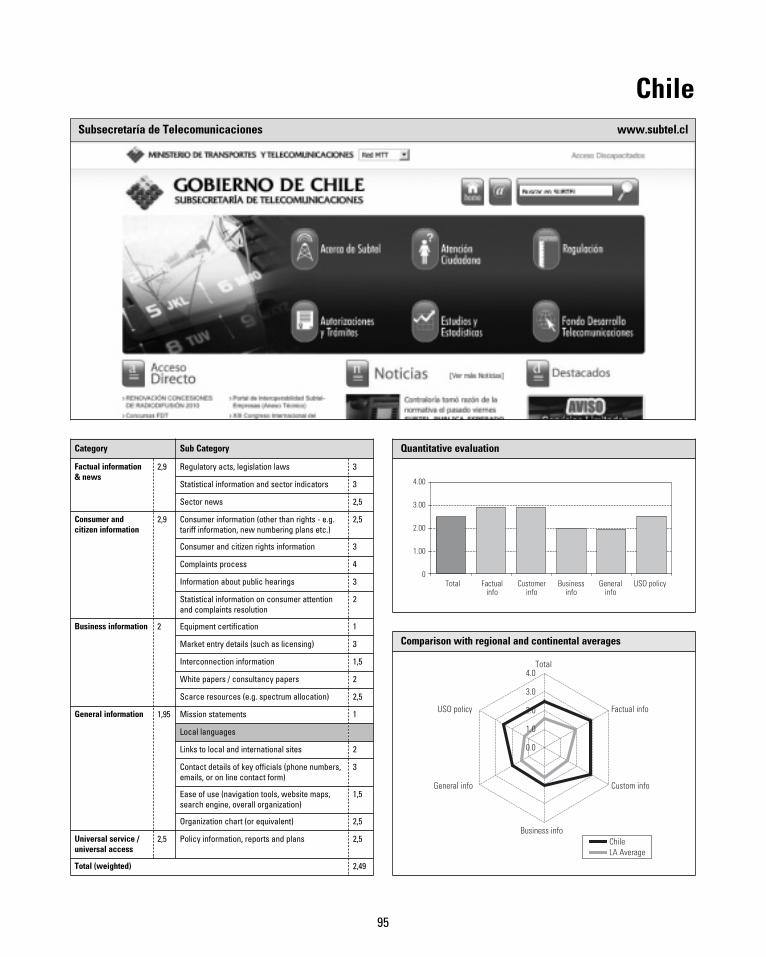
95
ChileSubsecretaría de Telecomunicaciones www.subtel.cl
Quantitative evaluation
Total Factualinfo
Customerinfo
Businessinfo
Generalinfo
USO policy0
1.00
2.00
3.00
4.00
Comparison with regional and continental averages
ChileLA Average
Total
Factual info
Custom info
Business info
General info
USO policy
0.0
1.0
2.0
3.0
4.0
Category Sub Category
Factual information& news
2,9 Regulatory acts, legislation laws 3
Statistical information and sector indicators 3
Sector news 2,5
Consumer andcitizen information
2,9 Consumer information (other than rights - e.g.tariff information, new numbering plans etc.)
2,5
Consumer and citizen rights information 3
Complaints process 4
Information about public hearings 3
Statistical information on consumer attentionand complaints resolution
2
Business information 2 Equipment certification 1
Market entry details (such as licensing) 3
Interconnection information 1,5
White papers / consultancy papers 2
Scarce resources (e.g. spectrum allocation) 2,5
General information 1,95 Mission statements 1
Local languages
Links to local and international sites 2
Contact details of key officials (phone numbers,emails, or on line contact form)
3
Ease of use (navigation tools, website maps,search engine, overall organization)
1,5
Organization chart (or equivalent) 2,5
Universal service /universal access
2,5 Policy information, reports and plans 2,5
Total (weighted) 2,49
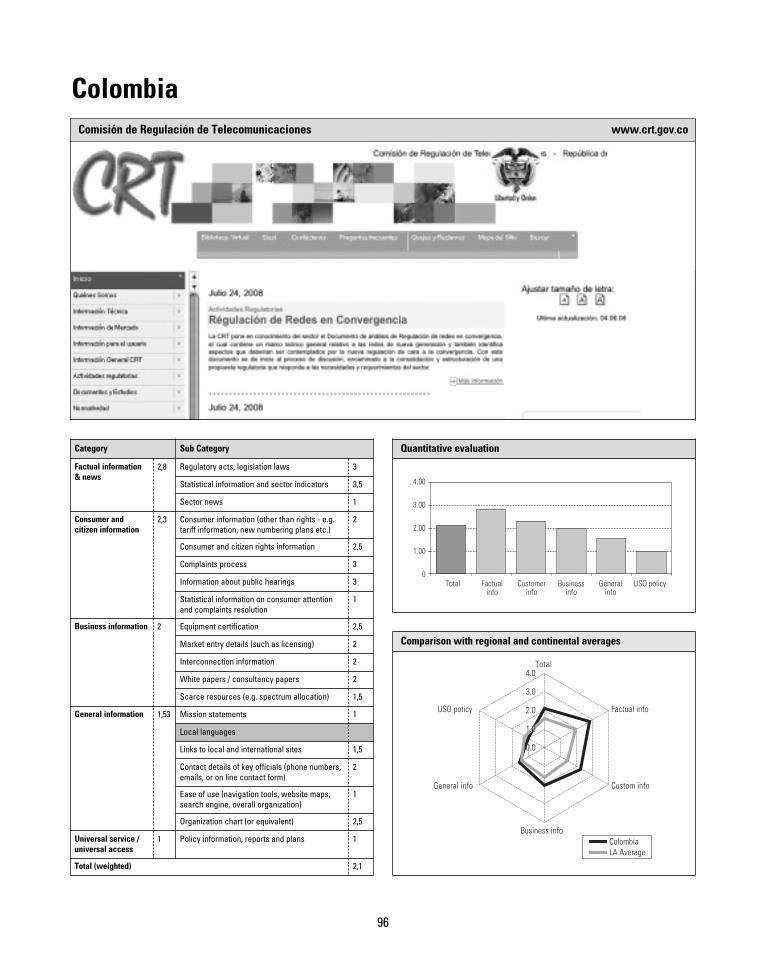
96
ColombiaComisión de Regulación de Telecomunicaciones www.crt.gov.co
Quantitative evaluation
Total Factualinfo
Customerinfo
Businessinfo
Generalinfo
USO policy0
1.00
2.00
3.00
4.00
Comparison with regional and continental averages
ColombiaLA Average
Total
Factual info
Custom info
Business info
General info
USO policy
0.0
1.0
2.0
3.0
4.0
Category Sub Category
Factual information& news
2,8 Regulatory acts, legislation laws 3
Statistical information and sector indicators 3,5
Sector news 1
Consumer andcitizen information
2,3 Consumer information (other than rights - e.g.tariff information, new numbering plans etc.)
2
Consumer and citizen rights information 2,5
Complaints process 3
Information about public hearings 3
Statistical information on consumer attentionand complaints resolution
1
Business information 2 Equipment certification 2,5
Market entry details (such as licensing) 2
Interconnection information 2
White papers / consultancy papers 2
Scarce resources (e.g. spectrum allocation) 1,5
General information 1,53 Mission statements 1
Local languages
Links to local and international sites 1,5
Contact details of key officials (phone numbers,emails, or on line contact form)
2
Ease of use (navigation tools, website maps,search engine, overall organization)
1
Organization chart (or equivalent) 2,5
Universal service /universal access
1 Policy information, reports and plans 1
Total (weighted) 2,1
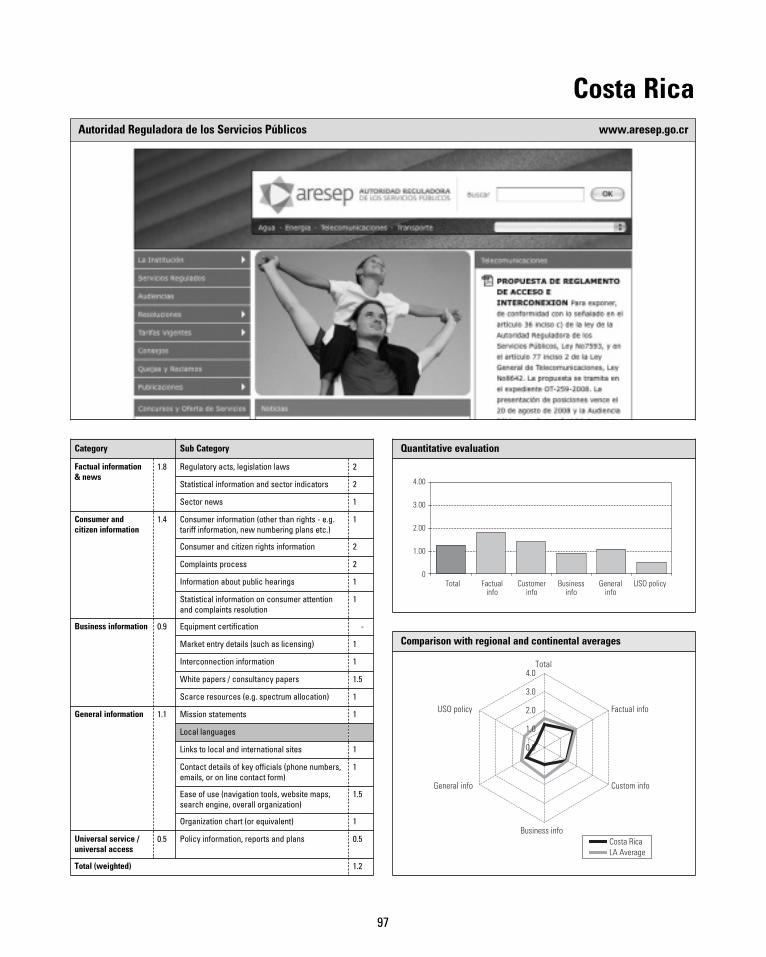
97
Costa RicaAutoridad Reguladora de los Servicios Públicos www.aresep.go.cr
Quantitative evaluation
Total Factualinfo
Customerinfo
Businessinfo
Generalinfo
USO policy0
1.00
2.00
3.00
4.00
Comparison with regional and continental averages
Costa RicaLA Average
Total
Factual info
Custom info
Business info
General info
USO policy
0.0
1.0
2.0
3.0
4.0
Category Sub Category
Factual information& news
1.8 Regulatory acts, legislation laws 2
Statistical information and sector indicators 2
Sector news 1
Consumer andcitizen information
1.4 Consumer information (other than rights - e.g.tariff information, new numbering plans etc.)
1
Consumer and citizen rights information 2
Complaints process 2
Information about public hearings 1
Statistical information on consumer attentionand complaints resolution
1
Business information 0.9 Equipment certification -
Market entry details (such as licensing) 1
Interconnection information 1
White papers / consultancy papers 1.5
Scarce resources (e.g. spectrum allocation) 1
General information 1.1 Mission statements 1
Local languages
Links to local and international sites 1
Contact details of key officials (phone numbers,emails, or on line contact form)
1
Ease of use (navigation tools, website maps,search engine, overall organization)
1.5
Organization chart (or equivalent) 1
Universal service /universal access
0.5 Policy information, reports and plans 0.5
Total (weighted) 1.2
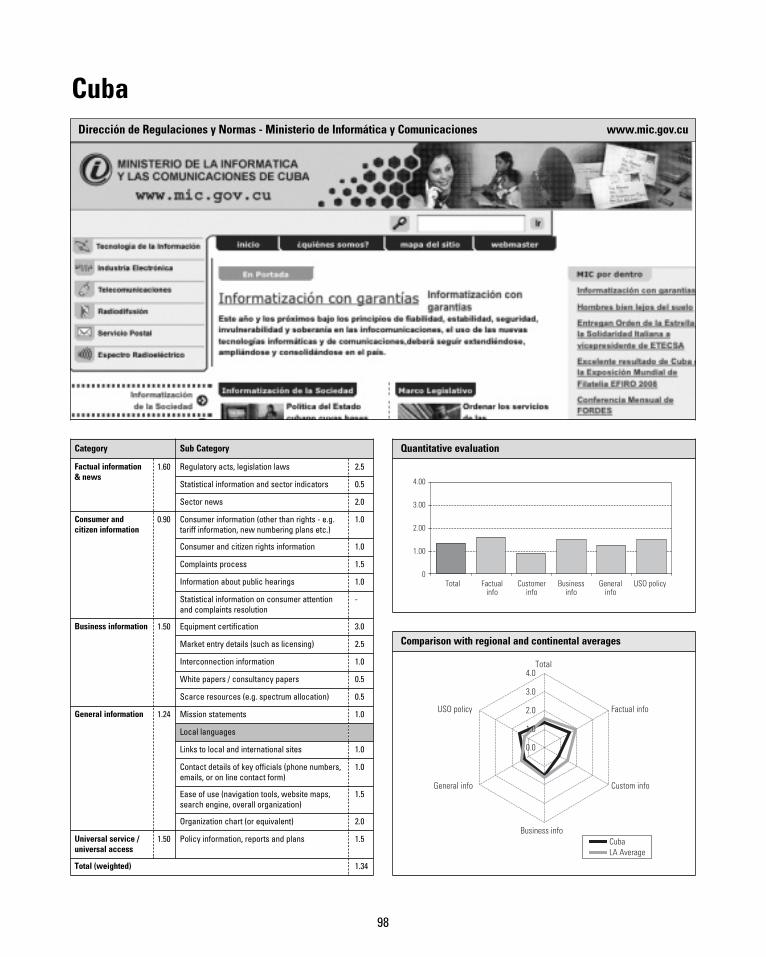
98
Cuba
Quantitative evaluation
Total Factualinfo
Customerinfo
Businessinfo
Generalinfo
USO policy0
1.00
2.00
3.00
4.00
Comparison with regional and continental averages
CubaLA Average
Total
Factual info
Custom info
Business info
General info
USO policy
0.0
1.0
2.0
3.0
4.0
Category Sub Category
Factual information& news
1.60 Regulatory acts, legislation laws 2.5
Statistical information and sector indicators 0.5
Sector news 2.0
Consumer andcitizen information
0.90 Consumer information (other than rights - e.g.tariff information, new numbering plans etc.)
1.0
Consumer and citizen rights information 1.0
Complaints process 1.5
Information about public hearings 1.0
Statistical information on consumer attentionand complaints resolution
-
Business information 1.50 Equipment certification 3.0
Market entry details (such as licensing) 2.5
Interconnection information 1.0
White papers / consultancy papers 0.5
Scarce resources (e.g. spectrum allocation) 0.5
General information 1.24 Mission statements 1.0
Local languages
Links to local and international sites 1.0
Contact details of key officials (phone numbers,emails, or on line contact form)
1.0
Ease of use (navigation tools, website maps,search engine, overall organization)
1.5
Organization chart (or equivalent) 2.0
Universal service /universal access
1.50 Policy information, reports and plans 1.5
Total (weighted) 1.34
Dirección de Regulaciones y Normas - Ministerio de Informática y Comunicaciones www.mic.gov.cu
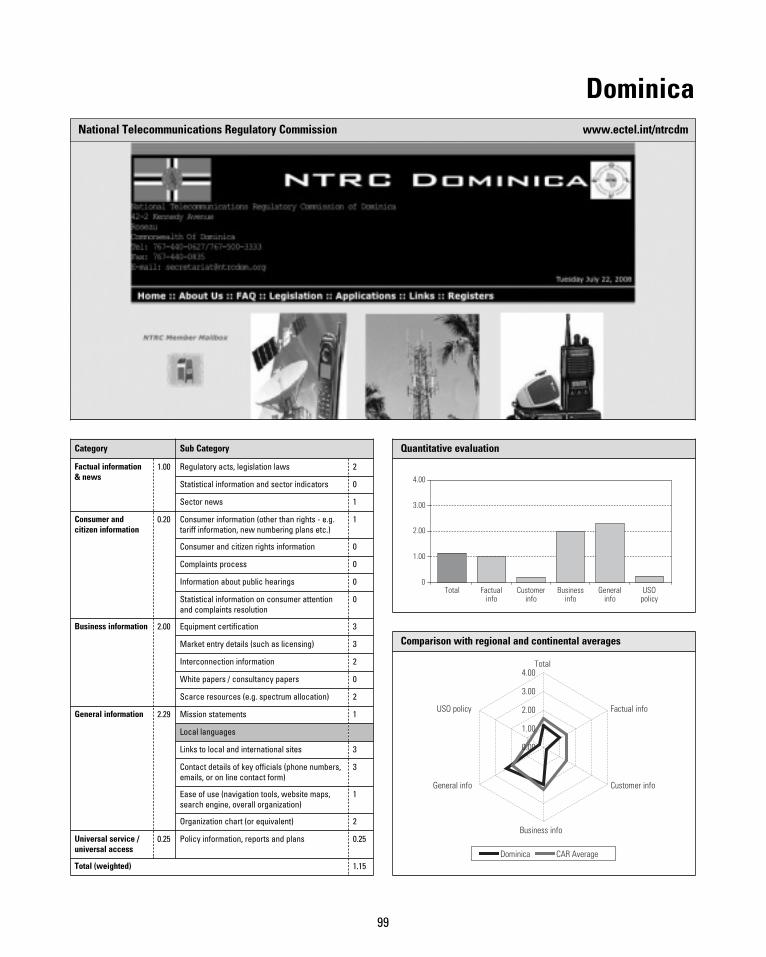
99
DominicaNational Telecommunications Regulatory Commission www.ectel.int/ntrcdm
Quantitative evaluation
Total Factualinfo
Customerinfo
Businessinfo
Generalinfo
USOpolicy
0
1.00
2.00
3.00
4.00
Comparison with regional and continental averages
Dominica CAR Average
0.00
1.00
2.00
3.00
4.00Total
Factual info
Customer info
Business info
General info
USO policy
0
Category Sub Category
Factual information& news
1.00 Regulatory acts, legislation laws 2
Statistical information and sector indicators 0
Sector news 1
Consumer andcitizen information
0.20 Consumer information (other than rights - e.g.tariff information, new numbering plans etc.)
1
Consumer and citizen rights information 0
Complaints process 0
Information about public hearings 0
Statistical information on consumer attentionand complaints resolution
0
Business information 2.00 Equipment certification 3
Market entry details (such as licensing) 3
Interconnection information 2
White papers / consultancy papers 0
Scarce resources (e.g. spectrum allocation) 2
General information 2.29 Mission statements 1
Local languages
Links to local and international sites 3
Contact details of key officials (phone numbers,emails, or on line contact form)
3
Ease of use (navigation tools, website maps,search engine, overall organization)
1
Organization chart (or equivalent) 2
Universal service /universal access
0.25 Policy information, reports and plans 0.25
Total (weighted) 1.15
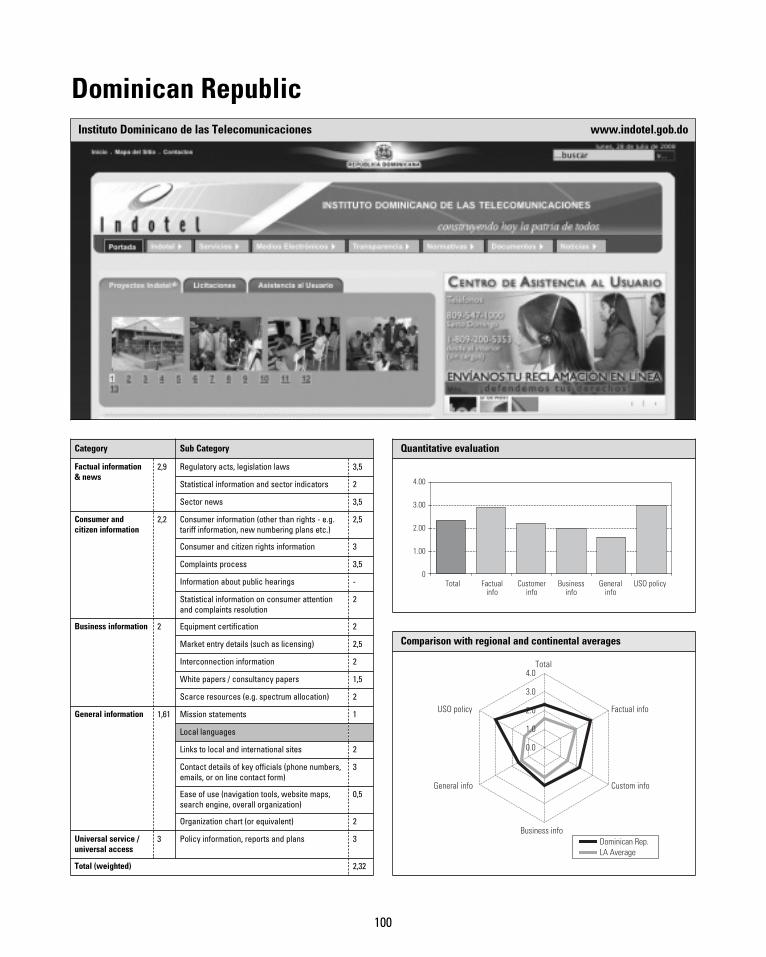
100
Dominican RepublicInstituto Dominicano de las Telecomunicaciones www.indotel.gob.do
Quantitative evaluation
Total Factualinfo
Customerinfo
Businessinfo
Generalinfo
USO policy0
1.00
2.00
3.00
4.00
Comparison with regional and continental averages
Dominican Rep.LA Average
Total
Factual info
Custom info
Business info
General info
USO policy
0.0
1.0
2.0
3.0
4.0
Category Sub Category
Factual information& news
2,9 Regulatory acts, legislation laws 3,5
Statistical information and sector indicators 2
Sector news 3,5
Consumer andcitizen information
2,2 Consumer information (other than rights - e.g.tariff information, new numbering plans etc.)
2,5
Consumer and citizen rights information 3
Complaints process 3,5
Information about public hearings -
Statistical information on consumer attentionand complaints resolution
2
Business information 2 Equipment certification 2
Market entry details (such as licensing) 2,5
Interconnection information 2
White papers / consultancy papers 1,5
Scarce resources (e.g. spectrum allocation) 2
General information 1,61 Mission statements 1
Local languages
Links to local and international sites 2
Contact details of key officials (phone numbers,emails, or on line contact form)
3
Ease of use (navigation tools, website maps,search engine, overall organization)
0,5
Organization chart (or equivalent) 2
Universal service /universal access
3 Policy information, reports and plans 3
Total (weighted) 2,32
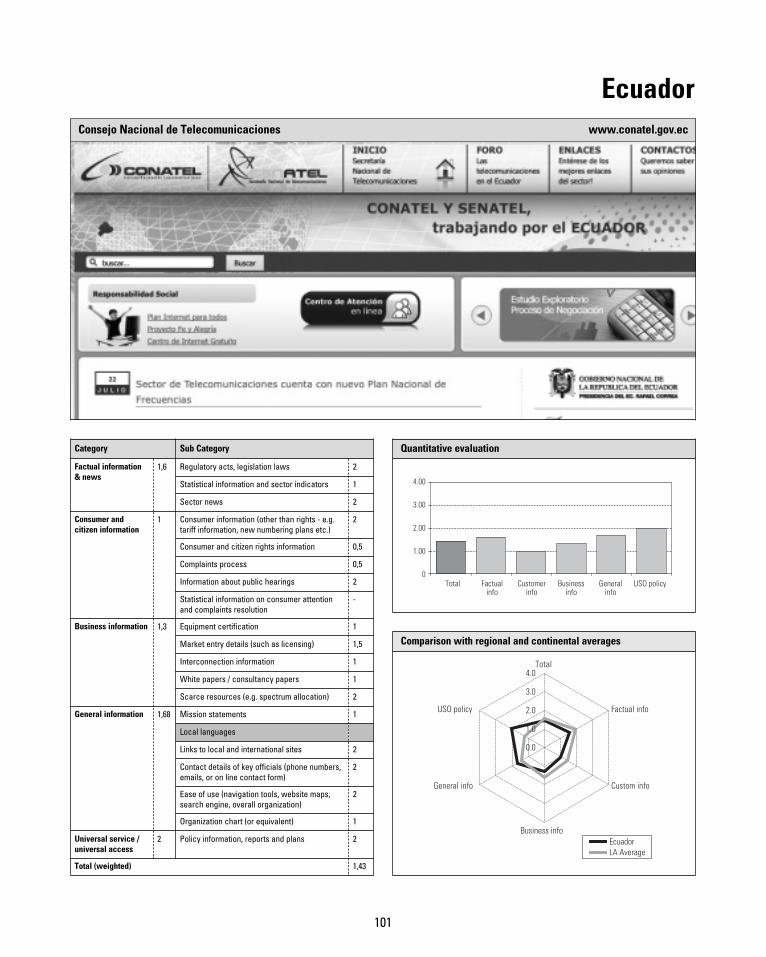
101
EcuadorConsejo Nacional de Telecomunicaciones www.conatel.gov.ec
Quantitative evaluation
Total Factualinfo
Customerinfo
Businessinfo
Generalinfo
USO policy0
1.00
2.00
3.00
4.00
Comparison with regional and continental averages
EcuadorLA Average
Total
Factual info
Custom info
Business info
General info
USO policy
0.0
1.0
2.0
3.0
4.0
Category Sub Category
Factual information& news
1,6 Regulatory acts, legislation laws 2
Statistical information and sector indicators 1
Sector news 2
Consumer andcitizen information
1 Consumer information (other than rights - e.g.tariff information, new numbering plans etc.)
2
Consumer and citizen rights information 0,5
Complaints process 0,5
Information about public hearings 2
Statistical information on consumer attentionand complaints resolution
-
Business information 1,3 Equipment certification 1
Market entry details (such as licensing) 1,5
Interconnection information 1
White papers / consultancy papers 1
Scarce resources (e.g. spectrum allocation) 2
General information 1,68 Mission statements 1
Local languages
Links to local and international sites 2
Contact details of key officials (phone numbers,emails, or on line contact form)
2
Ease of use (navigation tools, website maps,search engine, overall organization)
2
Organization chart (or equivalent) 1
Universal service /universal access
2 Policy information, reports and plans 2
Total (weighted) 1,43
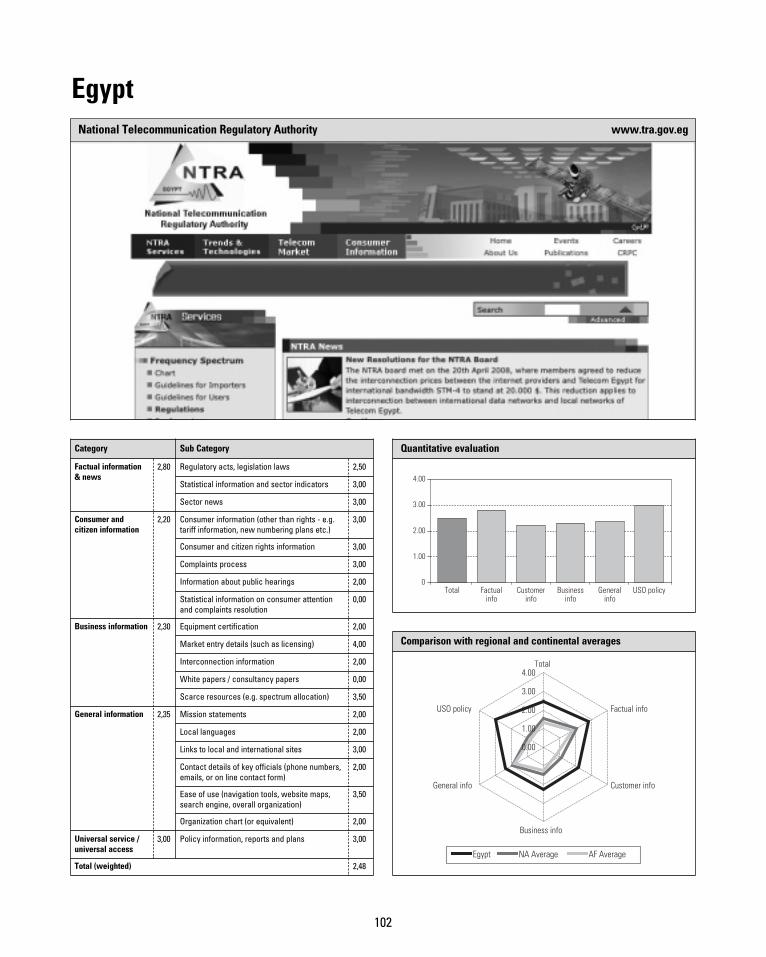
102
EgyptNational Telecommunication Regulatory Authority www.tra.gov.eg
Quantitative evaluation
Total Factualinfo
Customerinfo
Businessinfo
Generalinfo
USO policy0
1.00
2.00
3.00
4.00
Comparison with regional and continental averages
Egypt NA Average AF Average
0.00
1.00
2.00
3.00
4.00Total
Factual info
Customer info
Business info
General info
USO policy
Category Sub Category
Factual information& news
2,80 Regulatory acts, legislation laws 2,50
Statistical information and sector indicators 3,00
Sector news 3,00
Consumer andcitizen information
2,20 Consumer information (other than rights - e.g.tariff information, new numbering plans etc.)
3,00
Consumer and citizen rights information 3,00
Complaints process 3,00
Information about public hearings 2,00
Statistical information on consumer attentionand complaints resolution
0,00
Business information 2,30 Equipment certification 2,00
Market entry details (such as licensing) 4,00
Interconnection information 2,00
White papers / consultancy papers 0,00
Scarce resources (e.g. spectrum allocation) 3,50
General information 2,35 Mission statements 2,00
Local languages 2,00
Links to local and international sites 3,00
Contact details of key officials (phone numbers,emails, or on line contact form)
2,00
Ease of use (navigation tools, website maps,search engine, overall organization)
3,50
Organization chart (or equivalent) 2,00
Universal service /universal access
3,00 Policy information, reports and plans 3,00
Total (weighted) 2,48
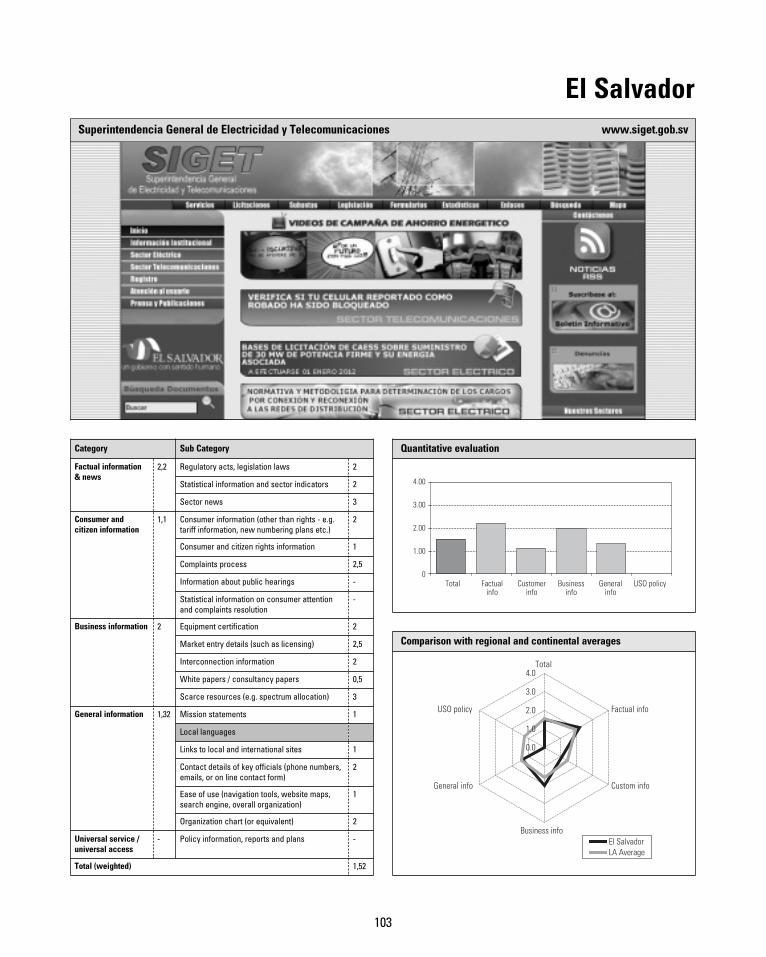
103
El SalvadorSuperintendencia General de Electricidad y Telecomunicaciones www.siget.gob.sv
Quantitative evaluation
Total Factualinfo
Customerinfo
Businessinfo
Generalinfo
USO policy0
1.00
2.00
3.00
4.00
Comparison with regional and continental averages
El SalvadorLA Average
Total
Factual info
Custom info
Business info
General info
USO policy
0.0
1.0
2.0
3.0
4.0
Category Sub Category
Factual information& news
2,2 Regulatory acts, legislation laws 2
Statistical information and sector indicators 2
Sector news 3
Consumer andcitizen information
1,1 Consumer information (other than rights - e.g.tariff information, new numbering plans etc.)
2
Consumer and citizen rights information 1
Complaints process 2,5
Information about public hearings -
Statistical information on consumer attentionand complaints resolution
-
Business information 2 Equipment certification 2
Market entry details (such as licensing) 2,5
Interconnection information 2
White papers / consultancy papers 0,5
Scarce resources (e.g. spectrum allocation) 3
General information 1,32 Mission statements 1
Local languages
Links to local and international sites 1
Contact details of key officials (phone numbers,emails, or on line contact form)
2
Ease of use (navigation tools, website maps,search engine, overall organization)
1
Organization chart (or equivalent) 2
Universal service /universal access
- Policy information, reports and plans -
Total (weighted) 1,52
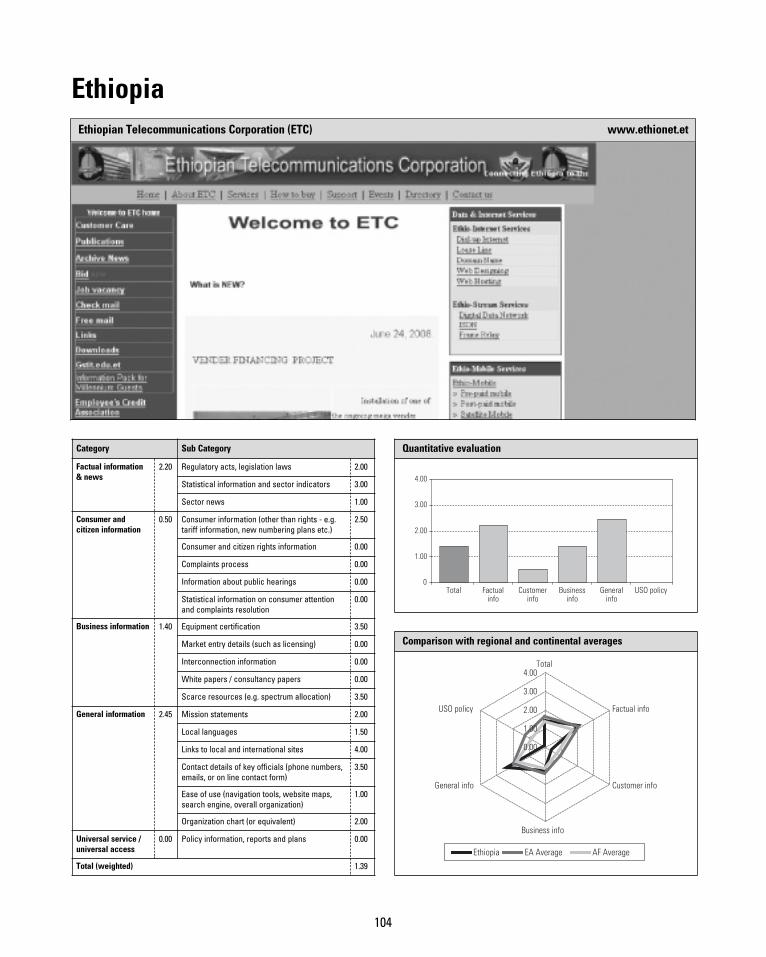
104
EthiopiaEthiopian Telecommunications Corporation (ETC) www.ethionet.et
Quantitative evaluation
Total Factualinfo
Customerinfo
Businessinfo
Generalinfo
USO policy0
1.00
2.00
3.00
4.00
Comparison with regional and continental averages
Ethiopia EA Average AF Average
0.00
1.00
2.00
3.00
4.00Total
Factual info
Customer info
Business info
General info
USO policy
0
Category Sub Category
Factual information& news
2.20 Regulatory acts, legislation laws 2.00
Statistical information and sector indicators 3.00
Sector news 1.00
Consumer andcitizen information
0.50 Consumer information (other than rights - e.g.tariff information, new numbering plans etc.)
2.50
Consumer and citizen rights information 0.00
Complaints process 0.00
Information about public hearings 0.00
Statistical information on consumer attentionand complaints resolution
0.00
Business information 1.40 Equipment certification 3.50
Market entry details (such as licensing) 0.00
Interconnection information 0.00
White papers / consultancy papers 0.00
Scarce resources (e.g. spectrum allocation) 3.50
General information 2.45 Mission statements 2.00
Local languages 1.50
Links to local and international sites 4.00
Contact details of key officials (phone numbers,emails, or on line contact form)
3.50
Ease of use (navigation tools, website maps,search engine, overall organization)
1.00
Organization chart (or equivalent) 2.00
Universal service /universal access
0.00 Policy information, reports and plans 0.00
Total (weighted) 1.39
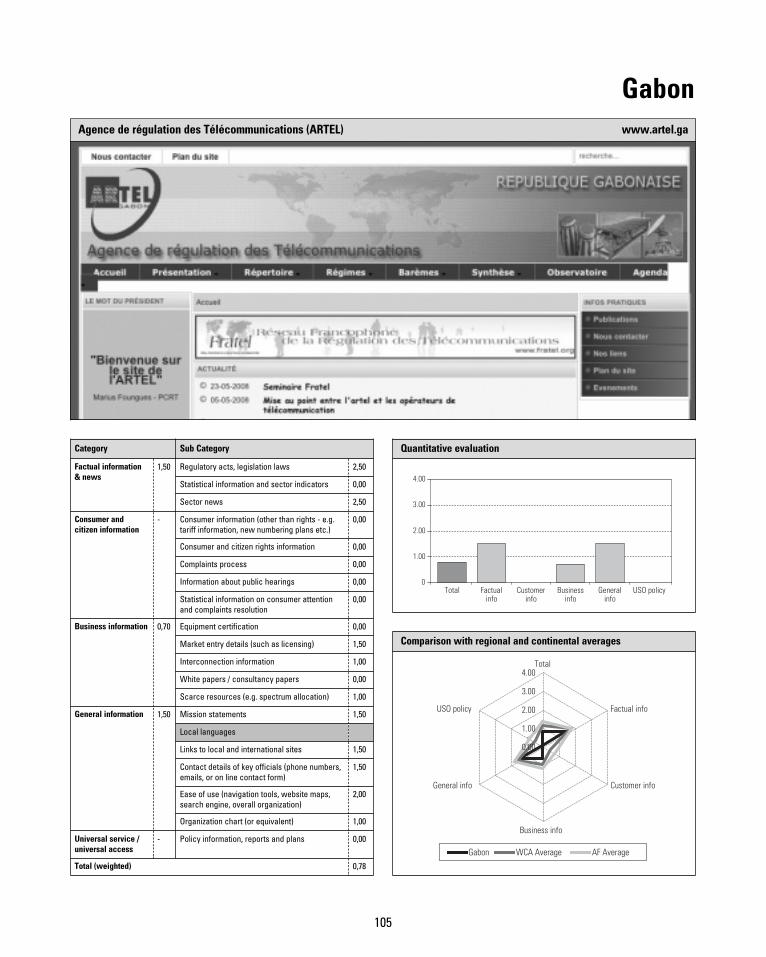
105
GabonAgence de régulation des Télécommunications (ARTEL) www.artel.ga
Quantitative evaluation
Total Factualinfo
Customerinfo
Businessinfo
Generalinfo
USO policy0
1.00
2.00
3.00
4.00
Comparison with regional and continental averages
Gabon WCA Average AF Average
0.00
1.00
2.00
3.00
4.00Total
Factual info
Customer info
Business info
General info
USO policy
0
Category Sub Category
Factual information& news
1,50 Regulatory acts, legislation laws 2,50
Statistical information and sector indicators 0,00
Sector news 2,50
Consumer andcitizen information
- Consumer information (other than rights - e.g.tariff information, new numbering plans etc.)
0,00
Consumer and citizen rights information 0,00
Complaints process 0,00
Information about public hearings 0,00
Statistical information on consumer attentionand complaints resolution
0,00
Business information 0,70 Equipment certification 0,00
Market entry details (such as licensing) 1,50
Interconnection information 1,00
White papers / consultancy papers 0,00
Scarce resources (e.g. spectrum allocation) 1,00
General information 1,50 Mission statements 1,50
Local languages
Links to local and international sites 1,50
Contact details of key officials (phone numbers,emails, or on line contact form)
1,50
Ease of use (navigation tools, website maps,search engine, overall organization)
2,00
Organization chart (or equivalent) 1,00
Universal service /universal access
- Policy information, reports and plans 0,00
Total (weighted) 0,78
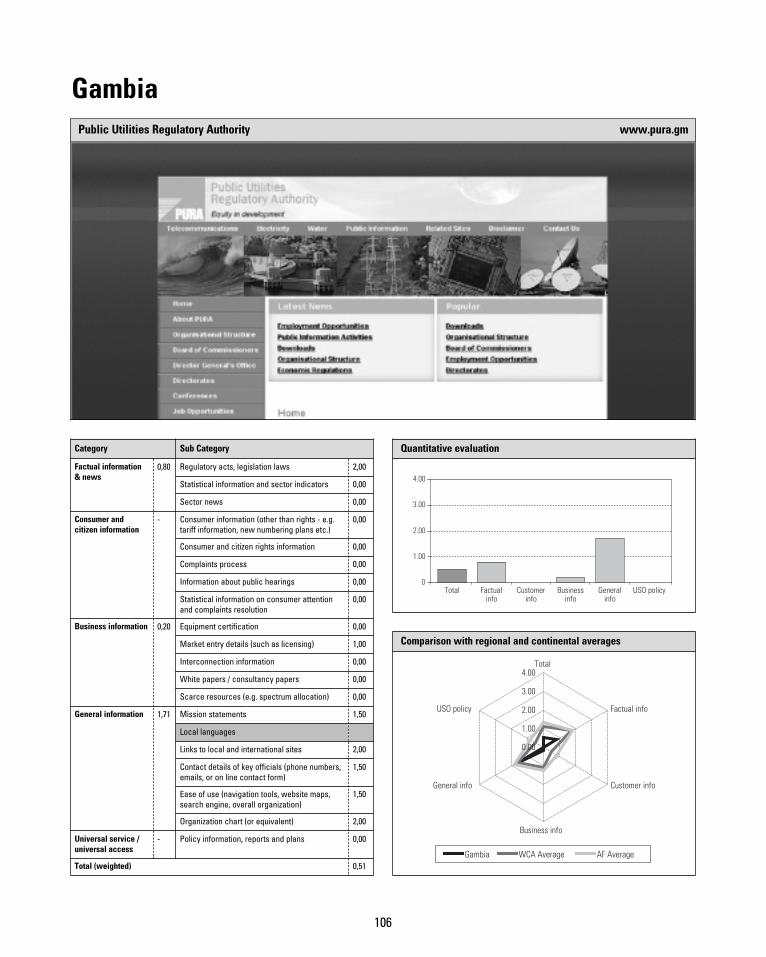
106
GambiaPublic Utilities Regulatory Authority www.pura.gm
Quantitative evaluation
Total Factualinfo
Customerinfo
Businessinfo
Generalinfo
USO policy0
1.00
2.00
3.00
4.00
Comparison with regional and continental averages
Gambia WCA Average AF Average
0.00
1.00
2.00
3.00
4.00Total
Factual info
Customer info
Business info
General info
USO policy
0
Category Sub Category
Factual information& news
0,80 Regulatory acts, legislation laws 2,00
Statistical information and sector indicators 0,00
Sector news 0,00
Consumer andcitizen information
- Consumer information (other than rights - e.g.tariff information, new numbering plans etc.)
0,00
Consumer and citizen rights information 0,00
Complaints process 0,00
Information about public hearings 0,00
Statistical information on consumer attentionand complaints resolution
0,00
Business information 0,20 Equipment certification 0,00
Market entry details (such as licensing) 1,00
Interconnection information 0,00
White papers / consultancy papers 0,00
Scarce resources (e.g. spectrum allocation) 0,00
General information 1,71 Mission statements 1,50
Local languages
Links to local and international sites 2,00
Contact details of key officials (phone numbers,emails, or on line contact form)
1,50
Ease of use (navigation tools, website maps,search engine, overall organization)
1,50
Organization chart (or equivalent) 2,00
Universal service /universal access
- Policy information, reports and plans 0,00
Total (weighted) 0,51
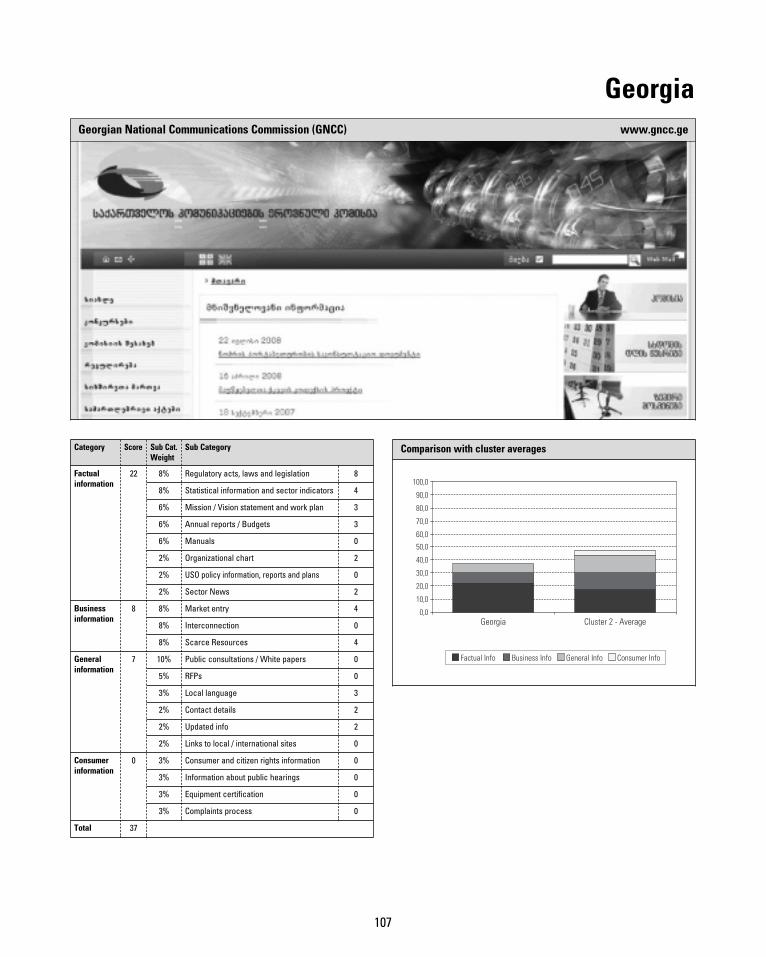
107
GeorgiaGeorgian National Communications Commission (GNCC) www.gncc.ge
Category Score Sub Cat.Weight
Sub Category
Factualinformation
22 8% Regulatory acts, laws and legislation 8
8% Statistical information and sector indicators 4
6% Mission / Vision statement and work plan 3
6% Annual reports / Budgets 3
6% Manuals 0
2% Organizational chart 2
2% USO policy information, reports and plans 0
2% Sector News 2
Businessinformation
8 8% Market entry 4
8% Interconnection 0
8% Scarce Resources 4
Generalinformation
7 10% Public consultations / White papers 0
5% RFPs 0
3% Local language 3
2% Contact details 2
2% Updated info 2
2% Links to local / international sites 0
Consumerinformation
0 3% Consumer and citizen rights information 0
3% Information about public hearings 0
3% Equipment certification 0
3% Complaints process 0
Total 37
Comparison with cluster averages
0,0
10,0
20,0
30,0
40,0
50,0
60,0
70,0
80,0
90,0
100,0
0Georgia Cluster 2 - Average
Factual Info Business Info General Info Consumer Info
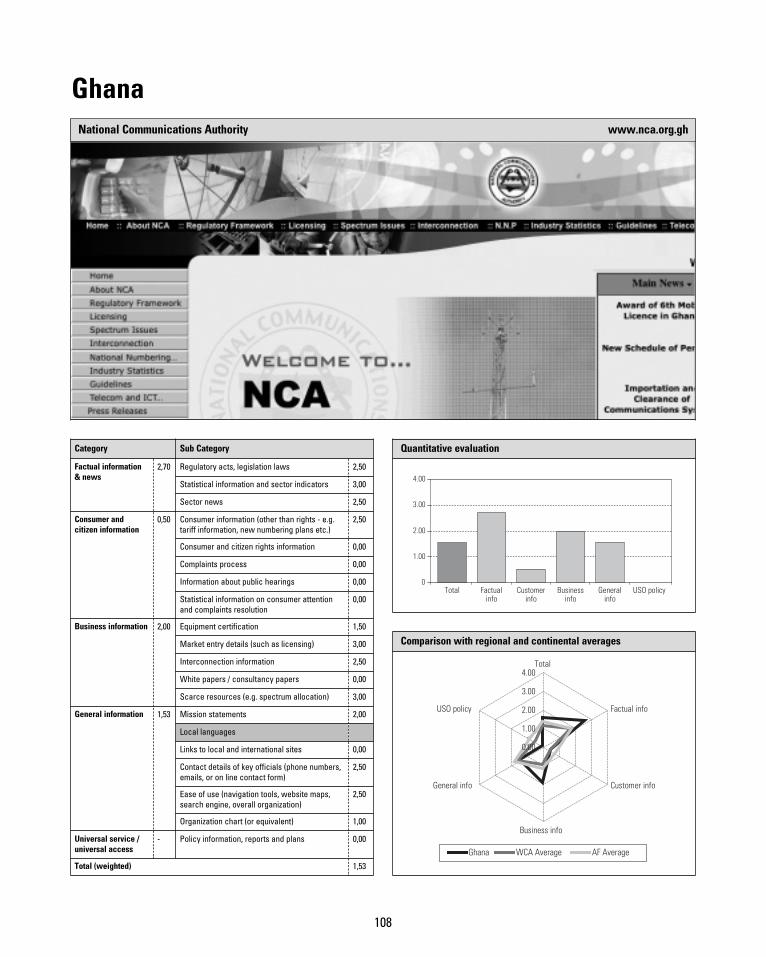
108
GhanaNational Communications Authority www.nca.org.gh
Quantitative evaluation
Total Factualinfo
Customerinfo
Businessinfo
Generalinfo
USO policy0
1.00
2.00
3.00
4.00
Comparison with regional and continental averages
Ghana WCA Average AF Average
0.00
1.00
2.00
3.00
4.00Total
Factual info
Customer info
Business info
General info
USO policy
0
Category Sub Category
Factual information& news
2,70 Regulatory acts, legislation laws 2,50
Statistical information and sector indicators 3,00
Sector news 2,50
Consumer andcitizen information
0,50 Consumer information (other than rights - e.g.tariff information, new numbering plans etc.)
2,50
Consumer and citizen rights information 0,00
Complaints process 0,00
Information about public hearings 0,00
Statistical information on consumer attentionand complaints resolution
0,00
Business information 2,00 Equipment certification 1,50
Market entry details (such as licensing) 3,00
Interconnection information 2,50
White papers / consultancy papers 0,00
Scarce resources (e.g. spectrum allocation) 3,00
General information 1,53 Mission statements 2,00
Local languages
Links to local and international sites 0,00
Contact details of key officials (phone numbers,emails, or on line contact form)
2,50
Ease of use (navigation tools, website maps,search engine, overall organization)
2,50
Organization chart (or equivalent) 1,00
Universal service /universal access
- Policy information, reports and plans 0,00
Total (weighted) 1,53
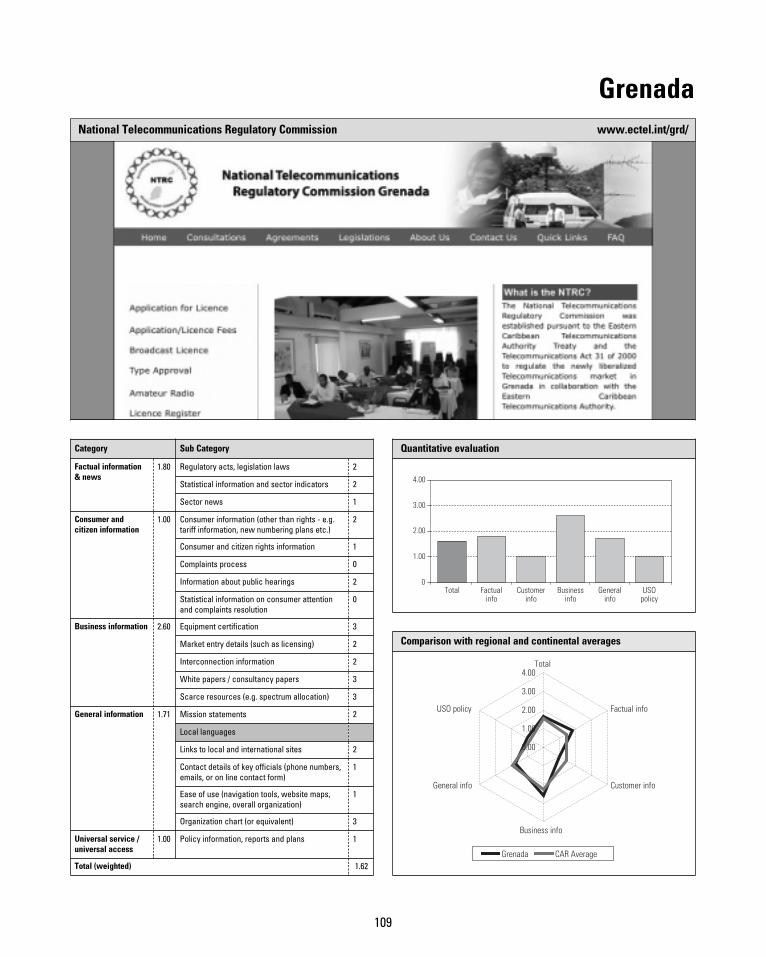
109
GrenadaNational Telecommunications Regulatory Commission www.ectel.int/grd/
Quantitative evaluation
Total Factualinfo
Customerinfo
Businessinfo
Generalinfo
USOpolicy
0
1.00
2.00
3.00
4.00
Comparison with regional and continental averages
Grenada CAR Average
0.00
1.00
2.00
3.00
4.00Total
Factual info
Customer info
Business info
General info
USO policy
0
Category Sub Category
Factual information& news
1.80 Regulatory acts, legislation laws 2
Statistical information and sector indicators 2
Sector news 1
Consumer andcitizen information
1.00 Consumer information (other than rights - e.g.tariff information, new numbering plans etc.)
2
Consumer and citizen rights information 1
Complaints process 0
Information about public hearings 2
Statistical information on consumer attentionand complaints resolution
0
Business information 2.60 Equipment certification 3
Market entry details (such as licensing) 2
Interconnection information 2
White papers / consultancy papers 3
Scarce resources (e.g. spectrum allocation) 3
General information 1.71 Mission statements 2
Local languages
Links to local and international sites 2
Contact details of key officials (phone numbers,emails, or on line contact form)
1
Ease of use (navigation tools, website maps,search engine, overall organization)
1
Organization chart (or equivalent) 3
Universal service /universal access
1.00 Policy information, reports and plans 1
Total (weighted) 1.62
110
GuatemalaSuperintendencia de Telecomunicaciones www.sit.gob.gt
Quantitative evaluation
Total Factualinfo
Customerinfo
Businessinfo
Generalinfo
USO policy0
1.00
2.00
3.00
4.00
Comparison with regional and continental averages
GuatemalaLA Average
Total
Factual info
Custom info
Business info
General info
USO policy
0.0
1.0
2.0
3.0
4.0
Category Sub Category
Factual information& news
- Regulatory acts, legislation laws -
Statistical information and sector indicators -
Sector news -
Consumer andcitizen information
- Consumer information (other than rights - e.g.tariff information, new numbering plans etc.)
-
Consumer and citizen rights information -
Complaints process -
Information about public hearings -
Statistical information on consumer attentionand complaints resolution
-
Business information - Equipment certification -
Market entry details (such as licensing) -
Interconnection information -
White papers / consultancy papers -
Scarce resources (e.g. spectrum allocation) -
General information - Mission statements -
Local languages -
Links to local and international sites -
Contact details of key officials (phone numbers,emails, or on line contact form)
-
Ease of use (navigation tools, website maps,search engine, overall organization)
-
Organization chart (or equivalent) -
Universal service /universal access
- Policy information, reports and plans -
Total (weighted) -
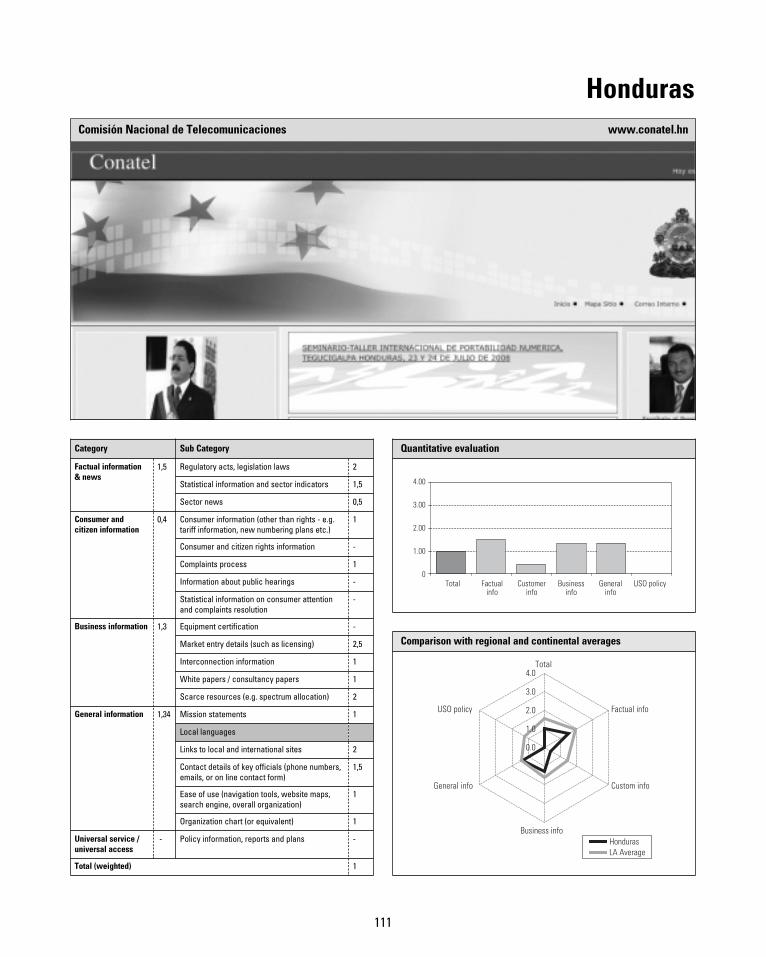
111
HondurasComisión Nacional de Telecomunicaciones www.conatel.hn
Quantitative evaluation
Total Factualinfo
Customerinfo
Businessinfo
Generalinfo
USO policy0
1.00
2.00
3.00
4.00
Comparison with regional and continental averages
HondurasLA Average
Total
Factual info
Custom info
Business info
General info
USO policy
0.0
1.0
2.0
3.0
4.0
Category Sub Category
Factual information& news
1,5 Regulatory acts, legislation laws 2
Statistical information and sector indicators 1,5
Sector news 0,5
Consumer andcitizen information
0,4 Consumer information (other than rights - e.g.tariff information, new numbering plans etc.)
1
Consumer and citizen rights information -
Complaints process 1
Information about public hearings -
Statistical information on consumer attentionand complaints resolution
-
Business information 1,3 Equipment certification -
Market entry details (such as licensing) 2,5
Interconnection information 1
White papers / consultancy papers 1
Scarce resources (e.g. spectrum allocation) 2
General information 1,34 Mission statements 1
Local languages
Links to local and international sites 2
Contact details of key officials (phone numbers,emails, or on line contact form)
1,5
Ease of use (navigation tools, website maps,search engine, overall organization)
1
Organization chart (or equivalent) 1
Universal service /universal access
- Policy information, reports and plans -
Total (weighted) 1
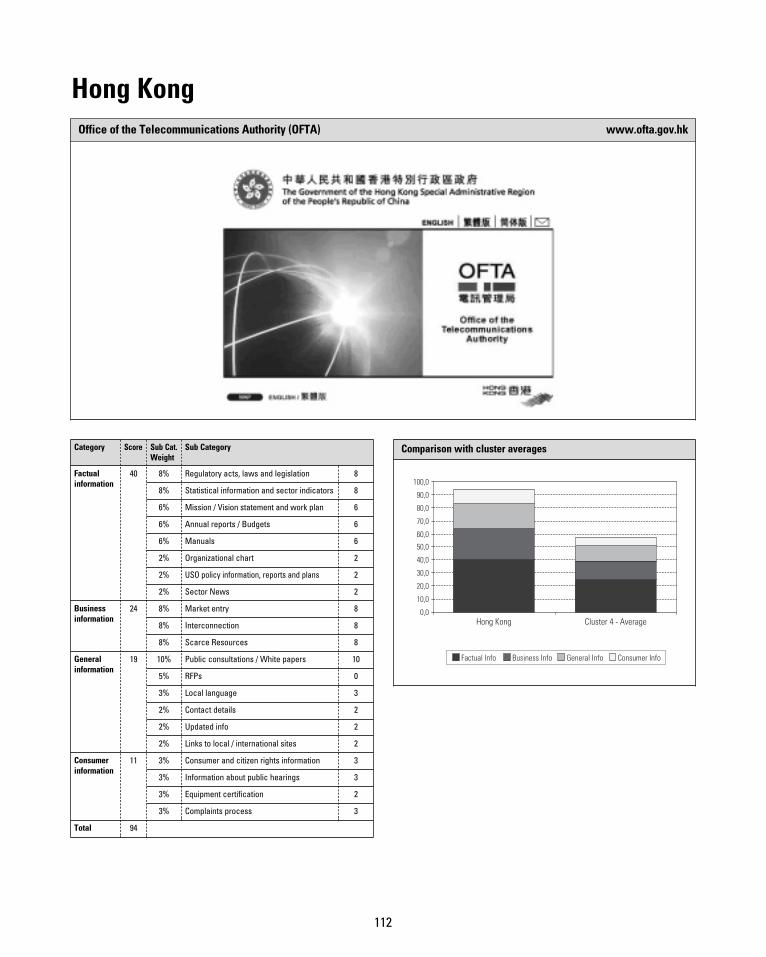
112
Hong KongOffice of the Telecommunications Authority (OFTA) www.ofta.gov.hk
Category Score Sub Cat.Weight
Sub Category
Factualinformation
40 8% Regulatory acts, laws and legislation 8
8% Statistical information and sector indicators 8
6% Mission / Vision statement and work plan 6
6% Annual reports / Budgets 6
6% Manuals 6
2% Organizational chart 2
2% USO policy information, reports and plans 2
2% Sector News 2
Businessinformation
24 8% Market entry 8
8% Interconnection 8
8% Scarce Resources 8
Generalinformation
19 10% Public consultations / White papers 10
5% RFPs 0
3% Local language 3
2% Contact details 2
2% Updated info 2
2% Links to local / international sites 2
Consumerinformation
11 3% Consumer and citizen rights information 3
3% Information about public hearings 3
3% Equipment certification 2
3% Complaints process 3
Total 94
Comparison with cluster averages
0,0
10,0
20,0
30,0
40,0
50,0
60,0
70,0
80,0
90,0
100,0
0
Hong Kong Cluster 4 - Average
Factual Info Business Info General Info Consumer Info
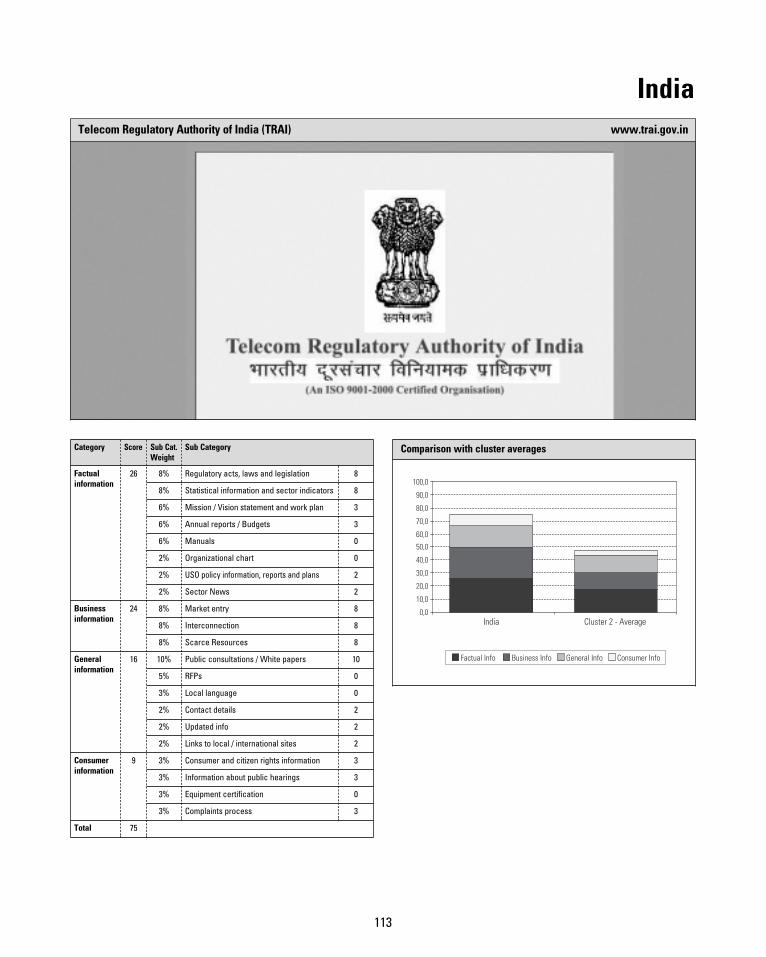
113
IndiaTelecom Regulatory Authority of India (TRAI) www.trai.gov.in
Category Score Sub Cat.Weight
Sub Category
Factualinformation
26 8% Regulatory acts, laws and legislation 8
8% Statistical information and sector indicators 8
6% Mission / Vision statement and work plan 3
6% Annual reports / Budgets 3
6% Manuals 0
2% Organizational chart 0
2% USO policy information, reports and plans 2
2% Sector News 2
Businessinformation
24 8% Market entry 8
8% Interconnection 8
8% Scarce Resources 8
Generalinformation
16 10% Public consultations / White papers 10
5% RFPs 0
3% Local language 0
2% Contact details 2
2% Updated info 2
2% Links to local / international sites 2
Consumerinformation
9 3% Consumer and citizen rights information 3
3% Information about public hearings 3
3% Equipment certification 0
3% Complaints process 3
Total 75
Comparison with cluster averages
0,0
10,0
20,0
30,0
40,0
50,0
60,0
70,0
80,0
90,0
100,0
0
India Cluster 2 - Average
Factual Info Business Info General Info Consumer Info
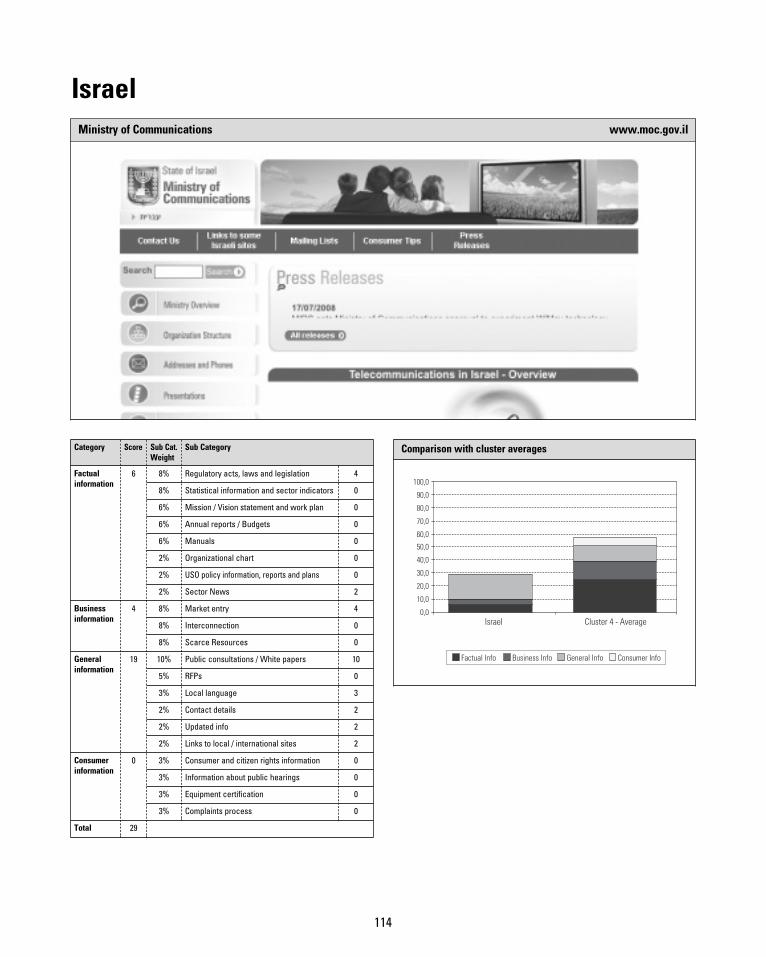
114
IsraelMinistry of Communications www.moc.gov.il
Category Score Sub Cat.Weight
Sub Category
Factualinformation
6 8% Regulatory acts, laws and legislation 4
8% Statistical information and sector indicators 0
6% Mission / Vision statement and work plan 0
6% Annual reports / Budgets 0
6% Manuals 0
2% Organizational chart 0
2% USO policy information, reports and plans 0
2% Sector News 2
Businessinformation
4 8% Market entry 4
8% Interconnection 0
8% Scarce Resources 0
Generalinformation
19 10% Public consultations / White papers 10
5% RFPs 0
3% Local language 3
2% Contact details 2
2% Updated info 2
2% Links to local / international sites 2
Consumerinformation
0 3% Consumer and citizen rights information 0
3% Information about public hearings 0
3% Equipment certification 0
3% Complaints process 0
Total 29
Comparison with cluster averages
0,0
10,0
20,0
30,0
40,0
50,0
60,0
70,0
80,0
90,0
100,0
0
Israel Cluster 4 - Average
Factual Info Business Info General Info Consumer Info
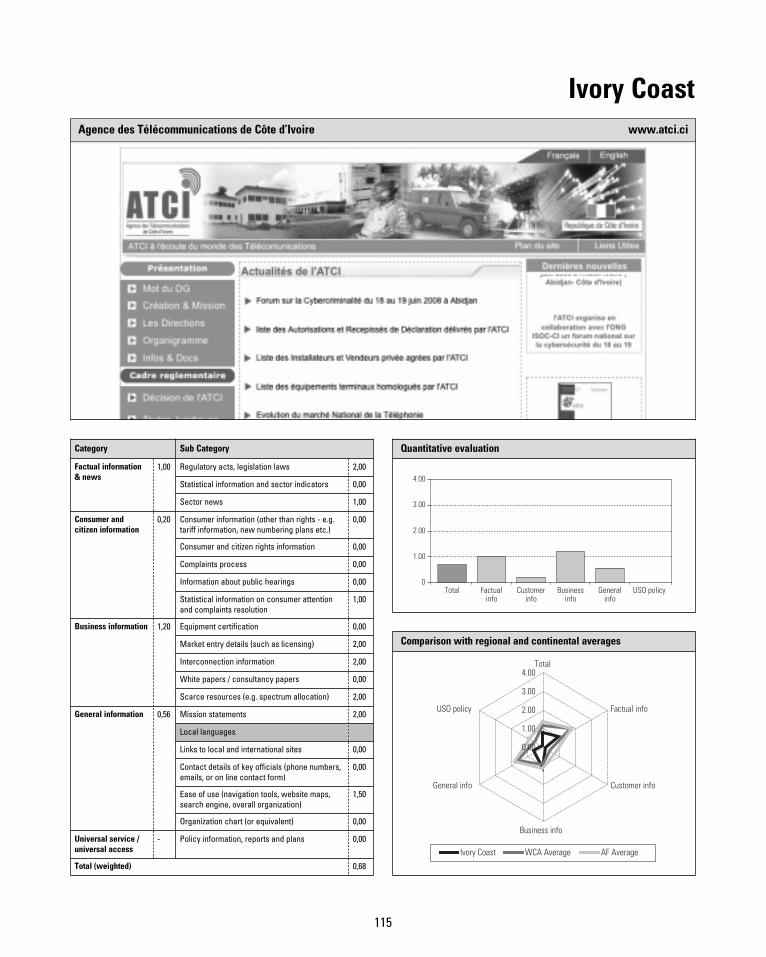
115
Ivory CoastAgence des Télécommunications de Côte d’Ivoire www.atci.ci
Quantitative evaluation
Total Factualinfo
Customerinfo
Businessinfo
Generalinfo
USO policy0
1.00
2.00
3.00
4.00
Comparison with regional and continental averages
Ivory Coast WCA Average AF Average
0.00
1.00
2.00
3.00
4.00Total
Factual info
Customer info
Business info
General info
USO policy
0
Category Sub Category
Factual information& news
1,00 Regulatory acts, legislation laws 2,00
Statistical information and sector indicators 0,00
Sector news 1,00
Consumer andcitizen information
0,20 Consumer information (other than rights - e.g.tariff information, new numbering plans etc.)
0,00
Consumer and citizen rights information 0,00
Complaints process 0,00
Information about public hearings 0,00
Statistical information on consumer attentionand complaints resolution
1,00
Business information 1,20 Equipment certification 0,00
Market entry details (such as licensing) 2,00
Interconnection information 2,00
White papers / consultancy papers 0,00
Scarce resources (e.g. spectrum allocation) 2,00
General information 0,56 Mission statements 2,00
Local languages
Links to local and international sites 0,00
Contact details of key officials (phone numbers,emails, or on line contact form)
0,00
Ease of use (navigation tools, website maps,search engine, overall organization)
1,50
Organization chart (or equivalent) 0,00
Universal service /universal access
- Policy information, reports and plans 0,00
Total (weighted) 0,68
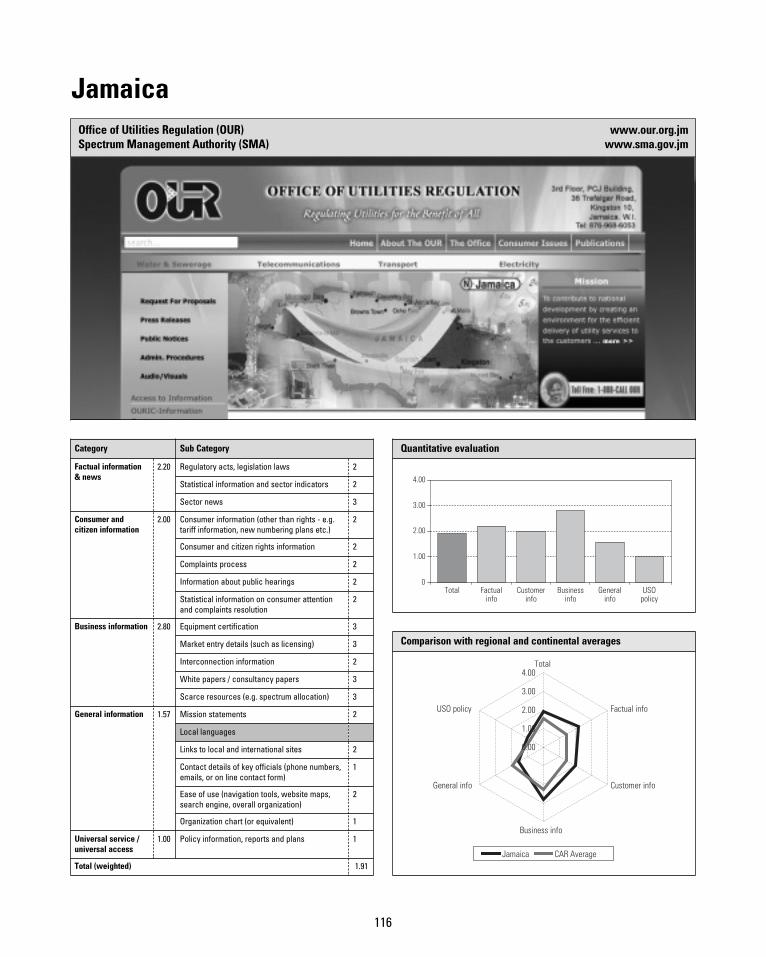
116
JamaicaOffice of Utilities Regulation (OUR) www.our.org.jmSpectrum Management Authority (SMA) www.sma.gov.jm
Quantitative evaluation
Total Factualinfo
Customerinfo
Businessinfo
Generalinfo
USOpolicy
0
1.00
2.00
3.00
4.00
Comparison with regional and continental averages
Jamaica CAR Average
0.00
1.00
2.00
3.00
4.00Total
Factual info
Customer info
Business info
General info
USO policy
0
Category Sub Category
Factual information& news
2.20 Regulatory acts, legislation laws 2
Statistical information and sector indicators 2
Sector news 3
Consumer andcitizen information
2.00 Consumer information (other than rights - e.g.tariff information, new numbering plans etc.)
2
Consumer and citizen rights information 2
Complaints process 2
Information about public hearings 2
Statistical information on consumer attentionand complaints resolution
2
Business information 2.80 Equipment certification 3
Market entry details (such as licensing) 3
Interconnection information 2
White papers / consultancy papers 3
Scarce resources (e.g. spectrum allocation) 3
General information 1.57 Mission statements 2
Local languages
Links to local and international sites 2
Contact details of key officials (phone numbers,emails, or on line contact form)
1
Ease of use (navigation tools, website maps,search engine, overall organization)
2
Organization chart (or equivalent) 1
Universal service /universal access
1.00 Policy information, reports and plans 1
Total (weighted) 1.91
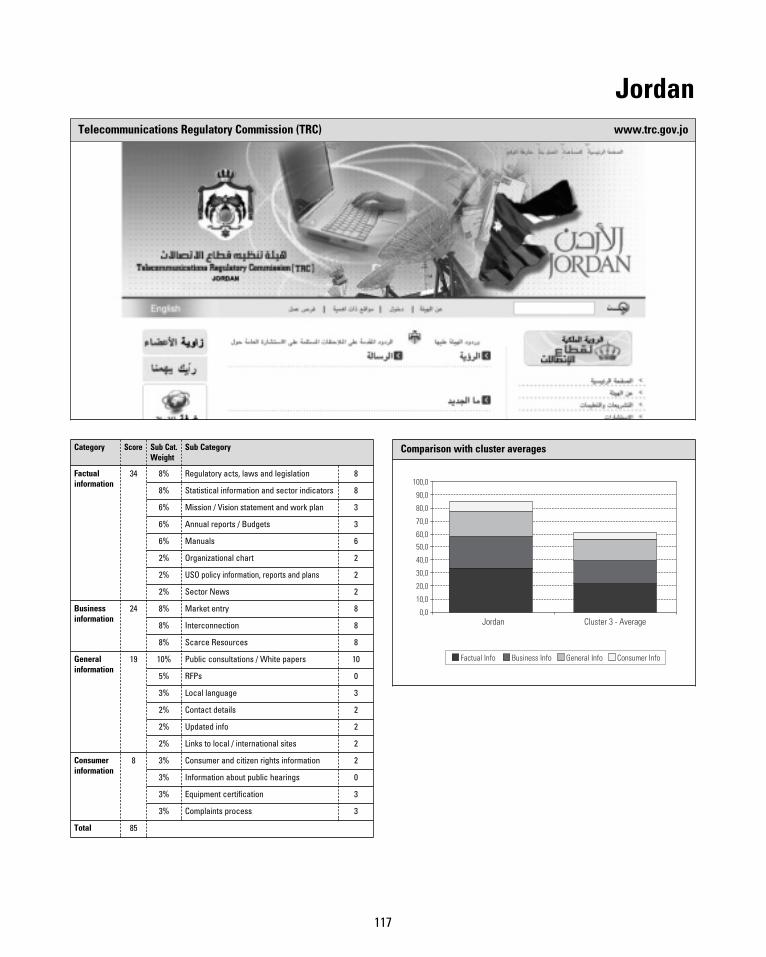
117
JordanTelecommunications Regulatory Commission (TRC) www.trc.gov.jo
Category Score Sub Cat.Weight
Sub Category
Factualinformation
34 8% Regulatory acts, laws and legislation 8
8% Statistical information and sector indicators 8
6% Mission / Vision statement and work plan 3
6% Annual reports / Budgets 3
6% Manuals 6
2% Organizational chart 2
2% USO policy information, reports and plans 2
2% Sector News 2
Businessinformation
24 8% Market entry 8
8% Interconnection 8
8% Scarce Resources 8
Generalinformation
19 10% Public consultations / White papers 10
5% RFPs 0
3% Local language 3
2% Contact details 2
2% Updated info 2
2% Links to local / international sites 2
Consumerinformation
8 3% Consumer and citizen rights information 2
3% Information about public hearings 0
3% Equipment certification 3
3% Complaints process 3
Total 85
Comparison with cluster averages
0,0
10,0
20,0
30,0
40,0
50,0
60,0
70,0
80,0
90,0
100,0
0
Jordan Cluster 3 - Average
Factual Info Business Info General Info Consumer Info
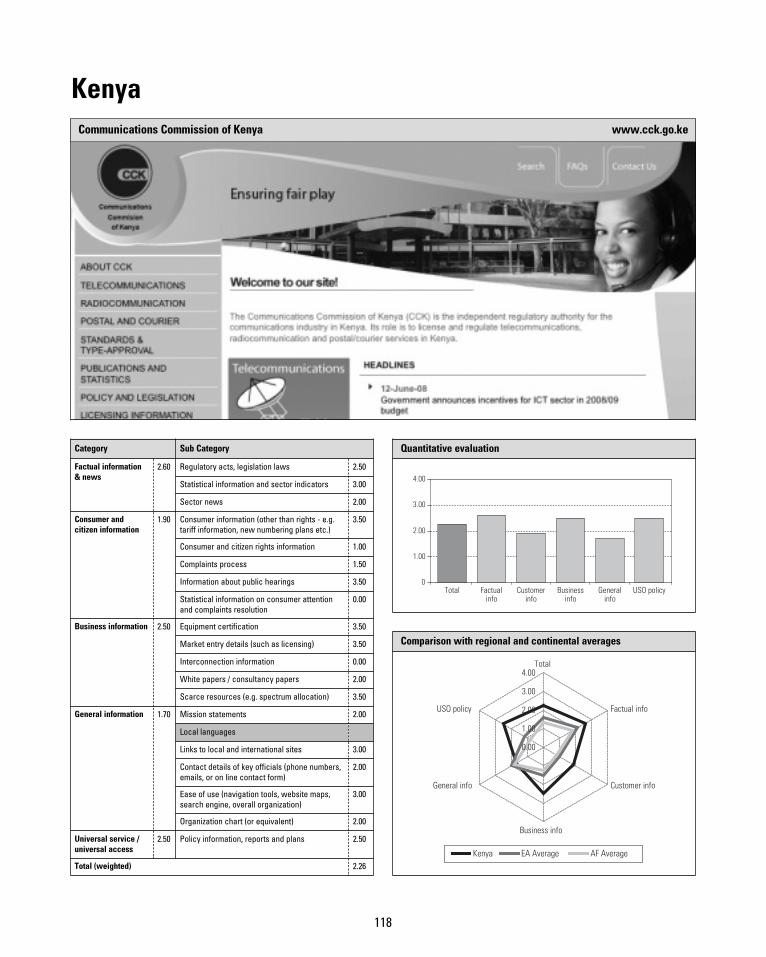
118
KenyaCommunications Commission of Kenya www.cck.go.ke
Quantitative evaluation
Total Factualinfo
Customerinfo
Businessinfo
Generalinfo
USO policy0
1.00
2.00
3.00
4.00
Comparison with regional and continental averages
Kenya EA Average AF Average
0.00
1.00
2.00
3.00
4.00Total
Factual info
Customer info
Business info
General info
USO policy
0
Category Sub Category
Factual information& news
2.60 Regulatory acts, legislation laws 2.50
Statistical information and sector indicators 3.00
Sector news 2.00
Consumer andcitizen information
1.90 Consumer information (other than rights - e.g.tariff information, new numbering plans etc.)
3.50
Consumer and citizen rights information 1.00
Complaints process 1.50
Information about public hearings 3.50
Statistical information on consumer attentionand complaints resolution
0.00
Business information 2.50 Equipment certification 3.50
Market entry details (such as licensing) 3.50
Interconnection information 0.00
White papers / consultancy papers 2.00
Scarce resources (e.g. spectrum allocation) 3.50
General information 1.70 Mission statements 2.00
Local languages
Links to local and international sites 3.00
Contact details of key officials (phone numbers,emails, or on line contact form)
2.00
Ease of use (navigation tools, website maps,search engine, overall organization)
3.00
Organization chart (or equivalent) 2.00
Universal service /universal access
2.50 Policy information, reports and plans 2.50
Total (weighted) 2.26
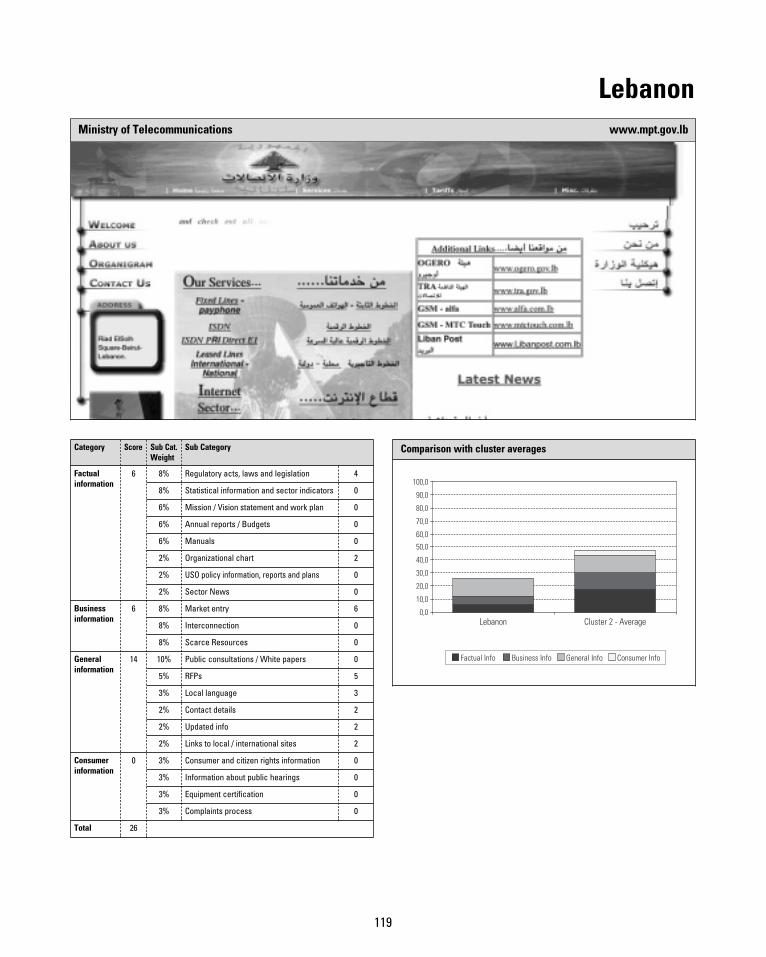
119
LebanonMinistry of Telecommunications www.mpt.gov.lb
Category Score Sub Cat.Weight
Sub Category
Factualinformation
6 8% Regulatory acts, laws and legislation 4
8% Statistical information and sector indicators 0
6% Mission / Vision statement and work plan 0
6% Annual reports / Budgets 0
6% Manuals 0
2% Organizational chart 2
2% USO policy information, reports and plans 0
2% Sector News 0
Businessinformation
6 8% Market entry 6
8% Interconnection 0
8% Scarce Resources 0
Generalinformation
14 10% Public consultations / White papers 0
5% RFPs 5
3% Local language 3
2% Contact details 2
2% Updated info 2
2% Links to local / international sites 2
Consumerinformation
0 3% Consumer and citizen rights information 0
3% Information about public hearings 0
3% Equipment certification 0
3% Complaints process 0
Total 26
Comparison with cluster averages
0,0
10,0
20,0
30,0
40,0
50,0
60,0
70,0
80,0
90,0
100,0
0
Lebanon Cluster 2 - Average
Factual Info Business Info General Info Consumer Info
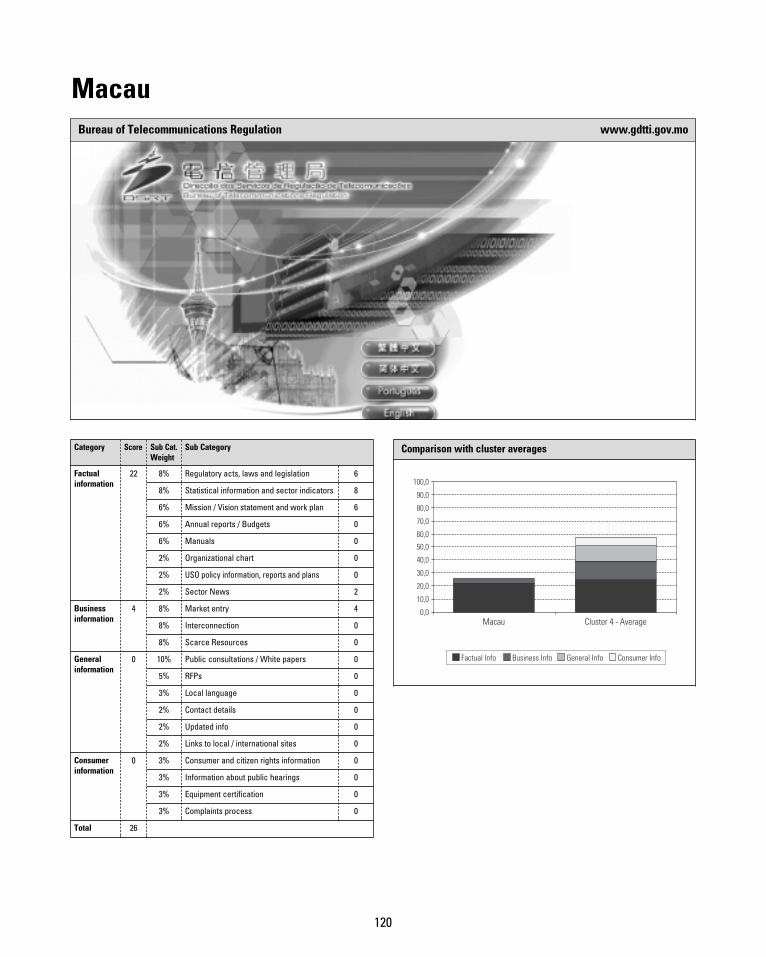
120
MacauBureau of Telecommunications Regulation www.gdtti.gov.mo
Category Score Sub Cat.Weight
Sub Category
Factualinformation
22 8% Regulatory acts, laws and legislation 6
8% Statistical information and sector indicators 8
6% Mission / Vision statement and work plan 6
6% Annual reports / Budgets 0
6% Manuals 0
2% Organizational chart 0
2% USO policy information, reports and plans 0
2% Sector News 2
Businessinformation
4 8% Market entry 4
8% Interconnection 0
8% Scarce Resources 0
Generalinformation
0 10% Public consultations / White papers 0
5% RFPs 0
3% Local language 0
2% Contact details 0
2% Updated info 0
2% Links to local / international sites 0
Consumerinformation
0 3% Consumer and citizen rights information 0
3% Information about public hearings 0
3% Equipment certification 0
3% Complaints process 0
Total 26
Comparison with cluster averages
0,0
10,0
20,0
30,0
40,0
50,0
60,0
70,0
80,0
90,0
100,0
Macau Cluster 4 - Average
Factual Info Business Info General Info Consumer Info
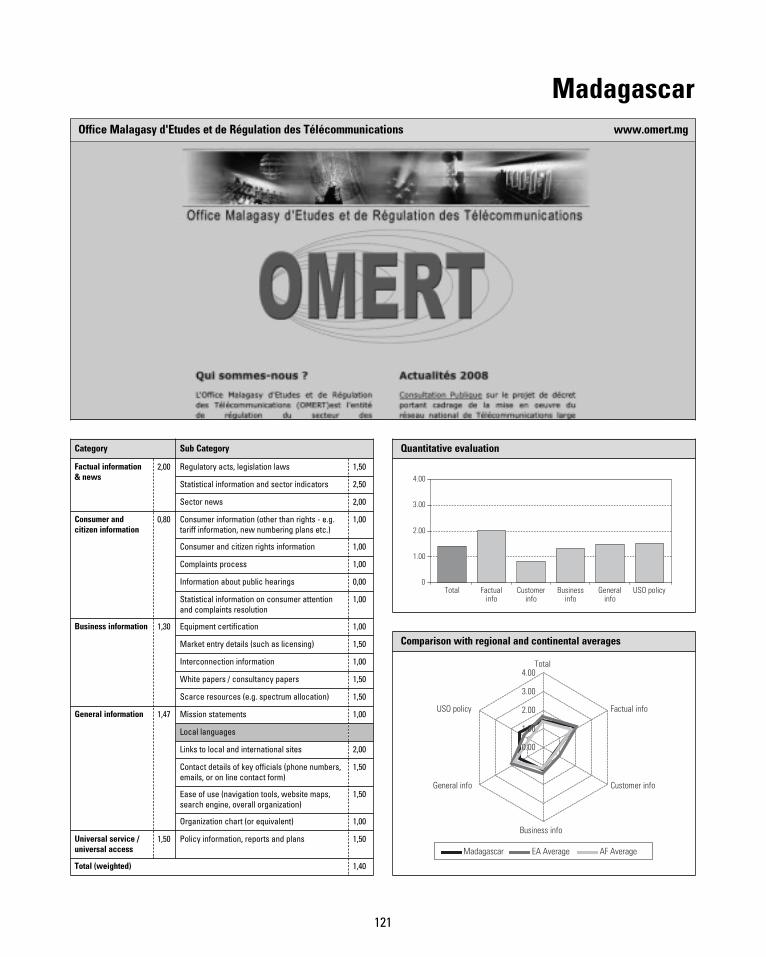
121
MadagascarOffice Malagasy d'Etudes et de Régulation des Télécommunications www.omert.mg
Quantitative evaluation
Total Factualinfo
Customerinfo
Businessinfo
Generalinfo
USO policy0
1.00
2.00
3.00
4.00
Comparison with regional and continental averages
Madagascar EA Average AF Average
0.00
1.00
2.00
3.00
4.00Total
Factual info
Customer info
Business info
General info
USO policy
Category Sub Category
Factual information& news
2,00 Regulatory acts, legislation laws 1,50
Statistical information and sector indicators 2,50
Sector news 2,00
Consumer andcitizen information
0,80 Consumer information (other than rights - e.g.tariff information, new numbering plans etc.)
1,00
Consumer and citizen rights information 1,00
Complaints process 1,00
Information about public hearings 0,00
Statistical information on consumer attentionand complaints resolution
1,00
Business information 1,30 Equipment certification 1,00
Market entry details (such as licensing) 1,50
Interconnection information 1,00
White papers / consultancy papers 1,50
Scarce resources (e.g. spectrum allocation) 1,50
General information 1,47 Mission statements 1,00
Local languages
Links to local and international sites 2,00
Contact details of key officials (phone numbers,emails, or on line contact form)
1,50
Ease of use (navigation tools, website maps,search engine, overall organization)
1,50
Organization chart (or equivalent) 1,00
Universal service /universal access
1,50 Policy information, reports and plans 1,50
Total (weighted) 1,40
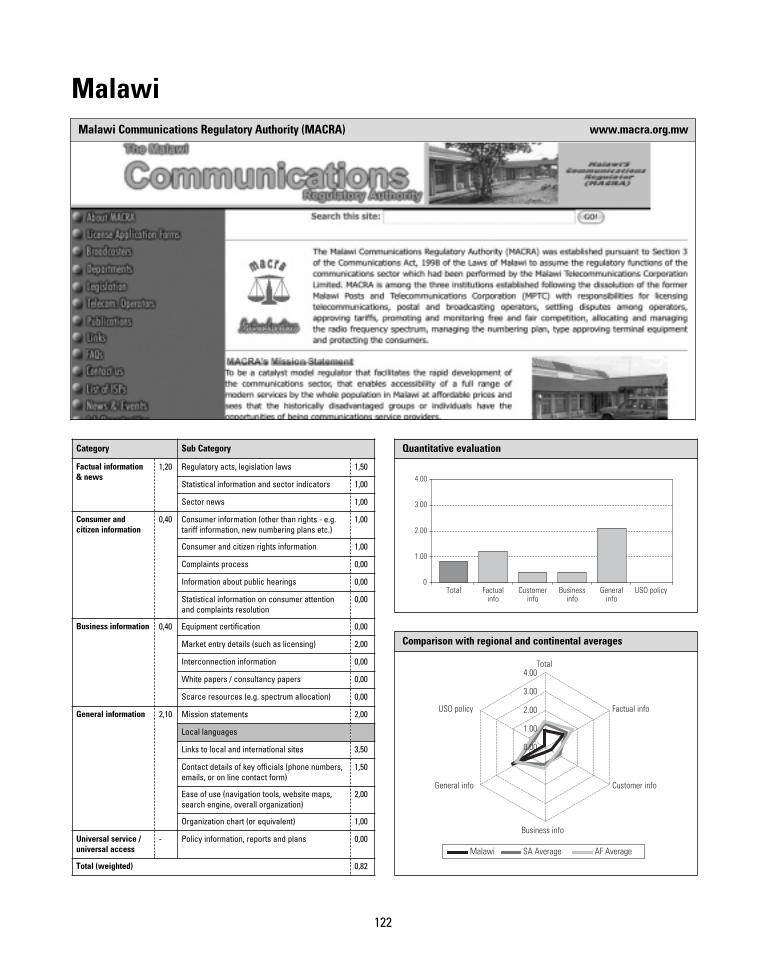
122
MalawiMalawi Communications Regulatory Authority (MACRA) www.macra.org.mw
Quantitative evaluation
Total Factualinfo
Customerinfo
Businessinfo
Generalinfo
USO policy0
1.00
2.00
3.00
4.00
Comparison with regional and continental averages
Malawi SA Average AF Average
0.00
1.00
2.00
3.00
4.00Total
Factual info
Customer info
Business info
General info
USO policy
Category Sub Category
Factual information& news
1,20 Regulatory acts, legislation laws 1,50
Statistical information and sector indicators 1,00
Sector news 1,00
Consumer andcitizen information
0,40 Consumer information (other than rights - e.g.tariff information, new numbering plans etc.)
1,00
Consumer and citizen rights information 1,00
Complaints process 0,00
Information about public hearings 0,00
Statistical information on consumer attentionand complaints resolution
0,00
Business information 0,40 Equipment certification 0,00
Market entry details (such as licensing) 2,00
Interconnection information 0,00
White papers / consultancy papers 0,00
Scarce resources (e.g. spectrum allocation) 0,00
General information 2,10 Mission statements 2,00
Local languages
Links to local and international sites 3,50
Contact details of key officials (phone numbers,emails, or on line contact form)
1,50
Ease of use (navigation tools, website maps,search engine, overall organization)
2,00
Organization chart (or equivalent) 1,00
Universal service /universal access
- Policy information, reports and plans 0,00
Total (weighted) 0,82
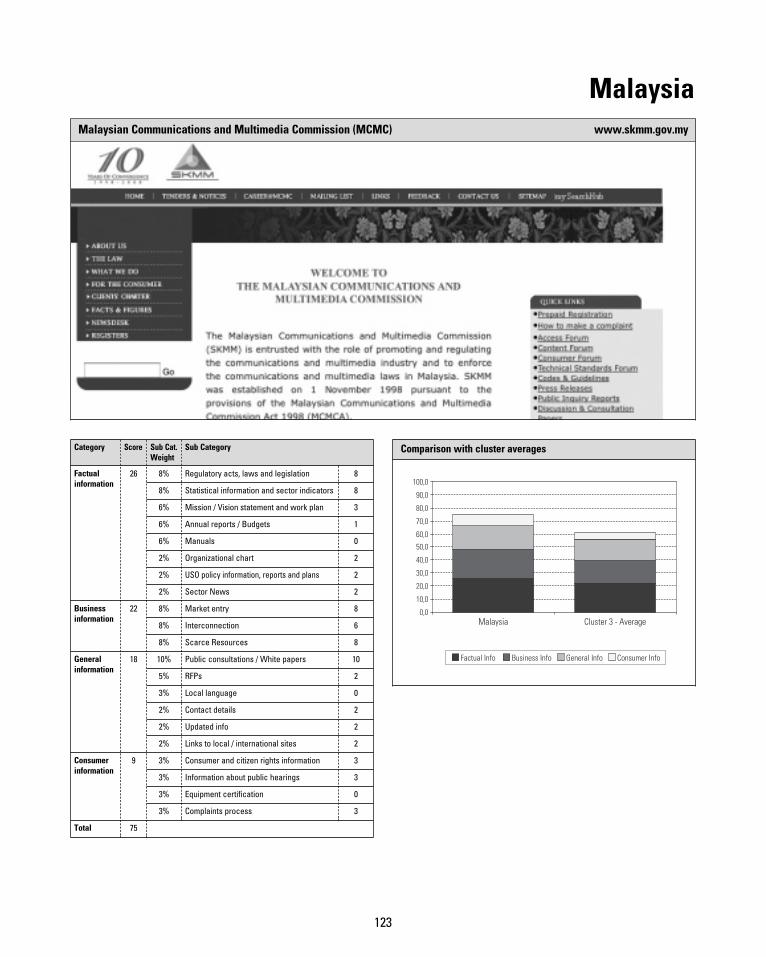
123
MalaysiaMalaysian Communications and Multimedia Commission (MCMC) www.skmm.gov.my
Category Score Sub Cat.Weight
Sub Category
Factualinformation
26 8% Regulatory acts, laws and legislation 8
8% Statistical information and sector indicators 8
6% Mission / Vision statement and work plan 3
6% Annual reports / Budgets 1
6% Manuals 0
2% Organizational chart 2
2% USO policy information, reports and plans 2
2% Sector News 2
Businessinformation
22 8% Market entry 8
8% Interconnection 6
8% Scarce Resources 8
Generalinformation
18 10% Public consultations / White papers 10
5% RFPs 2
3% Local language 0
2% Contact details 2
2% Updated info 2
2% Links to local / international sites 2
Consumerinformation
9 3% Consumer and citizen rights information 3
3% Information about public hearings 3
3% Equipment certification 0
3% Complaints process 3
Total 75
Comparison with cluster averages
0,0
10,0
20,0
30,0
40,0
50,0
60,0
70,0
80,0
90,0
100,0
0
Malaysia Cluster 3 - Average
Factual Info Business Info General Info Consumer Info
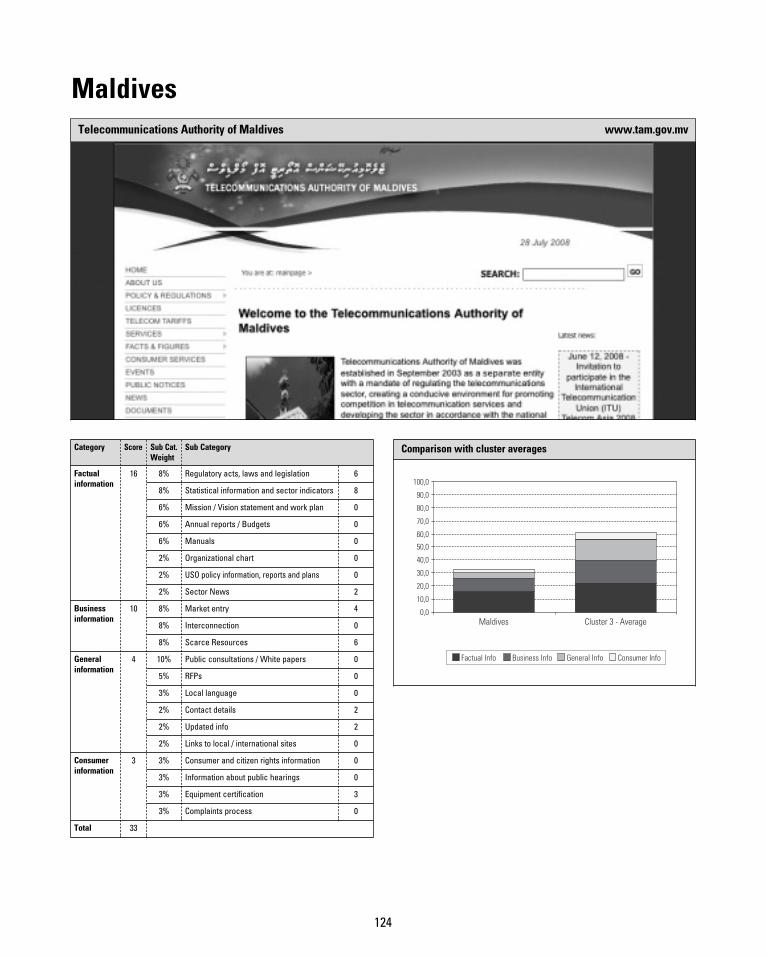
124
MaldivesTelecommunications Authority of Maldives www.tam.gov.mv
Category Score Sub Cat.Weight
Sub Category
Factualinformation
16 8% Regulatory acts, laws and legislation 6
8% Statistical information and sector indicators 8
6% Mission / Vision statement and work plan 0
6% Annual reports / Budgets 0
6% Manuals 0
2% Organizational chart 0
2% USO policy information, reports and plans 0
2% Sector News 2
Businessinformation
10 8% Market entry 4
8% Interconnection 0
8% Scarce Resources 6
Generalinformation
4 10% Public consultations / White papers 0
5% RFPs 0
3% Local language 0
2% Contact details 2
2% Updated info 2
2% Links to local / international sites 0
Consumerinformation
3 3% Consumer and citizen rights information 0
3% Information about public hearings 0
3% Equipment certification 3
3% Complaints process 0
Total 33
Comparison with cluster averages
0,0
10,0
20,0
30,0
40,0
50,0
60,0
70,0
80,0
90,0
100,0
0
Maldives Cluster 3 - Average
Factual Info Business Info General Info Consumer Info
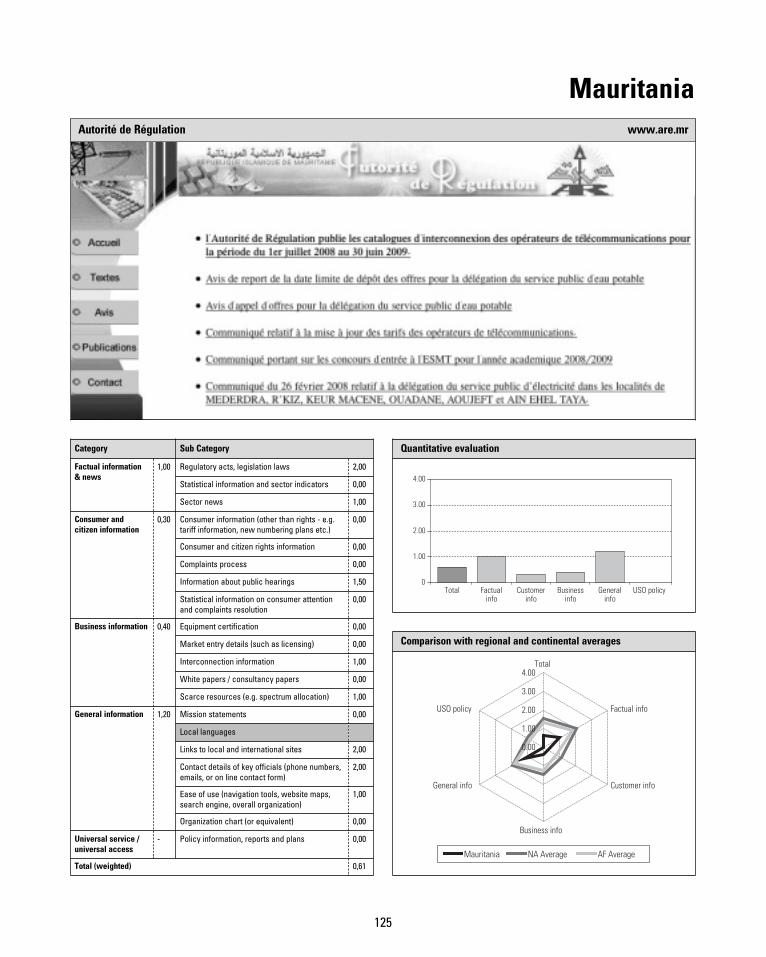
125
MauritaniaAutorité de Régulation www.are.mr
Quantitative evaluation
Total Factualinfo
Customerinfo
Businessinfo
Generalinfo
USO policy0
1.00
2.00
3.00
4.00
Comparison with regional and continental averages
Mauritania NA Average AF Average
0.00
1.00
2.00
3.00
4.00Total
Factual info
Customer info
Business info
General info
USO policy
Category Sub Category
Factual information& news
1,00 Regulatory acts, legislation laws 2,00
Statistical information and sector indicators 0,00
Sector news 1,00
Consumer andcitizen information
0,30 Consumer information (other than rights - e.g.tariff information, new numbering plans etc.)
0,00
Consumer and citizen rights information 0,00
Complaints process 0,00
Information about public hearings 1,50
Statistical information on consumer attentionand complaints resolution
0,00
Business information 0,40 Equipment certification 0,00
Market entry details (such as licensing) 0,00
Interconnection information 1,00
White papers / consultancy papers 0,00
Scarce resources (e.g. spectrum allocation) 1,00
General information 1,20 Mission statements 0,00
Local languages
Links to local and international sites 2,00
Contact details of key officials (phone numbers,emails, or on line contact form)
2,00
Ease of use (navigation tools, website maps,search engine, overall organization)
1,00
Organization chart (or equivalent) 0,00
Universal service /universal access
- Policy information, reports and plans 0,00
Total (weighted) 0,61
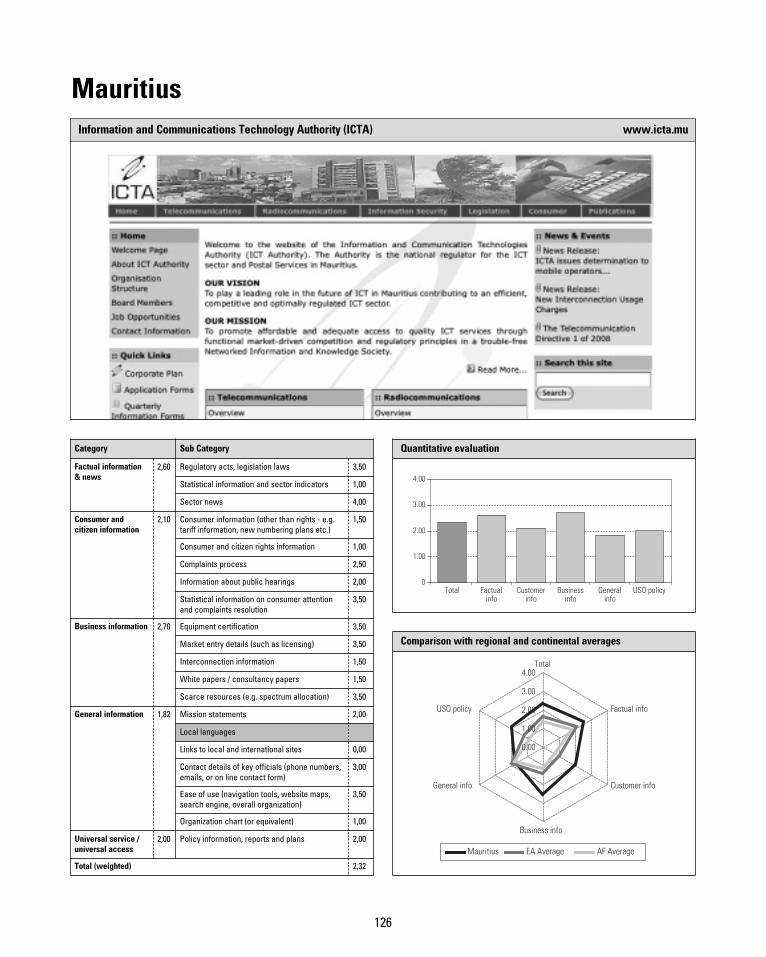
126
MauritiusInformation and Communications Technology Authority (ICTA) www.icta.mu
Quantitative evaluation
Total Factualinfo
Customerinfo
Businessinfo
Generalinfo
USO policy0
1.00
2.00
3.00
4.00
Comparison with regional and continental averages
Mauritius EA Average AF Average
0.00
1.00
2.00
3.00
4.00Total
Factual info
Customer info
Business info
General info
USO policy
0
Category Sub Category
Factual information& news
2,60 Regulatory acts, legislation laws 3,50
Statistical information and sector indicators 1,00
Sector news 4,00
Consumer andcitizen information
2,10 Consumer information (other than rights - e.g.tariff information, new numbering plans etc.)
1,50
Consumer and citizen rights information 1,00
Complaints process 2,50
Information about public hearings 2,00
Statistical information on consumer attentionand complaints resolution
3,50
Business information 2,70 Equipment certification 3,50
Market entry details (such as licensing) 3,50
Interconnection information 1,50
White papers / consultancy papers 1,50
Scarce resources (e.g. spectrum allocation) 3,50
General information 1,82 Mission statements 2,00
Local languages
Links to local and international sites 0,00
Contact details of key officials (phone numbers,emails, or on line contact form)
3,00
Ease of use (navigation tools, website maps,search engine, overall organization)
3,50
Organization chart (or equivalent) 1,00
Universal service /universal access
2,00 Policy information, reports and plans 2,00
Total (weighted) 2,32
127
MexicoComisión Federal de Telecomunicaciones www.cft.gob.mx
Quantitative evaluation
Total Factualinfo
Customerinfo
Businessinfo
Generalinfo
USOpolicy
0
1.00
2.00
3.00
4.00
Comparison with regional and continental averages
Mexico NAM Average LA Average S
0.00
1.00
2.00
3.00
4.00Total
Factual info
Customer info
Business info
General info
USO policy
0
Category Sub Category
Factual information& news
2.20 Regulatory acts, legislation laws 2.5
Statistical information and sector indicators 2
Sector news 2
Consumer andcitizen information
1.60 Consumer information (other than rights - e.g.tariff information, new numbering plans etc.)
2
Consumer and citizen rights information 1.5
Complaints process 2.5
Information about public hearings 2
Statistical information on consumer attentionand complaints resolution
0
Business information 1.20 Equipment certification 0.5
Market entry details (such as licensing) 2
Interconnection information 1
White papers / consultancy papers 1.5
Scarce resources (e.g. spectrum allocation) 1
General information 0.95 Mission statements 1
Local languages
Links to local and international sites 0.5
Contact details of key officials (phone numbers,emails, or on line contact form)
1
Ease of use (navigation tools, website maps,search engine, overall organization)
1.5
Organization chart (or equivalent) 1
Universal service /universal access
0.50 Policy information, reports and plans 0.5
Total (weighted) 1.44
128
MoroccoAgence Nationale de Réglementation des Télécommunications www.anrt.net.ma
Quantitative evaluation
Total Factualinfo
Customerinfo
Businessinfo
Generalinfo
USO policy0
1.00
2.00
3.00
4.00
Comparison with regional and continental averages
Morocco NA Average AF Average
0.00
1.00
2.00
3.00
4.00Total
Factual info
Customer info
Business info
General info
USO policy
Category Sub Category
Factual information& news
2,60 Regulatory acts, legislation laws 2,50
Statistical information and sector indicators 3,00
Sector news 2,00
Consumer andcitizen information
0,60 Consumer information (other than rights - e.g.tariff information, new numbering plans etc.)
2,00
Consumer and citizen rights information 0,00
Complaints process 1,00
Information about public hearings 0,00
Statistical information on consumer attentionand complaints resolution
0,00
Business information 1,90 Equipment certification 1,50
Market entry details (such as licensing) 2,00
Interconnection information 2,00
White papers / consultancy papers 2,00
Scarce resources (e.g. spectrum allocation) 2,00
General information 2,29 Mission statements 2,00
Local languages
Links to local and international sites 3,00
Contact details of key officials (phone numbers,emails, or on line contact form)
1,50
Ease of use (navigation tools, website maps,search engine, overall organization)
3,00
Organization chart (or equivalent) 2,00
Universal service /universal access
- Policy information, reports and plans 0,00
Total (weighted) 1,62
129
MozambiqueInstituto Nacional das Comunicaçoes de Moçambique (INCM) www.incm.gov.mz
Quantitative evaluation
Total Factualinfo
Customerinfo
Businessinfo
Generalinfo
USO policy0
1.00
2.00
3.00
4.00
Comparison with regional and continental averages
Mozambique SA Average AF Average
0.00
1.00
2.00
3.00
4.00Total
Factual info
Customer info
Business info
General info
USO policy
Category Sub Category
Factual information& news
1,20 Regulatory acts, legislation laws 2,00
Statistical information and sector indicators 0,00
Sector news 2,00
Consumer andcitizen information
0,20 Consumer information (other than rights - e.g.tariff information, new numbering plans etc.)
1,00
Consumer and citizen rights information 0,00
Complaints process 0,00
Information about public hearings 0,00
Statistical information on consumer attentionand complaints resolution
0,00
Business information 1,00 Equipment certification 1,00
Market entry details (such as licensing) 0,00
Interconnection information 1,00
White papers / consultancy papers 2,00
Scarce resources (e.g. spectrum allocation) 1,00
General information 1,90 Mission statements 2,00
Local languages
Links to local and international sites 3,00
Contact details of key officials (phone numbers,emails, or on line contact form)
2,50
Ease of use (navigation tools, website maps,search engine, overall organization)
2,00
Organization chart (or equivalent) 1,00
Universal service /universal access
3,00 Policy information, reports and plans 3,00
Total (weighted) 1,19
130
MyanmarMinistry of Communications, Posts and Telegraphs www.mcpt.gov.mm
Category Score Sub Cat.Weight
Sub Category
Factualinformation
5 8% Regulatory acts, laws and legislation 0
8% Statistical information and sector indicators 0
6% Mission / Vision statement and work plan 3
6% Annual reports / Budgets 0
6% Manuals 0
2% Organizational chart 2
2% USO policy information, reports and plans 0
2% Sector News 0
Businessinformation
6 8% Market entry 6
8% Interconnection 0
8% Scarce Resources 0
Generalinformation
0 10% Public consultations / White papers 0
5% RFPs 0
3% Local language 0
2% Contact details 0
2% Updated info 0
2% Links to local / international sites 0
Consumerinformation
0 3% Consumer and citizen rights information 0
3% Information about public hearings 0
3% Equipment certification 0
3% Complaints process 0
Total 11
Comparison with cluster averages
0,0
10,0
20,0
30,0
40,0
50,0
60,0
70,0
80,0
90,0
100,0
0
Myanmar Cluster 1-Average
Factual Info Business Info General Info Consumer Info
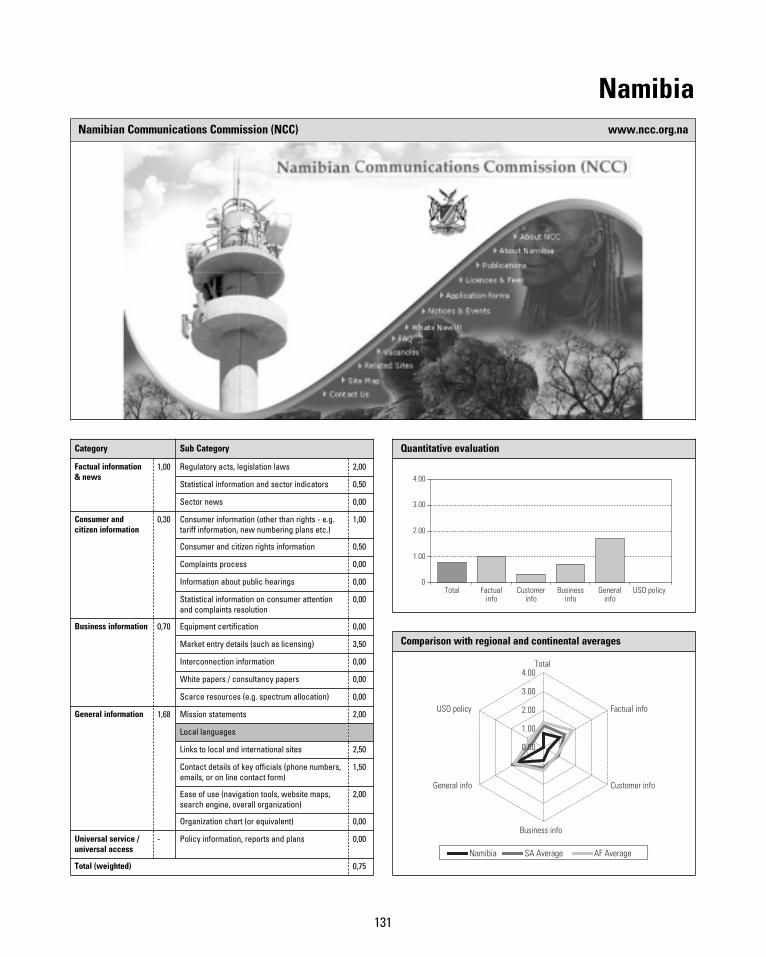
131
NamibiaNamibian Communications Commission (NCC) www.ncc.org.na
Quantitative evaluation
Total Factualinfo
Customerinfo
Businessinfo
Generalinfo
USO policy0
1.00
2.00
3.00
4.00
Comparison with regional and continental averages
Namibia SA Average AF Average
0.00
1.00
2.00
3.00
4.00Total
Factual info
Customer info
Business info
General info
USO policy
Category Sub Category
Factual information& news
1,00 Regulatory acts, legislation laws 2,00
Statistical information and sector indicators 0,50
Sector news 0,00
Consumer andcitizen information
0,30 Consumer information (other than rights - e.g.tariff information, new numbering plans etc.)
1,00
Consumer and citizen rights information 0,50
Complaints process 0,00
Information about public hearings 0,00
Statistical information on consumer attentionand complaints resolution
0,00
Business information 0,70 Equipment certification 0,00
Market entry details (such as licensing) 3,50
Interconnection information 0,00
White papers / consultancy papers 0,00
Scarce resources (e.g. spectrum allocation) 0,00
General information 1,68 Mission statements 2,00
Local languages
Links to local and international sites 2,50
Contact details of key officials (phone numbers,emails, or on line contact form)
1,50
Ease of use (navigation tools, website maps,search engine, overall organization)
2,00
Organization chart (or equivalent) 0,00
Universal service /universal access
- Policy information, reports and plans 0,00
Total (weighted) 0,75
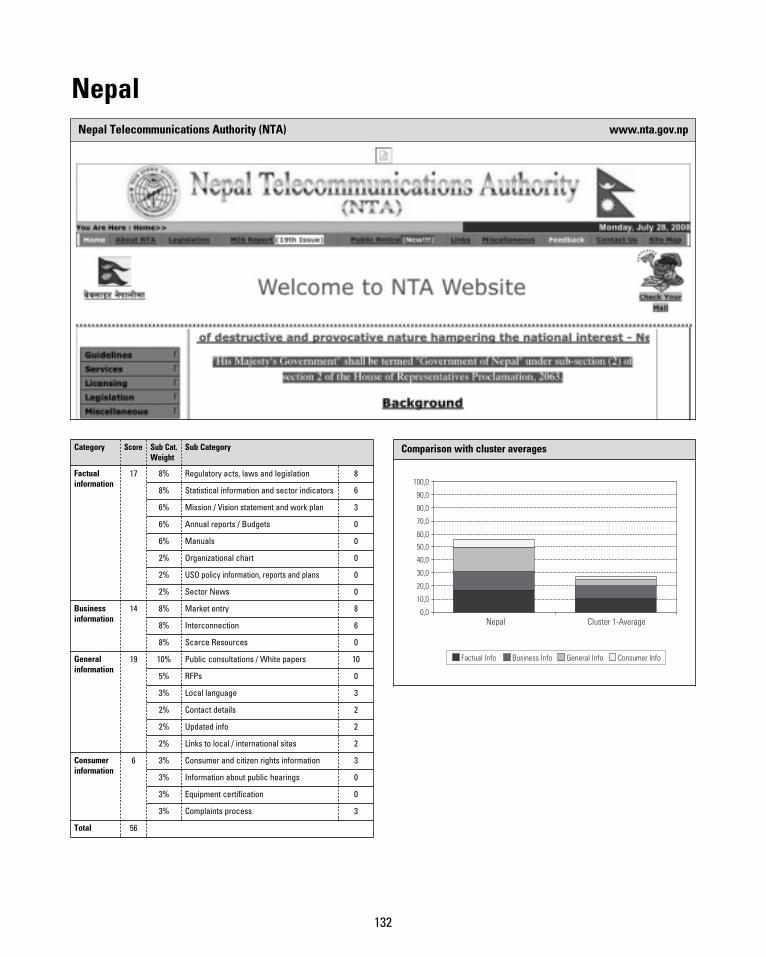
132
NepalNepal Telecommunications Authority (NTA) www.nta.gov.np
Category Score Sub Cat.Weight
Sub Category
Factualinformation
17 8% Regulatory acts, laws and legislation 8
8% Statistical information and sector indicators 6
6% Mission / Vision statement and work plan 3
6% Annual reports / Budgets 0
6% Manuals 0
2% Organizational chart 0
2% USO policy information, reports and plans 0
2% Sector News 0
Businessinformation
14 8% Market entry 8
8% Interconnection 6
8% Scarce Resources 0
Generalinformation
19 10% Public consultations / White papers 10
5% RFPs 0
3% Local language 3
2% Contact details 2
2% Updated info 2
2% Links to local / international sites 2
Consumerinformation
6 3% Consumer and citizen rights information 3
3% Information about public hearings 0
3% Equipment certification 0
3% Complaints process 3
Total 56
Comparison with cluster averages
0,0
10,0
20,0
30,0
40,0
50,0
60,0
70,0
80,0
90,0
100,0
0
Nepal Cluster 1-Average
Factual Info Business Info General Info Consumer Info
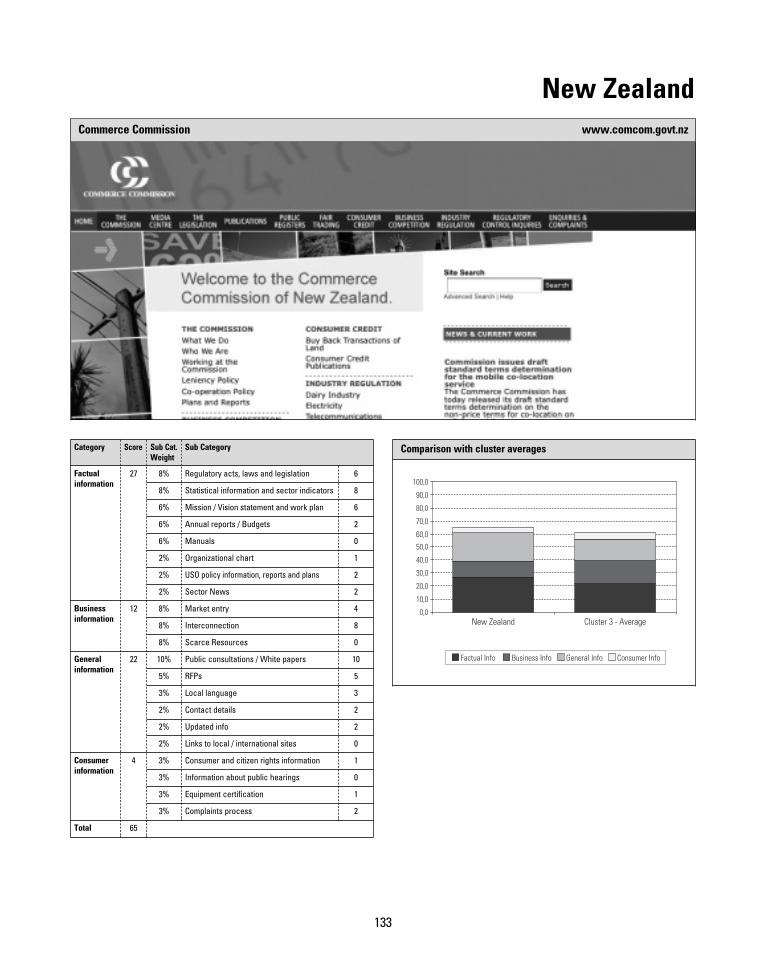
133
New ZealandCommerce Commission www.comcom.govt.nz
Category Score Sub Cat.Weight
Sub Category
Factualinformation
27 8% Regulatory acts, laws and legislation 6
8% Statistical information and sector indicators 8
6% Mission / Vision statement and work plan 6
6% Annual reports / Budgets 2
6% Manuals 0
2% Organizational chart 1
2% USO policy information, reports and plans 2
2% Sector News 2
Businessinformation
12 8% Market entry 4
8% Interconnection 8
8% Scarce Resources 0
Generalinformation
22 10% Public consultations / White papers 10
5% RFPs 5
3% Local language 3
2% Contact details 2
2% Updated info 2
2% Links to local / international sites 0
Consumerinformation
4 3% Consumer and citizen rights information 1
3% Information about public hearings 0
3% Equipment certification 1
3% Complaints process 2
Total 65
Comparison with cluster averages
0,0
10,0
20,0
30,0
40,0
50,0
60,0
70,0
80,0
90,0
100,0
0
New Zealand Cluster 3 - Average
Factual Info Business Info General Info Consumer Info
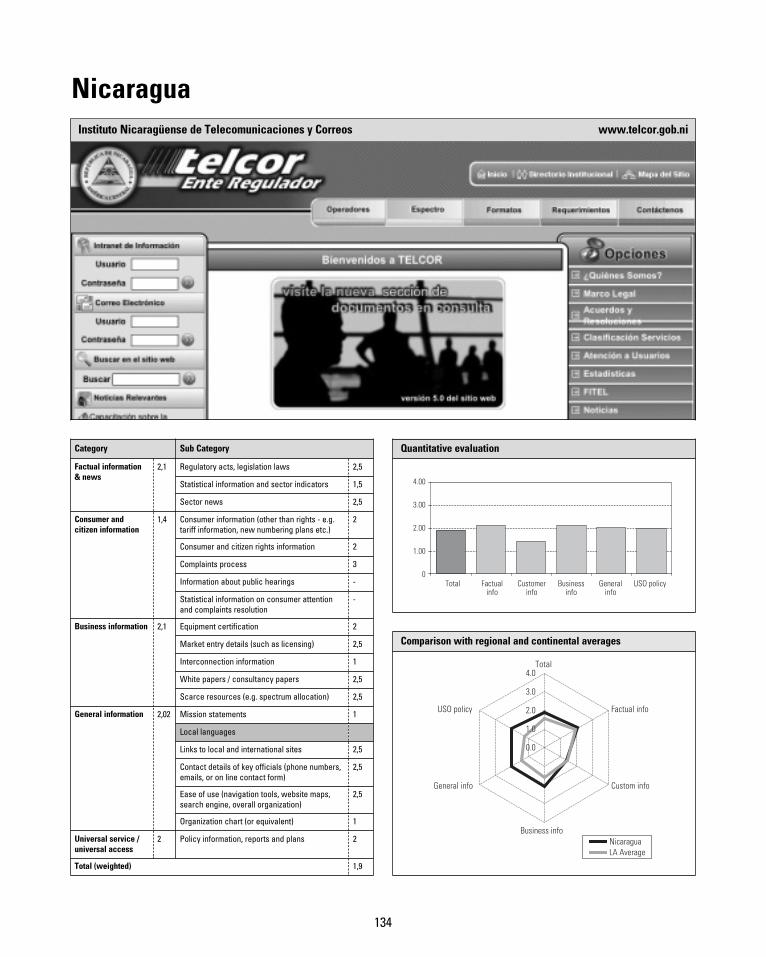
134
NicaraguaInstituto Nicaragüense de Telecomunicaciones y Correos www.telcor.gob.ni
Quantitative evaluation
Total Factualinfo
Customerinfo
Businessinfo
Generalinfo
USO policy0
1.00
2.00
3.00
4.00
Comparison with regional and continental averages
NicaraguaLA Average
Total
Factual info
Custom info
Business info
General info
USO policy
0.0
1.0
2.0
3.0
4.0
Category Sub Category
Factual information& news
2,1 Regulatory acts, legislation laws 2,5
Statistical information and sector indicators 1,5
Sector news 2,5
Consumer andcitizen information
1,4 Consumer information (other than rights - e.g.tariff information, new numbering plans etc.)
2
Consumer and citizen rights information 2
Complaints process 3
Information about public hearings -
Statistical information on consumer attentionand complaints resolution
-
Business information 2,1 Equipment certification 2
Market entry details (such as licensing) 2,5
Interconnection information 1
White papers / consultancy papers 2,5
Scarce resources (e.g. spectrum allocation) 2,5
General information 2,02 Mission statements 1
Local languages
Links to local and international sites 2,5
Contact details of key officials (phone numbers,emails, or on line contact form)
2,5
Ease of use (navigation tools, website maps,search engine, overall organization)
2,5
Organization chart (or equivalent) 1
Universal service /universal access
2 Policy information, reports and plans 2
Total (weighted) 1,9
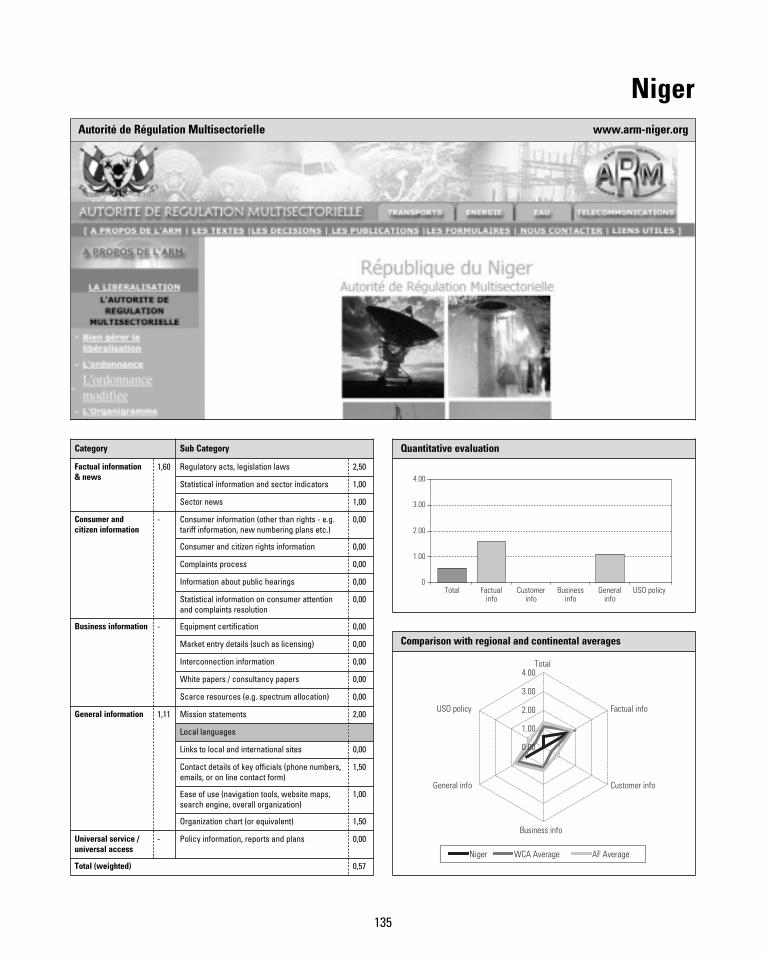
135
NigerAutorité de Régulation Multisectorielle www.arm-niger.org
Quantitative evaluation
Total Factualinfo
Customerinfo
Businessinfo
Generalinfo
USO policy0
1.00
2.00
3.00
4.00
Comparison with regional and continental averages
Niger WCA Average AF Average
0.00
1.00
2.00
3.00
4.00Total
Factual info
Customer info
Business info
General info
USO policy
0
Category Sub Category
Factual information& news
1,60 Regulatory acts, legislation laws 2,50
Statistical information and sector indicators 1,00
Sector news 1,00
Consumer andcitizen information
- Consumer information (other than rights - e.g.tariff information, new numbering plans etc.)
0,00
Consumer and citizen rights information 0,00
Complaints process 0,00
Information about public hearings 0,00
Statistical information on consumer attentionand complaints resolution
0,00
Business information - Equipment certification 0,00
Market entry details (such as licensing) 0,00
Interconnection information 0,00
White papers / consultancy papers 0,00
Scarce resources (e.g. spectrum allocation) 0,00
General information 1,11 Mission statements 2,00
Local languages
Links to local and international sites 0,00
Contact details of key officials (phone numbers,emails, or on line contact form)
1,50
Ease of use (navigation tools, website maps,search engine, overall organization)
1,00
Organization chart (or equivalent) 1,50
Universal service /universal access
- Policy information, reports and plans 0,00
Total (weighted) 0,57
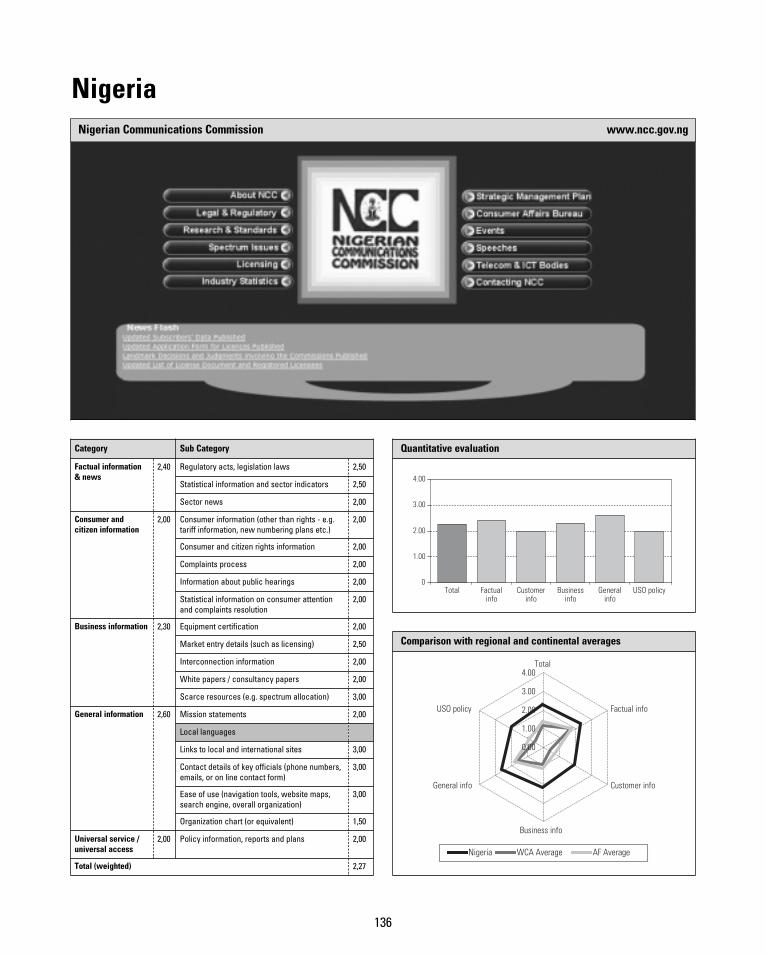
136
NigeriaNigerian Communications Commission www.ncc.gov.ng
Quantitative evaluation
Total Factualinfo
Customerinfo
Businessinfo
Generalinfo
USO policy0
1.00
2.00
3.00
4.00
Comparison with regional and continental averages
Nigeria WCA Average AF Average
0.00
1.00
2.00
3.00
4.00Total
Factual info
Customer info
Business info
General info
USO policy
0
Category Sub Category
Factual information& news
2,40 Regulatory acts, legislation laws 2,50
Statistical information and sector indicators 2,50
Sector news 2,00
Consumer andcitizen information
2,00 Consumer information (other than rights - e.g.tariff information, new numbering plans etc.)
2,00
Consumer and citizen rights information 2,00
Complaints process 2,00
Information about public hearings 2,00
Statistical information on consumer attentionand complaints resolution
2,00
Business information 2,30 Equipment certification 2,00
Market entry details (such as licensing) 2,50
Interconnection information 2,00
White papers / consultancy papers 2,00
Scarce resources (e.g. spectrum allocation) 3,00
General information 2,60 Mission statements 2,00
Local languages
Links to local and international sites 3,00
Contact details of key officials (phone numbers,emails, or on line contact form)
3,00
Ease of use (navigation tools, website maps,search engine, overall organization)
3,00
Organization chart (or equivalent) 1,50
Universal service /universal access
2,00 Policy information, reports and plans 2,00
Total (weighted) 2,27
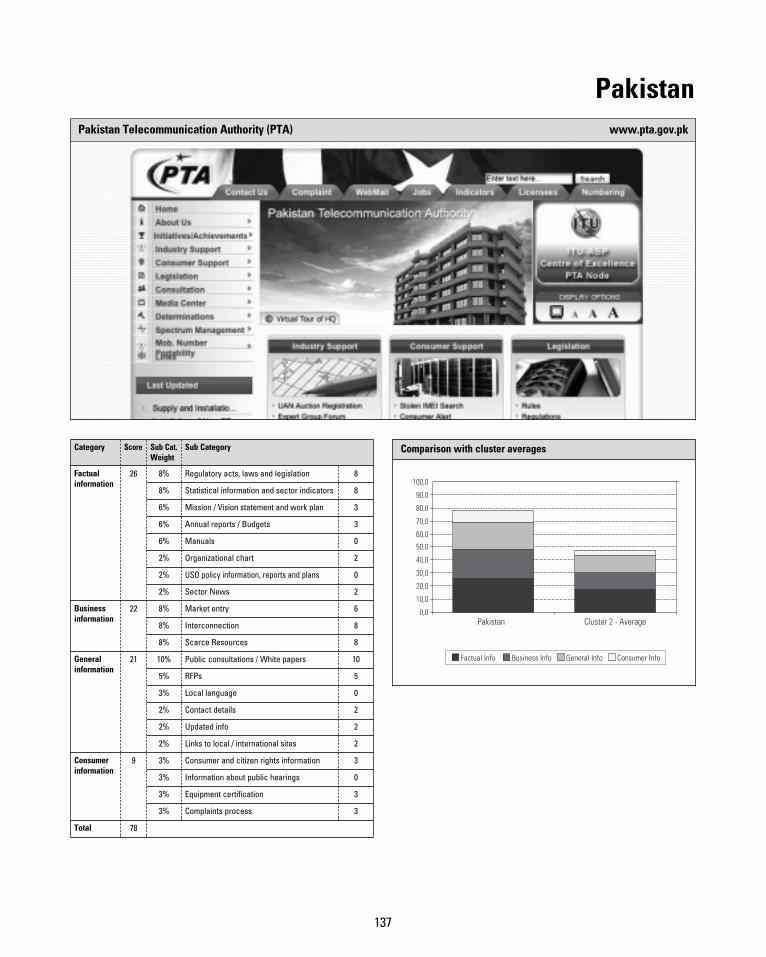
137
PakistanPakistan Telecommunication Authority (PTA) www.pta.gov.pk
Category Score Sub Cat.Weight
Sub Category
Factualinformation
26 8% Regulatory acts, laws and legislation 8
8% Statistical information and sector indicators 8
6% Mission / Vision statement and work plan 3
6% Annual reports / Budgets 3
6% Manuals 0
2% Organizational chart 2
2% USO policy information, reports and plans 0
2% Sector News 2
Businessinformation
22 8% Market entry 6
8% Interconnection 8
8% Scarce Resources 8
Generalinformation
21 10% Public consultations / White papers 10
5% RFPs 5
3% Local language 0
2% Contact details 2
2% Updated info 2
2% Links to local / international sites 2
Consumerinformation
9 3% Consumer and citizen rights information 3
3% Information about public hearings 0
3% Equipment certification 3
3% Complaints process 3
Total 78
Comparison with cluster averages
0,0
10,0
20,0
30,0
40,0
50,0
60,0
70,0
80,0
90,0
100,0
0
Pakistan Cluster 2 - Average
Factual Info Business Info General Info Consumer Info
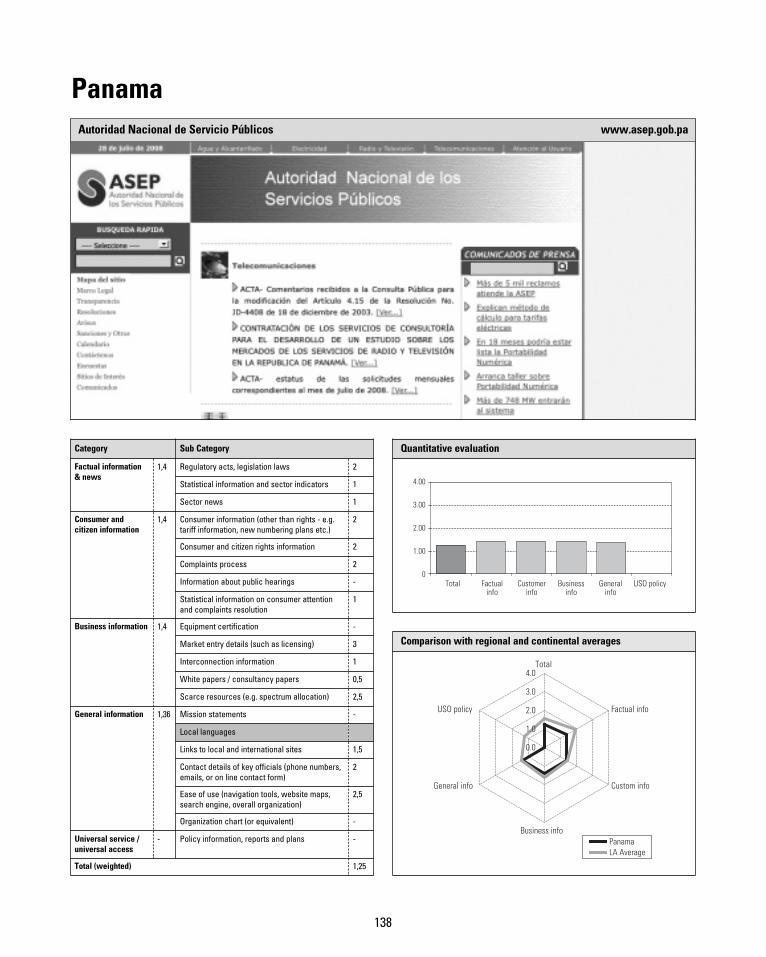
138
PanamaAutoridad Nacional de Servicio Públicos www.asep.gob.pa
Quantitative evaluation
Total Factualinfo
Customerinfo
Businessinfo
Generalinfo
USO policy0
1.00
2.00
3.00
4.00
Comparison with regional and continental averages
PanamaLA Average
Total
Factual info
Custom info
Business info
General info
USO policy
0.0
1.0
2.0
3.0
4.0
Category Sub Category
Factual information& news
1,4 Regulatory acts, legislation laws 2
Statistical information and sector indicators 1
Sector news 1
Consumer andcitizen information
1,4 Consumer information (other than rights - e.g.tariff information, new numbering plans etc.)
2
Consumer and citizen rights information 2
Complaints process 2
Information about public hearings -
Statistical information on consumer attentionand complaints resolution
1
Business information 1,4 Equipment certification -
Market entry details (such as licensing) 3
Interconnection information 1
White papers / consultancy papers 0,5
Scarce resources (e.g. spectrum allocation) 2,5
General information 1,36 Mission statements -
Local languages
Links to local and international sites 1,5
Contact details of key officials (phone numbers,emails, or on line contact form)
2
Ease of use (navigation tools, website maps,search engine, overall organization)
2,5
Organization chart (or equivalent) -
Universal service /universal access
- Policy information, reports and plans -
Total (weighted) 1,25
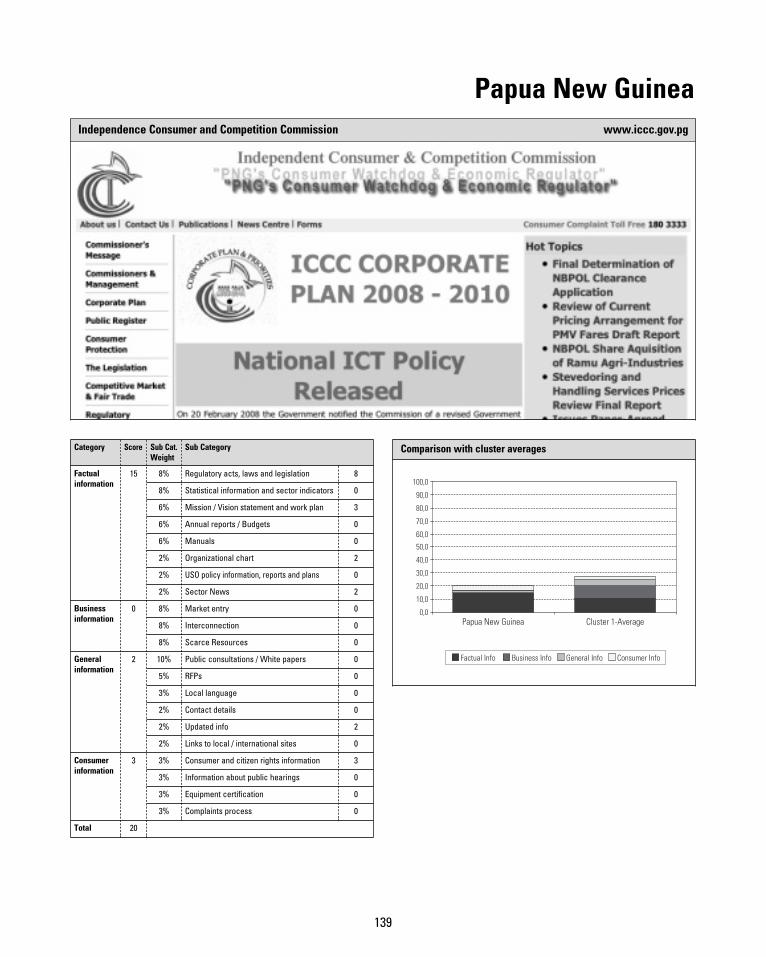
139
Papua New GuineaIndependence Consumer and Competition Commission www.iccc.gov.pg
Category Score Sub Cat.Weight
Sub Category
Factualinformation
15 8% Regulatory acts, laws and legislation 8
8% Statistical information and sector indicators 0
6% Mission / Vision statement and work plan 3
6% Annual reports / Budgets 0
6% Manuals 0
2% Organizational chart 2
2% USO policy information, reports and plans 0
2% Sector News 2
Businessinformation
0 8% Market entry 0
8% Interconnection 0
8% Scarce Resources 0
Generalinformation
2 10% Public consultations / White papers 0
5% RFPs 0
3% Local language 0
2% Contact details 0
2% Updated info 2
2% Links to local / international sites 0
Consumerinformation
3 3% Consumer and citizen rights information 3
3% Information about public hearings 0
3% Equipment certification 0
3% Complaints process 0
Total 20
Comparison with cluster averages
0,0
10,0
20,0
30,0
40,0
50,0
60,0
70,0
80,0
90,0
100,0
0
Papua New Guinea Cluster 1-Average
Factual Info Business Info General Info Consumer Info
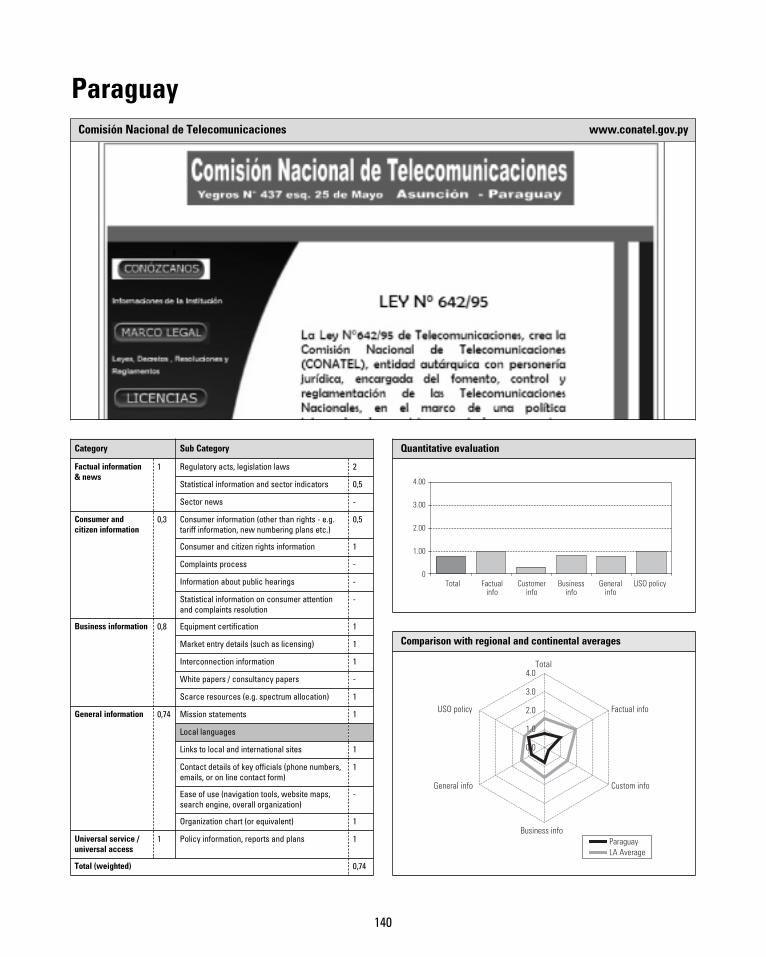
140
ParaguayComisión Nacional de Telecomunicaciones www.conatel.gov.py
Quantitative evaluation
Total Factualinfo
Customerinfo
Businessinfo
Generalinfo
USO policy0
1.00
2.00
3.00
4.00
Comparison with regional and continental averages
ParaguayLA Average
Total
Factual info
Custom info
Business info
General info
USO policy
0.0
1.0
2.0
3.0
4.0
Category Sub Category
Factual information& news
1 Regulatory acts, legislation laws 2
Statistical information and sector indicators 0,5
Sector news -
Consumer andcitizen information
0,3 Consumer information (other than rights - e.g.tariff information, new numbering plans etc.)
0,5
Consumer and citizen rights information 1
Complaints process -
Information about public hearings -
Statistical information on consumer attentionand complaints resolution
-
Business information 0,8 Equipment certification 1
Market entry details (such as licensing) 1
Interconnection information 1
White papers / consultancy papers -
Scarce resources (e.g. spectrum allocation) 1
General information 0,74 Mission statements 1
Local languages
Links to local and international sites 1
Contact details of key officials (phone numbers,emails, or on line contact form)
1
Ease of use (navigation tools, website maps,search engine, overall organization)
-
Organization chart (or equivalent) 1
Universal service /universal access
1 Policy information, reports and plans 1
Total (weighted) 0,74
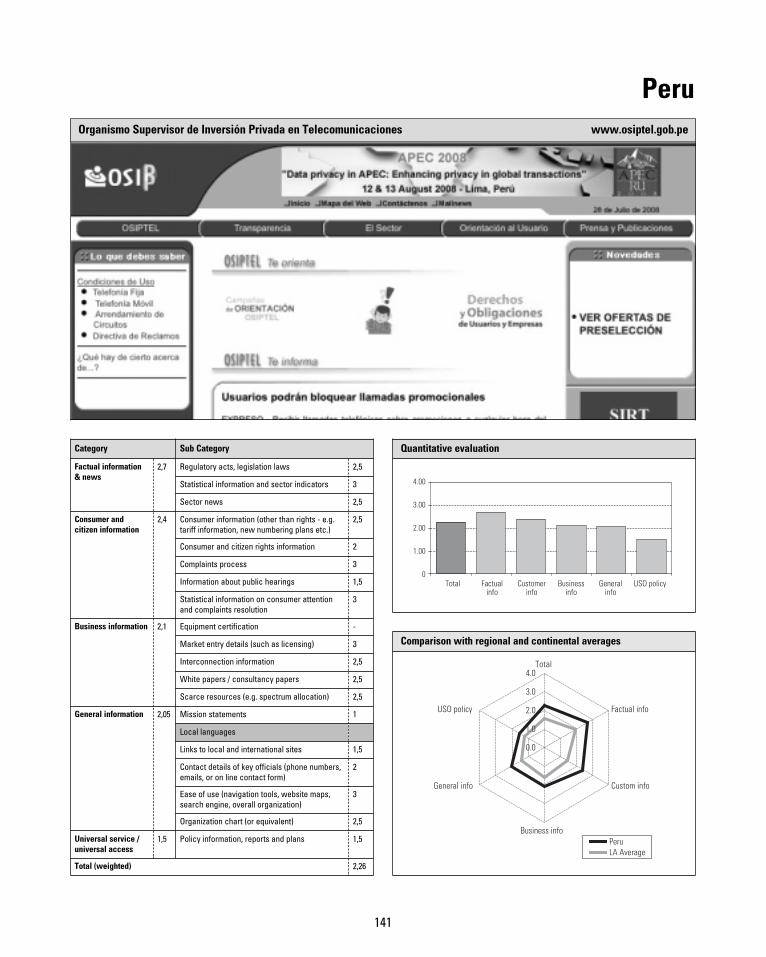
141
PeruOrganismo Supervisor de Inversión Privada en Telecomunicaciones www.osiptel.gob.pe
Quantitative evaluation
Total Factualinfo
Customerinfo
Businessinfo
Generalinfo
USO policy0
1.00
2.00
3.00
4.00
Comparison with regional and continental averages
PeruLA Average
Total
Factual info
Custom info
Business info
General info
USO policy
0.0
1.0
2.0
3.0
4.0
Category Sub Category
Factual information& news
2,7 Regulatory acts, legislation laws 2,5
Statistical information and sector indicators 3
Sector news 2,5
Consumer andcitizen information
2,4 Consumer information (other than rights - e.g.tariff information, new numbering plans etc.)
2,5
Consumer and citizen rights information 2
Complaints process 3
Information about public hearings 1,5
Statistical information on consumer attentionand complaints resolution
3
Business information 2,1 Equipment certification -
Market entry details (such as licensing) 3
Interconnection information 2,5
White papers / consultancy papers 2,5
Scarce resources (e.g. spectrum allocation) 2,5
General information 2,05 Mission statements 1
Local languages
Links to local and international sites 1,5
Contact details of key officials (phone numbers,emails, or on line contact form)
2
Ease of use (navigation tools, website maps,search engine, overall organization)
3
Organization chart (or equivalent) 2,5
Universal service /universal access
1,5 Policy information, reports and plans 1,5
Total (weighted) 2,26
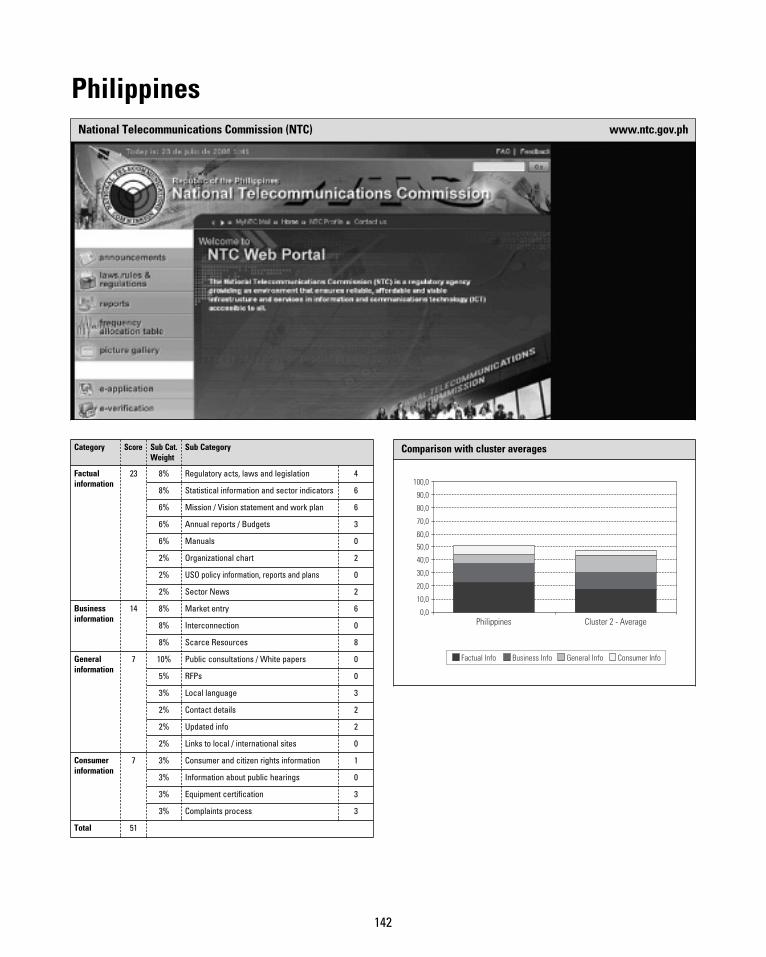
142
PhilippinesNational Telecommunications Commission (NTC) www.ntc.gov.ph
Category Score Sub Cat.Weight
Sub Category
Factualinformation
23 8% Regulatory acts, laws and legislation 4
8% Statistical information and sector indicators 6
6% Mission / Vision statement and work plan 6
6% Annual reports / Budgets 3
6% Manuals 0
2% Organizational chart 2
2% USO policy information, reports and plans 0
2% Sector News 2
Businessinformation
14 8% Market entry 6
8% Interconnection 0
8% Scarce Resources 8
Generalinformation
7 10% Public consultations / White papers 0
5% RFPs 0
3% Local language 3
2% Contact details 2
2% Updated info 2
2% Links to local / international sites 0
Consumerinformation
7 3% Consumer and citizen rights information 1
3% Information about public hearings 0
3% Equipment certification 3
3% Complaints process 3
Total 51
Comparison with cluster averages
0,0
10,0
20,0
30,0
40,0
50,0
60,0
70,0
80,0
90,0
100,0
0
Philippines Cluster 2 - Average
Factual Info Business Info General Info Consumer Info
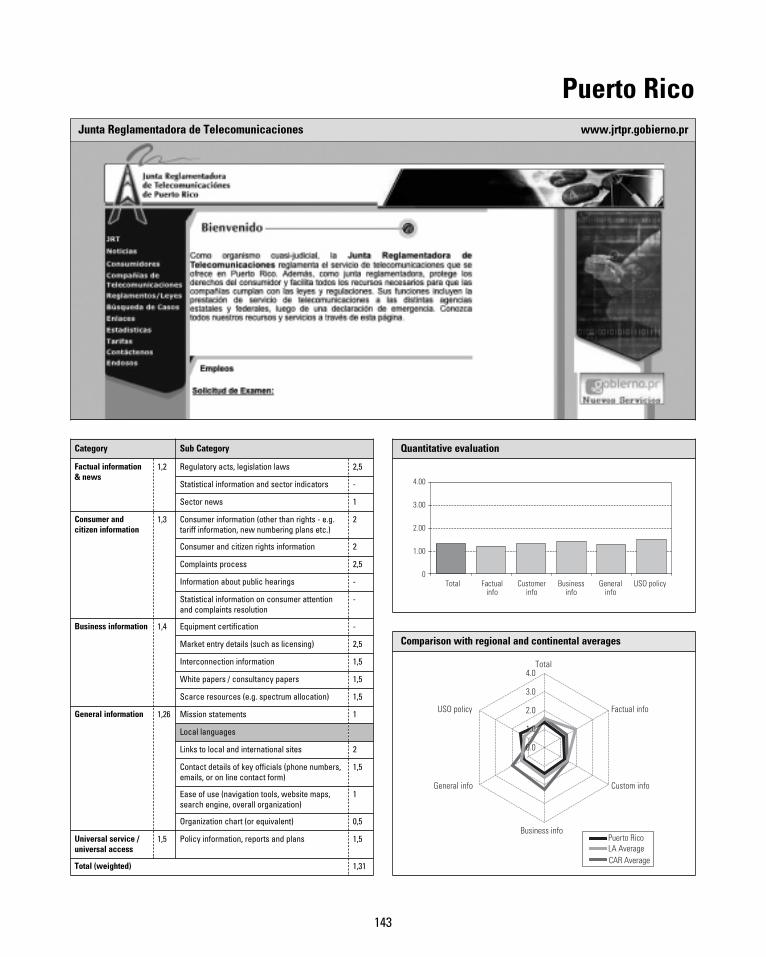
143
Puerto RicoJunta Reglamentadora de Telecomunicaciones www.jrtpr.gobierno.pr
Quantitative evaluation
Total Factualinfo
Customerinfo
Businessinfo
Generalinfo
USO policy0
1.00
2.00
3.00
4.00
Comparison with regional and continental averages
Puerto RicoLA AverageCAR Average
Total
Factual info
Custom info
Business info
General info
USO policy
0.0
1.0
2.0
3.0
4.0
Category Sub Category
Factual information& news
1,2 Regulatory acts, legislation laws 2,5
Statistical information and sector indicators -
Sector news 1
Consumer andcitizen information
1,3 Consumer information (other than rights - e.g.tariff information, new numbering plans etc.)
2
Consumer and citizen rights information 2
Complaints process 2,5
Information about public hearings -
Statistical information on consumer attentionand complaints resolution
-
Business information 1,4 Equipment certification -
Market entry details (such as licensing) 2,5
Interconnection information 1,5
White papers / consultancy papers 1,5
Scarce resources (e.g. spectrum allocation) 1,5
General information 1,26 Mission statements 1
Local languages
Links to local and international sites 2
Contact details of key officials (phone numbers,emails, or on line contact form)
1,5
Ease of use (navigation tools, website maps,search engine, overall organization)
1
Organization chart (or equivalent) 0,5
Universal service /universal access
1,5 Policy information, reports and plans 1,5
Total (weighted) 1,31
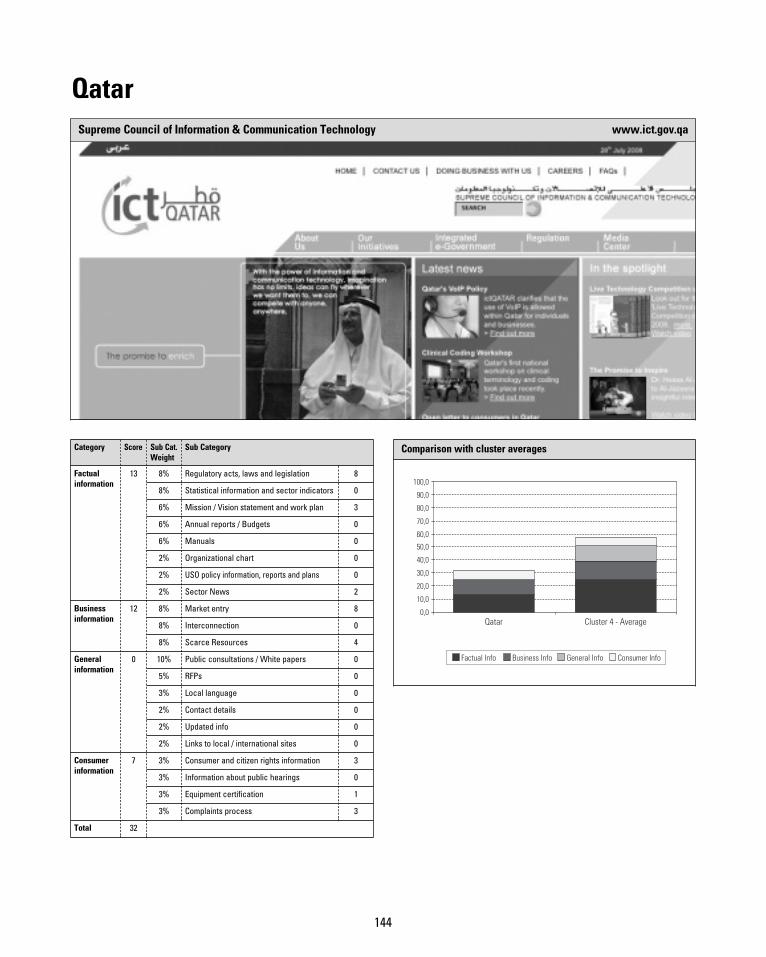
144
QatarSupreme Council of Information & Communication Technology www.ict.gov.qa
Category Score Sub Cat.Weight
Sub Category
Factualinformation
13 8% Regulatory acts, laws and legislation 8
8% Statistical information and sector indicators 0
6% Mission / Vision statement and work plan 3
6% Annual reports / Budgets 0
6% Manuals 0
2% Organizational chart 0
2% USO policy information, reports and plans 0
2% Sector News 2
Businessinformation
12 8% Market entry 8
8% Interconnection 0
8% Scarce Resources 4
Generalinformation
0 10% Public consultations / White papers 0
5% RFPs 0
3% Local language 0
2% Contact details 0
2% Updated info 0
2% Links to local / international sites 0
Consumerinformation
7 3% Consumer and citizen rights information 3
3% Information about public hearings 0
3% Equipment certification 1
3% Complaints process 3
Total 32
Comparison with cluster averages
0,0
10,0
20,0
30,0
40,0
50,0
60,0
70,0
80,0
90,0
100,0
0
Qatar Cluster 4 - Average
Factual Info Business Info General Info Consumer Info
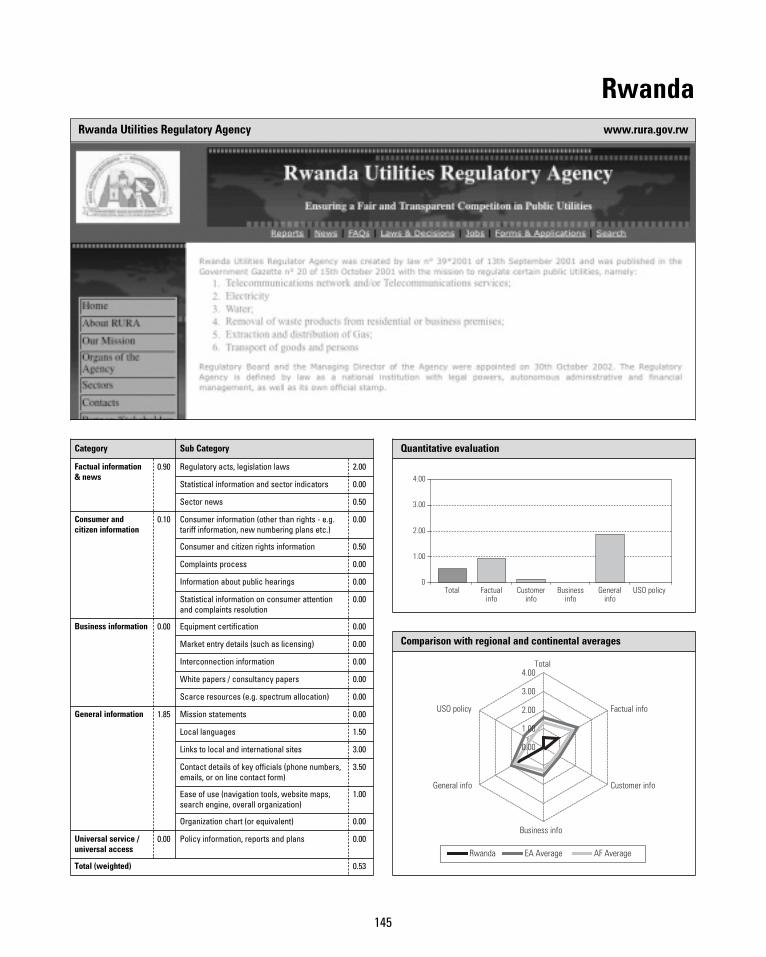
145
RwandaRwanda Utilities Regulatory Agency www.rura.gov.rw
Quantitative evaluation
Total Factualinfo
Customerinfo
Businessinfo
Generalinfo
USO policy0
1.00
2.00
3.00
4.00
Comparison with regional and continental averages
Rwanda EA Average AF Average
0.00
1.00
2.00
3.00
4.00Total
Factual info
Customer info
Business info
General info
USO policy
0
Category Sub Category
Factual information& news
0.90 Regulatory acts, legislation laws 2.00
Statistical information and sector indicators 0.00
Sector news 0.50
Consumer andcitizen information
0.10 Consumer information (other than rights - e.g.tariff information, new numbering plans etc.)
0.00
Consumer and citizen rights information 0.50
Complaints process 0.00
Information about public hearings 0.00
Statistical information on consumer attentionand complaints resolution
0.00
Business information 0.00 Equipment certification 0.00
Market entry details (such as licensing) 0.00
Interconnection information 0.00
White papers / consultancy papers 0.00
Scarce resources (e.g. spectrum allocation) 0.00
General information 1.85 Mission statements 0.00
Local languages 1.50
Links to local and international sites 3.00
Contact details of key officials (phone numbers,emails, or on line contact form)
3.50
Ease of use (navigation tools, website maps,search engine, overall organization)
1.00
Organization chart (or equivalent) 0.00
Universal service /universal access
0.00 Policy information, reports and plans 0.00
Total (weighted) 0.53
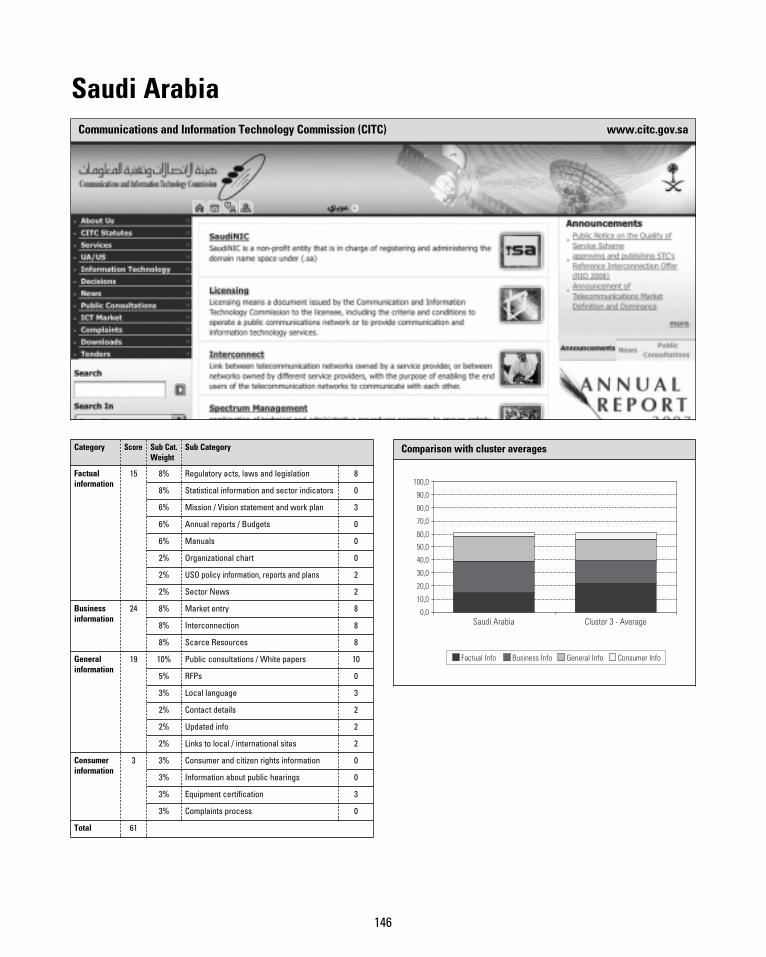
146
Saudi ArabiaCommunications and Information Technology Commission (CITC) www.citc.gov.sa
Category Score Sub Cat.Weight
Sub Category
Factualinformation
15 8% Regulatory acts, laws and legislation 8
8% Statistical information and sector indicators 0
6% Mission / Vision statement and work plan 3
6% Annual reports / Budgets 0
6% Manuals 0
2% Organizational chart 0
2% USO policy information, reports and plans 2
2% Sector News 2
Businessinformation
24 8% Market entry 8
8% Interconnection 8
8% Scarce Resources 8
Generalinformation
19 10% Public consultations / White papers 10
5% RFPs 0
3% Local language 3
2% Contact details 2
2% Updated info 2
2% Links to local / international sites 2
Consumerinformation
3 3% Consumer and citizen rights information 0
3% Information about public hearings 0
3% Equipment certification 3
3% Complaints process 0
Total 61
Comparison with cluster averages
0,0
10,0
20,0
30,0
40,0
50,0
60,0
70,0
80,0
90,0
100,0
0
Saudi Arabia Cluster 3 - Average
Factual Info Business Info General Info Consumer Info
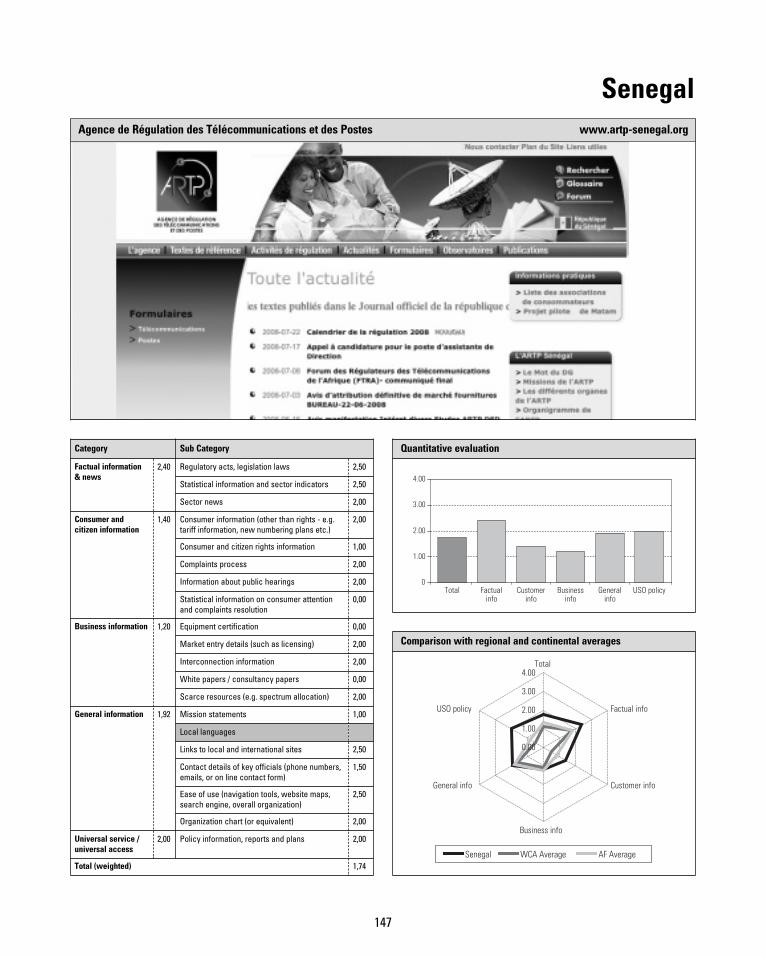
147
SenegalAgence de Régulation des Télécommunications et des Postes www.artp-senegal.org
Quantitative evaluation
Total Factualinfo
Customerinfo
Businessinfo
Generalinfo
USO policy0
1.00
2.00
3.00
4.00
Comparison with regional and continental averages
Senegal WCA Average AF Average
0.00
1.00
2.00
3.00
4.00Total
Factual info
Customer info
Business info
General info
USO policy
0
Category Sub Category
Factual information& news
2,40 Regulatory acts, legislation laws 2,50
Statistical information and sector indicators 2,50
Sector news 2,00
Consumer andcitizen information
1,40 Consumer information (other than rights - e.g.tariff information, new numbering plans etc.)
2,00
Consumer and citizen rights information 1,00
Complaints process 2,00
Information about public hearings 2,00
Statistical information on consumer attentionand complaints resolution
0,00
Business information 1,20 Equipment certification 0,00
Market entry details (such as licensing) 2,00
Interconnection information 2,00
White papers / consultancy papers 0,00
Scarce resources (e.g. spectrum allocation) 2,00
General information 1,92 Mission statements 1,00
Local languages
Links to local and international sites 2,50
Contact details of key officials (phone numbers,emails, or on line contact form)
1,50
Ease of use (navigation tools, website maps,search engine, overall organization)
2,50
Organization chart (or equivalent) 2,00
Universal service /universal access
2,00 Policy information, reports and plans 2,00
Total (weighted) 1,74
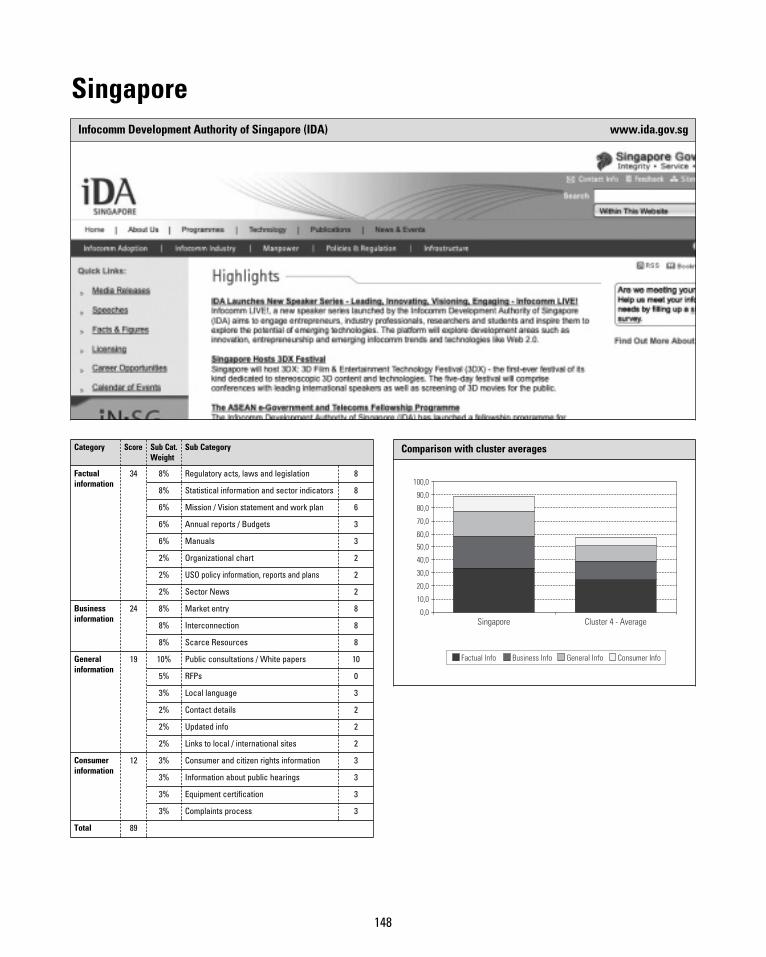
148
SingaporeInfocomm Development Authority of Singapore (IDA) www.ida.gov.sg
Category Score Sub Cat.Weight
Sub Category
Factualinformation
34 8% Regulatory acts, laws and legislation 8
8% Statistical information and sector indicators 8
6% Mission / Vision statement and work plan 6
6% Annual reports / Budgets 3
6% Manuals 3
2% Organizational chart 2
2% USO policy information, reports and plans 2
2% Sector News 2
Businessinformation
24 8% Market entry 8
8% Interconnection 8
8% Scarce Resources 8
Generalinformation
19 10% Public consultations / White papers 10
5% RFPs 0
3% Local language 3
2% Contact details 2
2% Updated info 2
2% Links to local / international sites 2
Consumerinformation
12 3% Consumer and citizen rights information 3
3% Information about public hearings 3
3% Equipment certification 3
3% Complaints process 3
Total 89
Comparison with cluster averages
0,0
10,0
20,0
30,0
40,0
50,0
60,0
70,0
80,0
90,0
100,0
0
Singapore Cluster 4 - Average
Factual Info Business Info General Info Consumer Info
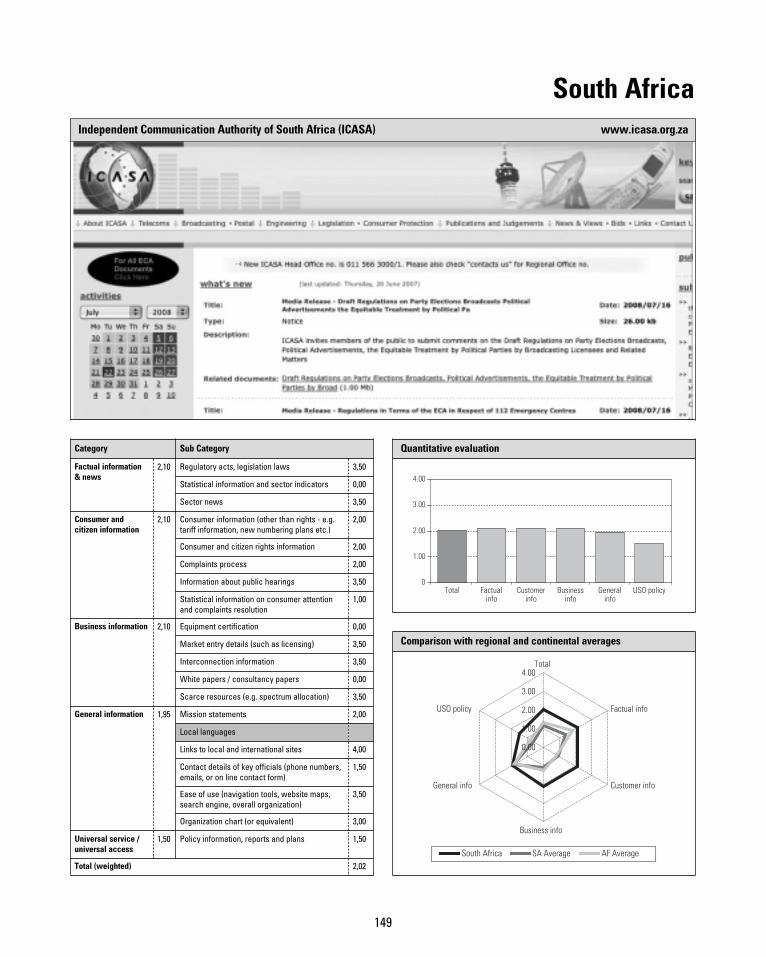
149
South AfricaIndependent Communication Authority of South Africa (ICASA) www.icasa.org.za
Quantitative evaluation
Total Factualinfo
Customerinfo
Businessinfo
Generalinfo
USO policy0
1.00
2.00
3.00
4.00
Comparison with regional and continental averages
South Africa SA Average AF Average
0.00
1.00
2.00
3.00
4.00Total
Factual info
Customer info
Business info
General info
USO policy
Category Sub Category
Factual information& news
2,10 Regulatory acts, legislation laws 3,50
Statistical information and sector indicators 0,00
Sector news 3,50
Consumer andcitizen information
2,10 Consumer information (other than rights - e.g.tariff information, new numbering plans etc.)
2,00
Consumer and citizen rights information 2,00
Complaints process 2,00
Information about public hearings 3,50
Statistical information on consumer attentionand complaints resolution
1,00
Business information 2,10 Equipment certification 0,00
Market entry details (such as licensing) 3,50
Interconnection information 3,50
White papers / consultancy papers 0,00
Scarce resources (e.g. spectrum allocation) 3,50
General information 1,95 Mission statements 2,00
Local languages
Links to local and international sites 4,00
Contact details of key officials (phone numbers,emails, or on line contact form)
1,50
Ease of use (navigation tools, website maps,search engine, overall organization)
3,50
Organization chart (or equivalent) 3,00
Universal service /universal access
1,50 Policy information, reports and plans 1,50
Total (weighted) 2,02
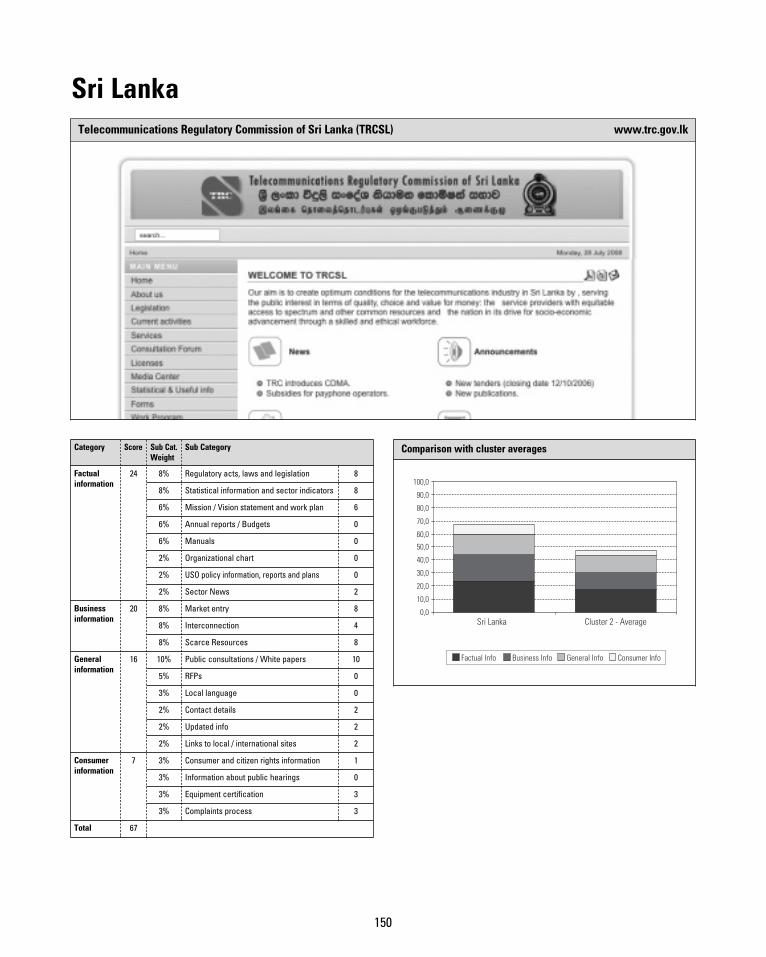
150
Sri LankaTelecommunications Regulatory Commission of Sri Lanka (TRCSL) www.trc.gov.lk
Category Score Sub Cat.Weight
Sub Category
Factualinformation
24 8% Regulatory acts, laws and legislation 8
8% Statistical information and sector indicators 8
6% Mission / Vision statement and work plan 6
6% Annual reports / Budgets 0
6% Manuals 0
2% Organizational chart 0
2% USO policy information, reports and plans 0
2% Sector News 2
Businessinformation
20 8% Market entry 8
8% Interconnection 4
8% Scarce Resources 8
Generalinformation
16 10% Public consultations / White papers 10
5% RFPs 0
3% Local language 0
2% Contact details 2
2% Updated info 2
2% Links to local / international sites 2
Consumerinformation
7 3% Consumer and citizen rights information 1
3% Information about public hearings 0
3% Equipment certification 3
3% Complaints process 3
Total 67
Comparison with cluster averages
0,0
10,0
20,0
30,0
40,0
50,0
60,0
70,0
80,0
90,0
100,0
0Sri Lanka Cluster 2 - Average
Factual Info Business Info General Info Consumer Info
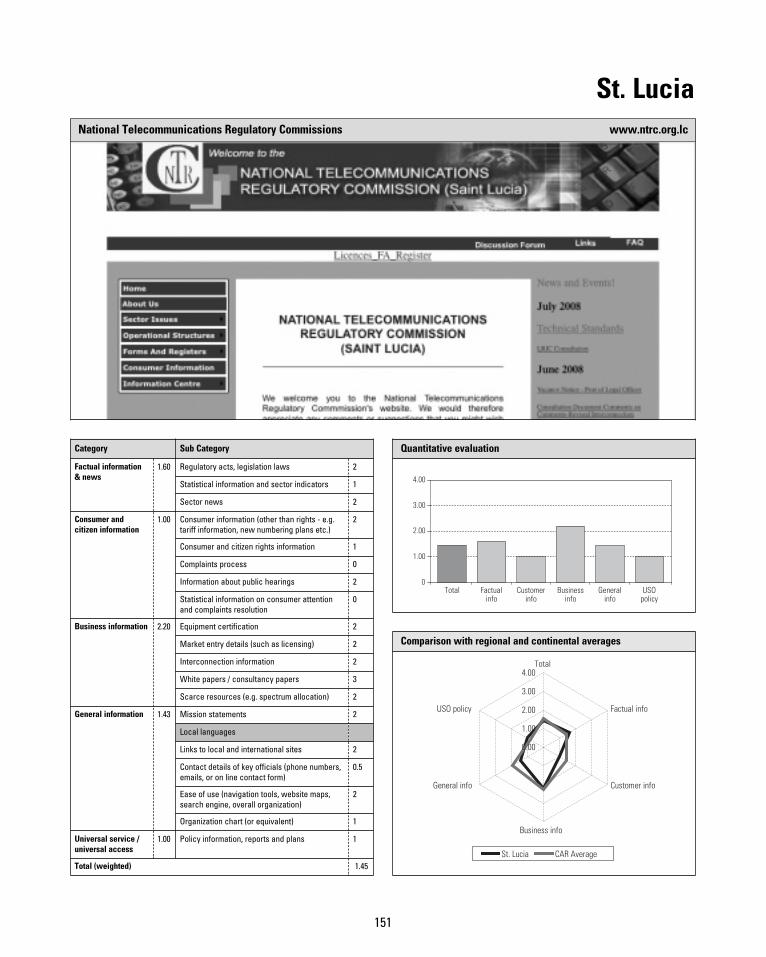
151
St. LuciaNational Telecommunications Regulatory Commissions www.ntrc.org.lc
Quantitative evaluation
Total Factualinfo
Customerinfo
Businessinfo
Generalinfo
USOpolicy
0
1.00
2.00
3.00
4.00
Comparison with regional and continental averages
St. Lucia CAR Average
0.00
1.00
2.00
3.00
4.00Total
Factual info
Customer info
Business info
General info
USO policy
0
Category Sub Category
Factual information& news
1.60 Regulatory acts, legislation laws 2
Statistical information and sector indicators 1
Sector news 2
Consumer andcitizen information
1.00 Consumer information (other than rights - e.g.tariff information, new numbering plans etc.)
2
Consumer and citizen rights information 1
Complaints process 0
Information about public hearings 2
Statistical information on consumer attentionand complaints resolution
0
Business information 2.20 Equipment certification 2
Market entry details (such as licensing) 2
Interconnection information 2
White papers / consultancy papers 3
Scarce resources (e.g. spectrum allocation) 2
General information 1.43 Mission statements 2
Local languages
Links to local and international sites 2
Contact details of key officials (phone numbers,emails, or on line contact form)
0.5
Ease of use (navigation tools, website maps,search engine, overall organization)
2
Organization chart (or equivalent) 1
Universal service /universal access
1.00 Policy information, reports and plans 1
Total (weighted) 1.45
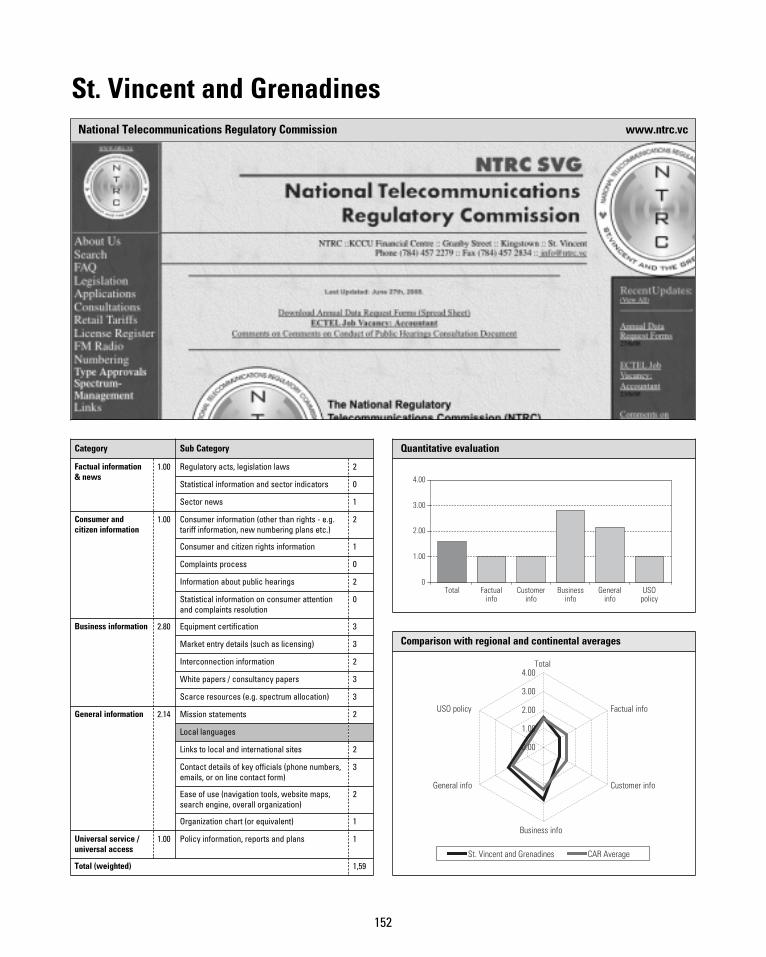
152
St. Vincent and GrenadinesNational Telecommunications Regulatory Commission www.ntrc.vc
Quantitative evaluation
Total Factualinfo
Customerinfo
Businessinfo
Generalinfo
USOpolicy
0
1.00
2.00
3.00
4.00
Comparison with regional and continental averages
St. Vincent and Grenadines CAR Average
0.00
1.00
2.00
3.00
4.00Total
Factual info
Customer info
Business info
General info
USO policy
0
Category Sub Category
Factual information& news
1.00 Regulatory acts, legislation laws 2
Statistical information and sector indicators 0
Sector news 1
Consumer andcitizen information
1.00 Consumer information (other than rights - e.g.tariff information, new numbering plans etc.)
2
Consumer and citizen rights information 1
Complaints process 0
Information about public hearings 2
Statistical information on consumer attentionand complaints resolution
0
Business information 2.80 Equipment certification 3
Market entry details (such as licensing) 3
Interconnection information 2
White papers / consultancy papers 3
Scarce resources (e.g. spectrum allocation) 3
General information 2.14 Mission statements 2
Local languages
Links to local and international sites 2
Contact details of key officials (phone numbers,emails, or on line contact form)
3
Ease of use (navigation tools, website maps,search engine, overall organization)
2
Organization chart (or equivalent) 1
Universal service /universal access
1.00 Policy information, reports and plans 1
Total (weighted) 1,59
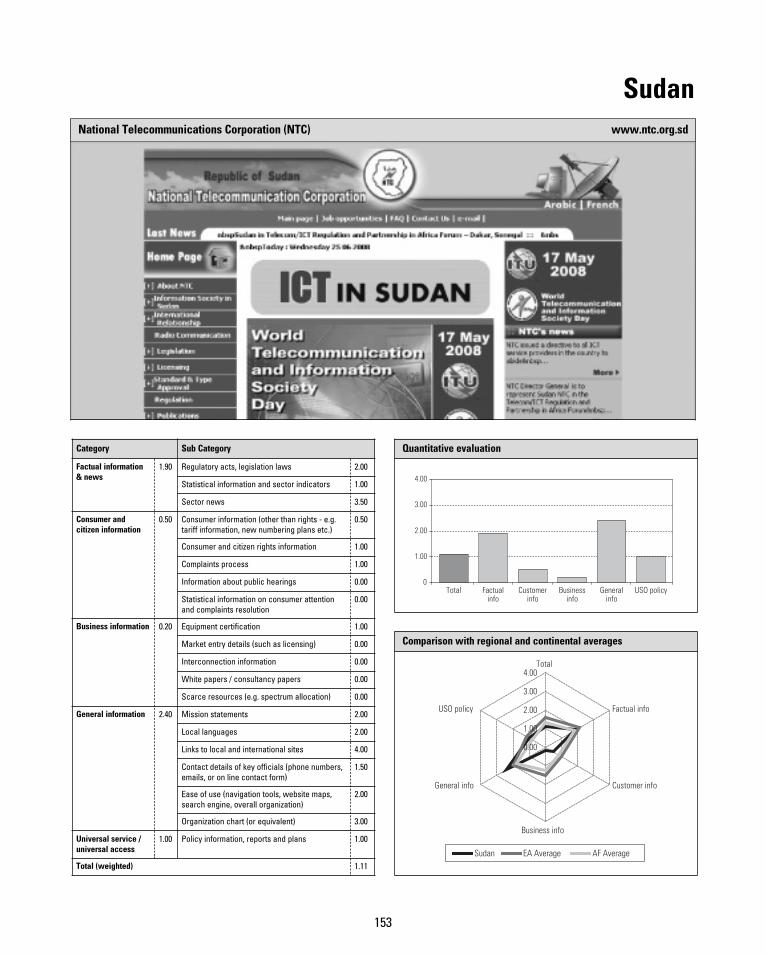
153
SudanNational Telecommunications Corporation (NTC) www.ntc.org.sd
Quantitative evaluation
Total Factualinfo
Customerinfo
Businessinfo
Generalinfo
USO policy0
1.00
2.00
3.00
4.00
Comparison with regional and continental averages
Sudan EA Average AF Average
0.00
1.00
2.00
3.00
4.00Total
Factual info
Customer info
Business info
General info
USO policy
0
Category Sub Category
Factual information& news
1.90 Regulatory acts, legislation laws 2.00
Statistical information and sector indicators 1.00
Sector news 3.50
Consumer andcitizen information
0.50 Consumer information (other than rights - e.g.tariff information, new numbering plans etc.)
0.50
Consumer and citizen rights information 1.00
Complaints process 1.00
Information about public hearings 0.00
Statistical information on consumer attentionand complaints resolution
0.00
Business information 0.20 Equipment certification 1.00
Market entry details (such as licensing) 0.00
Interconnection information 0.00
White papers / consultancy papers 0.00
Scarce resources (e.g. spectrum allocation) 0.00
General information 2.40 Mission statements 2.00
Local languages 2.00
Links to local and international sites 4.00
Contact details of key officials (phone numbers,emails, or on line contact form)
1.50
Ease of use (navigation tools, website maps,search engine, overall organization)
2.00
Organization chart (or equivalent) 3.00
Universal service /universal access
1.00 Policy information, reports and plans 1.00
Total (weighted) 1.11
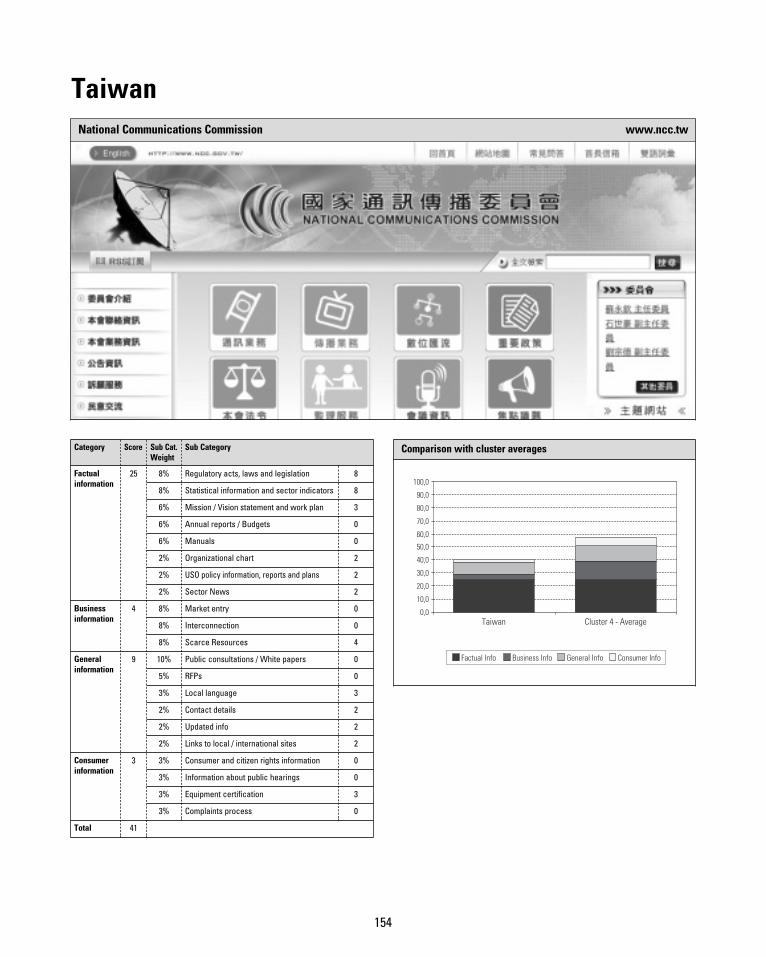
154
TaiwanNational Communications Commission www.ncc.tw
Category Score Sub Cat.Weight
Sub Category
Factualinformation
25 8% Regulatory acts, laws and legislation 8
8% Statistical information and sector indicators 8
6% Mission / Vision statement and work plan 3
6% Annual reports / Budgets 0
6% Manuals 0
2% Organizational chart 2
2% USO policy information, reports and plans 2
2% Sector News 2
Businessinformation
4 8% Market entry 0
8% Interconnection 0
8% Scarce Resources 4
Generalinformation
9 10% Public consultations / White papers 0
5% RFPs 0
3% Local language 3
2% Contact details 2
2% Updated info 2
2% Links to local / international sites 2
Consumerinformation
3 3% Consumer and citizen rights information 0
3% Information about public hearings 0
3% Equipment certification 3
3% Complaints process 0
Total 41
Comparison with cluster averages
0,0
10,0
20,0
30,0
40,0
50,0
60,0
70,0
80,0
90,0
100,0
0Taiwan Cluster 4 - Average
Factual Info Business Info General Info Consumer Info
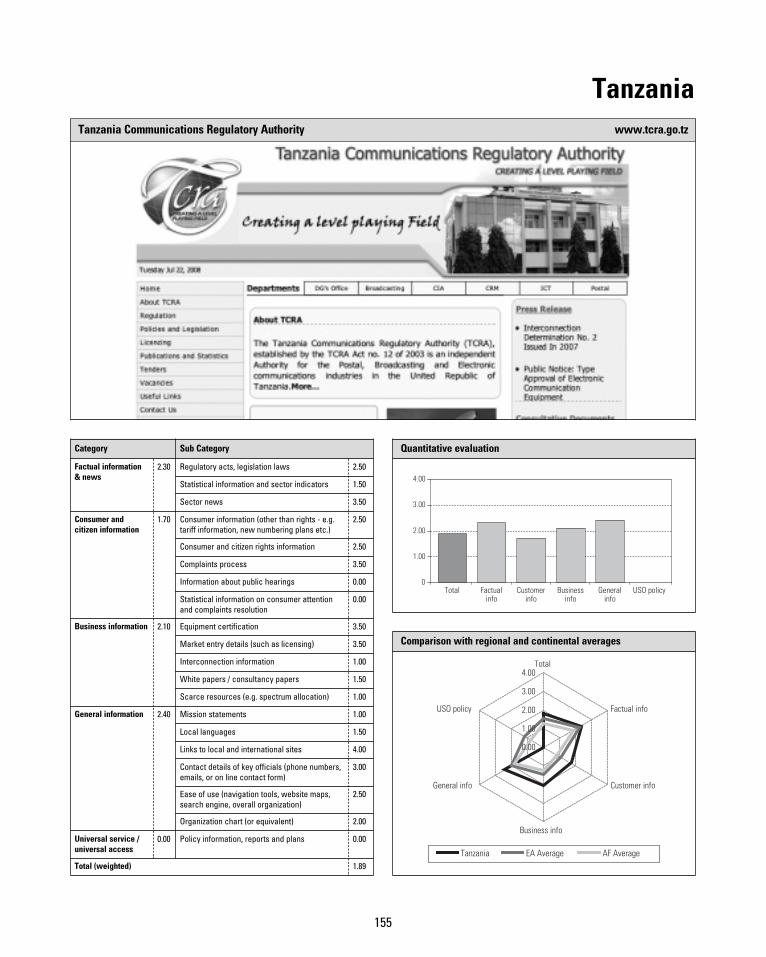
155
TanzaniaTanzania Communications Regulatory Authority www.tcra.go.tz
Quantitative evaluation
Total Factualinfo
Customerinfo
Businessinfo
Generalinfo
USO policy0
1.00
2.00
3.00
4.00
Comparison with regional and continental averages
Tanzania EA Average AF Average
0.00
1.00
2.00
3.00
4.00Total
Factual info
Customer info
Business info
General info
USO policy
0
Category Sub Category
Factual information& news
2.30 Regulatory acts, legislation laws 2.50
Statistical information and sector indicators 1.50
Sector news 3.50
Consumer andcitizen information
1.70 Consumer information (other than rights - e.g.tariff information, new numbering plans etc.)
2.50
Consumer and citizen rights information 2.50
Complaints process 3.50
Information about public hearings 0.00
Statistical information on consumer attentionand complaints resolution
0.00
Business information 2.10 Equipment certification 3.50
Market entry details (such as licensing) 3.50
Interconnection information 1.00
White papers / consultancy papers 1.50
Scarce resources (e.g. spectrum allocation) 1.00
General information 2.40 Mission statements 1.00
Local languages 1.50
Links to local and international sites 4.00
Contact details of key officials (phone numbers,emails, or on line contact form)
3.00
Ease of use (navigation tools, website maps,search engine, overall organization)
2.50
Organization chart (or equivalent) 2.00
Universal service /universal access
0.00 Policy information, reports and plans 0.00
Total (weighted) 1.89
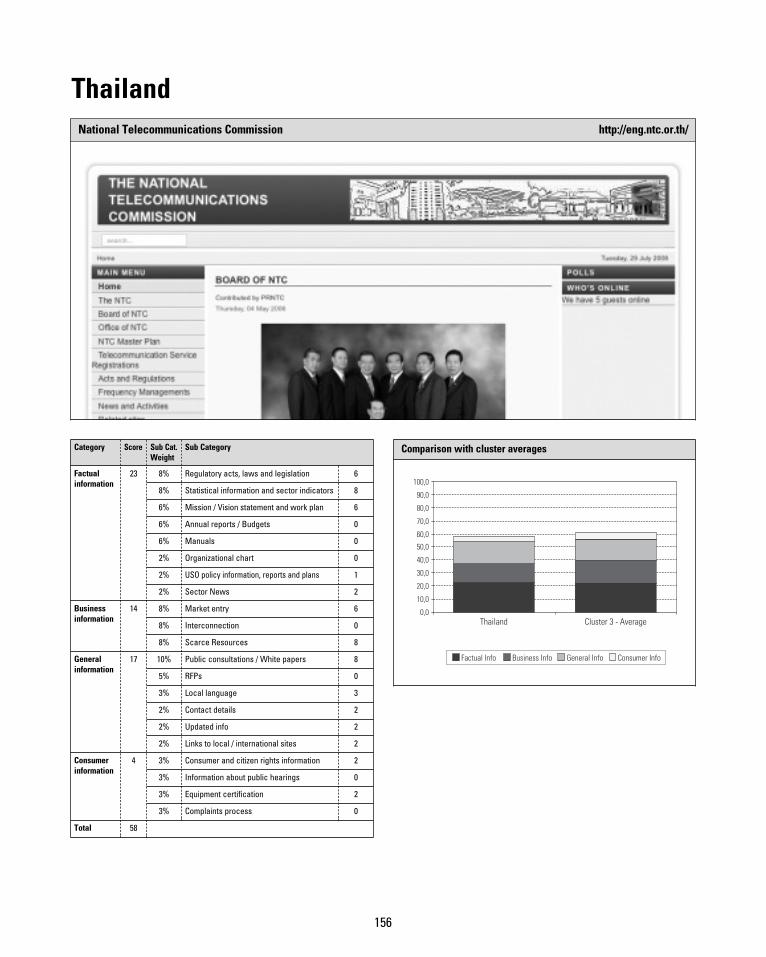
156
ThailandNational Telecommunications Commission http://eng.ntc.or.th/
Category Score Sub Cat.Weight
Sub Category
Factualinformation
23 8% Regulatory acts, laws and legislation 6
8% Statistical information and sector indicators 8
6% Mission / Vision statement and work plan 6
6% Annual reports / Budgets 0
6% Manuals 0
2% Organizational chart 0
2% USO policy information, reports and plans 1
2% Sector News 2
Businessinformation
14 8% Market entry 6
8% Interconnection 0
8% Scarce Resources 8
Generalinformation
17 10% Public consultations / White papers 8
5% RFPs 0
3% Local language 3
2% Contact details 2
2% Updated info 2
2% Links to local / international sites 2
Consumerinformation
4 3% Consumer and citizen rights information 2
3% Information about public hearings 0
3% Equipment certification 2
3% Complaints process 0
Total 58
Comparison with cluster averages
0,0
10,0
20,0
30,0
40,0
50,0
60,0
70,0
80,0
90,0
100,0
0
Thailand Cluster 3 - Average
Factual Info Business Info General Info Consumer Info
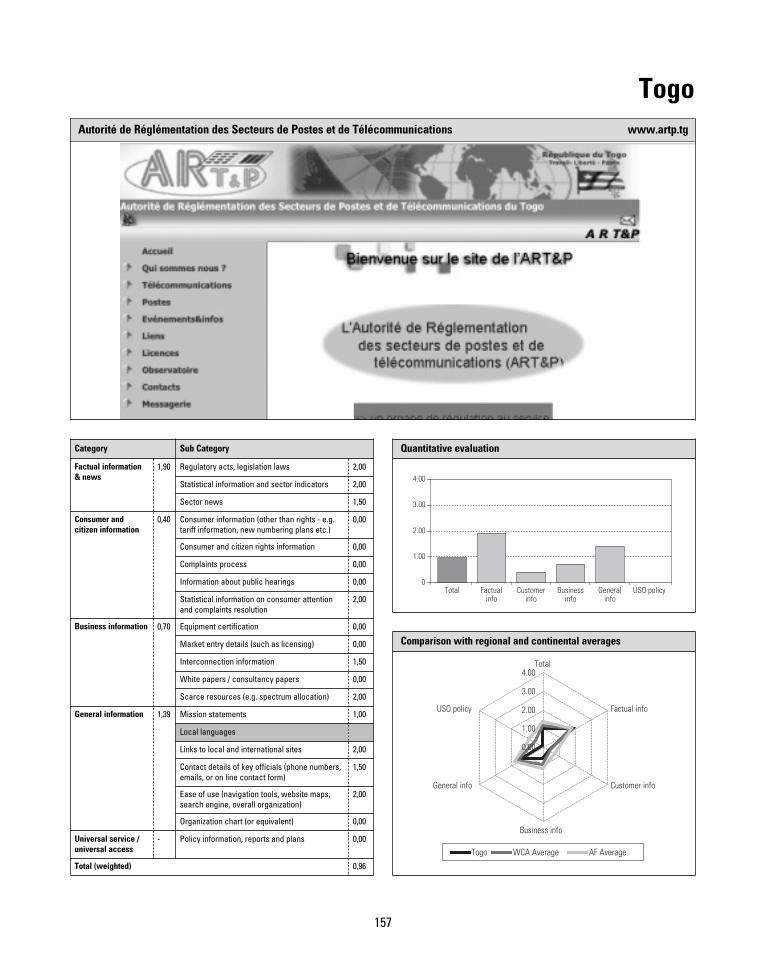
157
TogoAutorité de Réglémentation des Secteurs de Postes et de Télécommunications www.artp.tg
Quantitative evaluation
Total Factualinfo
Customerinfo
Businessinfo
Generalinfo
USO policy0
1.00
2.00
3.00
4.00
Comparison with regional and continental averages
Togo WCA Average AF Average
0.00
1.00
2.00
3.00
4.00Total
Factual info
Customer info
Business info
General info
USO policy
0
Category Sub Category
Factual information& news
1,90 Regulatory acts, legislation laws 2,00
Statistical information and sector indicators 2,00
Sector news 1,50
Consumer andcitizen information
0,40 Consumer information (other than rights - e.g.tariff information, new numbering plans etc.)
0,00
Consumer and citizen rights information 0,00
Complaints process 0,00
Information about public hearings 0,00
Statistical information on consumer attentionand complaints resolution
2,00
Business information 0,70 Equipment certification 0,00
Market entry details (such as licensing) 0,00
Interconnection information 1,50
White papers / consultancy papers 0,00
Scarce resources (e.g. spectrum allocation) 2,00
General information 1,39 Mission statements 1,00
Local languages
Links to local and international sites 2,00
Contact details of key officials (phone numbers,emails, or on line contact form)
1,50
Ease of use (navigation tools, website maps,search engine, overall organization)
2,00
Organization chart (or equivalent) 0,00
Universal service /universal access
- Policy information, reports and plans 0,00
Total (weighted) 0,96
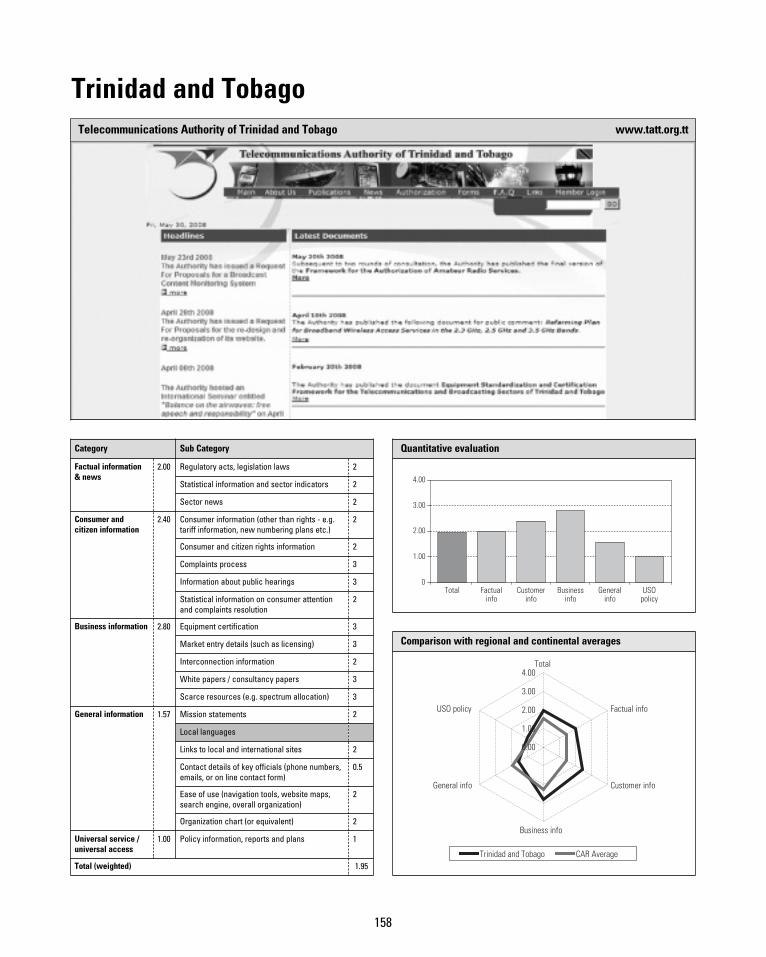
158
Trinidad and TobagoTelecommunications Authority of Trinidad and Tobago www.tatt.org.tt
Quantitative evaluation
Total Factualinfo
Customerinfo
Businessinfo
Generalinfo
USOpolicy
0
1.00
2.00
3.00
4.00
Comparison with regional and continental averages
Trinidad and Tobago CAR Average
0.00
1.00
2.00
3.00
4.00Total
Factual info
Customer info
Business info
General info
USO policy
0
Category Sub Category
Factual information& news
2.00 Regulatory acts, legislation laws 2
Statistical information and sector indicators 2
Sector news 2
Consumer andcitizen information
2.40 Consumer information (other than rights - e.g.tariff information, new numbering plans etc.)
2
Consumer and citizen rights information 2
Complaints process 3
Information about public hearings 3
Statistical information on consumer attentionand complaints resolution
2
Business information 2.80 Equipment certification 3
Market entry details (such as licensing) 3
Interconnection information 2
White papers / consultancy papers 3
Scarce resources (e.g. spectrum allocation) 3
General information 1.57 Mission statements 2
Local languages
Links to local and international sites 2
Contact details of key officials (phone numbers,emails, or on line contact form)
0.5
Ease of use (navigation tools, website maps,search engine, overall organization)
2
Organization chart (or equivalent) 2
Universal service /universal access
1.00 Policy information, reports and plans 1
Total (weighted) 1.95
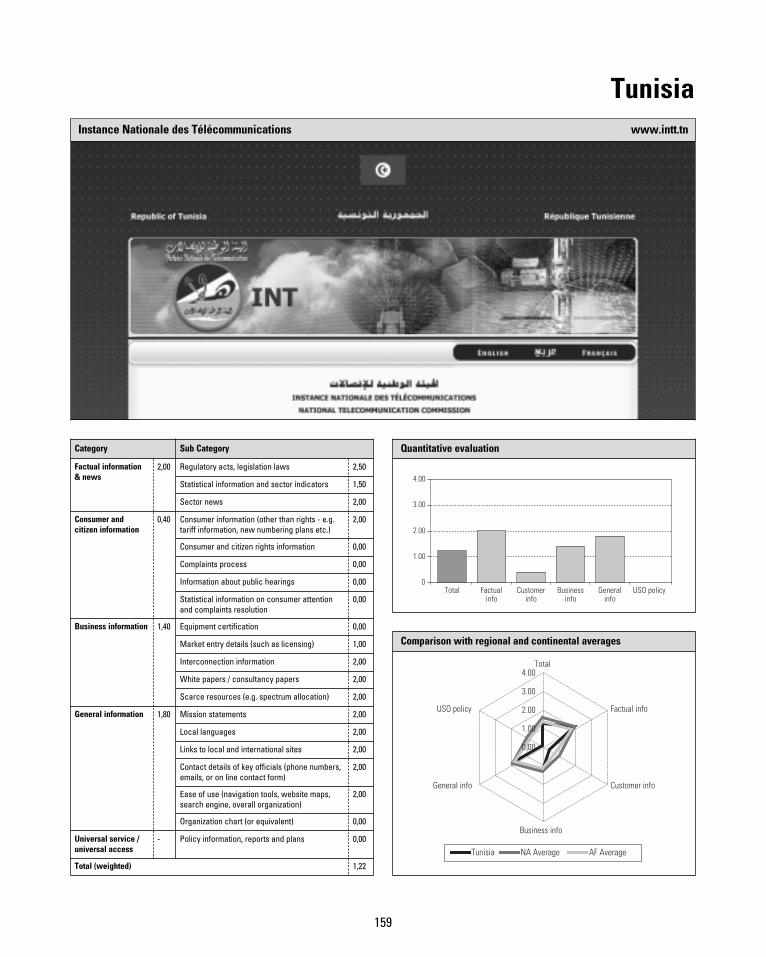
159
TunisiaInstance Nationale des Télécommunications www.intt.tn
Quantitative evaluation
Total Factualinfo
Customerinfo
Businessinfo
Generalinfo
USO policy0
1.00
2.00
3.00
4.00
Comparison with regional and continental averages
Tunisia NA Average AF Average
0.00
1.00
2.00
3.00
4.00Total
Factual info
Customer info
Business info
General info
USO policy
Category Sub Category
Factual information& news
2,00 Regulatory acts, legislation laws 2,50
Statistical information and sector indicators 1,50
Sector news 2,00
Consumer andcitizen information
0,40 Consumer information (other than rights - e.g.tariff information, new numbering plans etc.)
2,00
Consumer and citizen rights information 0,00
Complaints process 0,00
Information about public hearings 0,00
Statistical information on consumer attentionand complaints resolution
0,00
Business information 1,40 Equipment certification 0,00
Market entry details (such as licensing) 1,00
Interconnection information 2,00
White papers / consultancy papers 2,00
Scarce resources (e.g. spectrum allocation) 2,00
General information 1,80 Mission statements 2,00
Local languages 2,00
Links to local and international sites 2,00
Contact details of key officials (phone numbers,emails, or on line contact form)
2,00
Ease of use (navigation tools, website maps,search engine, overall organization)
2,00
Organization chart (or equivalent) 0,00
Universal service /universal access
- Policy information, reports and plans 0,00
Total (weighted) 1,22
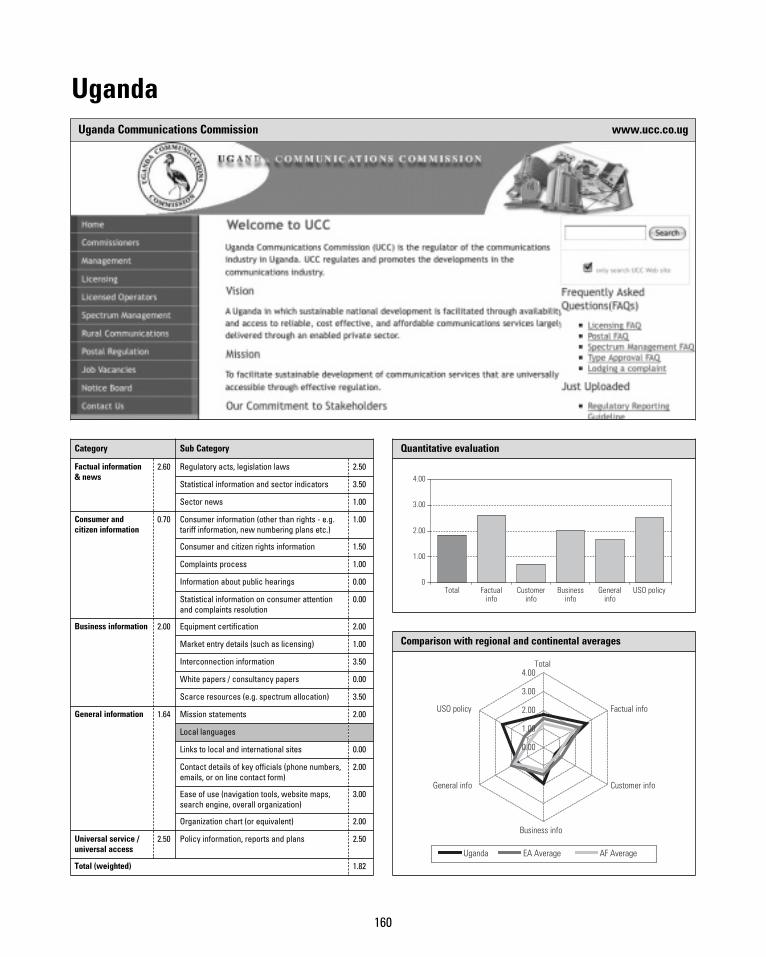
160
UgandaUganda Communications Commission www.ucc.co.ug
Quantitative evaluation
Total Factualinfo
Customerinfo
Businessinfo
Generalinfo
USO policy0
1.00
2.00
3.00
4.00
Comparison with regional and continental averages
Uganda EA Average AF Average
0.00
1.00
2.00
3.00
4.00Total
Factual info
Customer info
Business info
General info
USO policy
0
Category Sub Category
Factual information& news
2.60 Regulatory acts, legislation laws 2.50
Statistical information and sector indicators 3.50
Sector news 1.00
Consumer andcitizen information
0.70 Consumer information (other than rights - e.g.tariff information, new numbering plans etc.)
1.00
Consumer and citizen rights information 1.50
Complaints process 1.00
Information about public hearings 0.00
Statistical information on consumer attentionand complaints resolution
0.00
Business information 2.00 Equipment certification 2.00
Market entry details (such as licensing) 1.00
Interconnection information 3.50
White papers / consultancy papers 0.00
Scarce resources (e.g. spectrum allocation) 3.50
General information 1.64 Mission statements 2.00
Local languages
Links to local and international sites 0.00
Contact details of key officials (phone numbers,emails, or on line contact form)
2.00
Ease of use (navigation tools, website maps,search engine, overall organization)
3.00
Organization chart (or equivalent) 2.00
Universal service /universal access
2.50 Policy information, reports and plans 2.50
Total (weighted) 1.82
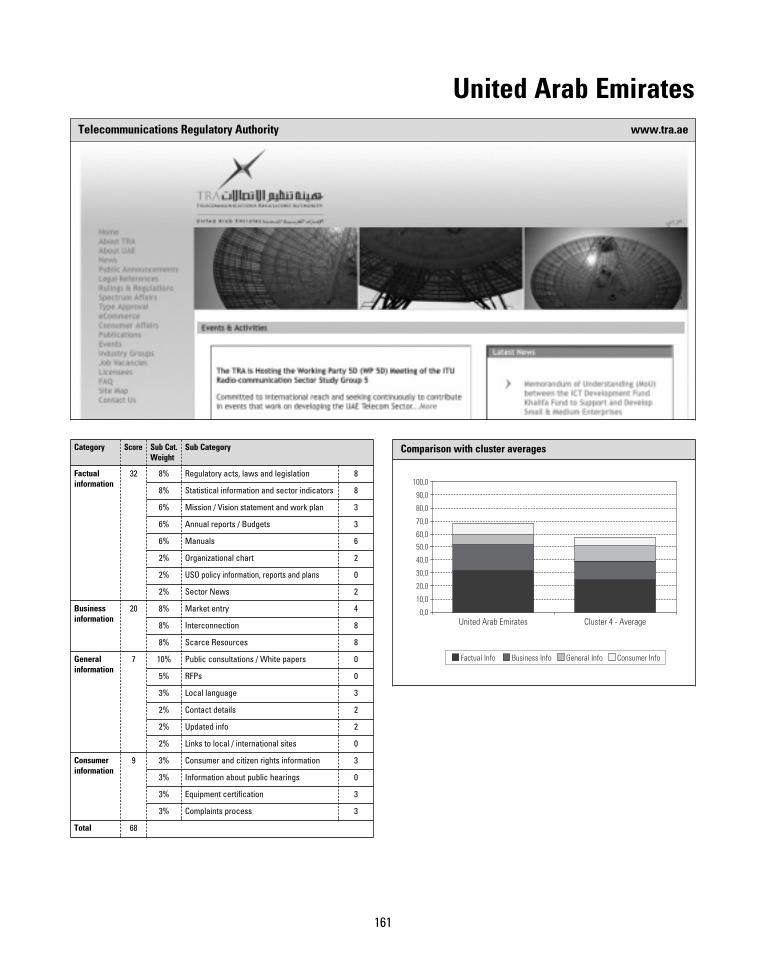
161
United Arab EmiratesTelecommunications Regulatory Authority www.tra.ae
Category Score Sub Cat.Weight
Sub Category
Factualinformation
32 8% Regulatory acts, laws and legislation 8
8% Statistical information and sector indicators 8
6% Mission / Vision statement and work plan 3
6% Annual reports / Budgets 3
6% Manuals 6
2% Organizational chart 2
2% USO policy information, reports and plans 0
2% Sector News 2
Businessinformation
20 8% Market entry 4
8% Interconnection 8
8% Scarce Resources 8
Generalinformation
7 10% Public consultations / White papers 0
5% RFPs 0
3% Local language 3
2% Contact details 2
2% Updated info 2
2% Links to local / international sites 0
Consumerinformation
9 3% Consumer and citizen rights information 3
3% Information about public hearings 0
3% Equipment certification 3
3% Complaints process 3
Total 68
Comparison with cluster averages
0,0
10,0
20,0
30,0
40,0
50,0
60,0
70,0
80,0
90,0
100,0
0
United Arab Emirates Cluster 4 - Average
Factual Info Business Info General Info Consumer Info
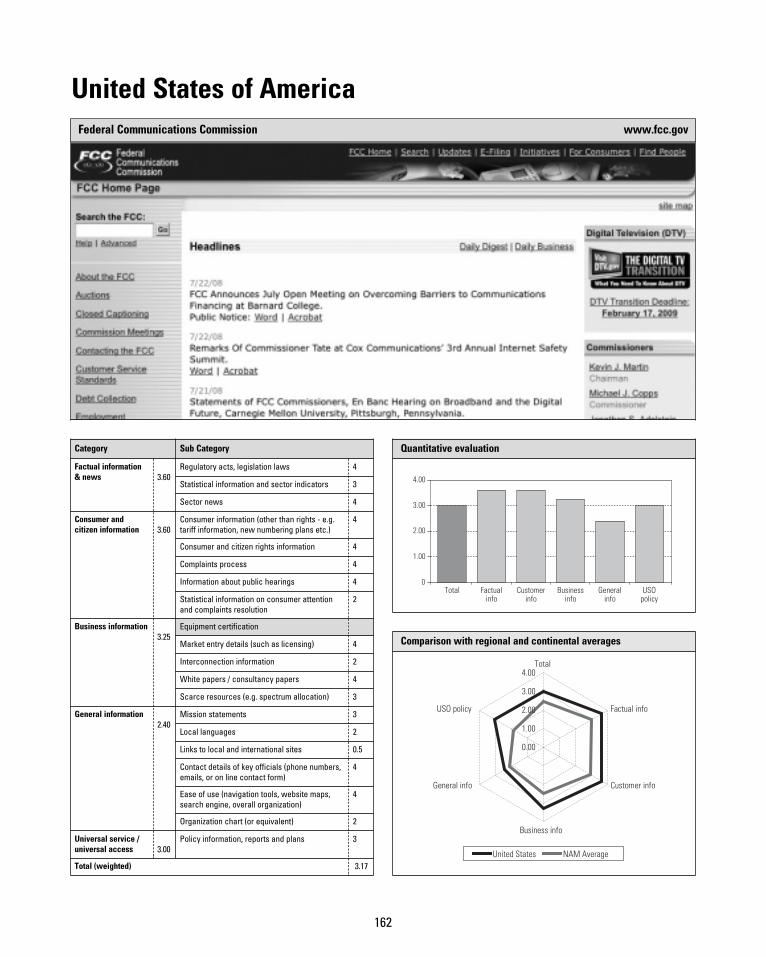
162
United States of AmericaFederal Communications Commission www.fcc.gov
Quantitative evaluation
Total Factualinfo
Customerinfo
Businessinfo
Generalinfo
USOpolicy
0
1.00
2.00
3.00
4.00
Comparison with regional and continental averages
United States NAM Average
0.00
1.00
2.00
3.00
4.00Total
Factual info
Customer info
Business info
General info
USO policy
Category Sub Category
Factual information& news 3.60
Regulatory acts, legislation laws 4
Statistical information and sector indicators 3
Sector news 4
Consumer andcitizen information 3.60
Consumer information (other than rights - e.g.tariff information, new numbering plans etc.)
4
Consumer and citizen rights information 4
Complaints process 4
Information about public hearings 4
Statistical information on consumer attentionand complaints resolution
2
Business information3.25
Equipment certification
Market entry details (such as licensing) 4
Interconnection information 2
White papers / consultancy papers 4
Scarce resources (e.g. spectrum allocation) 3
General information2.40
Mission statements 3
Local languages 2
Links to local and international sites 0.5
Contact details of key officials (phone numbers,emails, or on line contact form)
4
Ease of use (navigation tools, website maps,search engine, overall organization)
4
Organization chart (or equivalent) 2
Universal service /universal access 3.00
Policy information, reports and plans 3
Total (weighted) 3.17
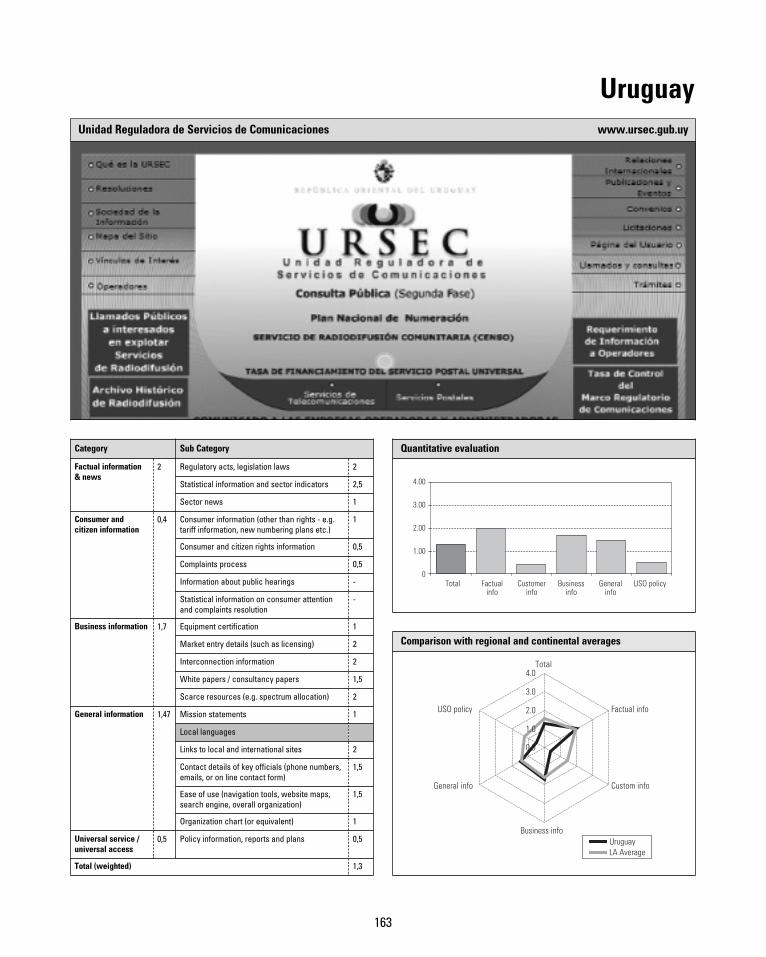
163
UruguayUnidad Reguladora de Servicios de Comunicaciones www.ursec.gub.uy
Quantitative evaluation
Total Factualinfo
Customerinfo
Businessinfo
Generalinfo
USO policy0
1.00
2.00
3.00
4.00
Comparison with regional and continental averages
UruguayLA Average
Total
Factual info
Custom info
Business info
General info
USO policy
0.0
1.0
2.0
3.0
4.0
Category Sub Category
Factual information& news
2 Regulatory acts, legislation laws 2
Statistical information and sector indicators 2,5
Sector news 1
Consumer andcitizen information
0,4 Consumer information (other than rights - e.g.tariff information, new numbering plans etc.)
1
Consumer and citizen rights information 0,5
Complaints process 0,5
Information about public hearings -
Statistical information on consumer attentionand complaints resolution
-
Business information 1,7 Equipment certification 1
Market entry details (such as licensing) 2
Interconnection information 2
White papers / consultancy papers 1,5
Scarce resources (e.g. spectrum allocation) 2
General information 1,47 Mission statements 1
Local languages
Links to local and international sites 2
Contact details of key officials (phone numbers,emails, or on line contact form)
1,5
Ease of use (navigation tools, website maps,search engine, overall organization)
1,5
Organization chart (or equivalent) 1
Universal service /universal access
0,5 Policy information, reports and plans 0,5
Total (weighted) 1,3
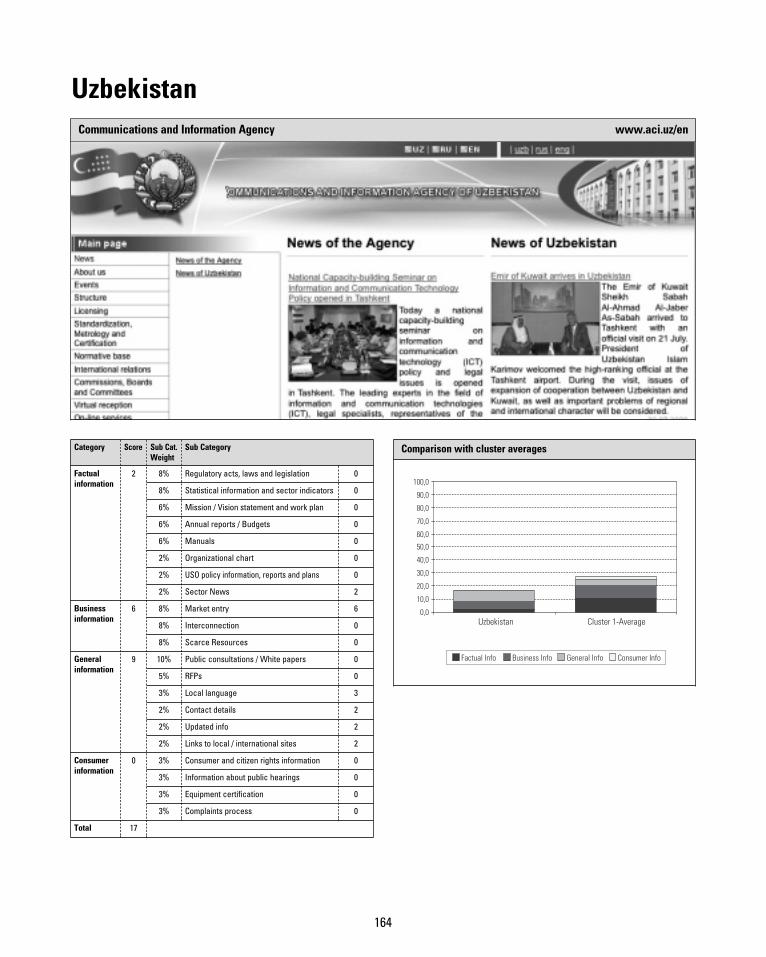
164
UzbekistanCommunications and Information Agency www.aci.uz/en
Category Score Sub Cat.Weight
Sub Category
Factualinformation
2 8% Regulatory acts, laws and legislation 0
8% Statistical information and sector indicators 0
6% Mission / Vision statement and work plan 0
6% Annual reports / Budgets 0
6% Manuals 0
2% Organizational chart 0
2% USO policy information, reports and plans 0
2% Sector News 2
Businessinformation
6 8% Market entry 6
8% Interconnection 0
8% Scarce Resources 0
Generalinformation
9 10% Public consultations / White papers 0
5% RFPs 0
3% Local language 3
2% Contact details 2
2% Updated info 2
2% Links to local / international sites 2
Consumerinformation
0 3% Consumer and citizen rights information 0
3% Information about public hearings 0
3% Equipment certification 0
3% Complaints process 0
Total 17
Comparison with cluster averages
0,0
10,0
20,0
30,0
40,0
50,0
60,0
70,0
80,0
90,0
100,0
0
Uzbekistan Cluster 1-Average
Factual Info Business Info General Info Consumer Info
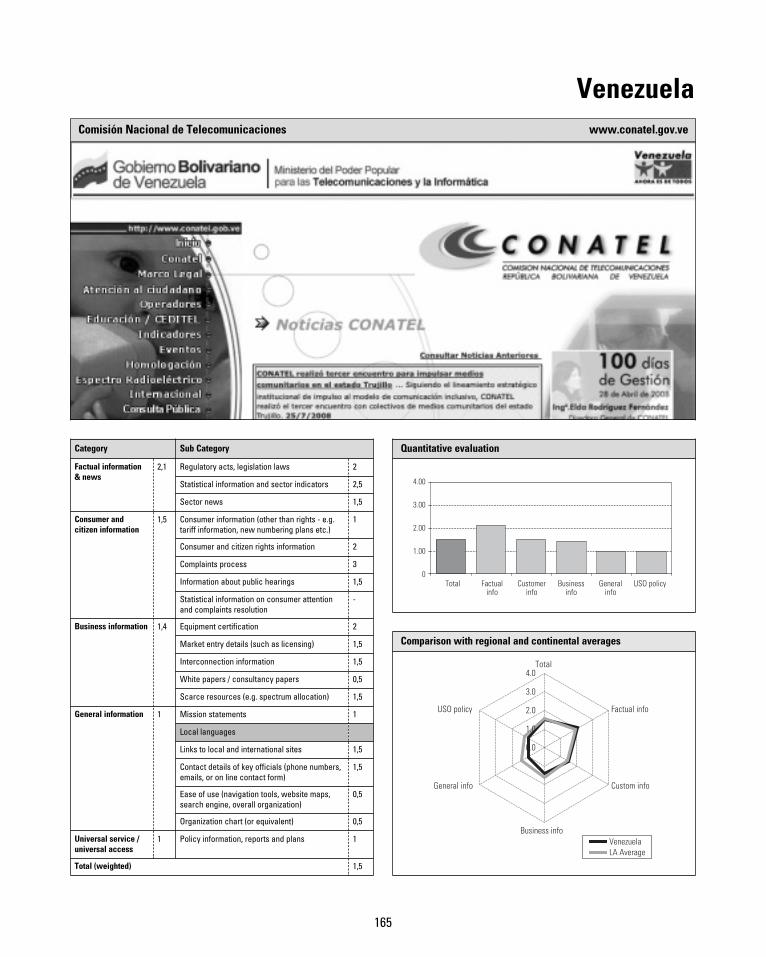
165
VenezuelaComisión Nacional de Telecomunicaciones www.conatel.gov.ve
Quantitative evaluation
Total Factualinfo
Customerinfo
Businessinfo
Generalinfo
USO policy0
1.00
2.00
3.00
4.00
Comparison with regional and continental averages
VenezuelaLA Average
Total
Factual info
Custom info
Business info
General info
USO policy
0.0
1.0
2.0
3.0
4.0
Category Sub Category
Factual information& news
2,1 Regulatory acts, legislation laws 2
Statistical information and sector indicators 2,5
Sector news 1,5
Consumer andcitizen information
1,5 Consumer information (other than rights - e.g.tariff information, new numbering plans etc.)
1
Consumer and citizen rights information 2
Complaints process 3
Information about public hearings 1,5
Statistical information on consumer attentionand complaints resolution
-
Business information 1,4 Equipment certification 2
Market entry details (such as licensing) 1,5
Interconnection information 1,5
White papers / consultancy papers 0,5
Scarce resources (e.g. spectrum allocation) 1,5
General information 1 Mission statements 1
Local languages
Links to local and international sites 1,5
Contact details of key officials (phone numbers,emails, or on line contact form)
1,5
Ease of use (navigation tools, website maps,search engine, overall organization)
0,5
Organization chart (or equivalent) 0,5
Universal service /universal access
1 Policy information, reports and plans 1
Total (weighted) 1,5
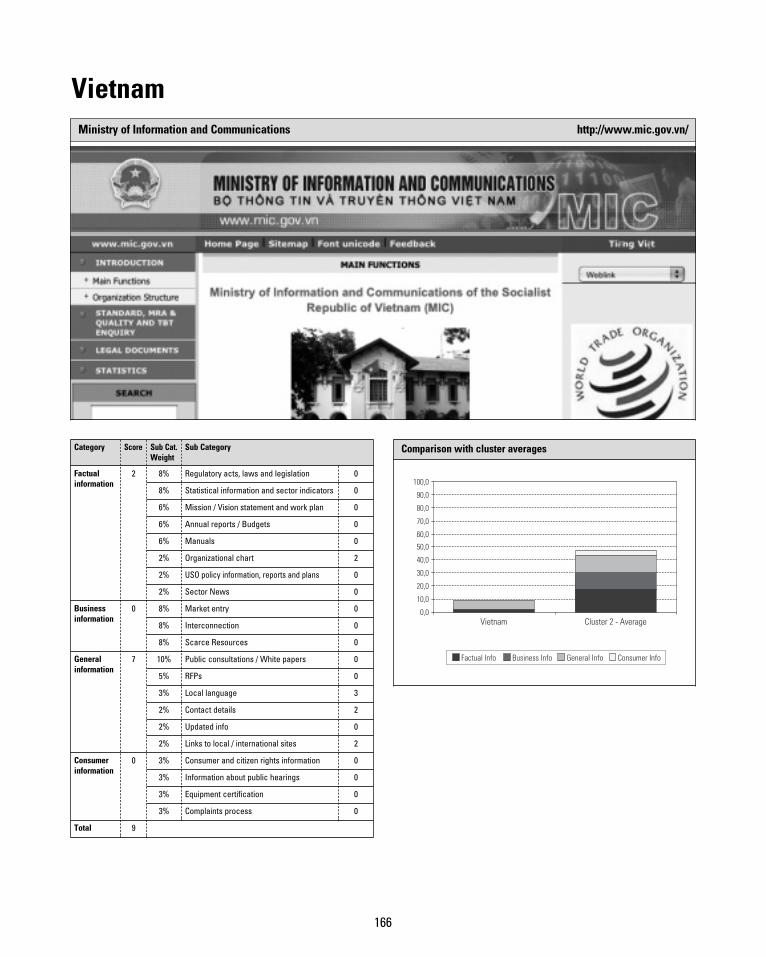
166
VietnamMinistry of Information and Communications http://www.mic.gov.vn/
Category Score Sub Cat.Weight
Sub Category
Factualinformation
2 8% Regulatory acts, laws and legislation 0
8% Statistical information and sector indicators 0
6% Mission / Vision statement and work plan 0
6% Annual reports / Budgets 0
6% Manuals 0
2% Organizational chart 2
2% USO policy information, reports and plans 0
2% Sector News 0
Businessinformation
0 8% Market entry 0
8% Interconnection 0
8% Scarce Resources 0
Generalinformation
7 10% Public consultations / White papers 0
5% RFPs 0
3% Local language 3
2% Contact details 2
2% Updated info 0
2% Links to local / international sites 2
Consumerinformation
0 3% Consumer and citizen rights information 0
3% Information about public hearings 0
3% Equipment certification 0
3% Complaints process 0
Total 9
Comparison with cluster averages
0,0
10,0
20,0
30,0
40,0
50,0
60,0
70,0
80,0
90,0
100,0
0
Vietnam Cluster 2 - Average
Factual Info Business Info General Info Consumer Info
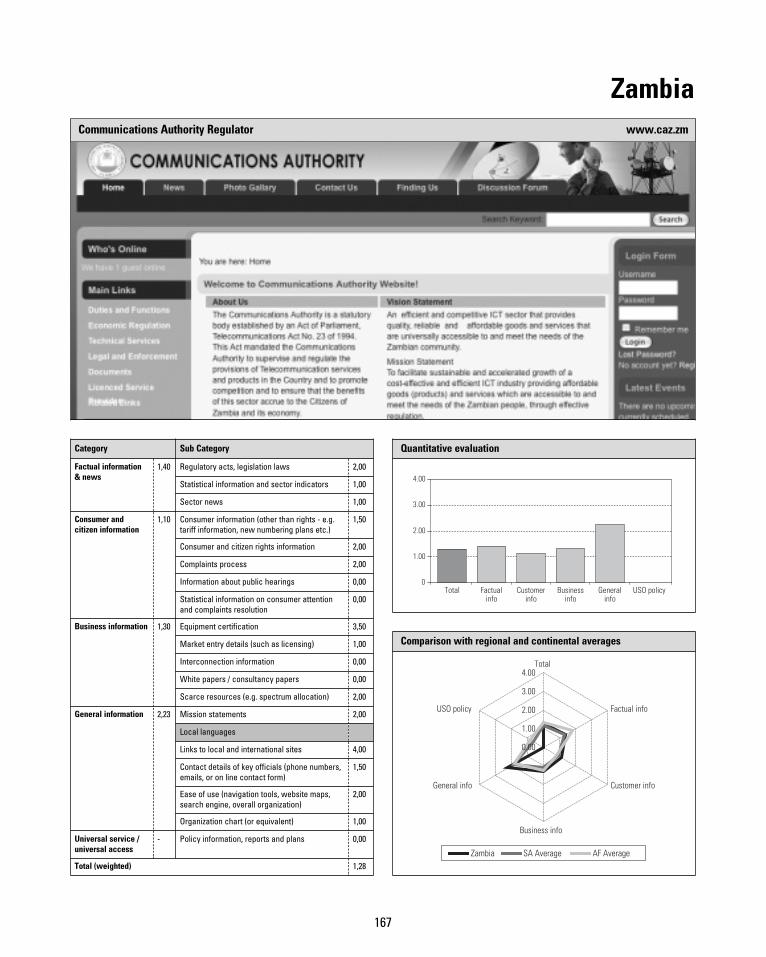
167
ZambiaCommunications Authority Regulator www.caz.zm
Quantitative evaluation
Total Factualinfo
Customerinfo
Businessinfo
Generalinfo
USO policy0
1.00
2.00
3.00
4.00
Comparison with regional and continental averages
Zambia SA Average AF Average
0.00
1.00
2.00
3.00
4.00Total
Factual info
Customer info
Business info
General info
USO policy
Category Sub Category
Factual information& news
1,40 Regulatory acts, legislation laws 2,00
Statistical information and sector indicators 1,00
Sector news 1,00
Consumer andcitizen information
1,10 Consumer information (other than rights - e.g.tariff information, new numbering plans etc.)
1,50
Consumer and citizen rights information 2,00
Complaints process 2,00
Information about public hearings 0,00
Statistical information on consumer attentionand complaints resolution
0,00
Business information 1,30 Equipment certification 3,50
Market entry details (such as licensing) 1,00
Interconnection information 0,00
White papers / consultancy papers 0,00
Scarce resources (e.g. spectrum allocation) 2,00
General information 2,23 Mission statements 2,00
Local languages
Links to local and international sites 4,00
Contact details of key officials (phone numbers,emails, or on line contact form)
1,50
Ease of use (navigation tools, website maps,search engine, overall organization)
2,00
Organization chart (or equivalent) 1,00
Universal service /universal access
- Policy information, reports and plans 0,00
Total (weighted) 1,28

169
Canada’s International Development Research Centre (IDRC) isone of the world’s leading institutions in the generation and appli-cation of new knowledge tomeet the challenges facing developingcountries.IDRC funds applied research by researchers from developing
countries on the problems they identify as crucial to their com-munities. It also provides technical support to those researchers.IDRC builds local capacity in developing countries to undertakeresearch and create innovations, believing that people from devel-oping countries must take the lead in producing and applying
knowledge for the benefit of their own communities. IDRC alsofosters alliances and knowledge sharing between scientific, aca-demic, and development communities in Canada and developingcountries.The mission of IDRC remains “Empowerment through Knowl-
edge,” i.e. to promote interaction, and foster a spirit of cooperationandmutual learning within and among social groups, nations andsocieties through the creation, and adaptation of the knowledgethat the people of developing countries judge to be of greatest rel-evance to their own prosperity, security and equity.
Foundation Partners
International Development Research Centre<www.idrc.ca>
<www.lirne.net>
LIRNE.NET is a Strategic Collaboration between researchers andfaculty from: the Center for Communication,Media and Informa-tion Technologies (CMI) at Aalborg University, Denmark; DIRSI(Regional Dialogue on the Information Society / Diálogo Regionalsobre la Sociedad de la Información), Lima, Peru; Economics ofInfrastructures Section, Delft University of Technology, TheNetherlands; LIRNEasia, Colombo, Sri Lanka; Media@LSE Pro-gramme at the London School of Economics; and Research ICTAfrica!, Johannesburg, South Africa.
The LIRNE.NETmission is twofold:
• To facilitate ICT-related institutional reform throughout theworld – through research, training, dialogue, policy and regula-tory advice; and to build human capital in this new area as thefoundation for effective policy, regulation, governance, man-agement and development in new ‘network’ or ‘knowledge’economies.
LIRNE.NET activities include:
• External Training Initiatives (for government, industry andNGOs); Research Activities and Reports;World Dialogue on Reg-ulation for Network Economies <regulateonline.org> and ExpertAnalysis & Commentary on Current Issues.

LARA ALAWATTEGAMA is responsible for the compilation ofLIRNEasia’s BroadbandBenchmark report under the guidanceof Professor Rohan Samarajiva and Helani Galpaya. She is alsoinvolved in research on Korea and the Information Society andtheway inwhich it can be replicated in the South Asian region.Lara has also worked on compiling the Telecom RegulatoryEnvironment (TRE) manual, for use as a benchmark in under-taking future TRE studies. Before joining LIRNEasia, Lara wasattached to a United Nations Development Project dealingwith poverty alleviation where she worked as an intern; shealso completed internship programs with Outokumpu, Aus-tralia. She holds a Bachelor’s degree from theUniversity of Syd-ney, with majors in Government and International relationsand International Business and a minor in Political Economy.
HUGO CARRIÓN GORDÓN is an Electrical Engineer, with a special-ty in telecommunications from the Escuela PolitécnicaNacional, Ecuador. His graduate studies focused on ICT Man-agement, education and training. He has also undertaken pro-fessional development at the Arkansas University, the Institutode Teletécnicas (USA), the Escuela de Organización Industrial(Spain), and the Public Administration Institute in Kuala-Lumpur,Malasya. Hismain areas of interest are ICT and knowl-edge management. He has conducted research and conductedtraining courses on these topics. He worked at the SecretaríaNacional de Telecomunicaciones, in the Business School of theUniversidad del Pacífico, at the Superintendencia deTelecomu-nicaciones and the Centro de Estudios para la Comunidad ofthe Escuela Politécnica Nacional. He has an extensive workexperience as a consultant and specialist in engineering stud-ies, technology plan development and technical auditing. Cur-rently, he is an ICT and business consultant for severalinternational organisms. He is also the director of IMAGINAR(Research Center for the Information Society, Knowledge andInnovation), and professor at the university.
ALEJANDRA DAVIDZIUK worked at LIRNE.NET and the Universi-dad San Andrés (UDESA, Buenos Aires). She holds an MA inInternational Affairs with a concentration in socioeconomicdevelopment from The New School and is a PhD candidate atthe Instituto de Desarrollo Económico y Social (IDES), Univer-sidad Nacional de General Sarmiento (UNGS). Her main areaof interest is Communication for Development, focusing onthe role of ICT in processes of development and innovationfrom an inclusive and participating point of view.
MONICA KERRETTS-MAKAU is a consultant and internationalresearcher based in Africa. Her background includes a PhD inPublic Policy with emphasis on the communications sector.Monica has workedwith both telecomoperators and regulato-ry authorities on various consultancies in Africa and is amem-ber of Research ICT Africa (RIA!), a research think tank inAfrica, seeking to inform and improve public policy in the ICTfield through rigorous research. She can be contacted [email protected]
OPAL K. LAWTON Lawton is an independent consultant in ICTpolicy and costing. She has over 16 years experience in thetelecommunications industry. She spent 13 years at Cable &Wireless Jamaica (1992-2005) where she worked in variousroles, including, Senior PricingAnalyst andRegulatory FinanceManager. During and after the process of market liberalizationshe worked on a range of policy issues including interconnec-tion, retail price control, accounting separation and universalservice. She managed the team that developed and imple-mented a system of financial reporting to address commercialas well as regulatory requirements for several Cable &Wirelessbusinesses in the Caribbean. She extended her reach regional-ly, when she was seconded to work with TelecommunicationsServices of Trinidad andTobago (TSTT) in April of 2005. In herrole as Costing Specialist she did analytical and advocacy workon the cost the model used to support the costing of intercon-nection and other services. She also worked on a range of reg-
171
About the Project contributors
172
ulatory issues. Since May of 2007 she has been working as anindependent consultant in ICT policy & costing. She has donework for CANTO on Connect the Caribbean Initiative, which isa project related to the ITU’s Connect theWorld Initiative. Opalhas a BA Mathematics & Social Sciences and MBA (Finance)fromThe University of theWest Indies.
STEVE ESSELAAR is a researcher at the LINK Centre University ofthe Witwatersrand. In 2003, Esselaar worked on a set of casestudies on VSAT in Algeria, Tanzania and Nigeria. In 2004 heoversaw several of the e-Index country studies` data captureand graphic presentation, including that of South Africa. Aris-ing from the African e-Index he produced a paper withResearch ICT Africa! colleague Christoph Stork on ICT Diffu-sion in Sub-Saharan Africa. He has a joint honours degree inPolitics and Philosophy from Rhodes University and an MBAfrom the Gordon Institute of Business Science University ofPretoria where his dissertation was on the strategic impact ofVoice over Internet Protocol on South AfricanTelecommunica-tion Operators.
HERNAN GALPERIN (Ph.D., Stanford University) is Associate Pro-fessor at the Annenberg School for Communication at the Uni-versity of Southern California (USA) and Visiting Professor atthe Universidad de San Andrés (Argentina). He is also SteeringCommittee member for DIRSI, an ICT policy research consor-tium for Latin America and the Caribbean. An expert ontelecommunications policy and development, Dr. Galperinleads a number of research projects related to the regulationand development impact of new information and communica-tion technologies in Latin America, funded by a variety of foun-dations and international donors such as IDRC, ECLAC, USAIDandUNDP.Hehas published extensively inmajor journals suchas Telecommunications Policy, The Information Society andInformation Technologies and International Development. Hismost recent book, Digital Poverty: Latin American andCaribbean Perspectives, was published by Practical Action Pub-lishing and IDRC in 2007.
BRUCE GIRARD is executive director of the Comunica Founda-tion. Based in Uruguay, Comunica coordinates a network ofresearchers and activists specialised in ICTs and media andtelecommunications policy and regulation. Girard is active inpolicy areas related tomedia, information and communicationtechnologies and communication rights, He regularly consultsto UNDP on a pro-poor ICT networks, applications and servic-es project and some conclusions of this ongoing work werepublished in Community-based Networks and Innovative Tech-nologies: New models to serve and empower the poor. While atDelft University of Technology in the Netherlands from 1998-2002, Girard researched trends in international governance ofmedia and communication, co-authoring the book GlobalMedia Governance. Girard was a founder of the Communica-tion Rights in the Information Society (CRIS) and co-edited thebook Communicating in the Information Society (2003).
GUSTAVO GÓMEZ is a communicator and researcher andhas beenthe director of the Communication Rights and Legislation Pro-gramme at AMARC-LAC (World Association of CommunityRadio Broadcasters-Latin America and the Caribbean) sinceNovember 2001. An expert on public policy and regulatoryframeworks in broadcasting, ICTs, freedom of expression andcommunication rights, he has conducted research, providedadvisory services and/or drafted recommendations in a num-ber of countries in the region, at the invitation of governments,Congresses, social organizations and international agencies(UNESCO, FAO,World Bank, among others).He was a member of the promotion committee for the “La
Onda Rural” a Latin American Initiative on Communication forDevelopment (United Nations Food and Agriculture Organisa-tion 2004-2007), the AMARCActionCommittee onDigitalTech-nologies before the International Telecommunication Union(ITU), and recently formed part of theNational Commission onOpen Digital Terrestrial Television in Uruguay established toadvise the government. He served on the advisory committeefor the Association for Progressive Communications (APC) ICTPolicy Monitor project (2002-2003) and was the coordinator ofthe Latin American Broadcasting Legislation Database project(UNESCO-AMARC-ALER, 2002-2003).He actively participated in the first and second phases of the
World Summit on the Information Society, as well as in region-al events related to the WSIS process, and is a member of theAMARC permanent delegation to international agencies suchas the OAS Inter-American Commission on Human Rights.
MALATHY KNIGHT-JOHN is the lead researcher on LIRNEasia’sproject to investigate the replicability of GrameenPhone’sapproach to extending rural connectivity through the use ofmicro-finance in Bangladesh. Shewas one of the co-authors ofthe National Early Warning System (NEWS:SL) concept paperproduced by LIRNEasia. She is a Research Fellow and Head ofPublic Enterprise Reform, Competition Policy and Regulationresearch at the Institute of Policy Studies (Colombo). Knight-John has written extensively in these areas both locally andinternationally and has also contributed directly to nationaleconomic policy by producing policy briefs and serving on var-ious committees appointed by the government. She is current-ly reading for a PhD at the Institute of Development Policy andManagement (IDPM), University of Manchester, focusing onThe Political Economy of Telecommunications Reform andRegulation in Developing Countries: The Case of Sri Lanka.
AMY MAHAN was senior researcher and coordinator forLIRNE.NET. Recent research focused on ICT for development,public access to ICTs, regulatory information practices, andcivil society participation in policy and regulatory processes.Mahan worked in the field of regulation and policy researchduring the past 15 years, including in Australia at the Centre forInternational Research on Communication and InformationTechnologies (CIRCIT); in Canada at the Centre for PolicyResearch on Science and Technology (CPROST), Simon Fraser
A B O U T T H E P R O J E C T C O N T R I B U T O R S
University; and in the Netherlands in the Economics of Infra-structures programme, Delft University of Technology. Mahandeveloped training materials and presentation materialsincluding multi-media training kits for the Association of Pro-gressive Communications (APC) and handbooks for UNDP one-government and telecentre management. Recent booksinclude Diversifying Participation in Network Development(2007 with W.H. Melody), Stimulating Investment in NetworkDevelopment:Roles for Regulators (2005withW.H.Melody); andHow to Build Open Information Societies: A Collection of BestPractices and Know-How (2005 with Yuri Misnikov). She wasguest editor, along with William Melody, of a special issue ofinfo onNetwork development: wireless applications for the nextbillion users (Vol. 11, Issue 2, 2009). As a founding member ofLIRNE.NET, she ensured wide dissemination of the network’sresearch products and worked with the other project leaders tocoordinate research practices across the regional centres.
ALVARO MAILHOS has a strong scientific background with post-graduate studies in Uruguay and Germany and extensiveresearch experience. He has recently developed a deep interestin ICTs and their impact on social development. Alvaro workspart time at Fundación Comunica, providing research andadministrative support, including maintaining the website ofthe International Association for Media and CommunicationResearch (IAMCR). He also holds a part time teaching positionat the Departamento de Ciencias Cognitivas y de la Salud, Fac-ultad de Psicología, Universidad Católica del Uruguay.
WILLIAM MELODYwas the founder of LIRNE.NET and continuesto advise the initiative. He isVisiting Professor at the Center forCommunication, Media and Information Technologies (CMI),Aalborg University, Denmark; Media@LSE, London School ofEconomics; LINK Centre, University of Witwatersrand, SouthAfrica; Distinguished Visiting Professor (2004), Law School,University of Toronto; and Emeritus Professor, Delft Universityof Technology, the Netherlands.Former Chief Economist, US FCC, and adviser and expert
witness for the US Department of Justice in US v. AT&T, Melodyhas a PhD in Economics (Nebraska, 1966), and has held aca-demic appointments leading newmultidisciplinary programmedevelopment in seven countries: University of Pennsylvania1971-76; Simon Fraser University 1976-85; Economic and SocialResearch Council and Oxford University 1985-89; Centre forInternational Research on Communication and InformationTechnologies, Melbourne 1989-94; Technical University of Den-mark 1995-97; Delft University of Technology 1997-02.Melody is a contributor to the research and policy literature
with more that 150 publications, and former editor, Telecom-munications Policy.His edited volume,TelecomReform:Princi-ples, Policies andRegulatory Practices (1997), is used in trainingprograms inmore than 100 countries. He is a periodic consult-ant and advisor to universities and research centres around theworld, for UN and other international organisations, govern-ment and corporate organisations.
CHANUKA WATTEGAMA is the LIRNEasia Organizational Develop-ment Director and leads the Mobile 2.0@BOP project thatfocuses on the non voice mobile usage at the grassroots level.In addition, he is also the lead researcher for the projectsBroadband Quality of Service Benchmarking, NRA WebsiteSurvey and the country study of the Telecom Regulatory Envi-ronment analysis in Indonesia. For the 2005 research cycleChanuka led theVirtual Organisation and NRA website surveyprojects. Before undertaking his current position, heworked asProgramme Specialist ICT4D at the UNDP-APDIP out-postedto Colombo Regional Center’s MDG Initiative. His focus wasICT for poverty reduction and achievement of the MDGs. Inthis capacity he has worked on various projects on differentareas covering poverty reduction, Telecom Regulation, Genderand ICTs, Disaster Management and e-Government. He hasover 14 years experience at specialist andmanagement level infor Development. As a researcher, he has co-authored the SriLankan chapters for the books Cyber Communities of Asia(AMIC, Singapore), Media in Asia (Sage Publishers, NewDelhi), Internet in Asia (AMIC, Singapore) and Digital Reviewof Asia Pacific (APDIP, Orbicom and IDRC). He was also thelead researcher for Sri Lanka in a nine-country study on ICT forHuman Development in Asia, by UNDP. He is a regular writerand commentator on ICT issues in the Sri Lankan media. Hewas the founder consultant editor of Pariganaka, the largestselling ICT magazine in Sri Lanka with a circulation of morethan 40,000 copies. He has won the ScienceWriter of the YearAward, presented annually by the Sri Lanka Association for theAdvancement of Science, twice.
B E N C H M A R K I N G N A T I O N A L R E G U L A T O R Y A U T H O R I T Y W E B S I T E S
173


![Benchmarking of Responsive Websites - UEM Sunrise Websites - [ February 2016 ]](https://img.pdfslide.us/doc/110x75/587369bd1a28abe7648b76df/benchmarking-of-responsive-websites-uem-sunrise-websites-february-2016.jpg)