Embed Size (px)
Citation preview

TEKS MASTERY TRACKER MATH 2 0 1 7 / 1 8
www.APLearning.com
PK - 8th Grade Math

8th Gr Mathematics Mastery TrackerStudent Name Grade
Demonstrates mastery consistentlySometimes demonstrates masteryBeginning to demonstrate masteryNo mastery
+-o
StandardDate
1A apply mathematics to problems arising in everyday life, society, and the workplace
1B
use a problem-solving model that incorporates analyzing given information, formulating a plan or strategy, determining a
solution, justifying the solution, and evaluating the problem-solving process and the reasonableness of the solution
1C
select tools, including real objects, manipulatives, paper and pencil, and technology as appropriate, and
techniques, including mental math, estimation, and number sense as appropriate, to solve problems
1Dcommunicate mathematical ideas, reasoning, and their
implications using multiple representations, including symbols, diagrams, graphs, and language as appropriate
1E create and use representations to organize, record, and communicate mathematical ideas
1F analyze mathematical relationships to connect and communicate mathematical ideas
1Gdisplay, explain, and justify mathematical ideas and arguments
using precise mathematical language in written or oral communication
2Aextend previous knowledge of sets and subsets using a visual representation to describe relationships between sets of real
numbers
2Bapproximate the value of an irrational number, including p and square roots of numbers less than 225, and locate that rational
number approximation on a number line
2C convert between standard decimal notation and scientific notation
2D order a set of real numbers arising from mathematical and real-world contexts
4A
use similar right triangles to develop an understanding that slope, m, given as the rate comparing the change in y-values to the change in x-values, (y2 – y1)/(x2 – x1), is the same for any
two points (x1, y1) and (x2, y2) on the same line
4B graph proportional relationships, interpreting the unit rate as the slope of the line that models the relationship
4Cuse data from a table or graph to determine the rate of change
or slope and y-intercept in mathematical and real-world problems
5A represent linear proportional situations with tables, graphs, and equations in the form of y = kx
5B represent linear non-proportional situations with tables, graphs, and equations in the form of y = mx + b, where b ≠ 0;
5E solve problems involving direct variation
5Fdistinguish between proportional and non-proportional
situations using tables, graphs, and equations in the form y = kxor y = mx + b, where b ≠ 0
5G identify functions using sets of ordered pairs, tables, mappings, and graphs
5Hidentify examples of proportional and non-proportional functions that arise from mathematical and real-world
problems
5Iwrite an equation in the form y = mx + b to model a linear
relationship between two quantities using verbal, numerical, tabular, and graphical representations
8Awrite one-variable equations or inequalities with variables on
both sides that represent problems using rational number coefficients and constants
8Bwrite a corresponding real-world problem when given a one-variable equation or inequality with variables on both sides of
the equal sign using rational number coefficients and constants
StandardDate
8C
model and solve one-variable equations with variables on both sides of the equal sign that represent mathematical and real-
world problems using rational number coefficients and constants
9Aidentify and verify the values of x and y that simultaneously satisfy two linear equations in the form y = mx + b from the
intersections of the graphed equations
3A generalize that the ratio of corresponding sides of similar shapes are proportional, including a shape and its dilation
3B compare and contrast the attributes of a shape and its dilation(s) on a coordinate plane
3C
use an algebraic representation to explain the effect of a given positive rational scale factor applied to two-dimensional
figures on a coordinate plane with the origin as the center of dilation
6A describe the volume formula V = Bh of a cylinder in terms of its base area and its height
6C use models and diagrams to explain the Pythagorean theorem
7A solve problems involving the volume of cylinders, cones, and spheres
7B
use previous knowledge of surface area to make connections to the formulas for lateral and total surface area and
determine solutions for problems involving rectangular prisms, triangular prisms, and cylinders
7C use the Pythagorean theorem and its converse to solve problems
7D determine the distance between two points on a coordinate plane using the Pythagorean theorem
8D
use informal arguments to establish facts about the angle sum and exterior angle of triangles, the angles created when
parallel lines are cut by a transversal, and the angle-angle criterion for similarity of triangles
10Ageneralize the properties of orientation and congruence of
rotations, reflections, translations, and dilations of two-dimensional shapes on a coordinate plane
10B differentiate between transformations that preserve congruence and those that do not
10C
explain the effect of translations, reflections over the x- or y-axis, and rotations limited to 90°, 180°, 270°, and 360° as
applied to two dimensional shapes on a coordinate plane using an algebraic representation
10D model the effect on linear and area measurements of dilated two dimensional shapes
5Ccontrast bivariate sets of data that suggest a linear relationship
with bivariate sets of data that do not suggest a linear relationship from a graphical representation
5D use a trend line that approximates the linear relationship between bivariate sets of data to make predictions
11Aconstruct a scatterplot and describe the observed data to
address questions of association such as linear, non-linear, and no association between bivariate data
11Bdetermine the mean absolute deviation and use this quantity as a measure of the average distance data are from the mean
using a data set of no more than 10 data points
12A solve real-world problems comparing how interest rate and loan length affect the cost of credit
12Cexplain how small amounts of money invested regularly,
including money saved for college and retirement, grow over time
12D calculate and compare simple interest and compound interest earnings
12G
estimate the cost of a two-year and four-year college education, including family contribution, and devise a periodic savings plan for accumulating the money needed to contribute
to the total cost of attendance for at least the first year of college
Tested 3 times past 1- 2 yearsTested 2 times past 1-2 years

7th Gr Mathematics Mastery TrackerStudent Name Grade
Demonstrates mastery consistentlySometimes demonstrates masteryBeginning to demonstrate masteryNo mastery
+-o
StandardDate
1A apply mathematics to problems arising in everyday life, society, and the workplace
1B
use a problem-solving model that incorporates analyzing given information, formulating a plan or strategy, determining a
solution, justifying the solution, and evaluating the problem-solving process and the reasonableness of the solution
1C
select tools, including real objects, manipulatives, paper and pencil, and technology as appropriate, and
techniques, including mental math, estimation, and number sense as appropriate, to solve problems
1Dcommunicate mathematical ideas, reasoning, and their
implications using multiple representations, including symbols, diagrams, graphs, and language as appropriate
1E create and use representations to organize, record, and communicate mathematical ideas
1F analyze mathematical relationships to connect and communicate mathematical ideas
1Gdisplay, explain, and justify mathematical ideas and arguments
using precise mathematical language in written or oral communication
2Aextend previous knowledge of sets and subsets using a visual
representation to describe relationships between sets of rational numbers
6A represent sample spaces for simple and compound events using lists and tree diagrams
6C make predictions and determine solutions using experimental data for simple and compound events
6D make predictions and determine solutions using theoretical probability for simple and compound events
6E find the probabilities of a simple event and its complement and describe the relationship between the two
6H solve problems using qualitative and quantitative predictions and comparisons from simple experiments
6I determine experimental and theoretical probabilities related to simple and compound events using data and sample spaces
3A add, subtract, multiply, and divide rational numbers fluently
3Bapply and extend previous understandings of operations to
solve problems using addition, subtraction, multiplication, and division of rational numbers
4Arepresent constant rates of change in mathematical and real-
world problems given pictorial, tabular, verbal, numeric, graphical, and algebraic representations, including d = rt
4B calculate unit rates from rates in mathematical and real-world problems
4C determine the constant of proportionality (k = y/x) within mathematical and real-world problems
4Dsolve problems involving ratios, rates, and percents, including
multistep problems involving percent increase and percent decrease, and financial literacy problems
7A represent linear relationships using verbal descriptions, tables, graphs, and equations that simplify to the form y = mx + b.
10A write one-variable, two-step equations and inequalities to represent constraints or conditions within problems
10B represent solutions for one-variable, two-step equations and inequalities on number lines
10C write a corresponding real-world problem given a one-variable, twostep equation or inequality
StandardDate
11A model and solve one-variable, two-step equations and inequalities
11B determine if the given value(s) make(s) one-variable, two-step equations and inequalities true
4E convert between measurement systems, including the use of proportions and the use of unit rates
5A generalize the critical attributes of similarity, including ratios within and between similar shapes
5B describe p as the ratio of the circumference of a circle to its diameter
5C solve mathematical and real-world problems involving similar shape and scale drawings
9Asolve problems involving the volume of rectangular prisms,
triangular prisms, rectangular pyramids, and triangular pyramids
9B determine the circumference and area of circles
9Cdetermine the area of composite figures containing combinations of rectangles, squares, parallelograms, trapezoids, triangles, semicircles, and quarter circles
9Dsolve problems involving the lateral and total surface area of a rectangular prism, rectangular pyramid, triangular prism, and triangular pyramid by determining the area of the shape’s ne
11C write and solve equations using geometry concepts, including the sum of the angles in a triangle, and angle relationships
6Gsolve problems using data represented in bar graphs, dot plots,
and circle graphs, including part-to-whole and part-to-part comparisons and equivalents
12Acompare two groups of numeric data using comparative dot plots or box plots by comparing their shapes, centers, and
spreads
12B use data from a random sample to make inferences about a population
12Ccompare two populations based on data in random samples
from these populations, including informal comparative inferences about differences between the two populations
13A calculate the sales tax for a given purchase and calculate income tax for earned wages
13B
identify the components of a personal budget, including income; planned savings for college, retirement, and
emergencies; taxes; and fixed and variable expenses, and calculate what percentage each category comprises of the total
budget
13C create and organize a financial assets and liabilities record and construct a net worth statement
13D
use a family budget estimator to determine the minimum household budget and average hourly wage needed for a
family to meet its basic needs in the student’s city or another large city nearby
13E calculate and compare simple interest and compound interest earnings
13F analyze and compare monetary incentives, including sales, rebates, and coupons
Tested 3 times past 1- 2 yearsTested 2 times past 1-2 years

6th Gr Mathematics Mastery TrackerStudent Name Grade
Demonstrates mastery consistentlySometimes demonstrates masteryBeginning to demonstrate masteryNo mastery
+-o
StandardDate
1A apply mathematics to problems arising in everyday life, society, and the workplace
1B
use a problem-solving model that incorporates analyzing given information, formulating a plan or strategy, determining a
solution, justifying the solution, and evaluating the problem-solving process and the reasonableness of the solution
1C
select tools, including real objects, manipulatives, paper and pencil, and technology as appropriate, and
techniques, including mental math, estimation, and number sense as appropriate, to solve problems
1Dcommunicate mathematical ideas, reasoning, and their
implications using multiple representations, including symbols, diagrams, graphs, and language as appropriate
1E create and use representations to organize, record, and communicate mathematical ideas
1F analyze mathematical relationships to connect and communicate mathematical ideas
1Gdisplay, explain, and justify mathematical ideas and arguments
using precise mathematical language in written or oral communication
2Aclassify whole numbers, integers, and rational numbers using a
visual representation such as a Venn diagram to describe relationships between sets of numbers
2B identify a number, its opposite, and its absolute value
2C locate, compare, and order integers and rational numbers using a number line
2D order a set of rational numbers arising from mathematical and real world contexts
2E extend representations for division to include fraction notation such as a/b represents the same number as a ÷ b where b ≠ 0
4C give examples of ratios as multiplicative comparisons of two quantities describing the same attribute
4Dgive examples of rates as the comparison by division of two
quantities having different attributes, including rates as quotients
4E represent ratios and percents with concrete models, fractions, and decimals
4Frepresent benchmark fractions and percents such as 1%, 10%,
25%, 33 1/3%, and multiples of these values using 10 by 10 grids, strip diagrams, number lines, and numbers
4Ggenerate equivalent forms of fractions, decimals, and percents
using real-world problems, including problems that involve money
5C use equivalent fractions, decimals, and percents to show equal parts of the same whole
7Agenerate equivalent numerical expressions using order of
operations, including whole number exponents, and prime factorization
7B distinguish between expressions and equations verbally, numerically, and algebraically
7C determine if two expressions are equivalent using concrete models, pictorial models, and algebraic representations
7Dgenerate equivalent expressions using the properties of
operations: inverse, identity, commutative, associative, and distributive properties
StandardDate
3A recognize that dividing by a rational number and multiplying by its reciprocal result in equivalent values
3Bdetermine, with and without computation, whether a quantity
is increased or decreased when multiplied by a fraction, including values greater than or less than one
3Crepresent integer operations with concrete models and
connect the actions with the models to standardized algorithms
3D add, subtract, multiply, and divide integers fluently
3E multiply and divide positive rational numbers fluently
4Acompare two rules verbally, numerically, graphically, and symbolically in the form of y = ax or y = x + a in order to
differentiate between additive and multiplicative relationships
4Bapply qualitative and quantitative reasoning to solve prediction
and comparison of real-world problems involving ratios and rates
5Arepresent mathematical and real-world problems involving
ratios and rates using scale factors, tables, graphs, and proportions
5B
solve real-world problems to find the whole given a part and the percent, to find the part given the whole and the percent, and to find the percent given the part and the whole, including
the use of concrete and pictorial models
6A identify independent and dependent quantities from tables and graphs
6B write an equation that represents the relationship between independent and dependent quantities from a table
6C represent a given situation using verbal descriptions, tables, graphs, and equations in the form y = kx or y = x + b
9A write one-variable, one-step equations and inequalities to represent constraints or conditions within problems
9B represent solutions for one-variable, one-step equations and inequalities on number lines
9C write corresponding real-world problems given one-variable, onestep equations or inequalities
10Amodel and solve one-variable, one-step equations and
inequalities that represent problems, including geometric concepts
10B determine if the given value(s) make(s) one-variable, one-step equations or inequalities true
4H convert units within a measurement system, including the use of proportions and unit rates
8A
extend previous knowledge of triangles and their properties to include the sum of angles of a triangle, the relationship
between the lengths of sides and measures of angles in a triangle, and determining when three lengths form a triangle
8Bmodel area formulas for parallelograms, trapezoids, and triangles by decomposing and rearranging parts of these
shapes
8C
write equations that represent problems related to the area of rectangles, parallelograms, trapezoids, and triangles and volume of right rectangular prisms where dimensions are
positive rational numbers
8D
determine solutions for problems involving the area of rectangles, parallelograms, trapezoids, and triangles and volume of right rectangular prisms where dimensions are
positive rational numbers
11A graph points in all four quadrants using ordered pairs of rational numbers
Tested 3 times past 1- 2 yearsTested 2 times past 1-2 years
Continued Next Page.

6th Gr Mathematics Mastery TrackerStudent Name Grade
Demonstrates mastery consistentlySometimes demonstrates masteryBeginning to demonstrate masteryNo mastery
+-o
StandardDate
12A represent numeric data graphically, including dot plots, stem-and leaf plots, histograms, and box plots
12B use the graphical representation of numeric data to describe the center, spread, and shape of the data distribution
12C
summarize numeric data with numerical summaries, including the mean and median (measures of center) and the range and interquartile range (IQR) (measures of spread), and use these summaries to describe the center, spread, and shape of the
data distribution
12D
summarize categorical data with numerical and graphical summaries, including the mode, the percent of values in each category (relative frequency table), and the percent bar graph,
and use these summaries to describe the data distribution
13A interpret numeric data summarized in dot plots, stem-and-leaf plots, histograms, and box plots
13B distinguish between situations that yield data with and without variability
14A compare the features and costs of a checking account and a debit card offered by different local financial institutions
14B distinguish between debit cards and credit cards
14C balance a check register that includes deposits, withdrawals, and transfers
14E describe the information in a credit report and how long it is retained
14F describe the value of credit reports to borrowers and to lenders;
14G explain various methods to pay for college, including through savings, grants, scholarships, student loans, and work-study
14H
compare the annual salary of several occupations requiring various levels of post-secondary education or vocational training and calculate the effects of the different annual
salaries on lifetime income
Tested 3 times past 1- 2 yearsTested 2 times past 1-2 years

5th Gr Mathematics Mastery TrackerStudent Name Grade
Demonstrates mastery consistentlySometimes demonstrates masteryBeginning to demonstrate masteryNo mastery
+-o
StandardDate
1A apply mathematics to problems arising in everyday life, society, and the workplace
1B
use a problem-solving model that incorporates analyzing given information, formulating a plan or strategy, determining a
solution, justifying the solution, and evaluating the problem-solving process and the reasonableness of the solution
1C
select tools, including real objects, manipulatives, paper and pencil, and technology as appropriate, and
techniques, including mental math, estimation, and number sense as appropriate, to solve problems
1Dcommunicate mathematical ideas, reasoning, and their
implications using multiple representations, including symbols, diagrams, graphs, and language as appropriate
1E create and use representations to organize, record, and communicate mathematical ideas
1F analyze mathematical relationships to connect and communicate mathematical ideas
1Gdisplay, explain, and justify mathematical ideas and arguments
using precise mathematical language in written or oral communication
2A represent the value of the digit in decimals through the thousandths using expanded notation and numerals
2B compare and order two decimals to thousandths and represent comparisons using the symbols >, <, or =
2C round decimals to tenths or hundredths
3Aestimate to determine solutions to mathematical and real-world
problems involving addition, subtraction, multiplication, or division
3B multiply with fluency a three-digit number by a two-digit number using the standard algorithm
3Csolve with proficiency for quotients of up to a four-digit
dividend by a two-digit divisor using strategies and the standard algorithm
3Drepresent multiplication of decimals with products to the
hundredths using objects and pictorial models, including area models
3E
solve for products of decimals to the hundredths, including situations involving money, using strategies based on place-
value understandings, properties of operations, and the relationship to the multiplication of whole numbers
3Frepresent quotients of decimals to the hundredths, up to four-
digit dividends and two-digit whole number divisors, using objects and pictorial models, including area models
3Gsolve for quotients of decimals to the hundredths, up to four-
digit dividends and two-digit whole number divisors, using strategies and algorithms, including the standard algorithm
3Hrepresent and solve addition and subtraction of fractions with
unequal denominators referring to the same whole using objects and pictorial models and properties of operations
3Irepresent and solve multiplication of a whole number and a
fraction that refers to the same whole using objects and pictorial models, including area models
3J
represent division of a unit fraction by a whole number and the division of a whole number by a unit fraction such as 1/3 ÷ 7 and 7 ÷ 1/3 using objects and pictorial models, including area
models3K add and subtract positive rational numbers fluently
3L divide whole numbers by unit fractions and unit fractions by whole numbers
StandardDate
4 A identify prime and composite numbers
4Brepresent and solve multi-step problems involving the four
operations with whole numbers using equations with a letter standing for the unknown quantity
4C generate a numerical pattern when given a rule in the form y = ax or y = x + a and graph;
4D recognize the difference between additive and multiplicative numerical patterns given in a table or graph
4E describe the meaning of parentheses and brackets in a numeric expression
4F simplify numerical expressions that do not involve exponents, including up to two levels of grouping;
4Guse concrete objects and pictorial models to develop the
formulas for the volume of a rectangular prism, including the special form for a cube (V = l x w x h, V = s x s x s, and V = Bh)
4H represent and solve problems related to perimeter and/or area and related to volume
5Aclassify two-dimensional figures in a hierarchy of sets and
subsets using graphic organizers based on their attributes and properties
6A
recognize a cube with side length of one unit as a unit cube having one cubic unit of volume and the volume of a three-
dimensional figure as the number of unit cubes (n cubic units) needed to fill it with no gaps or overlaps if possible
6Bdetermine the volume of a rectangular prism with whole
number side lengths in problems related to the number of layers times the number of unit cubes in the area of the base
7A solve problems by calculating conversions within a measurement system, customary or metric.
8A
describe the key attributes of the coordinate plane, including perpendicular number lines (axes) where the intersection
(origin) of the two lines coincides with zero on each number line and the given point (0, 0); the x-coordinate, the first
number in an ordered pair, indicates movement parallel to the x-axis starting at the origin; and the y-coordinate, the second number, indicates movement parallel to the y-axis
starting at the origin
8B describe the process for graphing ordered pairs of numbers in the first quadrant of the coordinate plane
8C
graph in the first quadrant of the coordinate plane ordered pairs of numbers arising from mathematical and real-world problems, including those generated by number patterns or
found in an input-output table
9A
represent categorical data with bar graphs or frequency tables and numerical data, including data sets of
measurements in fractions or decimals, with dot plots or stem-and-leaf plots
9B represent discrete paired data on a scatterplot
9C solve one- and two-step problems using data from a frequency table, dot plot, bar graph, stem-and-leaf plot, or scatterplot
10A define income tax, payroll tax, sales tax, and property tax
10B explain the difference between gross income and net income;
10Cidentify the advantages and disadvantages of different
methods of payment, including check, credit card, debit card, and electronic payments
10D develop a system for keeping and using financial records
10E describe actions that might be taken to balance a budget balance a simple budget when expenses exceed income
10F balance a simple budget.
Tested 3 times past 1- 2 yearsTested 2 times past 1-2 years
4th Gr Mathematics Mastery TrackerStudent Name Grade
Demonstrates mastery consistentlySometimes demonstrates masteryBeginning to demonstrate masteryNo mastery
+-o
StandardDate
1A apply mathematics to problems arising in everyday life, society, and the workplace
1B
use a problem-solving model that incorporates analyzing given information, formulating a plan or strategy, determining a
solution, justifying the solution, and evaluating the problem-solving process and the reasonableness of the solution
1C
select tools, including real objects, manipulatives, paper and pencil, and technology as appropriate, and
techniques, including mental math, estimation, and number sense as appropriate, to solve problems
1Dcommunicate mathematical ideas, reasoning, and their
implications using multiple representations, including symbols, diagrams, graphs, and language as appropriate
1E create and use representations to organize, record, and communicate mathematical ideas
1F analyze mathematical relationships to connect and communicate mathematical ideas
1Gdisplay, explain, and justify mathematical ideas and arguments
using precise mathematical language in written or oral communication
2Ainterpret the value of each place-value position as 10 times
the position to the right and as one-tenth of the value of the place to its left
2Brepresent the value of the digit in whole numbers through
1,000,000,000 and decimals to the hundredths using expanded notation and numerals
2C compare and order whole numbers to 1,000,000,000 and represent comparisons using the symbols >,
2D round whole numbers to a given place value through the hundred thousands place
2E represent decimals, including tenths and hundredths, using concrete and visual models and money
2F compare and order decimals using concrete and visual models to the hundredths
2G relate decimals to fractions that name tenths and hundredths
2H determine the corresponding decimal to the tenths or hundredths place of a specified point on a number line
3A represent a fraction a/b as a sum of fractions 1/b, where a and b are whole numbers and b > 0, including when a > b
3B
decompose a fraction in more than one way into a sum of fractions with the same denominator using concrete and
pictorial models and recording results with symbolic representations
3C determine if two given fractions are equivalent using a variety of methods
3Dcompare two fractions with different numerators and
different denominators and represent the comparison using the symbols >, =, or <
3G represent fractions and decimals to the tenths or hundredths as distances from zero on a number line
3Erepresent and solve addition and subtraction of fractions
with equal denominators using objects and pictorial models that build to the number line and properties of operations
3Fevaluate the reasonableness of sums and differences of
fractions using benchmark fractions 0, 1/4, 1/2, 3/4, and 1, referring to the same whole
4A add and subtract whole numbers and decimals to the hundredths place using the standard algorithm
4B determine products of a number and 10 or 100 using properties of operations and place value understandings
StandardDate
4 Crepresent the product of 2 two-digit numbers using arrays,
area models, or equations, including perfect squares through 15 by 15
4D
use strategies and algorithms, including the standard algorithm, to multiply up to a four-digit number by a one-digit number and to multiply a two-digit number by a two-digit number. Strategies may include mental math, partial
products, and the commutative, associative, and distributive properties
4Erepresent the quotient of up to a four-digit whole number
divided by a one-digit whole number using arrays, area models, or equations
4Fuse strategies and algorithms, including the standard
algorithm, to divide up to a four-digit dividend by a one-digit divisor
4G round to the nearest 10, 100, or 1,000 or use compatible numbers to estimate solutions involving whole numbers
4Hsolve with fluency one- and two-step problems involving
multiplication and division, including interpreting remainders
5Arepresent multi-step problems involving the four
operations with whole numbers using strip diagrams and equations with a letter standing for the unknown quantity
5B
represent problems using an input-output table and numerical expressions to generate a number pattern that follows a given rule representing the relationship of the values in the resulting sequence and their position in the
sequence
5D solve problems related to perimeter and area of rectangles where dimensions are whole numbers
6A identify points, lines, line segments, rays, angles, and perpendicular and parallel lines
6B identify and draw one or more lines of symmetry, if they exist, for a two-dimensional figure
6C apply knowledge of right angles to identify acute, right, and obtuse triangles.
6Dclassify two-dimensional figures based on the presence or absence of parallel or perpendicular lines or the presence
or absence of angles of a specified size
7C determine the approximate measures of angles in degrees to the nearest whole number using a protractor
7D draw an angle with a given measure
7Edetermine the measure of an unknown angle formed by two nonoverlapping adjacent angles given one or both
angle measures
8A identify relative sizes of measurement units within the customary and metric systems
8B
convert measurements within the same measurement system, customary or metric, from a smaller unit into a
larger unit or a larger unit into a smaller unit when given other equivalent measures represented in a table
8C
solve problems that deal with measurements of length, intervals of time, liquid volumes, mass, and money using
addition, subtraction, multiplication, or division as appropriate
9A represent data on a frequency table, dot plot, or stem-and-leaf plot marked with whole numbers and fractions
9Bsolve one- and two-step problems using data in whole
number, decimal, and fraction form in a frequency table, dot plot, or stem and-leaf plot
10A distinguish between fixed and variable expenses10B calculate profit in a given situation
10Edescribe the basic purpose of financial institutions,
including keeping money safe, borrowing money, and lending
Tested 3 times past 1- 2 yearsTested 2 times past 1-2 years

3rd Gr Mathematics Mastery TrackerStudent Name Grade
Demonstrates mastery consistentlySometimes demonstrates masteryBeginning to demonstrate masteryNo mastery
+-o
StandardDate
1A apply mathematics to problems arising in everyday life, society, and the workplace
1B
use a problem-solving model that incorporates analyzing given information, formulating a plan or strategy, determining a
solution, justifying the solution, and evaluating the problem-solving process and the reasonableness of the solution
1C
select tools, including real objects, manipulatives, paper and pencil, and technology as appropriate, and
techniques, including mental math, estimation, and number sense as appropriate, to solve problems
1Dcommunicate mathematical ideas, reasoning, and their
implications using multiple representations, including symbols, diagrams, graphs, and language as appropriate
1E create and use representations to organize, record, and communicate mathematical ideas
1F analyze mathematical relationships to connect and communicate mathematical ideas
1Gdisplay, explain, and justify mathematical ideas and arguments
using precise mathematical language in written or oral communication
2A
compose and decompose numbers up to 100,000 as a sum of so many ten thousands, so many thousands, so many hundreds, so
many tens, and so many ones using objects, pictorial models, and numbers, including expanded notation as appropriate
2B describe the mathematical relationships found in the base-10 place value system through the hundred thousands place
2C
represent a number on a number line as being between two consecutive multiples of 10; 100; 1,000; or 10,000 and use
words to describe relative size of numbers in order to round whole numbers; and
2D compare and order whole numbers up to 100,000 and represent comparisons using the symbols >,
3A
represent fractions greater than zero and less than or equal to one with denominators of 2, 3, 4, 6, and 8 using concrete objects and pictorial models, including strip diagrams and
number lines
3Bdetermine the corresponding fraction greater than zero and less than or equal to one with denominators of 2, 3, 4, 6, and 8 given
a specified point on a number line
3Cexplain that the unit fraction 1/b represents the quantity
formed by one part of a whole that has been partitioned into b equal parts where b is a non-zero whole number
3Dcompose and decompose a fraction a/b with a numerator
greater than zero and less than or equal to b as a sum of parts 1/b
3E
solve problems involving partitioning an object or a set of objects among two or more recipients using pictorial
representations of fractions with denominators of 2, 3, 4, 6, and 8
3Frepresent equivalent fractions with denominators of 2, 3, 4, 6, and 8 using a variety of objects and pictorial models, including
number lines
3G
explain that two fractions are equivalent if and only if they are both represented by the same point on the number line or
represent the same portion of a same size whole for an area model
3H
compare two fractions having the same numerator or denominator in problems by reasoning about their sizes and justifying the conclusion using symbols, words, objects, and
pictorial models4I determine if a number is even or odd using divisibility rules
7A represent fractions of halves, fourths, and eighths as distances from zero on a number line
StandardDate
4A
solve with fluency one-step and two-step problems involving addition and subtraction within 1,000 using strategies based on place value, properties of operations, and the relationship
between addition and subtraction
4B round to the nearest 10 or 100 or use compatible numbers to estimate solutions to addition and subtraction problems
4D round to the nearest 10 or 100 or use compatible numbers to estimate solutions to addition and subtraction problems
4Erepresent multiplication facts by using a variety of approaches
such as repeated addition, equal-sized groups, arrays, area models, equal jumps on a number line, and skip counting
4F recall facts to multiply up to 10 by 10 with automaticity and recall the corresponding division facts
4G
use strategies and algorithms, including the standard algorithm, to multiply a two-digit number by a one-digit
number. Strategies may include mental math, partial products, and the commutative, associative, and distributive properties
4Hdetermine the number of objects in each group when a set of
objects is partitioned into equal shares or a set of objects is shared equally
4J determine a quotient using the relationship between multiplication and division
4K
solve one-step and two-step problems involving multiplication and division within 100 using strategies based on objects; pictorial models, including arrays, area models, and equal
groups; properties of operations; or recall of facts
5Arepresent one- and two-step problems involving addition and subtraction of whole numbers to 1,000 using pictorial models,
number lines, and equations
5Brepresent and solve one- and two-step multiplication and
division problems within 100 using arrays, strip diagrams, and equations
5C describe a multiplication expression as a comparison such as 3 x 24 represents 3 times as much as 24
5Ddetermine the unknown whole number in a multiplication or
division equation relating three whole numbers when the unknown is either a missing factor or product
5E represent real-world relationships using number pairs in a table and verbal descriptions
6A
classify and sort two- and three-dimensional figures, including cones, cylinders, spheres, triangular and rectangular prisms,
and cubes, based on attributes using formal geometric language
6B
use attributes to recognize rhombuses, parallelograms, trapezoids, rectangles, and squares as examples of
quadrilaterals and draw examples of quadrilaterals that do not belong to any of these subcategories
6Cdetermine the area of rectangles with whole number side
lengths in problems using multiplication related to the number of rows times the number of unit squares in each row
6Ddecompose composite figures formed by rectangles into nonoverlapping rectangles to determine the area of the
original figure using the additive property of area
6E
decompose two congruent two-dimensional figures into parts with equal areas and express the area of each part as a unit
fraction of the whole and recognize that equal shares of identical wholes need not have the same shape
7B determine the perimeter of a polygon or a missing length when given perimeter and remaining side lengths in problems
7C
determine the solutions to problems involving addition and subtraction of time intervals in minutes using pictorial models
or tools such as a 15-minute event plus a 30-minute event equals 45 minutes
7D determine when it is appropriate to use measurements of liquid volume (capacity) or weight
7E determine liquid volume (capacity) or weight using appropriate units and tools
Tested 3 times past 2 yearsTested 2 times past 1-2 years
Continued Next Page.

3rd Gr Mathematics Mastery TrackerStudent Name Grade
Demonstrates mastery consistentlySometimes demonstrates masteryBeginning to demonstrate masteryNo mastery
+-o
StandardDate
4C determine the value of a collection of coins and bills
8A summarize a data set with multiple categories using a frequency table, dot plot, pictograph, or bar graph with scaled intervals
8Bsolve one- and two-step problems using categorical data
represented with a frequency table, dot plot, pictograph, or bar graph with scaled intervals
9A explain the connection between human capital/labor and income
9B describe the relationship between the availability or scarcity of resources and how that impacts cost
9Dexplain that credit is used when wants or needs exceed the
ability to pay and that it is the borrower’s responsibility to pay it back to the lender, usually with interest
9E list reasons to save and explain the benefit of a savings plan, including for college
Tested 3 times past 2 yearsTested 2 times past 1-2 years
Continued Next Page.

2nd Gr Mathematics Mastery TrackerStudent Name Grade
Demonstrates mastery consistentlySometimes demonstrates masteryBeginning to demonstrate masteryNo mastery
+-o
StandardDate
1A apply mathematics to problems arising in everyday life, society, and the workplace
1B
use a problem-solving model that incorporates analyzing given information, formulating a plan or strategy, determining a
solution, justifying the solution, and evaluating the problem-solving process and the reasonableness of the solution
1C
select tools, including real objects, manipulatives, paper and pencil, and technology as appropriate, and
techniques, including mental math, estimation, and number sense as appropriate, to solve problems
1Dcommunicate mathematical ideas, reasoning, and their
implications using multiple representations, including symbols, diagrams, graphs, and language as appropriate
1E create and use representations to organize, record, and communicate mathematical ideas
1F analyze mathematical relationships to connect and communicate mathematical ideas
1Gdisplay, explain, and justify mathematical ideas and arguments
using precise mathematical language in written or oral communication
2Ause concrete and pictorial models to compose and decompose
numbers up to 1,200 in more than one way as a sum of so many thousands, hundreds, tens, and ones
2B use standard, word, and expanded forms to represent numbers up to 1,200
2C generate a number that is greater than or less than a given whole number up to 1,200
2Duse place value to compare and order whole numbers up to
1,200 using comparative language, numbers, and symbols (>, <, or =)
2E locate the position of a given whole number on an open number line
2F name the whole number that corresponds to a specific point on a number line
3A partition objects into equal parts and name the parts, including halves, fourths, and eighths, using words
3Bexplain that the more fractional parts used to make a whole, the smaller the part; and the fewer the fractional parts, the
larger the part
3Cuse concrete models to count fractional parts beyond one whole using words and recognize how many parts it takes to equal one
whole
3D identify examples and non-examples of halves, fourths, and eighths
4A recall basic facts to add and subtract within 20 with automaticity
3F4B
add up to four two-digit numbers and subtract two-digit numbers using mental strategies and algorithms based on
knowledge of place value and properties of operations
4Csolve one-step and multi-step word problems involving addition and subtraction within 1,000 using a variety of strategies based
on place value, including algorithms
4Dgenerate and solve problem situations for a given mathematical number sentence involving addition and subtraction of whole
numbers within 1,0005A determine the value of a collection of coins up to one dollar
5B use the cent symbol, dollar sign, and the decimal point to name the value of a collection of coins
6A model, create, and describe contextual multiplication situations in which equivalent sets of concrete objects are joined
6B model, create, and describe contextual division situations in which a set of concrete objects is separated into equivalent sets
StandardDate
7A determine whether a number up to 40 is even or odd using pairings of objects to represent the number
7B use an understanding of place value to determine the number that is 10 or 100 more or less than a given number up to 1,200
7C represent and solve addition and subtraction word problems where unknowns may be any one of the terms in the problem
8A create two-dimensional shapes based on given attributes, including number of sides and vertices
8B
classify and sort three-dimensional solids, including spheres, cones, cylinders, rectangular prisms (including cubes as special rectangular prisms), and triangular prisms, based on attributes
using formal geometric language
8Cclassify and sort polygons with 12 or fewer sides according to
attributes, including identifying the number of sides and number of vertices
8D compose two-dimensional shapes and three-dimensional solids with given properties or attributes
8E
decompose two-dimensional shapes such as cutting out a square from a rectangle, dividing a shape in half, or
partitioning a rectangle into identical triangles and identify the resulting geometric parts
9A find the length of objects using concrete models for standard units of length
9Bdescribe the inverse relationship between the size of the unit
and the number of units needed to equal the length of an object
9C represent whole numbers as distances from any given location on a number line
9D determine the length of an object to the nearest marked unit using rulers, yardsticks, meter sticks, or measuring tapes
9E determine a solution to a problem involving length, including estimating lengths
9F
use concrete models of square units to find the area of a rectangle by covering it with no gaps or overlaps, counting to
find the total number of square units, and describing the measurement using a number and the unit
9Gread and write time to the nearest one-minute increment
using analog and digital clocks and distinguish between a.m. and p.m.
10Aexplain that the length of a bar in a bar graph or the number of pictures in a pictograph represents the number of data points
for a given category
10B organize a collection of data with up to four categories using pictographs and bar graphs with intervals of one or more
10Cwrite and solve one-step word problems involving addition or subtraction using data represented within pictographs and bar
graphs with intervals of one
10D draw conclusions and make predictions from information in a graph
11A calculate how money saved can accumulate into a larger amount over time
11B explain that saving is an alternative to spending
11C distinguish between a deposit and a withdrawal
11D identify examples of borrowing and distinguish between responsible and irresponsible borrowing
11E identify examples of lending and use concepts of benefits and costs to evaluate lending decisions
11F differentiate between producers and consumers and calculate the cost to produce a simple item
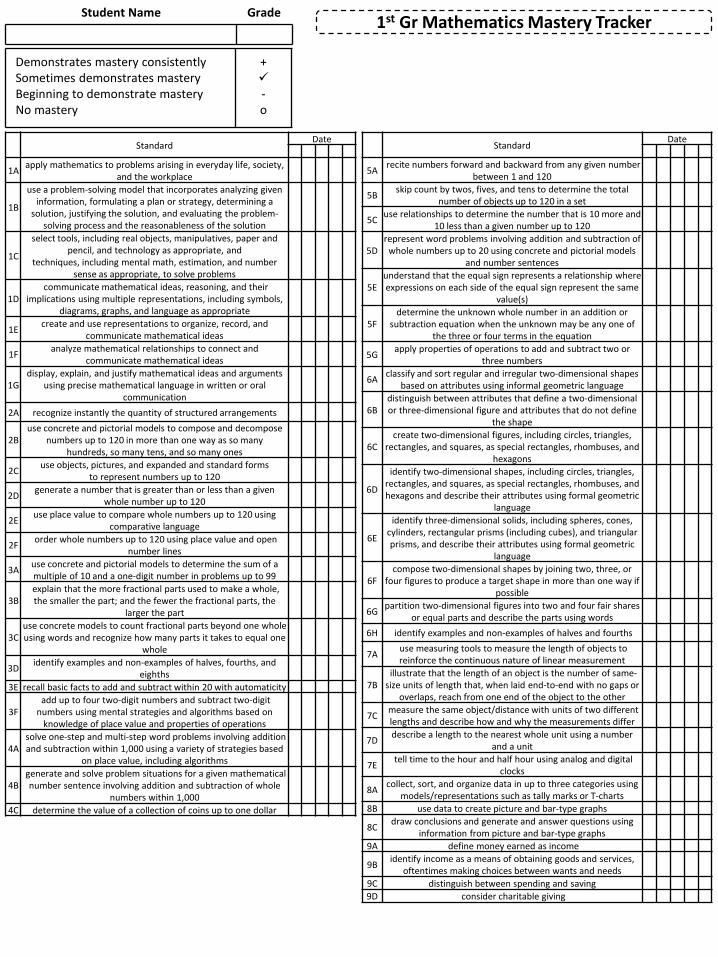
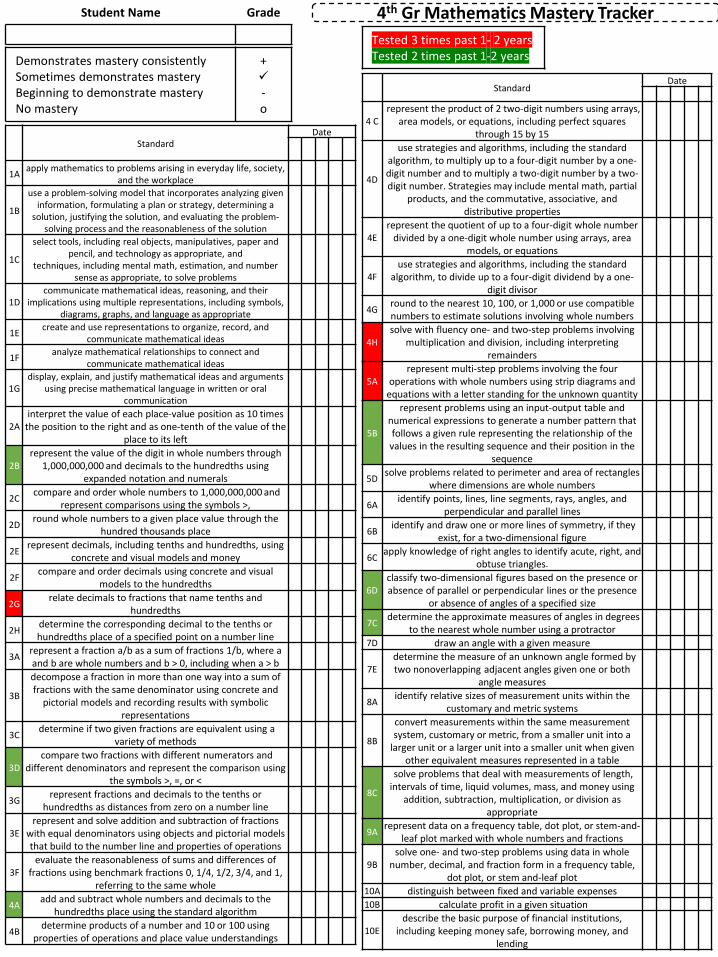
1st Gr Mathematics Mastery TrackerStudent Name Grade
Demonstrates mastery consistentlySometimes demonstrates masteryBeginning to demonstrate masteryNo mastery
+-o
StandardDate
1A apply mathematics to problems arising in everyday life, society, and the workplace
1B
use a problem-solving model that incorporates analyzing given information, formulating a plan or strategy, determining a
solution, justifying the solution, and evaluating the problem-solving process and the reasonableness of the solution
1C
select tools, including real objects, manipulatives, paper and pencil, and technology as appropriate, and
techniques, including mental math, estimation, and number sense as appropriate, to solve problems
1Dcommunicate mathematical ideas, reasoning, and their
implications using multiple representations, including symbols, diagrams, graphs, and language as appropriate
1E create and use representations to organize, record, and communicate mathematical ideas
1F analyze mathematical relationships to connect and communicate mathematical ideas
1Gdisplay, explain, and justify mathematical ideas and arguments
using precise mathematical language in written or oral communication
2A recognize instantly the quantity of structured arrangements
2Buse concrete and pictorial models to compose and decompose
numbers up to 120 in more than one way as so many hundreds, so many tens, and so many ones
2C use objects, pictures, and expanded and standard forms to represent numbers up to 120
2D generate a number that is greater than or less than a given whole number up to 120
2E use place value to compare whole numbers up to 120 using comparative language
2F order whole numbers up to 120 using place value and open number lines
3A use concrete and pictorial models to determine the sum of a multiple of 10 and a one-digit number in problems up to 99
3Bexplain that the more fractional parts used to make a whole, the smaller the part; and the fewer the fractional parts, the
larger the part
3Cuse concrete models to count fractional parts beyond one whole using words and recognize how many parts it takes to equal one
whole
3D identify examples and non-examples of halves, fourths, and eighths
3E recall basic facts to add and subtract within 20 with automaticity
3Fadd up to four two-digit numbers and subtract two-digit
numbers using mental strategies and algorithms based on knowledge of place value and properties of operations
4Asolve one-step and multi-step word problems involving addition and subtraction within 1,000 using a variety of strategies based
on place value, including algorithms
4Bgenerate and solve problem situations for a given mathematical number sentence involving addition and subtraction of whole
numbers within 1,0004C determine the value of a collection of coins up to one dollar
StandardDate
5A recite numbers forward and backward from any given number between 1 and 120
5B skip count by twos, fives, and tens to determine the total number of objects up to 120 in a set
5C use relationships to determine the number that is 10 more and 10 less than a given number up to 120
5Drepresent word problems involving addition and subtraction of
whole numbers up to 20 using concrete and pictorial models and number sentences
5Eunderstand that the equal sign represents a relationship where expressions on each side of the equal sign represent the same
value(s)
5Fdetermine the unknown whole number in an addition or
subtraction equation when the unknown may be any one of the three or four terms in the equation
5G apply properties of operations to add and subtract two or three numbers
6A classify and sort regular and irregular two-dimensional shapes based on attributes using informal geometric language
6Bdistinguish between attributes that define a two-dimensional or three-dimensional figure and attributes that do not define
the shape
6Ccreate two-dimensional figures, including circles, triangles,
rectangles, and squares, as special rectangles, rhombuses, and hexagons
6D
identify two-dimensional shapes, including circles, triangles, rectangles, and squares, as special rectangles, rhombuses, and hexagons and describe their attributes using formal geometric
language
6E
identify three-dimensional solids, including spheres, cones, cylinders, rectangular prisms (including cubes), and triangular prisms, and describe their attributes using formal geometric
language
6Fcompose two-dimensional shapes by joining two, three, or
four figures to produce a target shape in more than one way if possible
6G partition two-dimensional figures into two and four fair shares or equal parts and describe the parts using words
6H identify examples and non-examples of halves and fourths
7A use measuring tools to measure the length of objects to reinforce the continuous nature of linear measurement
7Billustrate that the length of an object is the number of same-
size units of length that, when laid end-to-end with no gaps or overlaps, reach from one end of the object to the other
7C measure the same object/distance with units of two different lengths and describe how and why the measurements differ
7D describe a length to the nearest whole unit using a number and a unit
7E tell time to the hour and half hour using analog and digital clocks
8A collect, sort, and organize data in up to three categories using models/representations such as tally marks or T-charts
8B use data to create picture and bar-type graphs
8C draw conclusions and generate and answer questions using information from picture and bar-type graphs
9A define money earned as income
9B identify income as a means of obtaining goods and services, oftentimes making choices between wants and needs
9C distinguish between spending and saving9D consider charitable giving

Kinder Mathematics Mastery TrackerStudent Name Grade
Demonstrates mastery consistentlySometimes demonstrates masteryBeginning to demonstrate masteryNo mastery
+-o
StandardDate
1A apply mathematics to problems arising in everyday life, society, and the workplace
1B
use a problem-solving model that incorporates analyzing given information, formulating a plan or strategy, determining a
solution, justifying the solution, and evaluating the problem-solving process and the reasonableness of the solution
1C
select tools, including real objects, manipulatives, paper and pencil, and technology as appropriate, and
techniques, including mental math, estimation, and number sense as appropriate, to solve problems
1Dcommunicate mathematical ideas, reasoning, and their
implications using multiple representations, including symbols, diagrams, graphs, and language as appropriate
1E create and use representations to organize, record, and communicate mathematical ideas
1F analyze mathematical relationships to connect and communicate mathematical ideas
1Gdisplay, explain, and justify mathematical ideas and arguments
using precise mathematical language in written or oral communication
2A count forward and backward to at least 20 with and without objects
2B read, write, and represent whole numbers from 0 to at least 20 with and without objects or pictures
2Ccount a set of objects up to at least 20 and demonstrate that the last number said tells the number of objects in the set regardless
of their arrangement or order
2D recognize instantly the quantity of a small group of objects in organized and random arrangements
2Egenerate a set using concrete and pictorial models that
represents a number that is more than, less than, and equal to a given number up to 20
2F generate a number that is one more than or one less than another number up to at least 20
2G compare sets of objects up to at least 20 in each set using comparative language
2H use comparative language to describe two numbers up to 20 presented as written numerals
2I compose and decompose numbers up to 10 with objects and pictures
3A model the action of joining to represent addition and the action of separating to represent subtraction
3B solve word problems using objects and drawings to find sums up to 10 and differences within 10
3Cexplain the strategies used to solve problems involving
adding and subtracting within 10 using spoken words, concrete and pictorial models, and number sentences
4 identify U.S. coins by name, including pennies, nickels, dimes, and quarters
5 recite numbers up to at least 100 by ones and tens beginning with any given number
StandardDate
6A identify two-dimensional shapes, including circles, triangles, rectangles, and squares as special rectangles
6B identify three-dimensional solids, including cylinders, cones, spheres, and cubes, in the real world
6C identify two-dimensional components of three-dimensional objects
6D identify attributes of two-dimensional shapes using informal and formal geometric language interchangeably
6E classify and sort a variety of regular and irregular two- and three-dimensional figures regardless of orientation or size
6F create two-dimensional shapes using a variety of materials and drawings
7A give an example of a measurable attribute of a given object, including length, capacity, and weight
7Bcompare two objects with a common measurable attribute to
see which object has more of/less of the attribute and describe the difference
8A collect, sort, and organize data into two or three categories;8B use data to create real-object and picture graphs8C draw conclusions from real-object and picture graphs
9A identify ways to earn income
9B differentiate between money received as income and money received as gifts
9C list simple skills required for jobs
9D distinguish between wants and needs and identify income as a source to meet one's wants and needs

Pre-K Mathematics Mastery TrackerStudent Name Grade
Demonstrates mastery consistentlySometimes demonstrates masteryBeginning to demonstrate masteryNo mastery
+-o
StandardDate
A1Child knows that objects, or parts of an object, can be
counted (can organize objects into a row and begin counting, identifies that objects can be counted)
A2Child uses words to rote count from 1 to 30 (recites numbers up to 30, and can recite numbers in order by starting from a
number other than one)
A3
Child counts 1– 10 items, with one count per item (moves or touches items when counting and uses a one- to- one
correspondence; knows each finger represents a count of one)
AAChild demonstrates that the order of the counting sequence
is always the same, regardless of what is counted (counts various items in the correct order in various settings)
A5Child counts up to 10 items and demonstrates that the last count indicates how many items were counted (counts a
number of items and states the number)
A6
Child demonstrates understanding that when counting, the items can be chosen in any order (counts 2-10 objects in different orders like left to right, right to left, and top to
bottom)
A7Child uses the verbal ordinal terms (uses ordinal numbers up
to five: first, second, third, fourth, and fifth; can communicate sequence and place using ordinal terms)
A8
Child verbally identifies, without counting, the number of objects from 1 to 5 (looks at up to 5 objects and says the
number without counting; uses the words equal, more, less, or fewer to describe sets up to 5 objects, etc.)
A9Child recognizes one-digit numerals, 0–9 (says the name of
numerals written down, performs a number of actions indicated by a written numeral, etc.)
B1
Child uses concrete objects, creates pictorial models and shares a verbal word problem for adding up to 5 objects (can
add parts to a number using objects or fingers, counts objects from sets that can be joined, counting on from a
larger set, etc.)
B2
Child uses concrete models or makes a verbal word problem for subtracting 0–5 objects from a set (can separate parts of
a number using objects or fingers, uses a five frame to organize work, creates verbal word problems)
B3
Child uses informal strategies to separate up to 10 items into equal groups (trading several small items equivalent to a
larger one, sharing up to 10 items with a friend, and using a ten frame to organize work)
C1Child names common shapes (square, rectangle, triangle, circle, etc.; can identify common objects with the given
shape)
C2
Child creates shapes (including creating new shapes by putting together two or more shapes, using vocabulary to describe shapes, and puts together or takes apart solids to
make other solids like a sphere or cone)
C3Child demonstrates use of location words (such as “over,”
“under,” “above,” “on,” “beside,” “next to,” “between,” “in front of,” “near,” “far,” etc.)
C4Child slides, flips, and turns shapes to demonstrate that the
shapes remain the same (including turning clockwise, counterclockwise)
D1Child recognizes and compares heights or lengths of people
or objects (uses language like taller, shorter, longer, smaller, etc. Can draw objects of varying heights or lengths, etc.)
D2Child recognizes how much can be placed within an object (defines by size, smallest to largest, etc.; compares capacity
between objects)
D3 Child informally recognizes and compares weights of objects or people (uses terms like heavy, light, more than, etc.)
D4Child uses language to describe concepts associated with the passing of time (morning, after snack, tomorrow, yesterday
sequence of events in a day, etc.)
E1Child sorts objects that are the same and different into
groups and uses language to describe how the groups are similar and different
E2
Child collects data and organizes it in a graphic representation (uses mathematical language: more, less,
same, longer; compares data on charts and graphs; checks yes or no on graphs, etc.)
E3 Child recognizes and creates patterns (AB, AABB, ABC patterns)
StandardDate

General Assessment FormUse this form to track general student assessments and record observational notes
Student Name Grade Level
Assessment Source & Description Date Score Areas of Concern & Future Goals