Embed Size (px)
Citation preview
Data from the Series 21
NATIONAL VITAL STATISTICSSYSTEM Number ,23
Teenagers:
Marriages, Divorces,
Parenthood, and Mortality
Analysis of teenage marriage, divorce, parenthood
(including information on illegitimacy rates and ratios), and mortality during the 1960’s.
DHEW Publication No. (HRA) 74-1901
U.S. DEPARTMENT OF HEALTH, EDUCATION, AND WELFARE Public Health Service
Health Resources Administration National Center for Health Statistics Rockville, Md. August 1973
. . . .
Vital and Health Statistics-Series 21-No. 23
NATIONAL CENTER FOR HEALTH STATISTICS
EDWARD B. PERRIN, Ph.D., Acting Director
PHILIP S. LAWRENCE, SC.D., Associate Director
GAIL F. FISHER, Acting Assistant Director for Health Statistics Development
WALT R. SIMMONS, M.A., Assistant Director for Research and Scientific Development
JOHN J. HANLON, M.D., MedicalAdvisor /
JAMES E. KELLY, D.D.S., Dental Advisor
EDWARD E. MINTY, Executive Officer
ALICE HAYWOOD, Information Officer
DIVISION OF VITAL STATISTICS
ROBERT A. ISRAEL, M. S., Director
JOHN E. PATTERSON, Assistant Director for Demographic Affairs
ROBERT J. ARMSTRONG, M. S., chief Mortality Statistics Branch
ROBERT L. HEUSER, M. A., Chiej Natality Statistics Branch
ALICE M. HETZEL, Chiej Marriage and Divorce Statistics ,Branch
Vital and Health Statistics-Series 21-No. 23
DHEW Publication No. (HRA) 74-1901
Library of Congress Cutalog Card Number 73-600052
------------------- ------------------------ -------
------------------------ -------------------- ---------------------------------- ---------
------------------------- -------------------------------------------------- ---
------- ---------------------- -------------- ------------------------------ -------------------
------- --------------------- --------------------- ------- -----
--------------------- --------------------- ------- -------------------- ------------------------- ------
-------------------------- -------------------
--------------------------------------------------------------------- ---------------------------
------------------------------------------- ------------------------- --
------------------------- ------------------------ ------------------- ------- --------------------- ------------------------------------------- ------------------------
------------------------- ------------------------
---------------------------- ------------------------ ---------------- --------------------- ---
--------- ------------------------ -------------------------------- --------------------
-------------- --------------------- -------------------------------- -------------------------- --
CONTENTS
In&oduction -------Q
Marriages - . -- ”
The Married Teenage Population -----.-
Teenage Marriages During the 1960’s ---------------------------------Marriages in the MRAGeographic Variation in U.S. MarriagesState Marriage LawsInternational Comparisons
Divorces
Parenthood ---.--*-
B&h Rates - . . . -- ”
Premarital ConceptionsIllegitimate BtitisBirths by Color -.-----k-
Trends in Births by “Color -------------------------
Infant Mortalily
MortalityLeading CausesLife Expectancy .-
List of Detailed Tables
AppendixSources of Data ---------------------
Rate Computations - . -------- ”
. Estimating ProceduresIllegitimate Births --.----Standard Errors
Page
1
2 2 2 4 9
12 13
15
18 18 18 19 21 23 24
25 25 27
28
37 37 39 39 39 40
... Ill
------------------------ ---
-------------------
----------------------------
------------------
SYMBOLS
Data not available
Category not applicable . . .
Quantity zero -
Quantity more than O but less than O.05---- 0.0
Figure doesnot meet standards of *reliabilityor precision
iv
TEENAGERS: MARRIAGES, DIVORCES,
PARENTHOOD, AND MORTALITYAlice M. Hetzel and Marlene Cappetta, Division of Vital Sizztistics
INTRODUCTIONI
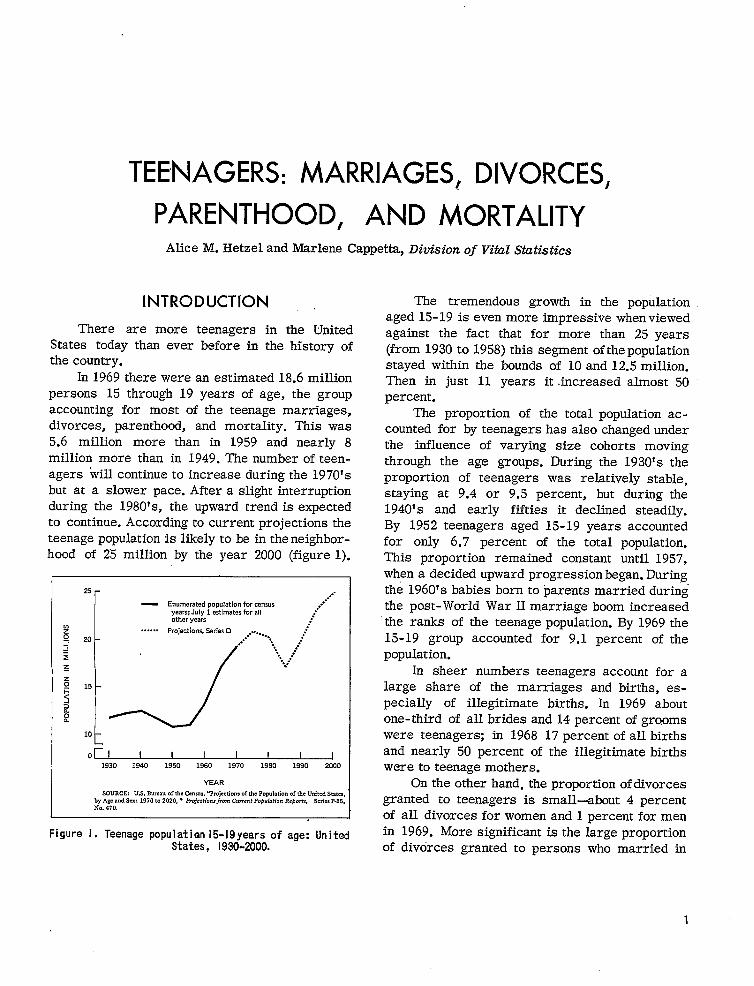
There are more teenagers in the United States today than ever before in the history of the country.
In 1969 there were an estimated 18.6 million persons 15 through 19 years of age, the group accounting for most of the teenage marriages, divorces, parenthood, and mortality. This was 5.6 million more than in 1959 and nearly 8 million more than in 1949. The number of teenagers will continue to increase during the 1970’s but at a slower pace. After a slight interruption during the 1980’s, the upward trend is expected to continue. According to current projections the teenage population is likely to be in the neighbor-hood of 25 million by the year 2000 (figure 1).
...” Enumerated population for census ...””
year% July 1 estimates for all jother years ...
Projections, Series D . . . . . . . . ... ... . ..” ..
.. ... ...””
“.+... .
/“
‘“to~
1930 1940 1950 1960 1970 1980 1990 2000
YEAR
SOURCE U.S. Bum.. oftheCensus,“Pr.j.ctimsof h. P.apulmion of the United Saks by Age and Sex: 1970 t. 2020,,, Projection from Current Population Reports, Series P-25 N.. 470,
Figure 1. Teenage populat ian 15-19years of age: UnitedStates, 1930-2000.
The tremendous growth in the population aged 15-19 is even more impressive when viewed against the fact that for more than 25 years (from 1930 to 1958) this segment of the population stayed within the bounds of 10 and 12.5 million. Then in just 11 years it increased almost 50 percent.
The proportion of the total population accounted for by teenagers has also changed under the influence of varying size cohorts moving through the age groups. During the 1930’s the proportion of teenagers was relatively stable, staying at 9.4 or 9.5 percent, but during the 1940’s and early fifties it declined steadily. By 1952 teenagers aged 15-19 years accounted for only 6.7 percent of the total population. This proportion remained constant until 1957, when a decided upward progression began. Duriqg the 1960’s babies born to parents married during the post- World War II marriage boom increased
“the ranks of the teenage population. By 1969 the 15-19 group accounted for 9.1 percent of the population.
In sheer numbers teenagers account for a large share of the marriages and births, especially of illegitimate births. In 1969 about one-third of alI brides and 14 percent of gr~oms were teenagers; in 1968 17 percent of all births and nearly 50 percent of the illegitimate births were to teenage mothers.
On the other hand, the proportion of divorces granted to teenagers is small--about 4 percent of all divorces for women and 1 percent for men in 1969. More significant is the large proportion of divorces granted to persons who married in
1
--------------------------------------------------------------------------------------------------------------------------------------------------------
--- ------ ------ ---
---------
--------
their teens (46 percent for women and 19 percent for men).
The total number of deaths among teenagers also is small and the death rate from all causes combined is low. Motor vehicle accidents, how-ever, take a heavy toll from the teenage group; in 1969 the age group 15-19 years ranked a close second to the group aged 20-24 years in having more deaths from this cause than any of the other 5-year age groups throughout the entire life span. The death rate for teenagers was among the highest of the age-specific fatality rates for motor vehicle accidents.
These and other facts presented in this re-port on teenagers were derived from the vital statistics of the United States and publications of the U.S. Bureau of the Census. Figures for marriages and divorces were obtained or estimated from data provided by States having the necessary information on their marriage and divorce records. Discussions of estimating procedures and of reliability of the estimates appear in the appendix to this report.
MARRIAGES
The Married Teenage Population
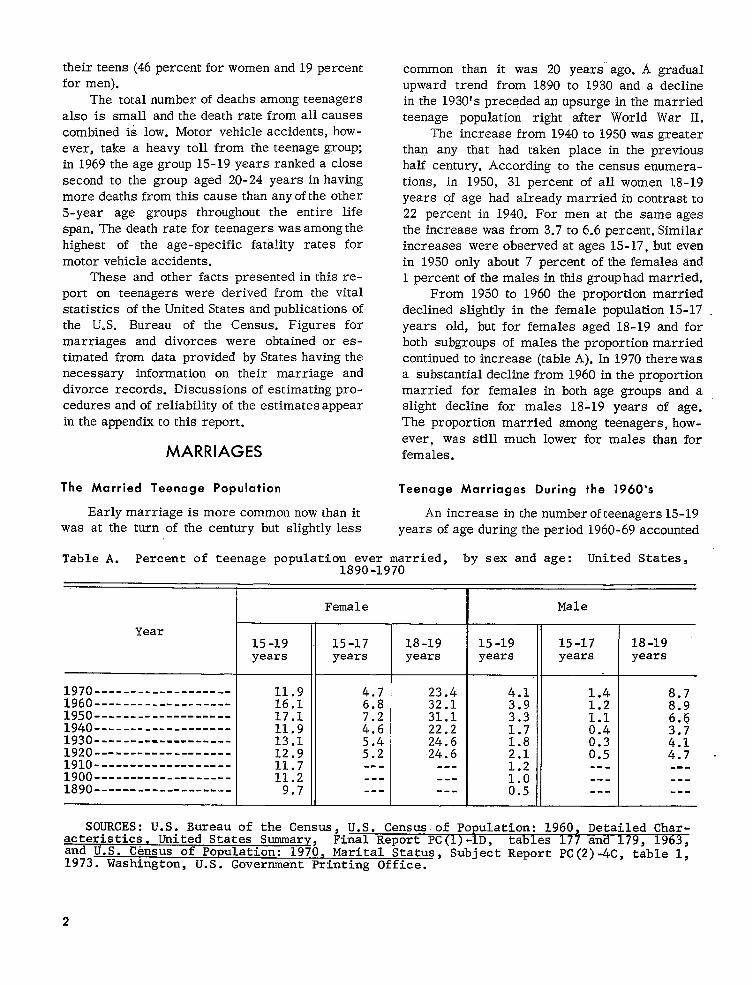
Early marriage is more common now than it was at the turn of the century but slightly less
common than it was 20 years ago. A gradual upward trend from 1890 to 1930 and a decline in the 1930’s preceded an upsurge in the married teenage population right after World War II.
The increase from 1940 to 1950 was greater than any that had taken place in the previous half century. According to the census enumerations, in 1950, 31 percent of all women 18-19 years of age had already married in contrast to 22 percent in 1940. For men at the same ages the increase was from 3.7 to 6.6 percent. Similar increases were observed at ages 15-17, but even in 1950 only about 7 percent of the females and 1 percent of the males in this group had married.
From 1950 to 1960 the proportion married declined slightly in the female population 15-17 . years old, but for females aged 18-19 and for both subgroups of males the proportion married continued to increase (table A). In 1970 there was a substantial decline from 1960 in the proportion married for females in both age groups and a slight decline for males 18-19 years of age. The proportion married among teenagers, how-ever, was still much lower for males than for females.
Teenage Marriages During the 1960’s
An increase in the number of teenagers 15-19 years of age during the period 1960-69 accounted
Table A. Percent of teenage population ever married, by sex and age: United States, 1890-1970
Female Male
Year 15-19 15-17 18-19 15-19 15-17 18-19 years years years years years years
1970 1960 1950 1940 1930 1920 1910 1900 1890 -----------------=--
11.9 16.1 17.1 11.9 13.1 12.9 11.7 11.2
9.7
4.7 23.4 6.8 32.1
31.1 ::: 22.2 5.4 24.6 5.2 24.6
4.1 1.4 8.7 3.9 1.2 8.9 3.3 6.tj 1.7 ::: 1.8 0.3 H
0.5 4.7 ::; -1.0 0.5
SOURCES: U.S. Bureau of the Census, U.S. Census of Population: 1960, Detailed Characteristics, United States Summary, Final Report PC(l) -lD, tables 1963, and U.S. Census of Population: 1970, Marital Status, Subject Report PC(2~4C, t~ble 1, 1973. Washington, U.S. Government Printing Office.
2
---
for 50 percent of the”growth in the total unmarried population 15 years of age and over. This rapid growth of the teenage population had a marked effect on the number of marriages performed.
About one-third of the women and 14 percent of the men who married during 1969 were teenagers. An estimated 717,000 women and 311,000 men married at ages under 20 years (table 1). This was more than for any of the previous 4 years and an increase over 1960 of 160,000 women and 110,000 men (table B). The number of teenage marriages was up nearly 30 percent for women a,nd over 50 percent for men in 1969 as compared with 1960.
Annual increases in the number of marriages were greatest in the middle and late sixties, when the unusually large birth cohorts of the immediate post-World War II years were reaching marriage-able ages. Even with this tremendous increase in the number of teenage marriages, between 1960 and 1969 the teenage marriage mte actually declined for women and increased only slightly for men (table B). In other words, the increase in the number of teenage marriages did not keep pace with the increase in the teenage population for women and did not exceed it greatly for men.
If no significant changes occur in the teenage marriage rate, the number of teenage marriages will continue to increase at a diminishing rate until the late seventies. By then the downward
Table B. Estimated number and rate of marriages for teenagers aged 15-19 years, by sex: United States, 1960 and 1965-69
[See appendix for method of computation. Rates per 1,000 unmarried population 15-19 years of age]
Number Rate
Year
Female Male
1969 717,000 311,000 87.7 34.6 1968--- 689,000 294,000 86.2 33.3 1967--- 663,000 285,000 85.7 33.0 1966--- 689,000 299,000 89.0 34.5 1965--- 661,000 252,000 89.8 30.4
1 1960--- 557,000 201,000 100.3 31.2
FEMALES
Ir 100
75
50
25
0
1969 1960 1969 1960
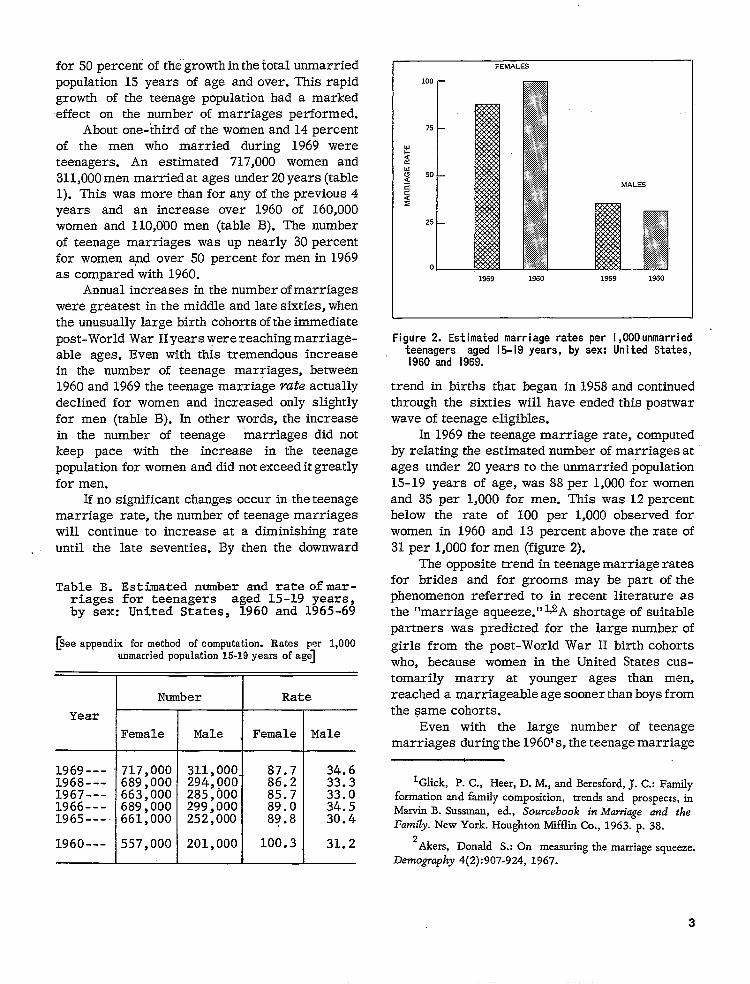
Figure 2. Estimated marriage rates per 1,OOOunmarriedteenagers aged 15-19 years, by sex: Un ited States,1960 and 196%
trend in births that began in 1958 and continued through the sixties will have ended this postwar wave of teenage eligibles.
In 1969 the teenage marriage rate, computed by relating the estimated number of marriages at ages under 20 years to the unmarried population 15-19 years of age, was 88 per 1,000 for women and 35 per 1,000 for men. This was 12 percent below the rate of 100 per 1,000 observed for women in 1960 and 13 percent above the rate of 31 per 1,000 for men (figure 2).
The opposite trend in teenage marriage rates for brides and for grooms may be part of the phenomenon referred to in recent literature as the “marriage squeeze. 1rL2A shortage of suitable
partners was predicted for the large number of
girls from the post-World War H birth cohorts who, because women in the United States customarily marry at younger ages than men, reached a marriageable age sooner than boys from the same cohorts.
Even with the large number of teenage marriages during the 1960’s, the teenage marriage
lGlick, P. C., Heer, D. M., and Beresford, J. C.: Family formation and family composition, tren~ and prospects, k Marvin B. Sussman, cd., Sourcebook in Marriage and the
Family. New York. Houghton Mifflin Co., 1963. p. 38.
2 Akers, Donald S.: On measuring the marriage squeeze.
Demography 4(2):907-924, 1967.
-----------------------
-----------------------------------------------------------------------------------------------------------------------------------------
-----------------
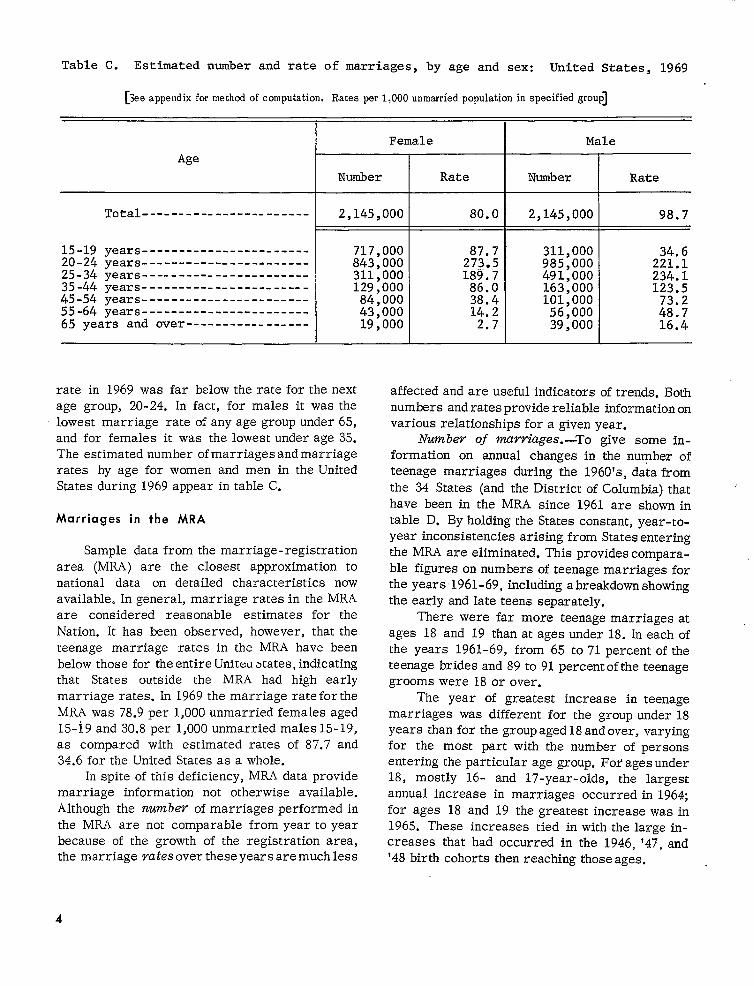
Table C. Estimated number and rate of marriages, by age and sex: United States, 1969
~ee appendix for method of computation, Rates per 1,000 unmarried population in specified group]
I 1
Female Male
Age
Number Rate Number Rate
Total 2,145,000 80.0 2,145,000 98.7
15-19 years 717,000 87.7 311,000 34.6 20-24 years 843,000 273.5 985,000 221.1 25-34 years 311,000 189.7 491,000 234.1 35-44 years - 129,000 86.0 163,000 123.5 45-54 years 84,000 38.4 101,000 73.2 55-64 years 43,000 14.2 56,000 48.7 65 years and over 19,000 2.7 39,000 16.4
rate in 1969 was far below the rate for the next age group, 20-24. In fact, for males it was the lowest marriage rate of any age group under 65, and for females it was the lowest underage 35. The estimated number ofmarriagesand marriage rates by age for women and men in the United States during 1969 appear intable C.
Marriages in the MF?A
Sample data from the marriage-registration area (MRA) are the closest approximation to national data on detailed characteristics now available. In general, marriage ratesin theMRA are considered reasonable estimates for the Nation. It has been observed, however, that the teenage marriage ratea in the MRA have been below those for the entireUniteuatates ,indicating that States outside the MRA had high early marriage rates. In 1969 the marriage rate forthe M&\ was 78.9pex l, OOOunmarried females aged 15-19 and30.8 per l,OOOunmarried males 15-19, as compared with estimated rates of 87.7 and 34.6 for the United States as a whole.
In spite of this deficiency, MRA data provide marriage information not otherwise available. Although the rzunzbev of marriages performed in the MRA are not comparable from year to year because of the growth of the registration area, the marriage ratasoverthese years aremuchless
affected and are useful indicators of trends. Both numbers and rates provide reliable information on various relationships for a given year.
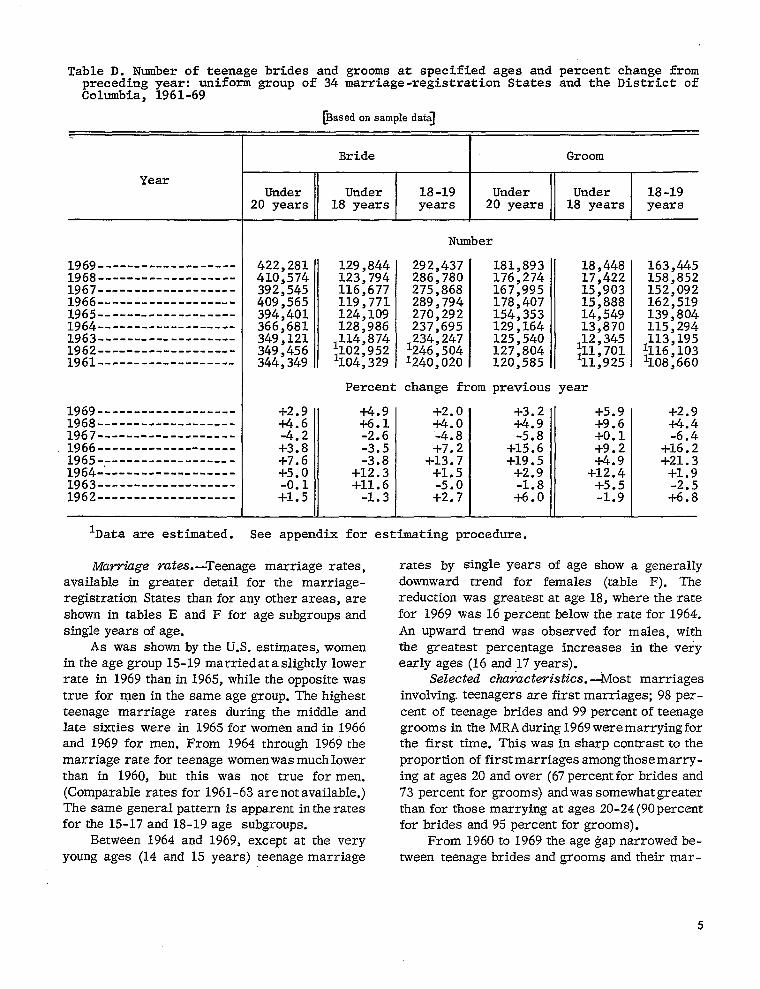
Mm ?JW of muvriages. —To give some in-formation on annual changes in the number of teenage marriages during the 1960’s, data from the 34 States (and the District of Columbia) that have been in the MRA since 1961 are shown in table D. By holding the States constant, year-to-year inconsistencies arising from States entering the MRA are eliminated. This provides comparable figures on numbers of teenage marriages for the years 1961-69, including a breakdown showing the early and late teens separately.
There were far more teenage marriages at ages 18 and 19 than at ages under 18. In each of the years 1961-69, from 65 to 71 percent of the teenage brides and 89 to 91 percent of the teenage grooms were 18 or over.
The year of greatest increase in teenage marriages was different for the group under 18 years than for the group aged 18 and over, varying for the most part with the number of persons entering the particular age group. For ages under 18, mostly 16- and 17-year-olds, the largest annual increase in marriages occurred in 1964; for ages 18 and 19 the greatest increase was in 1965. These increases tied in with the large in-creases that had occurred in the 1946, ’47, and ’48 birth cohorts then reaching those ages.
4
-------------------
------------------------- ------- -----
Table D. Number of teenage brides and grooms at specified ages and percent change from Precedin$z Year: uniform ~rou~ of 34 marria~e-re~istration States and the District of ~olumbia~ 1961-69
[Based dat~onsample
Bride
==l==F=
Nu
422,281 129,844 292,437 :;;
116,677 275,868 409;565 119,771 289,794 394,401 124,109 270,292 366,681 128,986 237,695 349,121 349,456 1::;;;;$ 1;;:;;;;
1-240,020
,y; 123,794 286,780
Year
1969-------------------i968-------------------1967-------------------1966-------------------1965-------------------&------------------
1962-------------------1961-------------------
1969-------------------i968-------------------1967-------------------
. 1966-------------------1965-------------------:;::-’
1962------------------
ll)ataare estimated.
Marriage Yates.—Teenage avaiIable in greater detail
Groom
II IUnder I Under
20 years 18 years
181,893 18,448 176,274 17,422 167,995 15,903 178,407 15,888 154,353 14,549 129,164 13,87’0 125,540 1;; ; ;;;
18-19 years
163,445158,852152,092162,519139,804115,294
1;;:;;;;1108,660
-t-2.9+4.4-6.4
+16.2+21.3-I-1.9-2.5+6.8
127,804 344,349 1104,329 120,585 111,925
Percent change from previous year
+1.5
+2.9 +2.0 +3.2 -1-5.9 +4.6 Z:: +$: +4.9 +9.6 -4.2 -5.8 +-0.1 +3.8 -3:5 +7:2 +15.6 +9.2 +7.6 -3.8 +13.7 +19.5 +5.0 +12.3 +1.5 +2.9 +Z:: -0.1 +11.6 -5.0 -1.8 +5.5
-1.3 +2.7 -L-1.9+6.01
See appendix for estimating procedure.
marriage rates, for the marriage-
registration States than for any other areas, are shown in tables E and F for age subgroups and single yearsof age.
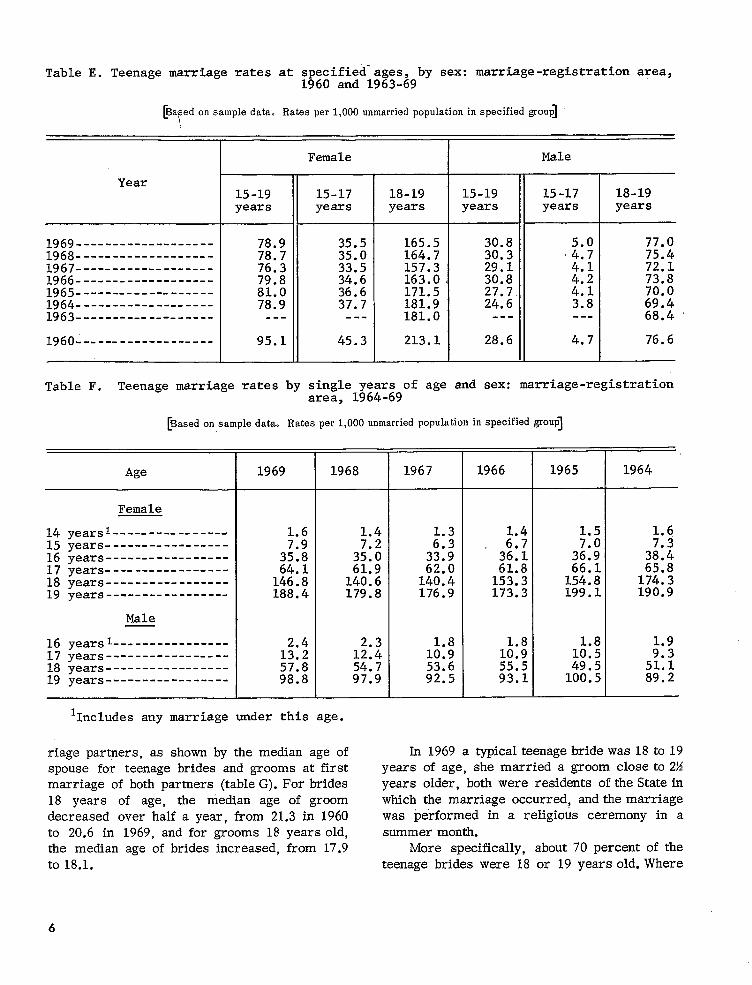
As was shown by the U.S. estimates, women in the age group 15-19 marriedataslightly lower rate in 1969 than in1965, while the opposite was true for men in the same age group. The highest teenage marriage rates during the middle and late sixties were in 1965 for women andin 1966 and 1969 for men. From 1964 through 1969the marriage rate for teenage womenwasmuch lower than in 1960, but this was not true for men. (Comparable rates for 1961-63 are not available.) The same general pattern is apparent intherates for the 15-17 and18-19 age subgroups.
Between 1964 and 1969, except at the very young ages (14 and 15 years) teenage marriage
rates by single years of age show a generally downward trend for females (table F). The reduction was greatest at age 18, where the rate for 1969 was 16 percent below the rate for 1964. An upward trend was observed for males, with the greatest percentage increases in the very early ages (16 and17y ears).
Selected charactwistics.--Most marriages involving. teenagers are first marriages; 98per-cent of teenage brides and 99 percent ofteenage grooms inthe MRA during1969were marryingfor the first time. This was in sharp contrast to the proportion offirst marriagesamong thosemarrying at ages 20 andover (67percentfor brides and 73 percent for grooms) andwas somewhatgreater than for those marrying at ages 20-24(90percent for brides and95 percent for grooms).
From 1960 to1969 the age gap narrowed be-tween teenage brides and&ooms and their mar-
5
--- --- --- ---
-----------------------------------------------------------------------------------------------------
---------------------------------------------------
Table E. Teenage marriage rates at speci.fied”ages, by sex: marriage-registration area, 1960 and 1963-69
~yed on sample data. Rates per 1,000 unmarried population in specified group] 1
Female Male
Year 15-19 15-17 18-19 15-19 15-17 18-19 years years years years years yearsI
1969------------------- 78.9 35.5 165.5 30.8 77.0 1968------------------- 78.7 35.0 164.7 30.3 .::; 75.4 1967------------------- 76.3 33.5 157.3 29.1 4.1 72.1 1966------------------- 79.8 34.6 163.0 30.8 4.2 73.8 1965------------------- 81.0 36.6 171.5 27.7, 4.1 70.0 1964------------------- 78.9 37.7 181.9 24.6 3.8 69.4 1963------------------- 181.0 68.4
1960------------------- 95.1 45.3 213.1 28.6 I 4.7 76.6
Table F. Teenage marriage rates by single years of age and sex: marriage-registration area, 1964-69
[Based on sample data. Rates per 1,000 unmarried population in specified group]
Age 1969 1968 1967 1966 1965 1964
Female I 14 yearsl 1.6 1.4 1.3 1.4 1.5 1.6 15 years 16 years 3;:: 3;:; 3!:; 3::: 3::: 3::: 17 years 64.1 61.9 62.0 61.8 66,1 65.8 18 years 19 years
146.8 188.4
140:6 179.8
140.4 176.9
153.3 173.3
154.8 199.1
174.3 190.9
Male I
16 years l---------------- 2.4 1.917 years 13.2 1;:2 1!:! 1::; J::18 years 57.8 54.7 53.6 55.5 49.5 5%;19 years 98.8 97.9 92.5 93.1 100.5 89.2
lIncludes any marriage under this age.
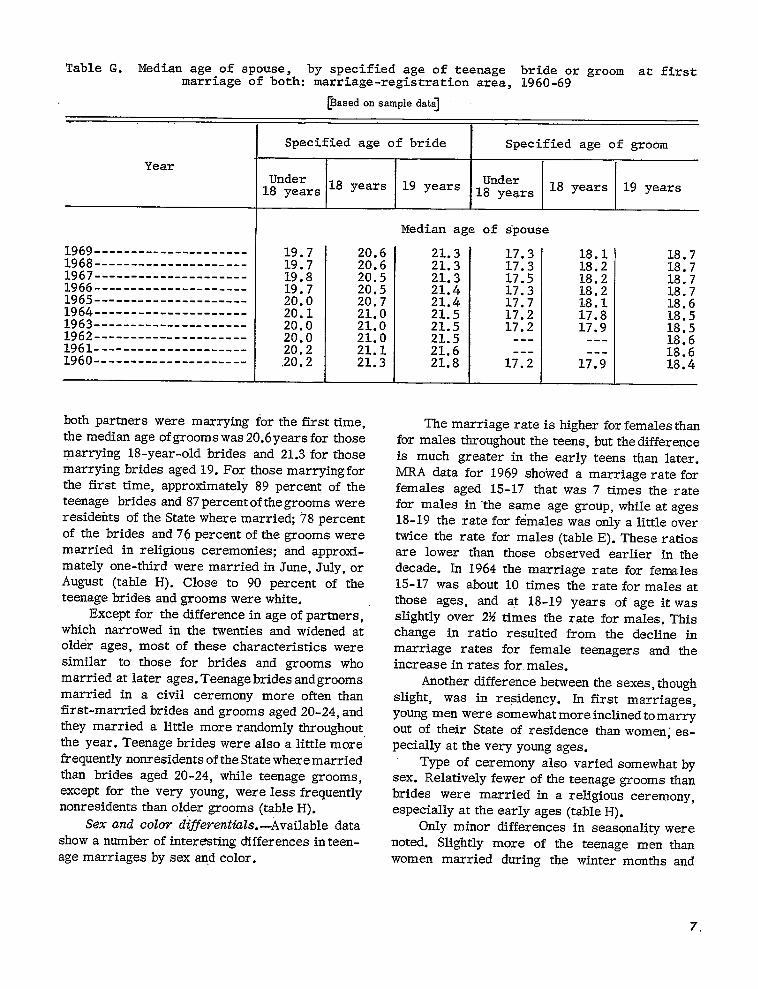
riage par@ers, as shown by the median age of spouse for teenage brides and grooms at first marriage of both partners (table G). For brides 18 years of age, the median age of groom decreased over halfa year, from 21.3 in 1960 to 20.6 in 1969, and for grooms 18 years old, the median age of brides increased, from 17.9 to 18.1.
In 1969 a typical teenage bride was18to 19 years of age, she married a groom close to2% years older, both were residents of the Statein which the marriage occurred, and the marriage was performed in a religious ceremony in a summer month.
More specifically, about 70 percent of the teenage brides were 18 or 19 years old. Where
6
------
------
Table G. Median age of spouse, by specified age of teenage bride or groom at first marriage of both: marriage-registration area, 1960-69
@ased cm simple dat~
Specified age of bride I Specified
Year Under Under
18 years 18 years 19 years 18 years 18
Median age of spouse
1969--------------------- 19.7 20.6 21.3 17.3 1968--------------------- 19.7 20.6 21.3 17.3 1967--------------------- 19.8 20.5 21.3 17.5 1966--------------------- 19.7 20.5 21.4 17.3 1965--------------------- 20.0 20.7 21.4 17.7 1964--------------------- 20.1 21.0 21.5 17.2 1963--------------------- 20.0 21.0 21.5 17.2 1962--------------------- 20.0 21.0 21.5 1961--------------------- 20.2 21.1 21.6 1960--------------------- .20.2 21.3 21.8 17.2
age of groom
years 19 years
18.1 18.718.2 18.718.2 18.718.2 18.718.1 18.617.8 18.517.9 18.5
18.618.6
17.9 18.4I
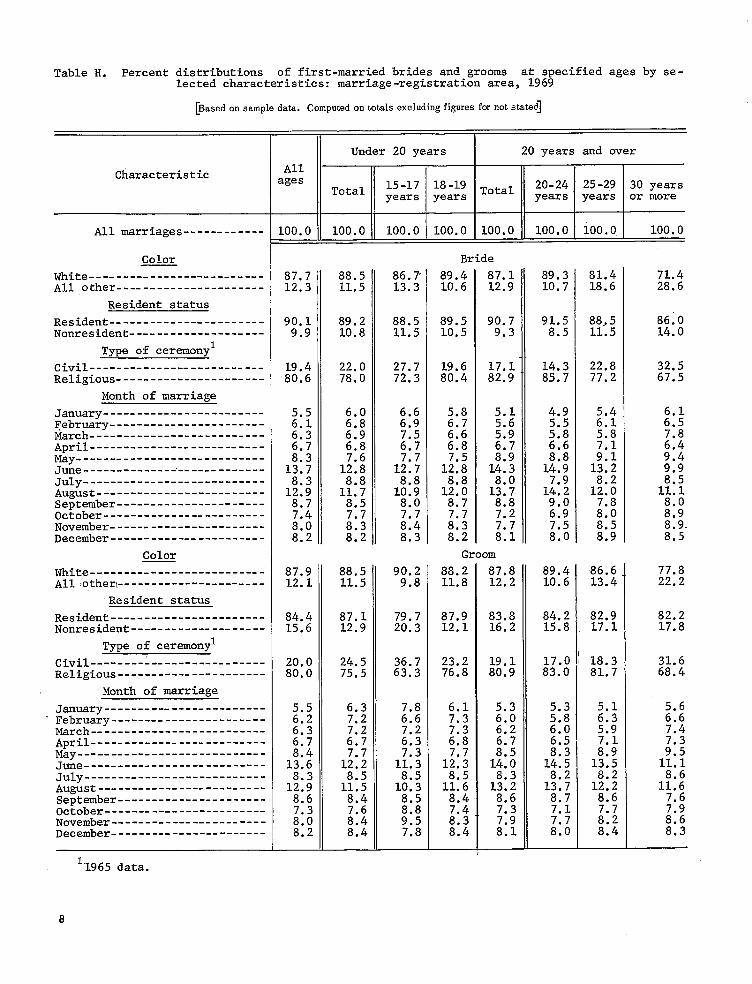
both partners were marrying for the first time, themedisn age ofgroomswas 20.6yearsfor those marrying HLyear-old brides and 21.3 for those niarrying brides aged 19. For those marryingfor the first time, approximately 89 percent of the teenage brides and 87percentofthegrooms were residents of the State where married; 78 percent of the brides and76 percent of the grooms were married in religious ceremonies; and approximately one-third were married in June, July, or August (table H). Close to 90 percent of the teenage brides and grooms were white.
Except for the difference in ageofpwtners, which narrowed in the twenties and widened at older ages, most of these characteristics were similar to those for brides and grooms who married at later ages.Teenagebridesandgrooms married in a civil ceremony more often than first-married brides and grooms aged 20-24,and they married a little more randomly throughout the year. Teenage brides were also a little more’ frequently nonresidents oftheStatewhere married than brides aged 20-24, while teenage grooms, except for the very young, were less frequently nonresidents than older grooms (table H).
Sex and color d&eventials.—Available data show anumber of interesting differences inteenage marriages by sex aqd color.
The marriage rate is higher forfemales than for maIes throughout the teens, butthedifference is much greater in the early teens than Iater. MRA data for 1969 showed a marriage rate for females aged 15-17 that was 7 times the rate for males in’the same age group, while atages 18-19 the rate for females was onlya little over twice the rate for males (table E). These ratios are lower than those observed earlier in the decade. In 1964 the marriage rate for females 15-17 was about 10 times the rate for malesat those ages, and at 18-19 years of age it was slightly over 2?4 times the rate for males. This change in ratio resulted from the decline in marriage rates for female teenagers and the increase in rates for males.
Another difference between the sexes ,though slight, was in residency. In first marriages, young menwer e somewhatmore inclinedtomarry out of their State of residence than women; especially at the very young ages.
Type of ceremony also varied somewhat by sex. Relatively fewer of the teenage grooms than brides were married in a religious ceremony, especially at the early ages (table H).
Only minor differences in seasonality were noted. Slightly more of the teenage men than women married during the winter months and
7.
--------------------
-------------------------
-----------------------
-------
----------------------
----------------------
--------
-----
--------------------------
--------------------------
----
Table H. Percentdistributions of first-married brides and grooms at specified ages by selected characteristics: marriage-registration area, 1969
[Based on sample data. Computed on totals excluding figures for not stated]
II
II Under 20 years 20 years and over
Characteristic I I 20-24 25-29 30 years
Total I years Iyears or more
All marriages------------ LOO.O II100.0 II100001 100.0 100.0 100.0 100.0 100.0
Color
White--------------------------All other----------------------
Resident status
Resident-----------------------Nonresident
Type of ceremonyl
Civil-----------------------Religious
Month of marriage
January------------------------FebruaryMarch--------------------------April--------------------------May----------------------------J&e--------------------July---------------------------Aug&t -------------------------SeptemberOctober------------------------November-----------------------December-----------------------
Color
White--------------------------All ‘o.therl
‘Resident status
Resident-----------------------Nonresident------------
Type of ceremonyl
Civil---------------------Religious----------------------
Month of marriage
January------------------------Fetwary -----------------------
April--------------------------May----------------------------Juie---------------------------July---------------------------Au&st ---------------------SeptemberOctober------------------------November-------------------December-----------------------
1’1965data.
Bride
87.7 88.5 86.7’ 89.4 87.1 89.3 81.4 71.412.3 11.5 13.3 10.6 12.9 10.7 18.6 28.6
90.1 89.2 88.5 89.5 90.7 91.5 88.,5 86.09.9 10.8 11.5 10.5 9.3 8.5 11.5 14.0
19.4 22.0 27.7 19.6 17.1 14.3 22.8 32.580.6 78.0 72.3 80.4 82.9 85.7 77.2 67.5
6.0 6.6 5.8 5.1 4.9 2:? 6.8 6.9 6.7 2:: ::; 6.3 6.9 6.6 n R 5.8 6.7 6.8 H 6.8 6.7 6.6 :::
;:: 9.4 1%; 1;:: 1;:; 1;:: 1::; 1;:: 13.2 9.9
1;:: 1::? 1::: 1;:: 1!:; 1::; 1;:: 1;:: 8.7 8.5 8.0 8.7 8.8 9.0 8.0
7.2 6.9 H 8.9 n ;:; ;:: n 8.5 8.9. 8.2 8.2 8.3 8.2 ;:: ;:: 8.9 8.5
Groom
87.9 88,5 90.2 88.2 87.8 89.4 86.6 77.812.1 11.5 9.8 11.8 12.2 10.6 13.4 22.2
;;.; ;;,; 79.7 87.9 83.8 ::.; 82.9 82.2. . 20.3 12.1 16.2 . 17.1 17.8
20.0 24.5 36.7 ;:.; 19.1 17.0 18.3 31.680.0 75.5 63.3 . 80.9 83.0 81.7 68.4
5.5 6.3 6.1 5.3 5.3 :.; 5.6 6.2 7.2 u 7.3 6.0 5.8 6.6 6.3 7.2 6.2 :.; 5:9 7.4 6.7 2:; 6.3 ::; . 7.1 7.3
;:; J:: J:; 1::: 1;:; 14.0 J:; 1::2 1;:: 8’.3 12.9 1::; 1::; 1?:: 1$: 1%? 1;:; 11:6 8.6 8.4 8.5 8.4 8.7 8.6 7.6
7:3 7.1 n ::: ::! u ;:$ ;:: 8.2 8.4 7.8 8.4 ;:: ;:; 8.4 8.3
8
----------------------
----------------------
-----
-------
Table J. Teenage marriage rates for females and males, by color and age: marriage-registration area, 1960
Age in years
Sex and color 18-19
m 15-17
Female
White 97.8 44.0 ;;; . ; All other 83.7 56.2 .
Male
White 29.0 4.7 77.7 All other 26.8 6.3 67.4
fewer marriedduring thesummer.For bothbrides and grooms the June and August seasonal pea.ks were a little less decided for those marrying at ages under 18 than for those 18 and over.
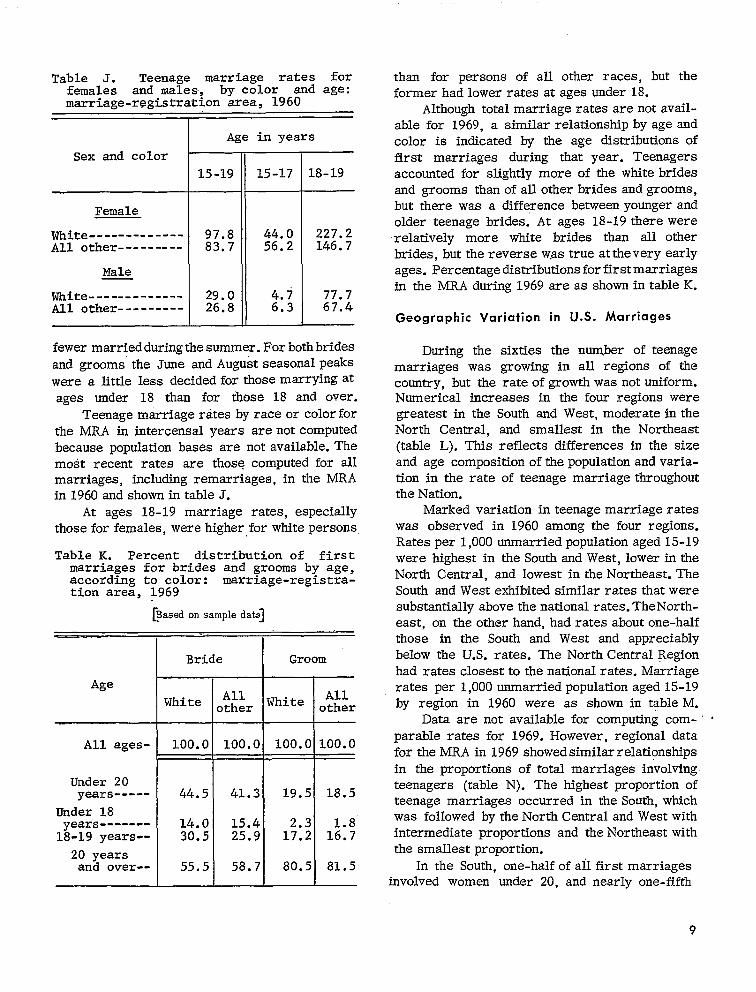
Teenage marriage rates by raceor colorfor the MRA in intercensal years are not computed because population bases are not available. The most recent rates are those computed for all marriages, including remarriages, in the MRA in1960 and shown intable J.
At ages 18-19 marriage rates, especially those for females, were higher for white persons,
Table K. Percent distribution of first marriages for brides and grooms by age, according to color: marriage-registration area, 1969
[~ased on simpledata]
1“ I I Bride I Groom
Age AllWhite o~~~r
IWhite other
All ages- 100.0 100.0 100.0 100.0 ,
Under 20 years 44.5 41.3 19.5 18.5
Under 18 years 14.0 15.4
18-19 years-- 30.5 25.9 1;:: 1::;
20 yearsand over-- 55.5 58.7 80.5 I 81.5
than for persons of all other races, but the former hadlower rates at ages under 18.
Although total marriage rates are not avail-able for 1969, a simikrr elationshipby age and color is indicated by the age distributions of first marriages during that year. Teenagers accounted for slightly more of the white brides and grooms than of another brides and grooms, but there was a difference between younger and older teenage brides. At ages 18-19 there were
-relatively more white brides than all other brides, but thereverse was true atthevery early ages. Percentagedistributionsforfirstmarriages in the MRA during 1969 areas shown intable K.
Geographic Variation in U.S. Marriages
During the sixties the number of teenage marriages was growing in all regions of the country, but the rate of growth was nonuniform. Numerical increases in the four regions were greatest in the South and West, moderate inthe North Central, and smallest in the Northeast (table L). This reflects differences in the size and age composition ofthe population andvariation in the rate of teenage marriage throughout the Nation.
Marked variation in teenage marriage rates was observed in 1960 among the four regions. Rates per 1,000 unmarried population agedl 5-19 were highest in the South and West, lower in the North Central, and lowest in the Northeast. The South and West exhibited similar rates that were substantially above the national rates. The North-east, on the other hand, had rates about one-half those in the South and West and appreciably below the U.S. rates. The North Central Region had rates closest to the national rates. Marriage rates per 1,000 unmarried population aged 15-19 by region in 1960 were as shown in table M.
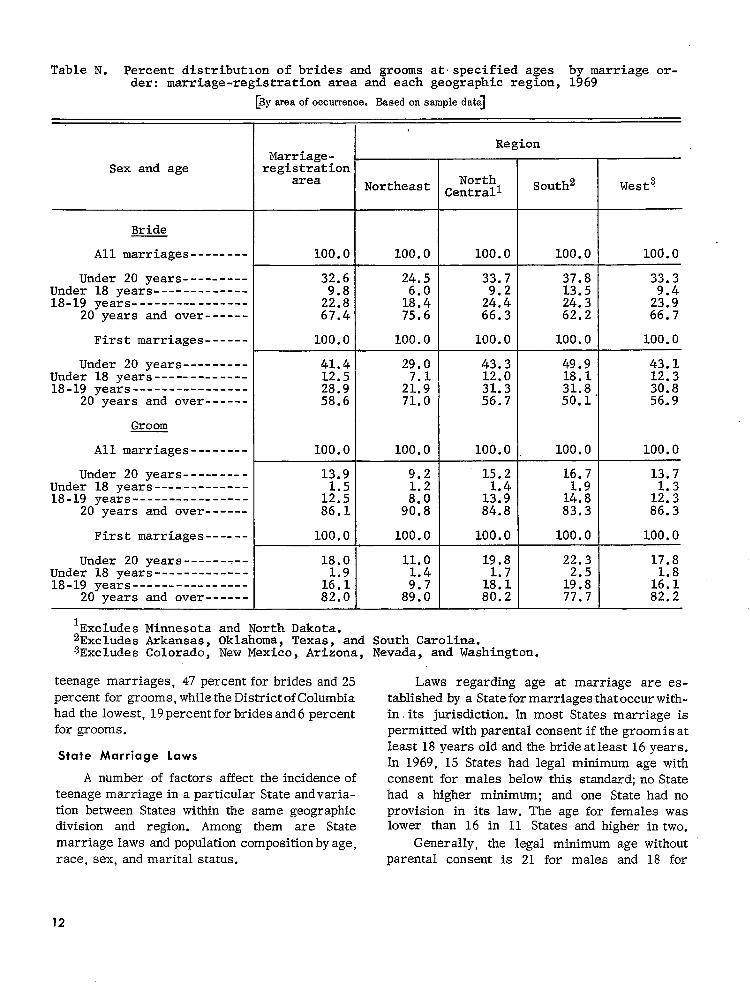
Data are not availabIe for computing corn- “ parable rates for 1969. However, regional data for the MRA in 1969 showed similar relationships in the proportions of total marriages involving teenagers (table N). The highest proportion of teenage marriages occurred in the South, which was followed by the North Central and West with intermediate proportions and the Northeast with the smallest proportion.
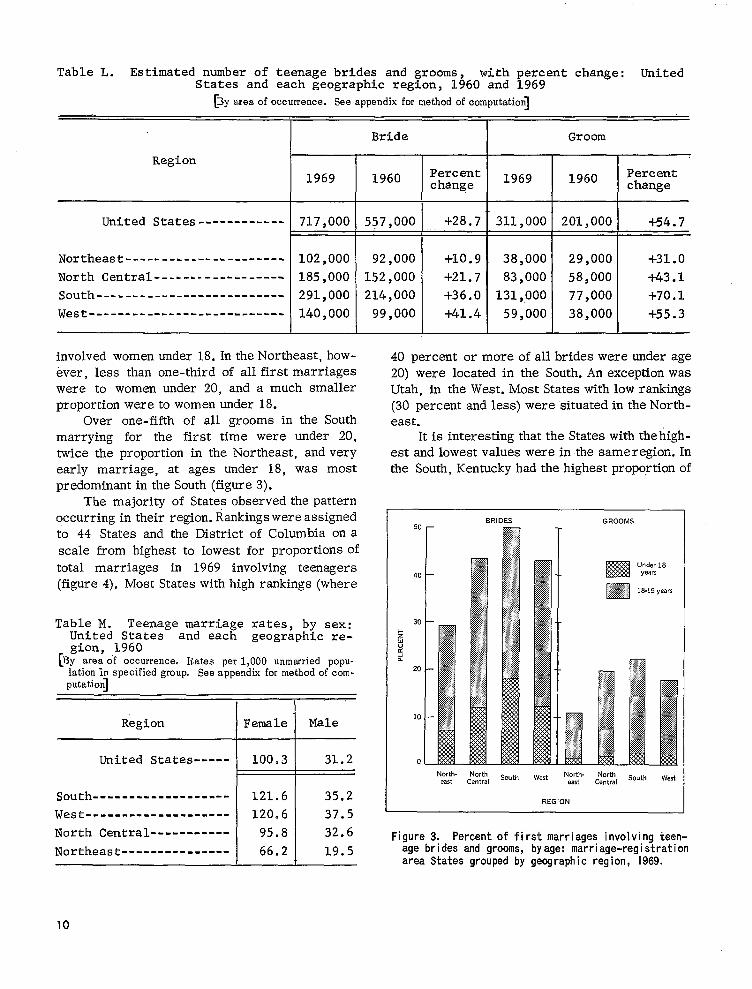
In the South, one-half of all first marriages involved women under 20, and nearly one-fifth
9
------------
----------------------
------------------
--------------------------
---------------------------
-----
-------------------
--------------------
-----------
---------------
Table L. Estimated number of teenage brides and grooms, with percent change: UnitedStates and each geographic region, 1960 and 1969
[3y area of occurrence. See appendix for method of computation]
Bride Groom
Region
1969 1960 Percent 1969 1960 Percent change change
United States 717,000 557,000 .—+28.7 311,000 201,000 +54.7
Northeast 102,000 92,000 +10.9 38,000 29,000 +31.0
North Central 185,000 152,000 +21.7 83,000 58,000 +43.1
South 291,000 214,000 +36.0 131,000 77,000 +70.1
West 140,000 99,000 +41.4 59,000 38,000 +55.3
involved women under 18. In the Northeast, how-ever, less than one-third of all first marriages were to women under 20, and a much smaller proportion were to women under 18.
Over one-fifth of all grooms in the South marrying for the first time were under 20, twice the proportion in the Northeast, and very early marriage, at ages under 18, was most predominant inthe South (figure 3).
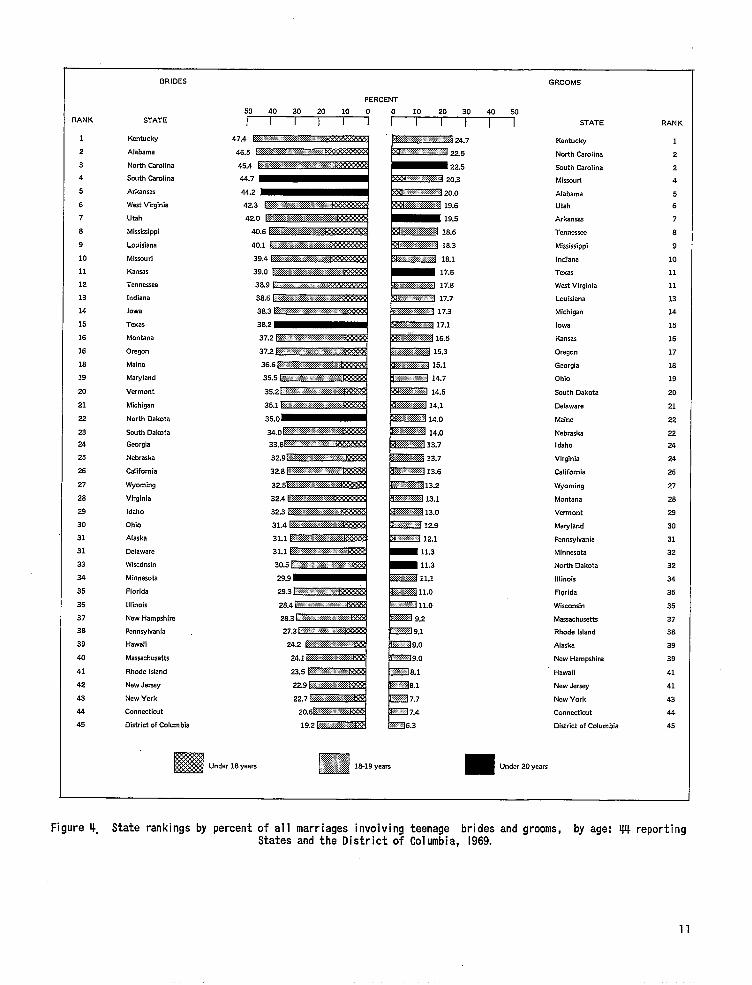
The majority of States observed the pattern occurring in their region. Rankingswereassigned to 44 States and the District of Columbia ona scale from highest to lowest for proportions of total marriages in 1969 involving teenagers (figure 4). Most States with high rankings (where
Table M. Teenage marriage rates, by sex: United States and each geographic region, 1960
[By areaof occurrence. ItatBs per 1,000 unmarried pqJ.lation in specified group. See appendix for method of computation]
Region Female Male
United States 100.3 31.2
south 121.6 35.2
West 120.6 37.5
North Central 95.8 32.6
Northeast 66.2 19.5 1
40 percent or more of all brides hereunder age 20) were located in the South. An exception was Utah, in the West. Most States with low rankings (30 percent and less) were situated in the North-east.
It is interesting that the States with the highestandlowest values were inthe sarneregion. In the South, Kentucky had the highest proportion of
BRIDES GROOMS 50
Under 18
40 = year,
m 1S-19 years
I
North. North North- NorthSouth West South West east Central east Central
REGION
:igure 3, Percent of first marriages involving teen-age brides and grooms, byage: marriage-registrationarea States grouped by geographic reg ion, 1969.
10
1
2
3
4
5
6
7
8
9
10
11
12
13
14
15
16
GRoOMS
PERCENT
RANK STATE ‘YH%-Fi STATE RANK
Kentucky Kentucky 1
Alabama North Carolina 2
North Carolim South Carolina 2
South Carolina Missouri 4
Arkansas Alabama 5
We5t Virginia Utah 6
Utah Arkansas 7
Mississippi Tennessse 8
Louisiana Mississippi 9
Missouri Indiana 10
Kansas Texas 11
Tennessee West Vkgi”ia 11
Indiana Louisiana 13
Iowa Michigan 14
Texas Iowa 15
Montana Kansas 16
16 Oregon Oregon 17
18 Maine Georgia 18
19 Maryland Ohio 19
20 Vermont South Dakota 20
21 Michigm Delaware 21
22 North Dakota Maine 22
23 South Dakota Nebraska 22
24 Georgia Idaho 24
25 Nebraska Virginia 24
26 California California 26
27 Wyoming Wyoming 27
28 Virginia Montana 28
29 Idaho Vermont 29
30 Ohio Maryland 30
31 Alaska Pennsylvania 31
31 Oelaware Minnesota 32
33 Wisconsin North Dakota 32
34 Minnesota Illinois 34
35 Florida Florida 35
36 Illinois Wisconsin 35
37 New Hampshire Massachusetts 37
38 Pennsylvania Rhode Island 38
39 Hawaii Alaska 39
40 Massachusetts New Hampshire 39
41 Rhode Island Hawaii 41
42 New Jersey New J0rsJ2y 41
43 New York New York 43
44 Connecticut Connecticut 44
45 District of Columbia District of Columbia 45
Under 18 years Under 20 years
Figure 4. State rankings by percent of al1 marr iages involving teenage brides and grooms, by age: w reportingStates and the District of Columbia, 1969.
11
--------
------
Table N. Percent distr~butlon of brides and grooms atspecified ages ~6arriage order: marriage-registrationarea and each geographic region,
[Byamaof C)CCUW31)CX3. Based on iwnple data]
RegionMarriage-
Sex and age registrationarea
Bride
All marriages 100.0
Under 20 years--------- 32.6Under 18 years-------------18-19 years---------------- 2;::
20 years and over------ 67.4
First marriages 100.0
Under 20 years--------- 41.4Under 18 years------------- 12.518-19 years---------------- 28.9
20 years and over------ 58.6 r
Groom I All marriages-------- 100.0
Under 20 years--------- 13.9Under 18 years-------------18-19 years---------------- 1;:2
20 years and over------ 86.1k
First marriages------ 100.0
Under 20 years--------- 18.0Under 18 years-------------18-19 years---------------- 1::;
20 years and over------ 82.0
lExcludesMinnesota and North Dakota.
Northortheast Centrall
100.0 100.0
24.5 33.7
1::: 2::;75.6 66.3
100.0 100.0
29.0 43.312.0
2!;: 31.371.0 56.7
100.0 100.0
9.2 15,21.2
1$;9::: 84.8
100.0 100.0
11.0 19.81.4
1;::8;:; 80.2
T 100.0 I 100.0
37.8 33.3 13.5 24.3 2!:: 62.2 66.7
100.0 100.0
49.9 43.1 18.1 12.3 31.8 30.8 50.1 ‘ 56.9
100.0 I 100.0
16.7 13.7
1;:: J:: 83.3 86.3
100.0 100.0
22.3 17.8
1::2 1:::Y’ 82.277.7
2Excludes Arkansas, Oklahoma, Texas,-and South Carolina.3Excludes Colorado, New Mexico, Arizona, Nevada, and Washington.
teenagemarriages,47 percentforbridesand25percentforgrooms,whiletheDistrictofColumbiahad thelowest,19.percentforbridesand6percentforgrooms.
State Marriage Laws
A number of factorsaffecttheincidenceofteenagemarriageina particularStateandvariationbetweenStateswithinthe same geographicdivisionand region.Among them are Statemarriagelawsandpopulationcompositionbyage,race,sex,andmaritalstatus.
Laws regardingage at marriage are established thatoccurwithbya Stateformarriagesin.itsjurisdiction.In most Statesmarriage ispermittedwithparentalconsentifthegroomisatleast18yearsoldandthebrideatleast16years.In 1969,15 Stateshad legalminimum age withconsentformales belowthisstandard;no Statehad a higherminimum; and one Statehad noprovisionin itslaw.The age forfemaleswaslower than 16 in 11 Statesand higherintwo.
Generally,the legalminimum age withoutparentalconsentis 21 for males and 18 for
12
females. This age requirement was lower for males in nine States and higher for females in 14 States; no State had a higher requirement for males nor a lower requirement for females. Practically all States have established procedures whereby younger parties may obtain licenses to marry in case of special circumstances such as pregnancy or parenthood.
To some extent teenage marriage occurs more frequently in States which are permissive in their standards regarding age at marriage. Of the States for which data on age at marriage were available in 1969, 20 had a relatively low legal minimum age for at least one partner. Of these 20 States, 12 had proportions of teenage marriages above the U.S. average of 33.4 for brides and 14.5 for grooms. These States are Kentucky,, Alabama, North Carolina, South Carolina, Utah, Mississippi, Missouri: Tennessee, Texas, Oregon, Michigan, and Georgia. Seven of the 12 States are located in the South. All but three of the 12 States allowed females under 16 years, males under 18, or both to marry with parental consent.
Legislation regarding age at marriage was revised or enacted in several States during the sixties. A review of the nature of these revisions showed three distinct trends: (1) more uniformity brought about by States raising or lowering their legal minimum age to the standard limits, (2) a legal minimum age corresponding to the legal voting age, and (3) lessening of the gap in age requirements by sex.
Changes in marriage laws may affect year-to-year differences in the number of teenagers married in the State where the change is en-acted and also in adjacent States.
Following a change in the Iowa marriage law that raised the legal minimum age with parental consent, the number of teenagers married in tliat State fell from 15,020 in 1960 to 10,740 in 1962, the first full year after the change+ 29-percent decline.
A change of even greater magnitude occurred in Idaho in 1967 after the law was revised to raise the legal minimum age with and without consent and to establish a 3-day waiting period. The number of teenagers married declined from 12,665 in 1966 to 5,020 in 1968, a 60-percent drop. Increases, although small, occurred in the ad-joining States of Montana, Oregon, Utah, and
Wyoming. Counts of marriages by age were not available for the adjoining States .of Nevada and Washington.
In addition, decreases were observed in Montana between 1960 and 1962 after a 5-day waiting period before issuance of license was instituted, in Rhode Island between 1961 and 1962 after Massachusetts reduced its waiting period from 5 to 3 days, and in the District of Columbia between 1966 and 1967 after a blood test for venereal disease became mandatory.
The opposite effect was producedin Kentucky when limits were relaxed for both partners in marriage without parental consent. The number of teenagers marrying rose from 18,030 in 1967 to 26,190 in 1969, the first full year after the change+ 45-percent increase.
Effective in 1969, Texas lowered the age at which consent for males is required and dropped the 3-day waiting period before issuance of a license. The number of brides and grooms under 20 marrying in Texas increased tiom 62,135 in 1968 to 79,863 in 1969 (an increase of 29 percent).
In Hawaii, which had large numbers of servicemen on rest and rehabilitation programs, a lower age requirement for females and the abolition of a 3-day w&ingperiodbefore issuance of a license raised the number of teenagers marrying from 2,592 in 1968 to 3,194 in 1969+ 23-percent increase after the law had been in effect for only 6 months.
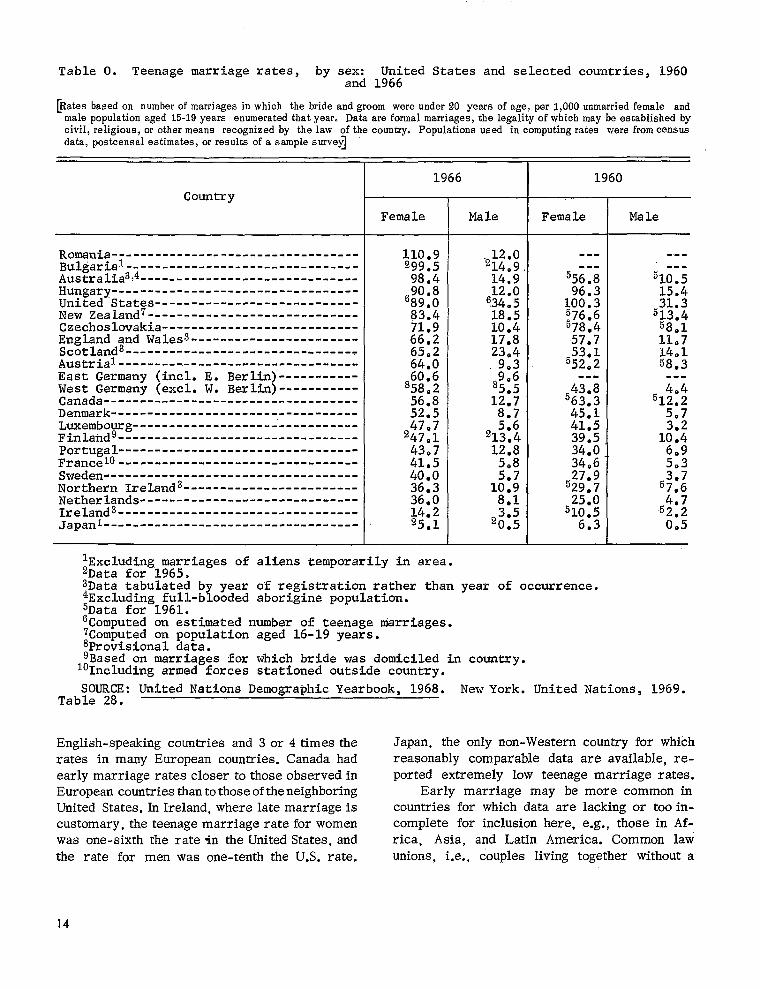
International Comparisons
The United States has a relatively high teen-age marriage rate compared with other industrialized nations. Rates for selected countries, as published in the United Nations Demographic Yewbook, 1968, are shown in table O. For men, the United States had the highest teenage marriage rate of any country for which comparative data were available; its teenage marriage rate for women was exceeded only in Romania, Bulgaria, Australia, and Hungary.
Marriage rates for ,teenage women in the United States were closest to those for Hungary, New Zealand, and Austialia and considerably higher than those for the British Isles and West-ern Europe. The rate for teenage males in the United States was twice the rates for most of the
13
--------------------------------------------------------------
----------------------------
----------------------------------
-----------------------------------------------------------------
-------------------------------------------------------------------------------------------------
------------------------ ---
-----------------------------------------------------------
------
---
-------
---
Table O. Teenage �arriage rates, by sex: United States and selected countries, 1960 and 1966
[Rates based on number of marriages in which the bride and groom were under 20 years of age, per 1,000 unmarried female and male population aged 15-19 years enumerated that year. Data are formal marriages, the legality of which may be established by civil, religious, or other means recognized by the law of the country. Populations used in computing rates were from oensus data, postcensal estimates, or results ofa sample surve~
1966 1960
Country
Female Male Female Male
Romania.-----.---------------------------BulEari.alAustralia3~4Hungary----------------------------------United StatesNew Zealand7-----------------------------CzechoslovakiaEngland and WalesS----------------,Scotland3AustrialEast Germany (incl. E. Berlin)-----------West Germany (excl. W. Berlin)-----------Canada-----------------------------------Denmark-----------------------,-----------LuxembourgFinlandgPortugalFranceIO---------------------------------Sweden -----.--Northern Ireland3------------------------Netherlands1reland3---..JapanI-----------------------------------
110.92$)9-5
9894 556.8 510.5
6;;:; 96.3 100.3
15.4 31.3
83.4 576.6 513.4 71.9 578.4 58.1 66.2 57.7 11.7 65,2 64.0 5:;:;
L4.1 58.3
60.6 858.2 4.4 56.8 5:::; 512.2 52.5 45.1 5.7
41.5 2:;:: 39.5 1~:~ 43;7 34.0 41.5 34.6 5:3 40.0 3.7 36.3 53:; 57.6 36.0 25.014.2 51O*5 5$;25.1 6.3 005
lExcludingmarriages of aliens temporarily in area.2Data for 1965.3Data tabulated by year OF registration rather than year Of occurrence.4Excluding full-blooded aborigine population.5Data for 1961.6Computed on estimated number of teenage uiarriages.7Computedon population aged 16-19 years.provisional data.9Based on marrf-ages for which bride was domiciled in COU121Xy.
10Includingarmed forces stationed outside country.
SOURCE: United Nations Demographic Yearbook, 1968. New York. United Nations, 1969.Table 28.
English-speakingcountriesand 3or4 timestherates in many European countries.Canada hadearlymarriageratesclosertothoseobservedinEuropeancountries neighboringthantothoseoftheUnitedStates. where latemarriageisInIreland,customary,theteenagemarriagerateforwomenwas one-sixththerateqn theUnitedStates,and
the rate for men was one-tenththe U.S.rate.
Japan,theonlynon-Westerncountryforwhichreasonablycomparable dataare available,re
portedextremelylow teenagemarriage rates.Early marriage may be more common in
countriesforwhich dataare lackingor tooincomplete forinclusionhere,e.g.,thosein Africa, Asia, and Latin America. Common lawunions,i.e.,coupleslivingtogetherwithouta
14
-------------
--------------------------------------
-----------------
-------------------
--------------------------------
------------------------------------
Table P* Ratio of teenage marriage rate for females to rate for males: United States and selected countries, 1966
[Ratioscomputed from rates shown in table 0]
Ratio of
Country teenage � arriage rate female/male
Romania-------------------- 9.2 Bulgarial’2----------------- 6.7 Australia3----------------- 6.6 Hungary-------------------- 7.6 United States4-------------New Zealand5--------------- ::: Czechoslovakia 6.9 England and Wales----------Scotland AustriaI East Germany (incl. E. Berlin)---------------- 6.3
West Germany (excl. W. Berlin)6---------------Canada---------------------Denmark--------------------LuxembourgFinland%?------------------PortugalFrances--------------------SwedenNorthern IrelandNetherlandsIrelandJapanl~2-------------------
lExcluding �arriages of aliens temporarily in area.
2Data for 1965. 3Excluding full-blooded aborigine pop-
ulation. 4Computed on estimated number of teen-
age marriages. 5Computed on population aged 16-19
years.6provisionaldata.7Based .on marriages for which bride
was domiciled in country.‘Includingarmed forces stationed out
side country.
formal or recognizedmarriage, are believedto be prevalentin theseareas.Census enumer-ationsin thesecountrieshave shown highproportionsmarried among theteenagepopulation,whilethevitalstatisticsshow fewteenagemarriages.
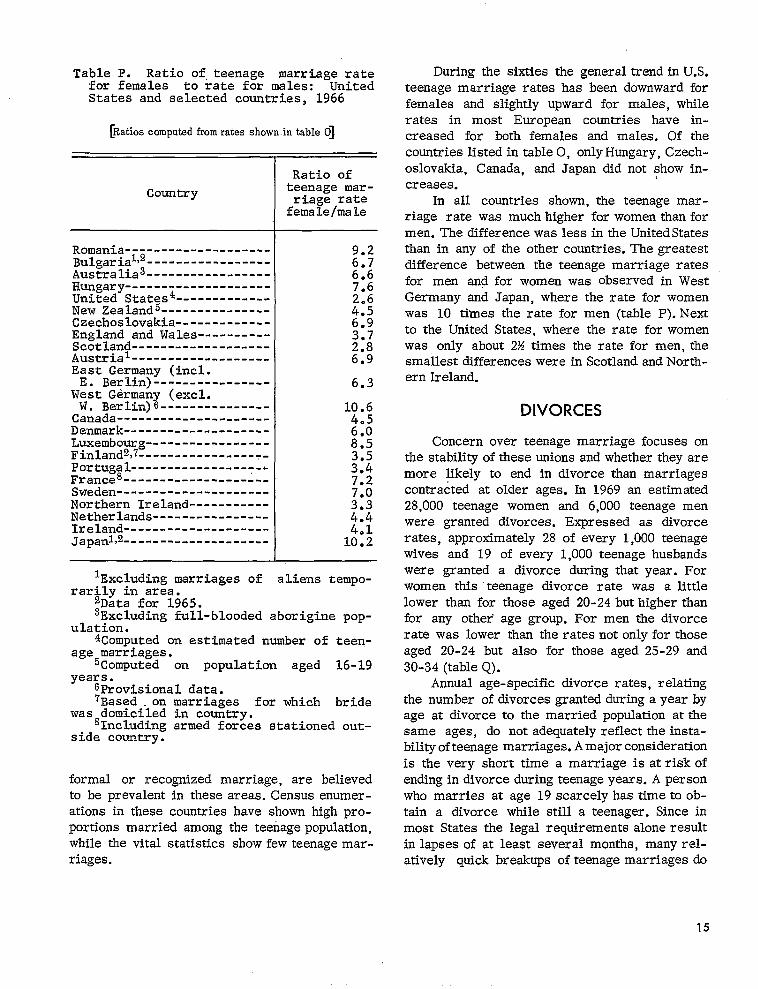
During the sixties the general trend inU.S. teenage marriage rates has been downward for females and slightly upward for males, while rates in most European countries have in-creased for both females and males. Of the countries listed in tableO, onlyHungary, Czechoslovakia, Canada, and Japan did not show in-creases.
In all countries shown, the teenage marriage rate was much higher for women than for men. The difference was less in the UnitedStates than in any of the other countries. The greatest difference between the teenage marriage rates for men and for women was observed in West Germany and Japan, where the rate for women was 10 times the rate for men (table P).Next to the United States, where the rate for women was only about 2% times the rate for men, the smallest differences were in Scotland and North-ern Ireland.
DIVORCES
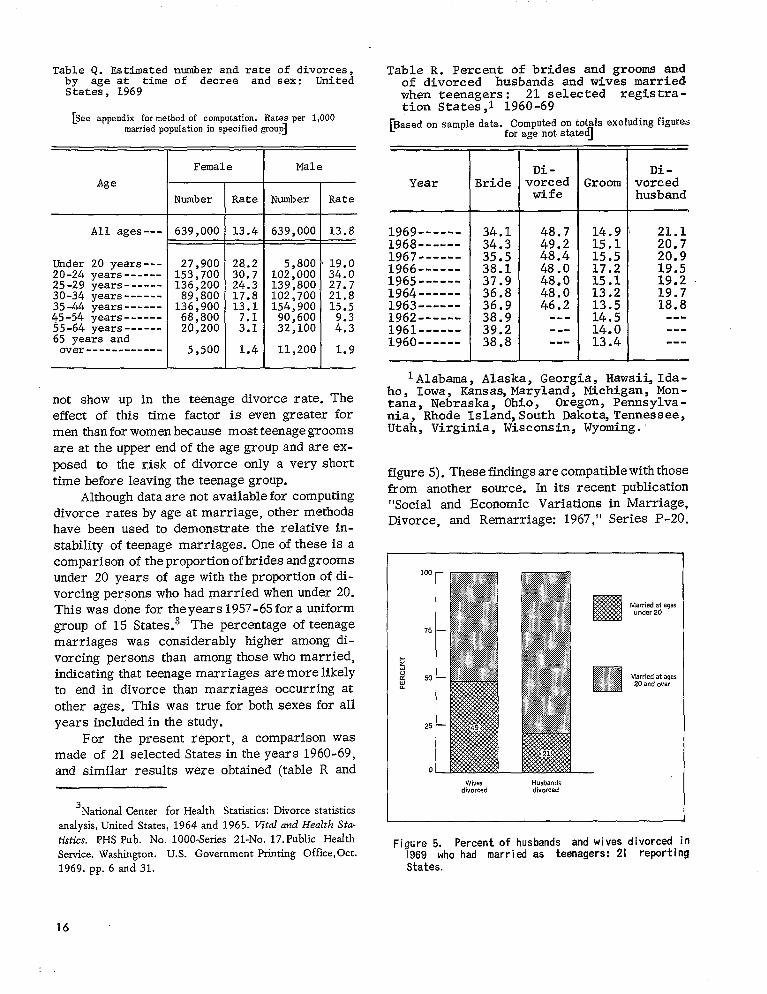
Concern over teenage marriage focuses on the stability ofthese unions and whether they are more likely to end in divorce than marriages contracted at older ages. In 1969 an estimated 28,000 teenage women and 6,000 teenage men were granted divorces. Expressed as divorce rates, approximately 28 of every 1,000 teenage wives and 19 of every 1,000 teenage husbands were granted a divorce during that year. For women thLs teenage divorce rate was a little lower than for those aged 20-24 buthigher than for any other age group. For men the divorce rate was lower than the rates not only for those aged 20-24 but also for those aged 25-29 and 30-34 (table Q).
Annual age-specific divorce rates, relating the number of divorces grsntedduring ayear by age at divorce to the married population at the same ages, do not adequately reflect theinstabilityofteenage marriages.Amajor consideration is the very short time a marriage is at riskof ending in divorce during teenage years. A person who marries at age 19 scarcely hastimetoobtain a divorce while still a teenager. Since in most States the legal requirements alone result in lapses of at least several months, many relatively quick breakups of teenage marriages do
15
---------------
------------------------------------
------------
---------
Table Q. Estimated number and rate of divorces, by age at time of decree and sex: United States, 1969
[See appendix formethodof computation. Rates per 1,000 married population in specified groupj
Female Male
Age
Number Rate Rate
All ages--- 639,000 13.4 639,000 13.8
Under20 years--- 27,900 28.2 5,800 19.0 20-24years 153,700 30.7 102,000 34.0 25-29 years 136,200 24.3 139,800 27.7 30-34 years 89%800 17.8 102,700 21.8 35-44 years 136,900 13.1 154,900 15.5 45-54 years 68,800 90,600 55-64 years 20,200 ;:; 32,100 ::: 65 years and
over 5,500 1.4 11,200 1.9
not show up in the teenagedivorcerate.Theeffectof thistime factoris even greaterformen thanforwomenbecausemostteenagegroomsareattheupperendoftheagegroupandareexposed to ther,iskof divorceonlya veryshorttimebeforeleavingtheteenagegroup.
Althoughdataarenotavailableforcomputingdivorceratesby ageatmarriage,othermethodshave been used to demonstratetherelativein-stabilityofteenagemarriages.Oneoftheseis acomparisonoftheproportionofbridesandgroomsunder 20 years of agewiththeproportionofdi-vorcingpersonswhohadrnarriedwhen under20.Thiswas donefortheyears1957-65forauniform
.3 The percentageofteenagegroup of 15 Statesmarriages was considerablyhigheramong divorcingpersonsthanamong thosewho married,indicatingthatteenagemarriagesaremorelikelyto end in divorcethanmarriagesoccurringatotherages.This was trueforbothsexesforallyearsincludedinthestudy.
For thepresentreport,a comparisonwasmade of 21 selectedStatesintheyears1960-69,and similarresultswere obtained(tableR and
3 National Center for Heakh Statistics: Divorce statistics
analysis, United States, 1964 and 1965. Vitdmd Heukh Statistics. PHSPub. No. 1000-Series 21-No. 17.Public Health
Service. Washington. U.S. Government Printing Office, Oct.
1969. pp.6and 31.
Table R. Percent of brides and grooms andof divorced husbands and wives marriedwhen teenagers: 21 selected registration States,l 1960-69
[Based on sample data. Com@ed ontot~ls excluding figuces for age not statedJ
I Di- Di-
Year Bride vorced Xoorn vorced wife husband
1969------ 34.1 48.7 14.9 21.1 1968------ 34.3 49.2 15.1 20.7 1967------ 35.5 48.4 15.5 20.9 1966------ 38.1 48.0 17.2 19.5 1965------ 37.9 48.0 15.1 19.2 y#---- 36.8 48.0 13.2 19.7
36.9 46.2 13.5 18.8 1962------ 38.9 14.5 1961------ 39.2 14.0 1960------ 38.8 13.4
lAlabama, Alaska, Georgia, Hawai,LIdaho, Iowa, Kansa~ Maryland, Michigan, Montana, Nebraska, Ohio, OregOn, Pennsylvania, Rhode Island,South Dakota,Tennessee,Utah, Virginia, Wisconsin, Wyoming.
figure5).Thesefindingsarecompatiblewiththosefrom anothersource.Initsrecentpublication“Socialand Economic Variationsin Marriage,Divorce,and Remarriage:1967,”SeriesP-20.
100
75
50
25
0
Wives Husbands divorced divorced
Figure 5. Percent of husbands and wives divorced in1969 who had married as teenagers: 21 reportingStates.
16
----------------------------
-------- -------- ----------------
-------------------------- ----------- ------- -------------- -----
------------------------ -----
------------------------
-------- -------------------------------------------------
----------------------------------------------------------- --------
---------------------------------
--------------------------------- ---------------------------------------------------
------------------------
---------------- ----------------------------------------------
-------------------- -------------------------- -------
-------- -------- ---------------- ---
Table S. Percentof divorced husbands and wives who were teenagers at time ofdecree andpercent married when teenagers: divorce-registration area and 20 reporting States,grouped by region, 1969
[Based on sample data. By place of OCCU,lWICt?. Computed excluding foragenotstated]ontotals figures
Divorced husbands Divorced wives who were teenagers who were teenagers
Region and State at time of: at time of:
I I Decree Marriage Decree Marriage
Divorce-registration area$---------
Northeast
Vermont ......----Rhode Island ......---------------
ConnecticutNew YorkPennsylvania
North Central
Illinois --q-----WisconsinIowa-----z--- -------m-MissouriNebraska ----s--- -----m-- -Kansas--------------------------.----m---
South
Virginia-- ------.-----
KentuckyTennessee
West ----=S-- -
Montana -S.-----m
IdahoOregon ---.-”California ------m-Alaska Hawaii ...........................--.-m---
Percent
0.9 19.2 4.4 45.8
“0.5 17.7 2.8 45.8
19.5 51.4 16.3 ;:: 44.8 15.2 1.9 42.1 15.3 43.6 20.6 ::; 48.9
19.4 5.3 47.0
0.8 17.6 4.5 45.1 0.3 16.9 ;:.; 1.8 22.9 ::;
22.0 6.7 48:1 M 17.3 5.6 46.2 1.7 21.8 7.3 49.5
1.6 25.1 7.1 52.5
0.5 24.1 52.3 25.7 M 52.4
R 25.5 8.8 52.7
0,6 16.2 2.9 40.8
12.7 41.2 14.5 41.0 16.9 44.0 16.4 40.7 13.5 41.5 13.2 34.7
lIncludes cases for Alabama, Georgia, Maryland, Michigan, Ohio, South Dakota, Utah,and Wyoming, which are not shown separately.
No. 223 of the Cuvvent Po@dutionRepo?%s, on page 1, the U.S. Bureau of the Census reported that “27 percent ofthe”women with teenage marriages were known to have been divorced within 20 or more years, as compared with 14 percent ofthose who entered first marriage aftertheyhad
reached their twenties.” The same comparison was not made for teenage men, but ’’28percentof those who married beforetheage of22years were known tohave been divorced, ascompared with13 percent of those who married for the first time after they had reached 22years of age.” (These
17
------
--------------------------------------------------------
figures are based onanationwide survey conducted for the Office of Economic Opportunity in the early months of 1967.) In other words, divorce was twice as likely for early marriages as for those contracted at later ages.
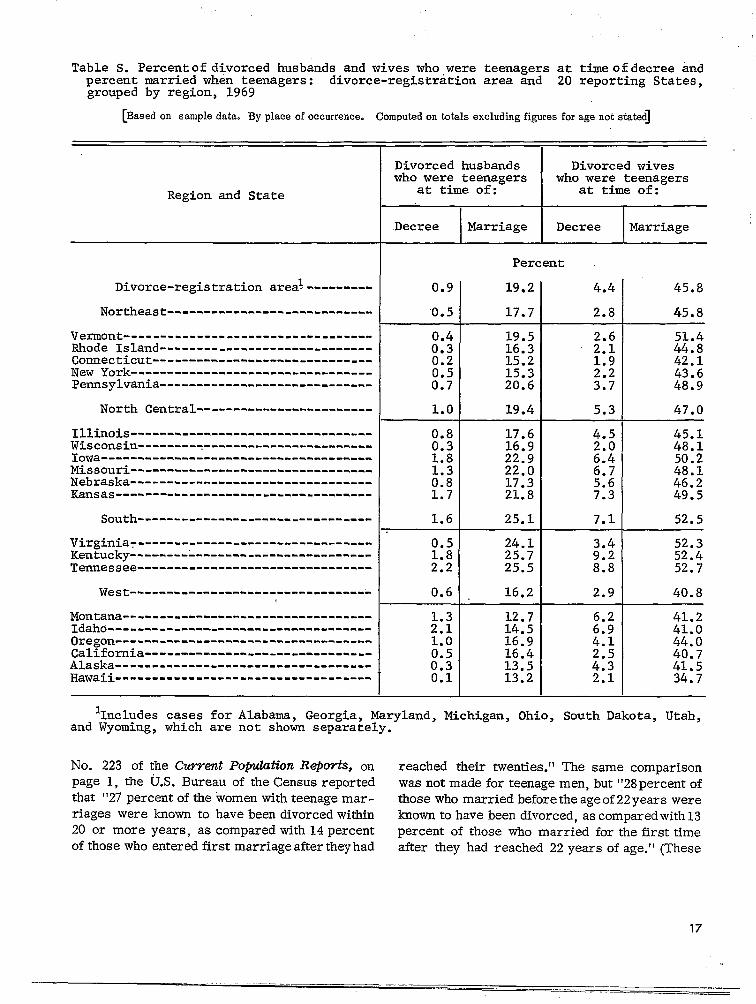
Persons who married before age 20 account for varying proportion; of divorces from State to State, and regional differences are apparent in the available figures (table S). In 1969 the highest pro-portion of such dfvorces was shown by the South (based on data for only three States of that region). The North Central and Northeast Regions ranked second and third, and in the West persons who had married in their teens accounted for the smallest proportion of divorces granted during the year, giving that region a rank of fourth.
As observed earlier, the South also accounted for the greatest proportion of teenage marriages. However, comparisons that may be made between marriage and divorce data by region are limited because data on divorces are not available for all States reporting marriage data.
PARENTHOOD
In 1968, the latest year for which natality statistics were available for inclusion in this re-port, there were 600,816 births to teenage mothers. This comprised 17 percent of all births in the United States during that year. Of these births, 591,312 (98 percent) were to mothers 15-19 years of age, and 9,504 (2 percent) ‘were to mothers under 15 years of age. In terms of birth order, it was a first child in 77 percent of these births, a second child in 18 percent, and a third or higher order child in 4 percent.
Birth Rates
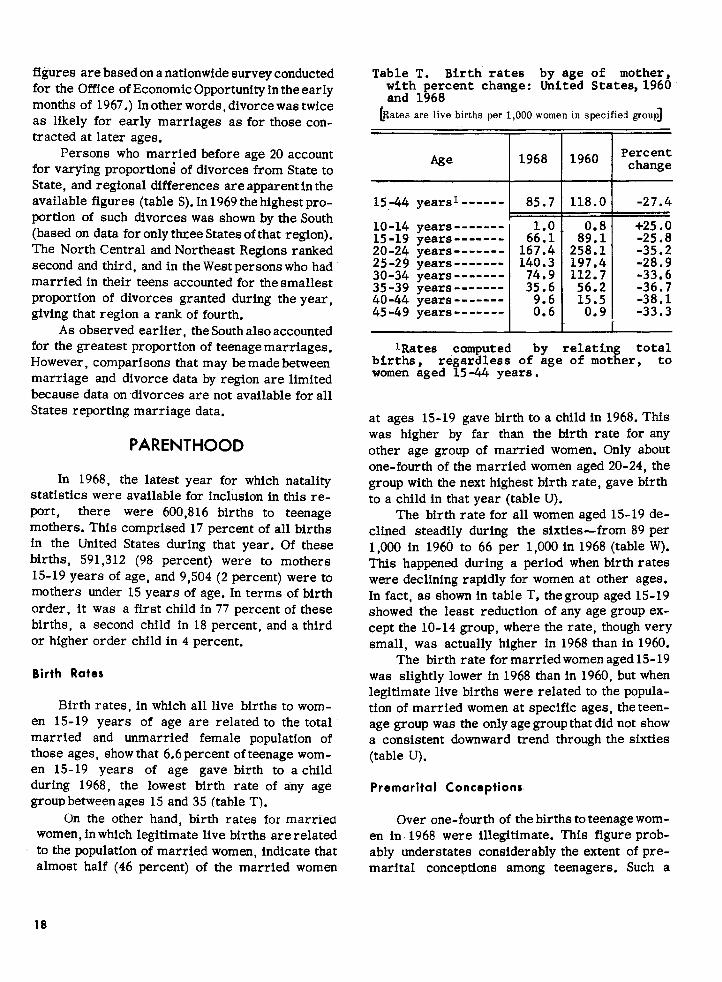
Birth rates, in which all live births to women 15-19 years of age are related to the total married and unmarried female population of those ages, show that 6.6 percent of teenage women 15-19 years of age gave birth to a child during 1968, the lowest birth rate of any age group between ages 15 and 35 (table T).
Un the other hand, birth rates fox married women, in which legitimate live births are related to the population of married women, indfcate that almost half (46 percent) of the married women
Table T. Birth rates by age of mother, with percent change: United States, 1960 and 1968
[Rates we live births per 1,000 women in specified group]
Age 1968 1960 Percent change
15-44 yearsl 85.7 118.0 -27.4
10-14 years +25 .0 15-19 years 6;:!? 8;:!/ -25.8 20-24 years 167.4 258.1 -35.2 25-29 years 140.3 197.4 -28.9 30-34 years 74.9 112.7 -33.6 35-39 years 35.6 56.2 -36.7 40-44 years 15.5 -38.1 45-49 years M 0.9 -33.3
l~tes conmut ed by relathz total births, regardless of Lge of motker, to women aged 15-44 years.
at ages 15-19 gave birth to a child in 1968. Thfs was hfgher by far than the birth rate for any other age group of married women. Only about one-fourth of the married women aged 20-24, the group with the next highest birth rate, gave birth to a child in that year (table U).
The birth rate for all women aged 15-19 declined steadily during the sixties—from 89 per 1,000 in 19@ to 66 per 1,000 in 1968 (table W). This happened during a period when birth rates were declining rapidly for women at other ages. In fact, as shown in table T, the group aged 15-19 showed the least reduction of any age group except the 10-14 group, where the rate, though very small, was actually higher in 1968 than in 1960.
The birth rate for married women aged 15-19 was slightly lower in 1968 than in 1960, but when legitimate live births were related to the population of married women at specific ages, the teen-age group was the only age group that did not show a consistent downward trend through the sixties (table U).
Premarital Conceptions
Over one-iourth of the births to teenage women in. 1968 were illegitimate. This figure probably understates considerably the extent of pre-marital conceptions among teenagers. Such a
18
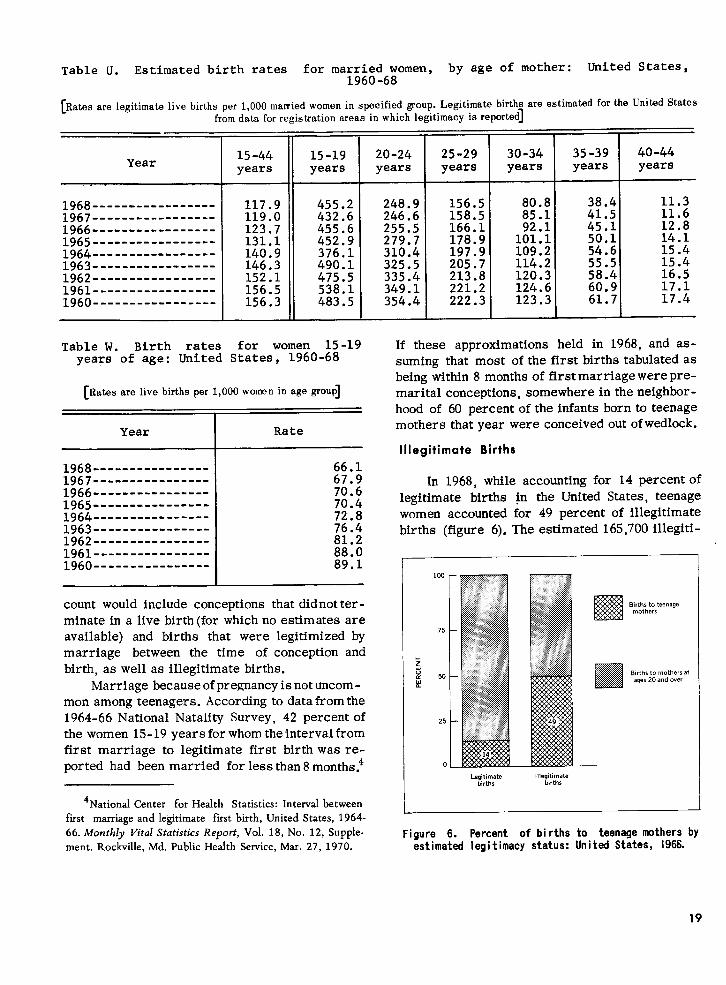
Table U. Estimated birth rates for mam&d6~men, by age of mother: united States,
[Rates are legitimate live births per 1,000 married women in specified group. Legitimate births em estimated for the United States from data for registration areas in which legitimacy is reported]
I 25-29 30-34 35-39 40-44
Year years years years years=11=1= 1968----------------- 117.9 455.2 1967----------------- 119.0 432.6 1966----------------- 123.7 455.6 1965----------------- 131.1 452.9 1964----------------- 140.9 376.1 1963----------------- 146.3 490.1 1962----------------- 152.1 475.5 1961----------------- 156.5 538.1 1960----------------- 156.3 483.5
Table W. Birth rates for women 15-19 years of age: United States, 1960-68
[Rates are live births per 1,000 women in age group]
Year Rate
1968---------------- 66.1 1967---------------- 67.9 1966---------------- 70.6 1965---------------- 70.4 1964---------------- 72.8 1963---------------- 76.4 1962---------------- 81.2 1961---------------- 88.0 1960---------------- 89.1
count would include conceptions that didnotterminate in a live birth (for which no estimates are available) and births that were legitimized by marriage between the time of conception and birth, as well as illegitimate births.
Marriage because ofpregnancyis notuncommon among teenagers. According todatafromthe 1964-66 National Natality Survey, 42 percentof the women 15-19 years forwhomtheintervalfrom first marriage to legitimate first birth wasreported had been married for lessthan8months}
4National ~nter for He&h Statistics: Interval between
fwst marriage and legitimate first birth, United States, 1964-
66. Monthly Vital Statistics Report, Vol. 18, No. 12, Supple
ment. Rockville, Md. Public Health Service, Mar. 27, 1970.
248.9 156.5 80.8 38.4 11.3 246.6 158.5 85.1 41.5 11.6 255.5 166.1 92.1 45.1 12.8 279.7 178.9 101:1 50.1 14.1 310.4 197.9 109,2 54.6 15.4 325.5 205.7 114.2 55.5 15.4 335.4 213.8 120.3 58.4 16.5 349.1 221.2 124.6 60.9 17.1 354.4 222.3 123.3 61.7 17.4
If these approximations held in 1968, and assuming that most of the first births tabulated as being within 8months of firstmarriage werepremarital conceptions, somewhere in the neighbor-hood of 60 percent of the infants bornto teenage mothers that year were conceived out ofwedlock.
Illegitimate Births
In 1968, while accounting for 14 percentof legitimate births in the United States, teenage women accounted for 49 percent of illegitimate births (figure 6). The estimated 165,700 illegiti
lW
75
Bwths tomothers at ,ge,20 and over
— I_egit imate llleg&m:te
births
Figure 6. Percent of births to teenage mothers byest imatad Ieg itimacy status: United States, 1966.
19
---------------------
---------------------------------------
--------------------------------------
------------------------------------------------------------------------------------
---------------
mate births to teenage mothers that year were almost as many as were recorded for all other age groups of women combined.This count was about 80 percent above the number in 1960, a much greater increase than occurred in illegitimate births to women at all other ages (31 per-cent). In contrast, legitimate births to teenagers were 13 percent fewer than in 1960, a smaller decrease than the older women experienced (23 percent).
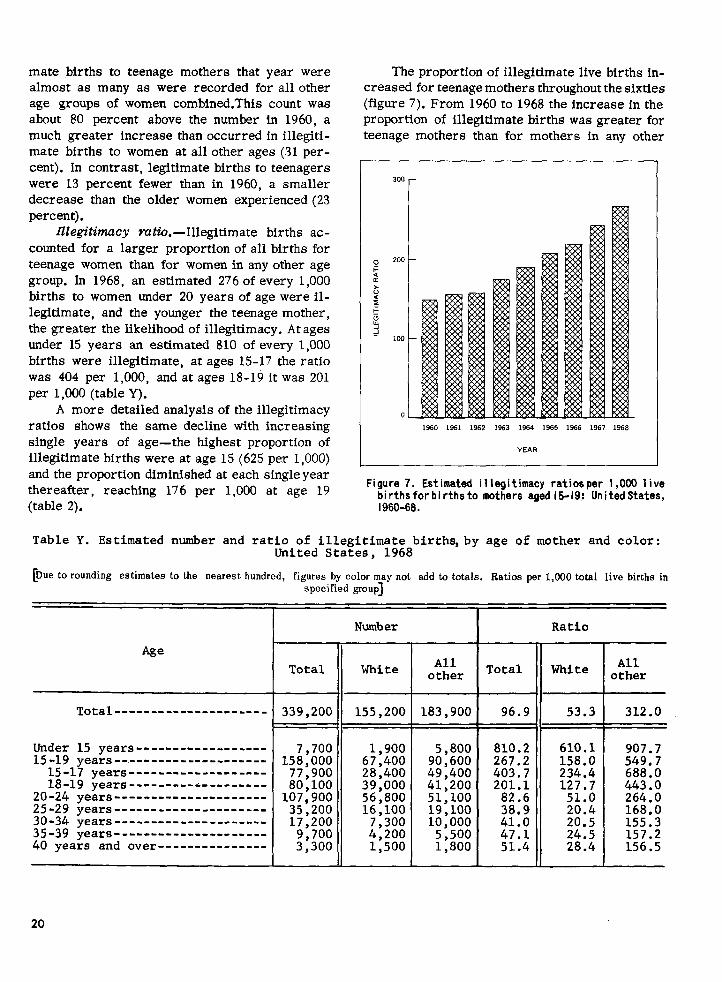
Illegitimacy ratio. - Illegitimate births accounted for a larger proportion of all births for teenage women than for women in any other age group. In 1968, an estimated 276 of every 1,000 births to women under 20 years of age were illegitimate, and the younger the teenage mother, the greater the likelihood of illegitimacy. At ages under 15 years an estimated 810 of every 1,000 births were illegitimate, at ages 15-17 the ratio was 404 per 1,000, and at ages 18-19 it was 201 per 1,000 (table Y).
A more detailed analysis of the illegitimacy ratios shows the same decline with increasing single years of age—the highest proportion of illegitimate births were at age 15 (625 per 1,000) and the proportion diminished at each single year thereafter, reaching 176 per 1,000 at age 19 (table 2).
The proportion of illegitimate live births in-creased for teenage mothers throughout the sixties (figure 7). From 1960 to 1968 the increase in the proportion of illegitimate births was greater for teenage mothers than for mothers in any other
1960 1%1 1962 1%3 1%4 1%5 1%6 1967 1968
YEAR
Figure7. Estimatedillegitimacyratiosper 1,0001ivebirthsforbirthsto mothersaged15-19:UnitedStates,1960-68.
Table Y. Estimated number and ratio of illegitimate births, by age of mother and color: United States, 1968
[Due to rounding estimates to the nearest hundred, figures by color m_ay not add t-a totals. Ratioe per 1,000 total live births in specified group]
I
I Number Ratio
Age
Total
Under 15 years 15-19 years
15-17 years 18-19 years
20-24 years 25-29 years 30-34 years 35-39 years 40 years and over
All AllTotal White other Total I White other I
339,200 155,200 183,900 96.9 I 53.3 312.0
I ,700 1,900 5,800 810.2 610.1 907.7
15; ,000 67,400 90,600 267.2 158.0 549.7 77 ,900 28.400 49,400 403.7 :;;.; 688.0
,100 39;000 41,200 201.1 443.0 ,900 56,800 51,100 82.6 51:0 264.0 ,200 16,100 19,100 38.9 20.4 168.0 ,200 7,300 10,000 41.0 20.5 155.3 ,700 4,200 5,500 47.1 24.5 157.2 ,300 1,500 1,800 51.4 28.4 156.5
J
20
-------
--------------------
-------
--------------
age group. The increase for teenagers was least at age 15 and more for each subsequent single year of age, being greatest at age 19, where the proportion almost doubled.
Illegitimacy vate. —Another measure of illegitimacy, the illegitimacy rate, relates the number of illegitimate live births to the unmarried females in specified age groups. In spite of the high proportion of illegitimate births to teenagers and the large proportion of the births to teenage mothers that were illegitimate, this measure shows that illegitimate births occurred less frequently among unmarried teenage women than among the unmarried women of any other age group under 35 years. In 1968 there were 20 illegitimate births per 1,000 unmarried females at ages 15-19. This rate was scarcely over half the rate for the next age group, 37 per 1,000 for women 20-24 years oId.
The illegitimacy rate for teenage women in-creased during the sixties, more rapidly in the second half of the decade than in the first. In 1968 the illegitimacy rate was lower or only slightly higher than in 1960 for women in every age group except the group aged 15-19 years, whose rate increased nearly 30 percent, from 15.3 per 1,000 unmarried women in 1960, to 16.7 in 1965, to 19.8 in 1968 (table 3).
To summarize, the converse relationships of teenage women having the lowest birth rate of all women under 35 but the highest birth rate of married women reflect the following conditions:
There were a relatively large number of women in the age group 15-19 as compared with older age groups.
In the age group 15-19 the proportion of married women was much smaller than the proportion married at older ages.
The number of births to women 15-19 years was large relative to the number of married women in that group but small relative to the total number of women in the age group.
Similarly, teenage women had the “highest illegitimacy ratio” but one of the “lowest illegitimacy rates” because:
A large proportion of the births to women aged 15-19 were illegitimate.
Although the number of illegitimate births to women 15-19 years was larger than for those in any other age group, it was small relative to the large population of unmarried women in that group.
These relationships are evident when the population figures and numbef of births for women in the age group 15-19 are compared with those for the 20-24 group. The comparison for 1968 is shown in table Z.
Table Z. Marital status of populat icm and legitimacy status of births for females at ages 15-19 And 20-24: United States, 1968
I
I Age of females
Status 15-19 20-24 years years
Population
Total
L Merried 952,000 4,818,000 Unmarried 7,997,000 2,991,000
Births I I
Total
~ Legit~mate ;;;,;:; 1,198,972 lllegitf.mate 1 107,900
I 1
Births by Color
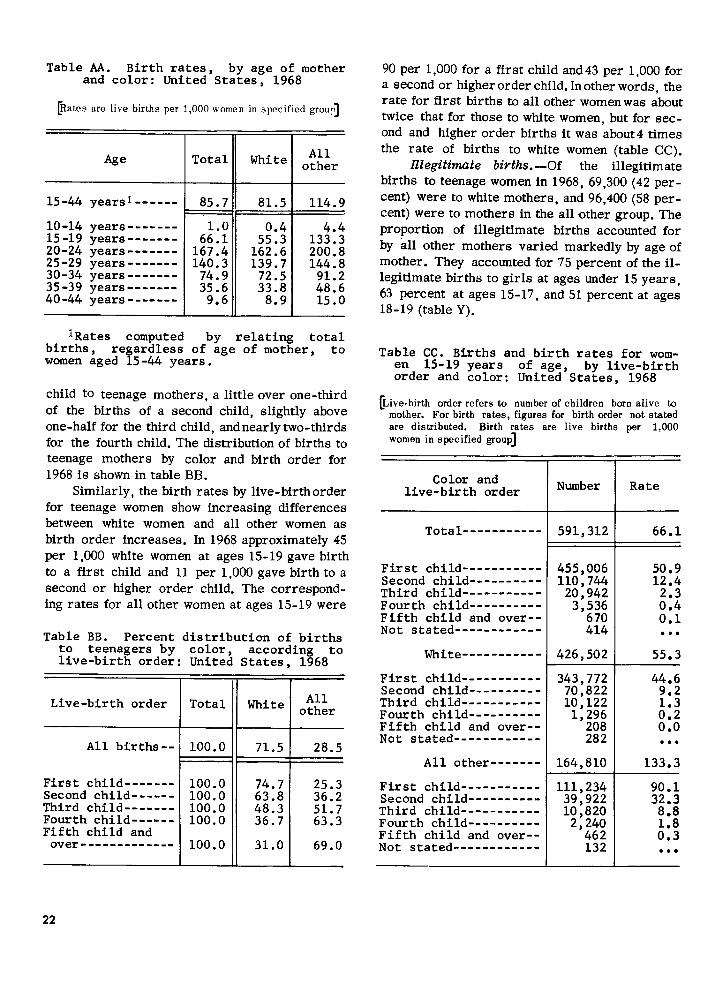
Of the births to teenage women in 1968, 429,616 (72 percent) were to white mothers and 171,200 (28 percent) were to mothers of all other races. The birth rate for teenage women of all other races was much higher than that for white women and this difference was far greater for teenagers than for any other age group. The comparison for 1968 is shown in table AA.
13irtlz ordsr, —The proportion of births to teenage women of all other races increased as birth order increased. Women of all other races accounted for one-fourth of the births of a first
21
------
-------------------------------------------------
-------------
-------------
-------------
-----------
------------------------------------------
------------
---------------------
---------------------
------------
-------
--------------------------------
----------
------------
Table AA. Birth rates, by age of mother and color: United States, 1968
~ates are live births per 1,000 women i. specified group]
All other
15-44 yearsl 85.7 81.5 114.9 1==== —,
10-14 years 15-19 years 20-24 years 25-29 years 30-34 years 35-39 years 40-44 years
‘Rates computed births, regardless
6;;; 5;:: 13$: 167.4 162.6 200.8 140.3 139.7 144.8 74.9 72.5 91.2 35.6 33.8 48.6 9.6 8.9 15.0
by relating total of age of mother, to
women aged 15-44 years.
child to teenage mothers, a little over one-third of the births of a second child, slightly above one-half for the third child, andnearlytwo-thirds for the fourth child. The distribution of births to teenage mothers by color and birth order for 1968 is shownin table BB.
Similarly, the birth ratesby live-birthorder for teenage women show increasing differences between white women and all other women as birth order increases. In 1968 approximately45 per 1,000 white women at ages 15-19 gave birth to a first child and 11 per l,OOOgavebirth toa second or higher order child. The correspond-ingrates for all other women at ages 15-19 were
Table BB. Percent distribution of births to teenagers by color, according to live-birth order: United States, 1968
II I Live-birth order I Total I White o~~~r
All births-- 100.O
+++= First child 100.0 74.7 25.3 Second child 100.0 63.8 36.2 Third child 100.0 48.3 51.7 Fourth child 100.0 36.7 63.3 Fifth child and
over 100.0 31.0 69.0
90per l,OOOfor afirst child and43 per 1,000 for a secondor higherorderchild. Inother words, the rate for first births to all other womenwas about twice that for those to white women, but for second and higher order births it was about4 times the rate of births to white women (table CC).
Illegitimate bivths . —Of the illegitimate births to teenage women in 1968,69,300 (42per-cent) were to white mothers, and 96,400 (58per-cent) were to mothers inthe another group. The proportion of illegitimate births accounted for by all other mothers varied markedly by age of mother. They accounted for75 percent oftheillegitimate births togirls atages under 15 years, 63 percent at ages 15-17, and51 percentat ages 18-19 (table Y).
Table CC. Births and birth rates for women 15-19 years of age, by live-birth order and color: United States, 1968
[Live-birth order refers to number of children born alive tQ mother. For birth rates, figures for bkth order not stated are distributed. Birth rates are live births oer 1,000 womenin speoified group]
Color and live-birth order Number Rate
Total 591,312 66.1
First child 455,006 50.9 Second child 110,744 12.4 Third child 20,942 Fourth child 3,:;; ;::Fifth child and over-- 0.1Not stated 414 .*.
White----------- 426,502 55.3
First child 3:;,;;; 44.6 Second child 9.2 Third child 10;122 Fourth child 1,296 ;:; Fifth child and over-- 208 O.O Not stated 282 ...
All other 164,810 133.3
First child 111,234 90.1 Second child 39,922 32.3 Third child 10,820 8.8 Fourth child 2,240 Fifth child and over-- 462 ::! Not stated 132 .**
22
-------------------
----------------------------------------------------------------------------------------------------------------------------------------------------------------
The illegitimacy ratio was considerably higher for births to all other mothers than for those to white mothers, and the difference was proportionately greater at the older ages. 11-legitimate births per 1,000 live births to mothers in specified teenage color groups for 1968 are shown in table Y.
The illegitimacy rate for the all other group of teenage women 15-19 years in 1968 was over 8 times the rate for white teenage women. The rate was 9.8 illegitimate births per 1,000 unmarried white women and 82.8 illegitimate births per 1,000 unmarried women in the all other group.
Trends in Births by Color
Natality statistics for the 1960’s show a number of differences in trends among teenage women grouped by color.
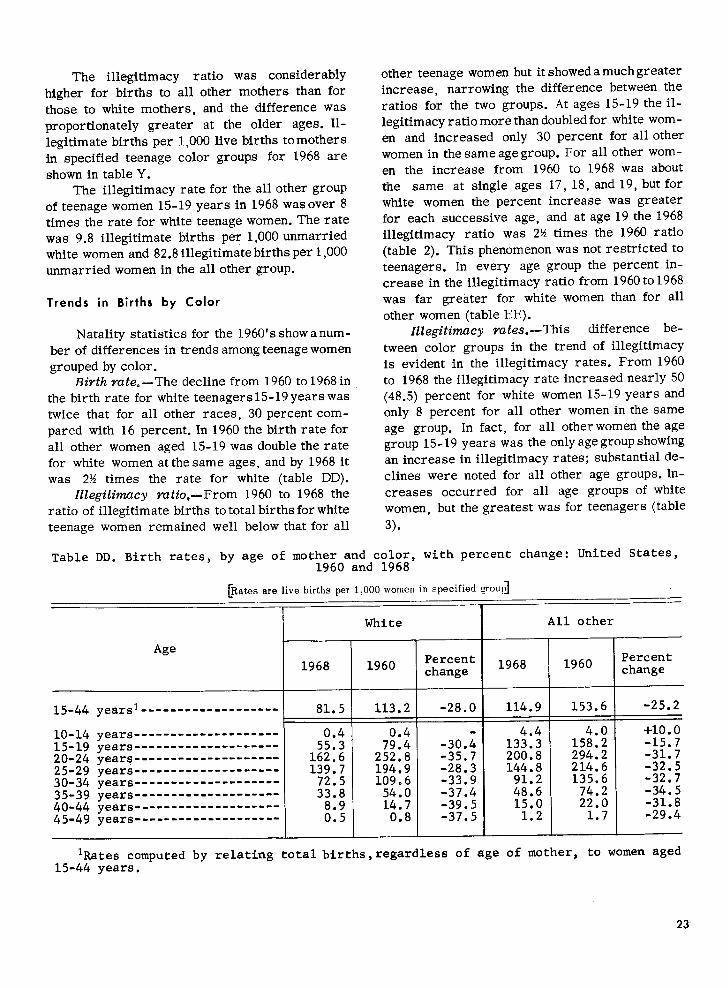
Birth vate. —The decline from 1960 to 1968 in the birth rate for white teenagers 15-19 years was twice that for all other races, 30 percent compared with 16 percent. In 1960 the birth rate for all other women aged 15-19 was double the rate for white women at the same ages, and by 1968 it was 2Z times the rate for white (table DD).
Ille,@tinmcy mtio,— From 1960 to 1968 the ratio of illegitimate births to total births for white teenage women remained well below that for all
other teenage women but it showed a much greater increase, narrowing the difference between the ratios for the two groups. At ages 15-19 the illegitimacy ratio more than doubled for white women and increased only 30 percent for all other women in the same age group. For all other women the increase from 1960 to 1968 was about the same at single ages 17, 18, and 19, but for white women the percent increase was greater for each successive age, and at age 19 the 1968 illegitimacy ratio was 2M times the 1960 ratio (table 2). This phenomenon was not restricted to teenagers. In every age group the percent in-crease in the illegitimacy ratio from 1960 to 1968 was far greater for white women than for all other women (table EE).
Illegitimacy vates.—This difference be-tween color groups in the trend of illegitimacy is evident in the illegitimacy rates. From 1960 to 1968 the illegitimacy rate increased nearly 50 (48.5) percent for white women 15-19 years and only 8 percent for all other women in the same age group. In fact, for all other women the age group 15-19 years was the only age group showing an increase in illegitimacy rates; substantial de-clines were noted for all other age groups. In-
creases occurred for all age groups of white women, but the greatest was for teenagers (table
3).
Table DD. Birth rates, by age of mother and color, with percent change: United States, 1960 and 1968
[Rates are live births per 1,000 women in specified group] —
All otherWhite
1 I
1968 1960 Percent change
55:3 79.4 -30.4 162.6 252.8 -35.7 139.7 194.9 -28.3
72.5 109.6 -33*9 33.8 54.0 -37.4
8.9 14.7 -39.5 0.5 0.8 -37.5
Age
15-44 yearsl
10-14 years 15-19 years 20-24 years 25-29 years 30-34 years 35-39 years 40-44 years 45-49 years
1968
114.9
4.4 133.3 200,8 144.8
91.2 48.6 15.0
1.2
1
1960 Percent change
I
++%+ 158;2 -15.7 294.2 -31.7 214.6 -32.5 135.6 -32.7
74.2 -34.5 22.0 -31.8
1.7 -29.4 I
l~ates comPUted by relating total births , regardless of
15-44 years.
age of mother, to women aged
23
-----------------------------------
----------------------
------------------------------------------------------------------------------------------------------------------------------------------------------
-------------------
—— —
Table EE. Estimated illegitimacy ratios, by age of mother and color, with percentchange: United States, 1960 and 1968[Ratios per 1,000 total live births in specified group]
Total White All other
1 Age Per- Per- Per-
1968 1960 I cent 1968 1960 cent 1968 1960 cent change change change
Total------- 96.9 52.7 -I-83.9 53.3 22.9 +132.8 312.0 215.8 +44.6
Under 15 years---- 810.2 678.5 -I-19.4 610.1 475.4 i-28.3 907.7 822.4 +10 .4 15-19 years 267.2 1;; .; +80.1 158.0 71.6 +120 .7 549.7 .421.5 -!-30.4 20-24 years 82.6 -f-73.2 51.0 21.9 -I-132.9 264.0 199.6 +32.3 25-29 years 38.9 29:4 +32.3 20.4 11.4 +78 .9 168.0 141.3 ‘+18.9 30-34 years 41.0 27.5 +49.1 20.5 10.2 +101.0 155.3 129.9 +19 .6 35-39 years 47.1 29.5 -1-59.7 24.5 12.7 +92 .9 157.2 127.7 +23.1 40 years and over- 51.4 31.0 +65.8 28.4 15.8 +79.7 156.6 116.8 +34.1
Infant Mortality
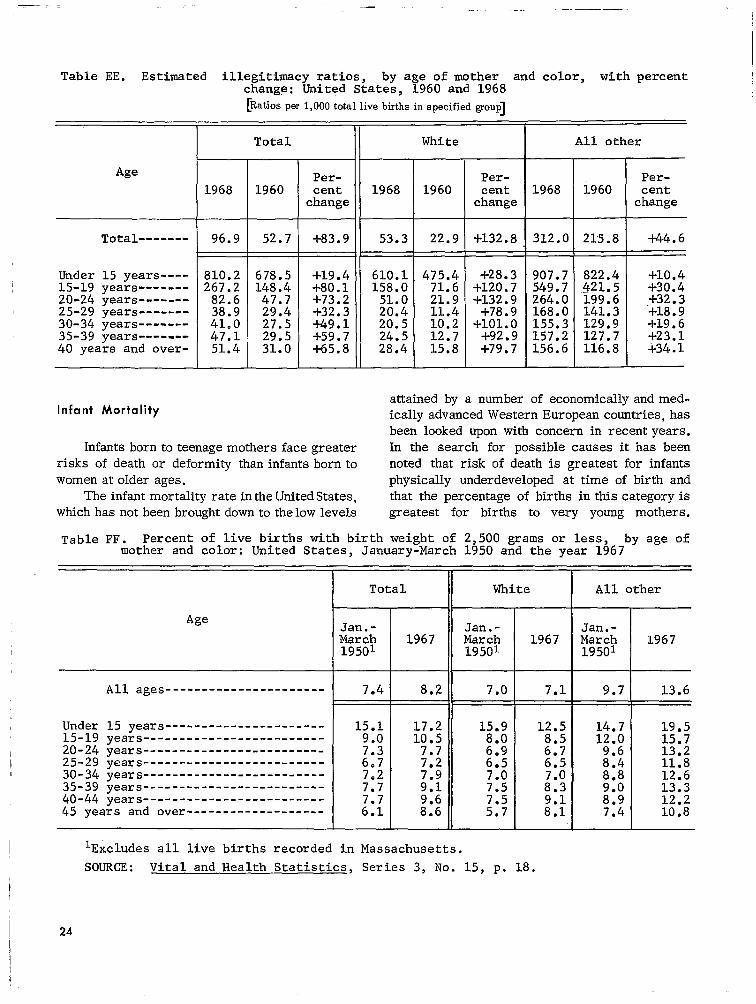
Infantsborntoteenagemothersfacegreaterrisksof deathor deformitythaninfantsborntowomen atolderages.
mortalityThe infant rateintheUnitedStates,whichhasnotbeenbroughtdown tothelowlevels
attained andmedby a number of economicallyically hasadvancedWesternEuropeancountries,been lookedupon withconcernin recentyears.In the search for possiblecausesithas beennoted thatriskof deathis greatestforinfantsphysicallyunderdevelopedat time of birthandthatthepercentageof birthsinthiscategoryisgreatestfor birthsto very young mothers.
Table FF. Percent of live births with birth weight of 2,500 grams or less, by age ofmother and color: United States, January-March 1950 and the year 1967
Total White All other
Age Jan.- Jan.- Jan.-March 1967 March 1967 March 1967 19501 19501 19501
All ages 7.4 8.2 7.0 7.1 9.7 13.6
Under 15 years---------------------- 15.1 17.2 15.9 14.7 19.5 15-19 years 9.0 10.5 8.0 1$.: 15.7 20-24 years 7.7 6.9 13.2
1’ 25-29 years ;;; 7.2 6.5 8:4 11.8 30-34 years 7.0 12.6 35-39 years ;:; ;:? 7.5 13.3 40-44 years 12.2 45 years and over ::; u ;:; 10.8
lExcludes all live births recorded in Massachusetts.
SOURCE: Vital and Health Statistics, Series 3, No. 15, p. 18.
24
~
t
In the United States, therisk ofdeath in the first year of life among infants who weighed 2,500 grams or less at birth was found to be 17 times the risk among infants weighing more. In addition to the greater risk of death, there was greater prevalence among infants with low birth weight of such conditions as cerebral palsy,. epilepsy, mental retardation, congenital anomalies, deafness, and blindness.5 Infants born to teen-age mothers are more likely to be of low birth weight than infants born to older mothers.
The proportion of infants weighing 2,500 grams or less at birth was highest among mothers at the youngest ages. The change in the incidence of infants with low birth weight by age of mother is shown in table FF.
MORTALITY
The number of deaths among teenagers is small and the death rate from all causes combined is low. In 1969, 21,141 teenagers 15-19 years of age lost their lives, accounting for approximately 1 percent of the total deaths in the United States that year.
Differences in teenage mortality for all causes were o“bserved among the sex-color groups. Teenage death rates were higher for males than for females and lower for white persons than for all other persons.
In both color groups the teenage death rate for males was about 2.5 times the rate for females. For both sexes the death rate for the all other group was about 1.5 times the rate for the white group.
From 1960 to 1969 the mortality rate for teenagers 15-19 years of age increased 25 per-cent, from 92 to 115 per 100,000 population. The increase was greater for all other males than for any of the other three color-sex groups, 42 percent as- compared with increases of 23 per-cent for white males, 18 percent for all other” females, and 17 percent for white females.
5Nationd Center for Health Statistics: Trends in “pre-
maturity:’ United States, 1950-67. Vital ad Health Statistics.
Series 3-No. 15. DHEW Pub. No. (HSM)72-103O. Health Services and Mental Health Administration. Washington. U.S. Government Printing Office, Jan. 1972. pp. 1 and 2.
Leading Causes
Accidents led all causes of death for teenagers 15-19 years of age. Sixty percent of the teenage deaths in 1969 were due to accidents; 40 percent were due to motor vehicle accidents
alone. Homicide ranked second, and malignant neoplasms and suicide ranked third and fourth.
These rankings varied by color-sex group. Accidents ranked first for afi four groups. Homicide was second for all other maIes and females. Malignant neoplasms ranked second for white teenagers, both male and female, and suicide ranked third. Neoplasms ranked third for all others. The fourth ranking cause “was homicide for white males, influenza and pneumonia for white females, suicide for all other males, and diseases of heart for all other females (table 4).
Another difference in rank was for complications of pregnancy and childbirth, which was the fifth leading cause of death for all other women but tenth for white women.
The rise in teenage mortality during the sixties was due primarily to deaths from violent causes—accidents, homicide, and suicide. Death rates for the major nonviolent causes declined.
The mortality data by cause for 1968 and 1969 are not strictly comparable with those for prior years because of changes in classification and coding procedures that result from the decennial revision of The International Lists of Causes of Death. However, the trends in specific causes referred to in this report were not greatiy affected by these changes.
Wlotor vehicle accidents. -In 1969 there were more deaths from motor vehicle accidents in the 15- 19-year group than in any other 5-year age group except the 20-24 group. The death rate for teenagers, 47 per 100,000 in the age group 15-19 years, was among the highest of the age specific fatality rates for this cause (table GG). Motor vehicle accidents took a far greater toll among males than among females and more among white than all other (figure 8). The motor vehicle accident death rate for males 15-19 years of age was nearly 3 times the rate for females, and for white teenagers it was 1?4 times the rate for all other teenagers (table 5).
This death rate for teenagers was nearly 40 percent higher in 1969 than in 1960. The in-
25
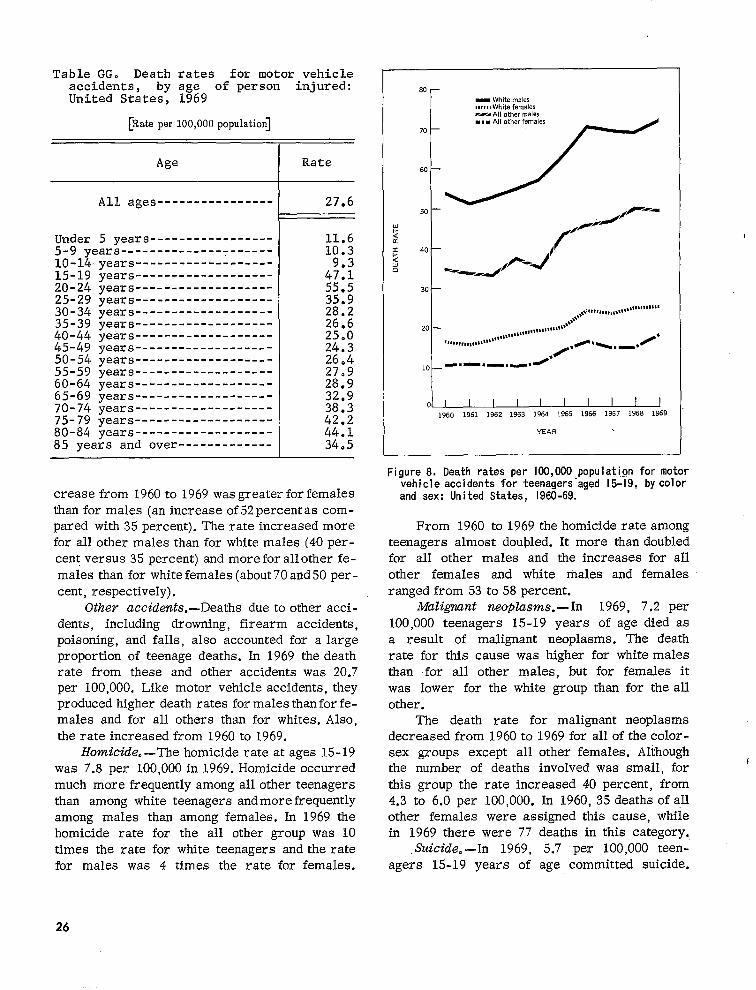
----------------
------------------- -- - -- -- -- - --- ---- - -
---------------------------------------------------------------------------------------------------------------------------------------------------------------------------------------------------------------------------------------------------------------------------------------------
-------------
Table GG. Death rates for �otor vehicle accidents, by age of person United States, 1969
[Rate per 100,000 population]
Age
All ages
Under 5 years5-9 years 10-11 15-19 20-24 25-29 30-34 35-39 40-44 45-49 50-54 55-59 60-64 65-69 70-74 75-79 80-84
years years years years years years years years years years years years years years Veals
85 yea~s and over
injured:
Rate
27.6
11.6 10.3
4%? 55.5 35.9 28.2 26.6 25.0 24.3 26.4 27.9 28.9 32.9 38.3 42.2 :;.;
0
crease from 1960to 1969 wasgreaterforfemales than for males (an increaseof 52percentascom-pared with 35 percent). The rate increased more for all other males than for white males (40per-cent versus 35 percent) and moreforallother females than for white females(about 70and50 per-cent, respectively).
Othev accidents.—Deaths due to other accidents, including drowning, firearm accidents, poisoning, and falls, also accounted for alarge proportion of teenage deaths. In 1969 the death rate from these and other accidents was 20.7 per 100,000. Like motor vehicle accidents, they produced higher death rates for malesthanforfemales and for all others than for whites. Also, the rate increased from 1960 to1969.
Homicide. —The homicide rate atages 15-19 was 7.8 per 100,000in 1969. Homicide occurred much more frequently among all other teenagers than among white teenagers andmorefrequently among males than among females. In 1969 the homicide rate for the all other group was 10 times the rate for white teenagers and the rate for males was 4 times the rate for females.
80 —
- White males n#tt, tWhite females rr~All other males . . . All other females
70 —
60 —
50 — ,/;//---
40 — /’
*e_@&/P+J
‘“t
,,,.,7,,,,,,,,,,,,,*8**1’’’””* ,,..
20 ,,,,,,,,,,,,,,1 !ll, !$’’’”
tl#,,,,,r,,,,a@ ,4~+, _,
10 -*-.—,-* /*R ‘*I
o~ 1960 1961 1962 1963 1964 1965 1966 1967 1968 1969
YEAR
Figure 8. Dsath rates per 100,000 population for motorvehicle accidents for teenagers ”aqed 15-19, by colorand sex: Un ited States, 1960-69. -
From 1960 to 1969 the homicide rate among teenagers almost doubled. It more than doubled for all other males and the increases for all other females and white males and females ranged from 53 to 58 percent.
Malignant neoplasms.—In 1969, 7.2 per 100,000 teenagers 15-19 years of age died as a result of malignant neoplasms. The death rate for this cause was higher for white males than for all other males, but for females it was lower for the white group than for the all other.
The death rate for malignant neoplasms decreased from 1960 to1969 for allofthe color-sex groups except all other females. Although the number of deaths involved was small, for this group the rate increased 40 percent, from 4.3 to 6.0 per 100,000. In 1960, 35deaths ofall other females were assigned this cause, while in 1969 there were 77 deaths in this category.
Suicide. -In 1969, 5.7 per 100,000 teenagers 15-19 years of age committed suicide.
26
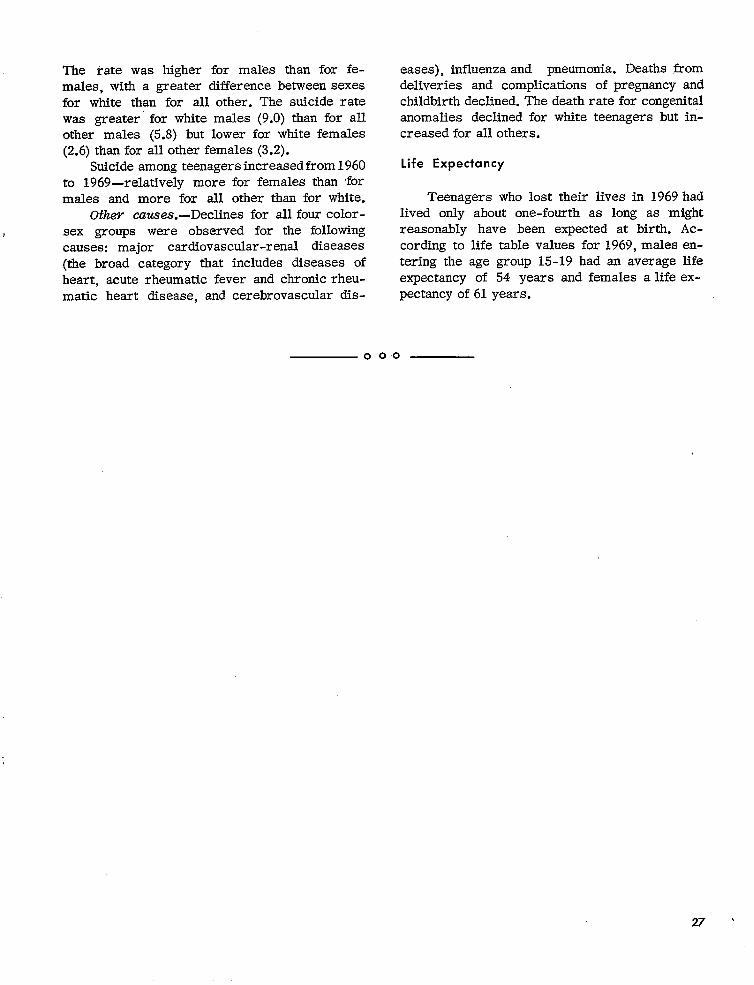
The rate was higher for ma~es than for females, with a greater difference between sexes for white than for all other. The suicide rate was greater” for white males (9.0) than for all other males (5.8) but lower for white females (2.6) than for all other females (3.2).
Suicide among teenagers increased from 1960 to 1969—relatively more for females than for males and more for all other than for white.
Othw cau.ses.-Declines for all four color-sex groups were observed for the following causes: major cardiovascular-renal diseases (the broad category that includes diseases of heart, acute rheumatic fever and chronic rheumatic heart disease, and cerebrovascular dis-
000
eases), influenza and pneumonia. Deaths from deliveries and complications of pregnancy and childbirth declined. The death rate for congenital anomalies declined for white teenagers but iricreased for all others.
Life Expectancy
Teenagers who lost their lives in 1969 had lived only about one-fourth as long as “might reasonably have been expected at birth. According to life table values for 1969, males entering the age group 15-19 had an average life expectancy of 54 years and females a life expectancy of 61 years.
27 ‘
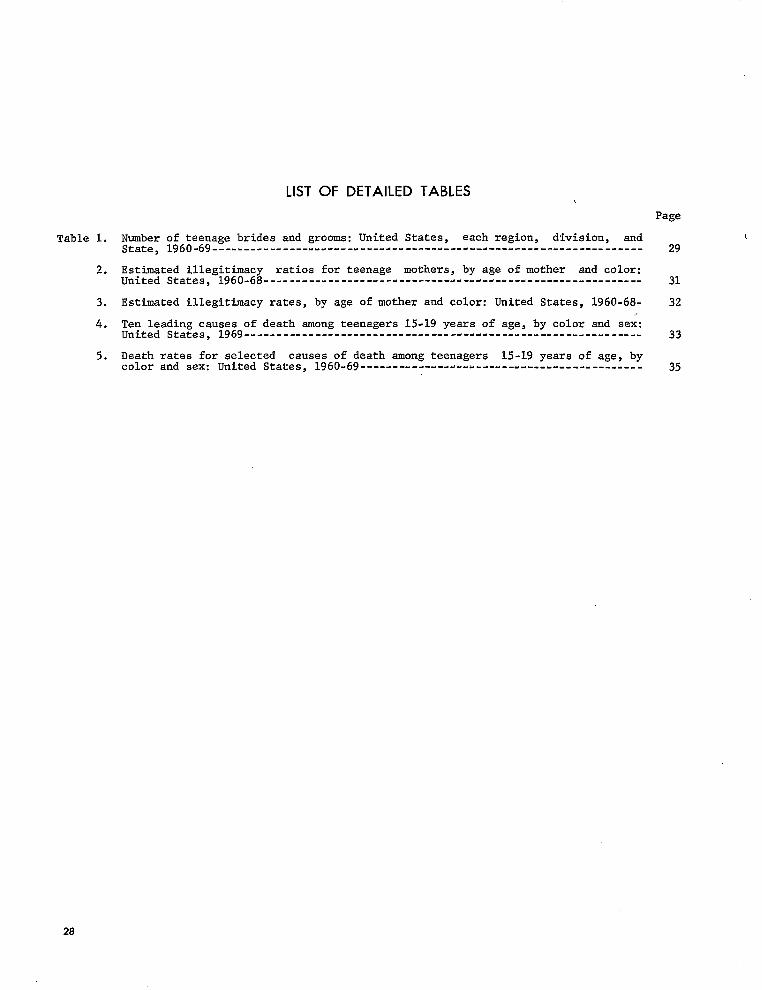
LIST OF DETAILED TABLES
Page
Table 1. Number of teenage brides and grooms: United States, each region, division, andState, 1960-69----------------..----.-----..---------.--------------------------- 29
2. Estimated illegitimacy ratios for teenage mothers, by age of mother and color:United States, l96O-68----------------------------------------------------------- 31
3. Estimated illegitimacy rates, by age of mother and color: United States, 1960-68- 32
4. Ten leading causes of death among teenagers 15-19 years of age, by color and sex:United States, 1969-------------------------------- ‘----d----d------------------- 33
5. Death rates for selected causes of death among teenagers 15-19 years of age, bycolor and sex: United States, l96O-69-------------------------------------------- 35
28
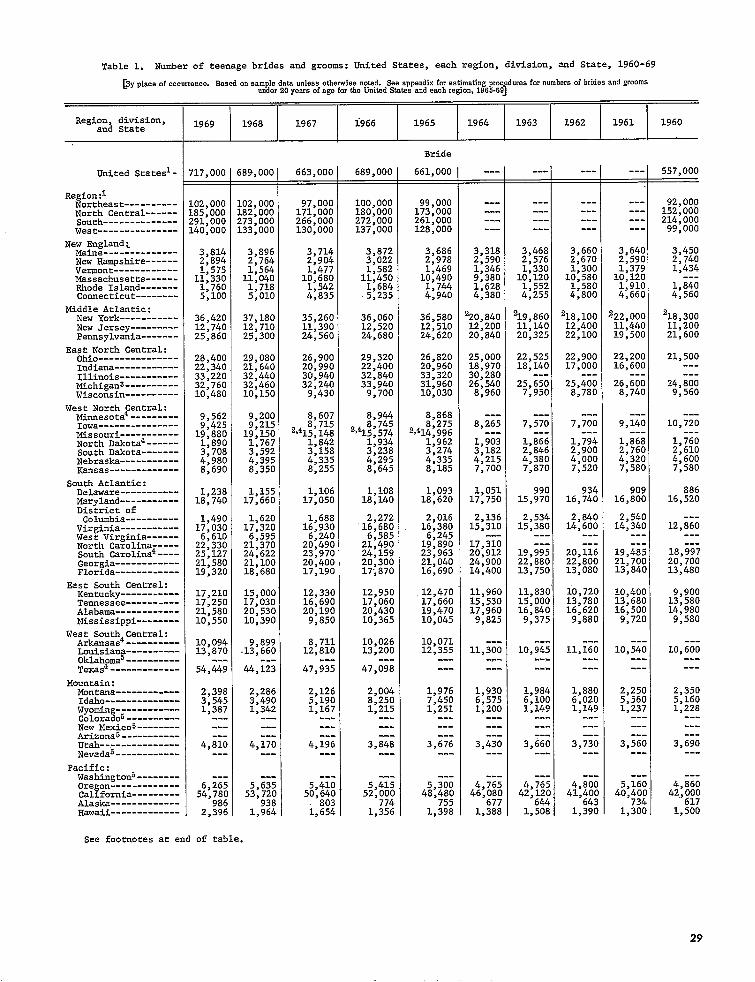
---
---------
--- --- --- ---
------------
---
---
---
------
---
------
---------
---
-----------------------------
--------------
-----------
--------------------------
----------
-----------
---------
---------
---
---
------
---------
---
---
---------
---------
------
--- ------
---
---
------
---
------
---------
---
---
---
------
---
------
---------
---
---
------
---
---
---
---
------ --- ---------
---
---
---
---
---
---
---
---
---
------
1. Number of teenage brides and grooms: United States, each region, division, and State, 1960-69‘l!able
[3yp1ace Basedonsampl. otherwise Seeappendix pracoduces [email protected]. dntaunless notsd. forestimating farnumbersofagefor States 1965-69]!mder20years tbeUnitsd andeacbregion,
Region, division, 1969 1968 1967 i966 1965 1964 1963 1962 1961 1960and State
Bride
United Statesl- 17,000 ;89, 000 663,000 689,000 661,000 557,000
Region:1 Northeast---------- 02,000 L02,000 97,000 100,000 99,000 92,000 ~~~ Central------ 85,000 L82,000 171,000 180,000 173,000 152,000
91,000 ?73,000 266,000 272,000 261,000 214,000West 40,000 1.33,000 130,000 137,000 128,000 99,000
New England; 3>814 3,896 3,714 3,872 3,686 3>318 3,468 3,660 3,640 3,450Maine
New Hampshire------ 2,894 2,764 2,904 3,022 2,978 2,590 2,576 2,670 2,590 2,740Vermont------------ 1,575 1,564 1,477 1,582 1,469 1,346 1,330 1,300 1,379 1,434Massachusetts------ 11,330 11,040 10,680 11,450 10,490 9,380 10,120 .10,580 10,120Rhode Island------- 1,760 1,718 1,542 1,684 1,744 L,628 1,552 1,580 1,910 1,840Connecticut-------- 5,100 5,010 4>835 5,235 4,940 4,380 4,255 4,800 4,660 4,560
Middle Atlantic: New York----------- 36,420 ;;,;:: 35,260 36,060 36,580 220,840 ~,;:: 218,100 ?22,000 218,300 New Jersey---------Pennsylvania-------
12,740 25,860 25;300
11,390 24,560
12,520 24,680
12,510 24,620
12,200 20,840 20;325
12,400 22,100
11,440 19,500
11,200 21,600
East North Central: Ohio--------------- 28,400 29,080 26,900 29,320 26,820 25,000 22,525 22,900 22,200 21,500 Indiana------------ 22,340 21,640 20,990 22,400 20,960 18,970 18,140 17,000 16,600 IllinOis 33,220 32,440 30,940 32,840 33,320 30,280 Michigan3---------- 32,760 32,460 32,240 33,940 ;;,:%: 26,540 25,650 25,400 26>600 24,800Wisconsin---------- 10,480 10,150 9,430 9,700 > 8,960 7,950 8,780 8,740 9,560
West North entral:!?Minnesota --------- 9,562 9,200 8,607 8,944 8,868 ._:
IOwa--------------- 9,425 9,215 2,412: ~~~ 2,41;;
8,265 7,570 7,700 9,140 10,720Missouri----------- 19,880 19,150 :;; 2,41~; $:
8outh Dakota------- 3,708 3,592 3,158 3,238 3,274 3,182 2,846 2,900 2,760 2,610 NebraSka-----------Kansas-------------
4,980 8,690
4,395 8,350
4,335 8,255
4,295 8,645
4,335 8,185
4,215 7,700
4,380 7,870
4,000 7,520
4,320 7,580
4,600 7,580
8outh Atlantic: Delaware----------- 1,238 1,155 1,106 1,108 1,093 1,051 990 934 909
North Dakota4------ 1,890 1,767 1,842 1,934 1,962 1,903 1,866 1,794 1,868 1,760
West
Maryland----------- 18,740 17,660 17,050 18,140 18,620 17,750 15,970 16,740 16,800 16,520 District of Columbia---------- 1,490 1,620 1,688 2,272 2,016 2,136 2,534 2,840 2,54a
Virginia----------- 17,030 17,320 16,930 16,680 16,380 15,310 15,380 14,600 14,340 12,860 Virginia------ 6,610 6,595 6,24C 6,585 6,245
North Carolina----- 22,330 21,370 20,49C 21,490 19,890 17,310South Carolina4---- 25,127 24,622 23,97C 24,159 23,963 20,912 19,995 20,116 19,485 18,997Georgia------------ 21,580 21,100 20,40C 20,300 21,040 24,900 22,880 22,800 21,700 20,700Florida------------ 19,32C 18,680 17,19C 17;870 16,690 14,400 13,750 13,080 13,84C 13,480
East South Central:Kentucky----------- 17,21C 15,00C 12,33C 12,950 12,470 11,960 11,830 10,720 10,4OC 9,900Tennessee---------- 17,25C 17,030 16,69C 17,060 17,660 15,530 15,000 13,780 13,68C 13,580Alabama------------ 21,58C 20,53C 20,19C 20,430 19,470 17,960 16,840 16,620 16,50C 14,980Mississippi-------- 10,55C 10,390 9,85C 10,365 10,045 9,825 9,375 9,880 9,72C 9>580
West South Central: Arkansas4----------Louisiana----------
10,094 13,87C
9,899 .13,660
8,711 12,81C
10,026 13,200
10,071 12,355 11,300 10,945 11,160 10,54C 10,600
0klahoma5---------- ...- .-. Texas4------------- 54,445 44,123 47,935 47,098
Mountain: NOnns 2,39~ 2,286 2,12t 2,004 1,976 1,930 1,984 1,880 2,25C 2,350
3,545 3,49C 5,19C 8,250 7,450 6,575 6,100 6,020 5,56C 5,160 wyOming------------ 1,387 1,342 1,167 1,215 1,251 1,200 1,149 1,149 1,237 1,228 Colorado~ New Mexico~--------Arizona5utah--------------- 4,81C 4,17C 4,196 3,848 3,676 3,430 3,660 3,730 3,56C 3,690Nevada5------------
Pacific:Washingtons-------- --.
OregOn------------- 6,26! 5,635 5,41( 5,415 5,300 4,765 4,765 4,800 5,16C 4,860;):CalifOrnia 54,78( 53,72[ 50,64( 52,000 48,480 46,080 42,120 41,:;; 40,40[ 42.,
.Alaska------------- 98C 93& 774 755 677 644 734Hawaii------------- 2,39C 1>964 i,% 1,356 1,398 1,388 1,508 1,390 1,30C 1,500
See footnotes at end of table.
29
886
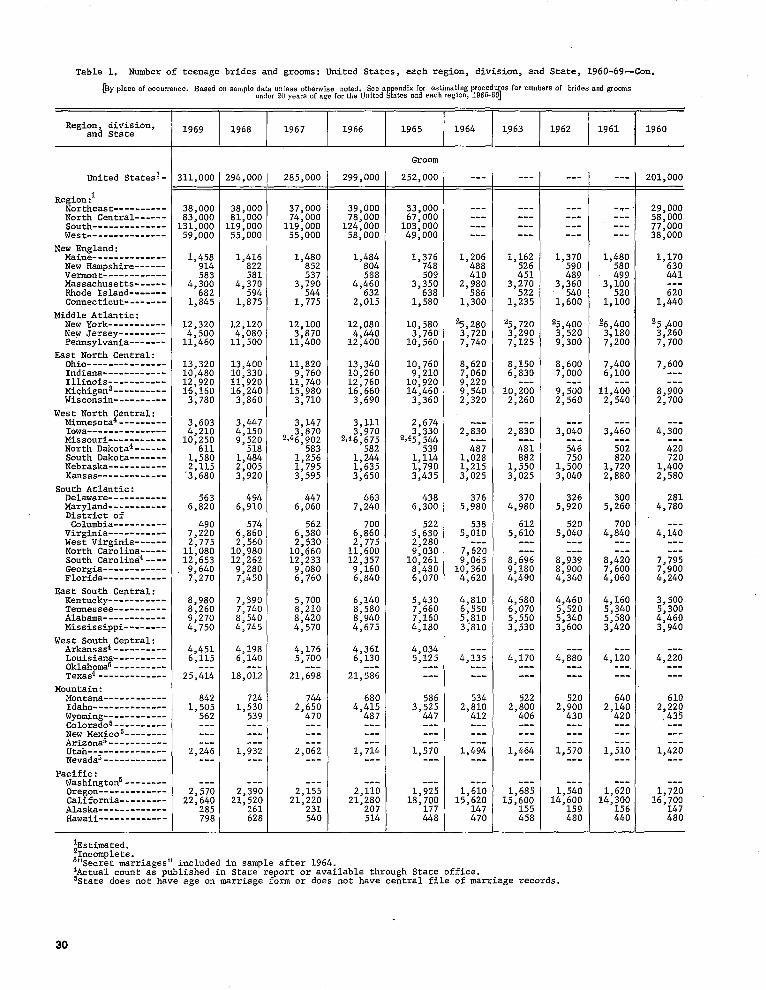
---
---------
---
---
---
---------
---
---
--------------
---------------
---------
-----------
-------------
----------
---
---------
---
---
---
---------
---
---
------
---------
---
---
------------
---
---
---
---
------
---------
---
---
---
------------
---
---
---
------
---
------
---------
---
---
---
------------
---
---
---
------
---
------
---------
---
---
---
------
---
---
---
------
---------
---
------
---
---
------
---
------
---------
---
Table 1. Number of teenage brides and grooms: United States, each region, division, and State, 1960-69-Con.
[Byplaceof o.cumnm. Based m sample data unless .4hewiw nctad. See ymndix fm ostimat,i.g ixmedqes for numbm of brides and gemsunder 20 ynms of age for the United tntws and each region, 1965-69
Region, division, 1969 1968 1967 1966 1965 1964 1963 1962 1961 1960and state
United Statesl-
Region:1Ncmtheast----------North Central------SouthWest---------------
New England:Maine--------------New Hampshire------VennOnt------------Massachusetts------Rhode IslandConnecticut
Middle Atlantic:New York-----------New .lerseyPennsylvania-------
East North Central:Ohio---------------Indiana------------IllinoisMiChigans----------WiscOnsin----------
West North Central:Minnes0ta4---------IOwa---------------Missouri-----------North Dakota4------South Dakota-------Nebraska-----------Kansas
South Atlantic:Delaware-----------Maryland-----------District ofColumbia
Virginia-----------West Virginia------North Carolina-----South Carolina4----Georgia------------Florida------------
East South Central:Kentucky-----------Tennessee----------Alabama------------Mississippi--------
West South Central:Arkansas4----------Louisiana----------0klahoma5----------Texas4-------------
Mountain:Montana------------Idaho-------------wyOming------------Colorado5----------New Mexico5--------Arizona5-----------Utah--“.--.---------Ne”ada.------------
Pacific:Washingt0n5--------OregOn-------------California---------Alaska-------------Hawaii------------
lEstimated.%ncomplete.
Groom
311,000 294,000 285,000 299,000 252,000 201,000-
38,000 38,000 ;;,ml: ::,133: 33,000 29,000 83,000 81,000 67,000 58,000 131,000 119,000 119:000 124;000 103,000 ..- 77,000 59,000 55,000 55,000 58,000 49,000 ..- 38,000
1,458 1,416 1,480 1>484 1,376 1,206 i,162 1,370 1,480 1,170 914 822 852 804 748 488 526 590 580 630 583 581 537 588 509 410 451 489 499 441
4,300 4,370 3,790 4,;;; 3,:;; 2>;:: 3>270 3,360 3,100 .-. 682 594 544 522 540 520 620
1>845 1,875 1,775 2,015 1,580 1,300 1,235 1,600 1,100 1,440
12,320 12,120 12,100 12,080 10,580 %, 280 25,720 25,400 26,400 2’5,400 4,500 4,080 3,870 4,440 3,760 3,720 3,290 3,520 3,180 3,260 11,460 11,500 11,400 12,400 10,560 7,740 7,125 9,300 7,200 7,700
13,320 13,400 11,820 13,340 10,760 S,620 8,150 S,600 7,400 7,600 10,480 10,330 9,760 10,260 9,210 7,060 6,S30 7,000 6,100 12,920 11,920 11,740 12,760 10,920 9,220 16,160 16,240 1:,;!: 1:,:5: 14,460 9,540 10,200 9,500 8,900 3,780 3,860 , > 3,360 2,320 2,260 2,560 2,700
3,603 3,447 3,147 3,111 2,674 .-. 4,210 10,250
4,150 9,520 2,4; ;$;;
3,9702,46,675 2,43;;;
2,830 2,830 3,040 3,460 4,300
611 518 583 582 539 487 481 546 502 420 1,580 1,484 1,256 1,244 1,114 1,028 S82 750 820 720 2,115 2,005 1,795 1,635 1,790 1,215 1,550 1,500 1,720 1,400 ‘3,680 3,920 3,595 3,650 3,435 3,025 3,025 3,040 2,880 2,580
563 494 447 463 438 376 370 326 300 281 6,820 6,910 6,060 7,240 6,300 5,980 4,980 5,920 5,260 4,780
490 574 562 700 522 538 612 520 700 7,220 6,860 6,380 6,860 5,630 5,010 5,610 5,040 4,840 4,140 2,775 2,560 2,530 2,775 2,280 11,080 10,980 10,660 11,600 9,030 7,620 12,653 12,262 12,233 12>357 10,261 9,065 8,696 8,939 8,420 7,795 9,640 9,280 9,080 9,160 8,480 10,360 9,180 8,900 7,600 7,900 7,270 7,450 6,760 6,840 6,070 4,620 4,490 4,340 4,060 4,240
8,980 7,390 5,700 6,140 5,430 4,810 4,580 4,460 4,160 3,500 8,260 7,740 8,210 8,580 7,660 6,550 6,070 5,520 5,340 5,300 9,270 8,540 8,420 8,940 7,160 5>-810 5,550 5,340 5,580 ;,;:: 4,750 4>745 4,570 4,675 4,180 3,810 3,530 3,600 3,420 ,
4,451 4,198 4,176 4,361 4,034 6,115 6>140 5,700 6,130 5,125 4,135 4,170 4,880 4,120 4,220
25,414 18,012 21,698 21,586
842 724 744 680 586 534 522 520 640 6101,505 1,530 2,650 4>415 3>525 2,810 2,::: 2,900 2,140 2,220562 539 470 487 447 412 430 420 ,435
2,246 1,932 2,062 1,714 1,570 1,494 1,464 1,570 1,510 1,420-..
2,570 2,390 2,155 2,110 1,925 1,610 1,685 1,540 1,620 1,720 22,640 21,520 21,220 21,280 18,700 15,620 15,600 14,600 14,300 16,700
285 261 231 207 177 147 1.55 159. 156 147 798 628 540 514 448 470 458 480 440 480
3!(Secretmarriages“ included in sample after 1964.‘iAct”al~Ount as published in State report or available through State Office.5State does not have age on marriage form or does not have central file of marriage
30
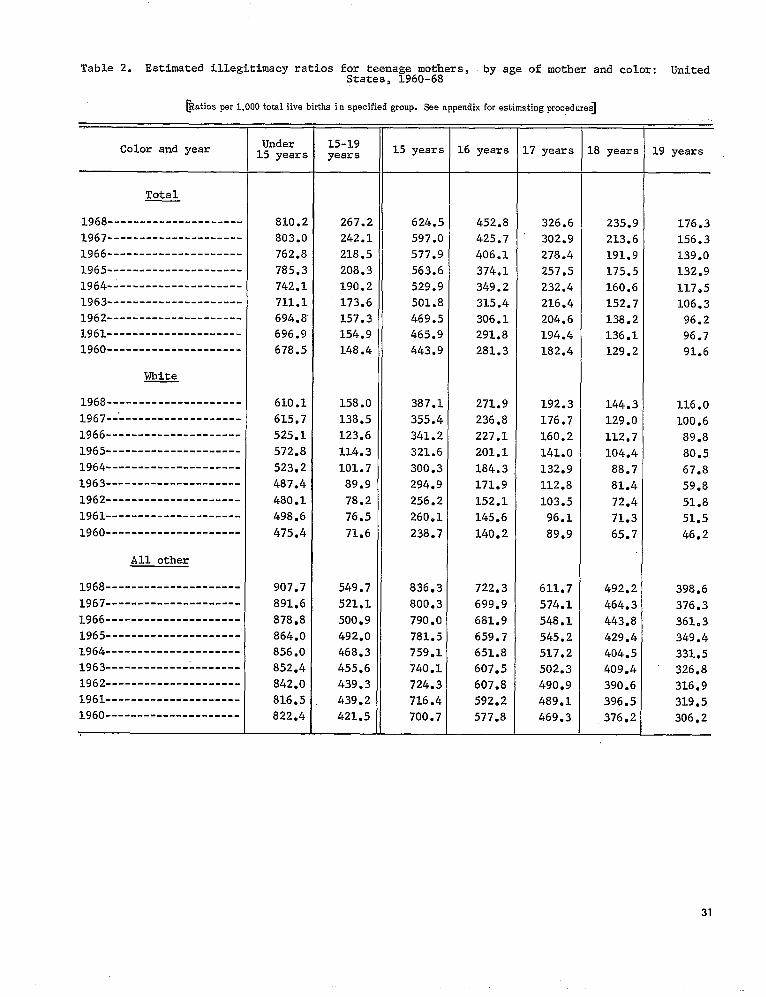
Table 2. Estimated illegitimacy ratios for teenage mothers, by age of mother and color: United States, 1960-68
@atiosper 1,000 total live bicthsin specified group. Seeappendix forestimatirrg prm+dums]
Under 15-19Color and year 15 years years 15 years 16 years 17 years 18 years 19 years
Total
1968--------------------- 810.2 267.2 624.5 452.8 326.6 235.9 176.3
1967--------------------- 803.0 242.1 597.0 425.7 302.9 213.6 156.3
1966--------------------- 762.8 218.5 577*9 406.1 278.4 191.9 139.0
1965--------------------- 785.3 208.3 563.6 374.1 257.5 175.5 132.9
1964--------------------- 742.1 190.2 529.9 349.2 232.4 160.6 117.5
1963--------------------- 711.1 173.6 501.8 315.4 216.4 152.7 106.3
1962--------------------- 694.8’ 157.3 469.5 306.1 204.6 138.2 96.2
1961--------------------- 696.9 154.9 465.9 291.8 194.4 136.1 96.7
1960--------------------- 678.5 148.4 443.9 281.3 182.4 129.2 91.6
White
1968--------------------- 610.1 158.0 387.1 271.9 192.3 144.3 116.0
1967-:------------------- 615.7 138.5 355.4 236.8 176.7 129.0 100.6
1966--------------------- 525.1 123.6 341.2 227.1 160.2 112.7 89.8
1965--------------------- 572.8 114.3 321.6 201.1 141.0 104.4 80.5
1964--------------------- 523.2 101.7 300.3 184.3 132.9 88.7 67.8
1963--------------------- 487.4 89.9 294.9 171.9 112.8 81.4 59.8
1962--------------------- 480.1 78.2 256.2 152.1 1o3.5 72.4 51.8
1961--------------------- 498.6 76.5 260.1 145.6 96.1 71.3 51.5
1960--------------------- 475.4 71.6 238.7 140.2 89.9 65.7 46.2
All other
1968--------------------- 907.7 549.7 836.3 722.3 611.7 492.2 398.6
1967--------------------- 891.6 521.1 800.3 699.9 574.1 464.3 376.3
1966--------------------- 878.8 500.9 790.0 681.9 548.1 443.8 361.3
1965--------------------- 864.0 492.0 781.5 659.7 545.2 429.4 349.4
1964--------------------- 856.0 468.3 759.1 651.8 517.2 404.5 331.5
1963--------------------- 852.4 455.6 740.1 607.5 502.3 409.4 ‘ 326.8
1962--------------------- 842.0 439.3 724.3 607.8 490.9 390.6 316.9
1961--------------------- 816.5 439.2 716.4 592.2 489.1 396.5 319.5
1960--------------------- 822.4 421.5 700.7 577.8 469.3 376.2 306.2
31
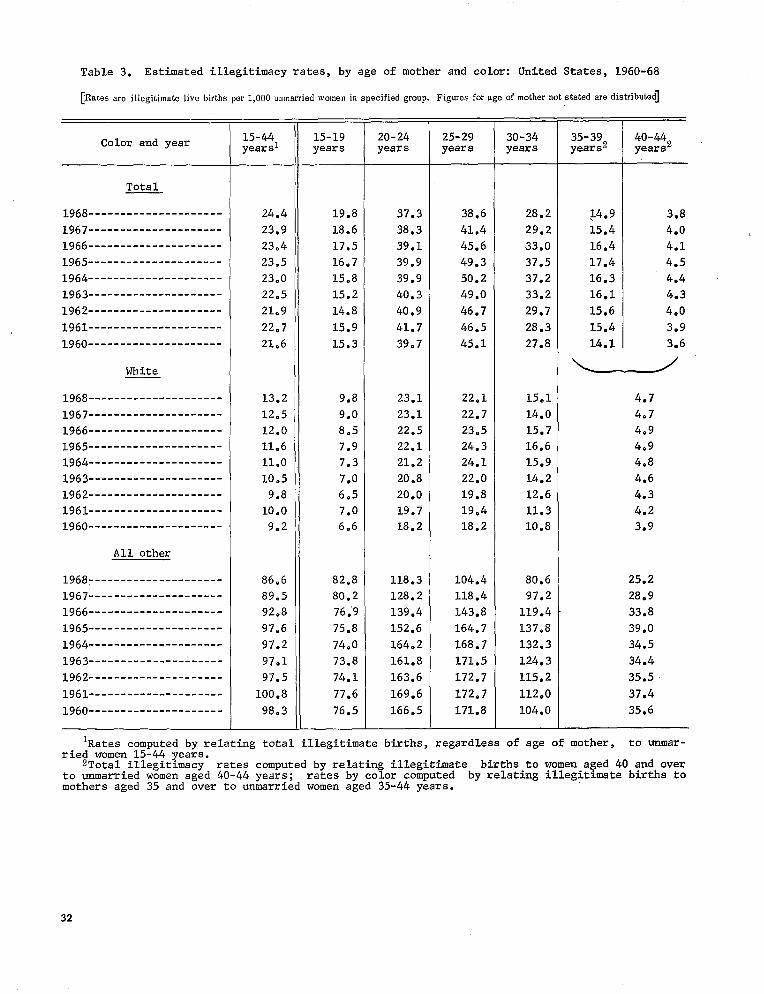
Table 3. Estimated illegitimacy rates, by age of mother and color: United States, 1960-68
[Ratesareillegitimate live births per 1,000 unmarried women in specified group. Figures forage ofmother notstated are distributed]
15-44 15-19 20-24 25-29 30-34 35-39 40-44Color and year yearsl years years years years yearsz years2
Tota1
1968--------------------- 24.4 19.8 37.3 38.6 28.2 J4.9 3.8
1967--------------------- 23.9 18.6 38.3 41.4 29.2 15.4 4.0
1966--------------------- 23.4 17.5 39.1 45.6 33.0 16.4 4.1
1965--------------------- 23.5 16.7 39.9 49.3 37.5 17.4 4.5
1964--------------------- 23.0 15.8 39.9 50.2 37.2 16.3 4.4
1963--------------------- 22.5 15.2 40.3 49.0 33.2 16.1 4.3
1962--------------------- 21.9 14.8 40.9 46.7 29.7 15.6 4.0
1961--------------------- 22.7 15.9 41.7 46.5 28.3 15.4 3.9
1960--------------------- 21.6 15.3 39.7 45.1 27.8 14.1 3.6
~’White
1968--------------------- 13.2 9.8 23.1 22.1 15.1 4*7
1967--------------------- 12.5 9.0 23.1 22.7 14.0 4.7
1966--------------------- 12.0 8.5 22.5 23.5 15.7 4.9
1965--------------------- 11.6 7*9 22.1 24.3 16.6 4.9
1964--------------------- 11.O 7.3 21.2 24.1 15.9 4.8
1963--------------------- 10.5 7.0 20.8 22.0 14.2 4.6
1962--------------------- 9.8 6.5 20.0 19.8 12.6 4.3
1961--------------------- 10.O 7.0 19.7 19.4 11.3 4.2
1960--------------------- 9.2 6.6 18.2 18.2 10.8 3.9
All other
1968--------------------- 86.6 82.8 118.3 104.4 80.6 25.2
1967--------------------- 89.5 80.2 128.2 118.4 97.2 28.9
1966--------------------- 92.8 76;9 139.4 143.8 119.4 33.8
1965--------------------- 97.6 75.8 152.6 164.7 137.8 39.0
1964--------------------- 97.2 74.0 164.2 168.7 132.3 34.5
1963--------------------- 97.1 73.8 161.8 171.5 124.3 34.4
1962--------------------- 97.5 74.1 163.6 172.7 115.2 35.5
1961--------------------- 10008 77.6 169.6 172.7 112.0 37.4
1960--------------------- 98.3 76.5 166.5 171.8 104.0 35.6
lRates computed by relating total illegitimate birtha, regardless of age of mother, to unmarried women 15-44 years.
2Total illegitimacy rates computed by relating illegitimate births to women aged 40 and over to unmarried women aged 40-44 years; rates by color computed by relating illegitimate births to �others aged 35 and over to unmarried women aged 35-44 years.
32
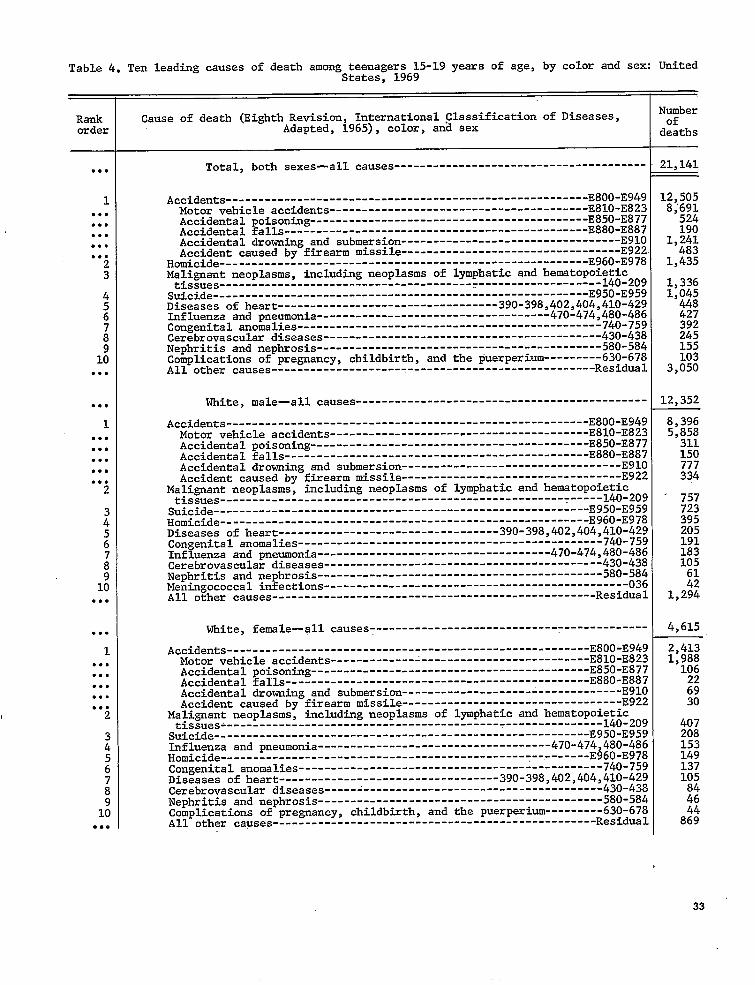
---------------------------------------
---------------------------------------------
-------------------------------------------
Table 4. Ten leading causes of death among teenagers15-19 years of age, bv color and sex: United. states, 1969
NumberRank Cause of death (EighthRevision, InternationalClassificationof Diseasea, oforder Adapted, 1965), color, and sex deaths
. . . Total, both sexes—all causes 21,141
12,5051 Accidents--------------------------------------------------------E8OO-E949 ..0 Motor vehicle accidents----------------------------------------E8lO-E82:8;691 . . . Accidentalpoisontig-------------------------------------------E85O-E87J;;; . . . Accidentalfalls-----------------------------------------------E88O-E887 . . . Accidentaldrowning and submersion----------------------------------E9lC1,& ..0 Accident caused by firearm missile----------------------------------E922 2 Homicide---------------------------------------------------------E?6O;E9781,4353 Malignant neoplasms,includingneoplasms of lymphaticand hematopo~etxc
tissues---------------------------------------:-------------------l4O-2O~1,336; Suicide----------------------------------------------------------E95O-E95~1,045
Diseases of heart----------------------------------39O-398,4O2,4O4,4lO-425448 6 Influenzaand pneumonia------------------------------------47O-474,48O-48C 427
Congenitalanomalies-----------------------------------------------74O-75~392 ; Cerebrovasculardiseases-------------------------------------------43O-43~245
Nephritis and nephrosis--------------------------------------------58O-584 155 J Complicationsof pregnancy,childbirth,and the puerperium---------63O-67Z 103
� .. All other causes--------------------------------------------------Residu13,050
... White, male-all causes 12,352
1 Accidents--------------------------------------------------------E8OO-E9498,396.** Motor vehicle accidents----------------------------------------E8lO-E8235,858.*O Accidentalpoisoning-------------------------------------------E85O-E877 311... Accidentalfalls-----------------------------------------------E88O-E887150... Accidentaldrowning and submersion----------------------------------E91O 777� OO Accident caused by firearm missile----------------------------------E922 334 2 Malignantneoplasms, includingneoplasms of lymphaticand hematopoietic
tissues-----------------------------------------------------T-----l4O-2O9757-Suicide----------------------------------------------------------E95O-E959723
i Homicide--.------------------------------------------------------E96O-E9783955 Diseases of heart----------------------------------39O-398,4O2,4O4,4lO-4292056 Congenitalanomalies-----------------------------------------------74o-759 191
Influenzaand pneumonia------------------------------------47O-474,48O-486 183i Cerebrovasculardiseases-------------------------------------------43O-438 105
Nephritis and nephrosis--.-----------------------------------------58O-584 611: Meningococcalinfections--------------------------------------------:~-O36... All other causes--------------------------------------------------Res~dual1,2:2
..* White, female-all causes 4,615
2,4131 Accidents--------------------------------------------------------E8OO-E949... Motor vehicle accidents----------------------------------------E8lO-E8231,::: ... Accidentalpoisontig-------------------------------------------E85O-E877 � .. Accidentalfalls-----------------------------------------------E88O-E887 � .* Accidentaldrowning and submersion----------------------------------E91O % ..* Accident caused by firearm missile----------------------------------E922 30 2 Malignant neoplasms,includingneoplasms of lymphaticand hematopoietic
tissues&----------------------------------------------------------l4O-2O9$3;Suicide----------------------------------------------------------E95o-E959
: Influenzaand pneumonia------------------------------------47O-474,48O-486 1535 Homicide---------------------------------------------------------E96O-E9781496 Congenitalanomalies-----------------------------------------------74o-759 137
Diseases of heart----------------------------------39•-398,4O2,4O4,4lO-429 105: Cerebrovasculardiseases-------------------------------------------43O-438
Nephritis and nephrosis--------------------------------------------58O-584 ::1: Complicationsof pregnancy,childbirth,and the puerperium---------63O-678.*. All other causes--------------------------------------------------Residwl 8%
33
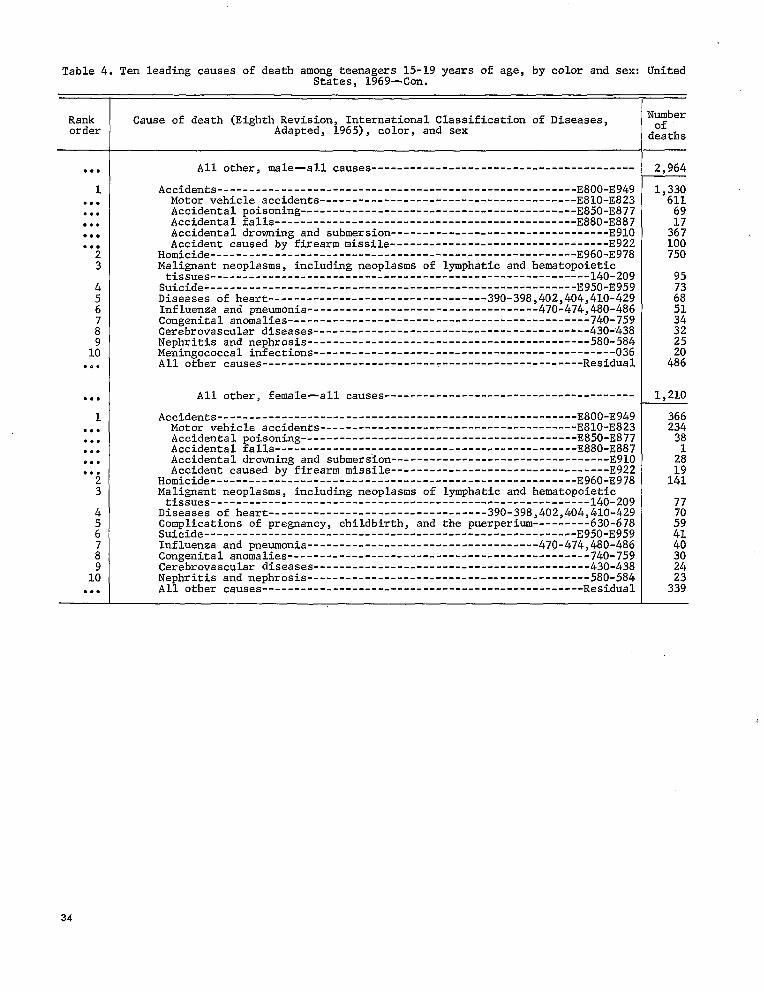
Table 4. Ten leading causes of death amonE teenagers 15-19 years of age, by color and sex: United
Rankorder
..0
1 . . . � . . . . . .00
. . .
23
456
;
1;...
� ..
1.0.....0.0....*23
4
:
i
1; � *.
St~tes, lg69-Con. -
Cauae of death (Eighth Revision, International Classification of Diseases,Adapted; 1965), color, and sex
All other, male-all causes-----------------------------------------
Accidents--------------------------------------------------------E8OO-E949Motor vehicle accidenta----------------------------------------E8lO-E823Accidental poisoning-------------------------------------------E85O-E877Accidental falls-----------------------------------------------E88O-E887Accidental drowning and submersion----------------------------------E9lOAccident caused by firearm missile----------------------------------E922
Homicide---------------------------------------------------------E96O-E978Malignant neoplaams, including neoplasms of lymphatic and hematopoietictissues-----------------------------------------------------------l4O-2O9
Suicide----------------------------------------------------------E95o-E959Diseases of heart----------------------------------39O-398,4O2,4O4,4lO-429Influenza and pneumonia------------------------------------47O-474,48O-486Congenital anomalies-----------------------------------------------74O-759
--------------------------------&--430-438Cerebrovascular diaeases---------Nephritis and nephrosis--------------------------------------------58O-584Meningococcal infections-----------------------------------------------O36All other cauaes--------------------------------------------------Residual
All other, female-all causes---------------------------------------
Accidents--------------------------------------------------------E8OO-E949Motor vehicle accidents----------------------------------------E8lO-E823Accidental poisoning-------------------------------------------E85O-E877Accidental falla-----------------------------------------------E88O-E887Accidental drowning and submers'ion----------------------------------E9lOAccident cauaed by firearm missile----------------------------------E922
Homicide---------------------------------------------------------E96O-E978Malignant neoplasms, including neoplasms of lymphatic and hematopoietictissuea-----------------------------------------------------------l4O-2O9
Diseases of heart----------------------------------39O-398,4O2,4O4,4lO-429Complications of pregnancy, childbirth, and the puerperium---------63O-678Suicide----------------------------------------------------------E95o-E959Influenza and pnewonia------------------------------------47O-474,48O-486Congenital anomalies-----------------------------------------------74O-759Cerebrovascular diseasea-------------------------------------------43O-438Nephritis and nephrosia--------------------------------------------58O-584All other causes--------------------------------------------------Reaidual
Numberof
deaths
2,964
1,33061169
3:;100750
95
;:51343225
4%
1,210
366234381
::141
77
;:4140 30 24
3::
34
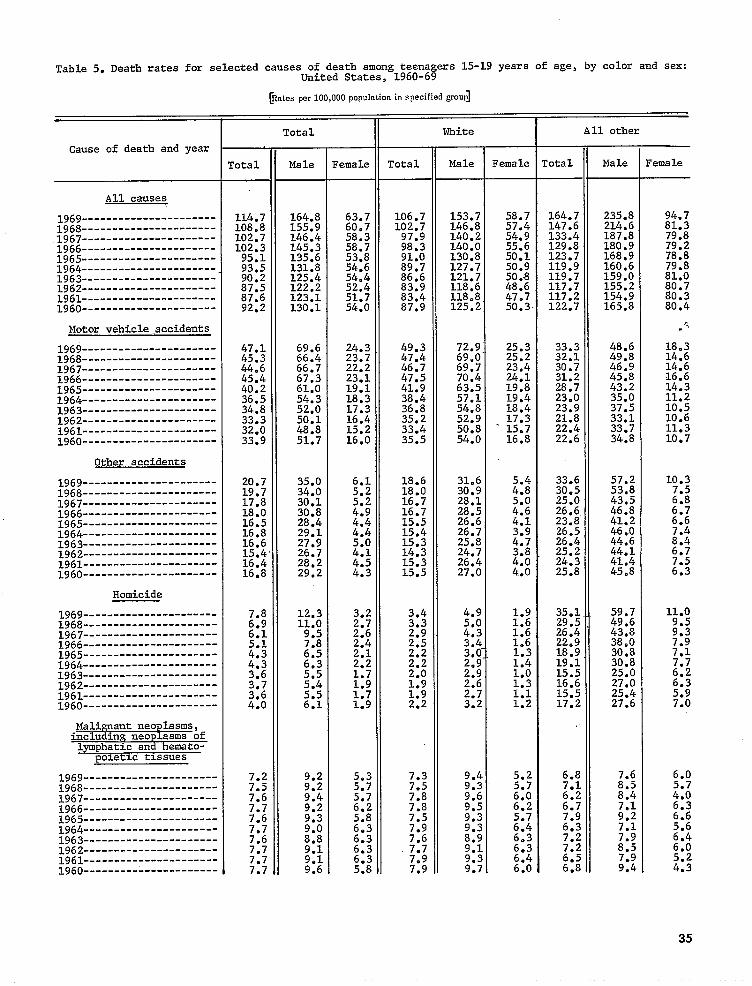
Table 5. Death rates for selected causes Of death among WSn%ers 15-19 Yeara Of age, by color and sex:United States, 1960-69
Cause of death and year
All causes
1969----------------------1968----------------------1967----------------------1966----------------------1965----------------------1964----------------------1963----------------------1962----------------------1961----------------------1960----------------------
Motor vehicle-accidents
1969----------------------1968----------------------1967----------------------1966----------------------1965----------------------1964----------------------1963----------------------1962----------------------1961----------------------1960----------------------
Other accidents
1969----------------------1968----------------------1967----------------------1966----------------------1965----------------------1964----------------------1963----------------------1962----------------------1961----------------------1960----------------------
Homicide
1969----------------------1968----------------------1967----------------------1966----------------------1965----------------------1964----------------------1963----------------------1962----------------------1961----------------------1960----------------------
Malia-nantneoplasms,including neoplasms oflymphatic and hemato
poletic tisauea
1969----------------------1968----------------------1967----------------------1966----------------------1965----------------------1964----------------------1963----------------------1962----------------------1961----------------------1960----------------------
per100,000 inspecified[Rates population growj
Total White
Total Male Female Total Male Female
114.7 164.8 63.7 106.7 153.7 58.7 108.8 155.9 60.7 m).; 146.8 57.4 102.7 146.4 58.3 140.2 54.9 102.3 145� 3 58.7 98:3 140.0 55.6 95.1 135.6 53.8 91.0 130.8 50.1 93.5 131.8 54.6 89.7 127.7 50.9 90.2 125.4 54s4 86.6 U;.:, 50.8 87.5 122.2 52.4 83.9 48.6 87.6 123.1 51.7 83.4 118:8 47.7
All other
?otal Male
164.7 235.8147.6 214.6133.4 187.8129.8 180.9123.7 168.9119.9 160.6119.7 159.0117.7 155.2117.2 154.9
92.2 130.1 54.0 87.9 125.2: 50.3. 122.7 165.8
47.1 69.6 24.3 49.3 72.9” 25.3 33.3 48.6 45.3 66.4 23.7 47.4 69.0- 25.2 32.1 49.8 44.6 66.7 22.2 46.7 69.7 23.4 30.7 46.9 45.4 67.3 23.1 47.5 70.4 24.1 31.2 45.8 40.2 61.0 19.1 41.9 63.5 19.8 28.7 43.2 :$: 54.3 18.3 38.4 57.1 19.4 23.0 35.0
52.0 17.3 36.8 54.8 18.4 23.9 37.5 33:3 50.1 16.4 35.2 52.9 17.3 21.8 ;:.; 32.0 48.8 15.2 33.4 50.8 - 15.7 22.4 33.9 51.7 16.0 35.5 54.0 16.8 22.6 34:8
20.7 35.0 6.1 18.6 31.6 5.4 33.6 57.2 19.7 34.0 5.2 18.0 30.9 4.8 30.5 53.8 17.8 30.1 16.7 28.1 5.0 25.0 43.5 18.0 30.8 ::; 16.7 28.5 4.6 26.6 46.8 16.5 28.4 4.4 15.5 26.6 4.1 23.8 ;:.: 16.8 29.1 4.4 15.4 26.7 26.5 16.6 27.9 15.3 25.8 H 26.4 44:6 15.4’ 26.7 2:: 14.3 24.7 25.2 44.1 16.4 28.2 4.5 15.3 26.4 2:: 24.3 :;.: 16.8 29.2 4.3 15.5 27.0 4.0 25.8 m
12.3 3.2 3.4 4.9 ;$; 59.7 U 11.0 ;.; 5.0 ::: 49.6
;.; N 4.3 1.6 26:4 43.8 M � 2.4 2:5 3.4 1.6 22.9 38.0
2.1 2.2 3.0: 18.9 30.8 $:: H 2.2 ::2 19.1 30.8
5.5 ::; 2.0 ::; 1.0 ;:.: 25.0 3:7 5.4 1.9 2.6 1.3 27.0
5.5 1:7 1.9 2.7 1.1 15:5 25.4 M 6.1 1.9 2.2 3.2 1.2 17.2 27.6
7.2 5.3 7.3 9.4 ;.; 6.8 7.5 ;:$ 5.7 7.5 9.3 U 7.6 ;.; 5.7 7.8 9.6 6:0 ::; 8.4 7.7 6.2 7.8 9,5 6.2 6.7 7.6 9:3 5.8 7.5 9.3 ::; 7.7 6.3 7.9 9.3 ;:: ::; 7.1 7.6 ::: 6.3 7.6 8.9 6.3 7.2 7.7 9.1 6.3 7.7 9.1 6.3 ;:; 7.7 9.1 6.3 7.9 9.3 6.4 ;:; 7.7 9.6 5.8 7.9 9.7 6.0 6.8 N
Female
94.781.379.879.278.879.881.080.780.380.4
..““.
18.314.614.616.614.311.210.510.611.310.7
10.37.5
::;6.6
U6.7
;::
11.09.59.37.97.17.76.26.35.97.0
6.0
M6.36.65.66.46.05.24.3
35
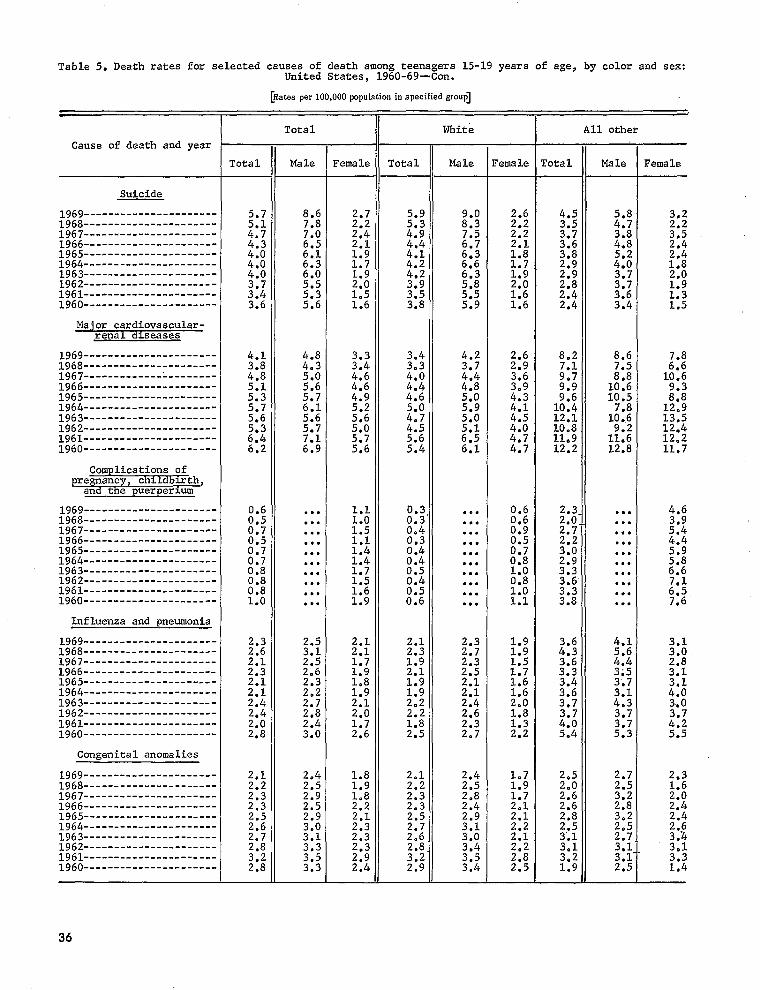
---------
-------------
----------------------
�
�
�
Table 5. Death rates for selected causes of death among teenagers 15-19 yeara of age, by color and sex: United States, 1960-69-Con.
pwuIatioII[Rates per 100,000 i.specified group]
Cause of death and year
Suicide
1969----------------------1968----------------------1967----------------------1966----------------------1965----------------------1964----------------------1963----------------------1962----------------------1961----------------------1960----------------------
Major cardiovascular-rena1 dlseasea
1969----------------------1968----------------------1967----------------------1966----------------------1965----------------------1964----------------------1963----------------------1962----------------------1961----------------------1960----------------------
Complications of pregnancy, chlldbm th, and the puerperium
1969----------------------1968----------------------;%;----------------------
.----------.-1965----------------------1964----------------------;;:;----------------------
----.----1961----------------------1960----------------------
Influenza and pneumonia
1969----------------------1968----------------------1967----------------------1966----------------------1965----------------------1964----------------------1963----------------------1962----------------------1961----------------------1960----------------------
Congenital anomalies
1969----------------------1968----------------------1967----------------------1966----------------------1965----------------------1964----------------------N%;----------------------
1961----------------------1960----------------------
Total White
Total Male Female Tots1 Male ?emale
::; 8.6
;:; R 9.0 8.3 ;:;
4.7 ;:: 2.4 4.9 2.2 2.1 4.4 ;:; 2.1
::; ::: 1.9 4.1 6.3 4.0 6.3 :.; 4.2 6.6 ;:: 4.0 6.0 ;.; :.: 1.9 3.7 2:0 :.: ;:; 1.5 3:5 5:5 :::
� � 1.6 3.8 5.9 1.6
4.1 3.4 4.2 3.8 2:! ::: 3.7 n 4.8 5.0 4.6 M 4.4 3.6
4.6 4.8 ;:$ 2:; 4.9 ::; 5.0 ::; 5.7 6.1 5.2 5.6 5.6 5.6 :$ H ::;
5.7 5.0 4.5 2:: 7.1 5.7 5.6 2:: ::? 6.2 6.9 5.6 5.4 6.1 4.7
... 1.1 0.3 .0. 0.6 M .*. ... 0.6 0.7 � .. ::: M ... 0.9
� 0. 1.1 0.3 ... 0.5 $; � *. 1.4 ... 0.7 � *. %: .0. w 0.8 .0. ;:j 0.5 ... 1.0 0.8 ... ... 0.8 0.8 ... 1:6 ;:2 .*. 1.0 1.0 .*. 1.9 0.6 ... 1.1
2.5 2.1 1.9 ::: $:; 2.3 %
N 1.9 ::; ;:; 2.6 M 2.1 ;:; 1.7 2.1 2.3 1.8 2.1 1.6 2.1 2.2 ::; 2.1 1.6 2.4 2.7 H 2.2 2.4 2.0 2.4 2.8 2.0 2.2 2.6 1.8
2.4 1.7 2.3 1.3 R 3.0 2.6 ;:; 2.7 2.2
2.1 2.4 1.8 2.1 2.4 :.; 2.5 2.2 2.5
;:$ R 2.3 2.8 1:7 2.3 ;:; 2.2 2.3 2.4 2.1 2.5 2.9 2.1 2.5 2.1 2.6 ::: 2.2 2.7 ;:!/ ::: N 3.0 2.1 2.8 3.3 2.3 3.4 2.2 3.2 3,5 2.9 n 3.5 2.8 2.8 3.3 2.4 2.9 3.4 2.5
All other
rotal Male
4.5 5.83.5 ;.7s3.73.6 4:83.82.9 2::2.9 3.7
;:: ::;2.4 3.4
8.2 8.6
;:; ;::9.9 10.6
10.51;::12.1 1;::10.811.9 R’12.2 1.2.8
2.3, � .. � ..
;:; � ** ..*
;:: � ,. .0.
$: .0. 3.6 � ., 3.3 ... 3.8 ...
4.1$! 5.6
4.43:3 3;53.4 3.73.63.7 :::
3.7N5.4 2::
2.5 2.7
::: $:;2.6 2.82.8 3.2::: 2.5
2.73.13.2 :::1.9 2.5
Female
3.2
M2.4
;::*
::;1.5
;::10.6
u12.913.512.412.211.7
;.:
:::
;::6.6
~:;
3.13.02.83.1
$;
M5.5
2.31.62.02.42.4
H3.13.31.4
36
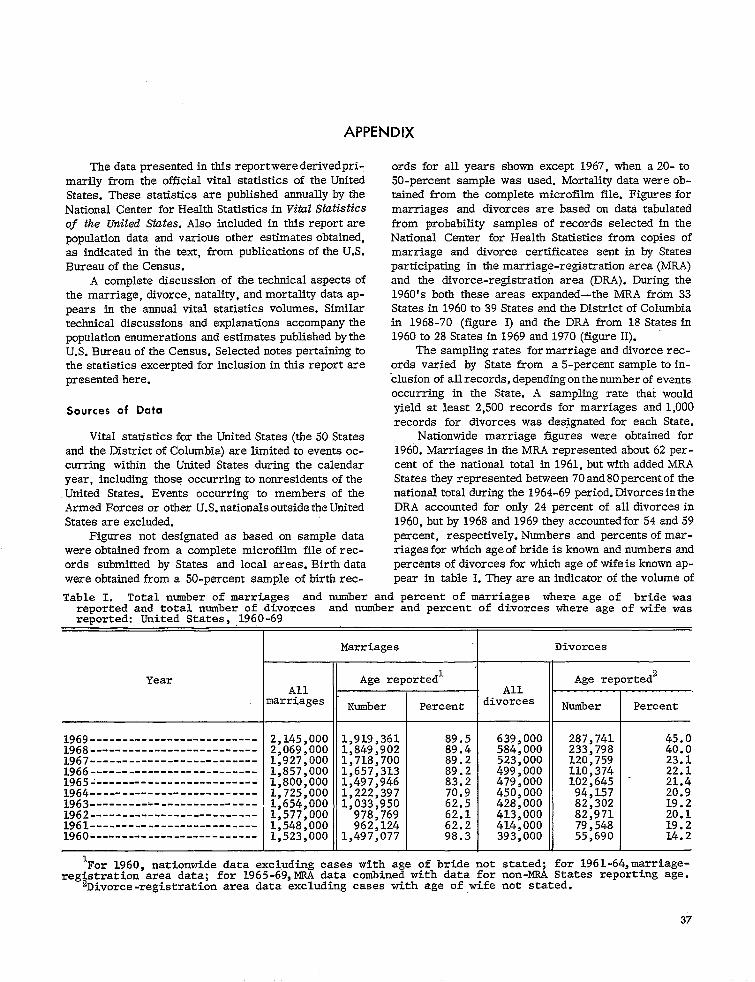
--------------------------------------------------------------------------------------------------------
------- -------------------------------------------------------------------------------------------------------------------------------------
APPENDIX
The data presented in this report were derived primsrily from the official vital statistics of the United States. These statistics are published annually by the National Center for Health Statistics in vitul Statistics of the United Stutes. Also included in this report are population data and various other estimates obtained, as indicated in the text, from publications of the U.S. Bureau of the Census.
A complete discussion of the technical aspects of the marriage, divorce, natality, and mortality data appears in the annual vital statistics volumes. Similar technical discussions and explanations accompany the population enumerations and estimates published by the U.S. Bureau of the Census. Selected notes pertaining to the statistics excerpted for inclusion in this report are preaented here.
Sourcesof Data
Vital statistics for the United States (the 50 States and the District of Columbla) are limited to events occurring within the United States during the calendar year, including those occurring to nonresidents of the United States. Events occurring to members of the Armed Forces or other U.S. nationals outside the United States are excluded.
Figures not designated as based on sample data were obtained from a complete microfilm file of records submitted by States and local areas. Birth data were obtained from a 50-percent sample of birth rec
ords for all years shown except 1967, when a 20- to 50-percent sample was used. Mortality data were obtained from the complete microfilm file. Figures for marriages and divorces are based on data tabulated from probability samples of records selected in the National Center for Health Statistics from copies of marriage and divorce certificates sent in by States participating in the marriage-registration area (MRA) and the divorce-registration area (DRA). During the 1960’s both these areas expanded-the MRA from 33 States in 1960 to 39 States and the District of Columbia in 1968-70 (figure I) and the DRA from 18 States in 1960 to 28 States in 1969 and 1970 (figure H).
The sampling rates for marriage and divorce records varied by State from a 5-percent sample to inclusion of all records, depending on the number of events occurring in the State. A sampling rate that would
Table I. Total number of marriages and number and reported and total number of d?vorces and number reported: United States, ,1960-69
Marriages
yield at least 2,500 records for marriages and 1,000 records for divorces was designated for each State.
Nationwide marriage figures were obtained for 1960. Marriages in the MRA represented about 62 per-cent of the national total in 1961, but with added MRA States they represented between 70 and 80 percent of the national total during the 1964-69 period. Divorces in the DRA accounted for only 24 percent of all divorces in 1960, but by 1968 and 1969 they accounted for 54 and 59 percent, respectively. Numbers and percents of marriages for which age of bride is known and numbers and percents of divorces for which age of wife is known appear in table I. They are an indicator of the volume of
Percent of marriages where age of bride was &d percent of di~orces where-age of wife was
Divorces
Year Age reportedl Age reportedz All All
oarriages Number Percent.t-divorces Number Percent
1969 2,145,000 1,919,361 89.5 639,000 287>741 45.0 1968 2,069,000 1,849,902 89.4 584,000 233,798 40.0 1967 1,927,000 1,718,700 89.2 523,000 120,759 23.1 1966 1,857,000 1,657,313 89.2 499,000 110,374 22.1 ;;::-------- .------ 1,800,000 1,497,946 83.2 479,000 102,645 21.4
- 1,725,000 1,222,397 70.9 450,000 94,157 20.9 1963 1,654,000 1,033,950 62.5 428,000 82,302 19.2 1962 1,577,000 978,769 62.1 413,000 82.971 20.1 1961 1,548,000 962,124 62.2 ;;:,;(); 79;548 19.2 1960 1,523,000 1,497,077 98.3 * 55,690 14.2
1For 1960, nationwide data excludf.ng cases with age of bride not stated; for 1961-64,marriage
registrationarea data; for 1965-69,MRJIdata combinedwith data for non-MRA States reportingage.%Di~or~e-registrationarea data excluding cases with age of wife not stated.
37
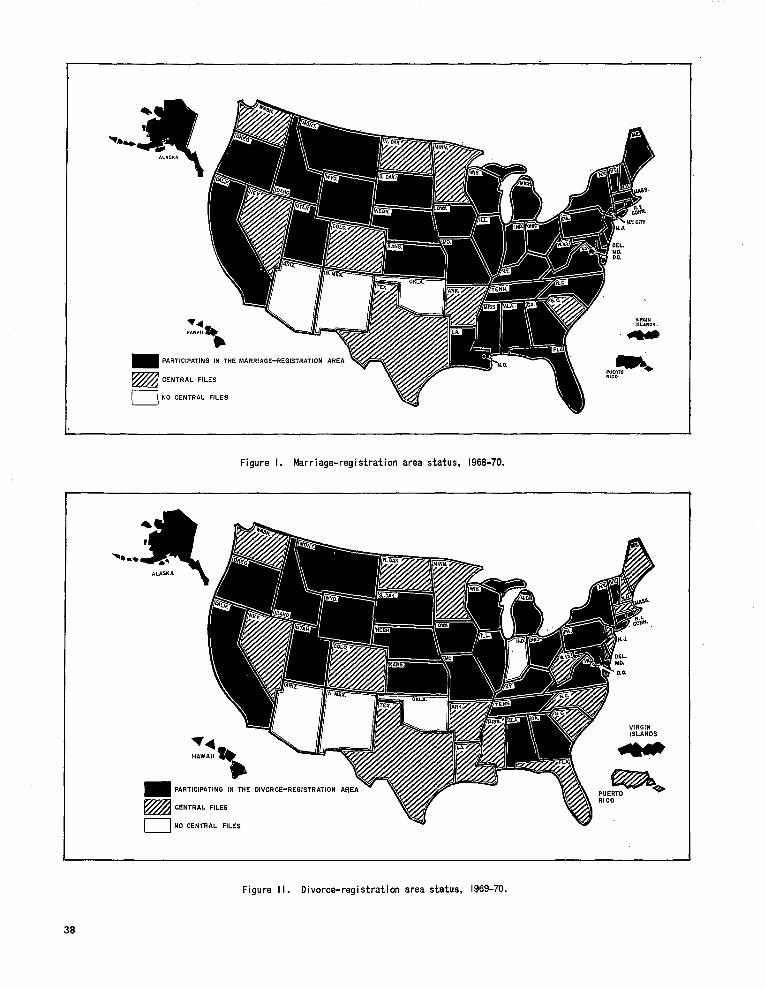
V4“.!.,!1
‘*
PARTICIPATING IN THE MARRIAGE-REGISTRATION AREA
CENTRAL FI~ I I NO CENTRAL FILES
Figure 1. Marriage-registration area status, 1968-70.
Figure Il. Divorce-registrationarea status, 1969-70.
38
cases from which information about teenage marriage and divorce were obtained.
Rate Computations
Rates for census years are based on populations enumerated as of April 1 of that year. All other rates are based on estimates of the population present in the area as of July 1, including Armed Forces stationed in the area but excluding Armed Forces abroad. The population estimates were prepared by the U.S. Bureau of the Census.
Estimating Procedures
National estimates of mam!ages. —The number of marriages in the United States during 1969 by age and sex were estimated from sample data for the MRA (39 States and the District of Columbia) combined with data from five other States reporting marriages by age (Arkansas, Mimesota, South Carolina, North Dakota, and Texas). It was assumed that brides and grooms marrying in the 6 States where age was not reported (Arizona, Colorado, New Mexico, Nevada, Oklahoma, and Washington) had the same distribution by age as brides ,md grooms marrying where age at marriage was known. National totals of marriages by age were obtained by applying the percent distribution by age in the reporting area to the U.S. total of marriages. National marriage rates were computed by relating the
estimated totals to the unmarried resident population of the U.S. by age and sex.
Similar estimates were made for 1966-68 using data from the same reporting States. (Missouri was not in the MRA until 1968 but was included as a non-MRA State reporting marriages by age for the 1965-67 estimates.) The 1965 estimates were based on data excluding Texas. For 1960, U.S. data by age were obtained horn a nationwide sample, but State figures were compiled only for States in the MRA.
Rep”onal estimates of [email protected] estimates of teenage marriages (table 1) were made by computing separate estimates for each nonreporting State and summarizing State totals for each of the four regions. Teenage marriage totals were available for all States in the Northeast and North Central Regions beginning with. 1965 data. For the South Region estimates were prepared for Texas in 1965 and for Oklahoma in 1965-69. Estimates for the West were prepared for five States (Arizona, Colorado, Nevada, New Mexico, and Washington) for all years 1965-69.
Estimates of teenage brides and gvooms at specified ayes. —The uniform group of States for which data are shown in table D are those comprising the MRA in 1961, excluding New York. Because data for New York State excluded New York City until 1965, they are eliminated for all~esrs for the purpose of comparability.
For 1961 and 1962 the number of marriages at ages under 18 and 18-19 are available for the MRA as a
whole, but data were not tabulated in such detail for each State. Estimates were made for New York State by assuming the same age distribution of brides and grooms under age 20 in the State as for those in the entire MRA including New York State. The resulting State estimates were subtracted from the MRA totals in each of the two age groups to obtain estimates for the 34 States and the District of. Columbia for 1961 and 1962.
National estimates of divorces. —National estimates of divorces by age and sex for 1969 (table Q) were prepared by aproceduresimilsr to that used for national estimates of marriages. Sample data on age at decree and age at marriage,’ reported by the 28 States in the DRA, were used as the basis for estimates. It was assumed that the age distribution of husbands and wives granted” decrees in-the reporting States was representative of that in nonreporting States. Nationwide totals were derived by applying the known distribution to the final U.S. total of divorces in 1969. (For 1969 age was known for approximately 75 percent of the divorces in the DlL4, or about 45 percent of the 639,000 divorces in the entire United States.)
National divorce rates by age at decree were computed by relatig the estimated numbers of divorces for the United States to the married population of the United States by age and sex.
Illegitimate Births
Legitimacy status was reported in 40 States and the District of Columbia in 1968. The following States did not require reporting of this information: California, Connecticut, Georgia, Idsho, Maryland, Massachusetts, Montana, New, Mexico, New York, and Vermont. In earlier years fewer States reported. In 1960, the esrliest year for which illegitimate live births and ratios are shown in this report, legitimacy status was re-ported in 34 States and the District of Columbia. In addition to those listed above, the following States did not report legitimacy status in 1960: Arizona, Arkansas, Colorado, Nebraska, New Hampshire, and Oklahoma.
In making annual estimates of the number of illegitimate births occurring in the countiy as a whole, the States were grouped into nine geographic divisions. The combined ratio” of illegitimate births per 1,000 total live births for all reporting States in a single geographic division was then applied to all live births occurring to residents of that division. This estimating procedure was done separately for the two color groups, white and all other. For each year, the sum of these estimates for the nine geographic divisions makes up the estimate for the United States.
In processing the data, no adjustments were made for misstatements of legitimacy status on the birth record or for failure to register illegitimate births because the extent of such reporting problems is unknown. A birth with legitimacy status not stated was considered to be legitimate.
39
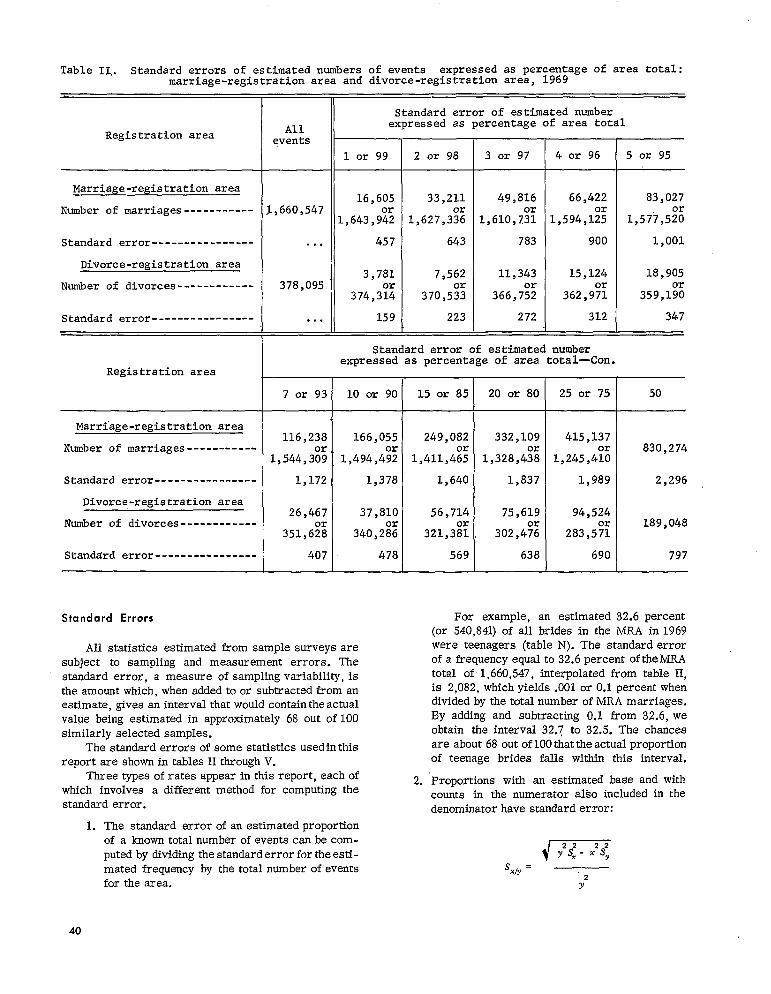
-----------
----------------
------------
----------------
-----------
----------------
------------
----------------
Table 11,. Standard errors of estimated numbers of events expressed as percentage of area total: marriage-registration area and divorce-registration area, 1969
Standard error of estimated number All expressed as percentage of area total
Registration area events
1 or 99 2 or 98 3 or 97 4 or 96 5 or 95
Marriage-registration area 16,605 33,211 49,816 66,422 83,027
Number of marriages .,660,547 .,643,9% 1,627,3% 1,610,7% 1,594,1% la577,5z
Standard error . . . 457 643 783 900 1,001
Divorce-registration area 3,781 7,562 11,343 15,124 18,905
Number of divorces 378,095 374,3E 370,5s 366,7% 362,9$ 359,1E
Standard error . . . 159 223 272 312 347
Standard error of estimated number expressed as percentage of area total—Con.
Registration area
7 or 93 10 or 90 15 or 85 20 or 80 25 or 75 50
Marriage-registration area 116,238 332,109 415,137
Number of marriages 830,274 1,544,3% 1,328,4% 1,245,4%
Standard error 1,172 1,378 1,640 1,837 1,989 2,296 I I
Divorce-registration area 26,467 37,810 56,714 75,619 94,524
Number of divorces 189,048 351,6% 340,2~ 321,3~ 302,4% 283,5%
Standard error 407 478 569 638 690 797
Standard Errors For example, an estimated 32.6 percent (or 540,841) of all brides in the MRA in 1969
All statistics estimated from sample surveys are were teenagers (table N). The standard error
subject to sampling and measurement errors. The of afrequency equal to32.6 percent of the MRA
standard error, a measure of sampling variabili~, is total ofl ,660,547, interpolated from table II,
the amount which, when added to or subtracted from an is 2,082, which yields .001 or 0.1 percent when estimate, gives an interval that would contain theactual divided by the total number of MRA marriages.
value being estimated in approximately 68 out of 100 By adding and subtracting 0.1 from 32.6, we
similarly selected samples. obtain the interval 32.7 to 32.5. The chances
The standard errors of some statistics usedinthis are about 68 out oflOOthatthe actual proportion
report are shown in tables II through V. of teenage brides falls within this interval.
Three types ofrates appear in this report, each of 2. Proportions with an estimated base and with which involves a different method for computing the counts in the numerator also included in the standard error. denominator have standard error:
1. The standard error of an estimated proportion of a known total number of events can be computed by dividing the standard error for the esti- m mated frequency by the total number of events s=
.IY
for the area, Y2
40
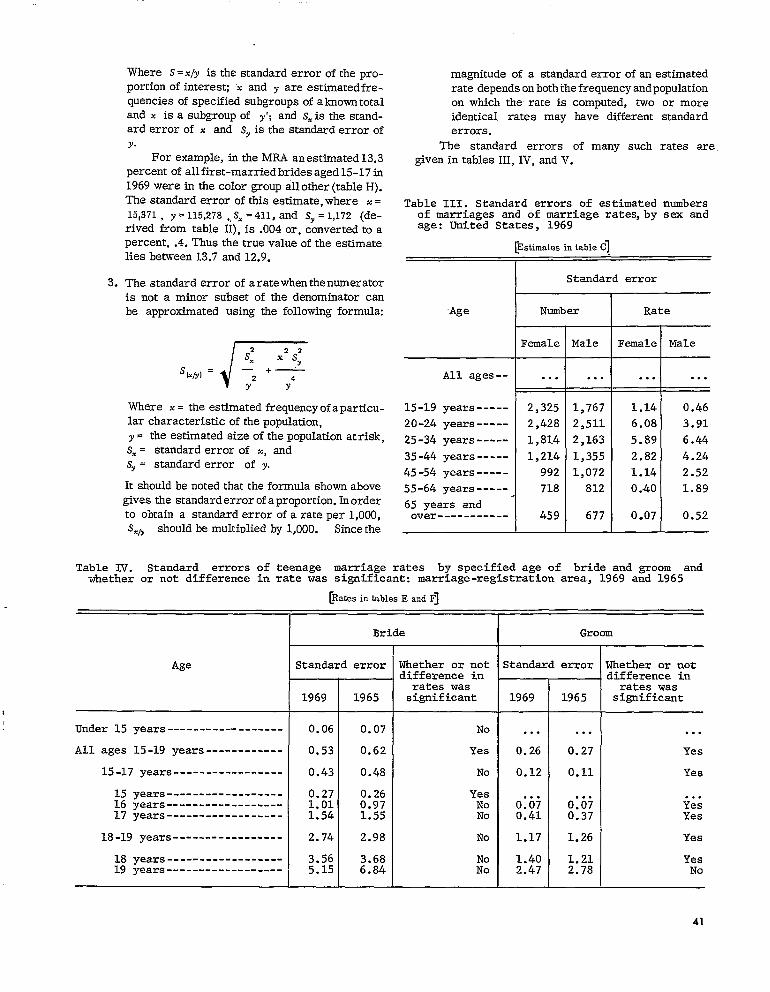
--
----------
-----
-----
-----
-----
-----------
------------------
------------
-----------------
------------------------------------------------------
-----------------
------------------------------------
Where S= X/Y is the standard error of the pro-portion of interest; x and y are estimated frequencies of specified subgroups of a known total and x is a subgroup of y‘; and Sx isthe standard error of x and Sy is the standard error of Y.
For example, in the MR4 an estimated 13.3 percent of all first-married brides aged 15-17 in 1969 were in the color group all other (table H). The standard error of this estimate, where x =
15,371, y = 115,278 ,,SX = 411, and Sy = 1,172 (de-rived from table II), is .004 or, converted to a percent, .4. Thus the true value of the estimate lies between 13.7 and 12.9.
3. The standard error of a rate when the numerator is not a minor subset of the denominator can be approximated using the following formula
s: x=s: Sh,y)= —2 + -JY Y4
Where x = the estimated frequency of a particular characteristic of the population,y = the estimated size of the population at risk,SX = standard error of X, andSY= standard error of y.
It should be noted that the formula shown abovegives the standard error of a proportion. In orderto obtain a standard error of a rate per 1,000,S.,Y should be multiplied by 1,000. Since the
magnitude of a standard error of an estimated rate depends on both the frequency and population on which the rate is computed, two or more identical rates may have different standard errors.
The standard errors of many such rates are given in tables III, IV, and V.
Table III. Standard errors of estimated numbers of marriages and of marriage rates,by sex and age: United States, 1969
[Estimates in table Cl.
Standard error
Age Number Rate
Female
All ages . . .
15-19 years 2,325
20-24 years 2,428
25-34 years 1,814
35-44 years 1,214
45-54 years 992
55-64 years 718
65 years and over 459
Male Female Male
. . . . . . . . .
1,767 1.14 0.46 2,511 6.08 3.91 2,163 5.89 6.44
1,355 2.82 4.24 1,072 1.14 2.52
812 0.40 1.89
677 0.07 0.52
bride and groom andTable N. Standard errors of teenage marriage rates by specified age ofwhether or not difference in rate was significant: marriage-registration area, 1969 and 1965
[Rates in table, E ..d F]
Bride
Age Standard error Whether or not1 difference in rates was
1969 1965 significant
Groom
I Wandard error Whether or not.1 difference in
1969
. . . . . . . . .
0.26 0.27 Yes
0.12 0.11 Yes
. . . . . . . . . 0.07 0.07 Yes 0.41 0.37 Yes
1.17 1.26 Yes
1.21 Yes 2.78 No
Under 15 years
All ages 15-19 years
15-17 years
15 years 16 years 17 years
18-19 years
18 years 19 years
0.06 0.07 No
0.53 0.62 Yes
0.43 0.48 No
0.27 0.26 Yes 1.01 0.97 No 1.54 1.55 No
2.74 2.98 No
3.56 3.68 No 5.15 6.84 No
41
I
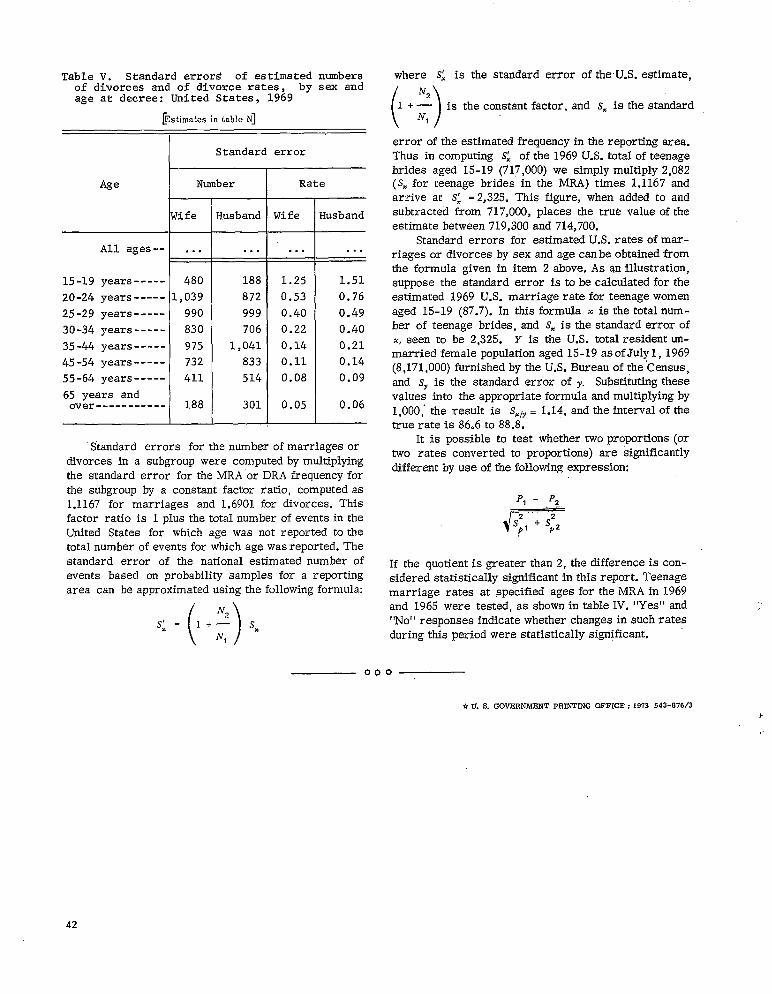
-----
----------
-----
-----
----------
-----------
Table V. Standard error~ of estimated numbers of divorces and of divorce rates, by sex and age at decree: United States, 1969
~stimatesin tableN]
Age
All ages--
15-19 years
20-24 years 25-29 years
30-34 years
35-44 years
45-54 years 55-64 years
65 years and over
Standard error
Number Rate
$ife $usband Wife FIusband
. . . . . . . . . . . .
480 188 1.25 1.51
1,039 872 0.53 0.76
990 999 0.40 0.49
830 706 0.22 0.40
975 1,041 0.14 0.21 732 833 0.11 0.14
411 514 0.08 0.09
188 301 0.05 0.06
Standard errors for the number of marriages or divorces in a subgroup were computed by multiplying the standard error for the MRA”or DRA frequency for the subgroup by a constant factor ratio, computed as 1.1167 for marriages and 1.6901 for divorces, This factor ratio is 1 plus thetotal number of events in the United States for which age was not reported to the total number of events for which age wasreported. The standard error of the national estimated number of events based on probability samples for a reporting area can be approximated using the following formula:
/ N.\
where Sj is the standard error of the U.S. estimate, Nz
l+— is the constant factor. and S. is the standard Iv,
()
error of the estimated frequency in the reporting area. Thus in computing Sj of the 1969 U.S. total of teenage brides aged 15-19 (717,000) we simply multiply 2,082 (Szforteenage brides inthe MRA) times 1.1167 and arrive at S: =2,325. This figure, when added to and subtracted from 717,000, places the true value of the estimate between 719,300 and 714,700.
Standard errors for estimated U.S.rates of marriages or divorces by sex and age canbe obtained from the formula given in item 2 above. As ~n illustration, suPpose the standard error is to be calculated for the estimated 1969 U.S. marriage rate for teenage women aged 15-19 (87.7). In this formula x is the total number of teenage brides, and S. isthestandard error of X, seen to be 2,325. Y is the U.S. total resident unmarried female population aged 15-19 asofJulyl, 1969 (8,171 ,000) furnished by the U.S. Bureau of the ‘Census, and S7 is the standard error of y. Substiku?ing these values into the appropriate formula and multiplying by 1,000; the result is SZIY=1.14, andthe interval of the true rate is 86.6 to 88.8.
It is possible to test whether two proportions (or two rates converted to proportions) are significantly different by use of the following expression:
PI - ,P2
J7TTIf the quotient isgreaterthan2, the differenceis considered statistically significant in this report. Teenage marriage rates at specified ages for the MRAin 1969 and 1965 were tested, as shown in table IV. “Yes” and “No’’responses indicate whether changes insuch rates during this period were statistically significant.
000
*U. S. GOVERNMENT PR~TING OFFICE: 1073543-S76/3
42
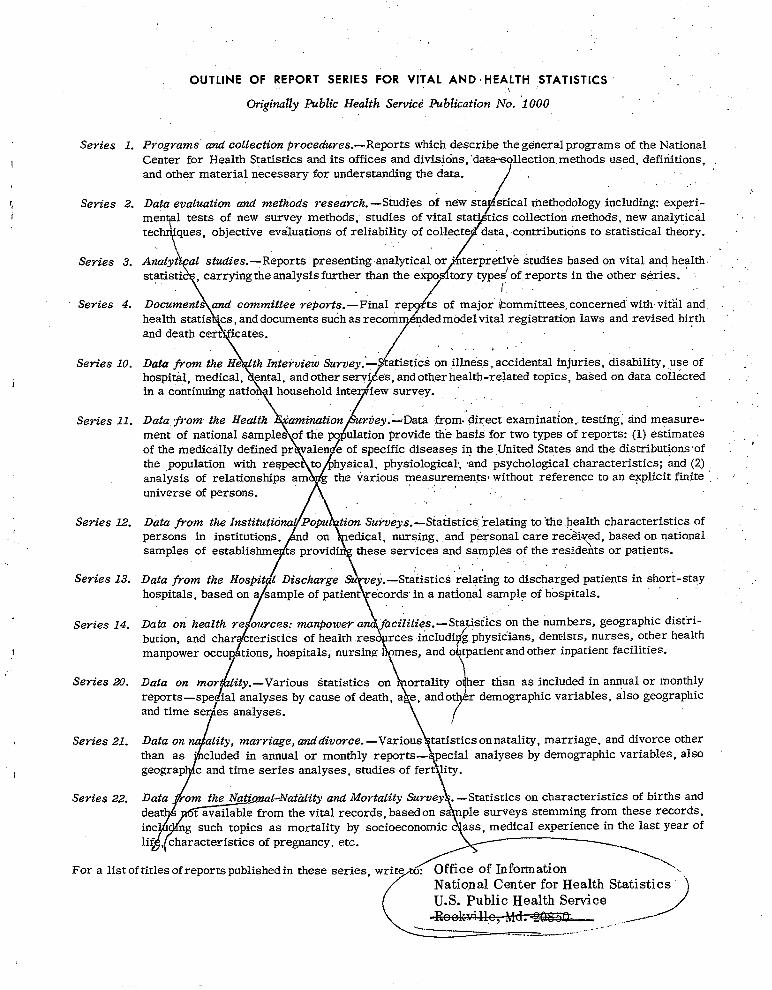
L
OUTLINE OF REPORT SERIES FOR VITAL AND HEALTH ,STATISTICS,, ,, Originally Public Health Service publication No. ‘1000
Seyies 1. P9’ogYams and collection pToceduYes.— Reports which describe the g~neral programs of the National Iection. methods used, definitions,
and other material necessary for understanding the data. ,.,
Series 2. Data evaluation and methods reseamh. al thethodology including: experi -tics collection methods, new analytical
ontributions to statistical theory.
Se7ies 3. -Reports presenting analytical or “ terpretive studies based on vital and health. reports in the other series.
,.
Series 4. ts of major committees. concerned with vital and nded model vital registration laws and revised birth
... , Series 10. atist~cs on illness, accidental injuries, disability, use of
hospital, medical, d topics, based on data collected
,, .,
Series 11. Data from the Health “anzination xvey. —Data from.’ direct examination,. testing: and measurement of national samples of the po ulation provide th”e basis for two types of reports: (1) estimates
‘>of the medically defined pr valen e of specific diseases in the ,United States and the distributions “of ~ the ,population with re~pec to hysical, physiological; and psychological characteristics; and (2) anal ysis of relationships am g the Various measurements Iwithout reference to an ‘FPlicit finite I ‘ ,,. universe of persons. Y.. . .
Se7-ies12. Data from the Institutions Popu tion Survey s.- Statistics, relating to “thehealth characteristics of persons in institutions, nd on edical, nursing, and personal care rec$?
Yed, based on national “.
ts providisamples of establishme /i’ these services and samples of the residents or patients.
Series 13. Data from the Hospit 1 DiscJzaYge .—Statistics “relating to discharged patients in short-stay hospitals, based on a sample of patient ecords m a national sample of hospitals.
/ ‘v’’”’” “Series 14. Data on’ health re ouvces: manpower a facilities. —Statistics on the numbers, geographic distri
bution, and char cteristics of health res rces includ” g. physicians, dentists, nurses, other health manpower occu lithospitals, nursiruz roes, and o tpatienc and other inpatient facilities.tions,
Series 20. Data on moY lity.— Various Statistics on ortality o her than as included in annual or monthly reports —spe ial analyses by cause of death, a e, and o r demographic variables, also geographic and time ser es analyses.
f \;
I Series 21. Data on w ality, rnan-iage, and divorce. —Various tatistics on natality, marriage, and divorce other than as “ eluded in annual or monthly reports— pecial analyses by demographic variables, also geograp c and time series analyses, studies of fert ity.! \
Series 22. Data om the Natioxul--Natality and Mortality Survey . —Statistics on characteristics of births and cleat2~ from the vital records. based on sa de surveys stenlming from these records. inc ng such topics as mortality by socioeconomic iss, meti-cal experience in the last year of lift? , characteristics of pregnancy, etc.
For a list of titles of reports published in these series, write : Of fiCe Of In fOI’inatiOn National Center for Health Statistics
<~>