Embed Size (px)
Citation preview

STATISTICS ON MARRIAGES AND DIVORCES, 2016 ISSN 1793-0081 © Department of Statistics, Ministry of Trade & Industry, Republic of Singapore Reproducing or quoting any part of this publication is permitted, provided this publication is accredited as the source. Please refer to the Statistics Singapore Website Terms of Use (http://www.singstat.gov.sg/terms-of-use) for more details on the conditions of use of this publication.
Statistical activities conducted by the Singapore Department of Statistics are governed by the provisions of the Statistics Act (Cap. 317). The Act guarantees the confidentiality of information collected from individuals and companies. It spells out the legislative authority and responsibility of the Chief Statistician. The Act is available in the Department’s Website (www.singstat.gov.sg).
Singapore Department of Statistics Statistics on Marriages and Divorces, 2016 ► i
PREFACE
The Singapore Department of Statistics initiated the collection of divorce statistics in 1981 and of educational qualification of marriage partners in 1984. The marriage and divorce statistics provide important inputs for formulating population and related policies.
This report, Statistics on Marriages and Divorces, 2016, is the thirty-third in a regular series of publications. There are two parts in this report. Part 1 analyses the marriage trends and characteristics of grooms and brides. Part 2 highlights the nature of divorces and characteristics of divorcees. Relevant statistical tables and charts are included.
I would like to thank the Ministry of Social and Family Development, Ministry of Culture, Community and Youth, Registry of Marriages, Registry of Muslim Marriages, the Syariah Court and the Family Justice Courts for providing the data on marriages and divorces. I would also like to thank all others who have contributed towards this publication. Wong Wee Kim Chief Statistician Singapore July 2017
ii ◄ Statistics on Marriages and Divorces, 2016 Singapore Department of Statistics
Our Vision
A National Statistical System of Quality, Integrity and Expertise.
Our Mission We Provide Reliable, Relevant and Timely Statistics
to Support Singapore’s Social and Economic Development.
Our Guiding Principles
Professionalism & Expertise
We adhere to professional ethics and proficiently produce quality statistics that comply with international concepts and best practices.
Relevance We constantly innovate our processes and
produce statistics that meet users’ needs.
Accessibility We make our statistics readily available.
Confidentiality We protect the confidentiality of information provided to us.
Timeliness & Reliability
We produce statistics that users can depend on and disseminate them at the earliest possible date while maintaining data quality.
Cost Effectiveness
We use resources effectively, minimising respondent burden and leveraging on administrative data.
Singapore Department of Statistics Statistics on Marriages and Divorces, 2016 ► iii
CONTENTS Page
Preface ................................................................................................................i Contents .......................................................................................................................... iii List of Tables .................................................................................................... iv Key Indicators on Marriages and Divorces, 2011 – 2016 .............................. xi Part 1 Marriage Trends
Number of Marriages Registered .......................................................... 3 General Marriage Rate .......................................................................... 4 Age-Specific Marriage Rate .................................................................. 4 Marriages by Marriage Order ................................................................ 5 Median Age at Marriage ........................................................................ 6 Age Differential at First Marriage ........................................................... 6 Median Age at First Marriage by Educational Qualification ................... 7 Inter-ethnic Marriages ........................................................................... 8 Educational Differential at Marriage ...................................................... 9 Marriages of Minors ............................................................................ 10
Part 2 Divorce and Annulment Trends
Number of Marital Dissolutions ........................................................... 13 General Divorce Rate .......................................................................... 14 Age-Specific Divorce Rate .................................................................. 14 Age at Divorce ..................................................................................... 15 Median Marriage Duration ................................................................... 16 Main Reasons for Divorce and Plaintiff ............................................... 17 Annulment of Marriages under the Women’s Charter ......................... 19
Tables on Marriages ...................................................................................... 21 Tables on Divorces and Annulments ........................................................... 63 Source and Data Coverage ......................................................................... 107 Glossary ....................................................................................................... 108
iv ◄ Statistics on Marriages and Divorces, 2016 Singapore Department of Statistics
LIST OF TABLES Table Page
Total Marriages
A1.1 Total Marriages, 1980 – 2016 ...................................................................... 23 A1.2 Age-Sex-Specific Marriage Rate, 1980 – 2016 ............................................ 24 A1.3 Total Marriages by Age Group of Grooms and Brides, 2006 – 2016 ........... 26 A1.4 Total Marriages by Age Differential of Grooms to Brides and
Marriage Order, 2014 – 2016 ...................................................................... 27 A1.5 Median Age of Grooms and Brides by Marriage Order, 2006 – 2016 .......... 28 A1.6 Median Age of Grooms by Ethnic Group, 2006 – 2016 ............................... 28 A1.7 Median Age of Brides by Ethnic Group, 2006 – 2016 .................................. 29 A1.8 Median Age at First Marriage of Grooms and Brides by Educational
Qualification, 2006 – 2016 ........................................................................... 29
Marriages under the Women’s Charter
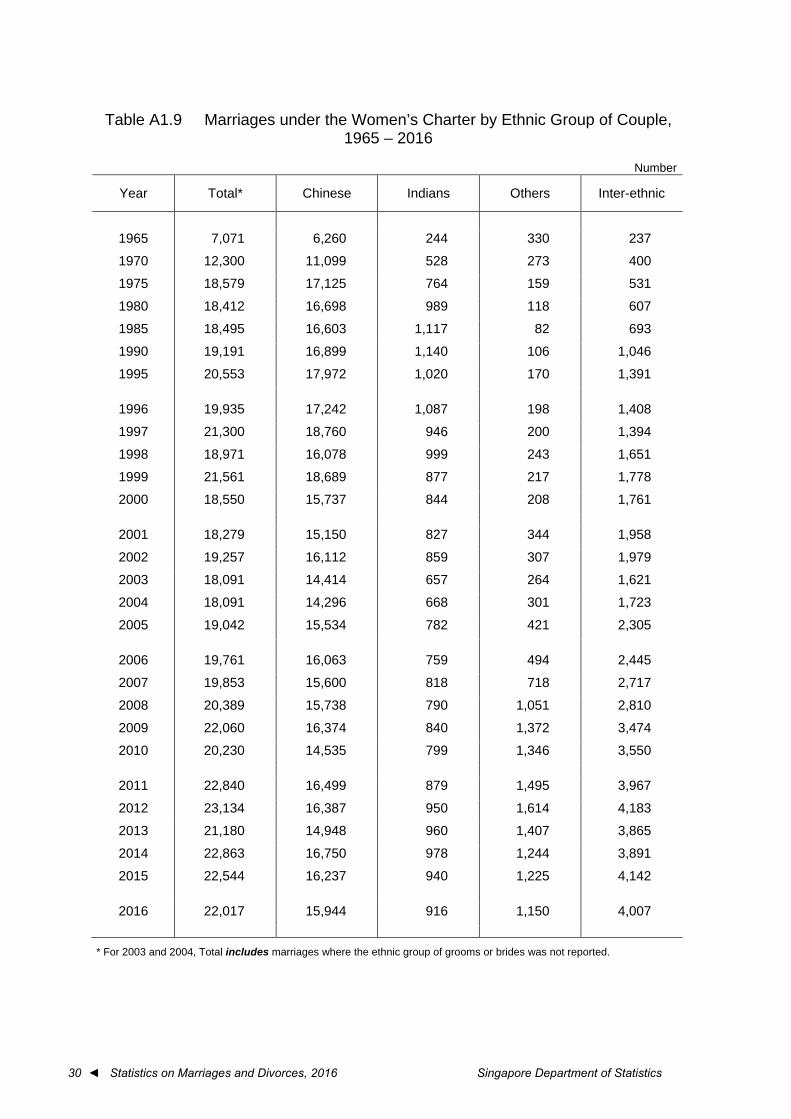
A1.9 Marriages under the Women’s Charter by Ethnic Group of Couple, 1965 – 2016 ................................................................................................. 30
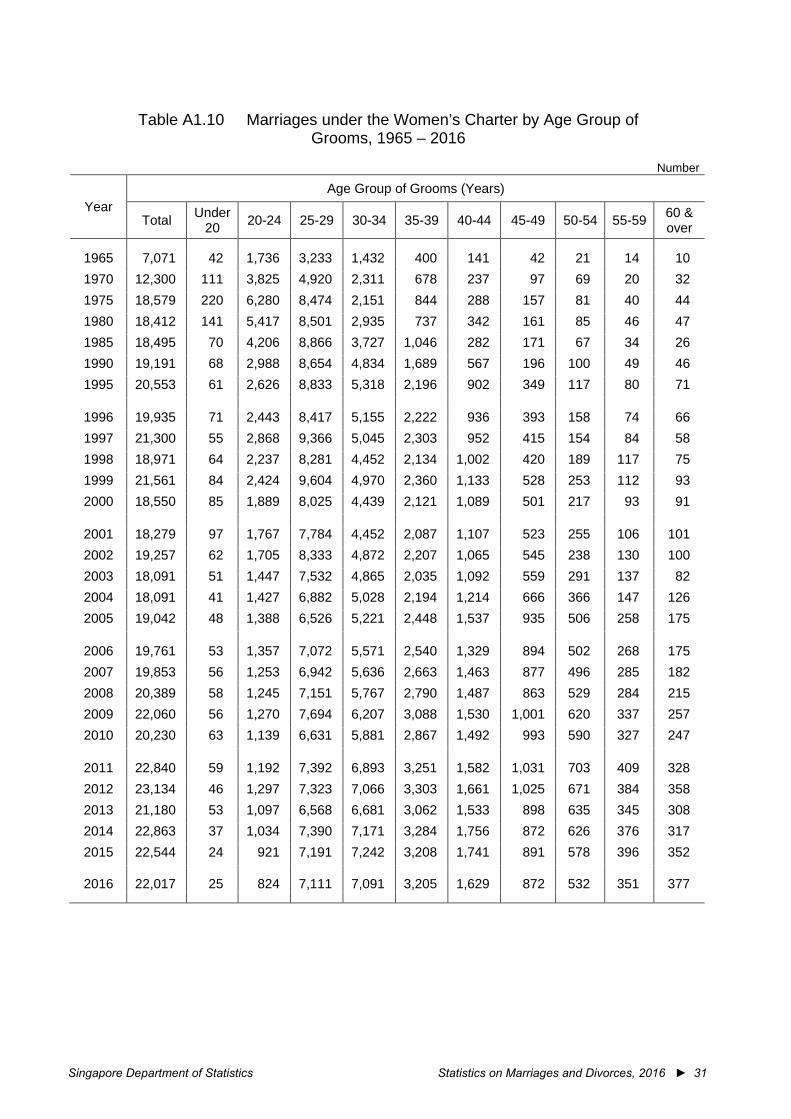
A1.10 Marriages under the Women’s Charter by Age Group of Grooms, 1965 – 2016 ................................................................................................. 31
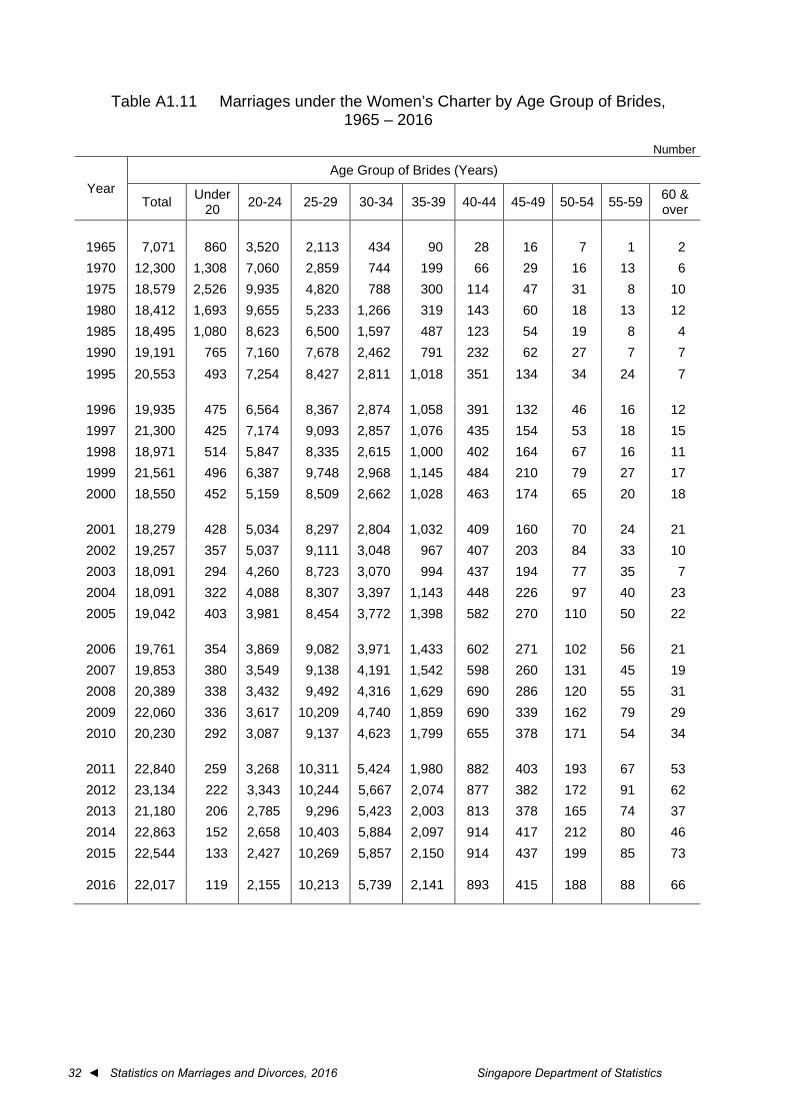
A1.11 Marriages under the Women’s Charter by Age Group of Brides, 1965 – 2016 ................................................................................................. 32
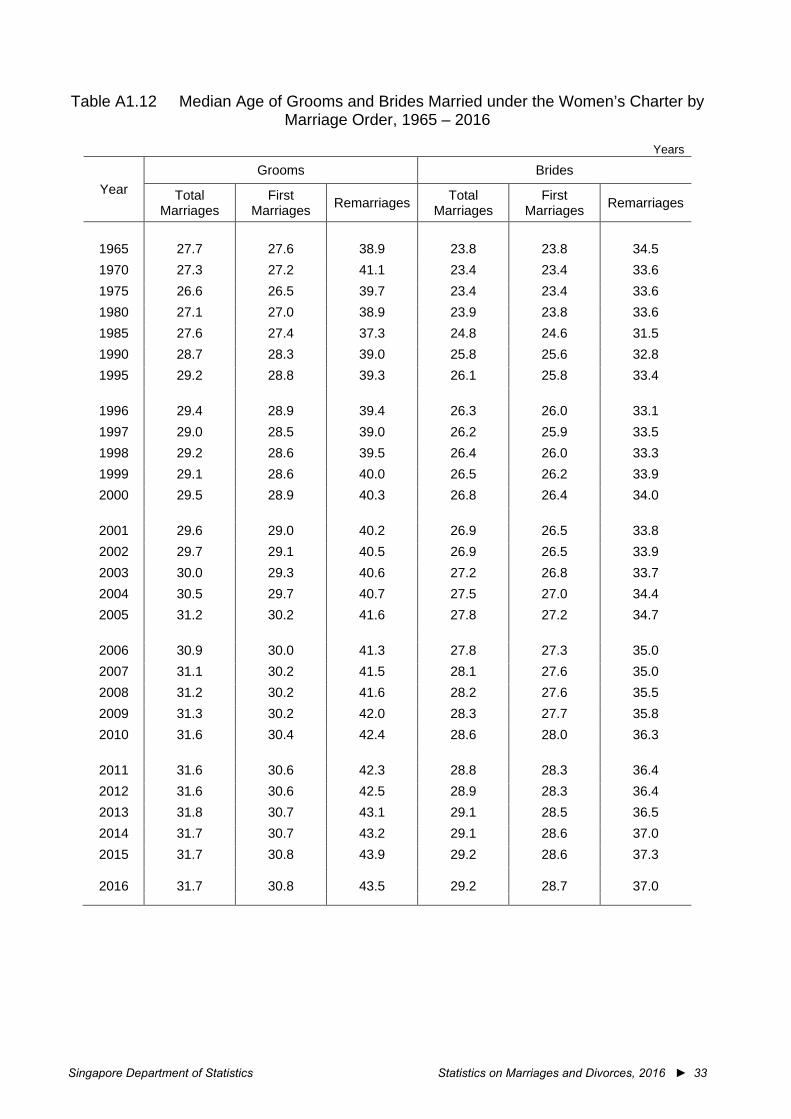
A1.12 Median Age of Grooms and Brides Married under the Women’s Charter by Marriage Order, 1965 – 2016 .................................................................. 33
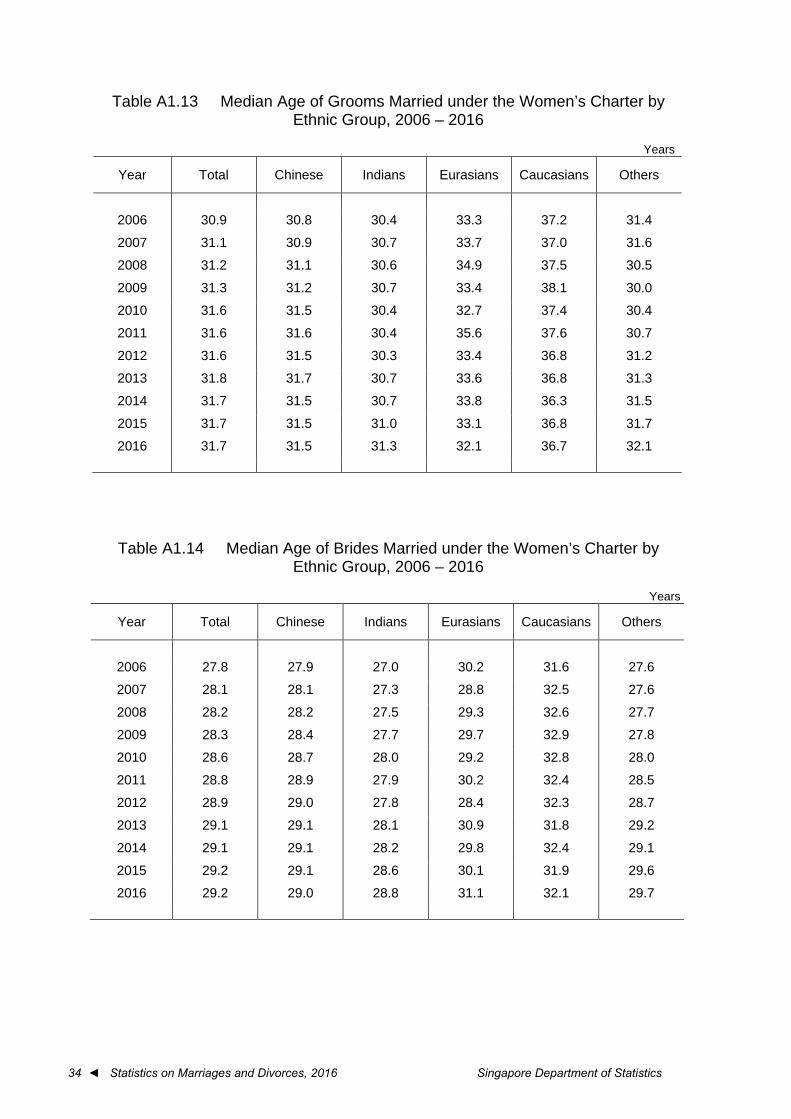
A1.13 Median Age of Grooms Married under the Women’s Charter by Ethnic Group, 2006 – 2016 ..................................................................... 34
A1.14 Median Age of Brides Married under the Women’s Charter by Ethnic Group, 2006 – 2016 ..................................................................... 34
A1.15 Marriages under the Women’s Charter by Ethnic Group of Couple, January – December 2016 .......................................................................... 35
A1.16 Marriages under the Women’s Charter by Previous Marital Status and Ethnic Group of Couple, 2016 .............................................................. 35
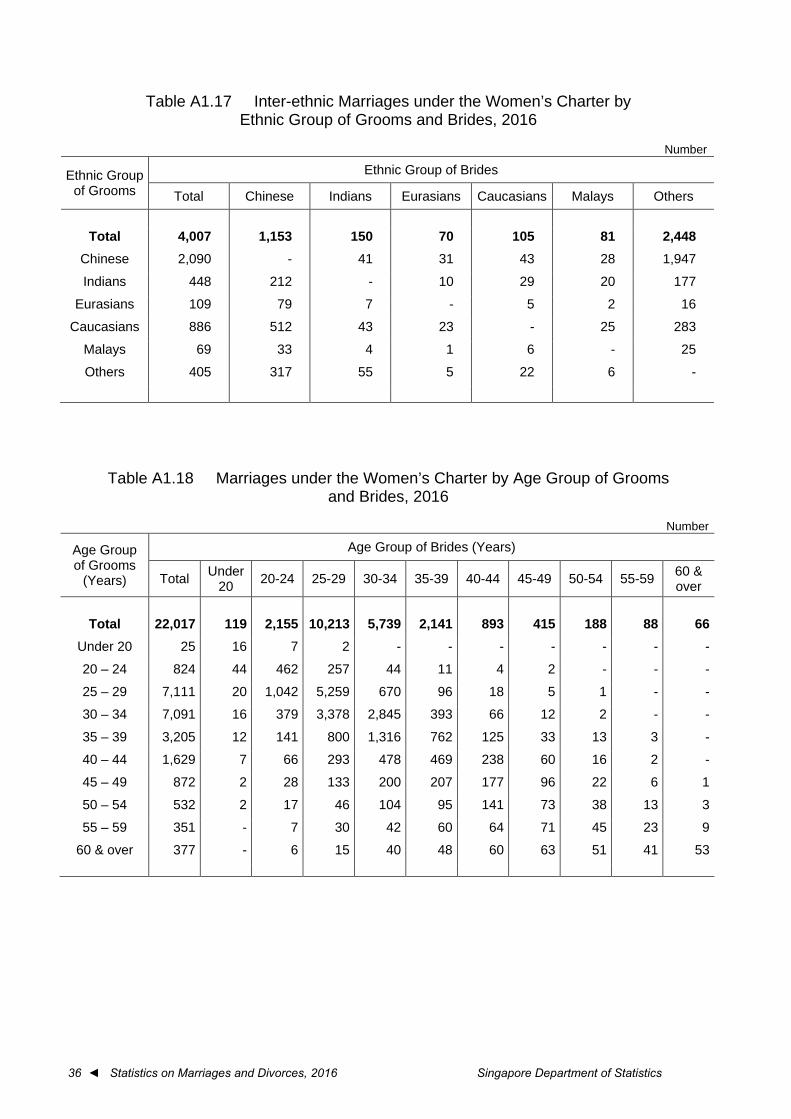
A1.17 Inter-ethnic Marriages under the Women’s Charter by Ethnic Group of Grooms and Brides, 2016 ........................................................................ 36
A1.18 Marriages under the Women’s Charter by Age Group of Grooms and Brides, 2016 ......................................................................................... 36
A1.19 Marriages under the Women’s Charter by Age Group and Ethnic Group of Grooms and Brides, 2016 .................................................. 37
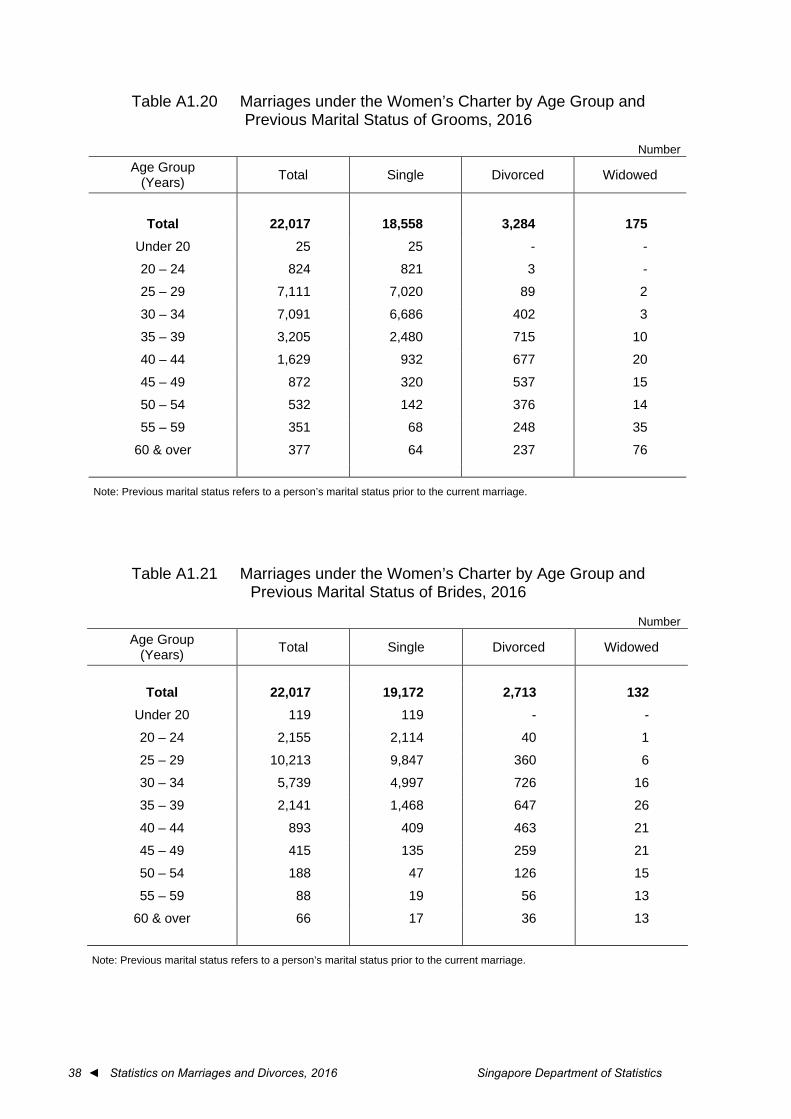
A1.20 Marriages under the Women’s Charter by Age Group and Previous Marital Status of Grooms, 2016 .................................................... 38
A1.21 Marriages under the Women’s Charter by Age Group and Previous Marital Status of Brides, 2016 ....................................................... 38
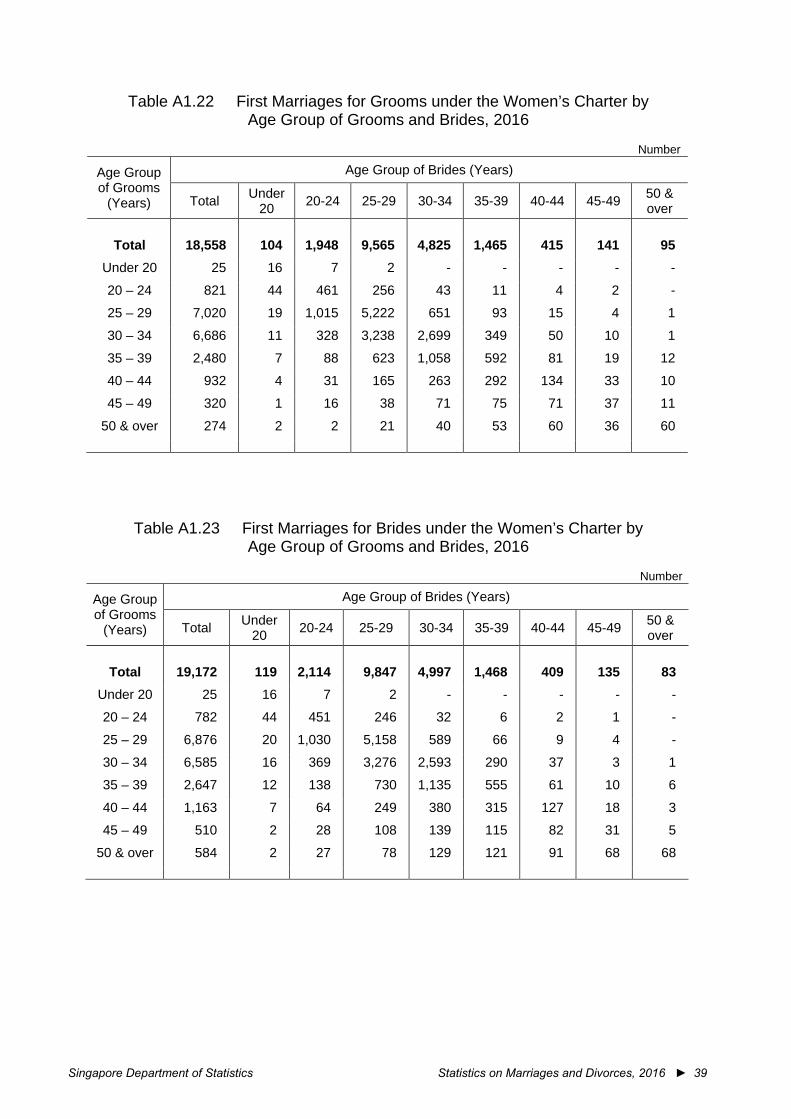
A1.22 First Marriages for Grooms under the Women’s Charter by Age Group of Grooms and Brides, 2016 ..................................................... 39
Singapore Department of Statistics Statistics on Marriages and Divorces, 2016 ► v
LIST OF TABLES (cont’d) Table Page A1.23 First Marriages for Brides under the Women’s Charter by
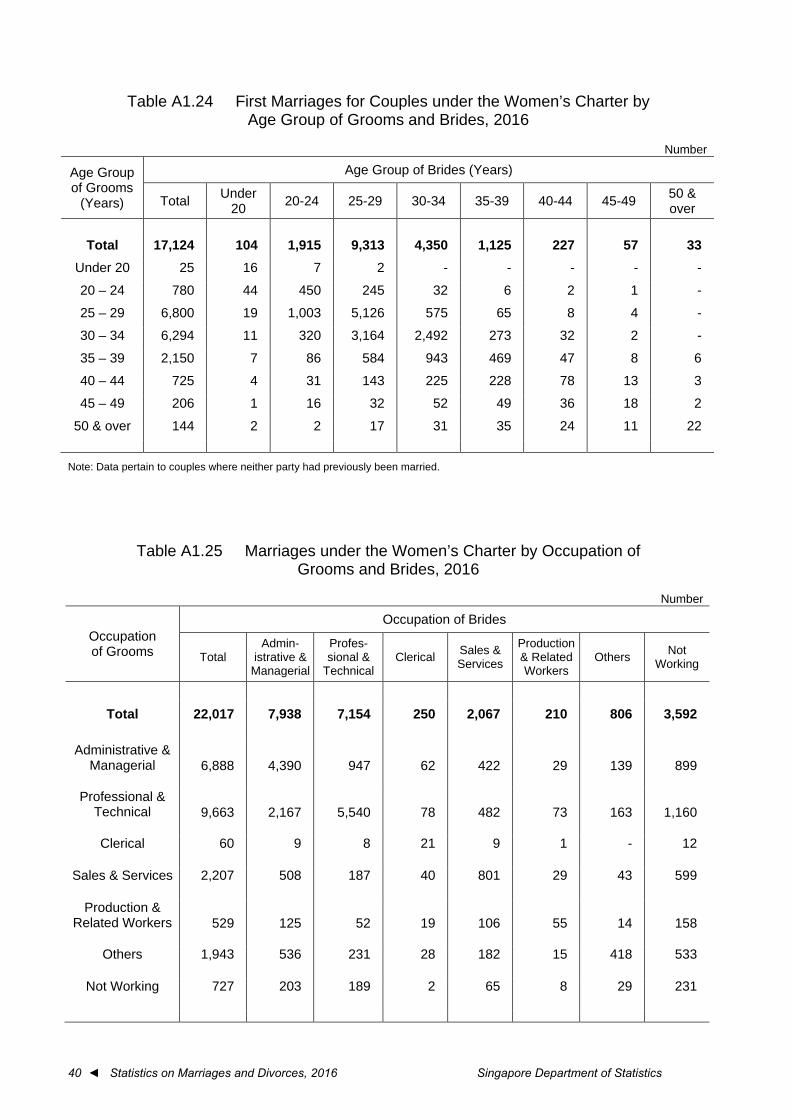
Age Group of Grooms and Brides, 2016 ..................................................... 39 A1.24 First Marriages for Couples under the Women’s Charter by
Age Group of Grooms and Brides, 2016 ..................................................... 40 A1.25 Marriages under the Women’s Charter by Occupation of Grooms
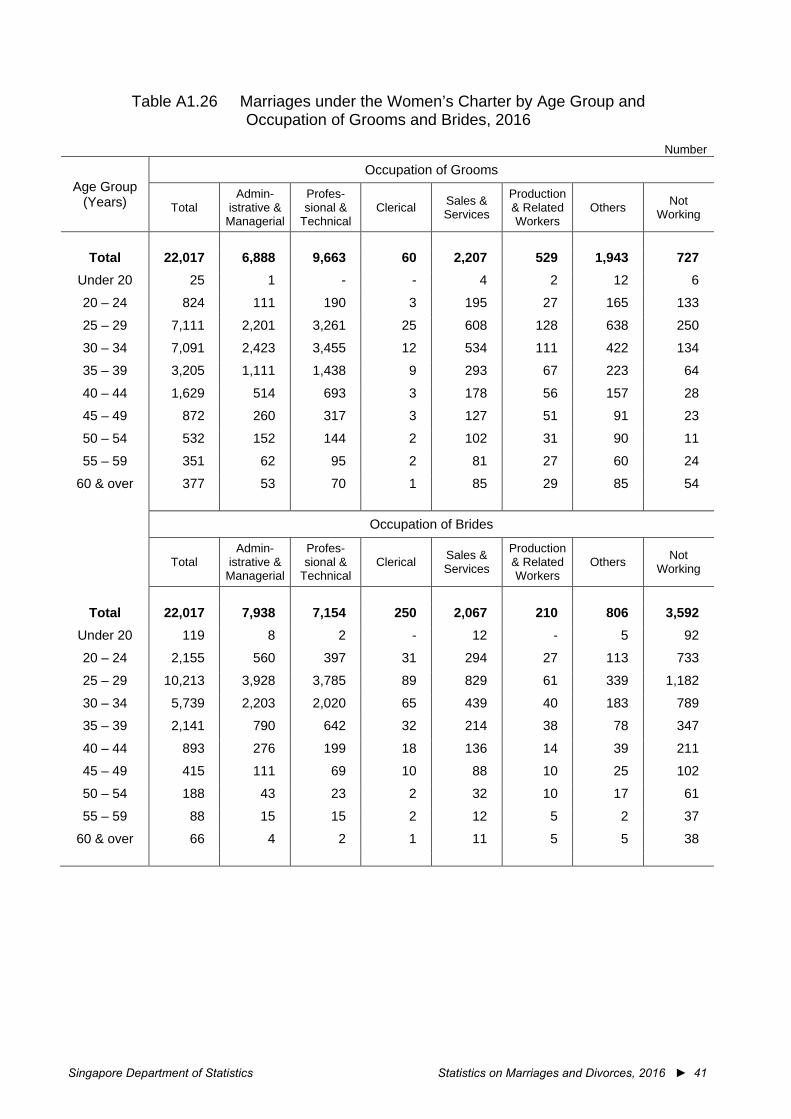
and Brides, 2016 ......................................................................................... 40 A1.26 Marriages under the Women’s Charter by Age Group and
Occupation of Grooms and Brides, 2016 ..................................................... 41 A1.27 Marriages under the Women’s Charter by Age Group and
Educational Qualification of Grooms and Brides, 2016 ............................... 42 A1.28 Marriages under the Women’s Charter by Educational Qualification
of Grooms and Brides, 2016 ........................................................................ 43 A1.29 First Marriages for Couples under the Women’s Charter by
Educational Qualification of Grooms and Brides, 2016 ............................... 43 A1.30 Inter-ethnic Marriages under the Women’s Charter by Educational
Qualification of Grooms and Brides, 2016 ................................................... 44 A1.31 Median Age at First Marriage of Grooms and Brides under the
Women’s Charter by Educational Qualification, 2006 – 2016 ...................... 44 A1.32 Marriages under the Women’s Charter by Religion of Grooms
and Brides, 2016 ......................................................................................... 45 A1.33 Marriages under the Women’s Charter by Ethnic Group of Couple
and Place of Marriage / Marriage Solemnizer, 2016 .................................... 45 A1.34 Resident Marriages under the Women’s Charter by Ethnic Group
of Couple, 2006 – 2016 ............................................................................... 46 A1.35 Marriages under the Women’s Charter by Age Group and
Educational Qualification of Resident Grooms and Brides, 2016 ................ 47
Marriages under the Administration of Muslim Law Act
A1.36 Marriages under the Administration of Muslim Law Act by Ethnic Group of Couple, 1965 – 2016 ......................................................... 48
A1.37 Marriages under the Administration of Muslim Law Act by Age Group of Grooms, 1965 – 2016 ............................................................ 49
A1.38 Marriages under the Administration of Muslim Law Act by Age Group of Brides, 1965 – 2016 .............................................................. 50
A1.39 Median Age of Grooms and Brides Married under the Administration of Muslim Law Act by Marriage Order, 1965 – 2016 .................................... 51
A1.40 Median Age of Grooms Married under the Administration of Muslim Law Act by Ethnic Group, 2006 – 2016 ........................................... 52
A1.41 Median Age of Brides Married under the Administration of Muslim Law Act by Ethnic Group, 2006 – 2016 ........................................... 52
vi ◄ Statistics on Marriages and Divorces, 2016 Singapore Department of Statistics
LIST OF TABLES (cont’d) Table Page A1.42 Marriages under the Administration of Muslim Law Act by
Ethnic Group of Couple, January – December 2016 ................................... 53 A1.43 Marriages under the Administration of Muslim Law Act by Previous
Marital Status and Ethnic Group of Couple, 2016 ........................................ 53 A1.44 Inter-ethnic Marriages under the Administration of Muslim Law Act by
Ethnic Group of Grooms and Brides, 2016 .................................................. 54 A1.45 Marriages under the Administration of Muslim Law Act by
Age Group of Grooms and Brides, 2016 ..................................................... 54 A1.46 Marriages under the Administration of Muslim Law Act by
Age Group and Ethnic Group of Grooms and Brides, 2016 ......................... 55 A1.47 Marriages under the Administration of Muslim Law Act by
Age Group and Previous Marital Status of Grooms, 2016 ........................... 56 A1.48 Marriages under the Administration of Muslim Law Act by
Age Group and Previous Marital Status of Brides, 2016 ............................. 56 A1.49 First Marriages for Grooms under the Administration of Muslim
Law Act by Age Group of Grooms and Brides, 2016 ................................... 57 A1.50 First Marriages for Brides under the Administration of Muslim
Law Act by Age Group of Grooms and Brides, 2016 ................................... 57 A1.51 First Marriages for Couples under the Administration of Muslim
Law Act by Age Group of Grooms and Brides, 2016 ................................... 58 A1.52 Marriages under the Administration of Muslim Law Act by
Occupation of Grooms and Brides, 2016 ..................................................... 58 A1.53 Marriages under the Administration of Muslim Law Act by Age Group
and Occupation of Grooms and Brides, 2016 .............................................. 59 A1.54 Marriages under the Administration of Muslim Law Act by Age Group
and Educational Qualification of Grooms and Brides, 2016 ........................ 60 A1.55 Marriages under the Administration of Muslim Law Act by
Educational Qualification of Grooms and Brides, 2016 ............................... 61 A1.56 First Marriages for Couples under the Administration of Muslim Law
Act by Educational Qualification of Grooms and Brides, 2016 ..................... 61 A1.57 Inter-Ethnic Marriages under the Administration of Muslim Law Act
by Educational Qualification of Grooms and Brides, 2016 ........................... 62 A1.58 Median Age at First Marriage of Grooms and Brides under the
Administration of Muslim Law Act by Educational Qualification, 2006 – 2016 ................................................................................................. 62
A1.59 Resident Marriages under the Administration of Muslim Law Act by Ethnic Group of Couple, 2006 – 2016 ......................................................... 62
A1.60 Marriages under the Administration of Muslim Law Act by Age Group and Educational Qualification of Resident Grooms and Brides, 2016 ......... 64
Singapore Department of Statistics Statistics on Marriages and Divorces, 2016 ► vii
LIST OF TABLES (cont’d) Table Page
Total Divorces
A2.1 Total Divorces, 1980 – 2016 ........................................................................ 67 A2.2 Age-Sex-Specific Divorce Rate, 1980 – 2016 .............................................. 68 A2.3 Total Divorces by Age Group and Sex of Divorcees, 1980 – 2016 .............. 70 A2.4 Total Divorces by Duration of Marriage, 1980 – 2016 ................................. 72
Divorces under the Women’s Charter
A2.5 Divorces under the Women’s Charter by Age Group and Sex of Divorcees, 1980 – 2016 .................................................................... 73
A2.6 Divorces under the Women’s Charter by Duration of Marriage, 1980 – 2016 ................................................................................................. 75
A2.7 Divorces under the Women’s Charter by Ethnic Group of Couple, 1980 – 2016 ................................................................................................. 76
A2.8 Median Age of Male Divorcees under the Women’s Charter by Ethnic Group, 1980 – 2016 .......................................................................... 77
A2.9 Median Age of Female Divorcees under the Women’s Charter by Ethnic Group, 1980 – 2016 .......................................................................... 78
A2.10 Divorces under the Women’s Charter by Ethnic Group of Couple, January – December 2016 .......................................................................... 79
A2.11 Divorces under the Women’s Charter by Previous Marital Status and Ethnic Group of Couple, 2016 .............................................................. 79
A2.12 Inter-ethnic Divorces under the Women’s Charter by Ethnic Group of Male and Female Divorcees, 2016 .......................................................... 80
A2.13 Divorces under the Women’s Charter by Age Group of Male and Female Divorcees, 2016 .............................................................................. 80
A2.14 Divorces under the Women’s Charter by Age Group, Ethnic Group and Sex of Divorcees, 2016 ......................................................................... 81
A2.15 Divorces under the Women’s Charter by Age Group, Previous Marital Status and Sex of Divorcees, 2016 .................................................. 82
A2.16 Divorces under the Women’s Charter by Age at Marriage of Male and Female Divorcees, 2016 .............................................................. 83
A2.17 Divorces under the Women’s Charter by Age at Marriage, Ethnic Group and Sex of Divorcees, 2016 ................................................... 83
A2.18 Divorces under the Women’s Charter by Duration of Marriage and Ethnic Group of Couple, 2016 ..................................................................... 84
A2.19 Divorces under the Women’s Charter by Duration of Marriage and Number of Dependent Children under 18 Years, 2016 ................................ 84
A2.20 Divorces under the Women’s Charter by Age Group and Sex of Divorcees, and Duration of Marriage, 2016 ................................................. 85
viii ◄ Statistics on Marriages and Divorces, 2016 Singapore Department of Statistics
LIST OF TABLES (cont’d)
Table Page A2.21 Divorces under the Women’s Charter by (A) Duration of Marriage;
(B) Plaintiff; and Main Reason for Divorce, 2016 ......................................... 86 A2.22 Divorces under the Women’s Charter by Main Reason for Divorce
and Ethnic Group of Couple, 2016 .............................................................. 86 A2.23 Divorces under the Women’s Charter by Age Group and Sex of
Divorcees, and Main Reason for Divorce, 2016 .......................................... 87
Divorces under the Administration of Muslim Law Act
A2.24 Divorces under the Administration of Muslim Law Act by Age Group and Sex of Divorcees, 1980 – 2016 .......................................... 88
A2.25 Divorces under the Administration of Muslim Law Act by Duration of Marriage, 1980 – 2016 .............................................................. 90
A2.26 Divorces under the Administration of Muslim Law Act by Ethnic Group of Couple, 1980 – 2016 ......................................................... 91
A2.27 Median Age of Male Divorcees under the Administration of Muslim Law Act by Ethnic Group, 1980 – 2016 ........................................... 92
A2.28 Median Age of Female Divorcees under the Administration of Muslim Law Act by Ethnic Group, 1980 – 2016 ........................................... 93
A2.29 Divorces under the Administration of Muslim Law Act by Ethnic Group of Couple, January – December 2016 ................................... 94
A2.30 Divorces under the Administration of Muslim Law Act by Previous Marital Status and Ethnic Group of Couple, 2016 ......................... 94
A2.31 Inter-ethnic Divorces under the Administration of Muslim Law Act by Ethnic Group of Male and Female Divorcees, 2016 .................................... 95
A2.32 Divorces under the Administration of Muslim Law Act by Age Group of Male and Female Divorcees, 2016 ........................................ 95
A2.33 Divorces under the Administration of Muslim Law Act by Age Group, Ethnic Group and Sex of Divorcees, 2016 ............................... 96
A2.34 Divorces under the Administration of Muslim Law Act by Age Group, Previous Marital Status and Sex of Divorcees, 2016 ................................... 97
A2.35 Divorces under the Administration of Muslim Law Act by Age at Marriage of Male and Female Divorcees, 2016 ................................ 98
A2.36 Divorces under the Administration of Muslim Law Act by Age at Marriage, Ethnic Group and Sex of Divorcees, 2016 ....................... 98
A2.37 Divorces under the Administration of Muslim Law Act by Duration of Marriage and Ethnic Group of Couple, 2016 ........................................... 99
A2.38 Divorces under the Administration of Muslim Law Act by Duration of Marriage and Number of Dependent Children under 18 Years, 2016 ............................................................................................................ 99
Singapore Department of Statistics Statistics on Marriages and Divorces, 2016 ► ix
LIST OF TABLES (cont’d) Table Page A2.39 Divorces under the Administration of Muslim Law Act by Age
Group and Sex of Divorcees, and Duration of Marriage, 2016 .................. 100 A2.40 Divorces under the Administration of Muslim Law Act by (A) Duration
of Marriage; (B) Plaintiff; and Main Reason for Divorce, 2016 ................... 101 A2.41 Divorces under the Administration of Muslim Law Act by Main Reason
for Divorce and Ethnic Group of Couple, 2016 .......................................... 101 A2.42 Divorces under the Administration of Muslim Law Act by Age Group and
Sex of Divorcees, and Main Reason for Divorce, 2016 ............................. 102
Annulments under the Women’s Charter
A2.43 Annulments under the Women’s Charter by Age Group and Sex, 1980 – 2016 ............................................................................................... 103
A2.44 Annulments under the Women’s Charter by Duration of Marriage, 1980 – 2016 ............................................................................................... 105
A2.45 Annulments under the Women’s Charter by Ethnic Group of Couple, 1980 – 2016 ................................................................................. 106
A2.46 Annulments under the Women’s Charter by Ethnic Group of Couple, January – December 2016 ........................................................... 107
A2.47 Annulments under the Women’s Charter by Age Group of Husbands and Wives, 2016 ....................................................................... 107
A2.48 Annulments under the Women’s Charter by Duration of Marriage, Age Group and Sex, 2016 ......................................................................... 108
A2.49 Annulments under the Women’s Charter by Previous Marital Status of Husbands and Wives, 2016 ................................................................... 108
Notation - nil na not applicable Note: Longer time series for Tables A1.1 – A2.49 can be downloaded here.

Singapore Department of Statistics Statistics on Marriages and Divorces, 2016 ► xi
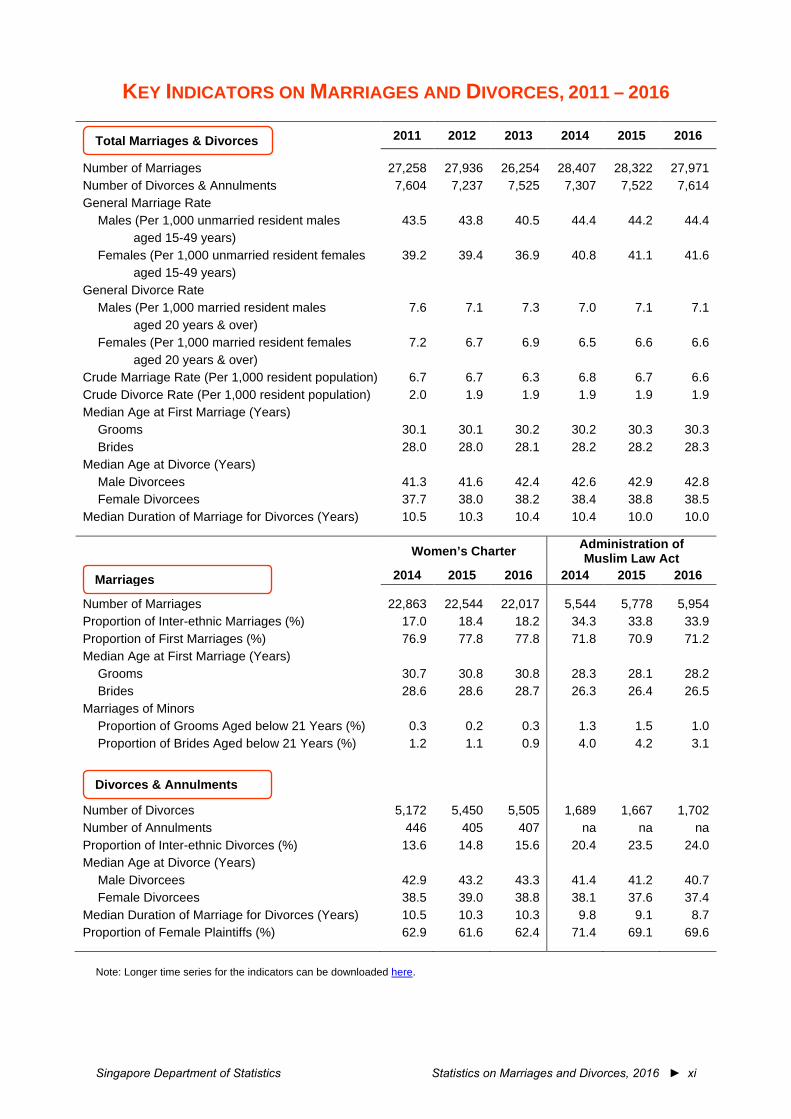
KEY INDICATORS ON MARRIAGES AND DIVORCES, 2011 – 2016
2011 2012 2013 2014 2015 2016
Number of Marriages 27,258 27,936 26,254 28,407 28,322 27,971 Number of Divorces & Annulments 7,604 7,237 7,525 7,307 7,522 7,614 General Marriage Rate
Males (Per 1,000 unmarried resident males aged 15-49 years)
43.5 43.8 40.5 44.4 44.2 44.4
Females (Per 1,000 unmarried resident females aged 15-49 years)
39.2 39.4 36.9 40.8 41.1 41.6
General Divorce Rate Males (Per 1,000 married resident males
aged 20 years & over) 7.6 7.1 7.3 7.0 7.1 7.1
Females (Per 1,000 married resident females aged 20 years & over)
7.2 6.7 6.9 6.5 6.6 6.6
Crude Marriage Rate (Per 1,000 resident population) 6.7 6.7 6.3 6.8 6.7 6.6 Crude Divorce Rate (Per 1,000 resident population) 2.0 1.9 1.9 1.9 1.9 1.9 Median Age at First Marriage (Years)
Grooms 30.1 30.1 30.2 30.2 30.3 30.3 Brides 28.0 28.0 28.1 28.2 28.2 28.3
Median Age at Divorce (Years) Male Divorcees 41.3 41.6 42.4 42.6 42.9 42.8 Female Divorcees 37.7 38.0 38.2 38.4 38.8 38.5
Median Duration of Marriage for Divorces (Years) 10.5 10.3 10.4 10.4 10.0 10.0
Women’s Charter Administration of Muslim Law Act
2014 2015 2016 2014 2015 2016
Number of Marriages 22,863 22,544 22,017 5,544 5,778 5,954 Proportion of Inter-ethnic Marriages (%) 17.0 18.4 18.2 34.3 33.8 33.9 Proportion of First Marriages (%) 76.9 77.8 77.8 71.8 70.9 71.2 Median Age at First Marriage (Years)
Grooms 30.7 30.8 30.8 28.3 28.1 28.2 Brides 28.6 28.6 28.7 26.3 26.4 26.5
Marriages of Minors Proportion of Grooms Aged below 21 Years (%) 0.3 0.2 0.3 1.3 1.5 1.0 Proportion of Brides Aged below 21 Years (%) 1.2 1.1 0.9 4.0 4.2 3.1
Number of Divorces 5,172 5,450 5,505 1,689 1,667 1,702 Number of Annulments 446 405 407 na na na Proportion of Inter-ethnic Divorces (%) 13.6 14.8 15.6 20.4 23.5 24.0 Median Age at Divorce (Years)
Male Divorcees 42.9 43.2 43.3 41.4 41.2 40.7 Female Divorcees 38.5 39.0 38.8 38.1 37.6 37.4
Median Duration of Marriage for Divorces (Years) 10.5 10.3 10.3 9.8 9.1 8.7 Proportion of Female Plaintiffs (%) 62.9 61.6 62.4 71.4 69.1 69.6
Note: Longer time series for the indicators can be downloaded here.
Total Marriages & Divorces
Marriages
Divorces & Annulments


► 1
Part 1 Marriage Trends

Singapore Department of Statistics Statistics on Marriages and Divorces, 2016 ► 3
PART 1 MARRIAGE TRENDS Number of Marriages Registered
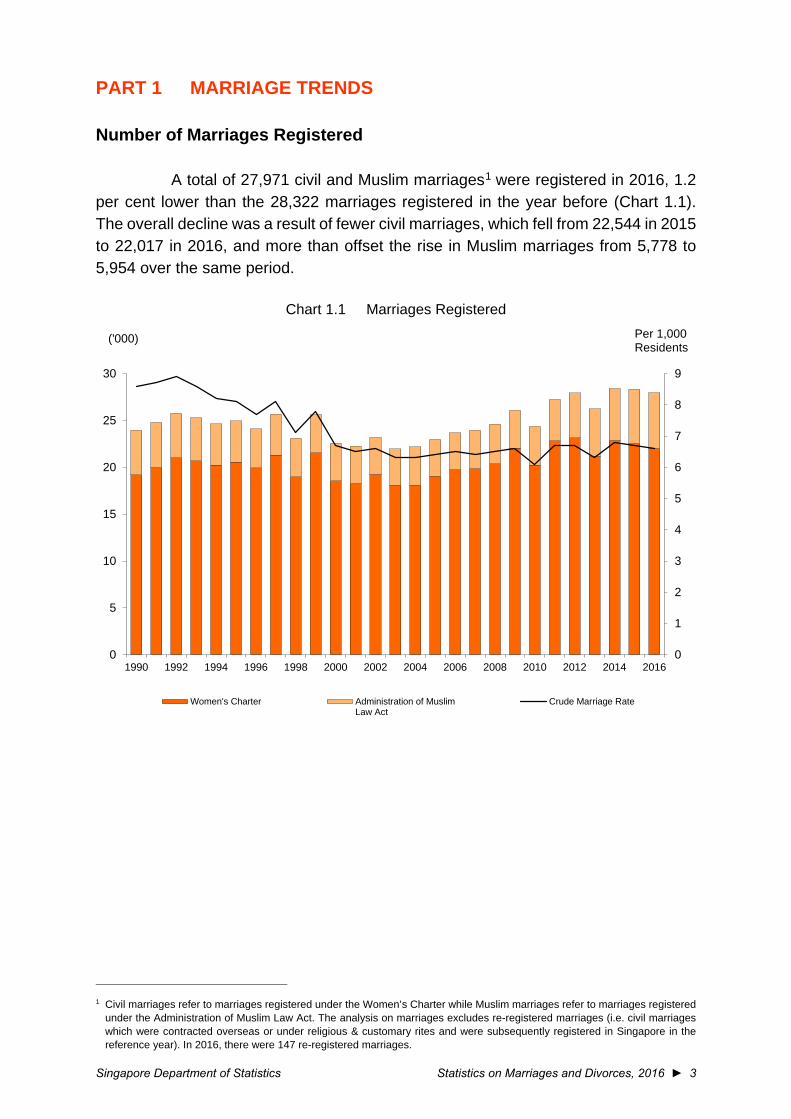
A total of 27,971 civil and Muslim marriages1 were registered in 2016, 1.2 per cent lower than the 28,322 marriages registered in the year before (Chart 1.1). The overall decline was a result of fewer civil marriages, which fell from 22,544 in 2015 to 22,017 in 2016, and more than offset the rise in Muslim marriages from 5,778 to 5,954 over the same period.
Chart 1.1 Marriages Registered
1 Civil marriages refer to marriages registered under the Women’s Charter while Muslim marriages refer to marriages registered
under the Administration of Muslim Law Act. The analysis on marriages excludes re-registered marriages (i.e. civil marriages which were contracted overseas or under religious & customary rites and were subsequently registered in Singapore in the reference year). In 2016, there were 147 re-registered marriages.
0
1
2
3
4
5
6
7
8
9
0
5
10
15
20
25
30
1990 1992 1994 1996 1998 2000 2002 2004 2006 2008 2010 2012 2014 2016
Per 1,000Residents
('000)
Women's Charter Administration of MuslimLaw Act
Crude Marriage Rate
4 ◄ Statistics on Marriages and Divorces, 2016 Singapore Department of Statistics
General Marriage Rate
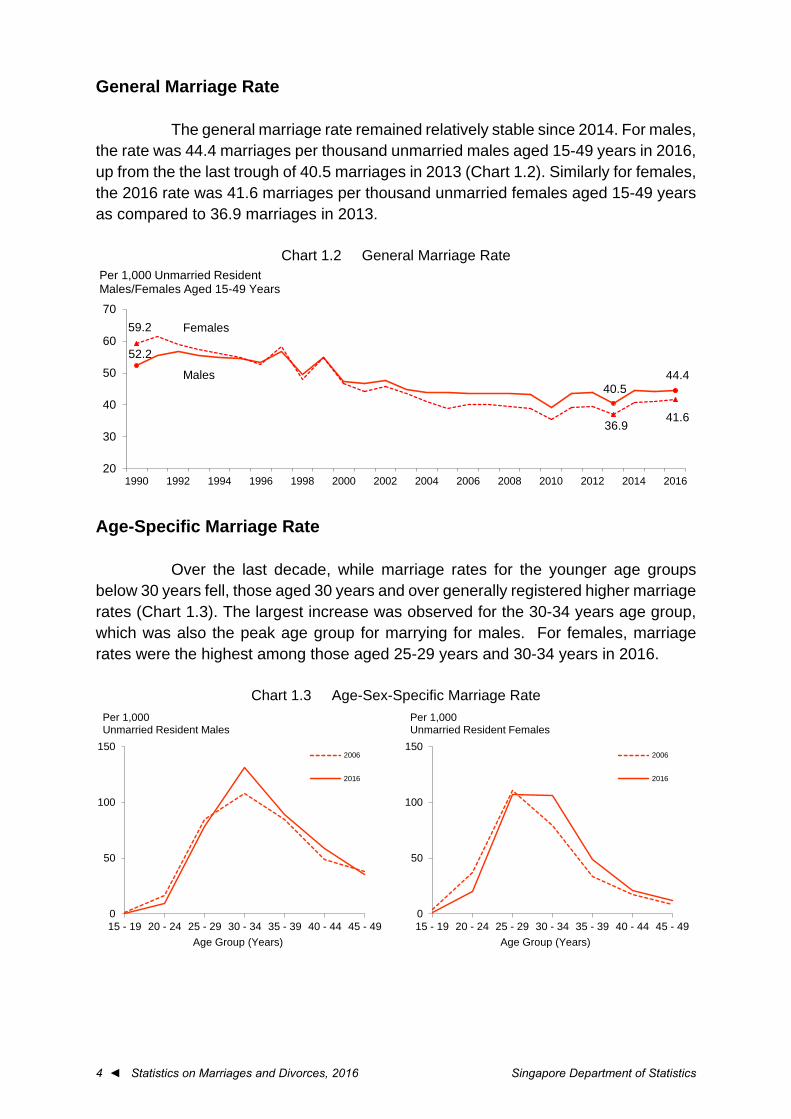
The general marriage rate remained relatively stable since 2014. For males, the rate was 44.4 marriages per thousand unmarried males aged 15-49 years in 2016, up from the the last trough of 40.5 marriages in 2013 (Chart 1.2). Similarly for females, the 2016 rate was 41.6 marriages per thousand unmarried females aged 15-49 years as compared to 36.9 marriages in 2013.
Chart 1.2 General Marriage Rate
Age-Specific Marriage Rate
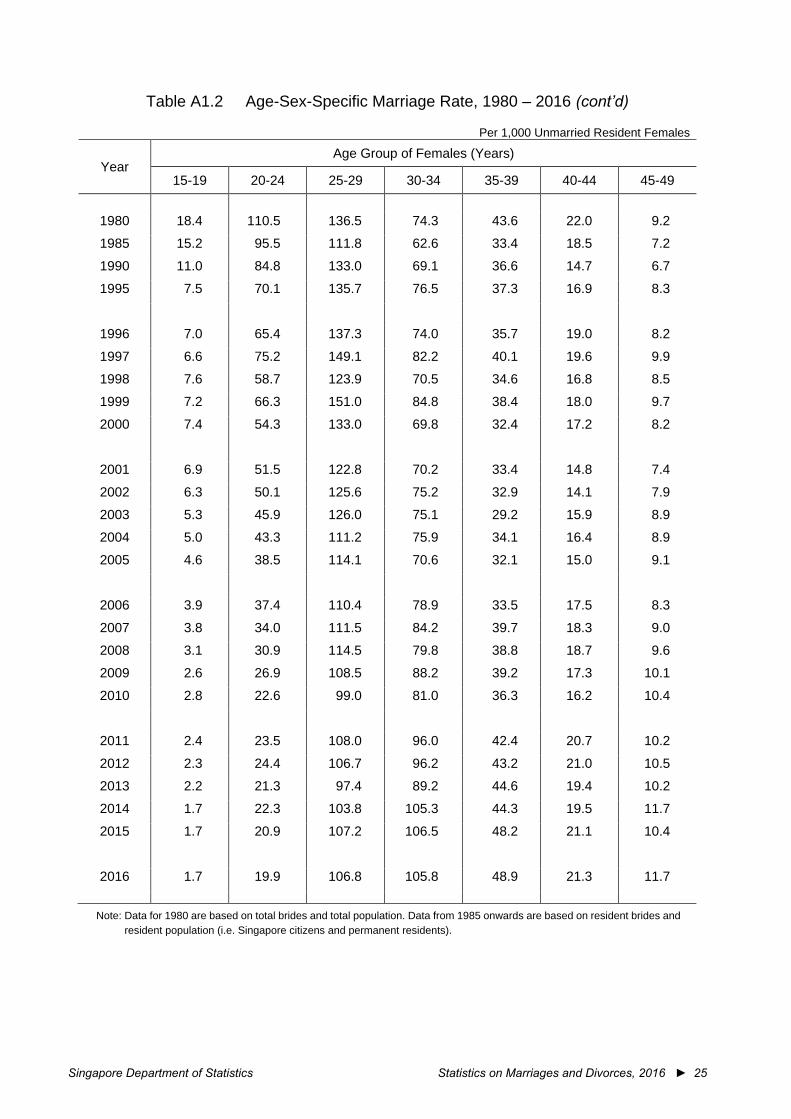
Over the last decade, while marriage rates for the younger age groups below 30 years fell, those aged 30 years and over generally registered higher marriage rates (Chart 1.3). The largest increase was observed for the 30-34 years age group, which was also the peak age group for marrying for males. For females, marriage rates were the highest among those aged 25-29 years and 30-34 years in 2016.
Chart 1.3 Age-Sex-Specific Marriage Rate
52.2
40.544.4
59.2
36.941.6
20
30
40
50
60
70
1990 1992 1994 1996 1998 2000 2002 2004 2006 2008 2010 2012 2014 2016
Per 1,000 Unmarried Resident Males/Females Aged 15-49 Years
Females
Males
0
50
100
150
15 - 19 20 - 24 25 - 29 30 - 34 35 - 39 40 - 44 45 - 49Age Group (Years)
2006
2016
Per 1,000 Unmarried Resident Females
0
50
100
150
15 - 19 20 - 24 25 - 29 30 - 34 35 - 39 40 - 44 45 - 49Age Group (Years)
2006
2016
Per 1,000 Unmarried Resident Males
Singapore Department of Statistics Statistics on Marriages and Divorces, 2016 ► 5
Marriages by Marriage Order
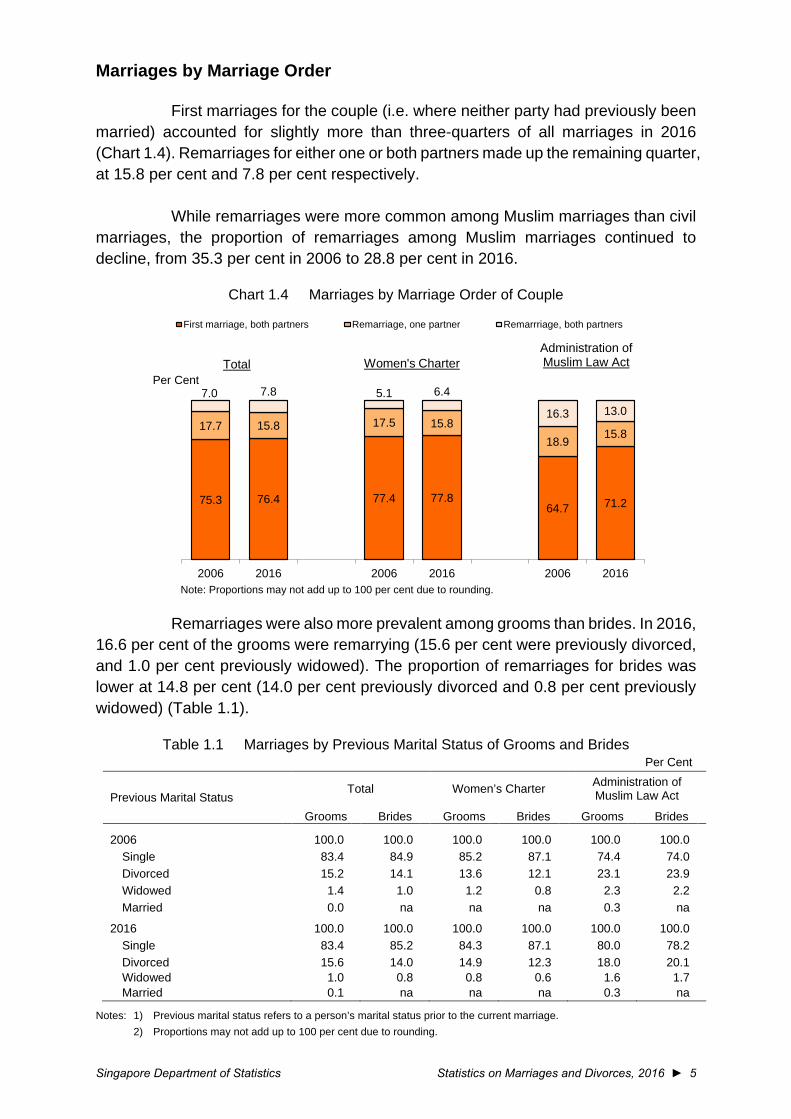
First marriages for the couple (i.e. where neither party had previously been married) accounted for slightly more than three-quarters of all marriages in 2016 (Chart 1.4). Remarriages for either one or both partners made up the remaining quarter, at 15.8 per cent and 7.8 per cent respectively.
While remarriages were more common among Muslim marriages than civil marriages, the proportion of remarriages among Muslim marriages continued to decline, from 35.3 per cent in 2006 to 28.8 per cent in 2016.
Chart 1.4 Marriages by Marriage Order of Couple
Note: Proportions may not add up to 100 per cent due to rounding.
Remarriages were also more prevalent among grooms than brides. In 2016,
16.6 per cent of the grooms were remarrying (15.6 per cent were previously divorced, and 1.0 per cent previously widowed). The proportion of remarriages for brides was lower at 14.8 per cent (14.0 per cent previously divorced and 0.8 per cent previously widowed) (Table 1.1).
Table 1.1 Marriages by Previous Marital Status of Grooms and Brides Per Cent
Previous Marital Status Total Women’s Charter Administration of
Muslim Law Act
Grooms Brides Grooms Brides Grooms Brides
2006 100.0 100.0 100.0 100.0 100.0 100.0 Single 83.4 84.9 85.2 87.1 74.4 74.0 Divorced 15.2 14.1 13.6 12.1 23.1 23.9 Widowed 1.4 1.0 1.2 0.8 2.3 2.2 Married 0.0 na na na 0.3 na
2016 100.0 100.0 100.0 100.0 100.0 100.0 Single 83.4 85.2 84.3 87.1 80.0 78.2 Divorced 15.6 14.0 14.9 12.3 18.0 20.1 Widowed 1.0 0.8 0.8 0.6 1.6 1.7 Married 0.1 na na na 0.3 na
Notes: 1) Previous marital status refers to a person’s marital status prior to the current marriage. 2) Proportions may not add up to 100 per cent due to rounding.
75.3 76.4 77.4 77.864.7 71.2
17.7 15.8 17.5 15.818.9
15.8
7.0 7.8 5.1 6.4
16.3 13.0
2006 2016 2006 2016 2006 2016
Per Cent
First marriage, both partners Remarriage, one partner Remarrriage, both partners
Total Women's CharterAdministration of Muslim Law Act
6 ◄ Statistics on Marriages and Divorces, 2016 Singapore Department of Statistics
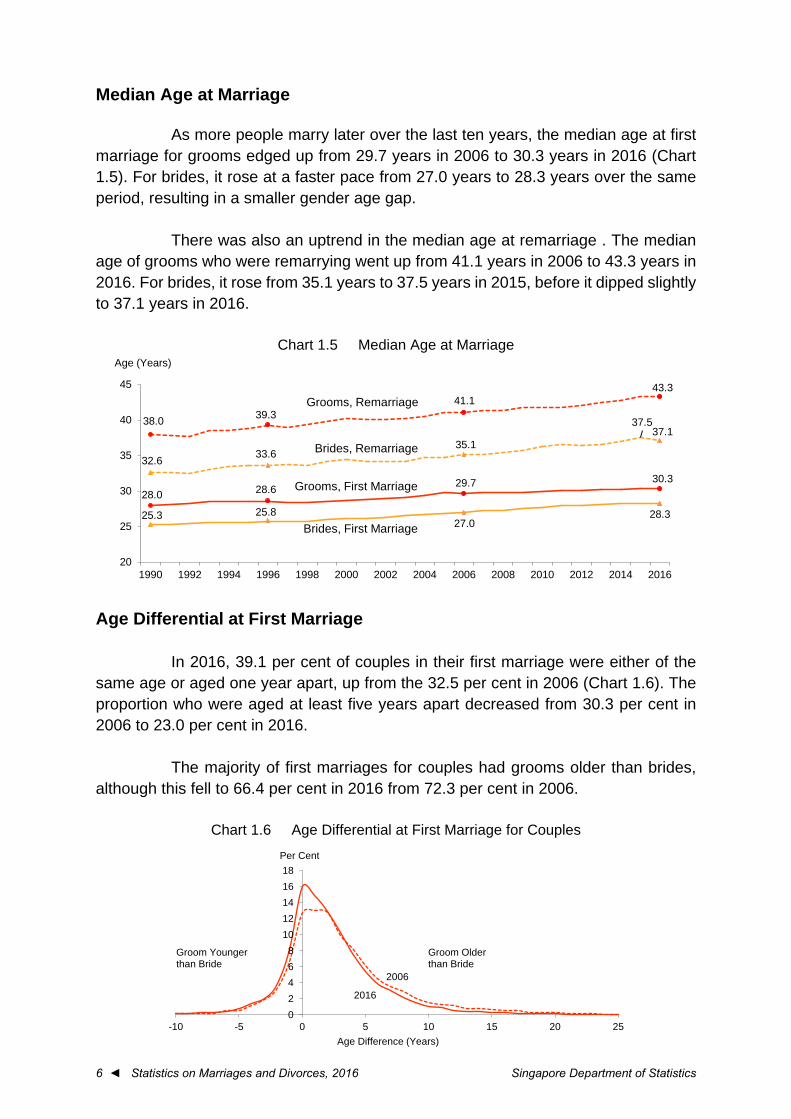
Median Age at Marriage
As more people marry later over the last ten years, the median age at first marriage for grooms edged up from 29.7 years in 2006 to 30.3 years in 2016 (Chart 1.5). For brides, it rose at a faster pace from 27.0 years to 28.3 years over the same period, resulting in a smaller gender age gap.
There was also an uptrend in the median age at remarriage . The median age of grooms who were remarrying went up from 41.1 years in 2006 to 43.3 years in 2016. For brides, it rose from 35.1 years to 37.5 years in 2015, before it dipped slightly to 37.1 years in 2016.
Chart 1.5 Median Age at Marriage
Age Differential at First Marriage
In 2016, 39.1 per cent of couples in their first marriage were either of the same age or aged one year apart, up from the 32.5 per cent in 2006 (Chart 1.6). The proportion who were aged at least five years apart decreased from 30.3 per cent in 2006 to 23.0 per cent in 2016.
The majority of first marriages for couples had grooms older than brides,
although this fell to 66.4 per cent in 2016 from 72.3 per cent in 2006.
Chart 1.6 Age Differential at First Marriage for Couples
28.0 28.6 29.7 30.3
25.3 25.827.0
28.3
38.0 39.341.1
43.3
32.6 33.635.1
37.537.1
20
25
30
35
40
45
1990 1992 1994 1996 1998 2000 2002 2004 2006 2008 2010 2012 2014 2016
Age (Years)
Grooms, Remarriage
Brides, Remarriage
Grooms, First Marriage
Brides, First Marriage
2006
2016
02468
1012141618
-10 -5 0 5 10 15 20 25
Per Cent
Age Difference (Years)
Groom Younger than Bride
Groom Older than Bride
Singapore Department of Statistics Statistics on Marriages and Divorces, 2016 ► 7
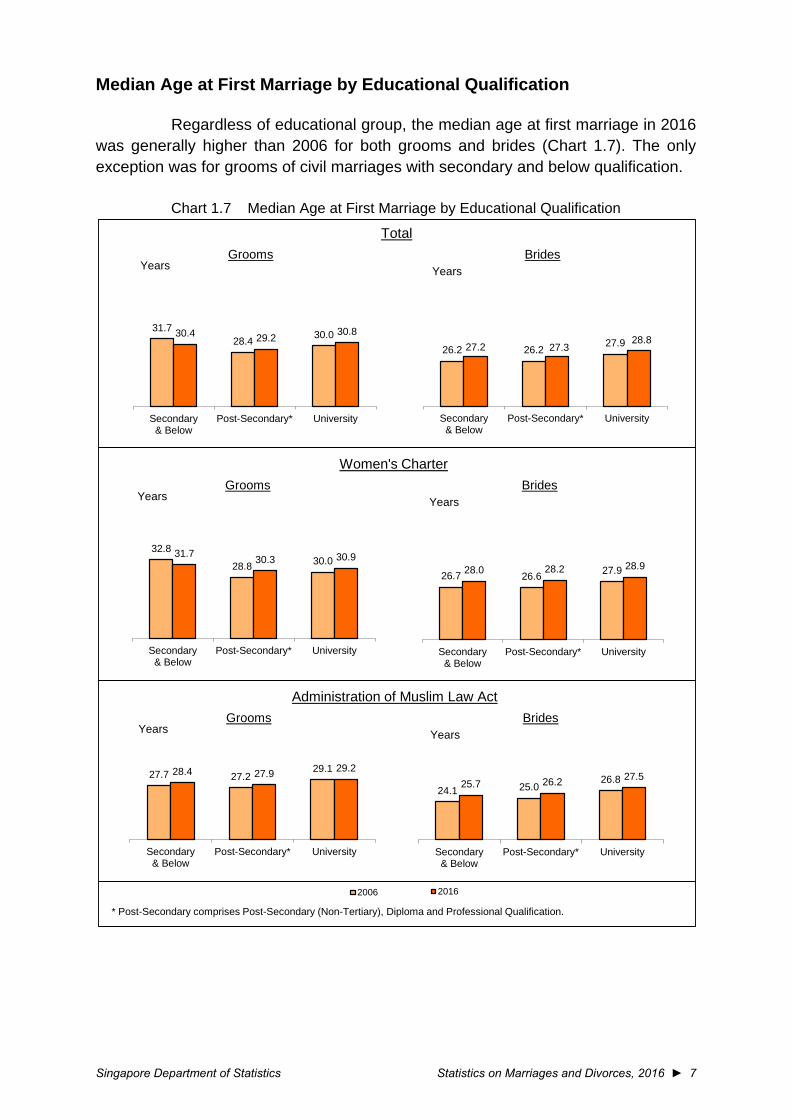
Median Age at First Marriage by Educational Qualification
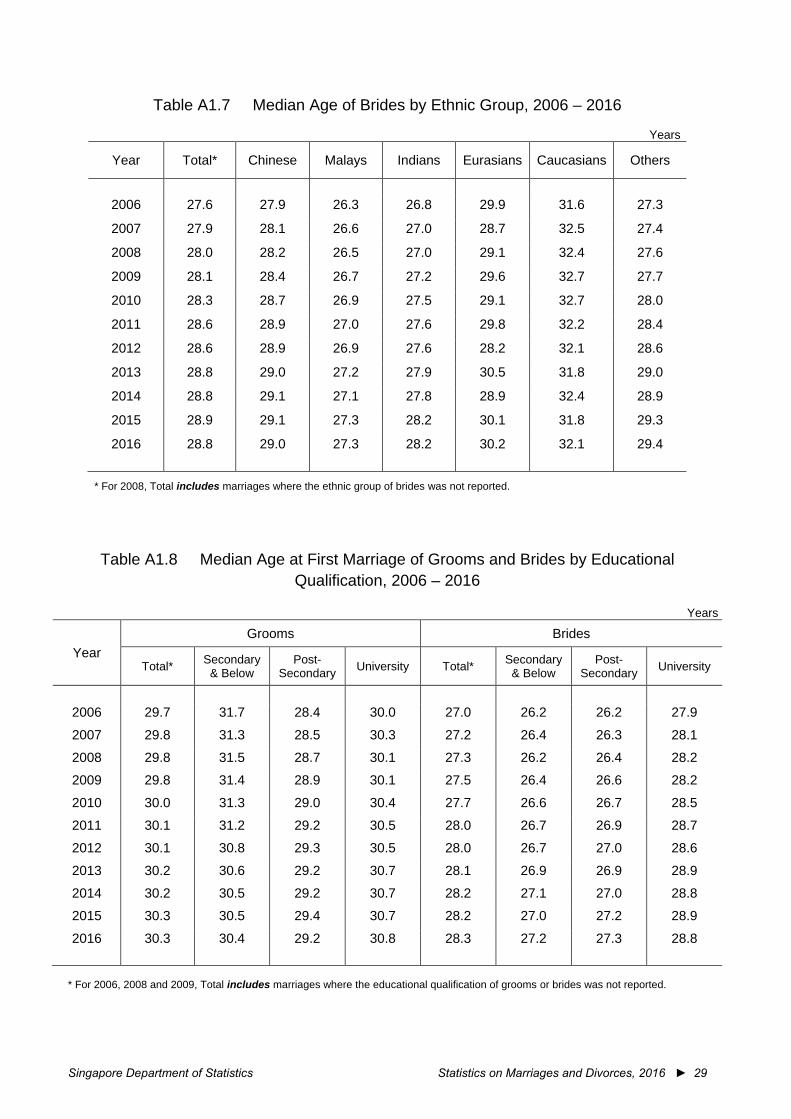
Regardless of educational group, the median age at first marriage in 2016 was generally higher than 2006 for both grooms and brides (Chart 1.7). The only exception was for grooms of civil marriages with secondary and below qualification.
Chart 1.7 Median Age at First Marriage by Educational Qualification
* Post-Secondary comprises Post-Secondary (Non-Tertiary), Diploma and Professional Qualification.
YearsYearsGrooms Brides
Total
YearsYearsGrooms Brides
Women's Charter
GroomsYears Years
BridesAdministration of Muslim Law Act
24.1 25.026.825.7 26.2 27.5
Secondary& Below
Post-Secondary* University
2016
32.8
28.8 30.031.7 30.3 30.9
Secondary& Below
Post-Secondary* University
26.7 26.6 27.928.0 28.2 28.9
Secondary& Below
Post-Secondary* University
31.728.4 30.030.4 29.2 30.8
Secondary& Below
Post-Secondary* University
26.2 26.227.927.2 27.3
28.8
Secondary& Below
Post-Secondary* University
27.7 27.229.128.4 27.9 29.2
Secondary& Below
Post-Secondary* University
2006
8 ◄ Statistics on Marriages and Divorces, 2016 Singapore Department of Statistics
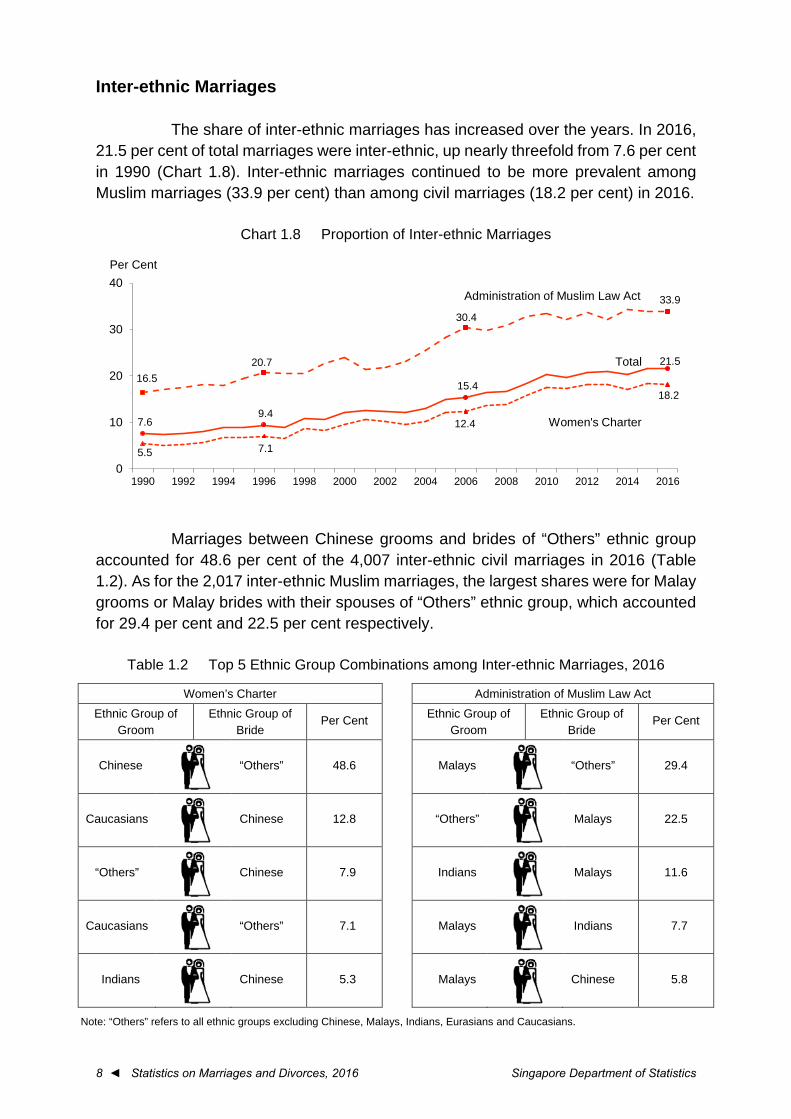
Inter-ethnic Marriages
The share of inter-ethnic marriages has increased over the years. In 2016, 21.5 per cent of total marriages were inter-ethnic, up nearly threefold from 7.6 per cent in 1990 (Chart 1.8). Inter-ethnic marriages continued to be more prevalent among Muslim marriages (33.9 per cent) than among civil marriages (18.2 per cent) in 2016.
Chart 1.8 Proportion of Inter-ethnic Marriages
Marriages between Chinese grooms and brides of “Others” ethnic group accounted for 48.6 per cent of the 4,007 inter-ethnic civil marriages in 2016 (Table 1.2). As for the 2,017 inter-ethnic Muslim marriages, the largest shares were for Malay grooms or Malay brides with their spouses of “Others” ethnic group, which accounted for 29.4 per cent and 22.5 per cent respectively.
Table 1.2 Top 5 Ethnic Group Combinations among Inter-ethnic Marriages, 2016
Women’s Charter Administration of Muslim Law Act Ethnic Group of
Groom Ethnic Group of
Bride Per Cent Ethnic Group of
Groom Ethnic Group of
Bride Per Cent
Chinese
“Others” 48.6
Malays
“Others” 29.4
Caucasians
Chinese 12.8
“Others”
Malays
22.5
“Others”
Chinese 7.9
Indians
Malays 11.6
Caucasians
“Others” 7.1
Malays
Indians 7.7
Indians
Chinese 5.3
Malays
Chinese 5.8
Note: “Others” refers to all ethnic groups excluding Chinese, Malays, Indians, Eurasians and Caucasians.
7.69.4
15.4
21.5
5.5 7.1
12.4
18.216.5
20.7
30.433.9
0
10
20
30
40
1990 1992 1994 1996 1998 2000 2002 2004 2006 2008 2010 2012 2014 2016
Per Cent
Administration of Muslim Law Act
Total
Women's Charter
Singapore Department of Statistics Statistics on Marriages and Divorces, 2016 ► 9
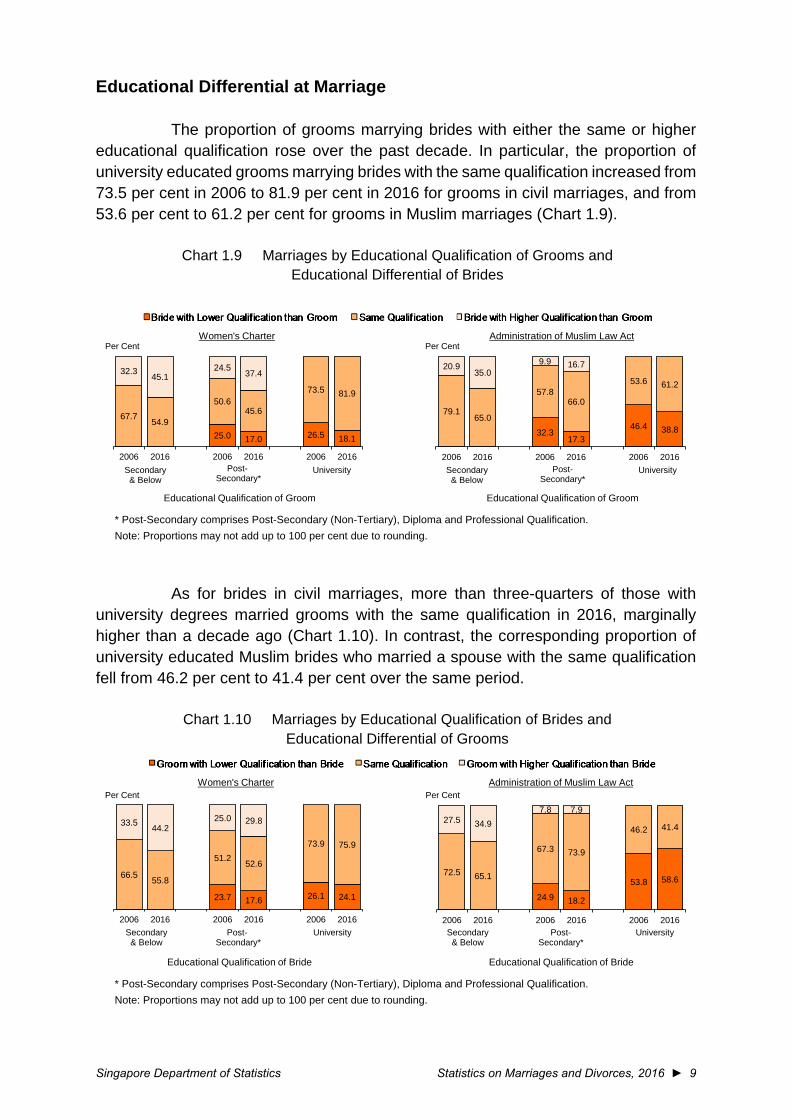
Educational Differential at Marriage
The proportion of grooms marrying brides with either the same or higher educational qualification rose over the past decade. In particular, the proportion of university educated grooms marrying brides with the same qualification increased from 73.5 per cent in 2006 to 81.9 per cent in 2016 for grooms in civil marriages, and from 53.6 per cent to 61.2 per cent for grooms in Muslim marriages (Chart 1.9).
Chart 1.9 Marriages by Educational Qualification of Grooms and Educational Differential of Brides
* Post-Secondary comprises Post-Secondary (Non-Tertiary), Diploma and Professional Qualification. Note: Proportions may not add up to 100 per cent due to rounding.
As for brides in civil marriages, more than three-quarters of those with university degrees married grooms with the same qualification in 2016, marginally higher than a decade ago (Chart 1.10). In contrast, the corresponding proportion of university educated Muslim brides who married a spouse with the same qualification fell from 46.2 per cent to 41.4 per cent over the same period.
Chart 1.10 Marriages by Educational Qualification of Brides and Educational Differential of Grooms
* Post-Secondary comprises Post-Secondary (Non-Tertiary), Diploma and Professional Qualification. Note: Proportions may not add up to 100 per cent due to rounding.
25.0 17.0 26.5 18.1
67.7 54.9
50.645.6
73.5 81.9
32.3 45.124.5 37.4
2006 2016 2006 2016 2006 2016
Women's Charter
Secondary& Below
University
Per Cent
Educational Qualification of Groom
Post-Secondary*
32.317.3
46.4 38.8
79.165.0
57.866.0
53.6 61.2
20.935.0
9.9 16.7
2006 2016 2006 2016 2006 2016
Administration of Muslim Law ActPer Cent
Educational Qualification of Groom
Secondary& Below
Post-Secondary*
University
23.7 17.6 26.1 24.1
66.5 55.8
51.2 52.6
73.9 75.9
33.5 44.225.0 29.8
2006 2016 2006 2016 2006 2016
Women's Charter
Educational Qualification of Bride
24.9 18.2
53.8 58.672.5 65.1
67.3 73.9
46.2 41.427.5 34.9
7.8 7.9
2006 2016 2006 2016 2006 2016
Administration of Muslim Law Act
Educational Qualification of Bride
Secondary& Below
Post-Secondary*
University Secondary& Below
Post-Secondary*
University
Per Cent Per Cent
10 ◄ Statistics on Marriages and Divorces, 2016 Singapore Department of Statistics
Marriages of Minors
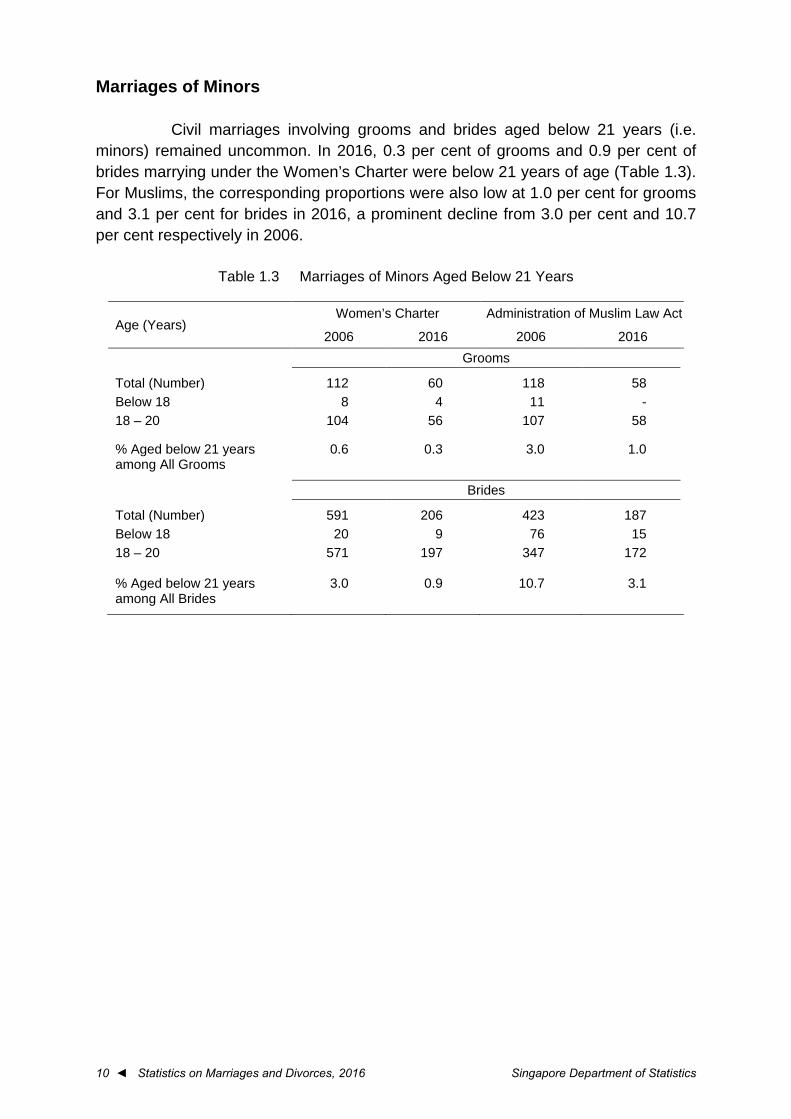
Civil marriages involving grooms and brides aged below 21 years (i.e. minors) remained uncommon. In 2016, 0.3 per cent of grooms and 0.9 per cent of brides marrying under the Women’s Charter were below 21 years of age (Table 1.3). For Muslims, the corresponding proportions were also low at 1.0 per cent for grooms and 3.1 per cent for brides in 2016, a prominent decline from 3.0 per cent and 10.7 per cent respectively in 2006.
Table 1.3 Marriages of Minors Aged Below 21 Years
Age (Years) Women’s Charter Administration of Muslim Law Act
2006 2016 2006 2016
Grooms
Total (Number) 112 60 118 58 Below 18 8 4 11 - 18 – 20 104 56 107 58 % Aged below 21 years among All Grooms
0.6 0.3 3.0 1.0
Brides
Total (Number) 591 206 423 187 Below 18 20 9 76 15 18 – 20 571 197 347 172 % Aged below 21 years among All Brides
3.0 0.9 10.7 3.1
► 11
Part 2 Divorce and Annulment
Trends

Singapore Department of Statistics Statistics on Marriages and Divorces, 2016 ► 13
PART 2 DIVORCE AND ANNULMENT TRENDS Number of Marital Dissolutions
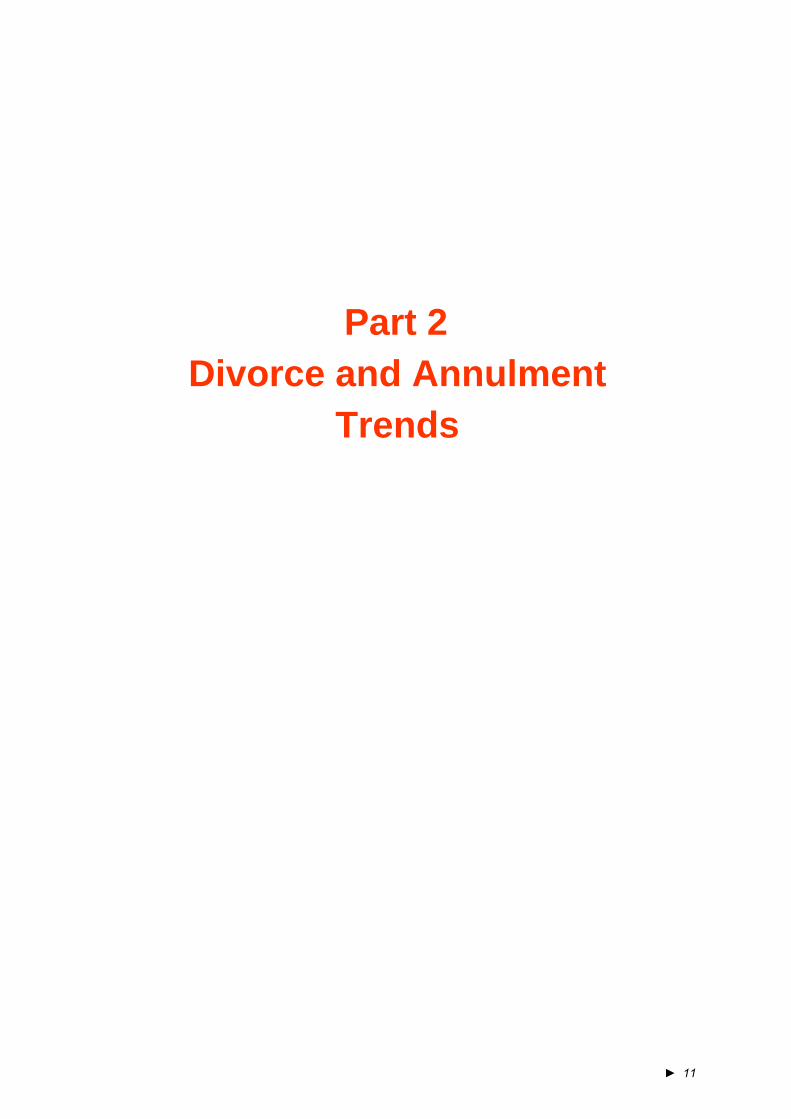
A total of 7,614 marriages ended in a divorce or an annulment in 2016, up 1.2 per cent from the 7,522 marital dissolutions in the previous year (Chart 2.1). Civil marital dissolutions rose from 5,855 in 2015 to 5,912 in 2016. Similarly, Muslim divorces also grew from 1,667 to 1,702 over the same period.
Chart 2.1 Marital Dissolutions
0.0
0.4
0.8
1.2
1.6
2.0
2.4
0
1
2
3
4
5
6
7
8
1990 1992 1994 1996 1998 2000 2002 2004 2006 2008 2010 2012 2014 2016
Per 1,000Residents
('000)
Women's Charter Administration of Muslim Law Act Crude Divorce Rate
14 ◄ Statistics on Marriages and Divorces, 2016 Singapore Department of Statistics
General Divorce Rate
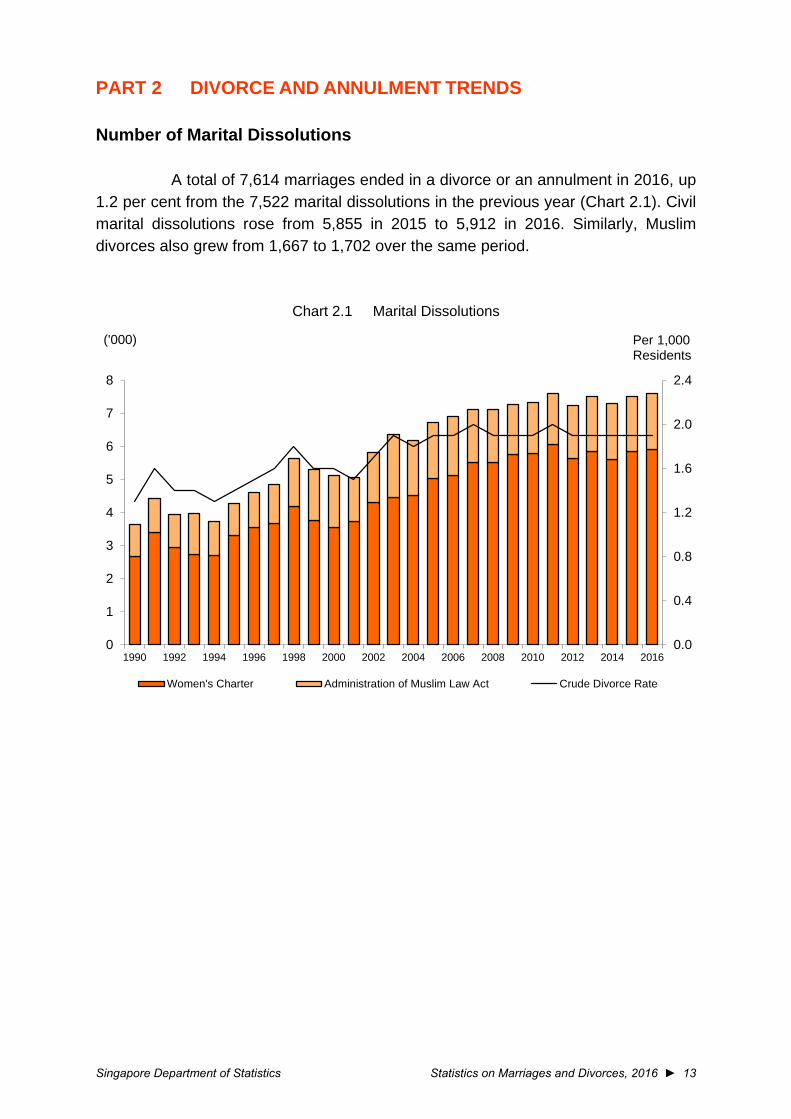
The general divorce rate in 2016 was unchanged from 2015. There were 7.1 male divorcees for every thousand married resident males aged 20 years and over (Chart 2.2). The corresponding rate for females was 6.6.
Chart 2.2 General Divorce Rate
Age-Specific Divorce Rate
Divorce rates tended to be higher among younger married persons than their older counterparts (Chart 2.3). Nonetheless, the differences narrowed over the last decade as divorce rates generally dropped for younger married residents aged below 35 years, while the rates rose for those aged 35 years and over.
Chart 2.3 Age-Sex-Specific Divorce Rates
7.1 7.1
6.16.6 6.6
0
2
4
6
8
10
1990 1992 1994 1996 1998 2000 2002 2004 2006 2008 2010 2012 2014 2016
Per 1,000 Married Resident Males/Females Aged 20 Years & Over
FemaleFemales
Males
0
10
20
30
40
50
20 - 24 25 - 29 30 - 34 35 - 39 40 - 44 45 - 49 50 &Over
Age Group (Years)
2006
2016
Per 1,000 Married Resident Males
0
10
20
30
40
50
20 - 24 25 - 29 30 - 34 35 - 39 40 - 44 45 - 49 50 &OverAge Group (Years)
2006
2016
Per 1,000 Married Resident Females
Singapore Department of Statistics Statistics on Marriages and Divorces, 2016 ► 15
Age at Divorce
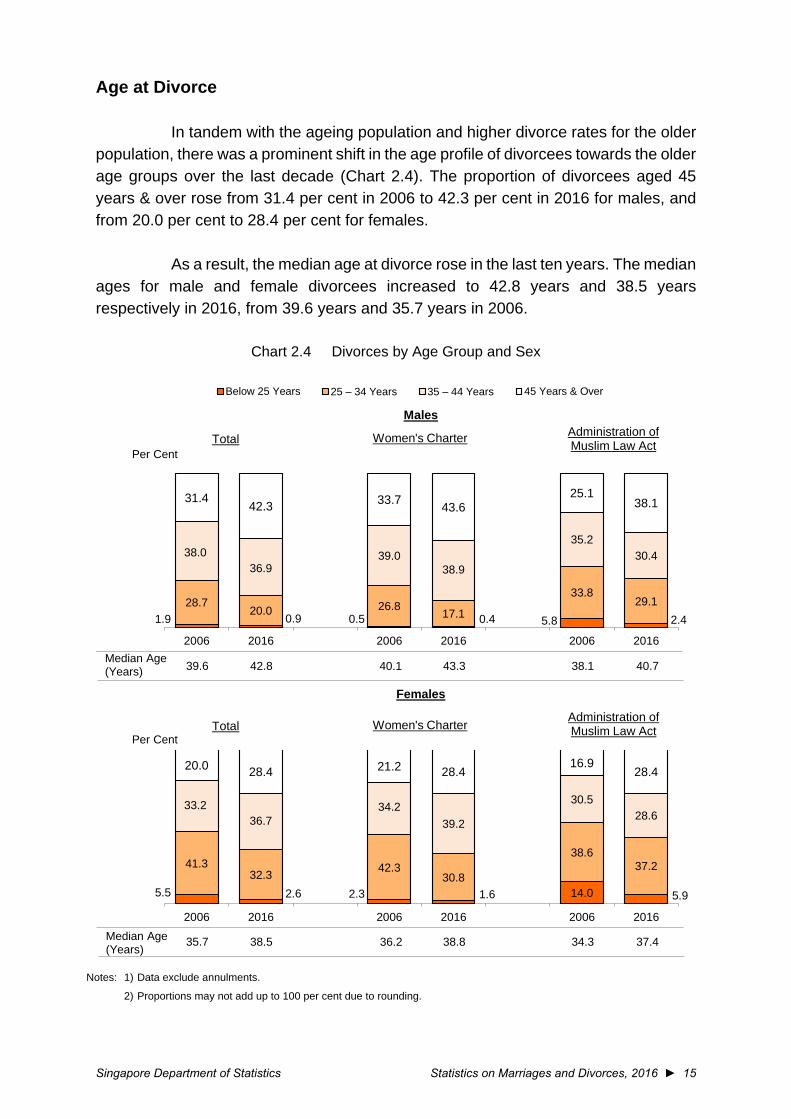
In tandem with the ageing population and higher divorce rates for the older population, there was a prominent shift in the age profile of divorcees towards the older age groups over the last decade (Chart 2.4). The proportion of divorcees aged 45 years & over rose from 31.4 per cent in 2006 to 42.3 per cent in 2016 for males, and from 20.0 per cent to 28.4 per cent for females.
As a result, the median age at divorce rose in the last ten years. The median
ages for male and female divorcees increased to 42.8 years and 38.5 years respectively in 2016, from 39.6 years and 35.7 years in 2006.
Chart 2.4 Divorces by Age Group and Sex
Notes: 1) Data exclude annulments.
2) Proportions may not add up to 100 per cent due to rounding.
1.9 0.9 0.5 0.4 5.8 2.428.7
20.0 26.8 17.1
33.829.1
38.036.9
39.038.9
35.230.4
31.442.3 33.7 43.6
25.138.1
2006 2016 2006 2016 2006 2016
Per Cent
Below 25 Years 25 – 34 Years 35 – 44 Years 45 Years & Over
Total Women's Charter Administration of Muslim Law Act
Males
5.5 2.6 2.3 1.6 14.0 5.9
41.332.3 42.3
30.8
38.637.2
33.236.7
34.239.2
30.528.6
20.0 28.4 21.2 28.416.9
28.4
2006 2016 2006 2016 2006 2016
Per CentTotal Women's Charter Administration of
Muslim Law Act
Females
Median Age (Years) 39.6 42.8 40.1 43.3 38.1 40.7
Median Age (Years)
35.7 38.5 36.2 38.8 34.3 37.4
16 ◄ Statistics on Marriages and Divorces, 2016 Singapore Department of Statistics
Median Marriage Duration
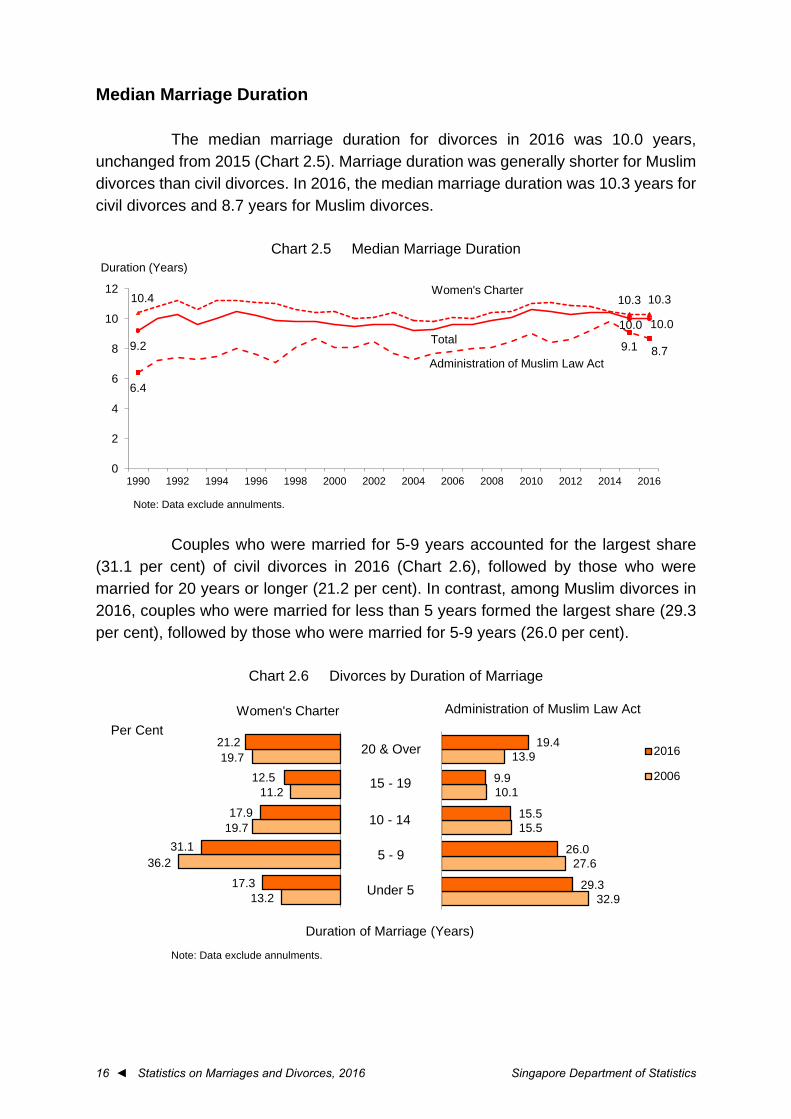
The median marriage duration for divorces in 2016 was 10.0 years, unchanged from 2015 (Chart 2.5). Marriage duration was generally shorter for Muslim divorces than civil divorces. In 2016, the median marriage duration was 10.3 years for civil divorces and 8.7 years for Muslim divorces.
Chart 2.5 Median Marriage Duration
Note: Data exclude annulments.
Couples who were married for 5-9 years accounted for the largest share
(31.1 per cent) of civil divorces in 2016 (Chart 2.6), followed by those who were married for 20 years or longer (21.2 per cent). In contrast, among Muslim divorces in 2016, couples who were married for less than 5 years formed the largest share (29.3 per cent), followed by those who were married for 5-9 years (26.0 per cent).
Chart 2.6 Divorces by Duration of Marriage
Note: Data exclude annulments.
10.4 10.3 10.3
6.4
9.1 8.79.2
10.0 10.0
0
2
4
6
8
10
12
1990 1992 1994 1996 1998 2000 2002 2004 2006 2008 2010 2012 2014 2016
Duration (Years)
Total
Women's Charter
Administration of Muslim Law Act
Duration of Marriage (Years)
13.2
36.2
19.7
11.2
19.7
17.3
31.1
17.9
12.5
21.2
Women's Charter Per Cent
32.9
27.6
15.5
10.1
13.9
29.3
26.0
15.5
9.9
19.4
Administration of Muslim Law Act
2016
2006
20 & Over
15 - 19
10 - 14
5 - 9
Under 5
Singapore Department of Statistics Statistics on Marriages and Divorces, 2016 ► 17
Main Reasons for Divorce and Plaintiff Divorces under the Women’s Charter
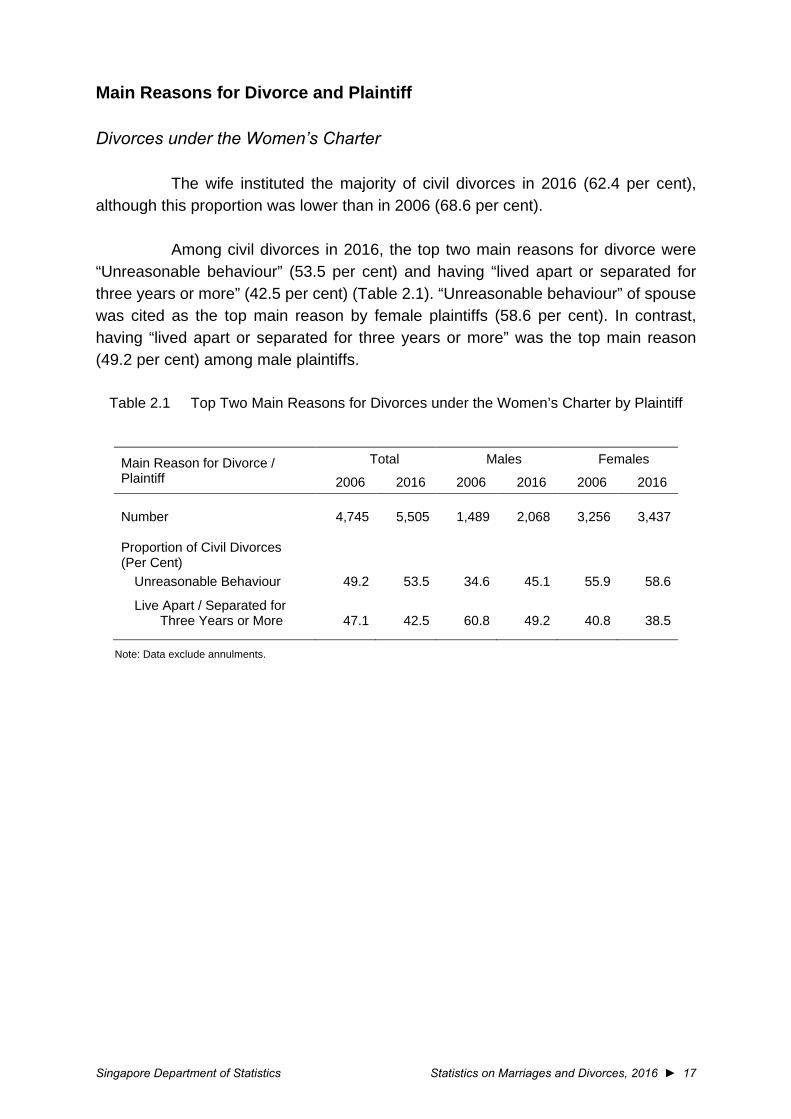
The wife instituted the majority of civil divorces in 2016 (62.4 per cent), although this proportion was lower than in 2006 (68.6 per cent).
Among civil divorces in 2016, the top two main reasons for divorce were
“Unreasonable behaviour” (53.5 per cent) and having “lived apart or separated for three years or more” (42.5 per cent) (Table 2.1). “Unreasonable behaviour” of spouse was cited as the top main reason by female plaintiffs (58.6 per cent). In contrast, having “lived apart or separated for three years or more” was the top main reason (49.2 per cent) among male plaintiffs.
Table 2.1 Top Two Main Reasons for Divorces under the Women’s Charter by Plaintiff
Main Reason for Divorce / Plaintiff
Total Males Females
2006 2016 2006 2016 2006 2016 Number 4,745 5,505 1,489 2,068 3,256 3,437 Proportion of Civil Divorces (Per Cent)
Unreasonable Behaviour 49.2 53.5 34.6 45.1 55.9 58.6
Live Apart / Separated for Three Years or More 47.1 42.5 60.8 49.2 40.8 38.5
Note: Data exclude annulments.
18 ◄ Statistics on Marriages and Divorces, 2016 Singapore Department of Statistics
Divorces under the Administration of Muslim Law Act
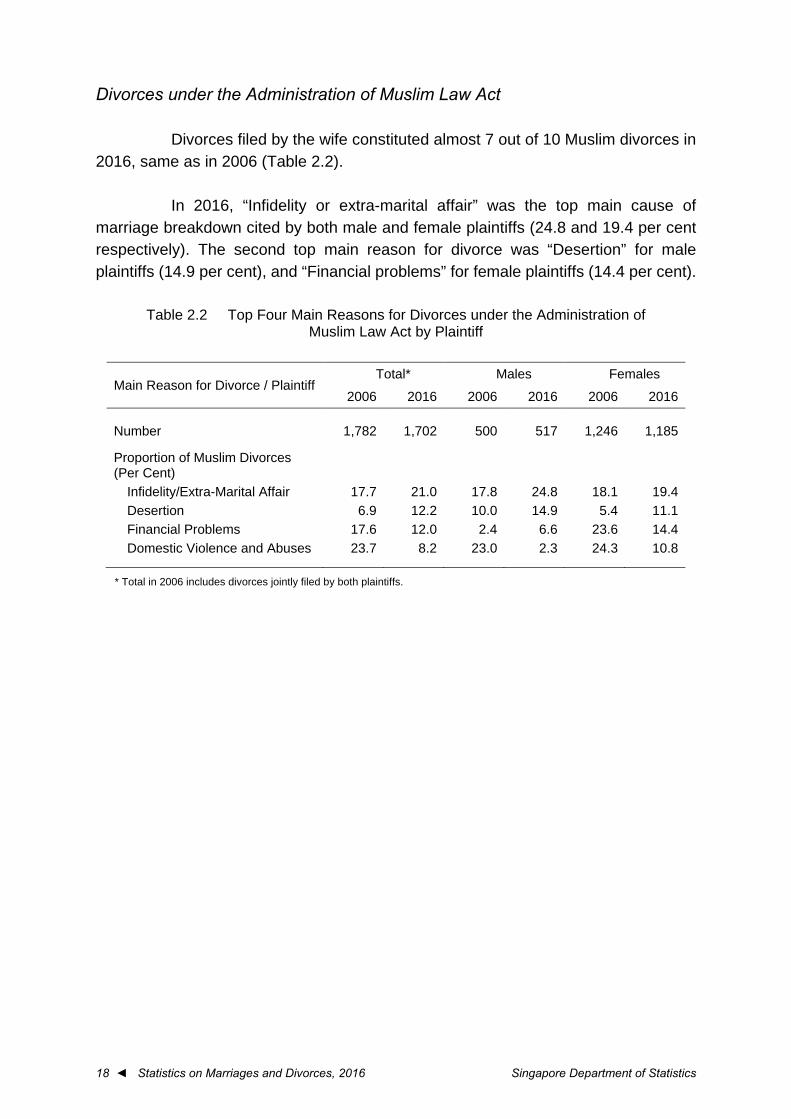
Divorces filed by the wife constituted almost 7 out of 10 Muslim divorces in 2016, same as in 2006 (Table 2.2).
In 2016, “Infidelity or extra-marital affair” was the top main cause of
marriage breakdown cited by both male and female plaintiffs (24.8 and 19.4 per cent respectively). The second top main reason for divorce was “Desertion” for male plaintiffs (14.9 per cent), and “Financial problems” for female plaintiffs (14.4 per cent).
Table 2.2 Top Four Main Reasons for Divorces under the Administration of Muslim Law Act by Plaintiff
Main Reason for Divorce / Plaintiff Total* Males Females
2006 2016 2006 2016 2006 2016 Number 1,782 1,702 500 517 1,246 1,185 Proportion of Muslim Divorces (Per Cent)
Infidelity/Extra-Marital Affair 17.7 21.0 17.8 24.8 18.1 19.4 Desertion 6.9 12.2 10.0 14.9 5.4 11.1 Financial Problems 17.6 12.0 2.4 6.6 23.6 14.4 Domestic Violence and Abuses 23.7 8.2 23.0 2.3 24.3 10.8
* Total in 2006 includes divorces jointly filed by both plaintiffs.
Singapore Department of Statistics Statistics on Marriages and Divorces, 2016 ► 19
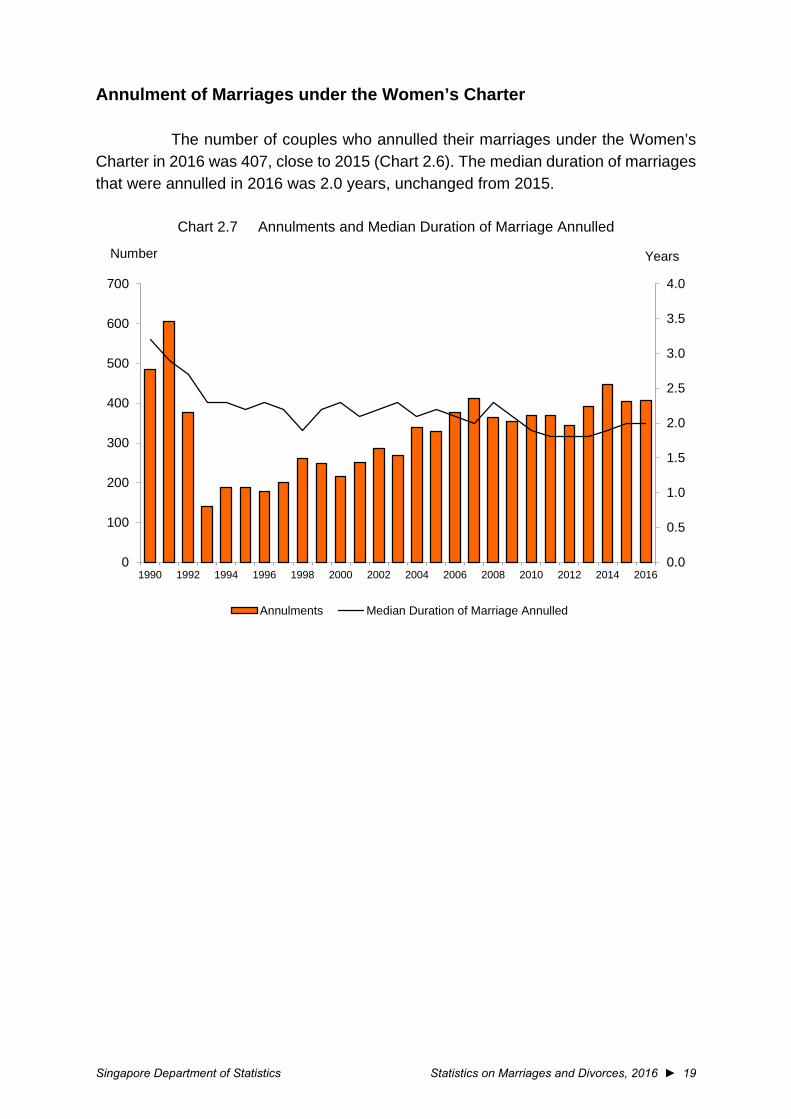
Annulment of Marriages under the Women’s Charter
The number of couples who annulled their marriages under the Women’s Charter in 2016 was 407, close to 2015 (Chart 2.6). The median duration of marriages that were annulled in 2016 was 2.0 years, unchanged from 2015.
Chart 2.7 Annulments and Median Duration of Marriage Annulled
0.0
0.5
1.0
1.5
2.0
2.5
3.0
3.5
4.0
0
100
200
300
400
500
600
700
1990 1992 1994 1996 1998 2000 2002 2004 2006 2008 2010 2012 2014 2016
YearsNumber
Annulments Median Duration of Marriage Annulled

► 21
Tables on Marriages

Singapore Department of Statistics Statistics on Marriages and Divorces, 2016 ► 23
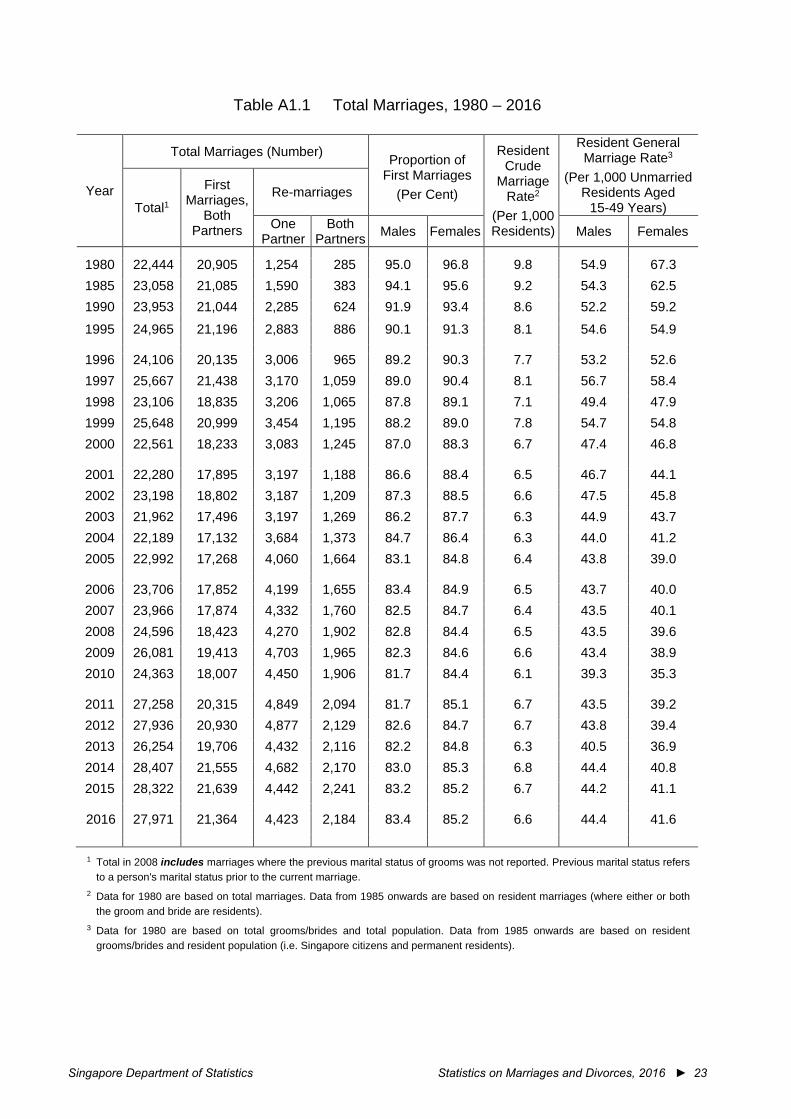
Table A1.1 Total Marriages, 1980 – 2016
Year
Total Marriages (Number) Proportion of First Marriages
(Per Cent)
Resident Crude
Marriage Rate2
(Per 1,000 Residents)
Resident General Marriage Rate3
(Per 1,000 Unmarried Residents Aged
15-49 Years) Total1
First Marriages,
Both Partners
Re-marriages
One Partner
Both Partners Males Females Males Females
1980 22,444 20,905 1,254 285 95.0 96.8 9.8 54.9 67.3 1985 23,058 21,085 1,590 383 94.1 95.6 9.2 54.3 62.5 1990 23,953 21,044 2,285 624 91.9 93.4 8.6 52.2 59.2
1995 24,965 21,196 2,883 886 90.1 91.3 8.1 54.6 54.9
1996 24,106 20,135 3,006 965 89.2 90.3 7.7 53.2 52.6 1997 25,667 21,438 3,170 1,059 89.0 90.4 8.1 56.7 58.4 1998 23,106 18,835 3,206 1,065 87.8 89.1 7.1 49.4 47.9 1999 25,648 20,999 3,454 1,195 88.2 89.0 7.8 54.7 54.8 2000 22,561 18,233 3,083 1,245 87.0 88.3 6.7 47.4 46.8
2001 22,280 17,895 3,197 1,188 86.6 88.4 6.5 46.7 44.1 2002 23,198 18,802 3,187 1,209 87.3 88.5 6.6 47.5 45.8 2003 21,962 17,496 3,197 1,269 86.2 87.7 6.3 44.9 43.7 2004 22,189 17,132 3,684 1,373 84.7 86.4 6.3 44.0 41.2 2005 22,992 17,268 4,060 1,664 83.1 84.8 6.4 43.8 39.0
2006 23,706 17,852 4,199 1,655 83.4 84.9 6.5 43.7 40.0 2007 23,966 17,874 4,332 1,760 82.5 84.7 6.4 43.5 40.1 2008 24,596 18,423 4,270 1,902 82.8 84.4 6.5 43.5 39.6 2009 26,081 19,413 4,703 1,965 82.3 84.6 6.6 43.4 38.9 2010 24,363 18,007 4,450 1,906 81.7 84.4 6.1 39.3 35.3
2011 27,258 20,315 4,849 2,094 81.7 85.1 6.7 43.5 39.2 2012 27,936 20,930 4,877 2,129 82.6 84.7 6.7 43.8 39.4 2013 26,254 19,706 4,432 2,116 82.2 84.8 6.3 40.5 36.9 2014 28,407 21,555 4,682 2,170 83.0 85.3 6.8 44.4 40.8 2015 28,322 21,639 4,442 2,241 83.2 85.2 6.7 44.2 41.1
2016 27,971 21,364 4,423 2,184 83.4 85.2 6.6 44.4 41.6
1 Total in 2008 includes marriages where the previous marital status of grooms was not reported. Previous marital status refers
to a person's marital status prior to the current marriage. 2 Data for 1980 are based on total marriages. Data from 1985 onwards are based on resident marriages (where either or both
the groom and bride are residents). 3 Data for 1980 are based on total grooms/brides and total population. Data from 1985 onwards are based on resident
grooms/brides and resident population (i.e. Singapore citizens and permanent residents).
24 ◄ Statistics on Marriages and Divorces, 2016 Singapore Department of Statistics
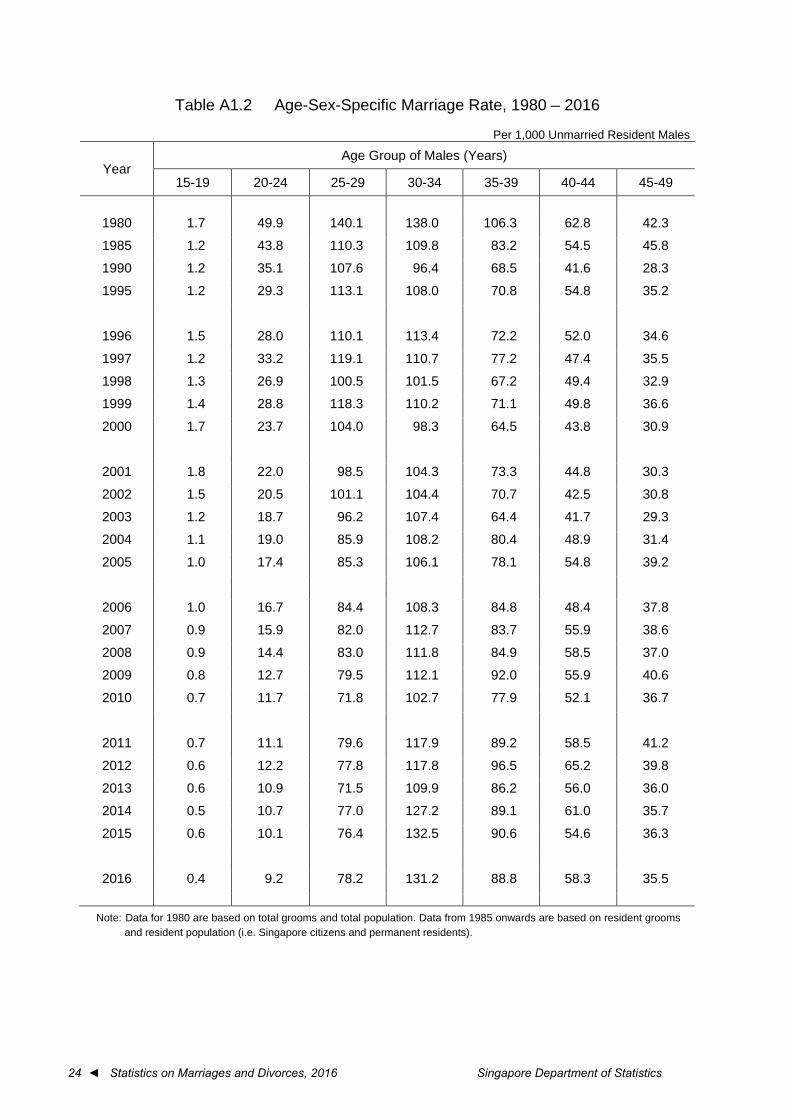
Table A1.2 Age-Sex-Specific Marriage Rate, 1980 – 2016
Per 1,000 Unmarried Resident Males
Year Age Group of Males (Years)
15-19 20-24 25-29 30-34 35-39 40-44 45-49
1980 1.7 49.9 140.1 138.0 106.3 62.8 42.3
1985 1.2 43.8 110.3 109.8 83.2 54.5 45.8
1990 1.2 35.1 107.6 96.4 68.5 41.6 28.3
1995 1.2 29.3 113.1 108.0 70.8 54.8 35.2
1996 1.5 28.0 110.1 113.4 72.2 52.0 34.6
1997 1.2 33.2 119.1 110.7 77.2 47.4 35.5
1998 1.3 26.9 100.5 101.5 67.2 49.4 32.9
1999 1.4 28.8 118.3 110.2 71.1 49.8 36.6
2000 1.7 23.7 104.0 98.3 64.5 43.8 30.9
2001 1.8 22.0 98.5 104.3 73.3 44.8 30.3
2002 1.5 20.5 101.1 104.4 70.7 42.5 30.8
2003 1.2 18.7 96.2 107.4 64.4 41.7 29.3
2004 1.1 19.0 85.9 108.2 80.4 48.9 31.4
2005 1.0 17.4 85.3 106.1 78.1 54.8 39.2
2006 1.0 16.7 84.4 108.3 84.8 48.4 37.8
2007 0.9 15.9 82.0 112.7 83.7 55.9 38.6
2008 0.9 14.4 83.0 111.8 84.9 58.5 37.0
2009 0.8 12.7 79.5 112.1 92.0 55.9 40.6
2010 0.7 11.7 71.8 102.7 77.9 52.1 36.7
2011 0.7 11.1 79.6 117.9 89.2 58.5 41.2
2012 0.6 12.2 77.8 117.8 96.5 65.2 39.8
2013 0.6 10.9 71.5 109.9 86.2 56.0 36.0
2014 0.5 10.7 77.0 127.2 89.1 61.0 35.7
2015 0.6 10.1 76.4 132.5 90.6 54.6 36.3
2016 0.4 9.2 78.2 131.2 88.8 58.3 35.5
Note: Data for 1980 are based on total grooms and total population. Data from 1985 onwards are based on resident grooms and resident population (i.e. Singapore citizens and permanent residents).
Singapore Department of Statistics Statistics on Marriages and Divorces, 2016 ► 25
Table A1.2 Age-Sex-Specific Marriage Rate, 1980 – 2016 (cont’d)
Per 1,000 Unmarried Resident Females
Year Age Group of Females (Years)
15-19 20-24 25-29 30-34 35-39 40-44 45-49
1980 18.4 110.5 136.5 74.3 43.6 22.0 9.2
1985 15.2 95.5 111.8 62.6 33.4 18.5 7.2
1990 11.0 84.8 133.0 69.1 36.6 14.7 6.7
1995 7.5 70.1 135.7 76.5 37.3 16.9 8.3
1996 7.0 65.4 137.3 74.0 35.7 19.0 8.2
1997 6.6 75.2 149.1 82.2 40.1 19.6 9.9
1998 7.6 58.7 123.9 70.5 34.6 16.8 8.5
1999 7.2 66.3 151.0 84.8 38.4 18.0 9.7
2000 7.4 54.3 133.0 69.8 32.4 17.2 8.2
2001 6.9 51.5 122.8 70.2 33.4 14.8 7.4
2002 6.3 50.1 125.6 75.2 32.9 14.1 7.9
2003 5.3 45.9 126.0 75.1 29.2 15.9 8.9
2004 5.0 43.3 111.2 75.9 34.1 16.4 8.9
2005 4.6 38.5 114.1 70.6 32.1 15.0 9.1
2006 3.9 37.4 110.4 78.9 33.5 17.5 8.3
2007 3.8 34.0 111.5 84.2 39.7 18.3 9.0
2008 3.1 30.9 114.5 79.8 38.8 18.7 9.6
2009 2.6 26.9 108.5 88.2 39.2 17.3 10.1
2010 2.8 22.6 99.0 81.0 36.3 16.2 10.4
2011 2.4 23.5 108.0 96.0 42.4 20.7 10.2
2012 2.3 24.4 106.7 96.2 43.2 21.0 10.5
2013 2.2 21.3 97.4 89.2 44.6 19.4 10.2
2014 1.7 22.3 103.8 105.3 44.3 19.5 11.7
2015 1.7 20.9 107.2 106.5 48.2 21.1 10.4
2016 1.7 19.9 106.8 105.8 48.9 21.3 11.7
Note: Data for 1980 are based on total brides and total population. Data from 1985 onwards are based on resident brides and resident population (i.e. Singapore citizens and permanent residents).
26 ◄ Statistics on Marriages and Divorces, 2016 Singapore Department of Statistics
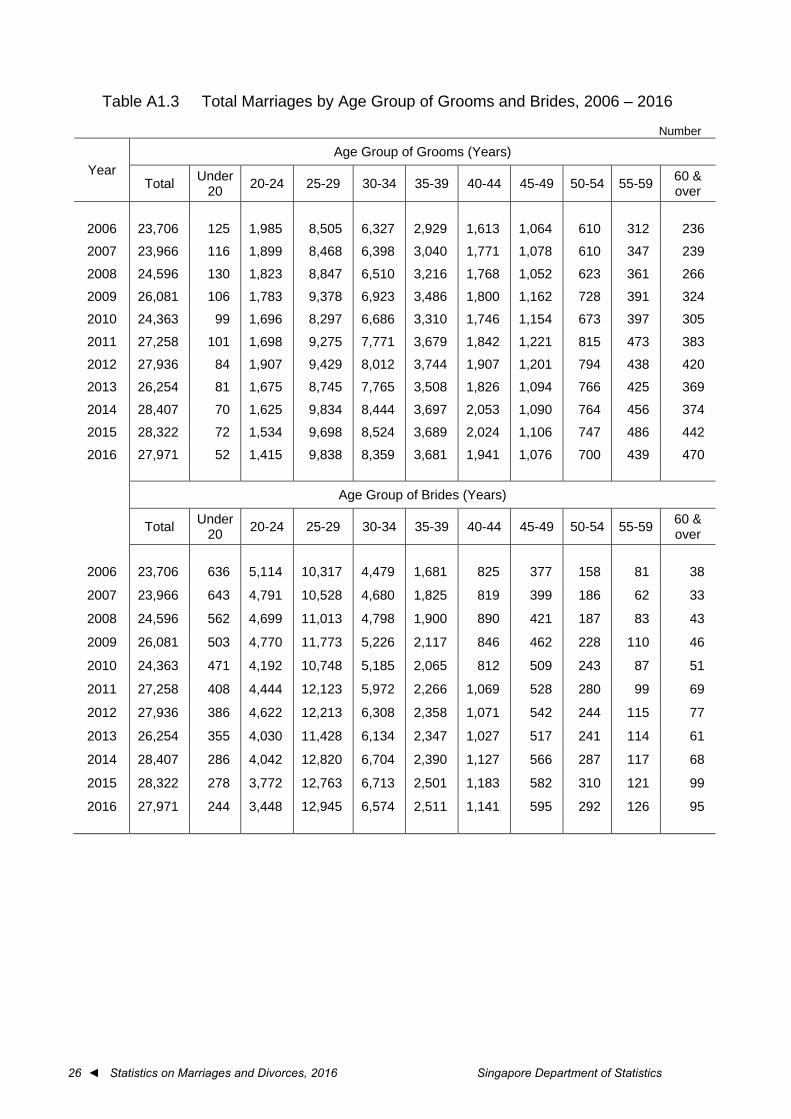
Table A1.3 Total Marriages by Age Group of Grooms and Brides, 2006 – 2016
Number
Year Age Group of Grooms (Years)
Total Under 20 20-24 25-29 30-34 35-39 40-44 45-49 50-54 55-59 60 &
over
2006 23,706 125 1,985 8,505 6,327 2,929 1,613 1,064 610 312 236
2007 23,966 116 1,899 8,468 6,398 3,040 1,771 1,078 610 347 239
2008 24,596 130 1,823 8,847 6,510 3,216 1,768 1,052 623 361 266
2009 26,081 106 1,783 9,378 6,923 3,486 1,800 1,162 728 391 324
2010 24,363 99 1,696 8,297 6,686 3,310 1,746 1,154 673 397 305
2011 27,258 101 1,698 9,275 7,771 3,679 1,842 1,221 815 473 383
2012 27,936 84 1,907 9,429 8,012 3,744 1,907 1,201 794 438 420
2013 26,254 81 1,675 8,745 7,765 3,508 1,826 1,094 766 425 369
2014 28,407 70 1,625 9,834 8,444 3,697 2,053 1,090 764 456 374
2015 28,322 72 1,534 9,698 8,524 3,689 2,024 1,106 747 486 442
2016 27,971 52 1,415 9,838 8,359 3,681 1,941 1,076 700 439 470
Age Group of Brides (Years)
Total Under 20 20-24 25-29 30-34 35-39 40-44 45-49 50-54 55-59 60 &
over
2006 23,706 636 5,114 10,317 4,479 1,681 825 377 158 81 38
2007 23,966 643 4,791 10,528 4,680 1,825 819 399 186 62 33
2008 24,596 562 4,699 11,013 4,798 1,900 890 421 187 83 43
2009 26,081 503 4,770 11,773 5,226 2,117 846 462 228 110 46
2010 24,363 471 4,192 10,748 5,185 2,065 812 509 243 87 51
2011 27,258 408 4,444 12,123 5,972 2,266 1,069 528 280 99 69
2012 27,936 386 4,622 12,213 6,308 2,358 1,071 542 244 115 77
2013 26,254 355 4,030 11,428 6,134 2,347 1,027 517 241 114 61
2014 28,407 286 4,042 12,820 6,704 2,390 1,127 566 287 117 68
2015 28,322 278 3,772 12,763 6,713 2,501 1,183 582 310 121 99
2016 27,971 244 3,448 12,945 6,574 2,511 1,141 595 292 126 95
Singapore Department of Statistics Statistics on Marriages and Divorces, 2016 ► 27
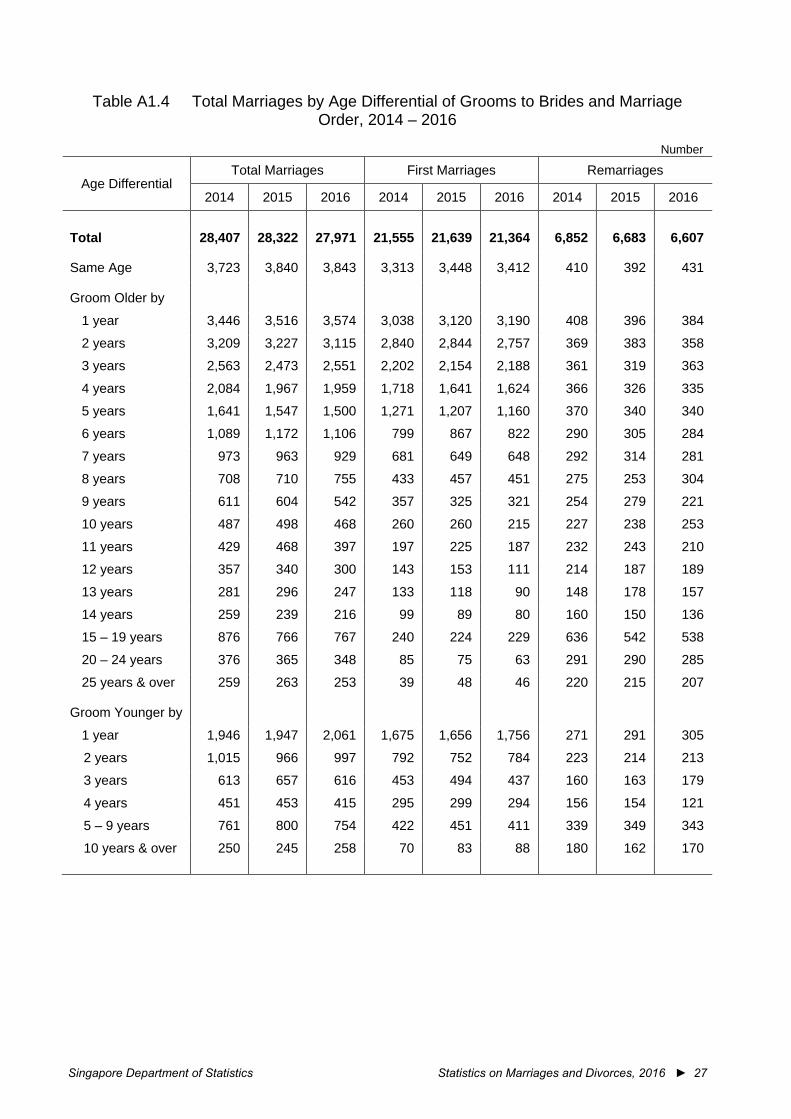
Table A1.4 Total Marriages by Age Differential of Grooms to Brides and Marriage
Order, 2014 – 2016
Number
Age Differential Total Marriages First Marriages Remarriages
2014 2015 2016 2014 2015 2016 2014 2015 2016
Total 28,407 28,322 27,971 21,555 21,639 21,364 6,852 6,683 6,607
Same Age 3,723 3,840 3,843 3,313 3,448 3,412 410 392 431
Groom Older by
1 year 3,446 3,516 3,574 3,038 3,120 3,190 408 396 384
2 years 3,209 3,227 3,115 2,840 2,844 2,757 369 383 358
3 years 2,563 2,473 2,551 2,202 2,154 2,188 361 319 363
4 years 2,084 1,967 1,959 1,718 1,641 1,624 366 326 335
5 years 1,641 1,547 1,500 1,271 1,207 1,160 370 340 340
6 years 1,089 1,172 1,106 799 867 822 290 305 284
7 years 973 963 929 681 649 648 292 314 281
8 years 708 710 755 433 457 451 275 253 304
9 years 611 604 542 357 325 321 254 279 221
10 years 487 498 468 260 260 215 227 238 253
11 years 429 468 397 197 225 187 232 243 210
12 years 357 340 300 143 153 111 214 187 189
13 years 281 296 247 133 118 90 148 178 157
14 years 259 239 216 99 89 80 160 150 136
15 – 19 years 876 766 767 240 224 229 636 542 538
20 – 24 years 376 365 348 85 75 63 291 290 285
25 years & over 259 263 253 39 48 46 220 215 207
Groom Younger by
1 year 1,946 1,947 2,061 1,675 1,656 1,756 271 291 305
2 years 1,015 966 997 792 752 784 223 214 213
3 years 613 657 616 453 494 437 160 163 179
4 years 451 453 415 295 299 294 156 154 121
5 – 9 years 761 800 754 422 451 411 339 349 343
10 years & over 250 245 258 70 83 88 180 162 170

28 ◄ Statistics on Marriages and Divorces, 2016 Singapore Department of Statistics
Table A1.5 Median Age of Grooms and Brides by Marriage Order, 2006 – 2016
Years
Year Grooms Brides
Total Marriages*
First Marriages Remarriages Total
Marriages First
Marriages Remarriages
2006 30.7 29.7 41.1 27.6 27.0 35.1
2007 30.9 29.8 41.3 27.9 27.2 35.1
2008 30.9 29.8 41.4 28.0 27.3 35.5
2009 31.0 29.8 41.8 28.1 27.5 35.7
2010 31.2 30.0 41.8 28.3 27.7 36.3
2011 31.2 30.1 41.8 28.6 28.0 36.5
2012 31.2 30.1 42.1 28.6 28.0 36.4
2013 31.3 30.2 42.5 28.8 28.1 36.6
2014 31.2 30.2 42.7 28.8 28.2 37.0
2015 31.3 30.3 43.3 28.9 28.2 37.5
2016 31.2 30.3 43.3 28.8 28.3 37.1
* Total in 2008 includes marriages where the previous marital status of grooms was not reported. Previous marital status refers to a person's marital status prior to the current marriage.
Table A1.6 Median Age of Grooms by Ethnic Group, 2006 – 2016
Years
Year Total* Chinese Malays Indians Eurasians Caucasians Others
2006 30.7 30.8 29.4 30.0 32.8 36.9 30.3
2007 30.9 30.9 29.4 30.0 34.1 36.9 30.4
2008 30.9 31.1 29.1 29.9 34.0 37.4 30.2
2009 31.0 31.2 29.1 30.3 33.4 38.1 29.7
2010 31.2 31.5 29.2 30.0 31.6 37.4 30.2
2011 31.2 31.5 29.4 29.9 35.6 37.7 30.3
2012 31.2 31.5 29.2 30.0 33.2 36.6 30.6
2013 31.3 31.7 29.2 30.4 33.5 36.6 30.7
2014 31.2 31.5 29.3 30.2 33.0 36.0 30.8
2015 31.3 31.5 29.3 30.5 33.4 36.6 31.0
2016 31.2 31.5 29.1 30.4 31.7 36.4 31.1
* For 2008, Total includes marriages where the ethnic group of grooms was not reported.
Singapore Department of Statistics Statistics on Marriages and Divorces, 2016 ► 29
Table A1.7 Median Age of Brides by Ethnic Group, 2006 – 2016
Years
Year Total* Chinese Malays Indians Eurasians Caucasians Others
2006 27.6 27.9 26.3 26.8 29.9 31.6 27.3
2007 27.9 28.1 26.6 27.0 28.7 32.5 27.4
2008 28.0 28.2 26.5 27.0 29.1 32.4 27.6
2009 28.1 28.4 26.7 27.2 29.6 32.7 27.7
2010 28.3 28.7 26.9 27.5 29.1 32.7 28.0
2011 28.6 28.9 27.0 27.6 29.8 32.2 28.4
2012 28.6 28.9 26.9 27.6 28.2 32.1 28.6
2013 28.8 29.0 27.2 27.9 30.5 31.8 29.0
2014 28.8 29.1 27.1 27.8 28.9 32.4 28.9
2015 28.9 29.1 27.3 28.2 30.1 31.8 29.3
2016 28.8 29.0 27.3 28.2 30.2 32.1 29.4
* For 2008, Total includes marriages where the ethnic group of brides was not reported.
Table A1.8 Median Age at First Marriage of Grooms and Brides by Educational Qualification, 2006 – 2016
Years
Year Grooms Brides
Total* Secondary & Below
Post-Secondary University Total* Secondary
& Below Post-
Secondary University
2006 29.7 31.7 28.4 30.0 27.0 26.2 26.2 27.9
2007 29.8 31.3 28.5 30.3 27.2 26.4 26.3 28.1
2008 29.8 31.5 28.7 30.1 27.3 26.2 26.4 28.2
2009 29.8 31.4 28.9 30.1 27.5 26.4 26.6 28.2
2010 30.0 31.3 29.0 30.4 27.7 26.6 26.7 28.5
2011 30.1 31.2 29.2 30.5 28.0 26.7 26.9 28.7
2012 30.1 30.8 29.3 30.5 28.0 26.7 27.0 28.6
2013 30.2 30.6 29.2 30.7 28.1 26.9 26.9 28.9
2014 30.2 30.5 29.2 30.7 28.2 27.1 27.0 28.8
2015 30.3 30.5 29.4 30.7 28.2 27.0 27.2 28.9
2016 30.3 30.4 29.2 30.8 28.3 27.2 27.3 28.8
* For 2006, 2008 and 2009, Total includes marriages where the educational qualification of grooms or brides was not reported.
30 ◄ Statistics on Marriages and Divorces, 2016 Singapore Department of Statistics
Table A1.9 Marriages under the Women’s Charter by Ethnic Group of Couple, 1965 – 2016
Number
Year Total* Chinese Indians Others Inter-ethnic
1965 7,071 6,260 244 330 237
1970 12,300 11,099 528 273 400
1975 18,579 17,125 764 159 531
1980 18,412 16,698 989 118 607
1985 18,495 16,603 1,117 82 693
1990 19,191 16,899 1,140 106 1,046
1995 20,553 17,972 1,020 170 1,391
1996 19,935 17,242 1,087 198 1,408
1997 21,300 18,760 946 200 1,394
1998 18,971 16,078 999 243 1,651
1999 21,561 18,689 877 217 1,778
2000 18,550 15,737 844 208 1,761
2001 18,279 15,150 827 344 1,958
2002 19,257 16,112 859 307 1,979
2003 18,091 14,414 657 264 1,621
2004 18,091 14,296 668 301 1,723
2005 19,042 15,534 782 421 2,305
2006 19,761 16,063 759 494 2,445
2007 19,853 15,600 818 718 2,717
2008 20,389 15,738 790 1,051 2,810
2009 22,060 16,374 840 1,372 3,474
2010 20,230 14,535 799 1,346 3,550
2011 22,840 16,499 879 1,495 3,967
2012 23,134 16,387 950 1,614 4,183
2013 21,180 14,948 960 1,407 3,865
2014 22,863 16,750 978 1,244 3,891
2015 22,544 16,237 940 1,225 4,142
2016 22,017 15,944 916 1,150 4,007
* For 2003 and 2004, Total includes marriages where the ethnic group of grooms or brides was not reported.
Singapore Department of Statistics Statistics on Marriages and Divorces, 2016 ► 31
Table A1.10 Marriages under the Women’s Charter by Age Group of Grooms, 1965 – 2016
Number
Year Age Group of Grooms (Years)
Total Under 20 20-24 25-29 30-34 35-39 40-44 45-49 50-54 55-59 60 &
over
1965 7,071 42 1,736 3,233 1,432 400 141 42 21 14 10 1970 12,300 111 3,825 4,920 2,311 678 237 97 69 20 32 1975 18,579 220 6,280 8,474 2,151 844 288 157 81 40 44 1980 18,412 141 5,417 8,501 2,935 737 342 161 85 46 47 1985 18,495 70 4,206 8,866 3,727 1,046 282 171 67 34 26 1990 19,191 68 2,988 8,654 4,834 1,689 567 196 100 49 46 1995 20,553 61 2,626 8,833 5,318 2,196 902 349 117 80 71
1996 19,935 71 2,443 8,417 5,155 2,222 936 393 158 74 66 1997 21,300 55 2,868 9,366 5,045 2,303 952 415 154 84 58 1998 18,971 64 2,237 8,281 4,452 2,134 1,002 420 189 117 75 1999 21,561 84 2,424 9,604 4,970 2,360 1,133 528 253 112 93 2000 18,550 85 1,889 8,025 4,439 2,121 1,089 501 217 93 91
2001 18,279 97 1,767 7,784 4,452 2,087 1,107 523 255 106 101 2002 19,257 62 1,705 8,333 4,872 2,207 1,065 545 238 130 100 2003 18,091 51 1,447 7,532 4,865 2,035 1,092 559 291 137 82 2004 18,091 41 1,427 6,882 5,028 2,194 1,214 666 366 147 126 2005 19,042 48 1,388 6,526 5,221 2,448 1,537 935 506 258 175
2006 19,761 53 1,357 7,072 5,571 2,540 1,329 894 502 268 175 2007 19,853 56 1,253 6,942 5,636 2,663 1,463 877 496 285 182 2008 20,389 58 1,245 7,151 5,767 2,790 1,487 863 529 284 215 2009 22,060 56 1,270 7,694 6,207 3,088 1,530 1,001 620 337 257 2010 20,230 63 1,139 6,631 5,881 2,867 1,492 993 590 327 247
2011 22,840 59 1,192 7,392 6,893 3,251 1,582 1,031 703 409 328 2012 23,134 46 1,297 7,323 7,066 3,303 1,661 1,025 671 384 358 2013 21,180 53 1,097 6,568 6,681 3,062 1,533 898 635 345 308 2014 22,863 37 1,034 7,390 7,171 3,284 1,756 872 626 376 317 2015 22,544 24 921 7,191 7,242 3,208 1,741 891 578 396 352
2016 22,017 25 824 7,111 7,091 3,205 1,629 872 532 351 377
32 ◄ Statistics on Marriages and Divorces, 2016 Singapore Department of Statistics
Table A1.11 Marriages under the Women’s Charter by Age Group of Brides,
1965 – 2016
Number
Year Age Group of Brides (Years)
Total Under 20 20-24 25-29 30-34 35-39 40-44 45-49 50-54 55-59 60 &
over
1965 7,071 860 3,520 2,113 434 90 28 16 7 1 2 1970 12,300 1,308 7,060 2,859 744 199 66 29 16 13 6 1975 18,579 2,526 9,935 4,820 788 300 114 47 31 8 10 1980 18,412 1,693 9,655 5,233 1,266 319 143 60 18 13 12 1985 18,495 1,080 8,623 6,500 1,597 487 123 54 19 8 4 1990 19,191 765 7,160 7,678 2,462 791 232 62 27 7 7 1995 20,553 493 7,254 8,427 2,811 1,018 351 134 34 24 7
1996 19,935 475 6,564 8,367 2,874 1,058 391 132 46 16 12 1997 21,300 425 7,174 9,093 2,857 1,076 435 154 53 18 15 1998 18,971 514 5,847 8,335 2,615 1,000 402 164 67 16 11 1999 21,561 496 6,387 9,748 2,968 1,145 484 210 79 27 17 2000 18,550 452 5,159 8,509 2,662 1,028 463 174 65 20 18
2001 18,279 428 5,034 8,297 2,804 1,032 409 160 70 24 21 2002 19,257 357 5,037 9,111 3,048 967 407 203 84 33 10 2003 18,091 294 4,260 8,723 3,070 994 437 194 77 35 7 2004 18,091 322 4,088 8,307 3,397 1,143 448 226 97 40 23 2005 19,042 403 3,981 8,454 3,772 1,398 582 270 110 50 22
2006 19,761 354 3,869 9,082 3,971 1,433 602 271 102 56 21 2007 19,853 380 3,549 9,138 4,191 1,542 598 260 131 45 19 2008 20,389 338 3,432 9,492 4,316 1,629 690 286 120 55 31 2009 22,060 336 3,617 10,209 4,740 1,859 690 339 162 79 29 2010 20,230 292 3,087 9,137 4,623 1,799 655 378 171 54 34
2011 22,840 259 3,268 10,311 5,424 1,980 882 403 193 67 53 2012 23,134 222 3,343 10,244 5,667 2,074 877 382 172 91 62 2013 21,180 206 2,785 9,296 5,423 2,003 813 378 165 74 37 2014 22,863 152 2,658 10,403 5,884 2,097 914 417 212 80 46 2015 22,544 133 2,427 10,269 5,857 2,150 914 437 199 85 73
2016 22,017 119 2,155 10,213 5,739 2,141 893 415 188 88 66
Singapore Department of Statistics Statistics on Marriages and Divorces, 2016 ► 33
Table A1.12 Median Age of Grooms and Brides Married under the Women’s Charter by
Marriage Order, 1965 – 2016
Years
Year Grooms Brides
Total Marriages
First Marriages Remarriages Total
Marriages First
Marriages Remarriages
1965 27.7 27.6 38.9 23.8 23.8 34.5 1970 27.3 27.2 41.1 23.4 23.4 33.6 1975 26.6 26.5 39.7 23.4 23.4 33.6 1980 27.1 27.0 38.9 23.9 23.8 33.6 1985 27.6 27.4 37.3 24.8 24.6 31.5 1990 28.7 28.3 39.0 25.8 25.6 32.8 1995 29.2 28.8 39.3 26.1 25.8 33.4
1996 29.4 28.9 39.4 26.3 26.0 33.1 1997 29.0 28.5 39.0 26.2 25.9 33.5 1998 29.2 28.6 39.5 26.4 26.0 33.3 1999 29.1 28.6 40.0 26.5 26.2 33.9 2000 29.5 28.9 40.3 26.8 26.4 34.0
2001 29.6 29.0 40.2 26.9 26.5 33.8 2002 29.7 29.1 40.5 26.9 26.5 33.9 2003 30.0 29.3 40.6 27.2 26.8 33.7 2004 30.5 29.7 40.7 27.5 27.0 34.4 2005 31.2 30.2 41.6 27.8 27.2 34.7
2006 30.9 30.0 41.3 27.8 27.3 35.0 2007 31.1 30.2 41.5 28.1 27.6 35.0 2008 31.2 30.2 41.6 28.2 27.6 35.5 2009 31.3 30.2 42.0 28.3 27.7 35.8 2010 31.6 30.4 42.4 28.6 28.0 36.3
2011 31.6 30.6 42.3 28.8 28.3 36.4 2012 31.6 30.6 42.5 28.9 28.3 36.4 2013 31.8 30.7 43.1 29.1 28.5 36.5 2014 31.7 30.7 43.2 29.1 28.6 37.0 2015 31.7 30.8 43.9 29.2 28.6 37.3
2016 31.7 30.8 43.5 29.2 28.7 37.0
34 ◄ Statistics on Marriages and Divorces, 2016 Singapore Department of Statistics
Table A1.13 Median Age of Grooms Married under the Women’s Charter by
Ethnic Group, 2006 – 2016
Years
Year Total Chinese Indians Eurasians Caucasians Others
2006 30.9 30.8 30.4 33.3 37.2 31.4
2007 31.1 30.9 30.7 33.7 37.0 31.6
2008 31.2 31.1 30.6 34.9 37.5 30.5
2009 31.3 31.2 30.7 33.4 38.1 30.0
2010 31.6 31.5 30.4 32.7 37.4 30.4
2011 31.6 31.6 30.4 35.6 37.6 30.7
2012 31.6 31.5 30.3 33.4 36.8 31.2
2013 31.8 31.7 30.7 33.6 36.8 31.3
2014 31.7 31.5 30.7 33.8 36.3 31.5
2015 31.7 31.5 31.0 33.1 36.8 31.7
2016 31.7 31.5 31.3 32.1 36.7 32.1
Table A1.14 Median Age of Brides Married under the Women’s Charter by Ethnic Group, 2006 – 2016
Years
Year Total Chinese Indians Eurasians Caucasians Others
2006 27.8 27.9 27.0 30.2 31.6 27.6
2007 28.1 28.1 27.3 28.8 32.5 27.6
2008 28.2 28.2 27.5 29.3 32.6 27.7
2009 28.3 28.4 27.7 29.7 32.9 27.8
2010 28.6 28.7 28.0 29.2 32.8 28.0
2011 28.8 28.9 27.9 30.2 32.4 28.5
2012 28.9 29.0 27.8 28.4 32.3 28.7
2013 29.1 29.1 28.1 30.9 31.8 29.2
2014 29.1 29.1 28.2 29.8 32.4 29.1
2015 29.2 29.1 28.6 30.1 31.9 29.6
2016 29.2 29.0 28.8 31.1 32.1 29.7

Singapore Department of Statistics Statistics on Marriages and Divorces, 2016 ► 35
Table A1.15 Marriages under the Women’s Charter by Ethnic Group of Couple,
January – December 2016
Number
Month Total Chinese Indians Others Inter-ethnic
Total 22,017 15,944 916 1,150 4,007
January 1,883 1,393 57 97 336 February 1,260 797 72 102 289
March 1,811 1,293 84 94 340
April 1,213 710 68 121 314 May 2,025 1,499 65 102 359 June 1,960 1,401 91 103 365
July 1,715 1,192 73 84 366
August 904 491 51 111 251 September 2,389 1,912 80 58 339
October 2,319 1,857 34 79 349
November 2,142 1,587 122 103 330 December 2,396 1,812 119 96 369
Table A1.16 Marriages under the Women’s Charter by Previous Marital Status and Ethnic Group of Couple, 2016
Number
Marriage Contracted Between
Total Chinese Indians Others Inter-ethnic
Total 22,017 15,944 916 1,150 4,007 Single man &
Single woman 17,124 12,859 694 948 2,623 Divorced woman 1,386 955 77 55 299 Widowed woman 48 30 5 5 8
Divorced man &
Single woman 1,967 1,114 54 84 715 Divorced woman 1,250 844 72 47 287 Widowed woman 67 29 8 5 25
Widowed man &
Single woman 81 47 3 3 28 Divorced woman 77 59 3 1 14 Widowed woman 17 7 - 2 8
Note: Previous marital status refers to a person’s marital status prior to the current marriage.
36 ◄ Statistics on Marriages and Divorces, 2016 Singapore Department of Statistics
Table A1.17 Inter-ethnic Marriages under the Women’s Charter by
Ethnic Group of Grooms and Brides, 2016
Number
Ethnic Group of Grooms
Ethnic Group of Brides
Total Chinese Indians Eurasians Caucasians Malays Others
Total 4,007 1,153 150 70 105 81 2,448 Chinese 2,090 - 41 31 43 28 1,947
Indians 448 212 - 10 29 20 177
Eurasians 109 79 7 - 5 2 16
Caucasians 886 512 43 23 - 25 283
Malays 69 33 4 1 6 - 25
Others 405 317 55 5 22 6 -
Table A1.18 Marriages under the Women’s Charter by Age Group of Grooms and Brides, 2016
Number
Age Group of Grooms
(Years)
Age Group of Brides (Years)
Total Under20 20-24 25-29 30-34 35-39 40-44 45-49 50-54 55-59 60 &
over
Total 22,017 119 2,155 10,213 5,739 2,141 893 415 188 88 66 Under 20 25 16 7 2 - - - - - - -
20 – 24 824 44 462 257 44 11 4 2 - - -
25 – 29 7,111 20 1,042 5,259 670 96 18 5 1 - -
30 – 34 7,091 16 379 3,378 2,845 393 66 12 2 - -
35 – 39 3,205 12 141 800 1,316 762 125 33 13 3 -
40 – 44 1,629 7 66 293 478 469 238 60 16 2 -
45 – 49 872 2 28 133 200 207 177 96 22 6 1
50 – 54 532 2 17 46 104 95 141 73 38 13 3
55 – 59 351 - 7 30 42 60 64 71 45 23 9
60 & over 377 - 6 15 40 48 60 63 51 41 53

Singapore Department of Statistics Statistics on Marriages and Divorces, 2016 ► 37
Table A1.19 Marriages under the Women’s Charter by Age Group and
Ethnic Group of Grooms and Brides, 2016
Number
Age Group (Years)
Ethnic Group of Grooms
Total Chinese Indians Others
Total 22,017 18,034 1,364 2,619 Under 20 25 24 1 -
20 – 24 824 681 67 76
25 – 29 7,111 6,065 473 573
30 – 34 7,091 5,830 427 834
35 – 39 3,205 2,533 184 488
40 – 44 1,629 1,281 91 257
45 – 49 872 653 60 159
50 – 54 532 399 30 103
55 – 59 351 266 16 69
60 & over 377 302 15 60
Ethnic Group of Brides
Total Chinese Indians Others
Total 22,017 17,097 1,066 3,854
Under 20 119 73 7 39
20 – 24 2,155 1,533 144 478
25 – 29 10,213 8,333 485 1395
30 – 34 5,739 4,341 240 1158
35 – 39 2,141 1,564 94 483
40 – 44 893 669 43 181
45 – 49 415 326 27 62
50 – 54 188 143 12 33
55 – 59 88 68 5 15
60 & over 66 47 9 10
38 ◄ Statistics on Marriages and Divorces, 2016 Singapore Department of Statistics
Table A1.20 Marriages under the Women’s Charter by Age Group and
Previous Marital Status of Grooms, 2016
Number Age Group
(Years) Total Single Divorced Widowed
Total 22,017 18,558 3,284 175 Under 20 25 25 - -
20 – 24 824 821 3 -
25 – 29 7,111 7,020 89 2
30 – 34 7,091 6,686 402 3
35 – 39 3,205 2,480 715 10
40 – 44 1,629 932 677 20
45 – 49 872 320 537 15
50 – 54 532 142 376 14
55 – 59 351 68 248 35
60 & over 377 64 237 76
Note: Previous marital status refers to a person’s marital status prior to the current marriage.
Table A1.21 Marriages under the Women’s Charter by Age Group and Previous Marital Status of Brides, 2016
Number
Age Group (Years) Total Single Divorced Widowed
Total 22,017 19,172 2,713 132 Under 20 119 119 - -
20 – 24 2,155 2,114 40 1
25 – 29 10,213 9,847 360 6
30 – 34 5,739 4,997 726 16
35 – 39 2,141 1,468 647 26
40 – 44 893 409 463 21
45 – 49 415 135 259 21
50 – 54 188 47 126 15
55 – 59 88 19 56 13
60 & over 66 17 36 13
Note: Previous marital status refers to a person’s marital status prior to the current marriage.
Singapore Department of Statistics Statistics on Marriages and Divorces, 2016 ► 39
Table A1.22 First Marriages for Grooms under the Women’s Charter by
Age Group of Grooms and Brides, 2016
Number
Age Group of Grooms
(Years)
Age Group of Brides (Years)
Total Under 20 20-24 25-29 30-34 35-39 40-44 45-49 50 &
over
Total 18,558 104 1,948 9,565 4,825 1,465 415 141 95 Under 20 25 16 7 2 - - - - -
20 – 24 821 44 461 256 43 11 4 2 -
25 – 29 7,020 19 1,015 5,222 651 93 15 4 1
30 – 34 6,686 11 328 3,238 2,699 349 50 10 1
35 – 39 2,480 7 88 623 1,058 592 81 19 12
40 – 44 932 4 31 165 263 292 134 33 10
45 – 49 320 1 16 38 71 75 71 37 11
50 & over 274 2 2 21 40 53 60 36 60
Table A1.23 First Marriages for Brides under the Women’s Charter by Age Group of Grooms and Brides, 2016
Number
Age Group of Grooms
(Years)
Age Group of Brides (Years)
Total Under 20 20-24 25-29 30-34 35-39 40-44 45-49 50 &
over
Total 19,172 119 2,114 9,847 4,997 1,468 409 135 83 Under 20 25 16 7 2 - - - - -
20 – 24 782 44 451 246 32 6 2 1 -
25 – 29 6,876 20 1,030 5,158 589 66 9 4 -
30 – 34 6,585 16 369 3,276 2,593 290 37 3 1
35 – 39 2,647 12 138 730 1,135 555 61 10 6
40 – 44 1,163 7 64 249 380 315 127 18 3
45 – 49 510 2 28 108 139 115 82 31 5
50 & over 584 2 27 78 129 121 91 68 68
40 ◄ Statistics on Marriages and Divorces, 2016 Singapore Department of Statistics
Table A1.24 First Marriages for Couples under the Women’s Charter by
Age Group of Grooms and Brides, 2016
Number
Age Group of Grooms
(Years)
Age Group of Brides (Years)
Total Under 20 20-24 25-29 30-34 35-39 40-44 45-49 50 &
over
Total 17,124 104 1,915 9,313 4,350 1,125 227 57 33 Under 20 25 16 7 2 - - - - -
20 – 24 780 44 450 245 32 6 2 1 -
25 – 29 6,800 19 1,003 5,126 575 65 8 4 -
30 – 34 6,294 11 320 3,164 2,492 273 32 2 -
35 – 39 2,150 7 86 584 943 469 47 8 6
40 – 44 725 4 31 143 225 228 78 13 3
45 – 49 206 1 16 32 52 49 36 18 2
50 & over 144 2 2 17 31 35 24 11 22
Note: Data pertain to couples where neither party had previously been married.
Table A1.25 Marriages under the Women’s Charter by Occupation of Grooms and Brides, 2016
Number
Occupation of Grooms
Occupation of Brides
Total Admin-
istrative & Managerial
Profes- sional &
Technical Clerical Sales &
Services
Production & Related Workers
Others Not Working
Total 22,017 7,938 7,154 250 2,067 210 806 3,592
Administrative & Managerial 6,888 4,390 947 62 422 29 139 899
Professional & Technical 9,663 2,167 5,540 78 482 73 163 1,160
Clerical 60 9 8 21 9 1 - 12
Sales & Services 2,207 508 187 40 801 29 43 599
Production & Related Workers 529 125 52 19 106 55 14 158
Others 1,943 536 231 28 182 15 418 533
Not Working 727 203 189 2 65 8 29 231
Singapore Department of Statistics Statistics on Marriages and Divorces, 2016 ► 41
Table A1.26 Marriages under the Women’s Charter by Age Group and
Occupation of Grooms and Brides, 2016
Number
Age Group (Years)
Occupation of Grooms
Total Admin-
istrative & Managerial
Profes- sional &
Technical Clerical Sales &
Services
Production & Related Workers
Others Not Working
Total 22,017 6,888 9,663 60 2,207 529 1,943 727
Under 20 25 1 - - 4 2 12 6
20 – 24 824 111 190 3 195 27 165 133
25 – 29 7,111 2,201 3,261 25 608 128 638 250
30 – 34 7,091 2,423 3,455 12 534 111 422 134
35 – 39 3,205 1,111 1,438 9 293 67 223 64
40 – 44 1,629 514 693 3 178 56 157 28
45 – 49 872 260 317 3 127 51 91 23
50 – 54 532 152 144 2 102 31 90 11
55 – 59 351 62 95 2 81 27 60 24
60 & over 377 53 70 1 85 29 85 54
Occupation of Brides
Total Admin-
istrative & Managerial
Profes- sional &
Technical Clerical Sales &
Services
Production & Related Workers
Others Not Working
Total 22,017 7,938 7,154 250 2,067 210 806 3,592 Under 20 119 8 2 - 12 - 5 92
20 – 24 2,155 560 397 31 294 27 113 733
25 – 29 10,213 3,928 3,785 89 829 61 339 1,182
30 – 34 5,739 2,203 2,020 65 439 40 183 789
35 – 39 2,141 790 642 32 214 38 78 347
40 – 44 893 276 199 18 136 14 39 211
45 – 49 415 111 69 10 88 10 25 102
50 – 54 188 43 23 2 32 10 17 61
55 – 59 88 15 15 2 12 5 2 37
60 & over 66 4 2 1 11 5 5 38

42 ◄ Statistics on Marriages and Divorces, 2016 Singapore Department of Statistics
Table A1.27 Marriages under the Women’s Charter by Age Group and
Educational Qualification of Grooms and Brides, 2016
Number
Age Group (Years)
Educational Qualification of Grooms
Total Below Secondary Secondary
Post-Secondary
(Non-Tertiary)
Diploma & Professional Qualification
University
Total 22,017 1,517 2,044 1,607 5,011 11,838 Under 20 25 4 13 7 1 -
20 – 24 824 94 196 147 278 109
25 – 29 7,111 199 427 522 1,717 4,246
30 – 34 7,091 216 454 406 1,483 4,532
35 – 39 3,205 187 310 222 791 1,695
40 – 44 1,629 194 226 146 361 702
45 – 49 872 169 152 78 186 287
50 – 54 532 176 93 34 95 134
55 – 59 351 125 83 25 53 65
60 & over 377 153 90 20 46 68 Educational Qualification of Brides
Total Below Secondary Secondary
Post-Secondary
(Non-Tertiary)
Diploma & Professional Qualification
University
Total 22,017 1,559 1,944 1,101 4,642 12,771 Under 20 119 41 44 26 7 1
20 – 24 2,155 255 351 252 648 649
25 – 29 10,213 384 542 380 2,024 6,883
30 – 34 5,739 296 388 205 1,184 3,666
35 – 39 2,141 198 268 114 478 1,083
40 – 44 893 149 165 64 169 346
45 – 49 415 100 97 39 92 87
50 – 54 188 66 53 13 23 33
55 – 59 88 33 23 5 14 13
60 & over 66 37 13 3 3 10
Note: Since 2015, data are based on a new set of educational qualification codes used by the data source agencies during marriage registration. Comparable data for past years can be downloaded here.
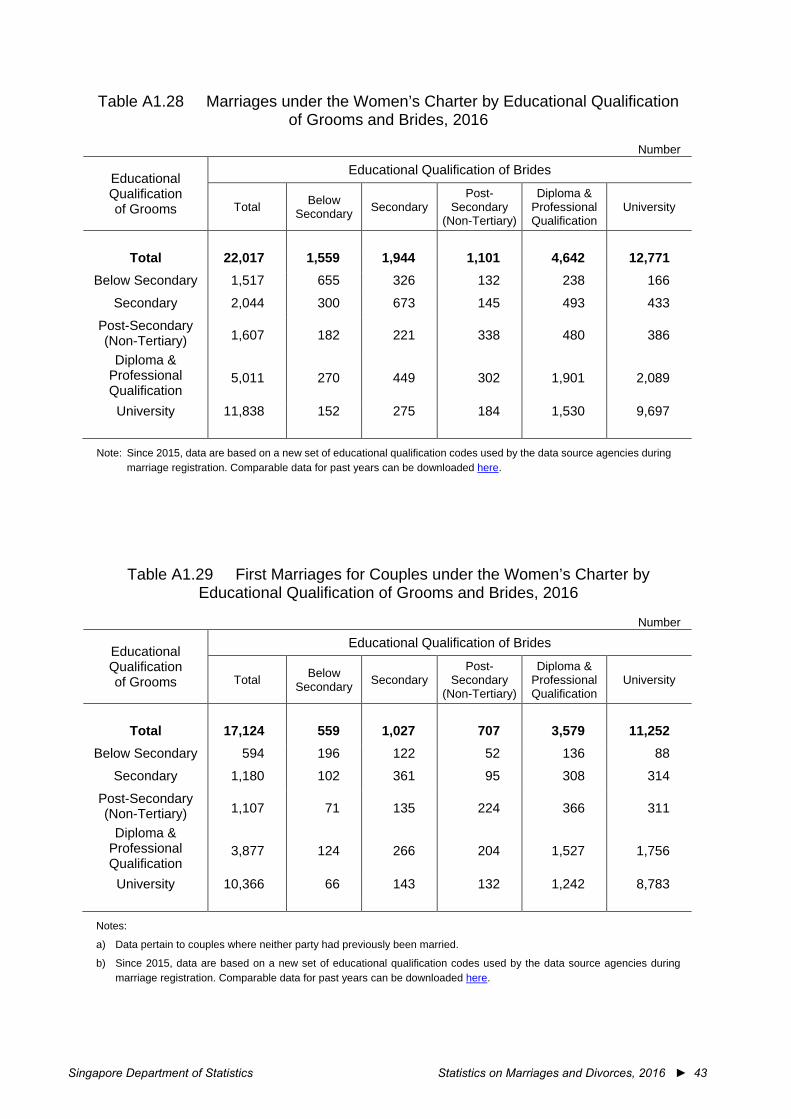
Singapore Department of Statistics Statistics on Marriages and Divorces, 2016 ► 43
Table A1.28 Marriages under the Women’s Charter by Educational Qualification
of Grooms and Brides, 2016
Number
Educational Qualification of Grooms
Educational Qualification of Brides
Total Below Secondary Secondary
Post-Secondary
(Non-Tertiary)
Diploma & Professional Qualification
University
Total 22,017 1,559 1,944 1,101 4,642 12,771 Below Secondary 1,517 655 326 132 238 166
Secondary 2,044 300 673 145 493 433
Post-Secondary (Non-Tertiary) 1,607 182 221 338 480 386
Diploma & Professional Qualification
5,011 270 449 302 1,901 2,089
University 11,838 152 275 184 1,530 9,697
Note: Since 2015, data are based on a new set of educational qualification codes used by the data source agencies during marriage registration. Comparable data for past years can be downloaded here.
Table A1.29 First Marriages for Couples under the Women’s Charter by Educational Qualification of Grooms and Brides, 2016
Number
Educational Qualification of Grooms
Educational Qualification of Brides
Total Below Secondary Secondary
Post-Secondary
(Non-Tertiary)
Diploma & Professional Qualification
University
Total 17,124 559 1,027 707 3,579 11,252 Below Secondary 594 196 122 52 136 88
Secondary 1,180 102 361 95 308 314
Post-Secondary (Non-Tertiary) 1,107 71 135 224 366 311
Diploma & Professional Qualification
3,877 124 266 204 1,527 1,756
University 10,366 66 143 132 1,242 8,783
Notes:
a) Data pertain to couples where neither party had previously been married.
b) Since 2015, data are based on a new set of educational qualification codes used by the data source agencies during marriage registration. Comparable data for past years can be downloaded here.
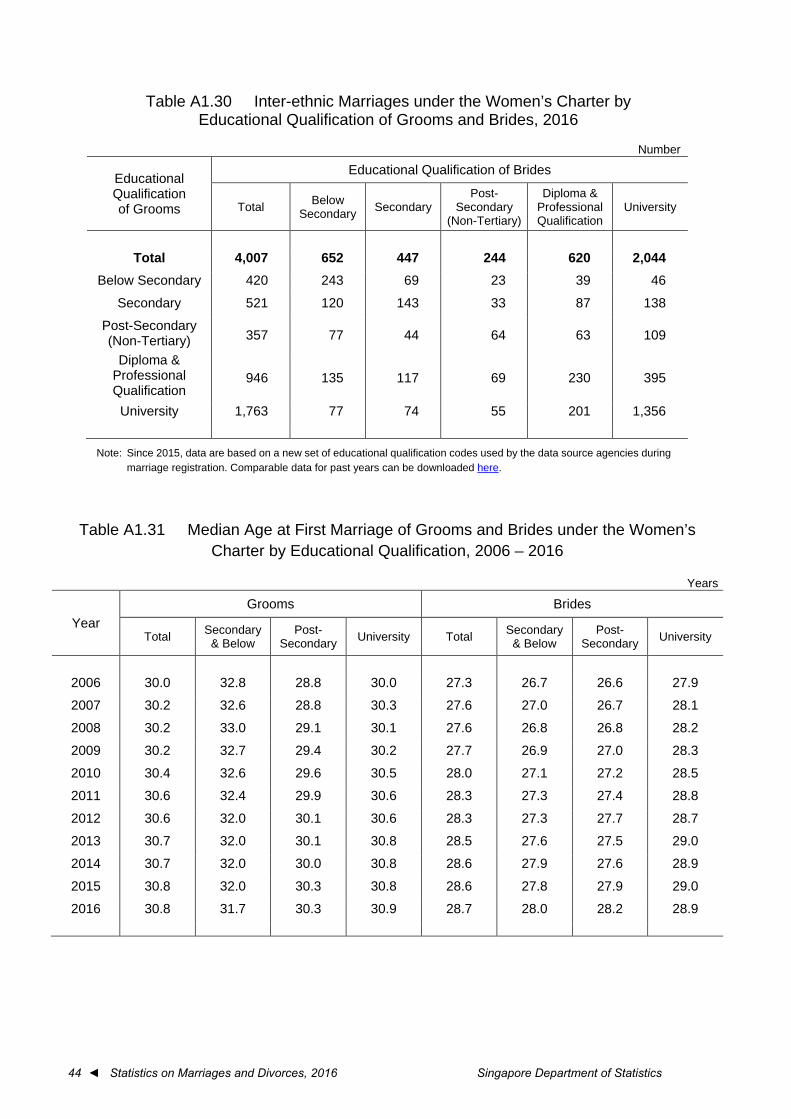
44 ◄ Statistics on Marriages and Divorces, 2016 Singapore Department of Statistics
Table A1.30 Inter-ethnic Marriages under the Women’s Charter by
Educational Qualification of Grooms and Brides, 2016
Number
Educational Qualification of Grooms
Educational Qualification of Brides
Total Below Secondary Secondary
Post-Secondary
(Non-Tertiary)
Diploma & Professional Qualification
University
Total 4,007 652 447 244 620 2,044 Below Secondary 420 243 69 23 39 46
Secondary 521 120 143 33 87 138
Post-Secondary (Non-Tertiary) 357 77 44 64 63 109
Diploma & Professional Qualification
946 135 117 69 230 395
University 1,763 77 74 55 201 1,356
Note: Since 2015, data are based on a new set of educational qualification codes used by the data source agencies during marriage registration. Comparable data for past years can be downloaded here.
Table A1.31 Median Age at First Marriage of Grooms and Brides under the Women’s Charter by Educational Qualification, 2006 – 2016
Years
Year Grooms Brides
Total Secondary & Below
Post-Secondary University Total Secondary
& Below Post-
Secondary University
2006 30.0 32.8 28.8 30.0 27.3 26.7 26.6 27.9
2007 30.2 32.6 28.8 30.3 27.6 27.0 26.7 28.1
2008 30.2 33.0 29.1 30.1 27.6 26.8 26.8 28.2
2009 30.2 32.7 29.4 30.2 27.7 26.9 27.0 28.3
2010 30.4 32.6 29.6 30.5 28.0 27.1 27.2 28.5
2011 30.6 32.4 29.9 30.6 28.3 27.3 27.4 28.8
2012 30.6 32.0 30.1 30.6 28.3 27.3 27.7 28.7
2013 30.7 32.0 30.1 30.8 28.5 27.6 27.5 29.0
2014 30.7 32.0 30.0 30.8 28.6 27.9 27.6 28.9
2015 30.8 32.0 30.3 30.8 28.6 27.8 27.9 29.0
2016 30.8 31.7 30.3 30.9 28.7 28.0 28.2 28.9
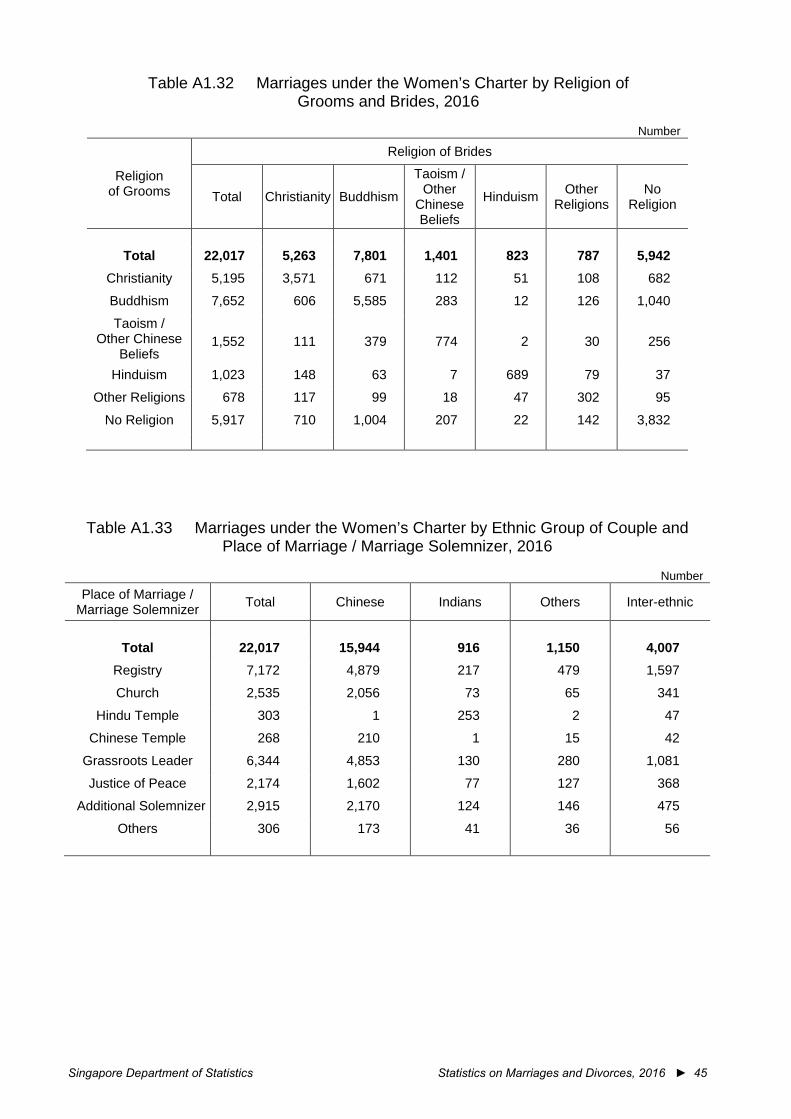
Singapore Department of Statistics Statistics on Marriages and Divorces, 2016 ► 45
Table A1.32 Marriages under the Women’s Charter by Religion of Grooms and Brides, 2016
Number
Religion of Grooms
Religion of Brides
Total Christianity Buddhism
Taoism / Other
Chinese Beliefs
Hinduism Other Religions
No Religion
Total 22,017 5,263 7,801 1,401 823 787 5,942 Christianity 5,195 3,571 671 112 51 108 682
Buddhism 7,652 606 5,585 283 12 126 1,040
Taoism / Other Chinese
Beliefs 1,552 111 379 774 2 30 256
Hinduism 1,023 148 63 7 689 79 37
Other Religions 678 117 99 18 47 302 95
No Religion 5,917 710 1,004 207 22 142 3,832
Table A1.33 Marriages under the Women’s Charter by Ethnic Group of Couple and Place of Marriage / Marriage Solemnizer, 2016
Number
Place of Marriage / Marriage Solemnizer Total Chinese Indians Others Inter-ethnic
Total 22,017 15,944 916 1,150 4,007 Registry 7,172 4,879 217 479 1,597
Church 2,535 2,056 73 65 341
Hindu Temple 303 1 253 2 47
Chinese Temple 268 210 1 15 42
Grassroots Leader 6,344 4,853 130 280 1,081
Justice of Peace 2,174 1,602 77 127 368
Additional Solemnizer 2,915 2,170 124 146 475
Others 306 173 41 36 56
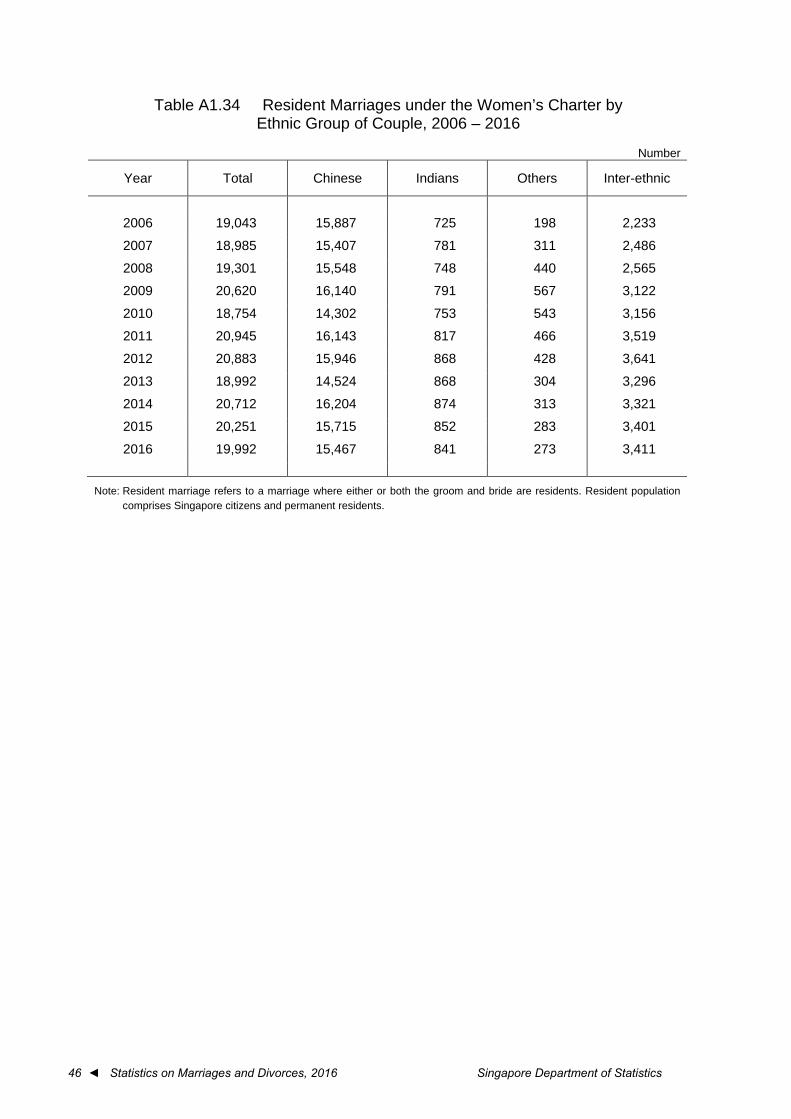
46 ◄ Statistics on Marriages and Divorces, 2016 Singapore Department of Statistics
Table A1.34 Resident Marriages under the Women’s Charter by
Ethnic Group of Couple, 2006 – 2016
Number
Year Total Chinese Indians Others Inter-ethnic
2006 19,043 15,887 725 198 2,233
2007 18,985 15,407 781 311 2,486
2008 19,301 15,548 748 440 2,565
2009 20,620 16,140 791 567 3,122
2010 18,754 14,302 753 543 3,156
2011 20,945 16,143 817 466 3,519
2012 20,883 15,946 868 428 3,641
2013 18,992 14,524 868 304 3,296
2014 20,712 16,204 874 313 3,321
2015 20,251 15,715 852 283 3,401
2016 19,992 15,467 841 273 3,411
Note: Resident marriage refers to a marriage where either or both the groom and bride are residents. Resident population comprises Singapore citizens and permanent residents.
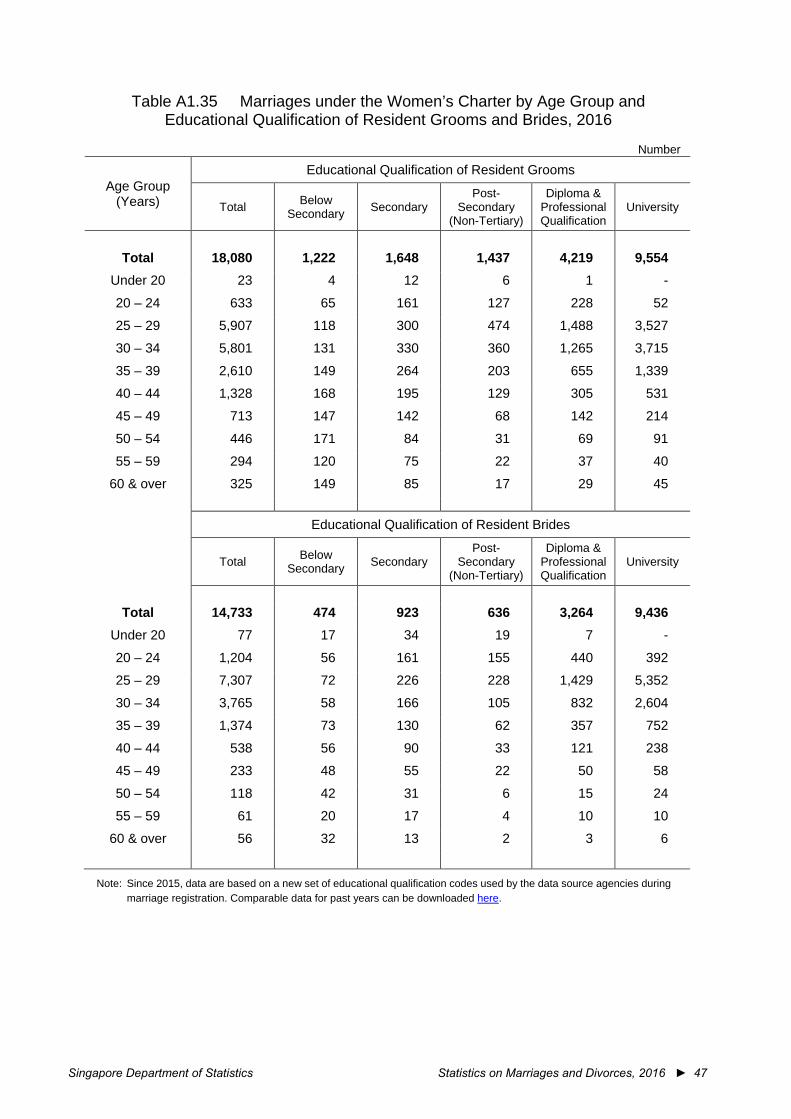
Singapore Department of Statistics Statistics on Marriages and Divorces, 2016 ► 47
Table A1.35 Marriages under the Women’s Charter by Age Group and
Educational Qualification of Resident Grooms and Brides, 2016
Number
Age Group (Years)
Educational Qualification of Resident Grooms
Total Below Secondary Secondary
Post-Secondary
(Non-Tertiary)
Diploma & Professional Qualification
University
Total 18,080 1,222 1,648 1,437 4,219 9,554 Under 20 23 4 12 6 1 -
20 – 24 633 65 161 127 228 52
25 – 29 5,907 118 300 474 1,488 3,527
30 – 34 5,801 131 330 360 1,265 3,715
35 – 39 2,610 149 264 203 655 1,339
40 – 44 1,328 168 195 129 305 531
45 – 49 713 147 142 68 142 214
50 – 54 446 171 84 31 69 91
55 – 59 294 120 75 22 37 40
60 & over 325 149 85 17 29 45 Educational Qualification of Resident Brides
Total Below Secondary Secondary
Post-Secondary
(Non-Tertiary)
Diploma & Professional Qualification
University
Total 14,733 474 923 636 3,264 9,436 Under 20 77 17 34 19 7 -
20 – 24 1,204 56 161 155 440 392
25 – 29 7,307 72 226 228 1,429 5,352
30 – 34 3,765 58 166 105 832 2,604
35 – 39 1,374 73 130 62 357 752
40 – 44 538 56 90 33 121 238
45 – 49 233 48 55 22 50 58
50 – 54 118 42 31 6 15 24
55 – 59 61 20 17 4 10 10
60 & over 56 32 13 2 3 6
Note: Since 2015, data are based on a new set of educational qualification codes used by the data source agencies during marriage registration. Comparable data for past years can be downloaded here.
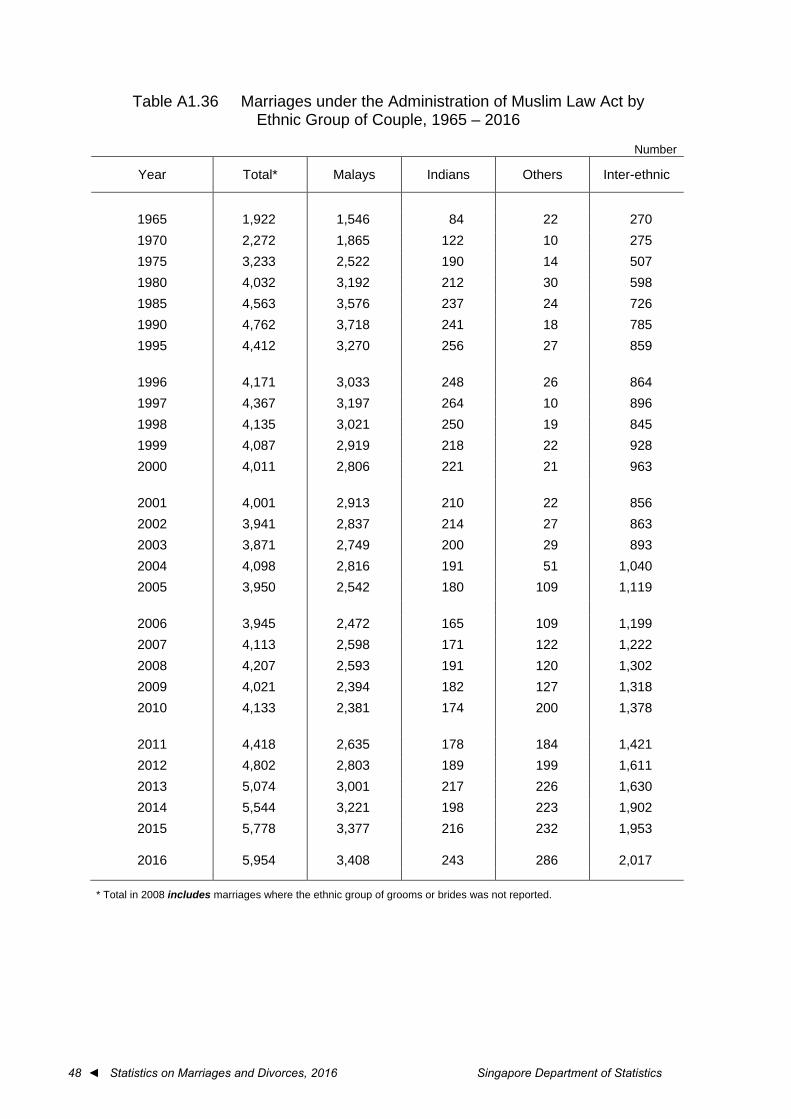
48 ◄ Statistics on Marriages and Divorces, 2016 Singapore Department of Statistics
Table A1.36 Marriages under the Administration of Muslim Law Act by
Ethnic Group of Couple, 1965 – 2016
Number
Year Total* Malays Indians Others Inter-ethnic
1965 1,922 1,546 84 22 270 1970 2,272 1,865 122 10 275 1975 3,233 2,522 190 14 507 1980 4,032 3,192 212 30 598 1985 4,563 3,576 237 24 726 1990 4,762 3,718 241 18 785 1995 4,412 3,270 256 27 859
1996 4,171 3,033 248 26 864 1997 4,367 3,197 264 10 896 1998 4,135 3,021 250 19 845 1999 4,087 2,919 218 22 928 2000 4,011 2,806 221 21 963
2001 4,001 2,913 210 22 856 2002 3,941 2,837 214 27 863 2003 3,871 2,749 200 29 893 2004 4,098 2,816 191 51 1,040 2005 3,950 2,542 180 109 1,119
2006 3,945 2,472 165 109 1,199 2007 4,113 2,598 171 122 1,222 2008 4,207 2,593 191 120 1,302 2009 4,021 2,394 182 127 1,318 2010 4,133 2,381 174 200 1,378
2011 4,418 2,635 178 184 1,421 2012 4,802 2,803 189 199 1,611 2013 5,074 3,001 217 226 1,630 2014 5,544 3,221 198 223 1,902 2015 5,778 3,377 216 232 1,953
2016 5,954 3,408 243 286 2,017
* Total in 2008 includes marriages where the ethnic group of grooms or brides was not reported.

Singapore Department of Statistics Statistics on Marriages and Divorces, 2016 ► 49
Table A1.37 Marriages under the Administration of Muslim Law Act by
Age Group of Grooms, 1965 – 2016
Number
Year Age Group of Grooms (Years)
Total* Under20 20-24 25-29 30-34 35-39 40-44 45-49 50-54 55-59 60 &
over
1965 1,922 75 632 695 245 102 87 36 21 10 12 1970 2,272 86 969 659 293 105 54 37 30 16 23 1975 3,233 116 1,356 1,200 247 128 82 35 34 14 21 1980 4,032 110 1,593 1,552 416 142 82 50 32 26 29 1985 4,563 69 1,678 1,848 575 166 70 62 34 26 35 1990 4,762 67 1,164 2,198 746 293 117 60 44 33 40 1995 4,412 68 878 1,743 903 391 206 96 44 32 51
1996 4,171 83 842 1,606 799 387 198 113 50 32 61 1997 4,367 72 858 1,612 884 451 216 113 64 36 61 1998 4,135 72 741 1,532 869 424 235 108 62 43 49 1999 4,087 76 739 1,542 755 427 250 140 72 31 55 2000 4,011 103 688 1,479 705 442 278 140 78 39 59
2001 4,001 98 697 1,451 733 448 245 146 86 39 58 2002 3,941 95 666 1,497 723 422 232 148 68 45 45 2003 3,871 88 656 1,391 748 441 231 155 82 42 37 2004 4,098 88 711 1,377 784 471 278 185 114 53 37 2005 3,950 72 668 1,410 739 425 258 173 101 56 48
2006 3,945 72 628 1,433 756 389 284 170 108 44 61 2007 4,113 60 646 1,526 762 377 308 201 114 62 57 2008 4,207 72 578 1,696 743 426 281 189 94 77 51 2009 4,021 50 513 1,684 716 398 270 161 108 54 67 2010 4,133 36 557 1,666 805 443 254 161 83 70 58
2011 4,418 42 506 1,883 878 428 260 190 112 64 55 2012 4,802 38 610 2,106 946 441 246 176 123 54 62 2013 5,074 28 578 2,177 1084 446 293 196 131 80 61 2014 5,544 33 591 2,444 1273 413 297 218 138 80 57 2015 5,778 48 613 2,507 1282 481 283 215 169 90 90
2016 5,954 27 591 2,727 1,268 476 312 204 168 88 93
* Total in 1965 includes marriages where the age of grooms was not reported.
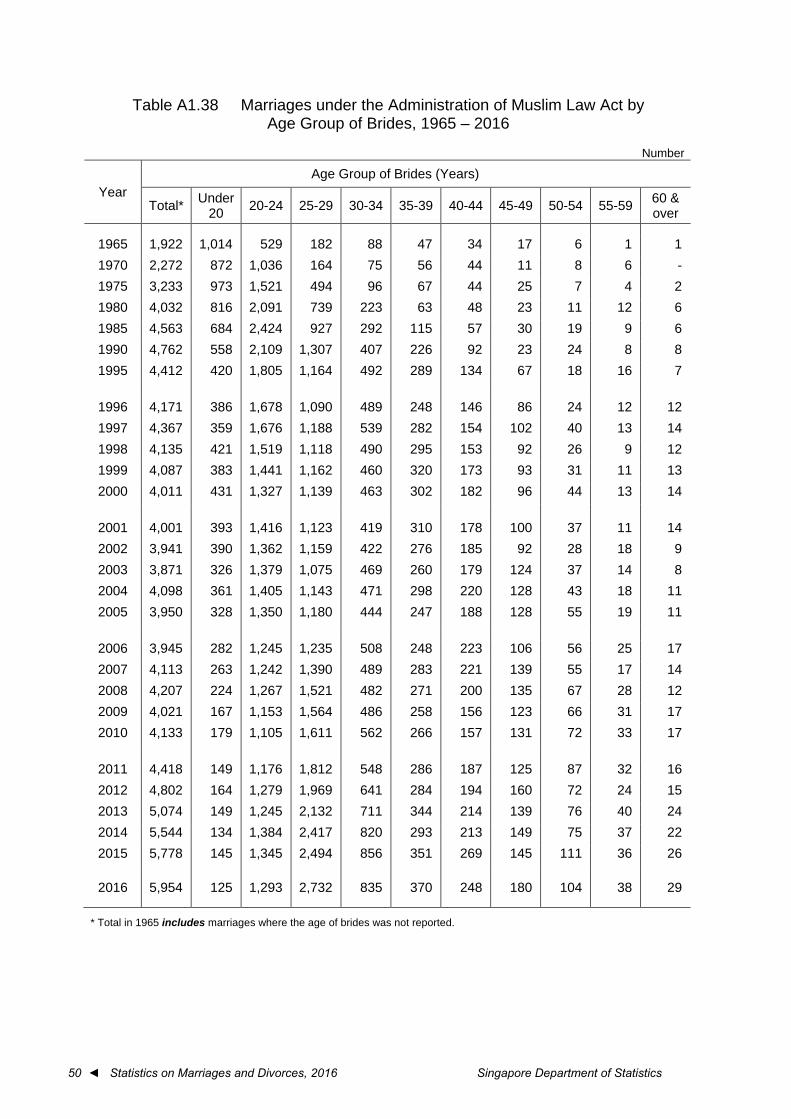
50 ◄ Statistics on Marriages and Divorces, 2016 Singapore Department of Statistics
Table A1.38 Marriages under the Administration of Muslim Law Act by
Age Group of Brides, 1965 – 2016
Number
Year Age Group of Brides (Years)
Total* Under 20 20-24 25-29 30-34 35-39 40-44 45-49 50-54 55-59 60 &
over
1965 1,922 1,014 529 182 88 47 34 17 6 1 1 1970 2,272 872 1,036 164 75 56 44 11 8 6 - 1975 3,233 973 1,521 494 96 67 44 25 7 4 2 1980 4,032 816 2,091 739 223 63 48 23 11 12 6 1985 4,563 684 2,424 927 292 115 57 30 19 9 6 1990 4,762 558 2,109 1,307 407 226 92 23 24 8 8 1995 4,412 420 1,805 1,164 492 289 134 67 18 16 7
1996 4,171 386 1,678 1,090 489 248 146 86 24 12 12 1997 4,367 359 1,676 1,188 539 282 154 102 40 13 14 1998 4,135 421 1,519 1,118 490 295 153 92 26 9 12 1999 4,087 383 1,441 1,162 460 320 173 93 31 11 13 2000 4,011 431 1,327 1,139 463 302 182 96 44 13 14
2001 4,001 393 1,416 1,123 419 310 178 100 37 11 14 2002 3,941 390 1,362 1,159 422 276 185 92 28 18 9 2003 3,871 326 1,379 1,075 469 260 179 124 37 14 8 2004 4,098 361 1,405 1,143 471 298 220 128 43 18 11 2005 3,950 328 1,350 1,180 444 247 188 128 55 19 11
2006 3,945 282 1,245 1,235 508 248 223 106 56 25 17 2007 4,113 263 1,242 1,390 489 283 221 139 55 17 14 2008 4,207 224 1,267 1,521 482 271 200 135 67 28 12 2009 4,021 167 1,153 1,564 486 258 156 123 66 31 17 2010 4,133 179 1,105 1,611 562 266 157 131 72 33 17
2011 4,418 149 1,176 1,812 548 286 187 125 87 32 16 2012 4,802 164 1,279 1,969 641 284 194 160 72 24 15 2013 5,074 149 1,245 2,132 711 344 214 139 76 40 24 2014 5,544 134 1,384 2,417 820 293 213 149 75 37 22 2015 5,778 145 1,345 2,494 856 351 269 145 111 36 26
2016 5,954 125 1,293 2,732 835 370 248 180 104 38 29
* Total in 1965 includes marriages where the age of brides was not reported.
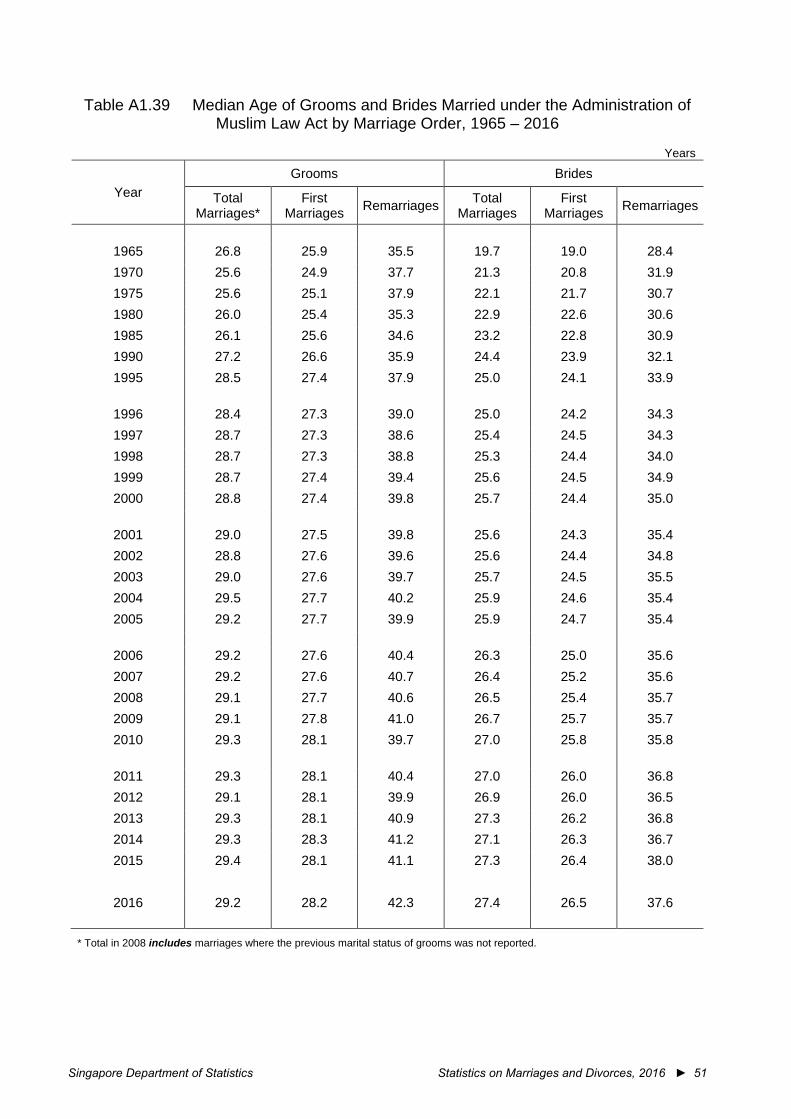
Singapore Department of Statistics Statistics on Marriages and Divorces, 2016 ► 51
Table A1.39 Median Age of Grooms and Brides Married under the Administration of
Muslim Law Act by Marriage Order, 1965 – 2016
Years
Year Grooms Brides
Total Marriages*
First Marriages Remarriages Total
Marriages First
Marriages Remarriages
1965 26.8 25.9 35.5 19.7 19.0 28.4 1970 25.6 24.9 37.7 21.3 20.8 31.9 1975 25.6 25.1 37.9 22.1 21.7 30.7 1980 26.0 25.4 35.3 22.9 22.6 30.6 1985 26.1 25.6 34.6 23.2 22.8 30.9 1990 27.2 26.6 35.9 24.4 23.9 32.1 1995 28.5 27.4 37.9 25.0 24.1 33.9
1996 28.4 27.3 39.0 25.0 24.2 34.3 1997 28.7 27.3 38.6 25.4 24.5 34.3 1998 28.7 27.3 38.8 25.3 24.4 34.0 1999 28.7 27.4 39.4 25.6 24.5 34.9 2000 28.8 27.4 39.8 25.7 24.4 35.0
2001 29.0 27.5 39.8 25.6 24.3 35.4 2002 28.8 27.6 39.6 25.6 24.4 34.8 2003 29.0 27.6 39.7 25.7 24.5 35.5 2004 29.5 27.7 40.2 25.9 24.6 35.4 2005 29.2 27.7 39.9 25.9 24.7 35.4
2006 29.2 27.6 40.4 26.3 25.0 35.6 2007 29.2 27.6 40.7 26.4 25.2 35.6 2008 29.1 27.7 40.6 26.5 25.4 35.7 2009 29.1 27.8 41.0 26.7 25.7 35.7 2010 29.3 28.1 39.7 27.0 25.8 35.8
2011 29.3 28.1 40.4 27.0 26.0 36.8 2012 29.1 28.1 39.9 26.9 26.0 36.5 2013 29.3 28.1 40.9 27.3 26.2 36.8 2014 29.3 28.3 41.2 27.1 26.3 36.7 2015 29.4 28.1 41.1 27.3 26.4 38.0
2016 29.2 28.2 42.3 27.4 26.5 37.6
* Total in 2008 includes marriages where the previous marital status of grooms was not reported.
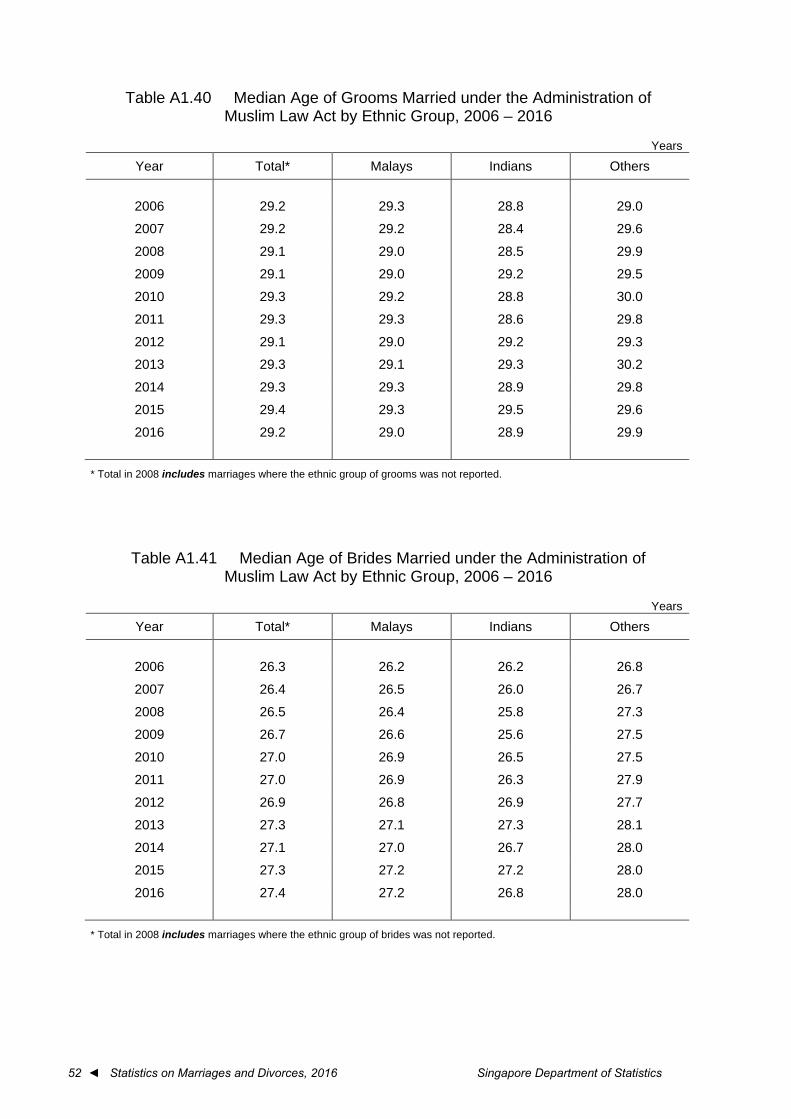
52 ◄ Statistics on Marriages and Divorces, 2016 Singapore Department of Statistics
Table A1.40 Median Age of Grooms Married under the Administration of Muslim Law Act by Ethnic Group, 2006 – 2016
Years
Year Total* Malays Indians Others
2006 29.2 29.3 28.8 29.0
2007 29.2 29.2 28.4 29.6
2008 29.1 29.0 28.5 29.9
2009 29.1 29.0 29.2 29.5
2010 29.3 29.2 28.8 30.0
2011 29.3 29.3 28.6 29.8
2012 29.1 29.0 29.2 29.3
2013 29.3 29.1 29.3 30.2
2014 29.3 29.3 28.9 29.8
2015 29.4 29.3 29.5 29.6
2016 29.2 29.0 28.9 29.9
* Total in 2008 includes marriages where the ethnic group of grooms was not reported.
Table A1.41 Median Age of Brides Married under the Administration of Muslim Law Act by Ethnic Group, 2006 – 2016
Years
Year Total* Malays Indians Others
2006 26.3 26.2 26.2 26.8
2007 26.4 26.5 26.0 26.7
2008 26.5 26.4 25.8 27.3
2009 26.7 26.6 25.6 27.5
2010 27.0 26.9 26.5 27.5
2011 27.0 26.9 26.3 27.9
2012 26.9 26.8 26.9 27.7
2013 27.3 27.1 27.3 28.1
2014 27.1 27.0 26.7 28.0
2015 27.3 27.2 27.2 28.0
2016 27.4 27.2 26.8 28.0
* Total in 2008 includes marriages where the ethnic group of brides was not reported.
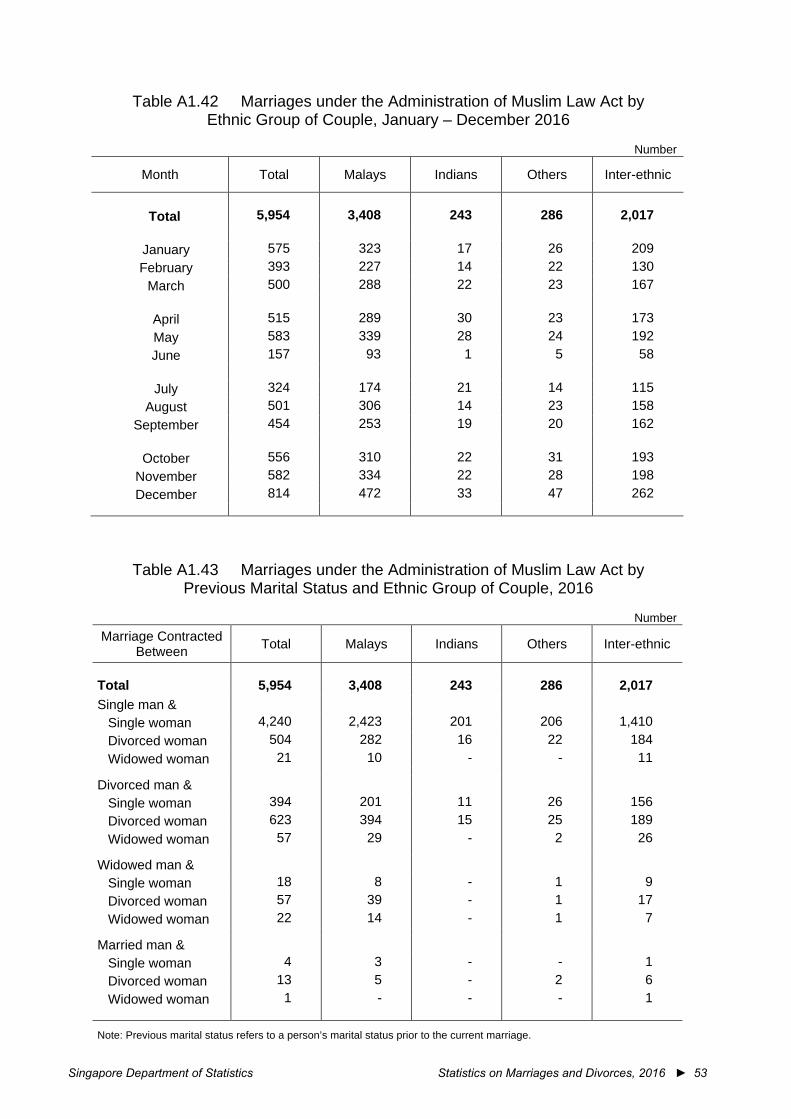
Singapore Department of Statistics Statistics on Marriages and Divorces, 2016 ► 53
Table A1.42 Marriages under the Administration of Muslim Law Act by
Ethnic Group of Couple, January – December 2016
Number
Month Total Malays Indians Others Inter-ethnic
Total 5,954 3,408 243 286 2,017
January 575 323 17 26 209 February 393 227 14 22 130
March 500 288 22 23 167
April 515 289 30 23 173 May 583 339 28 24 192 June 157 93 1 5 58
July 324 174 21 14 115
August 501 306 14 23 158 September 454 253 19 20 162
October 556 310 22 31 193
November 582 334 22 28 198 December 814 472 33 47 262
Table A1.43 Marriages under the Administration of Muslim Law Act by Previous Marital Status and Ethnic Group of Couple, 2016
Number
Marriage Contracted Between Total Malays Indians Others Inter-ethnic
Total 5,954 3,408 243 286 2,017 Single man &
Single woman 4,240 2,423 201 206 1,410 Divorced woman 504 282 16 22 184 Widowed woman 21 10 - - 11
Divorced man &
Single woman 394 201 11 26 156 Divorced woman 623 394 15 25 189 Widowed woman 57 29 - 2 26
Widowed man &
Single woman 18 8 - 1 9 Divorced woman 57 39 - 1 17 Widowed woman 22 14 - 1 7
Married man &
Single woman 4 3 - - 1 Divorced woman 13 5 - 2 6 Widowed woman 1 - - - 1
Note: Previous marital status refers to a person’s marital status prior to the current marriage.
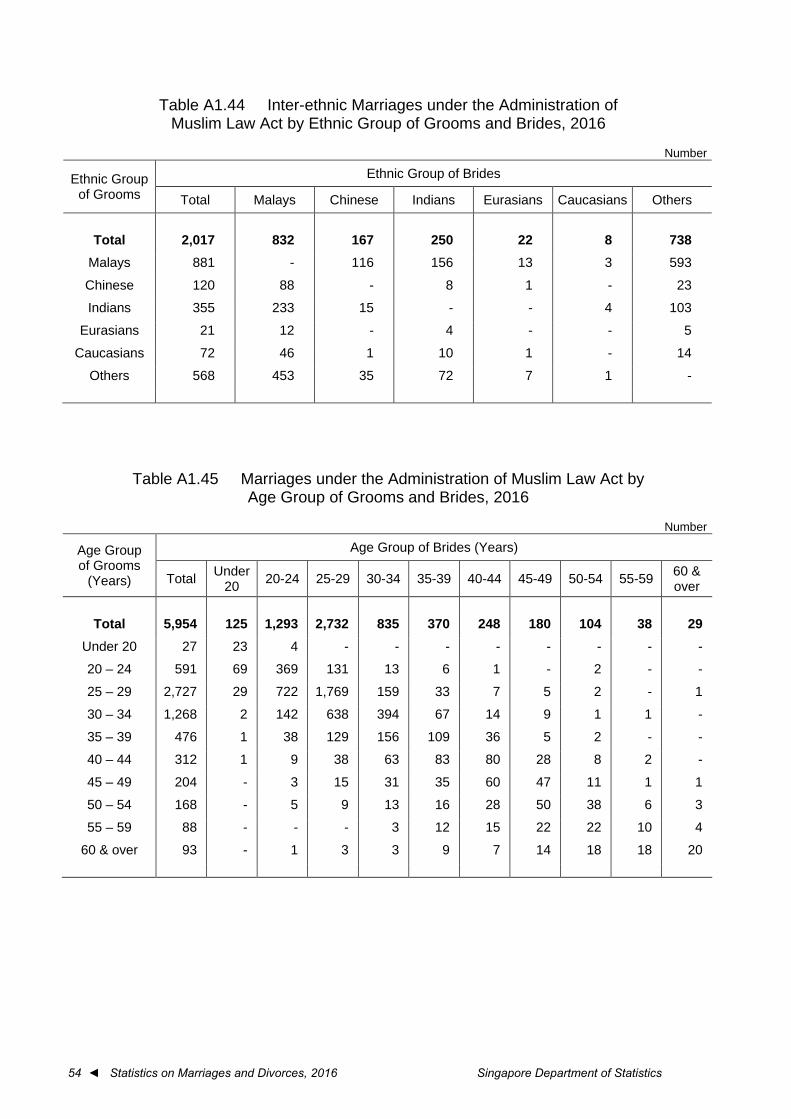
54 ◄ Statistics on Marriages and Divorces, 2016 Singapore Department of Statistics
Table A1.44 Inter-ethnic Marriages under the Administration of
Muslim Law Act by Ethnic Group of Grooms and Brides, 2016
Number
Ethnic Group of Grooms
Ethnic Group of Brides
Total Malays Chinese Indians Eurasians Caucasians Others
Total 2,017 832 167 250 22 8 738 Malays 881 - 116 156 13 3 593
Chinese 120 88 - 8 1 - 23
Indians 355 233 15 - - 4 103
Eurasians 21 12 - 4 - - 5
Caucasians 72 46 1 10 1 - 14
Others 568 453 35 72 7 1 -
Table A1.45 Marriages under the Administration of Muslim Law Act by Age Group of Grooms and Brides, 2016
Number
Age Group of Grooms
(Years)
Age Group of Brides (Years)
Total Under 20 20-24 25-29 30-34 35-39 40-44 45-49 50-54 55-59 60 &
over
Total 5,954 125 1,293 2,732 835 370 248 180 104 38 29 Under 20 27 23 4 - - - - - - - -
20 – 24 591 69 369 131 13 6 1 - 2 - -
25 – 29 2,727 29 722 1,769 159 33 7 5 2 - 1
30 – 34 1,268 2 142 638 394 67 14 9 1 1 -
35 – 39 476 1 38 129 156 109 36 5 2 - -
40 – 44 312 1 9 38 63 83 80 28 8 2 -
45 – 49 204 - 3 15 31 35 60 47 11 1 1
50 – 54 168 - 5 9 13 16 28 50 38 6 3
55 – 59 88 - - - 3 12 15 22 22 10 4
60 & over 93 - 1 3 3 9 7 14 18 18 20
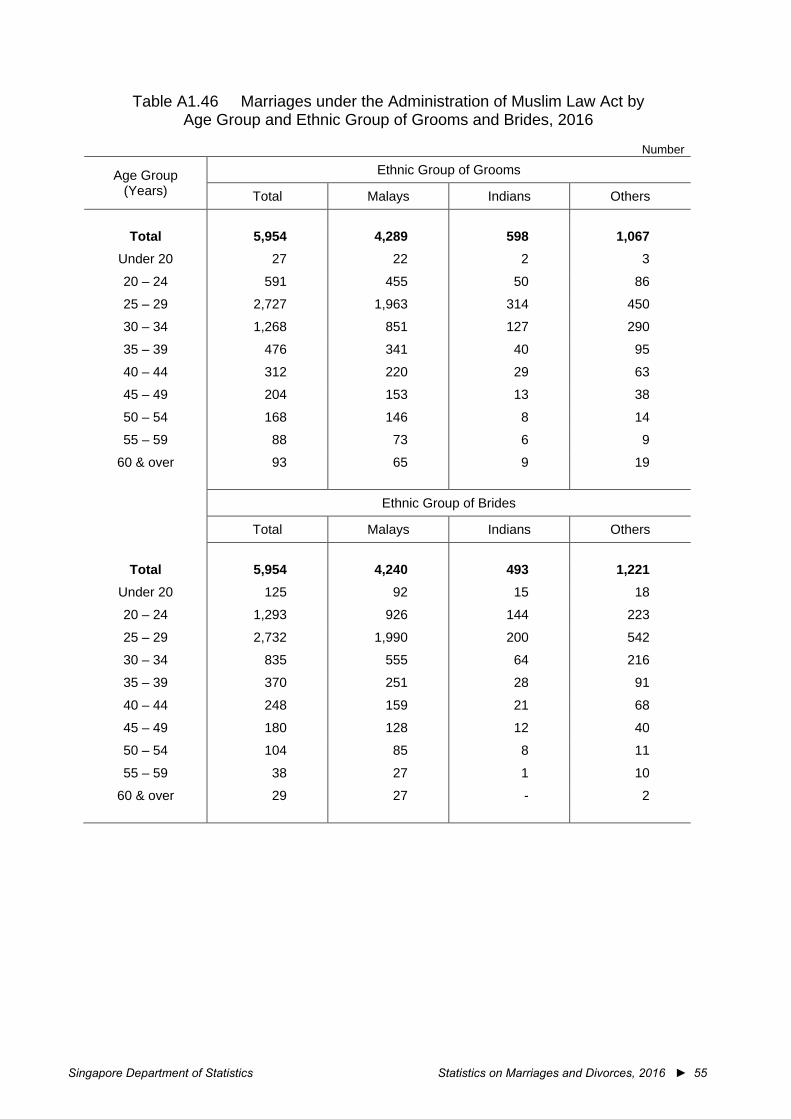
Singapore Department of Statistics Statistics on Marriages and Divorces, 2016 ► 55
Table A1.46 Marriages under the Administration of Muslim Law Act by
Age Group and Ethnic Group of Grooms and Brides, 2016
Number
Age Group (Years)
Ethnic Group of Grooms
Total Malays Indians Others
Total 5,954 4,289 598 1,067 Under 20 27 22 2 3
20 – 24 591 455 50 86
25 – 29 2,727 1,963 314 450
30 – 34 1,268 851 127 290
35 – 39 476 341 40 95
40 – 44 312 220 29 63
45 – 49 204 153 13 38
50 – 54 168 146 8 14
55 – 59 88 73 6 9
60 & over 93 65 9 19 Ethnic Group of Brides Total Malays Indians Others
Total 5,954 4,240 493 1,221 Under 20 125 92 15 18
20 – 24 1,293 926 144 223
25 – 29 2,732 1,990 200 542
30 – 34 835 555 64 216
35 – 39 370 251 28 91
40 – 44 248 159 21 68
45 – 49 180 128 12 40
50 – 54 104 85 8 11
55 – 59 38 27 1 10
60 & over 29 27 - 2
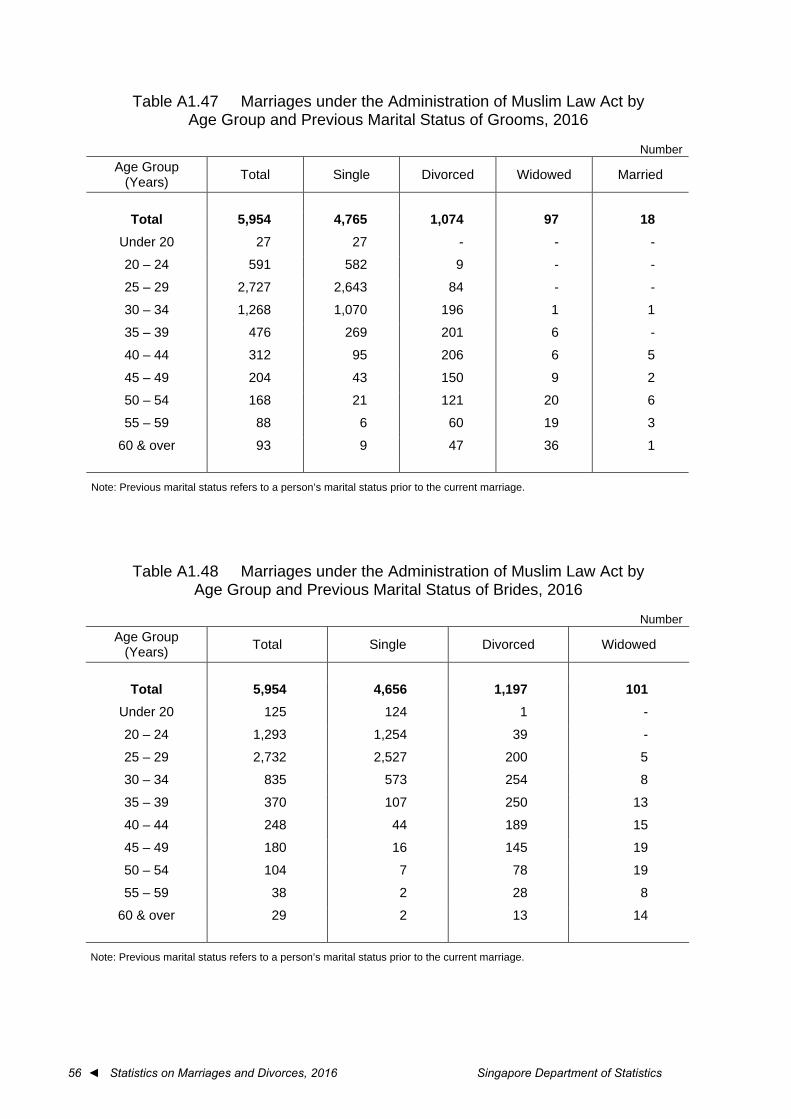
56 ◄ Statistics on Marriages and Divorces, 2016 Singapore Department of Statistics
Table A1.47 Marriages under the Administration of Muslim Law Act by
Age Group and Previous Marital Status of Grooms, 2016
Number Age Group
(Years) Total Single Divorced Widowed Married
Total 5,954 4,765 1,074 97 18 Under 20 27 27 - - -
20 – 24 591 582 9 - -
25 – 29 2,727 2,643 84 - -
30 – 34 1,268 1,070 196 1 1
35 – 39 476 269 201 6 -
40 – 44 312 95 206 6 5
45 – 49 204 43 150 9 2
50 – 54 168 21 121 20 6
55 – 59 88 6 60 19 3
60 & over 93 9 47 36 1
Note: Previous marital status refers to a person’s marital status prior to the current marriage.
Table A1.48 Marriages under the Administration of Muslim Law Act by Age Group and Previous Marital Status of Brides, 2016
Number
Age Group (Years) Total Single Divorced Widowed
Total 5,954 4,656 1,197 101 Under 20 125 124 1 -
20 – 24 1,293 1,254 39 -
25 – 29 2,732 2,527 200 5
30 – 34 835 573 254 8
35 – 39 370 107 250 13
40 – 44 248 44 189 15
45 – 49 180 16 145 19
50 – 54 104 7 78 19
55 – 59 38 2 28 8
60 & over 29 2 13 14
Note: Previous marital status refers to a person’s marital status prior to the current marriage.
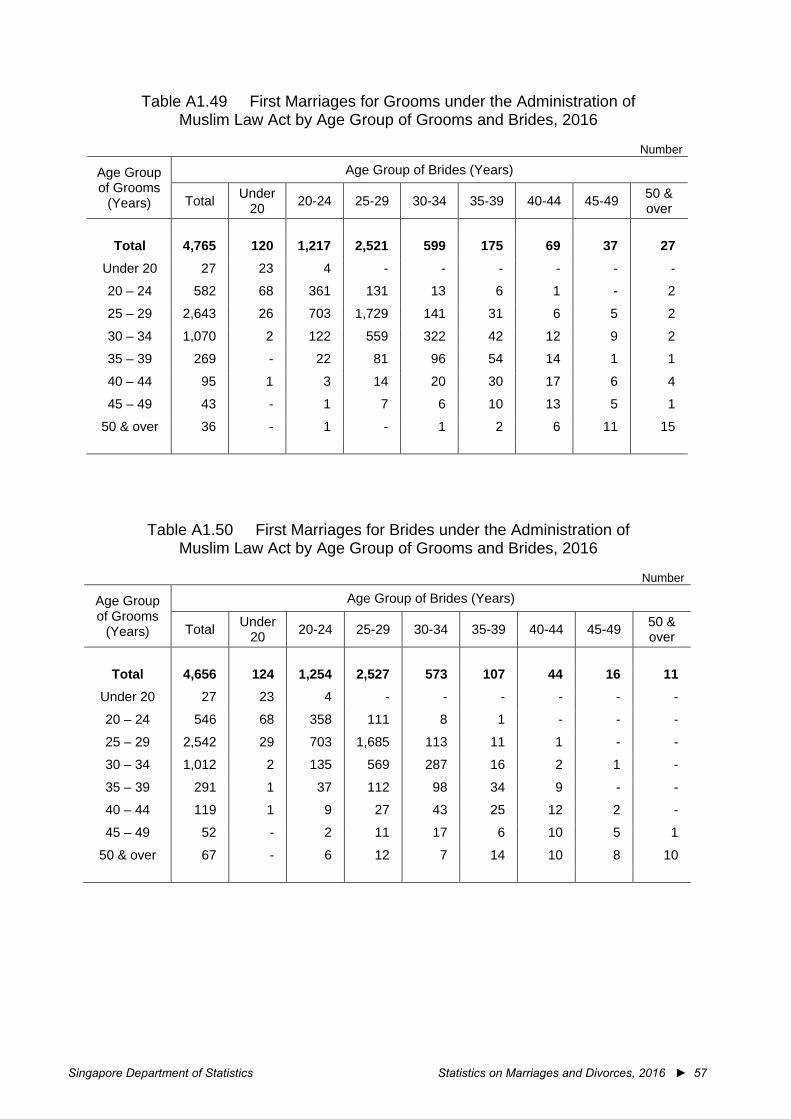
Singapore Department of Statistics Statistics on Marriages and Divorces, 2016 ► 57
Table A1.49 First Marriages for Grooms under the Administration of
Muslim Law Act by Age Group of Grooms and Brides, 2016
Number
Age Group of Grooms
(Years)
Age Group of Brides (Years)
Total Under 20 20-24 25-29 30-34 35-39 40-44 45-49 50 &
over
Total 4,765 120 1,217 2,521 599 175 69 37 27 Under 20 27 23 4 - - - - - -
20 – 24 582 68 361 131 13 6 1 - 2
25 – 29 2,643 26 703 1,729 141 31 6 5 2
30 – 34 1,070 2 122 559 322 42 12 9 2
35 – 39 269 - 22 81 96 54 14 1 1
40 – 44 95 1 3 14 20 30 17 6 4
45 – 49 43 - 1 7 6 10 13 5 1
50 & over 36 - 1 - 1 2 6 11 15
Table A1.50 First Marriages for Brides under the Administration of Muslim Law Act by Age Group of Grooms and Brides, 2016
Number
Age Group of Grooms
(Years)
Age Group of Brides (Years)
Total Under 20 20-24 25-29 30-34 35-39 40-44 45-49 50 &
over
Total 4,656 124 1,254 2,527 573 107 44 16 11 Under 20 27 23 4 - - - - - -
20 – 24 546 68 358 111 8 1 - - -
25 – 29 2,542 29 703 1,685 113 11 1 - -
30 – 34 1,012 2 135 569 287 16 2 1 -
35 – 39 291 1 37 112 98 34 9 - -
40 – 44 119 1 9 27 43 25 12 2 -
45 – 49 52 - 2 11 17 6 10 5 1
50 & over 67 - 6 12 7 14 10 8 10
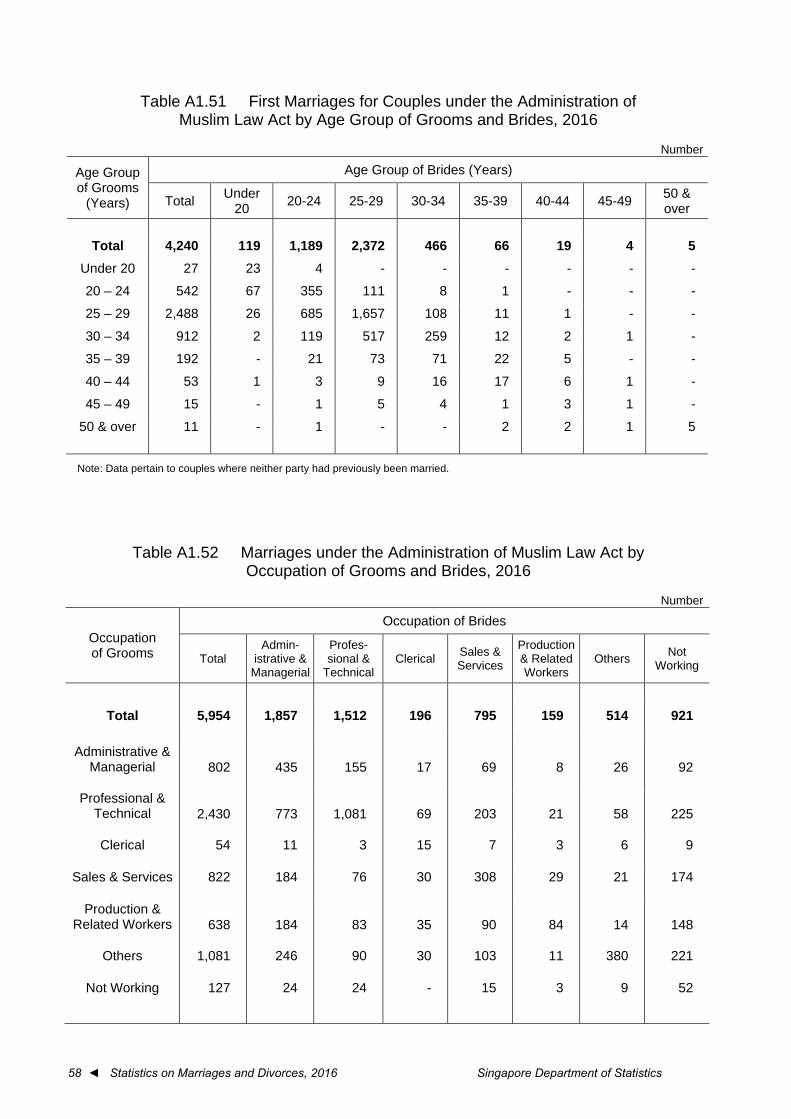
58 ◄ Statistics on Marriages and Divorces, 2016 Singapore Department of Statistics
Table A1.51 First Marriages for Couples under the Administration of
Muslim Law Act by Age Group of Grooms and Brides, 2016
Number
Age Group of Grooms
(Years)
Age Group of Brides (Years)
Total Under 20 20-24 25-29 30-34 35-39 40-44 45-49 50 &
over
Total 4,240 119 1,189 2,372 466 66 19 4 5 Under 20 27 23 4 - - - - - -
20 – 24 542 67 355 111 8 1 - - -
25 – 29 2,488 26 685 1,657 108 11 1 - -
30 – 34 912 2 119 517 259 12 2 1 -
35 – 39 192 - 21 73 71 22 5 - -
40 – 44 53 1 3 9 16 17 6 1 -
45 – 49 15 - 1 5 4 1 3 1 -
50 & over 11 - 1 - - 2 2 1 5
Note: Data pertain to couples where neither party had previously been married.
Table A1.52 Marriages under the Administration of Muslim Law Act by Occupation of Grooms and Brides, 2016
Number
Occupation of Grooms
Occupation of Brides
Total Admin-
istrative & Managerial
Profes- sional &
Technical Clerical Sales &
Services
Production & Related Workers
Others Not Working
Total 5,954 1,857 1,512 196 795 159 514 921
Administrative & Managerial 802 435 155 17 69 8 26 92
Professional & Technical 2,430 773 1,081 69 203 21 58 225
Clerical 54 11 3 15 7 3 6 9
Sales & Services 822 184 76 30 308 29 21 174
Production & Related Workers 638 184 83 35 90 84 14 148
Others 1,081 246 90 30 103 11 380 221
Not Working 127 24 24 - 15 3 9 52
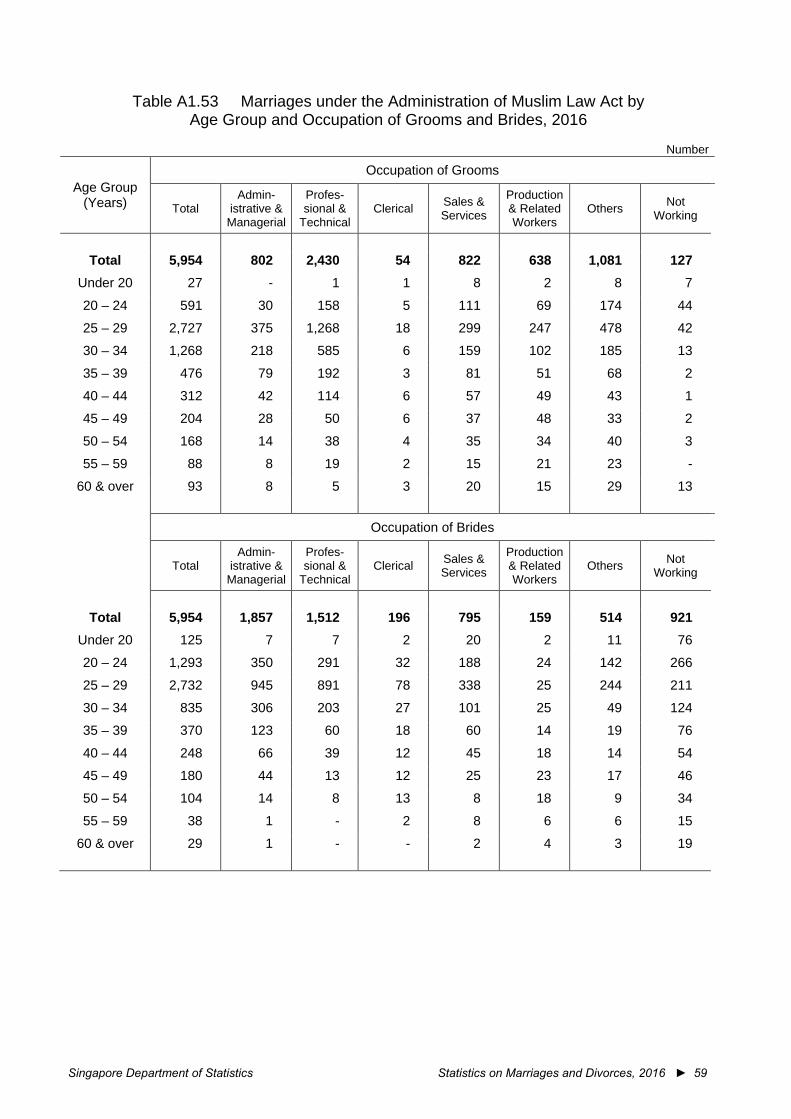
Singapore Department of Statistics Statistics on Marriages and Divorces, 2016 ► 59
Table A1.53 Marriages under the Administration of Muslim Law Act by
Age Group and Occupation of Grooms and Brides, 2016
Number
Age Group (Years)
Occupation of Grooms
Total Admin-
istrative & Managerial
Profes- sional &
Technical Clerical Sales &
Services
Production & Related Workers
Others Not Working
Total 5,954 802 2,430 54 822 638 1,081 127 Under 20 27 - 1 1 8 2 8 7
20 – 24 591 30 158 5 111 69 174 44
25 – 29 2,727 375 1,268 18 299 247 478 42
30 – 34 1,268 218 585 6 159 102 185 13
35 – 39 476 79 192 3 81 51 68 2
40 – 44 312 42 114 6 57 49 43 1
45 – 49 204 28 50 6 37 48 33 2
50 – 54 168 14 38 4 35 34 40 3
55 – 59 88 8 19 2 15 21 23 -
60 & over 93 8 5 3 20 15 29 13
Occupation of Brides
Total
Admin- istrative &
Managerial
Profes- sional &
Technical Clerical Sales &
Services
Production & Related Workers
Others Not Working
Total 5,954 1,857 1,512 196 795 159 514 921 Under 20 125 7 7 2 20 2 11 76
20 – 24 1,293 350 291 32 188 24 142 266
25 – 29 2,732 945 891 78 338 25 244 211
30 – 34 835 306 203 27 101 25 49 124
35 – 39 370 123 60 18 60 14 19 76
40 – 44 248 66 39 12 45 18 14 54
45 – 49 180 44 13 12 25 23 17 46
50 – 54 104 14 8 13 8 18 9 34
55 – 59 38 1 - 2 8 6 6 15
60 & over 29 1 - - 2 4 3 19
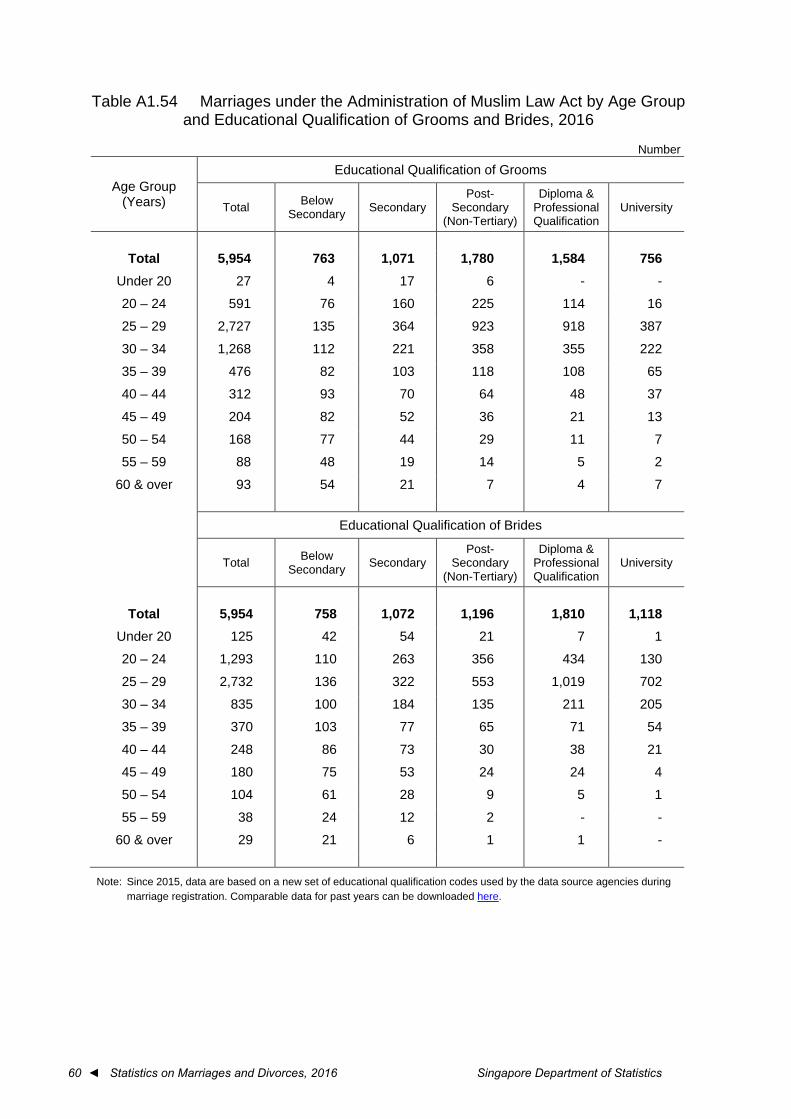
60 ◄ Statistics on Marriages and Divorces, 2016 Singapore Department of Statistics
Table A1.54 Marriages under the Administration of Muslim Law Act by Age Group
and Educational Qualification of Grooms and Brides, 2016
Number
Age Group (Years)
Educational Qualification of Grooms
Total Below Secondary Secondary
Post-Secondary
(Non-Tertiary)
Diploma & Professional Qualification
University
Total 5,954 763 1,071 1,780 1,584 756 Under 20 27 4 17 6 - -
20 – 24 591 76 160 225 114 16
25 – 29 2,727 135 364 923 918 387
30 – 34 1,268 112 221 358 355 222
35 – 39 476 82 103 118 108 65
40 – 44 312 93 70 64 48 37
45 – 49 204 82 52 36 21 13
50 – 54 168 77 44 29 11 7
55 – 59 88 48 19 14 5 2
60 & over 93 54 21 7 4 7 Educational Qualification of Brides
Total Below Secondary Secondary
Post-Secondary
(Non-Tertiary)
Diploma & Professional Qualification
University
Total 5,954 758 1,072 1,196 1,810 1,118 Under 20 125 42 54 21 7 1
20 – 24 1,293 110 263 356 434 130
25 – 29 2,732 136 322 553 1,019 702
30 – 34 835 100 184 135 211 205
35 – 39 370 103 77 65 71 54
40 – 44 248 86 73 30 38 21
45 – 49 180 75 53 24 24 4
50 – 54 104 61 28 9 5 1
55 – 59 38 24 12 2 - -
60 & over 29 21 6 1 1 -
Note: Since 2015, data are based on a new set of educational qualification codes used by the data source agencies during marriage registration. Comparable data for past years can be downloaded here.
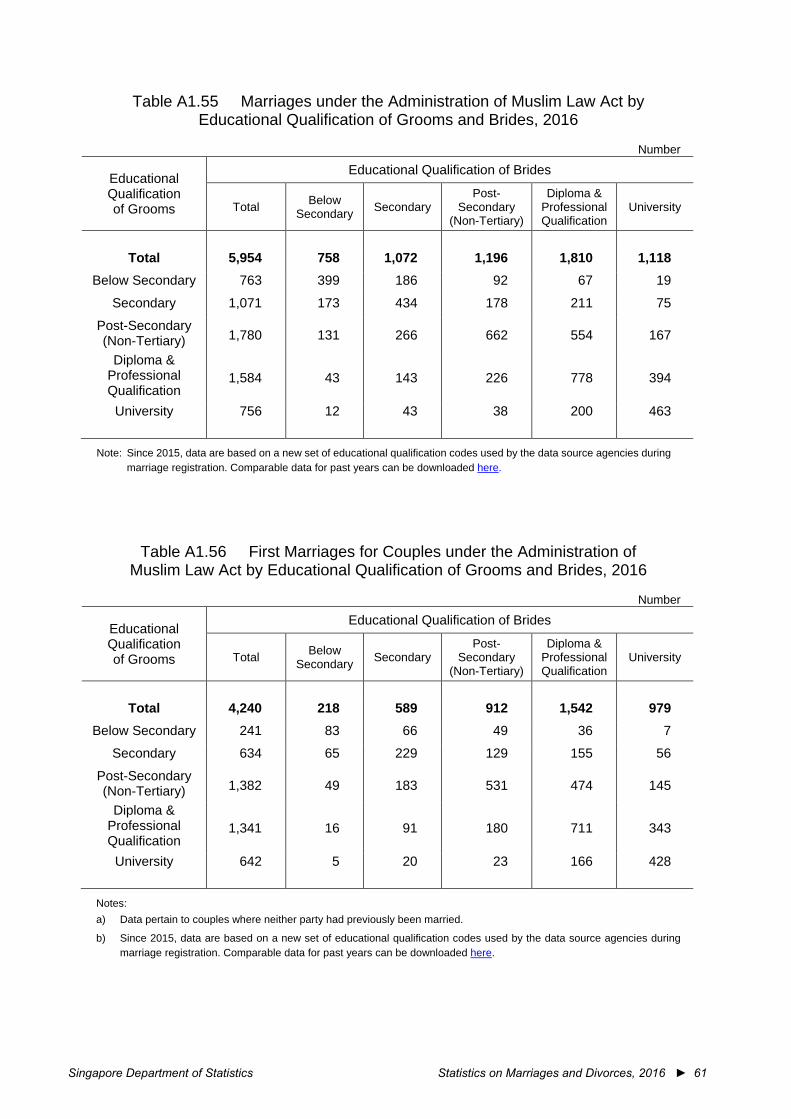
Singapore Department of Statistics Statistics on Marriages and Divorces, 2016 ► 61
Table A1.55 Marriages under the Administration of Muslim Law Act by
Educational Qualification of Grooms and Brides, 2016
Number
Educational Qualification of Grooms
Educational Qualification of Brides
Total Below Secondary Secondary
Post-Secondary
(Non-Tertiary)
Diploma & Professional Qualification
University
Total 5,954 758 1,072 1,196 1,810 1,118 Below Secondary 763 399 186 92 67 19
Secondary 1,071 173 434 178 211 75
Post-Secondary (Non-Tertiary) 1,780 131 266 662 554 167
Diploma & Professional Qualification
1,584 43 143 226 778 394
University 756 12 43 38 200 463
Note: Since 2015, data are based on a new set of educational qualification codes used by the data source agencies during marriage registration. Comparable data for past years can be downloaded here.
Table A1.56 First Marriages for Couples under the Administration of Muslim Law Act by Educational Qualification of Grooms and Brides, 2016
Number
Educational Qualification of Grooms
Educational Qualification of Brides
Total Below Secondary Secondary
Post-Secondary
(Non-Tertiary)
Diploma & Professional Qualification
University
Total 4,240 218 589 912 1,542 979 Below Secondary 241 83 66 49 36 7
Secondary 634 65 229 129 155 56
Post-Secondary (Non-Tertiary) 1,382 49 183 531 474 145
Diploma & Professional Qualification
1,341 16 91 180 711 343
University 642 5 20 23 166 428
Notes: a) Data pertain to couples where neither party had previously been married.
b) Since 2015, data are based on a new set of educational qualification codes used by the data source agencies during marriage registration. Comparable data for past years can be downloaded here.
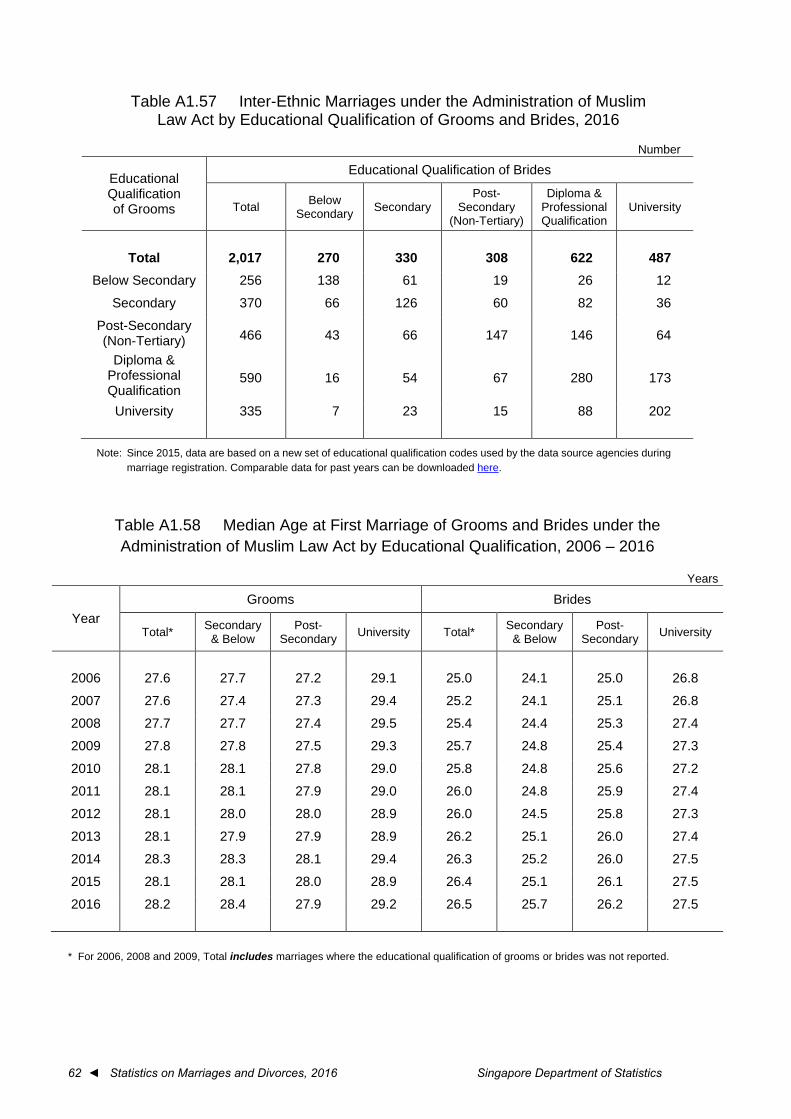
62 ◄ Statistics on Marriages and Divorces, 2016 Singapore Department of Statistics
Table A1.57 Inter-Ethnic Marriages under the Administration of Muslim
Law Act by Educational Qualification of Grooms and Brides, 2016
Number
Educational Qualification of Grooms
Educational Qualification of Brides
Total Below Secondary Secondary
Post-Secondary
(Non-Tertiary)
Diploma & Professional Qualification
University
Total 2,017 270 330 308 622 487 Below Secondary 256 138 61 19 26 12
Secondary 370 66 126 60 82 36
Post-Secondary (Non-Tertiary) 466 43 66 147 146 64
Diploma & Professional Qualification
590 16 54 67 280 173
University 335 7 23 15 88 202
Note: Since 2015, data are based on a new set of educational qualification codes used by the data source agencies during marriage registration. Comparable data for past years can be downloaded here.
Table A1.58 Median Age at First Marriage of Grooms and Brides under the Administration of Muslim Law Act by Educational Qualification, 2006 – 2016
Years
Year Grooms Brides
Total* Secondary & Below
Post-Secondary University Total* Secondary
& Below Post-
Secondary University
2006 27.6 27.7 27.2 29.1 25.0 24.1 25.0 26.8
2007 27.6 27.4 27.3 29.4 25.2 24.1 25.1 26.8
2008 27.7 27.7 27.4 29.5 25.4 24.4 25.3 27.4
2009 27.8 27.8 27.5 29.3 25.7 24.8 25.4 27.3
2010 28.1 28.1 27.8 29.0 25.8 24.8 25.6 27.2
2011 28.1 28.1 27.9 29.0 26.0 24.8 25.9 27.4
2012 28.1 28.0 28.0 28.9 26.0 24.5 25.8 27.3
2013 28.1 27.9 27.9 28.9 26.2 25.1 26.0 27.4
2014 28.3 28.3 28.1 29.4 26.3 25.2 26.0 27.5
2015 28.1 28.1 28.0 28.9 26.4 25.1 26.1 27.5
2016 28.2 28.4 27.9 29.2 26.5 25.7 26.2 27.5
* For 2006, 2008 and 2009, Total includes marriages where the educational qualification of grooms or brides was not reported.
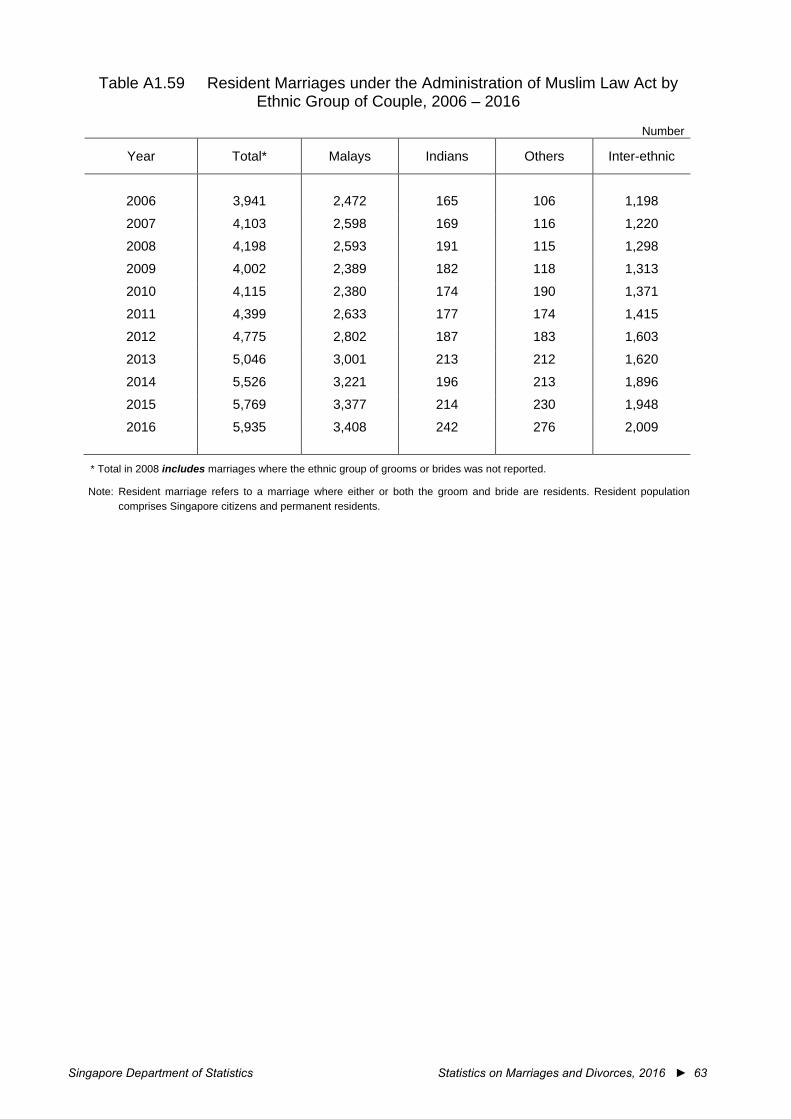
Singapore Department of Statistics Statistics on Marriages and Divorces, 2016 ► 63
Table A1.59 Resident Marriages under the Administration of Muslim Law Act by Ethnic Group of Couple, 2006 – 2016
Number
Year Total* Malays Indians Others Inter-ethnic
2006 3,941 2,472 165 106 1,198
2007 4,103 2,598 169 116 1,220
2008 4,198 2,593 191 115 1,298
2009 4,002 2,389 182 118 1,313
2010 4,115 2,380 174 190 1,371
2011 4,399 2,633 177 174 1,415
2012 4,775 2,802 187 183 1,603
2013 5,046 3,001 213 212 1,620
2014 5,526 3,221 196 213 1,896
2015 5,769 3,377 214 230 1,948
2016 5,935 3,408 242 276 2,009
* Total in 2008 includes marriages where the ethnic group of grooms or brides was not reported.
Note: Resident marriage refers to a marriage where either or both the groom and bride are residents. Resident population comprises Singapore citizens and permanent residents.
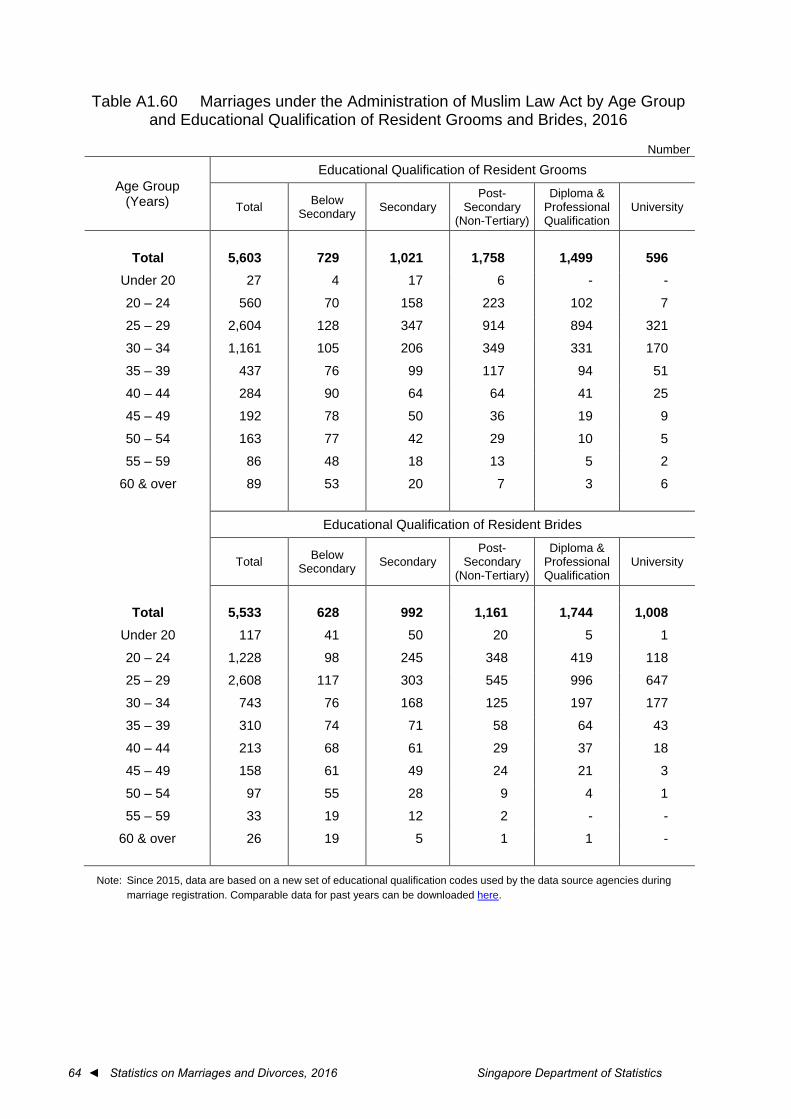
64 ◄ Statistics on Marriages and Divorces, 2016 Singapore Department of Statistics
Table A1.60 Marriages under the Administration of Muslim Law Act by Age Group
and Educational Qualification of Resident Grooms and Brides, 2016
Number
Age Group (Years)
Educational Qualification of Resident Grooms
Total Below Secondary Secondary
Post-Secondary
(Non-Tertiary)
Diploma & Professional Qualification
University
Total 5,603 729 1,021 1,758 1,499 596 Under 20 27 4 17 6 - -
20 – 24 560 70 158 223 102 7
25 – 29 2,604 128 347 914 894 321
30 – 34 1,161 105 206 349 331 170
35 – 39 437 76 99 117 94 51
40 – 44 284 90 64 64 41 25
45 – 49 192 78 50 36 19 9
50 – 54 163 77 42 29 10 5
55 – 59 86 48 18 13 5 2
60 & over 89 53 20 7 3 6 Educational Qualification of Resident Brides
Total Below Secondary Secondary
Post-Secondary
(Non-Tertiary)
Diploma & Professional Qualification
University
Total 5,533 628 992 1,161 1,744 1,008 Under 20 117 41 50 20 5 1
20 – 24 1,228 98 245 348 419 118
25 – 29 2,608 117 303 545 996 647
30 – 34 743 76 168 125 197 177
35 – 39 310 74 71 58 64 43
40 – 44 213 68 61 29 37 18
45 – 49 158 61 49 24 21 3
50 – 54 97 55 28 9 4 1
55 – 59 33 19 12 2 - -
60 & over 26 19 5 1 1 -
Note: Since 2015, data are based on a new set of educational qualification codes used by the data source agencies during marriage registration. Comparable data for past years can be downloaded here.
► 65
Tables on Divorces and Annulments

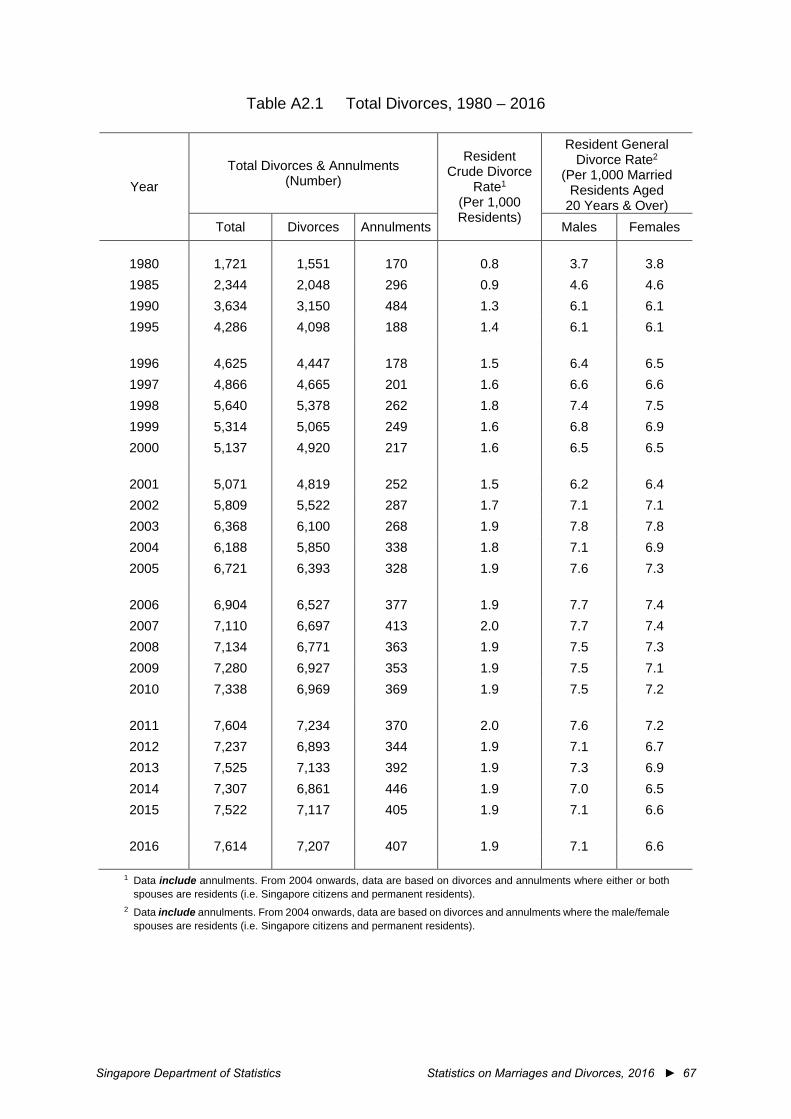
Singapore Department of Statistics Statistics on Marriages and Divorces, 2016 ► 67
Table A2.1 Total Divorces, 1980 – 2016
Year Total Divorces & Annulments
(Number)
Resident Crude Divorce
Rate1 (Per 1,000 Residents)
Resident General Divorce Rate2
(Per 1,000 Married Residents Aged
20 Years & Over) Total Divorces Annulments Males Females
1980 1,721 1,551 170 0.8 3.7 3.8 1985 2,344 2,048 296 0.9 4.6 4.6 1990 3,634 3,150 484 1.3 6.1 6.1 1995 4,286 4,098 188 1.4 6.1 6.1
1996 4,625 4,447 178 1.5 6.4 6.5 1997 4,866 4,665 201 1.6 6.6 6.6 1998 5,640 5,378 262 1.8 7.4 7.5 1999 5,314 5,065 249 1.6 6.8 6.9 2000 5,137 4,920 217 1.6 6.5 6.5
2001 5,071 4,819 252 1.5 6.2 6.4 2002 5,809 5,522 287 1.7 7.1 7.1 2003 6,368 6,100 268 1.9 7.8 7.8 2004 6,188 5,850 338 1.8 7.1 6.9 2005 6,721 6,393 328 1.9 7.6 7.3
2006 6,904 6,527 377 1.9 7.7 7.4 2007 7,110 6,697 413 2.0 7.7 7.4 2008 7,134 6,771 363 1.9 7.5 7.3 2009 7,280 6,927 353 1.9 7.5 7.1 2010 7,338 6,969 369 1.9 7.5 7.2
2011 7,604 7,234 370 2.0 7.6 7.2 2012 7,237 6,893 344 1.9 7.1 6.7 2013 7,525 7,133 392 1.9 7.3 6.9 2014 7,307 6,861 446 1.9 7.0 6.5 2015 7,522 7,117 405 1.9 7.1 6.6
2016 7,614 7,207 407 1.9 7.1 6.6
1 Data include annulments. From 2004 onwards, data are based on divorces and annulments where either or both
spouses are residents (i.e. Singapore citizens and permanent residents). 2 Data include annulments. From 2004 onwards, data are based on divorces and annulments where the male/female
spouses are residents (i.e. Singapore citizens and permanent residents).
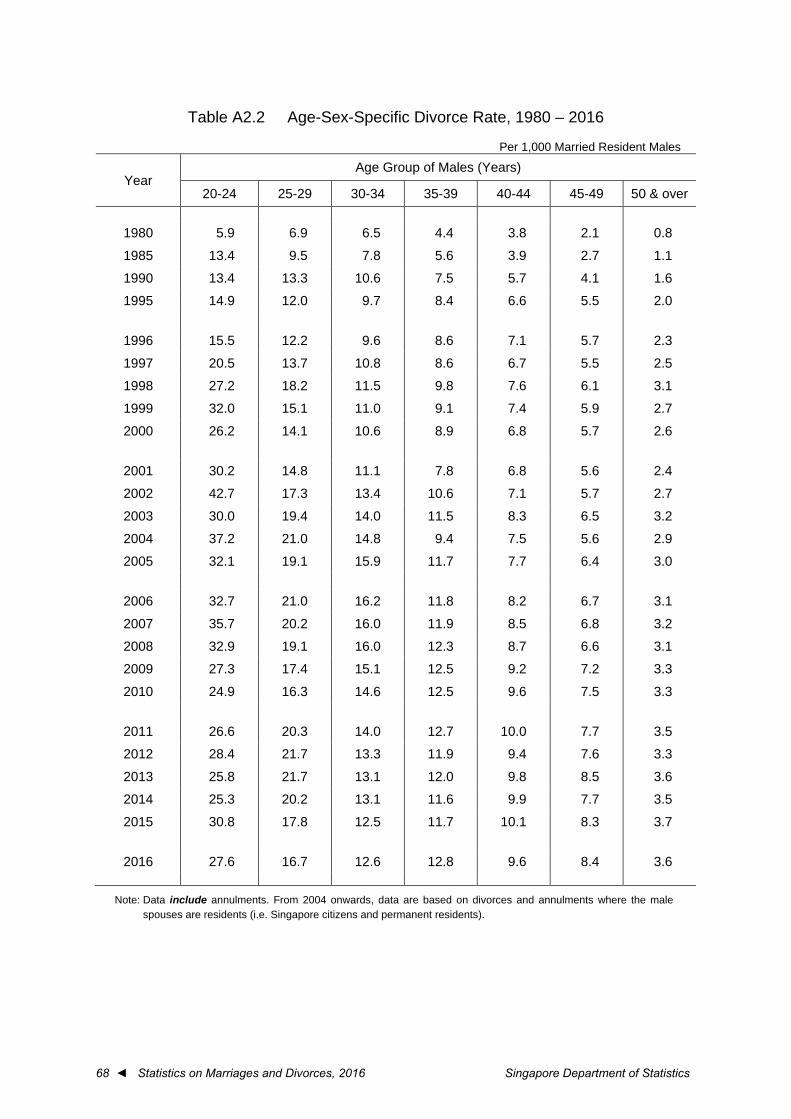
68 ◄ Statistics on Marriages and Divorces, 2016 Singapore Department of Statistics
Table A2.2 Age-Sex-Specific Divorce Rate, 1980 – 2016
Per 1,000 Married Resident Males
Year Age Group of Males (Years)
20-24 25-29 30-34 35-39 40-44 45-49 50 & over
1980 5.9 6.9 6.5 4.4 3.8 2.1 0.8
1985 13.4 9.5 7.8 5.6 3.9 2.7 1.1
1990 13.4 13.3 10.6 7.5 5.7 4.1 1.6
1995 14.9 12.0 9.7 8.4 6.6 5.5 2.0
1996 15.5 12.2 9.6 8.6 7.1 5.7 2.3
1997 20.5 13.7 10.8 8.6 6.7 5.5 2.5
1998 27.2 18.2 11.5 9.8 7.6 6.1 3.1
1999 32.0 15.1 11.0 9.1 7.4 5.9 2.7
2000 26.2 14.1 10.6 8.9 6.8 5.7 2.6
2001 30.2 14.8 11.1 7.8 6.8 5.6 2.4
2002 42.7 17.3 13.4 10.6 7.1 5.7 2.7
2003 30.0 19.4 14.0 11.5 8.3 6.5 3.2
2004 37.2 21.0 14.8 9.4 7.5 5.6 2.9
2005 32.1 19.1 15.9 11.7 7.7 6.4 3.0
2006 32.7 21.0 16.2 11.8 8.2 6.7 3.1
2007 35.7 20.2 16.0 11.9 8.5 6.8 3.2
2008 32.9 19.1 16.0 12.3 8.7 6.6 3.1
2009 27.3 17.4 15.1 12.5 9.2 7.2 3.3
2010 24.9 16.3 14.6 12.5 9.6 7.5 3.3
2011 26.6 20.3 14.0 12.7 10.0 7.7 3.5
2012 28.4 21.7 13.3 11.9 9.4 7.6 3.3
2013 25.8 21.7 13.1 12.0 9.8 8.5 3.6
2014 25.3 20.2 13.1 11.6 9.9 7.7 3.5
2015 30.8 17.8 12.5 11.7 10.1 8.3 3.7
2016 27.6 16.7 12.6 12.8 9.6 8.4 3.6
Note: Data include annulments. From 2004 onwards, data are based on divorces and annulments where the male spouses are residents (i.e. Singapore citizens and permanent residents).
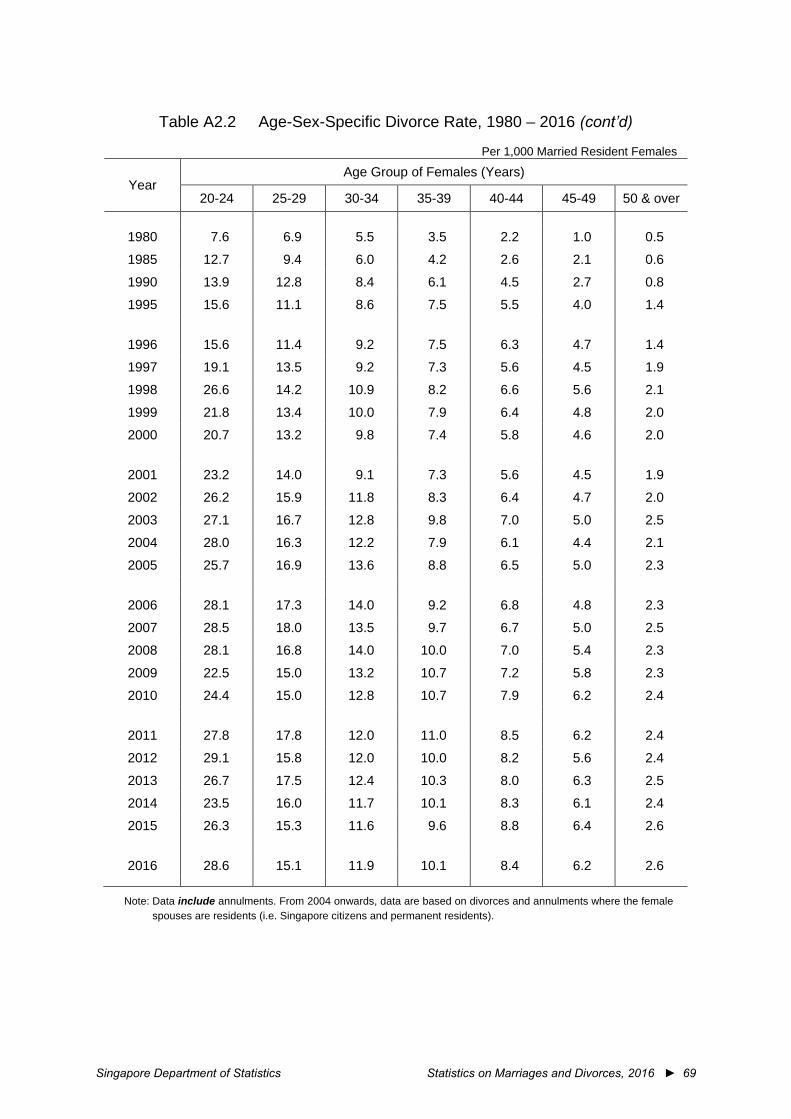
Singapore Department of Statistics Statistics on Marriages and Divorces, 2016 ► 69
Table A2.2 Age-Sex-Specific Divorce Rate, 1980 – 2016 (cont’d)
Per 1,000 Married Resident Females
Year Age Group of Females (Years)
20-24 25-29 30-34 35-39 40-44 45-49 50 & over
1980 7.6 6.9 5.5 3.5 2.2 1.0 0.5
1985 12.7 9.4 6.0 4.2 2.6 2.1 0.6
1990 13.9 12.8 8.4 6.1 4.5 2.7 0.8
1995 15.6 11.1 8.6 7.5 5.5 4.0 1.4
1996 15.6 11.4 9.2 7.5 6.3 4.7 1.4
1997 19.1 13.5 9.2 7.3 5.6 4.5 1.9
1998 26.6 14.2 10.9 8.2 6.6 5.6 2.1
1999 21.8 13.4 10.0 7.9 6.4 4.8 2.0
2000 20.7 13.2 9.8 7.4 5.8 4.6 2.0
2001 23.2 14.0 9.1 7.3 5.6 4.5 1.9
2002 26.2 15.9 11.8 8.3 6.4 4.7 2.0
2003 27.1 16.7 12.8 9.8 7.0 5.0 2.5
2004 28.0 16.3 12.2 7.9 6.1 4.4 2.1
2005 25.7 16.9 13.6 8.8 6.5 5.0 2.3
2006 28.1 17.3 14.0 9.2 6.8 4.8 2.3
2007 28.5 18.0 13.5 9.7 6.7 5.0 2.5
2008 28.1 16.8 14.0 10.0 7.0 5.4 2.3
2009 22.5 15.0 13.2 10.7 7.2 5.8 2.3
2010 24.4 15.0 12.8 10.7 7.9 6.2 2.4
2011 27.8 17.8 12.0 11.0 8.5 6.2 2.4
2012 29.1 15.8 12.0 10.0 8.2 5.6 2.4
2013 26.7 17.5 12.4 10.3 8.0 6.3 2.5
2014 23.5 16.0 11.7 10.1 8.3 6.1 2.4
2015 26.3 15.3 11.6 9.6 8.8 6.4 2.6
2016 28.6 15.1 11.9 10.1 8.4 6.2 2.6
Note: Data include annulments. From 2004 onwards, data are based on divorces and annulments where the female spouses are residents (i.e. Singapore citizens and permanent residents).
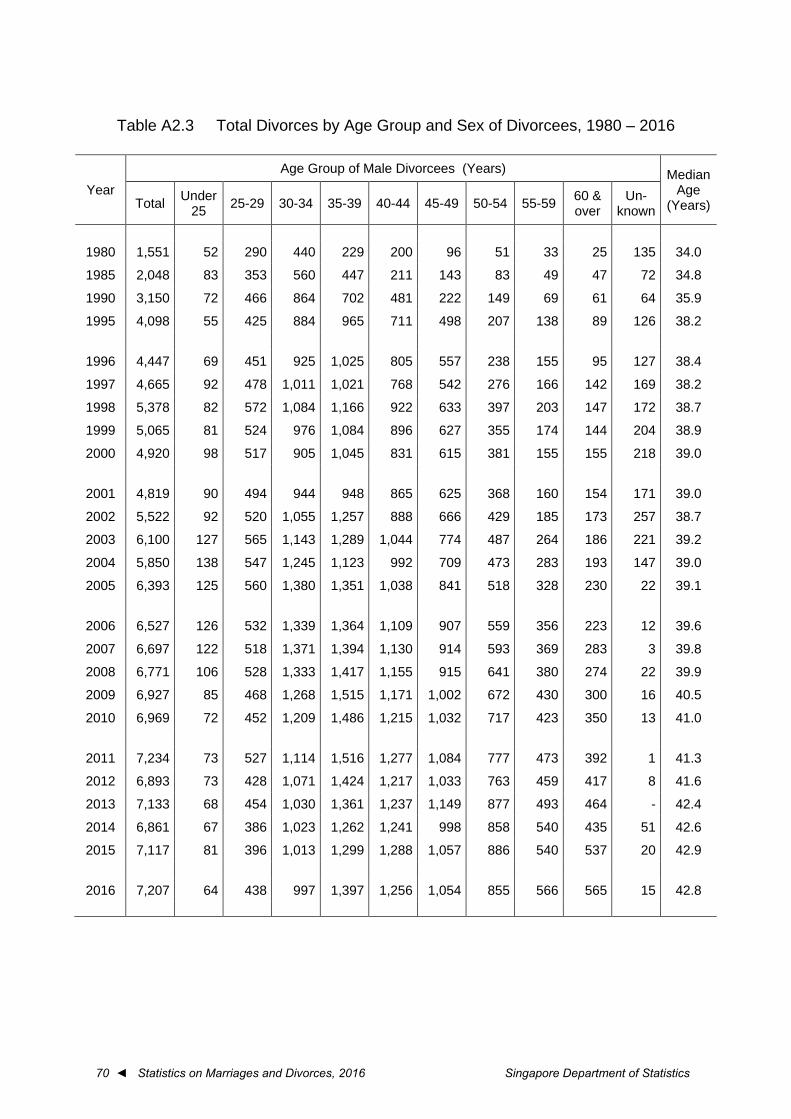
70 ◄ Statistics on Marriages and Divorces, 2016 Singapore Department of Statistics
Table A2.3 Total Divorces by Age Group and Sex of Divorcees, 1980 – 2016
Year Age Group of Male Divorcees (Years) Median
Age (Years) Total Under
25 25-29 30-34 35-39 40-44 45-49 50-54 55-59 60 & over
Un-known
1980 1,551 52 290 440 229 200 96 51 33 25 135 34.0
1985 2,048 83 353 560 447 211 143 83 49 47 72 34.8
1990 3,150 72 466 864 702 481 222 149 69 61 64 35.9
1995 4,098 55 425 884 965 711 498 207 138 89 126 38.2
1996 4,447 69 451 925 1,025 805 557 238 155 95 127 38.4
1997 4,665 92 478 1,011 1,021 768 542 276 166 142 169 38.2
1998 5,378 82 572 1,084 1,166 922 633 397 203 147 172 38.7
1999 5,065 81 524 976 1,084 896 627 355 174 144 204 38.9
2000 4,920 98 517 905 1,045 831 615 381 155 155 218 39.0
2001 4,819 90 494 944 948 865 625 368 160 154 171 39.0
2002 5,522 92 520 1,055 1,257 888 666 429 185 173 257 38.7
2003 6,100 127 565 1,143 1,289 1,044 774 487 264 186 221 39.2
2004 5,850 138 547 1,245 1,123 992 709 473 283 193 147 39.0
2005 6,393 125 560 1,380 1,351 1,038 841 518 328 230 22 39.1
2006 6,527 126 532 1,339 1,364 1,109 907 559 356 223 12 39.6
2007 6,697 122 518 1,371 1,394 1,130 914 593 369 283 3 39.8
2008 6,771 106 528 1,333 1,417 1,155 915 641 380 274 22 39.9
2009 6,927 85 468 1,268 1,515 1,171 1,002 672 430 300 16 40.5
2010 6,969 72 452 1,209 1,486 1,215 1,032 717 423 350 13 41.0
2011 7,234 73 527 1,114 1,516 1,277 1,084 777 473 392 1 41.3
2012 6,893 73 428 1,071 1,424 1,217 1,033 763 459 417 8 41.6
2013 7,133 68 454 1,030 1,361 1,237 1,149 877 493 464 - 42.4
2014 6,861 67 386 1,023 1,262 1,241 998 858 540 435 51 42.6
2015 7,117 81 396 1,013 1,299 1,288 1,057 886 540 537 20 42.9
2016 7,207 64 438 997 1,397 1,256 1,054 855 566 565 15 42.8
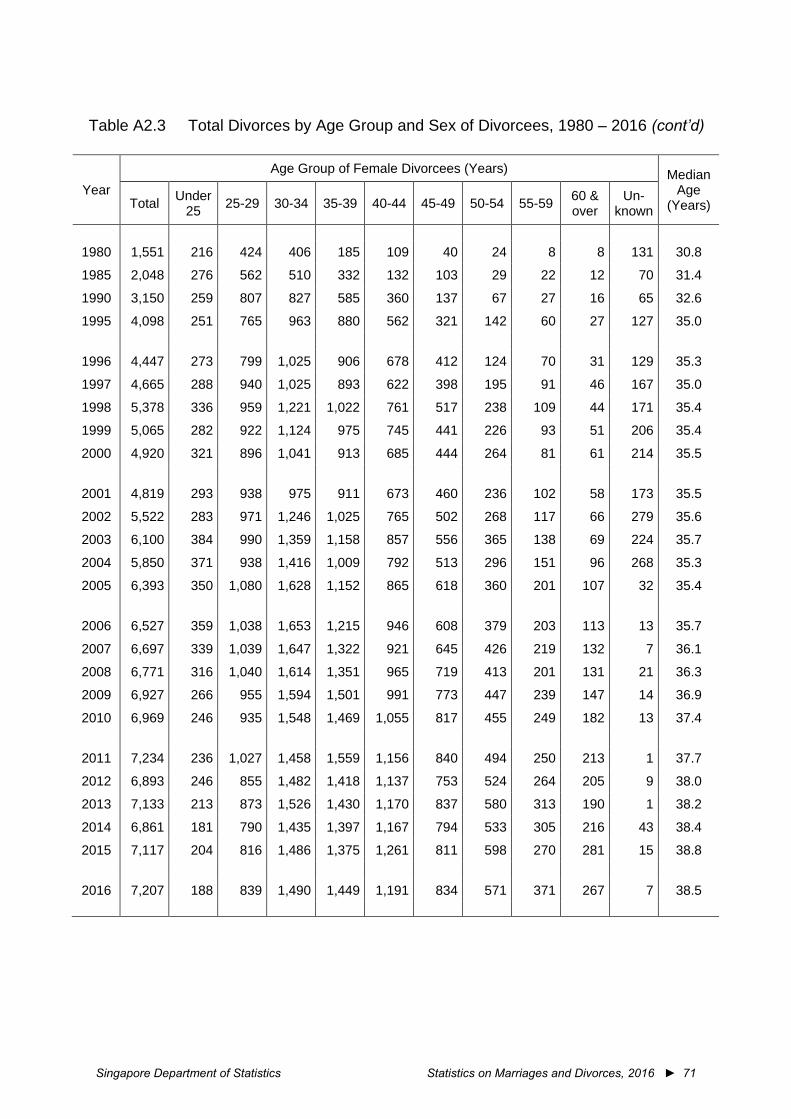
Singapore Department of Statistics Statistics on Marriages and Divorces, 2016 ► 71
Table A2.3 Total Divorces by Age Group and Sex of Divorcees, 1980 – 2016 (cont’d)
Year Age Group of Female Divorcees (Years) Median
Age (Years) Total Under
25 25-29 30-34 35-39 40-44 45-49 50-54 55-59 60 & over
Un-known
1980 1,551 216 424 406 185 109 40 24 8 8 131 30.8
1985 2,048 276 562 510 332 132 103 29 22 12 70 31.4
1990 3,150 259 807 827 585 360 137 67 27 16 65 32.6
1995 4,098 251 765 963 880 562 321 142 60 27 127 35.0
1996 4,447 273 799 1,025 906 678 412 124 70 31 129 35.3
1997 4,665 288 940 1,025 893 622 398 195 91 46 167 35.0
1998 5,378 336 959 1,221 1,022 761 517 238 109 44 171 35.4
1999 5,065 282 922 1,124 975 745 441 226 93 51 206 35.4
2000 4,920 321 896 1,041 913 685 444 264 81 61 214 35.5
2001 4,819 293 938 975 911 673 460 236 102 58 173 35.5
2002 5,522 283 971 1,246 1,025 765 502 268 117 66 279 35.6
2003 6,100 384 990 1,359 1,158 857 556 365 138 69 224 35.7
2004 5,850 371 938 1,416 1,009 792 513 296 151 96 268 35.3
2005 6,393 350 1,080 1,628 1,152 865 618 360 201 107 32 35.4
2006 6,527 359 1,038 1,653 1,215 946 608 379 203 113 13 35.7
2007 6,697 339 1,039 1,647 1,322 921 645 426 219 132 7 36.1
2008 6,771 316 1,040 1,614 1,351 965 719 413 201 131 21 36.3
2009 6,927 266 955 1,594 1,501 991 773 447 239 147 14 36.9
2010 6,969 246 935 1,548 1,469 1,055 817 455 249 182 13 37.4
2011 7,234 236 1,027 1,458 1,559 1,156 840 494 250 213 1 37.7
2012 6,893 246 855 1,482 1,418 1,137 753 524 264 205 9 38.0
2013 7,133 213 873 1,526 1,430 1,170 837 580 313 190 1 38.2
2014 6,861 181 790 1,435 1,397 1,167 794 533 305 216 43 38.4
2015 7,117 204 816 1,486 1,375 1,261 811 598 270 281 15 38.8
2016 7,207 188 839 1,490 1,449 1,191 834 571 371 267 7 38.5
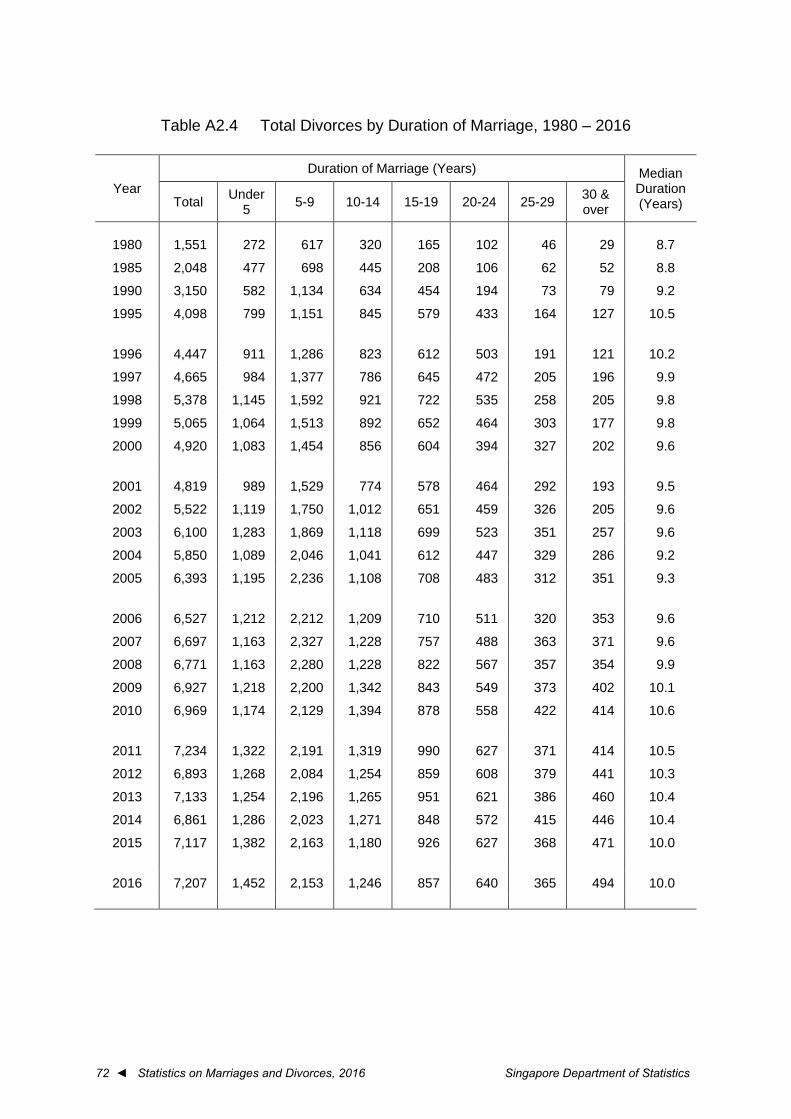
72 ◄ Statistics on Marriages and Divorces, 2016 Singapore Department of Statistics
Table A2.4 Total Divorces by Duration of Marriage, 1980 – 2016
Year Duration of Marriage (Years) Median
Duration (Years) Total Under
5 5-9 10-14 15-19 20-24 25-29 30 & over
1980 1,551 272 617 320 165 102 46 29 8.7
1985 2,048 477 698 445 208 106 62 52 8.8
1990 3,150 582 1,134 634 454 194 73 79 9.2
1995 4,098 799 1,151 845 579 433 164 127 10.5
1996 4,447 911 1,286 823 612 503 191 121 10.2
1997 4,665 984 1,377 786 645 472 205 196 9.9
1998 5,378 1,145 1,592 921 722 535 258 205 9.8
1999 5,065 1,064 1,513 892 652 464 303 177 9.8
2000 4,920 1,083 1,454 856 604 394 327 202 9.6
2001 4,819 989 1,529 774 578 464 292 193 9.5
2002 5,522 1,119 1,750 1,012 651 459 326 205 9.6
2003 6,100 1,283 1,869 1,118 699 523 351 257 9.6
2004 5,850 1,089 2,046 1,041 612 447 329 286 9.2
2005 6,393 1,195 2,236 1,108 708 483 312 351 9.3
2006 6,527 1,212 2,212 1,209 710 511 320 353 9.6
2007 6,697 1,163 2,327 1,228 757 488 363 371 9.6
2008 6,771 1,163 2,280 1,228 822 567 357 354 9.9
2009 6,927 1,218 2,200 1,342 843 549 373 402 10.1
2010 6,969 1,174 2,129 1,394 878 558 422 414 10.6
2011 7,234 1,322 2,191 1,319 990 627 371 414 10.5
2012 6,893 1,268 2,084 1,254 859 608 379 441 10.3
2013 7,133 1,254 2,196 1,265 951 621 386 460 10.4
2014 6,861 1,286 2,023 1,271 848 572 415 446 10.4
2015 7,117 1,382 2,163 1,180 926 627 368 471 10.0
2016 7,207 1,452 2,153 1,246 857 640 365 494 10.0
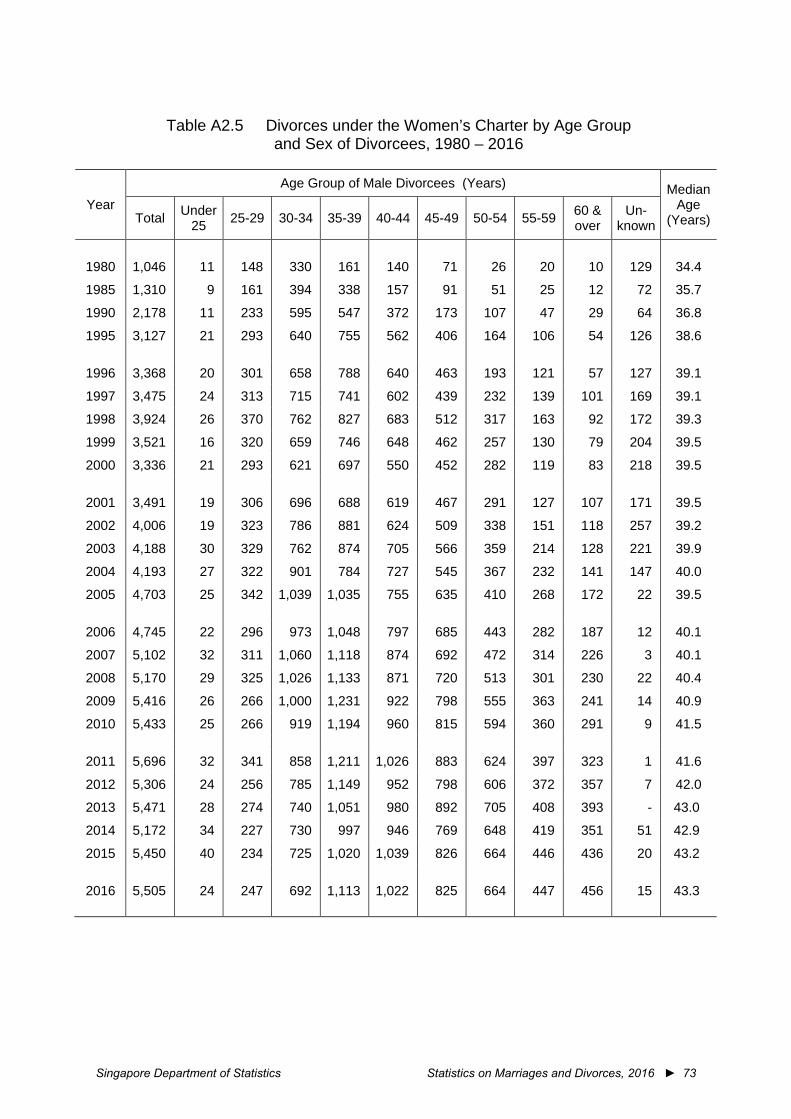
Singapore Department of Statistics Statistics on Marriages and Divorces, 2016 ► 73
Table A2.5 Divorces under the Women’s Charter by Age Group
and Sex of Divorcees, 1980 – 2016
Year Age Group of Male Divorcees (Years) Median
Age (Years) Total Under
25 25-29 30-34 35-39 40-44 45-49 50-54 55-59 60 & over
Un-known
1980 1,046 11 148 330 161 140 71 26 20 10 129 34.4
1985 1,310 9 161 394 338 157 91 51 25 12 72 35.7
1990 2,178 11 233 595 547 372 173 107 47 29 64 36.8
1995 3,127 21 293 640 755 562 406 164 106 54 126 38.6
1996 3,368 20 301 658 788 640 463 193 121 57 127 39.1
1997 3,475 24 313 715 741 602 439 232 139 101 169 39.1
1998 3,924 26 370 762 827 683 512 317 163 92 172 39.3
1999 3,521 16 320 659 746 648 462 257 130 79 204 39.5
2000 3,336 21 293 621 697 550 452 282 119 83 218 39.5
2001 3,491 19 306 696 688 619 467 291 127 107 171 39.5
2002 4,006 19 323 786 881 624 509 338 151 118 257 39.2
2003 4,188 30 329 762 874 705 566 359 214 128 221 39.9
2004 4,193 27 322 901 784 727 545 367 232 141 147 40.0
2005 4,703 25 342 1,039 1,035 755 635 410 268 172 22 39.5
2006 4,745 22 296 973 1,048 797 685 443 282 187 12 40.1
2007 5,102 32 311 1,060 1,118 874 692 472 314 226 3 40.1
2008 5,170 29 325 1,026 1,133 871 720 513 301 230 22 40.4
2009 5,416 26 266 1,000 1,231 922 798 555 363 241 14 40.9
2010 5,433 25 266 919 1,194 960 815 594 360 291 9 41.5
2011 5,696 32 341 858 1,211 1,026 883 624 397 323 1 41.6
2012 5,306 24 256 785 1,149 952 798 606 372 357 7 42.0
2013 5,471 28 274 740 1,051 980 892 705 408 393 - 43.0
2014 5,172 34 227 730 997 946 769 648 419 351 51 42.9
2015 5,450 40 234 725 1,020 1,039 826 664 446 436 20 43.2
2016 5,505 24 247 692 1,113 1,022 825 664 447 456 15 43.3
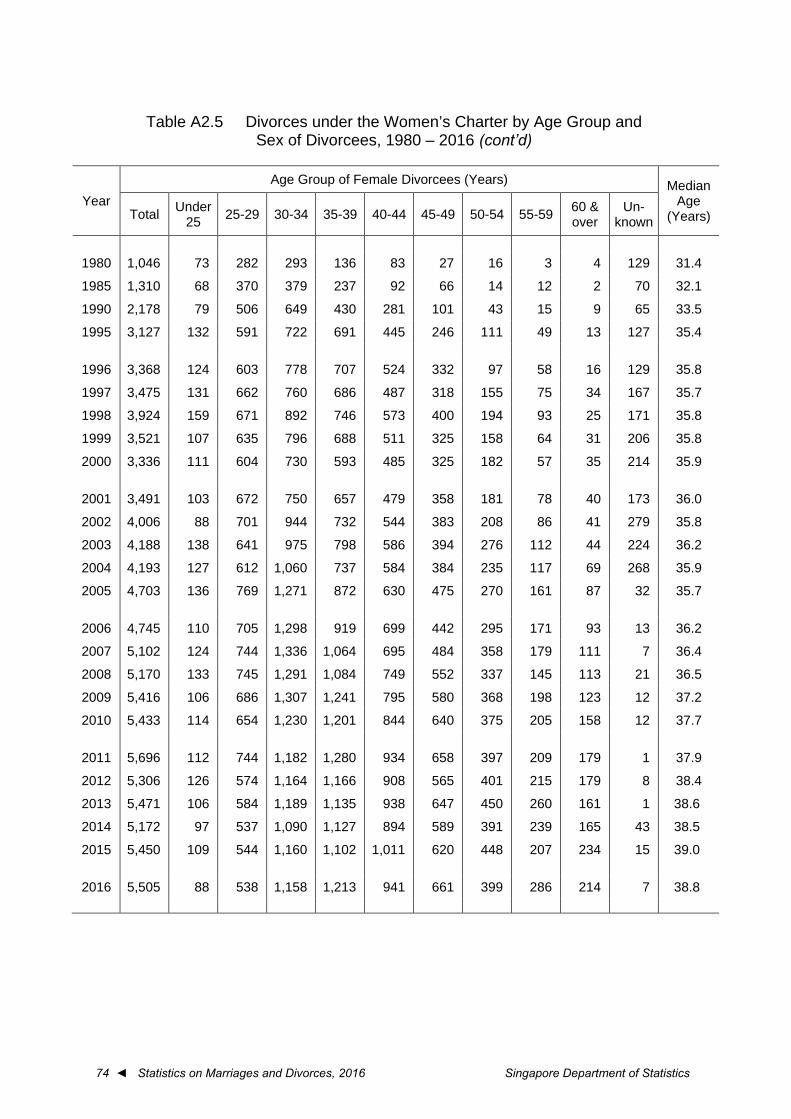
74 ◄ Statistics on Marriages and Divorces, 2016 Singapore Department of Statistics
Table A2.5 Divorces under the Women’s Charter by Age Group and
Sex of Divorcees, 1980 – 2016 (cont’d)
Year Age Group of Female Divorcees (Years) Median
Age (Years) Total Under
25 25-29 30-34 35-39 40-44 45-49 50-54 55-59 60 & over
Un-known
1980 1,046 73 282 293 136 83 27 16 3 4 129 31.4
1985 1,310 68 370 379 237 92 66 14 12 2 70 32.1
1990 2,178 79 506 649 430 281 101 43 15 9 65 33.5
1995 3,127 132 591 722 691 445 246 111 49 13 127 35.4
1996 3,368 124 603 778 707 524 332 97 58 16 129 35.8
1997 3,475 131 662 760 686 487 318 155 75 34 167 35.7
1998 3,924 159 671 892 746 573 400 194 93 25 171 35.8
1999 3,521 107 635 796 688 511 325 158 64 31 206 35.8
2000 3,336 111 604 730 593 485 325 182 57 35 214 35.9
2001 3,491 103 672 750 657 479 358 181 78 40 173 36.0
2002 4,006 88 701 944 732 544 383 208 86 41 279 35.8
2003 4,188 138 641 975 798 586 394 276 112 44 224 36.2
2004 4,193 127 612 1,060 737 584 384 235 117 69 268 35.9
2005 4,703 136 769 1,271 872 630 475 270 161 87 32 35.7
2006 4,745 110 705 1,298 919 699 442 295 171 93 13 36.2
2007 5,102 124 744 1,336 1,064 695 484 358 179 111 7 36.4
2008 5,170 133 745 1,291 1,084 749 552 337 145 113 21 36.5
2009 5,416 106 686 1,307 1,241 795 580 368 198 123 12 37.2
2010 5,433 114 654 1,230 1,201 844 640 375 205 158 12 37.7
2011 5,696 112 744 1,182 1,280 934 658 397 209 179 1 37.9
2012 5,306 126 574 1,164 1,166 908 565 401 215 179 8 38.4
2013 5,471 106 584 1,189 1,135 938 647 450 260 161 1 38.6
2014 5,172 97 537 1,090 1,127 894 589 391 239 165 43 38.5
2015 5,450 109 544 1,160 1,102 1,011 620 448 207 234 15 39.0
2016 5,505 88 538 1,158 1,213 941 661 399 286 214 7 38.8
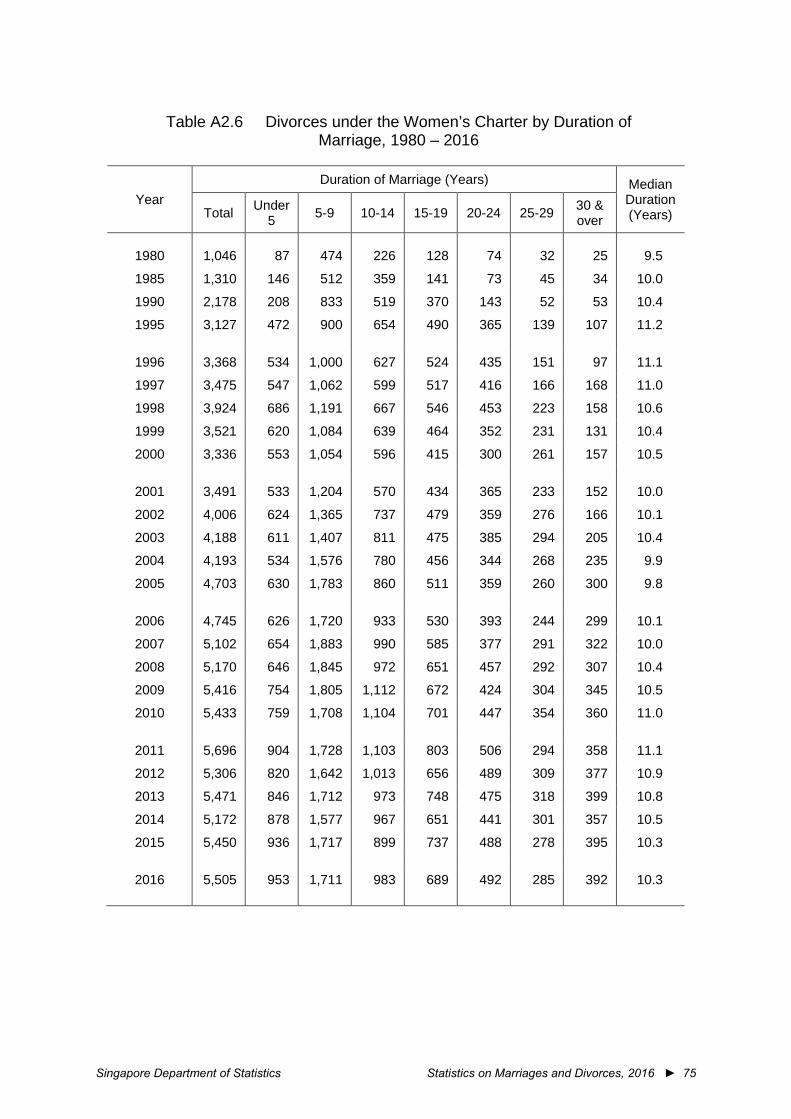
Singapore Department of Statistics Statistics on Marriages and Divorces, 2016 ► 75
Table A2.6 Divorces under the Women’s Charter by Duration of
Marriage, 1980 – 2016
Year Duration of Marriage (Years) Median
Duration (Years) Total Under
5 5-9 10-14 15-19 20-24 25-29 30 & over
1980 1,046 87 474 226 128 74 32 25 9.5
1985 1,310 146 512 359 141 73 45 34 10.0
1990 2,178 208 833 519 370 143 52 53 10.4
1995 3,127 472 900 654 490 365 139 107 11.2
1996 3,368 534 1,000 627 524 435 151 97 11.1
1997 3,475 547 1,062 599 517 416 166 168 11.0
1998 3,924 686 1,191 667 546 453 223 158 10.6
1999 3,521 620 1,084 639 464 352 231 131 10.4
2000 3,336 553 1,054 596 415 300 261 157 10.5
2001 3,491 533 1,204 570 434 365 233 152 10.0
2002 4,006 624 1,365 737 479 359 276 166 10.1
2003 4,188 611 1,407 811 475 385 294 205 10.4
2004 4,193 534 1,576 780 456 344 268 235 9.9
2005 4,703 630 1,783 860 511 359 260 300 9.8
2006 4,745 626 1,720 933 530 393 244 299 10.1
2007 5,102 654 1,883 990 585 377 291 322 10.0
2008 5,170 646 1,845 972 651 457 292 307 10.4
2009 5,416 754 1,805 1,112 672 424 304 345 10.5
2010 5,433 759 1,708 1,104 701 447 354 360 11.0
2011 5,696 904 1,728 1,103 803 506 294 358 11.1
2012 5,306 820 1,642 1,013 656 489 309 377 10.9
2013 5,471 846 1,712 973 748 475 318 399 10.8
2014 5,172 878 1,577 967 651 441 301 357 10.5
2015 5,450 936 1,717 899 737 488 278 395 10.3
2016 5,505 953 1,711 983 689 492 285 392 10.3

76 ◄ Statistics on Marriages and Divorces, 2016 Singapore Department of Statistics
Table A2.7 Divorces under the Women’s Charter by Ethnic Group of
Couple, 1980 – 2016
Number
Year Total* Chinese Indians Others Inter-ethnic
1980 1,046 926 62 13 45
1985 1,310 1,125 106 10 69
1990 2,178 1,920 144 20 94
1995 3,127 2,689 237 21 180
1996 3,368 2,838 282 66 182
1997 3,475 2,998 240 19 218
1998 3,924 3,346 309 28 241
1999 3,521 2,897 228 197 199
2000 3,336 2,714 193 223 206
2001 3,491 2,882 210 181 218
2002 4,006 3,235 233 253 285
2003 4,188 3,425 264 228 271
2004 4,193 3,350 252 18 215
2005 4,703 3,969 302 37 344
2006 4,745 3,968 339 32 381
2007 5,102 4,250 353 44 442
2008 5,170 4,333 344 49 428
2009 5,416 4,493 361 54 493
2010 5,433 4,446 366 64 546
2011 5,696 4,595 408 82 602
2012 5,306 4,240 336 91 628
2013 5,471 4,331 373 86 658
2014 5,172 4,018 352 89 701
2015 5,450 4,121 387 118 802
2016 5,505 4,123 380 119 853
* From 2004 onwards, Total includes divorces where the ethnic group of male or female divorcees was not reported.
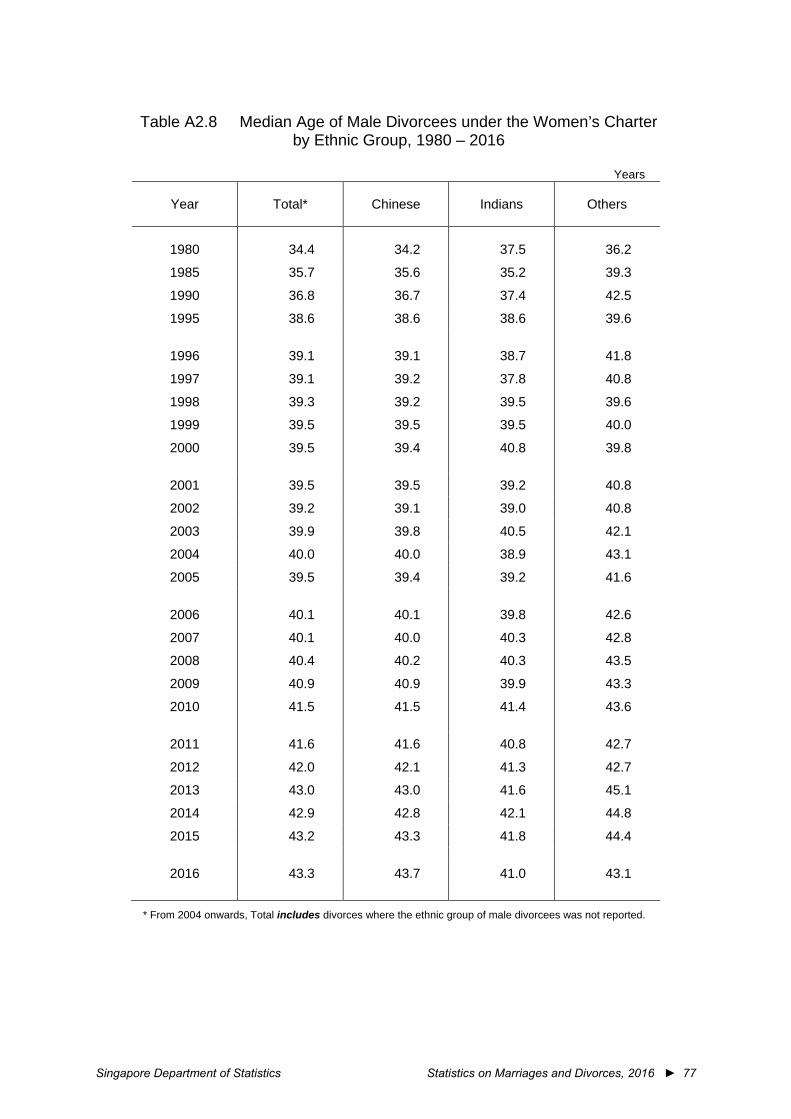
Singapore Department of Statistics Statistics on Marriages and Divorces, 2016 ► 77
Table A2.8 Median Age of Male Divorcees under the Women’s Charter
by Ethnic Group, 1980 – 2016
Years
Year Total* Chinese Indians Others
1980 34.4 34.2 37.5 36.2
1985 35.7 35.6 35.2 39.3
1990 36.8 36.7 37.4 42.5
1995 38.6 38.6 38.6 39.6
1996 39.1 39.1 38.7 41.8
1997 39.1 39.2 37.8 40.8
1998 39.3 39.2 39.5 39.6
1999 39.5 39.5 39.5 40.0
2000 39.5 39.4 40.8 39.8
2001 39.5 39.5 39.2 40.8
2002 39.2 39.1 39.0 40.8
2003 39.9 39.8 40.5 42.1
2004 40.0 40.0 38.9 43.1
2005 39.5 39.4 39.2 41.6
2006 40.1 40.1 39.8 42.6
2007 40.1 40.0 40.3 42.8
2008 40.4 40.2 40.3 43.5
2009 40.9 40.9 39.9 43.3
2010 41.5 41.5 41.4 43.6
2011 41.6 41.6 40.8 42.7
2012 42.0 42.1 41.3 42.7
2013 43.0 43.0 41.6 45.1
2014 42.9 42.8 42.1 44.8
2015 43.2 43.3 41.8 44.4
2016 43.3 43.7 41.0 43.1
* From 2004 onwards, Total includes divorces where the ethnic group of male divorcees was not reported.
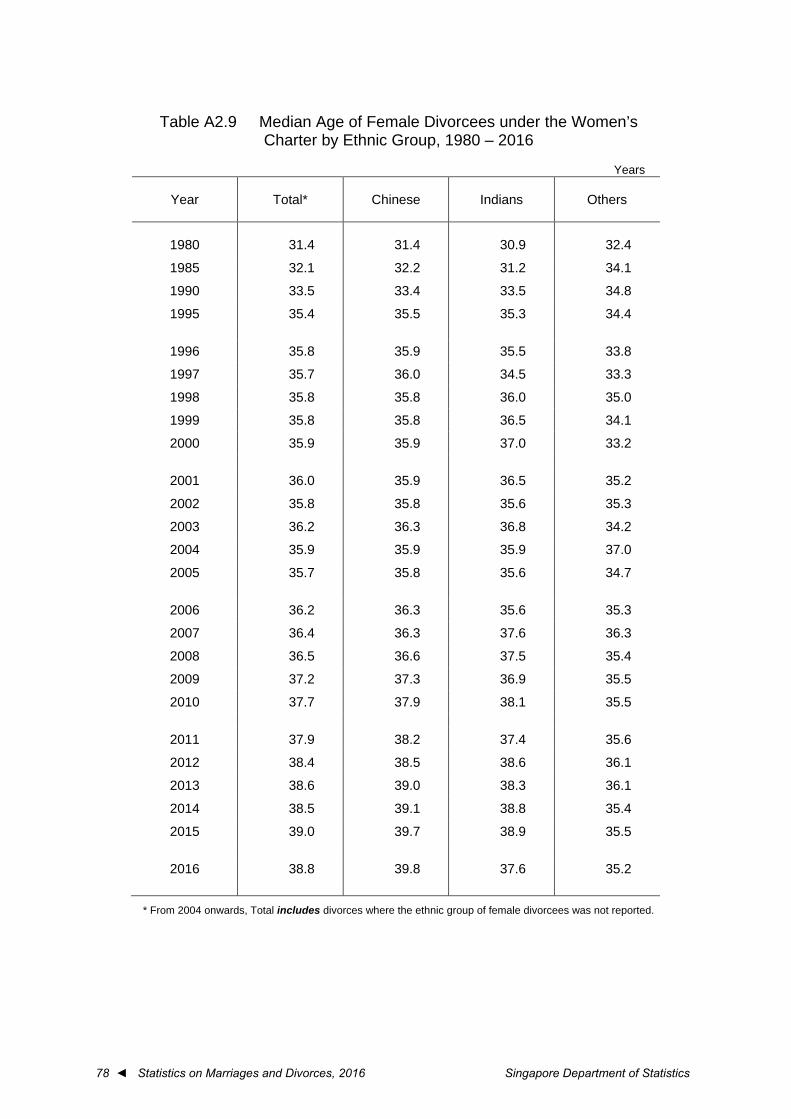
78 ◄ Statistics on Marriages and Divorces, 2016 Singapore Department of Statistics
Table A2.9 Median Age of Female Divorcees under the Women’s
Charter by Ethnic Group, 1980 – 2016
Years
Year Total* Chinese Indians Others
1980 31.4 31.4 30.9 32.4
1985 32.1 32.2 31.2 34.1
1990 33.5 33.4 33.5 34.8
1995 35.4 35.5 35.3 34.4
1996 35.8 35.9 35.5 33.8
1997 35.7 36.0 34.5 33.3
1998 35.8 35.8 36.0 35.0
1999 35.8 35.8 36.5 34.1
2000 35.9 35.9 37.0 33.2
2001 36.0 35.9 36.5 35.2
2002 35.8 35.8 35.6 35.3
2003 36.2 36.3 36.8 34.2
2004 35.9 35.9 35.9 37.0
2005 35.7 35.8 35.6 34.7
2006 36.2 36.3 35.6 35.3
2007 36.4 36.3 37.6 36.3
2008 36.5 36.6 37.5 35.4
2009 37.2 37.3 36.9 35.5
2010 37.7 37.9 38.1 35.5
2011 37.9 38.2 37.4 35.6
2012 38.4 38.5 38.6 36.1
2013 38.6 39.0 38.3 36.1
2014 38.5 39.1 38.8 35.4
2015 39.0 39.7 38.9 35.5
2016 38.8 39.8 37.6 35.2
* From 2004 onwards, Total includes divorces where the ethnic group of female divorcees was not reported.
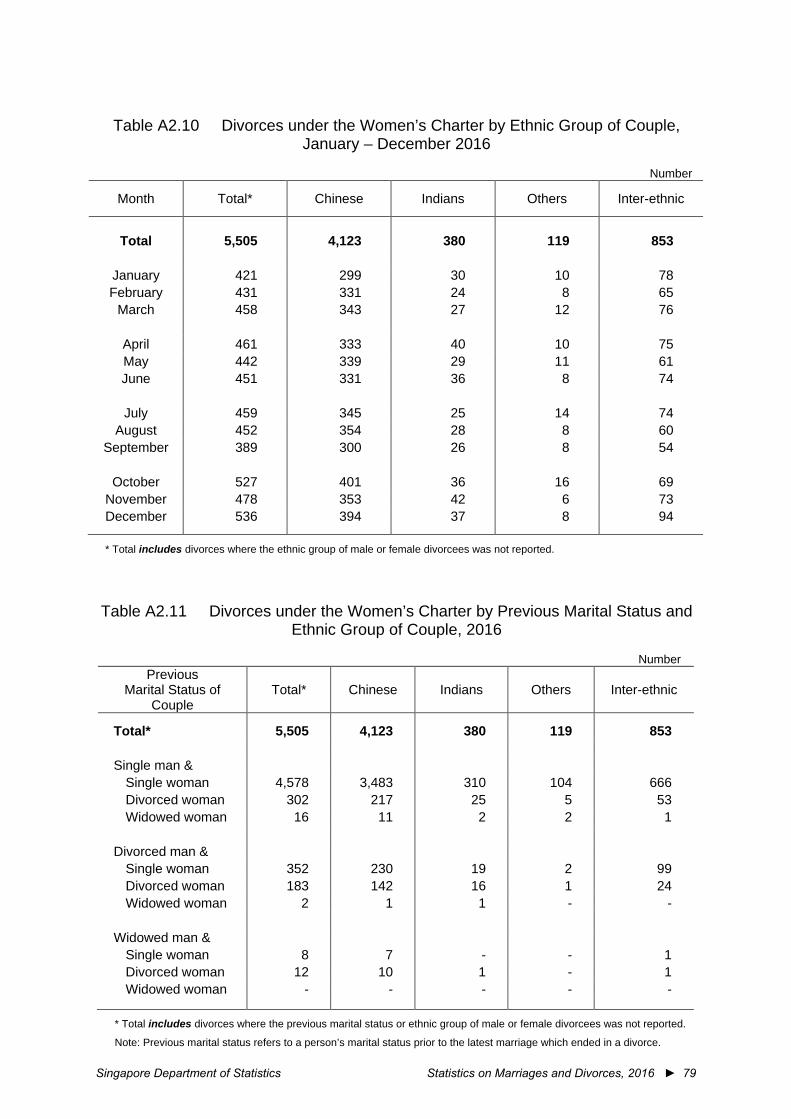
Singapore Department of Statistics Statistics on Marriages and Divorces, 2016 ► 79
Table A2.10 Divorces under the Women’s Charter by Ethnic Group of Couple,
January – December 2016
Number
Month Total* Chinese Indians Others Inter-ethnic
Total 5,505 4,123 380 119 853
January 421 299 30 10 78 February 431 331 24 8 65
March 458 343 27 12 76
April 461 333 40 10 75 May 442 339 29 11 61 June 451 331 36 8 74
July 459 345 25 14 74
August 452 354 28 8 60 September 389 300 26 8 54
October 527 401 36 16 69
November 478 353 42 6 73 December 536 394 37 8 94
* Total includes divorces where the ethnic group of male or female divorcees was not reported.
Table A2.11 Divorces under the Women’s Charter by Previous Marital Status and
Ethnic Group of Couple, 2016
Number Previous
Marital Status of Couple
Total* Chinese Indians Others Inter-ethnic
Total* 5,505 4,123 380 119 853
Single man &
Single woman 4,578 3,483 310 104 666 Divorced woman 302 217 25 5 53 Widowed woman 16 11 2 2 1
Divorced man & Single woman 352 230 19 2 99 Divorced woman 183 142 16 1 24 Widowed woman 2 1 1 - -
Widowed man & Single woman 8 7 - - 1 Divorced woman 12 10 1 - 1 Widowed woman - - - - -
* Total includes divorces where the previous marital status or ethnic group of male or female divorcees was not reported.
Note: Previous marital status refers to a person’s marital status prior to the latest marriage which ended in a divorce.
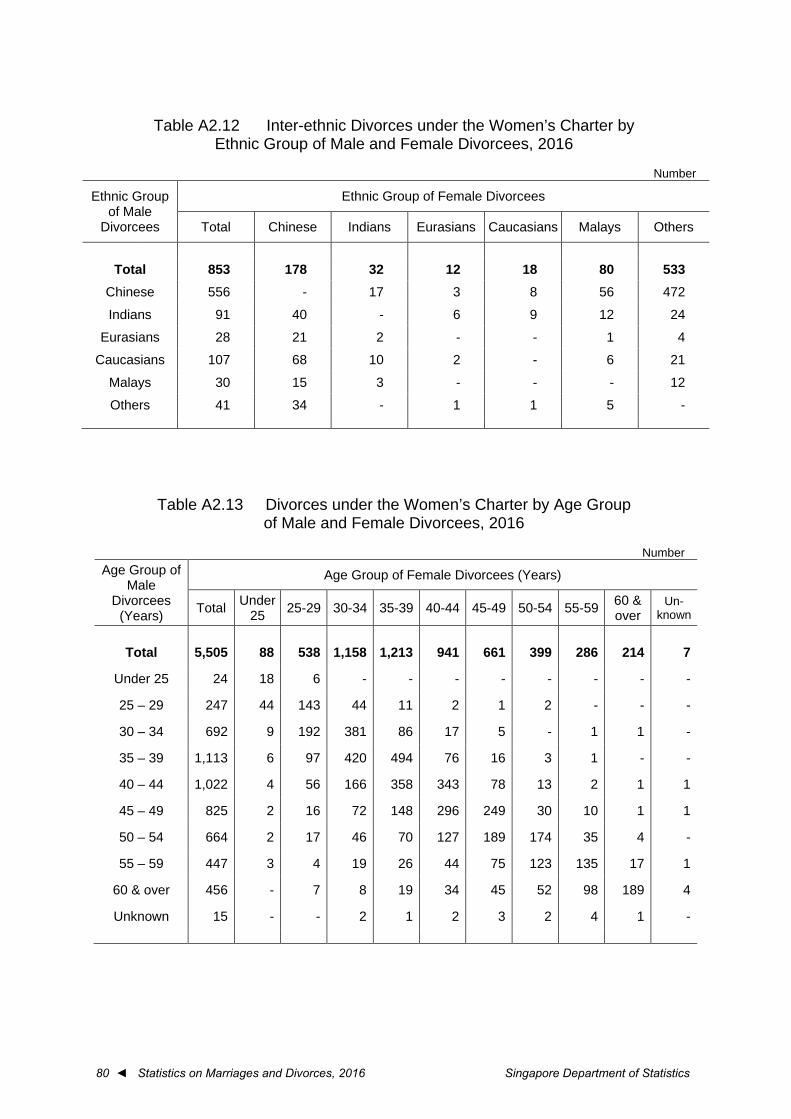
80 ◄ Statistics on Marriages and Divorces, 2016 Singapore Department of Statistics
Table A2.12 Inter-ethnic Divorces under the Women’s Charter by
Ethnic Group of Male and Female Divorcees, 2016
Number
Ethnic Group of Male
Divorcees
Ethnic Group of Female Divorcees
Total Chinese Indians Eurasians Caucasians Malays Others
Total 853 178 32 12 18 80 533
Chinese 556 - 17 3 8 56 472
Indians 91 40 - 6 9 12 24
Eurasians 28 21 2 - - 1 4
Caucasians 107 68 10 2 - 6 21
Malays 30 15 3 - - - 12
Others 41 34 - 1 1 5 -
Table A2.13 Divorces under the Women’s Charter by Age Group of Male and Female Divorcees, 2016
Number
Age Group of Male
Divorcees (Years)
Age Group of Female Divorcees (Years)
Total Under 25 25-29 30-34 35-39 40-44 45-49 50-54 55-59 60 &
over Un-
known
Total 5,505 88 538 1,158 1,213 941 661 399 286 214 7
Under 25 24 18 6 - - - - - - - -
25 – 29 247 44 143 44 11 2 1 2 - - -
30 – 34 692 9 192 381 86 17 5 - 1 1 -
35 – 39 1,113 6 97 420 494 76 16 3 1 - -
40 – 44 1,022 4 56 166 358 343 78 13 2 1 1
45 – 49 825 2 16 72 148 296 249 30 10 1 1
50 – 54 664 2 17 46 70 127 189 174 35 4 -
55 – 59 447 3 4 19 26 44 75 123 135 17 1
60 & over 456 - 7 8 19 34 45 52 98 189 4
Unknown 15 - - 2 1 2 3 2 4 1 -
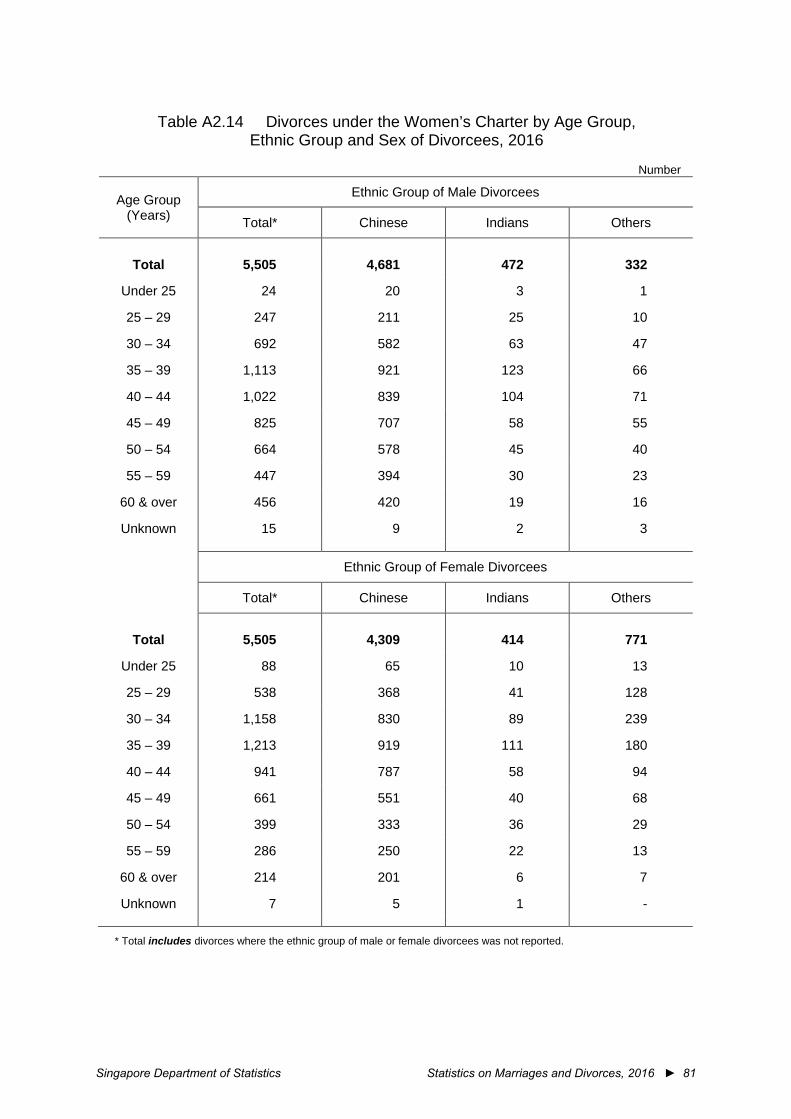
Singapore Department of Statistics Statistics on Marriages and Divorces, 2016 ► 81
Table A2.14 Divorces under the Women’s Charter by Age Group,
Ethnic Group and Sex of Divorcees, 2016
Number
Age Group (Years)
Ethnic Group of Male Divorcees
Total* Chinese Indians Others
Total 5,505 4,681 472 332
Under 25 24 20 3 1
25 – 29 247 211 25 10
30 – 34 692 582 63 47
35 – 39 1,113 921 123 66
40 – 44 1,022 839 104 71
45 – 49 825 707 58 55
50 – 54 664 578 45 40
55 – 59 447 394 30 23
60 & over 456 420 19 16
Unknown 15 9 2 3 Ethnic Group of Female Divorcees
Total* Chinese Indians Others
Total 5,505 4,309 414 771
Under 25 88 65 10 13
25 – 29 538 368 41 128
30 – 34 1,158 830 89 239
35 – 39 1,213 919 111 180
40 – 44 941 787 58 94
45 – 49 661 551 40 68
50 – 54 399 333 36 29
55 – 59 286 250 22 13
60 & over 214 201 6 7
Unknown 7 5 1 -
* Total includes divorces where the ethnic group of male or female divorcees was not reported.
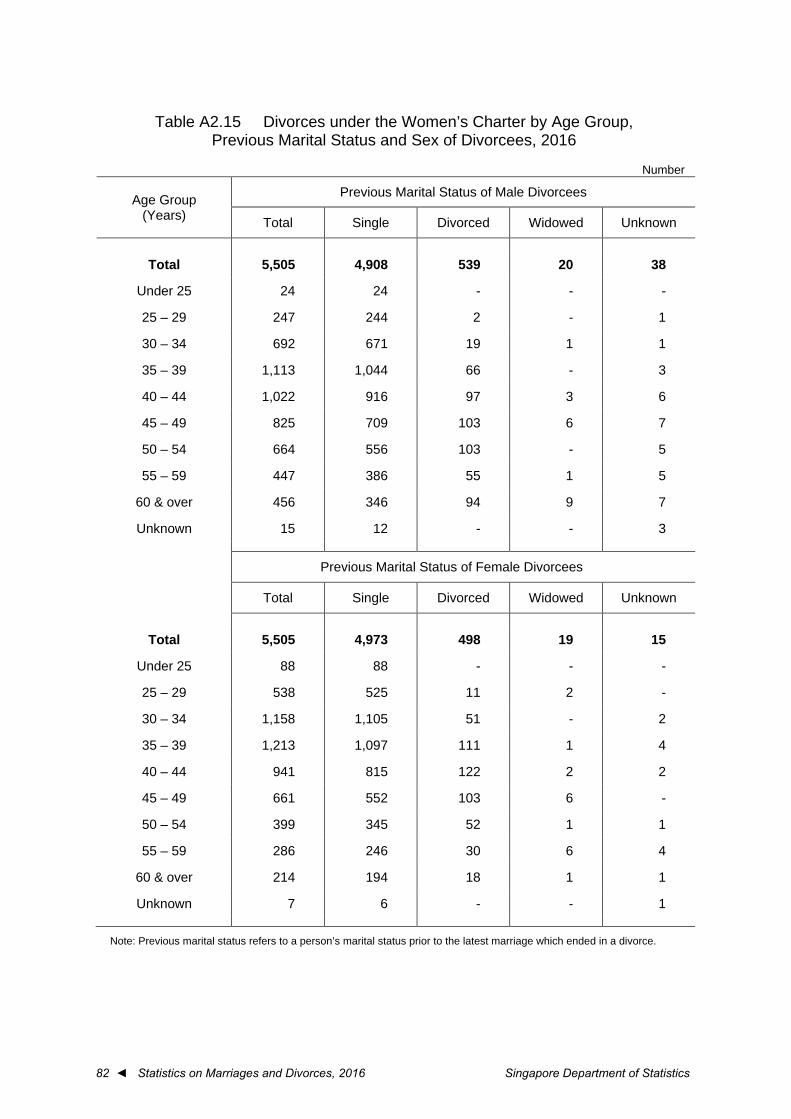
82 ◄ Statistics on Marriages and Divorces, 2016 Singapore Department of Statistics
Table A2.15 Divorces under the Women’s Charter by Age Group,
Previous Marital Status and Sex of Divorcees, 2016
Number
Age Group (Years)
Previous Marital Status of Male Divorcees
Total Single Divorced Widowed Unknown
Total 5,505 4,908 539 20 38
Under 25 24 24 - - -
25 – 29 247 244 2 - 1
30 – 34 692 671 19 1 1
35 – 39 1,113 1,044 66 - 3
40 – 44 1,022 916 97 3 6
45 – 49 825 709 103 6 7
50 – 54 664 556 103 - 5
55 – 59 447 386 55 1 5
60 & over 456 346 94 9 7
Unknown 15 12 - - 3 Previous Marital Status of Female Divorcees
Total Single Divorced Widowed Unknown
Total 5,505 4,973 498 19 15
Under 25 88 88 - - -
25 – 29 538 525 11 2 -
30 – 34 1,158 1,105 51 - 2
35 – 39 1,213 1,097 111 1 4
40 – 44 941 815 122 2 2
45 – 49 661 552 103 6 -
50 – 54 399 345 52 1 1
55 – 59 286 246 30 6 4
60 & over 214 194 18 1 1
Unknown 7 6 - - 1
Note: Previous marital status refers to a person’s marital status prior to the latest marriage which ended in a divorce.
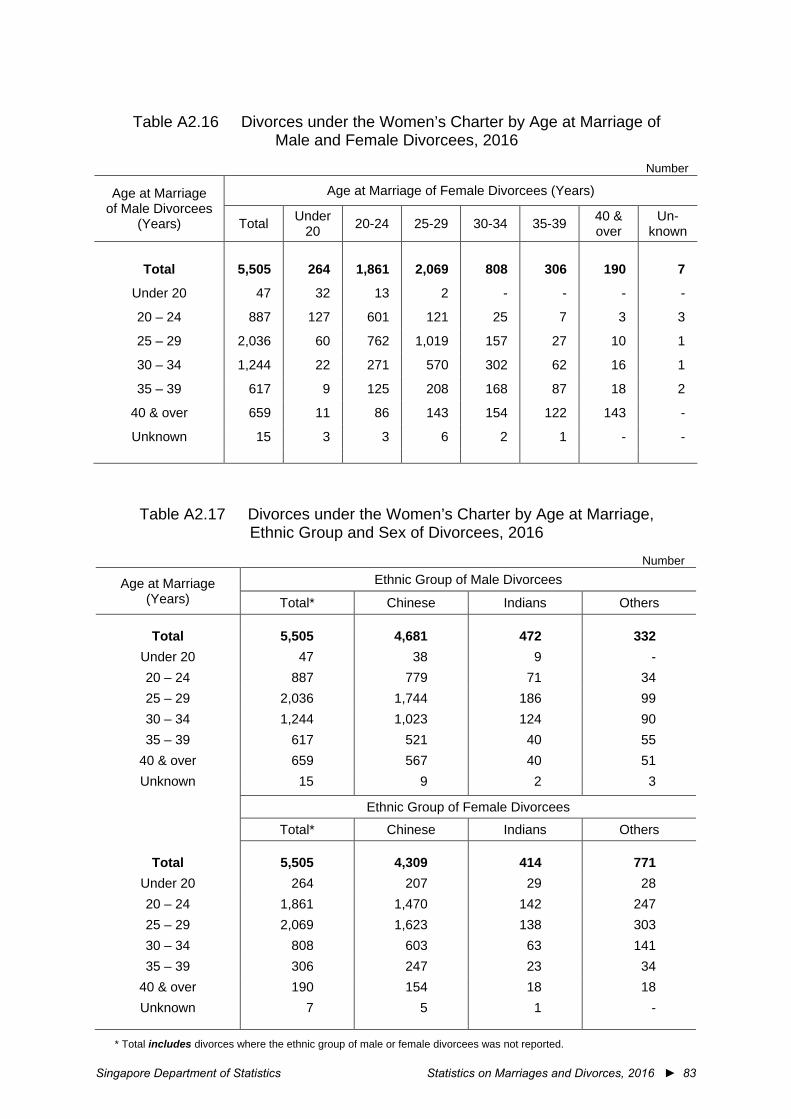
Singapore Department of Statistics Statistics on Marriages and Divorces, 2016 ► 83
Table A2.16 Divorces under the Women’s Charter by Age at Marriage of
Male and Female Divorcees, 2016
Number
Age at Marriage of Male Divorcees
(Years)
Age at Marriage of Female Divorcees (Years)
Total Under 20 20-24 25-29 30-34 35-39 40 &
over Un-
known
Total 5,505 264 1,861 2,069 808 306 190 7
Under 20 47 32 13 2 - - - -
20 – 24 887 127 601 121 25 7 3 3
25 – 29 2,036 60 762 1,019 157 27 10 1
30 – 34 1,244 22 271 570 302 62 16 1
35 – 39 617 9 125 208 168 87 18 2
40 & over 659 11 86 143 154 122 143 -
Unknown 15 3 3 6 2 1 - -
Table A2.17 Divorces under the Women’s Charter by Age at Marriage, Ethnic Group and Sex of Divorcees, 2016
Number
Age at Marriage (Years)
Ethnic Group of Male Divorcees
Total* Chinese Indians Others
Total 5,505 4,681 472 332 Under 20 47 38 9 - 20 – 24 887 779 71 34 25 – 29 2,036 1,744 186 99 30 – 34 1,244 1,023 124 90 35 – 39 617 521 40 55
40 & over 659 567 40 51 Unknown 15 9 2 3
Ethnic Group of Female Divorcees
Total* Chinese Indians Others
Total 5,505 4,309 414 771 Under 20 264 207 29 28 20 – 24 1,861 1,470 142 247 25 – 29 2,069 1,623 138 303 30 – 34 808 603 63 141 35 – 39 306 247 23 34
40 & over 190 154 18 18 Unknown 7 5 1 -
* Total includes divorces where the ethnic group of male or female divorcees was not reported.
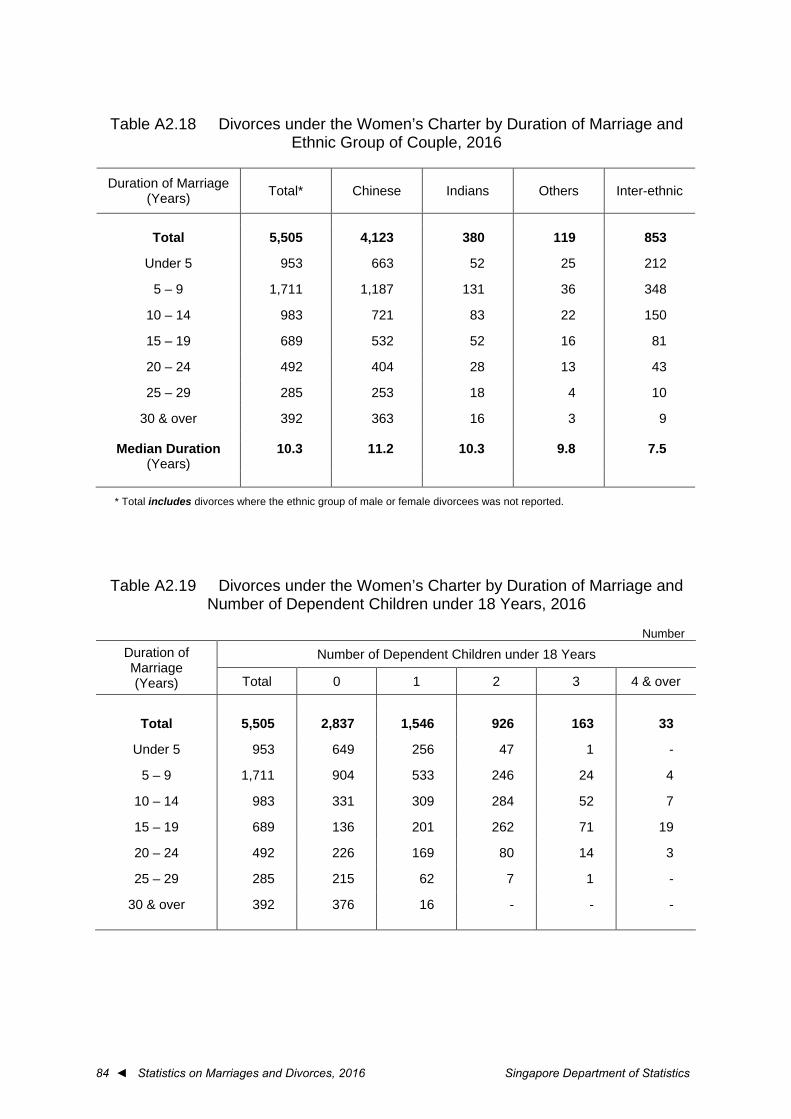
84 ◄ Statistics on Marriages and Divorces, 2016 Singapore Department of Statistics
Table A2.18 Divorces under the Women’s Charter by Duration of Marriage and
Ethnic Group of Couple, 2016
Duration of Marriage (Years) Total* Chinese Indians Others Inter-ethnic
Total 5,505 4,123 380 119 853
Under 5 953 663 52 25 212
5 – 9 1,711 1,187 131 36 348
10 – 14 983 721 83 22 150
15 – 19 689 532 52 16 81
20 – 24 492 404 28 13 43
25 – 29 285 253 18 4 10
30 & over 392 363 16 3 9
Median Duration (Years)
10.3 11.2 10.3 9.8 7.5
* Total includes divorces where the ethnic group of male or female divorcees was not reported.
Table A2.19 Divorces under the Women’s Charter by Duration of Marriage and Number of Dependent Children under 18 Years, 2016
Number
Duration of Marriage (Years)
Number of Dependent Children under 18 Years
Total 0 1 2 3 4 & over
Total 5,505 2,837 1,546 926 163 33
Under 5 953 649 256 47 1 -
5 – 9 1,711 904 533 246 24 4
10 – 14 983 331 309 284 52 7
15 – 19 689 136 201 262 71 19
20 – 24 492 226 169 80 14 3
25 – 29 285 215 62 7 1 -
30 & over 392 376 16 - - -
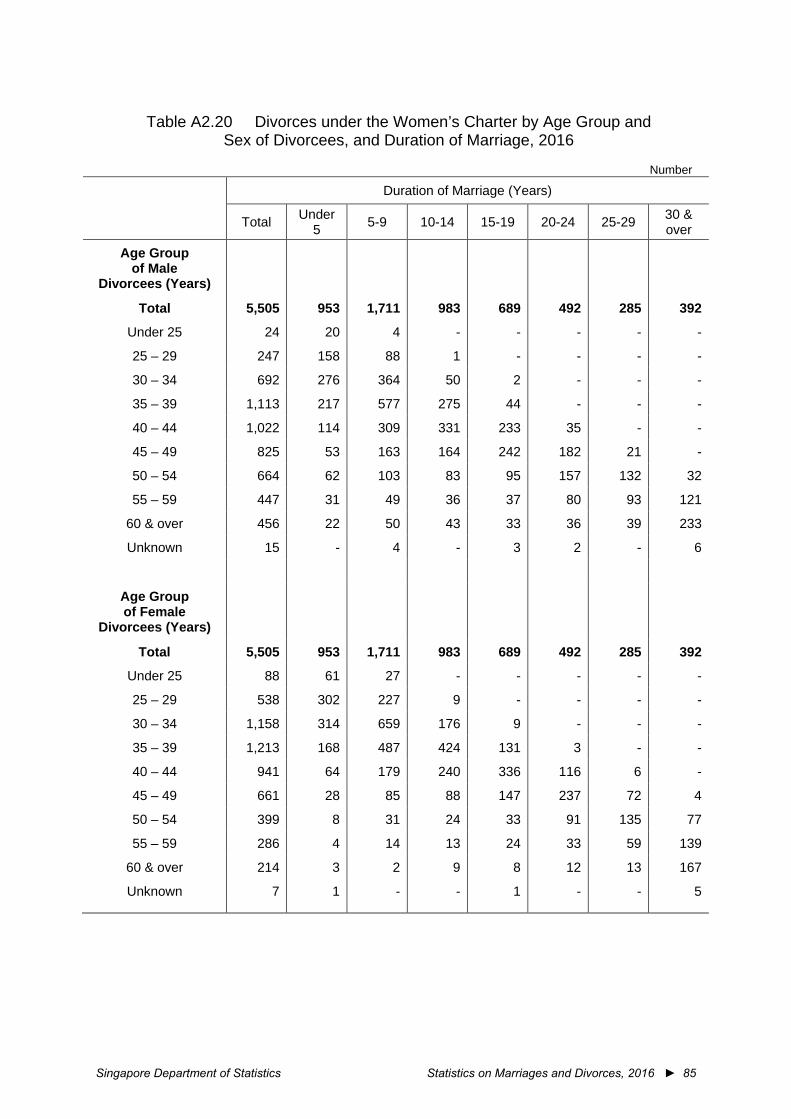
Singapore Department of Statistics Statistics on Marriages and Divorces, 2016 ► 85
Table A2.20 Divorces under the Women’s Charter by Age Group and
Sex of Divorcees, and Duration of Marriage, 2016
Number
Duration of Marriage (Years)
Total Under 5 5-9 10-14 15-19 20-24 25-29 30 &
over
Age Group of Male
Divorcees (Years)
Total 5,505 953 1,711 983 689 492 285 392
Under 25 24 20 4 - - - - -
25 – 29 247 158 88 1 - - - -
30 – 34 692 276 364 50 2 - - -
35 – 39 1,113 217 577 275 44 - - -
40 – 44 1,022 114 309 331 233 35 - -
45 – 49 825 53 163 164 242 182 21 -
50 – 54 664 62 103 83 95 157 132 32
55 – 59 447 31 49 36 37 80 93 121
60 & over 456 22 50 43 33 36 39 233
Unknown 15 - 4 - 3 2 - 6
Age Group of Female
Divorcees (Years)
Total
5,505 953 1,711 983 689 492 285 392
Under 25 88 61 27 - - - - -
25 – 29 538 302 227 9 - - - -
30 – 34 1,158 314 659 176 9 - - -
35 – 39 1,213 168 487 424 131 3 - -
40 – 44 941 64 179 240 336 116 6 -
45 – 49 661 28 85 88 147 237 72 4
50 – 54 399 8 31 24 33 91 135 77
55 – 59 286 4 14 13 24 33 59 139
60 & over 214 3 2 9 8 12 13 167
Unknown 7 1 - - 1 - - 5

86 ◄ Statistics on Marriages and Divorces, 2016 Singapore Department of Statistics
Table A2.21 Divorces under the Women’s Charter by (A) Duration of
Marriage; (B) Plaintiff; and Main Reason for Divorce, 2016
Number
Total
Lived Apart / Separated for Three Years
or More
Unreasonable Behaviour Desertion Adultery Other
Reasons
Total 5,505 2,342 2,947 125 89 2
Duration of Marriage
(Years)
Under 5 953 217 691 39 6 -
5 – 9 1,711 699 940 45 26 1
10 – 14 983 453 495 17 17 1
15 – 19 689 315 345 9 20 -
20 – 24 492 259 220 5 8 -
25 – 29 285 162 113 4 6 -
30 & over 392 237 143 6 6 -
Plaintiff
Husband 2,068 1,018 933 88 28 1
Wife 3,437 1,324 2,014 37 61 1
Table A2.22 Divorces under the Women’s Charter by Main Reason for Divorce and Ethnic Group of Couple, 2016
Number
Main Reason for Divorce Total* Chinese Indians Others Inter-ethnic
Total 5,505 4,123 380 119 853
Lived Apart / Separated for Three Years or More 2,342 1,808 126 50 347
Unreasonable Behaviour 2,947 2,167 248 64 449
Desertion 125 75 5 1 44
Adultery 89 71 1 4 13
Other Reasons 2 2 - - -
* Total includes divorces where the ethnic group of male or female divorcees was not reported.
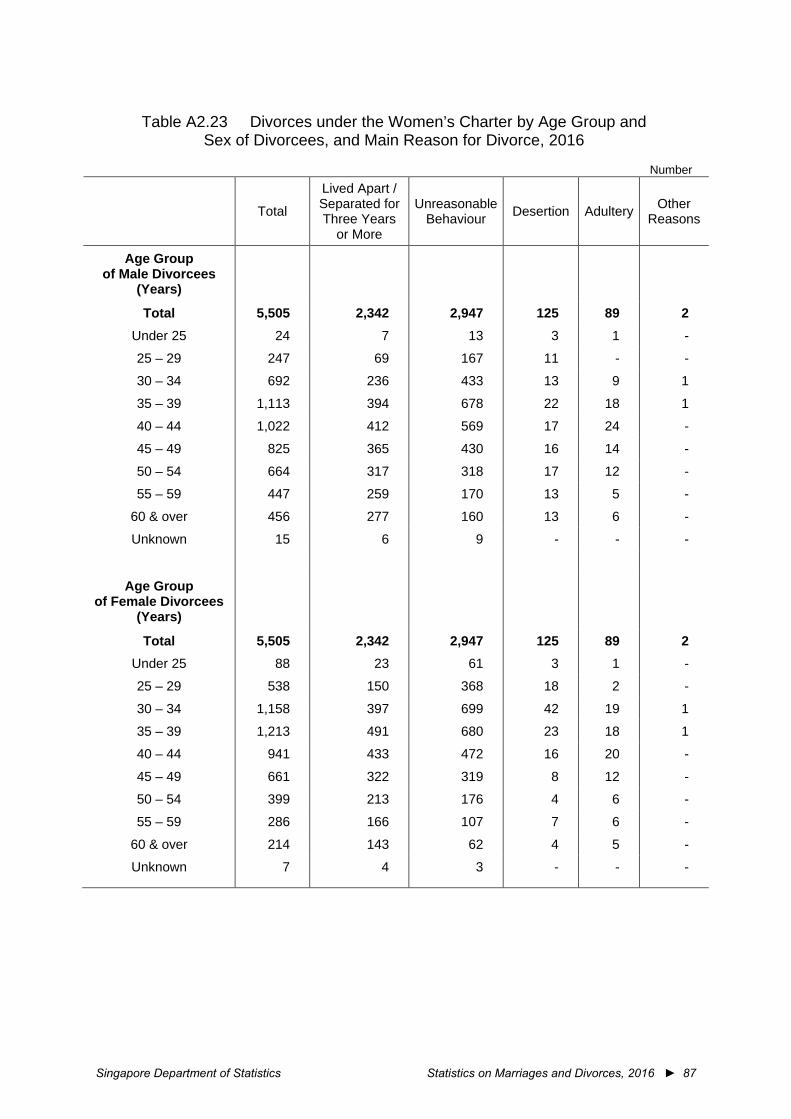
Singapore Department of Statistics Statistics on Marriages and Divorces, 2016 ► 87
Table A2.23 Divorces under the Women’s Charter by Age Group and
Sex of Divorcees, and Main Reason for Divorce, 2016
Number
Total
Lived Apart / Separated for Three Years
or More
Unreasonable Behaviour Desertion Adultery Other
Reasons
Age Group of Male Divorcees
(Years)
Total 5,505 2,342 2,947 125 89 2 Under 25 24 7 13 3 1 -
25 – 29 247 69 167 11 - -
30 – 34 692 236 433 13 9 1
35 – 39 1,113 394 678 22 18 1
40 – 44 1,022 412 569 17 24 -
45 – 49 825 365 430 16 14 -
50 – 54 664 317 318 17 12 -
55 – 59 447 259 170 13 5 -
60 & over 456 277 160 13 6 -
Unknown 15 6 9 - - -
Age Group of Female Divorcees
(Years)
Total 5,505 2,342 2,947 125 89 2 Under 25 88 23 61 3 1 -
25 – 29 538 150 368 18 2 -
30 – 34 1,158 397 699 42 19 1
35 – 39 1,213 491 680 23 18 1
40 – 44 941 433 472 16 20 -
45 – 49 661 322 319 8 12 -
50 – 54 399 213 176 4 6 -
55 – 59 286 166 107 7 6 -
60 & over 214 143 62 4 5 -
Unknown 7 4 3 - - -
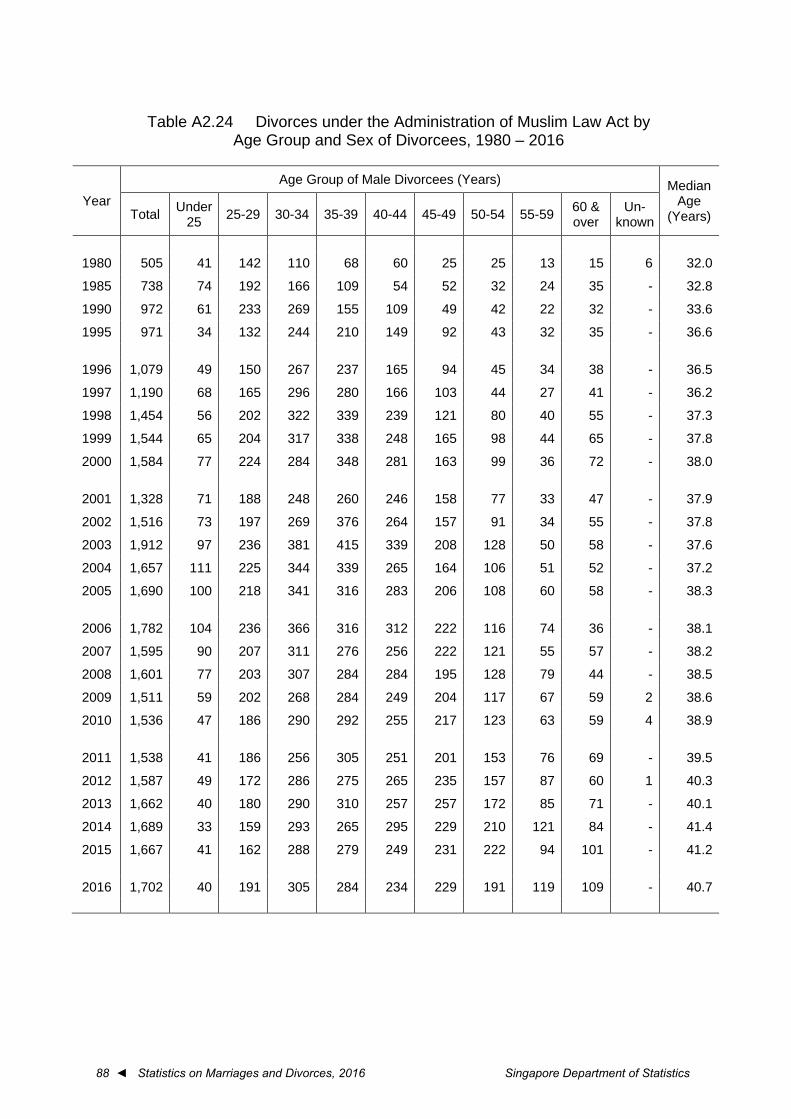
88 ◄ Statistics on Marriages and Divorces, 2016 Singapore Department of Statistics
Table A2.24 Divorces under the Administration of Muslim Law Act by
Age Group and Sex of Divorcees, 1980 – 2016
Year Age Group of Male Divorcees (Years) Median
Age (Years) Total Under
25 25-29 30-34 35-39 40-44 45-49 50-54 55-59 60 & over
Un-known
1980 505 41 142 110 68 60 25 25 13 15 6 32.0
1985 738 74 192 166 109 54 52 32 24 35 - 32.8
1990 972 61 233 269 155 109 49 42 22 32 - 33.6
1995 971 34 132 244 210 149 92 43 32 35 - 36.6
1996 1,079 49 150 267 237 165 94 45 34 38 - 36.5
1997 1,190 68 165 296 280 166 103 44 27 41 - 36.2
1998 1,454 56 202 322 339 239 121 80 40 55 - 37.3
1999 1,544 65 204 317 338 248 165 98 44 65 - 37.8
2000 1,584 77 224 284 348 281 163 99 36 72 - 38.0
2001 1,328 71 188 248 260 246 158 77 33 47 - 37.9
2002 1,516 73 197 269 376 264 157 91 34 55 - 37.8
2003 1,912 97 236 381 415 339 208 128 50 58 - 37.6
2004 1,657 111 225 344 339 265 164 106 51 52 - 37.2
2005 1,690 100 218 341 316 283 206 108 60 58 - 38.3
2006 1,782 104 236 366 316 312 222 116 74 36 - 38.1
2007 1,595 90 207 311 276 256 222 121 55 57 - 38.2
2008 1,601 77 203 307 284 284 195 128 79 44 - 38.5
2009 1,511 59 202 268 284 249 204 117 67 59 2 38.6
2010 1,536 47 186 290 292 255 217 123 63 59 4 38.9
2011 1,538 41 186 256 305 251 201 153 76 69 - 39.5
2012 1,587 49 172 286 275 265 235 157 87 60 1 40.3
2013 1,662 40 180 290 310 257 257 172 85 71 - 40.1
2014 1,689 33 159 293 265 295 229 210 121 84 - 41.4
2015 1,667 41 162 288 279 249 231 222 94 101 - 41.2
2016 1,702 40 191 305 284 234 229 191 119 109 - 40.7
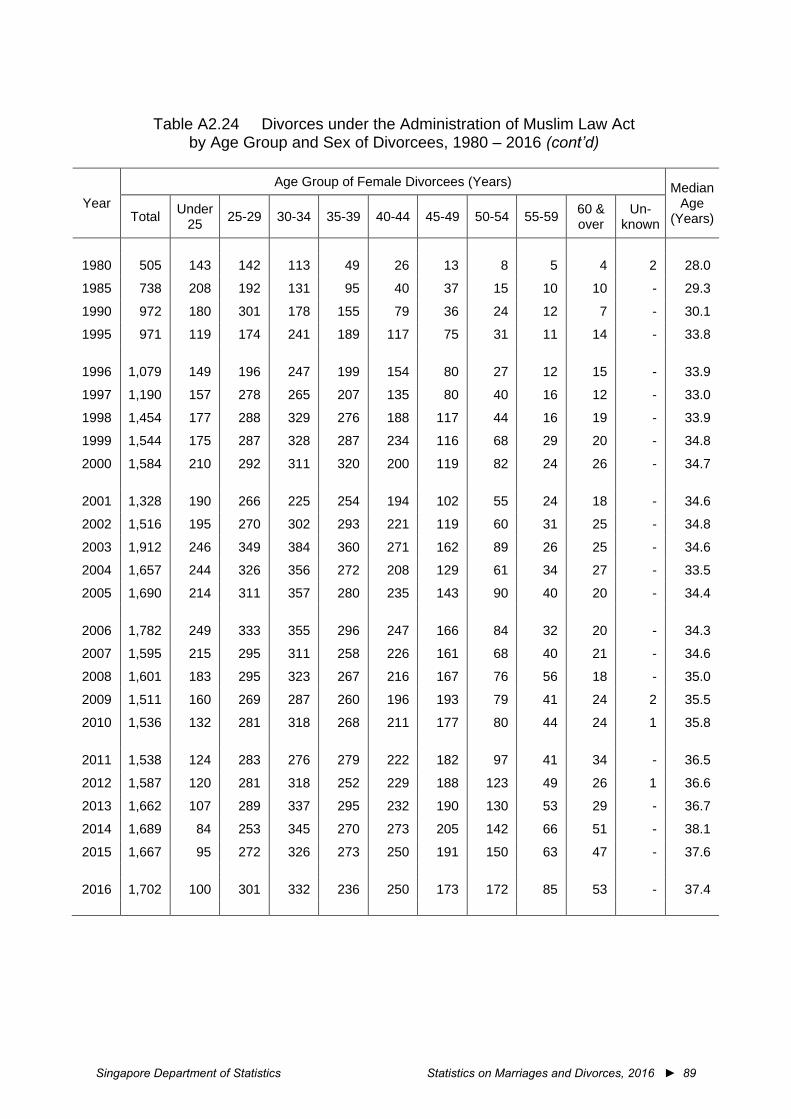
Singapore Department of Statistics Statistics on Marriages and Divorces, 2016 ► 89
Table A2.24 Divorces under the Administration of Muslim Law Act
by Age Group and Sex of Divorcees, 1980 – 2016 (cont’d)
Year Age Group of Female Divorcees (Years) Median
Age (Years) Total Under
25 25-29 30-34 35-39 40-44 45-49 50-54 55-59 60 & over
Un-known
1980 505 143 142 113 49 26 13 8 5 4 2 28.0
1985 738 208 192 131 95 40 37 15 10 10 - 29.3
1990 972 180 301 178 155 79 36 24 12 7 - 30.1
1995 971 119 174 241 189 117 75 31 11 14 - 33.8
1996 1,079 149 196 247 199 154 80 27 12 15 - 33.9
1997 1,190 157 278 265 207 135 80 40 16 12 - 33.0
1998 1,454 177 288 329 276 188 117 44 16 19 - 33.9
1999 1,544 175 287 328 287 234 116 68 29 20 - 34.8
2000 1,584 210 292 311 320 200 119 82 24 26 - 34.7
2001 1,328 190 266 225 254 194 102 55 24 18 - 34.6
2002 1,516 195 270 302 293 221 119 60 31 25 - 34.8
2003 1,912 246 349 384 360 271 162 89 26 25 - 34.6
2004 1,657 244 326 356 272 208 129 61 34 27 - 33.5
2005 1,690 214 311 357 280 235 143 90 40 20 - 34.4
2006 1,782 249 333 355 296 247 166 84 32 20 - 34.3
2007 1,595 215 295 311 258 226 161 68 40 21 - 34.6
2008 1,601 183 295 323 267 216 167 76 56 18 - 35.0
2009 1,511 160 269 287 260 196 193 79 41 24 2 35.5
2010 1,536 132 281 318 268 211 177 80 44 24 1 35.8
2011 1,538 124 283 276 279 222 182 97 41 34 - 36.5
2012 1,587 120 281 318 252 229 188 123 49 26 1 36.6
2013 1,662 107 289 337 295 232 190 130 53 29 - 36.7
2014 1,689 84 253 345 270 273 205 142 66 51 - 38.1
2015 1,667 95 272 326 273 250 191 150 63 47 - 37.6
2016 1,702 100 301 332 236 250 173 172 85 53 - 37.4
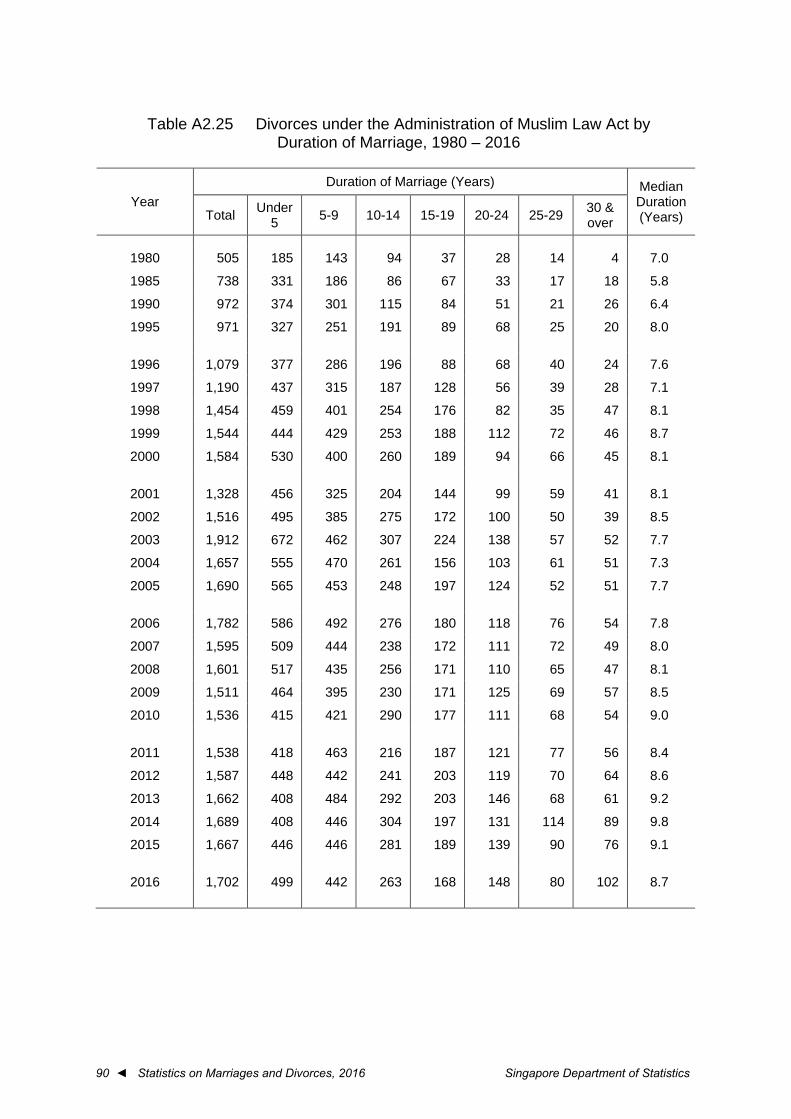
90 ◄ Statistics on Marriages and Divorces, 2016 Singapore Department of Statistics
Table A2.25 Divorces under the Administration of Muslim Law Act by
Duration of Marriage, 1980 – 2016
Year Duration of Marriage (Years) Median
Duration (Years) Total Under
5 5-9 10-14 15-19 20-24 25-29 30 & over
1980 505 185 143 94 37 28 14 4 7.0
1985 738 331 186 86 67 33 17 18 5.8
1990 972 374 301 115 84 51 21 26 6.4
1995 971 327 251 191 89 68 25 20 8.0
1996 1,079 377 286 196 88 68 40 24 7.6
1997 1,190 437 315 187 128 56 39 28 7.1
1998 1,454 459 401 254 176 82 35 47 8.1
1999 1,544 444 429 253 188 112 72 46 8.7
2000 1,584 530 400 260 189 94 66 45 8.1
2001 1,328 456 325 204 144 99 59 41 8.1
2002 1,516 495 385 275 172 100 50 39 8.5
2003 1,912 672 462 307 224 138 57 52 7.7
2004 1,657 555 470 261 156 103 61 51 7.3
2005 1,690 565 453 248 197 124 52 51 7.7
2006 1,782 586 492 276 180 118 76 54 7.8
2007 1,595 509 444 238 172 111 72 49 8.0
2008 1,601 517 435 256 171 110 65 47 8.1
2009 1,511 464 395 230 171 125 69 57 8.5
2010 1,536 415 421 290 177 111 68 54 9.0
2011 1,538 418 463 216 187 121 77 56 8.4
2012 1,587 448 442 241 203 119 70 64 8.6
2013 1,662 408 484 292 203 146 68 61 9.2
2014 1,689 408 446 304 197 131 114 89 9.8
2015 1,667 446 446 281 189 139 90 76 9.1
2016 1,702 499 442 263 168 148 80 102 8.7
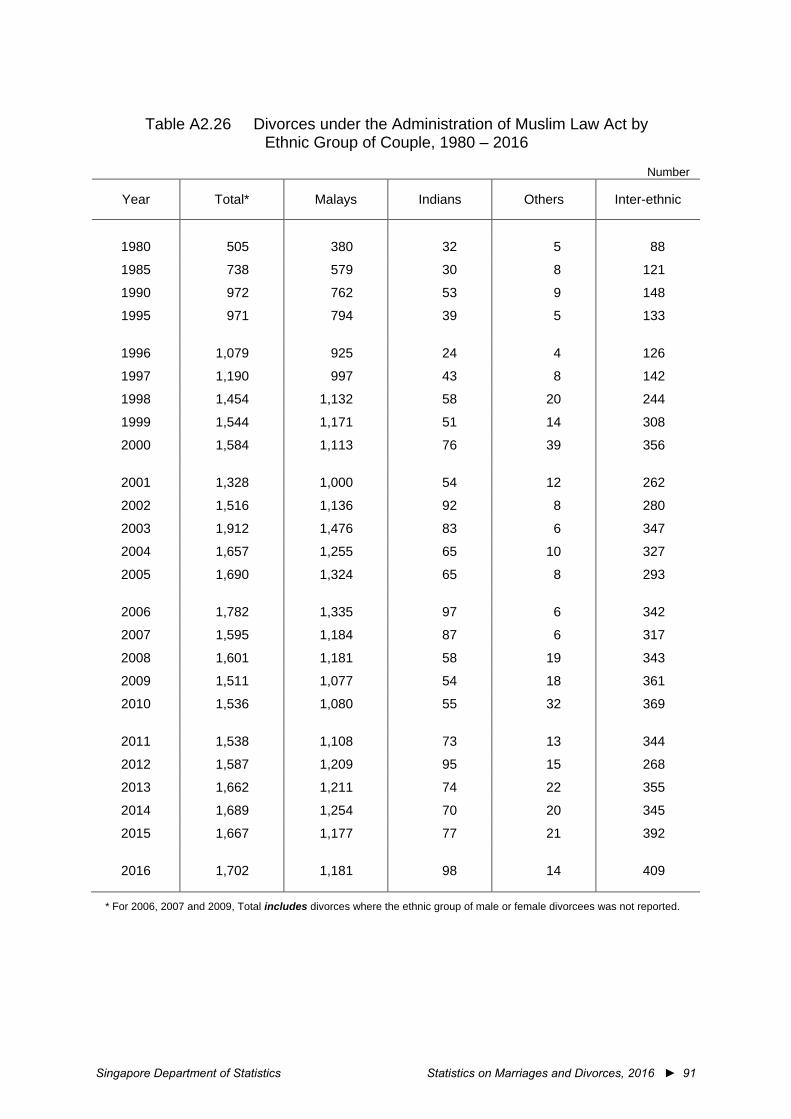
Singapore Department of Statistics Statistics on Marriages and Divorces, 2016 ► 91
Table A2.26 Divorces under the Administration of Muslim Law Act by
Ethnic Group of Couple, 1980 – 2016
Number
Year Total* Malays Indians Others Inter-ethnic
1980 505 380 32 5 88
1985 738 579 30 8 121
1990 972 762 53 9 148
1995 971 794 39 5 133
1996 1,079 925 24 4 126
1997 1,190 997 43 8 142
1998 1,454 1,132 58 20 244
1999 1,544 1,171 51 14 308
2000 1,584 1,113 76 39 356
2001 1,328 1,000 54 12 262
2002 1,516 1,136 92 8 280
2003 1,912 1,476 83 6 347
2004 1,657 1,255 65 10 327
2005 1,690 1,324 65 8 293
2006 1,782 1,335 97 6 342
2007 1,595 1,184 87 6 317
2008 1,601 1,181 58 19 343
2009 1,511 1,077 54 18 361
2010 1,536 1,080 55 32 369
2011 1,538 1,108 73 13 344
2012 1,587 1,209 95 15 268
2013 1,662 1,211 74 22 355
2014 1,689 1,254 70 20 345
2015 1,667 1,177 77 21 392
2016 1,702 1,181 98 14 409
* For 2006, 2007 and 2009, Total includes divorces where the ethnic group of male or female divorcees was not reported.

92 ◄ Statistics on Marriages and Divorces, 2016 Singapore Department of Statistics
Table A2.27 Median Age of Male Divorcees under the Administration of
Muslim Law Act by Ethnic Group, 1980 – 2016
Years
Year Total* Malays Indians Others
1980 32.0 32.0 32.0 36.0
1985 32.8 32.6 31.7 36.3
1990 33.6 33.6 32.7 34.8
1995 36.6 36.5 36.9 37.7
1996 36.5 36.5 36.7 37.4
1997 36.2 36.2 34.6 38.1
1998 37.3 37.1 37.0 39.9
1999 37.8 37.7 37.2 38.5
2000 38.0 38.1 37.1 37.7
2001 37.9 37.9 37.6 39.6
2002 37.8 37.9 37.2 38.4
2003 37.6 37.6 37.5 38.3
2004 37.2 37.2 37.7 37.1
2005 38.3 38.2 36.3 39.3
2006 38.1 38.2 35.7 40.3
2007 38.2 38.8 36.4 36.9
2008 38.5 38.4 37.8 39.7
2009 38.6 38.6 37.9 38.7
2010 38.9 38.9 38.2 39.1
2011 39.5 39.6 38.6 40.3
2012 40.3 40.4 39.5 39.3
2013 40.1 40.2 37.7 42.9
2014 41.4 41.5 40.5 40.6
2015 41.2 41.8 39.6 40.3
2016 40.7 40.9 40.0 40.0
* For 2009, Total includes divorces where the ethnic group of male divorcees was not reported.
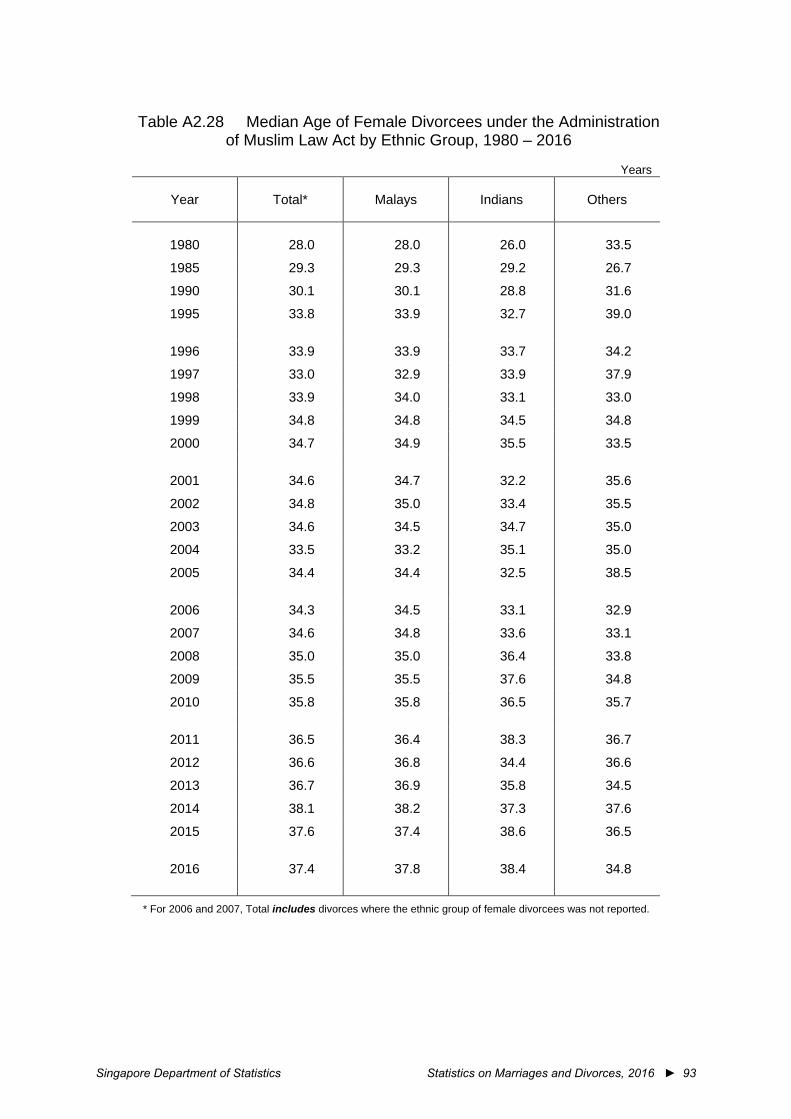
Singapore Department of Statistics Statistics on Marriages and Divorces, 2016 ► 93
Table A2.28 Median Age of Female Divorcees under the Administration
of Muslim Law Act by Ethnic Group, 1980 – 2016
Years
Year Total* Malays Indians Others
1980 28.0 28.0 26.0 33.5
1985 29.3 29.3 29.2 26.7
1990 30.1 30.1 28.8 31.6
1995 33.8 33.9 32.7 39.0
1996 33.9 33.9 33.7 34.2
1997 33.0 32.9 33.9 37.9
1998 33.9 34.0 33.1 33.0
1999 34.8 34.8 34.5 34.8
2000 34.7 34.9 35.5 33.5
2001 34.6 34.7 32.2 35.6
2002 34.8 35.0 33.4 35.5
2003 34.6 34.5 34.7 35.0
2004 33.5 33.2 35.1 35.0
2005 34.4 34.4 32.5 38.5
2006 34.3 34.5 33.1 32.9
2007 34.6 34.8 33.6 33.1
2008 35.0 35.0 36.4 33.8
2009 35.5 35.5 37.6 34.8
2010 35.8 35.8 36.5 35.7
2011 36.5 36.4 38.3 36.7
2012 36.6 36.8 34.4 36.6
2013 36.7 36.9 35.8 34.5
2014 38.1 38.2 37.3 37.6
2015 37.6 37.4 38.6 36.5
2016 37.4 37.8 38.4 34.8
* For 2006 and 2007, Total includes divorces where the ethnic group of female divorcees was not reported.

94 ◄ Statistics on Marriages and Divorces, 2016 Singapore Department of Statistics
Table A2.29 Divorces under the Administration of Muslim Law Act by
Ethnic Group of Couple, January – December 2016
Number
Month Total Malays Indians Others Inter-ethnic
Total 1,702 1,181 98 14 409
January 142 91 9 4 38 February 138 94 13 - 31
March 159 113 11 2 33
April 179 119 11 1 48 May 155 108 6 1 40 June 124 90 6 2 26
July 147 97 4 - 46
August 149 109 3 1 36 September 131 100 2 1 28
October 157 103 15 2 37
November 137 97 14 - 26 December 84 60 4 - 20
Table A2.30 Divorces under the Administration of Muslim Law Act by Previous Marital Status and Ethnic Group of Couple, 2016
Number
Previous Marital Status of Couple Total Malays Indians Others Inter-ethnic
Total* 1,702 1,181 98 14 409
Single man & Single woman 1,076 751 74 12 239 Divorced woman 183 121 8 - 54 Widowed woman 4 3 - - 1 Divorced man &
Single woman 139 94 4 - 41 Divorced woman 246 181 6 - 59 Widowed woman 9 5 - 1 3 Widowed/Married man &
Single woman 4 - - - 4 Divorced woman 12 9 2 - 1 Widowed woman 4 4 - - -
* Total includes divorces where the previous marital status of male or female divorcees was not reported.
Note: Previous marital status refers to a person’s marital status prior to the latest marriage which ended in a divorce.
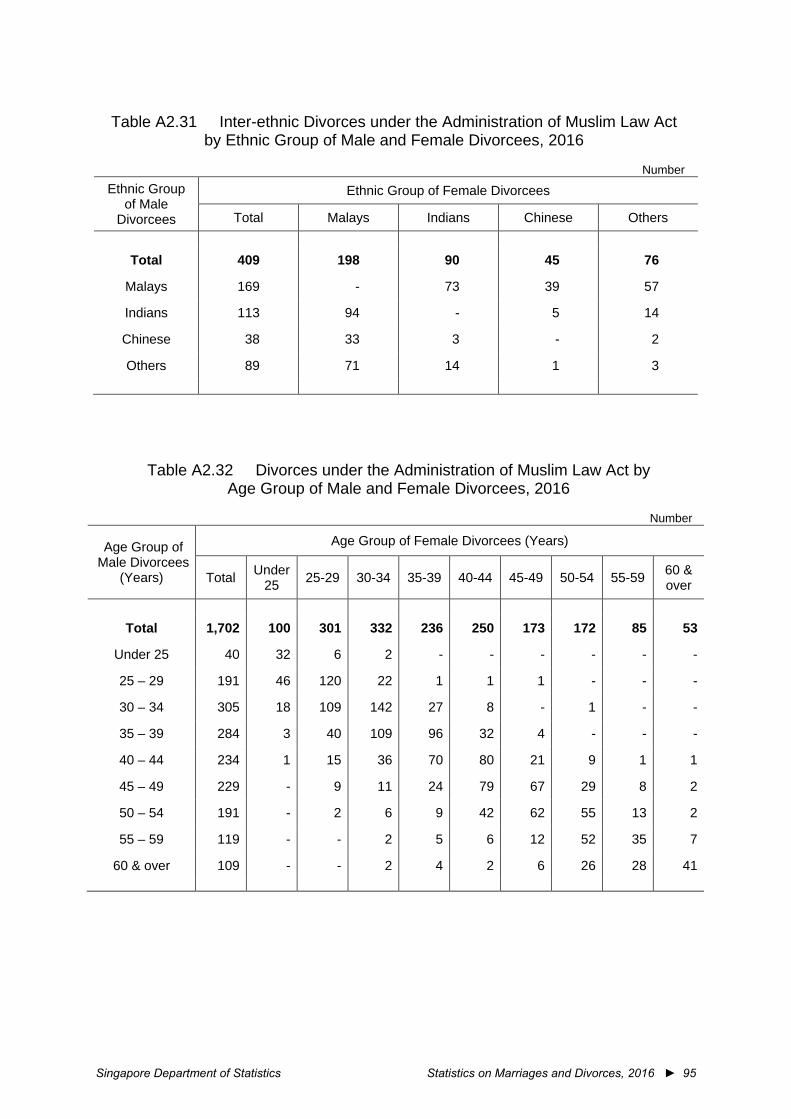
Singapore Department of Statistics Statistics on Marriages and Divorces, 2016 ► 95
Table A2.31 Inter-ethnic Divorces under the Administration of Muslim Law Act
by Ethnic Group of Male and Female Divorcees, 2016
Number Ethnic Group
of Male Divorcees
Ethnic Group of Female Divorcees
Total Malays Indians Chinese Others
Total 409 198 90 45 76
Malays 169 - 73 39 57
Indians 113 94 - 5 14
Chinese 38 33 3 - 2
Others 89 71 14 1 3
Table A2.32 Divorces under the Administration of Muslim Law Act by Age Group of Male and Female Divorcees, 2016
Number
Age Group of Male Divorcees
(Years)
Age Group of Female Divorcees (Years)
Total Under 25 25-29 30-34 35-39 40-44 45-49 50-54 55-59 60 &
over
Total 1,702 100 301 332 236 250 173 172 85 53
Under 25 40 32 6 2 - - - - - -
25 – 29 191 46 120 22 1 1 1 - - -
30 – 34 305 18 109 142 27 8 - 1 - -
35 – 39 284 3 40 109 96 32 4 - - -
40 – 44 234 1 15 36 70 80 21 9 1 1
45 – 49 229 - 9 11 24 79 67 29 8 2
50 – 54 191 - 2 6 9 42 62 55 13 2
55 – 59 119 - - 2 5 6 12 52 35 7
60 & over 109 - - 2 4 2 6 26 28 41
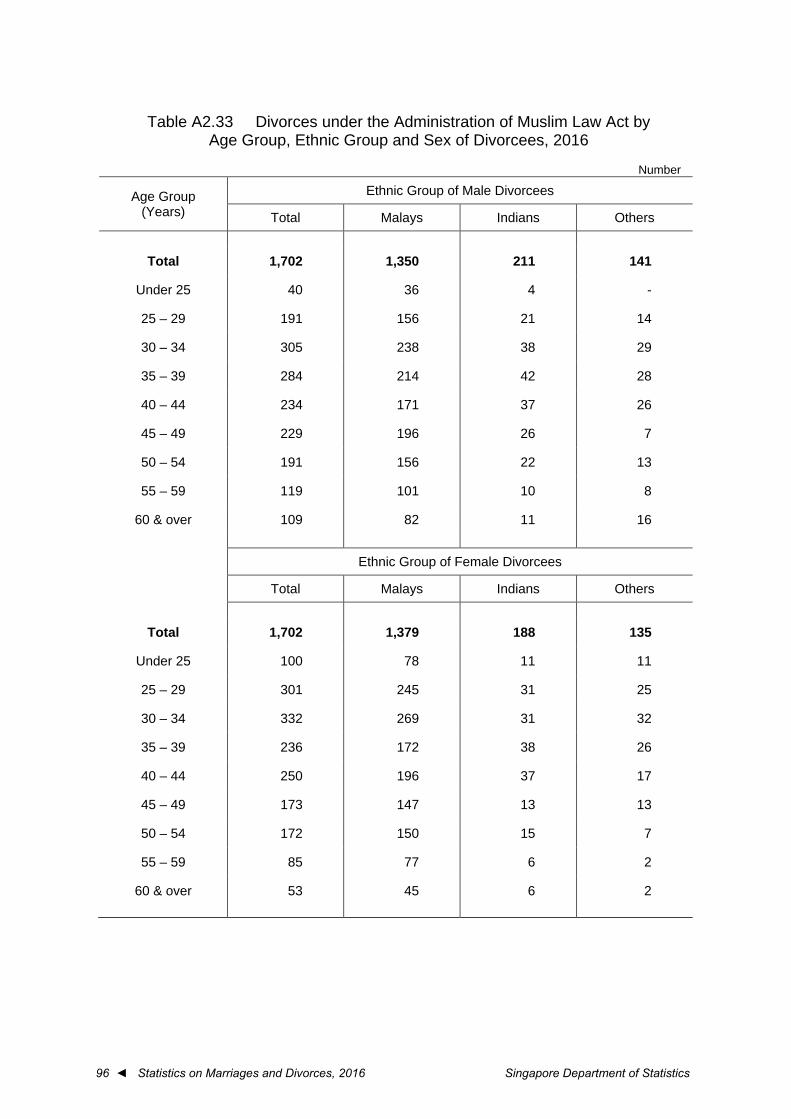
96 ◄ Statistics on Marriages and Divorces, 2016 Singapore Department of Statistics
Table A2.33 Divorces under the Administration of Muslim Law Act by
Age Group, Ethnic Group and Sex of Divorcees, 2016
Number
Age Group (Years)
Ethnic Group of Male Divorcees
Total Malays Indians Others
Total 1,702 1,350 211 141
Under 25 40 36 4 -
25 – 29 191 156 21 14
30 – 34 305 238 38 29
35 – 39 284 214 42 28
40 – 44 234 171 37 26
45 – 49 229 196 26 7
50 – 54 191 156 22 13
55 – 59 119 101 10 8
60 & over 109 82 11 16
Ethnic Group of Female Divorcees
Total Malays Indians Others
Total 1,702 1,379 188 135
Under 25 100 78 11 11
25 – 29 301 245 31 25
30 – 34 332 269 31 32
35 – 39 236 172 38 26
40 – 44 250 196 37 17
45 – 49 173 147 13 13
50 – 54 172 150 15 7
55 – 59 85 77 6 2
60 & over 53 45 6 2
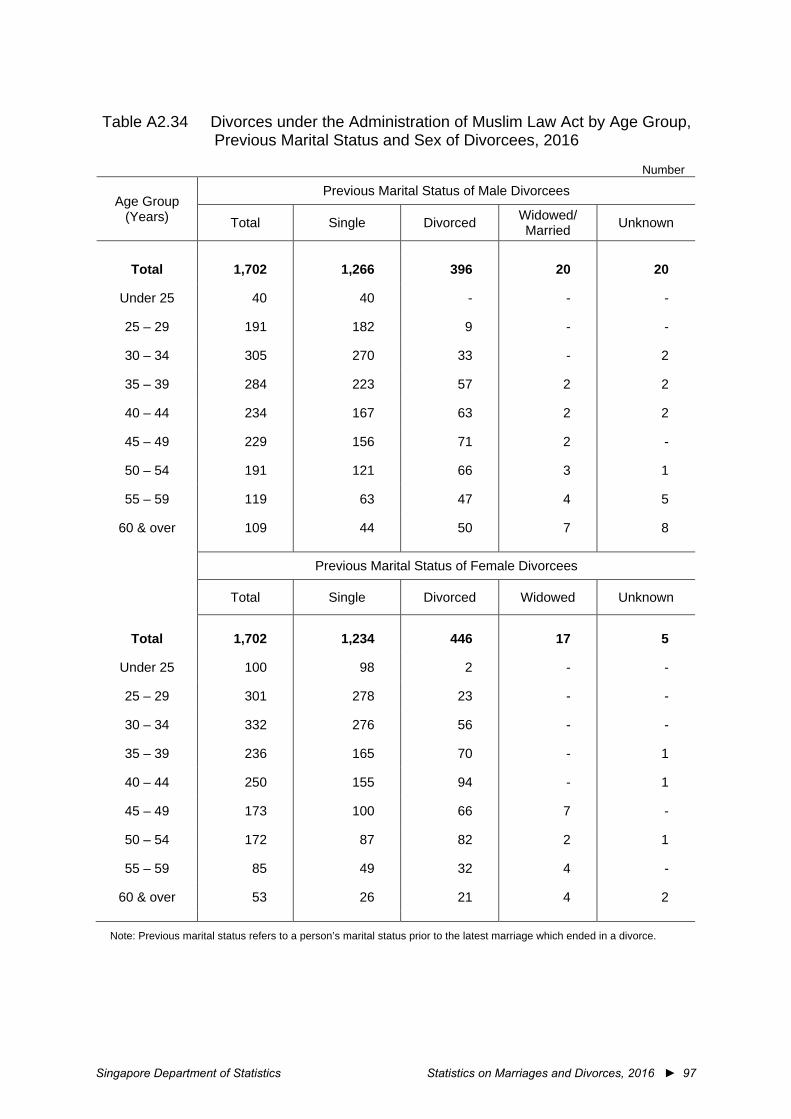
Singapore Department of Statistics Statistics on Marriages and Divorces, 2016 ► 97
Table A2.34 Divorces under the Administration of Muslim Law Act by Age Group,
Previous Marital Status and Sex of Divorcees, 2016
Number
Age Group (Years)
Previous Marital Status of Male Divorcees
Total Single Divorced Widowed/ Married Unknown
Total 1,702 1,266 396 20 20
Under 25 40 40 - - -
25 – 29 191 182 9 - -
30 – 34 305 270 33 - 2
35 – 39 284 223 57 2 2
40 – 44 234 167 63 2 2
45 – 49 229 156 71 2 -
50 – 54 191 121 66 3 1
55 – 59 119 63 47 4 5
60 & over 109 44 50 7 8
Previous Marital Status of Female Divorcees
Total Single Divorced Widowed Unknown
Total 1,702 1,234 446 17 5
Under 25 100 98 2 - -
25 – 29 301 278 23 - -
30 – 34 332 276 56 - -
35 – 39 236 165 70 - 1
40 – 44 250 155 94 - 1
45 – 49 173 100 66 7 -
50 – 54 172 87 82 2 1
55 – 59 85 49 32 4 -
60 & over 53 26 21 4 2
Note: Previous marital status refers to a person’s marital status prior to the latest marriage which ended in a divorce.
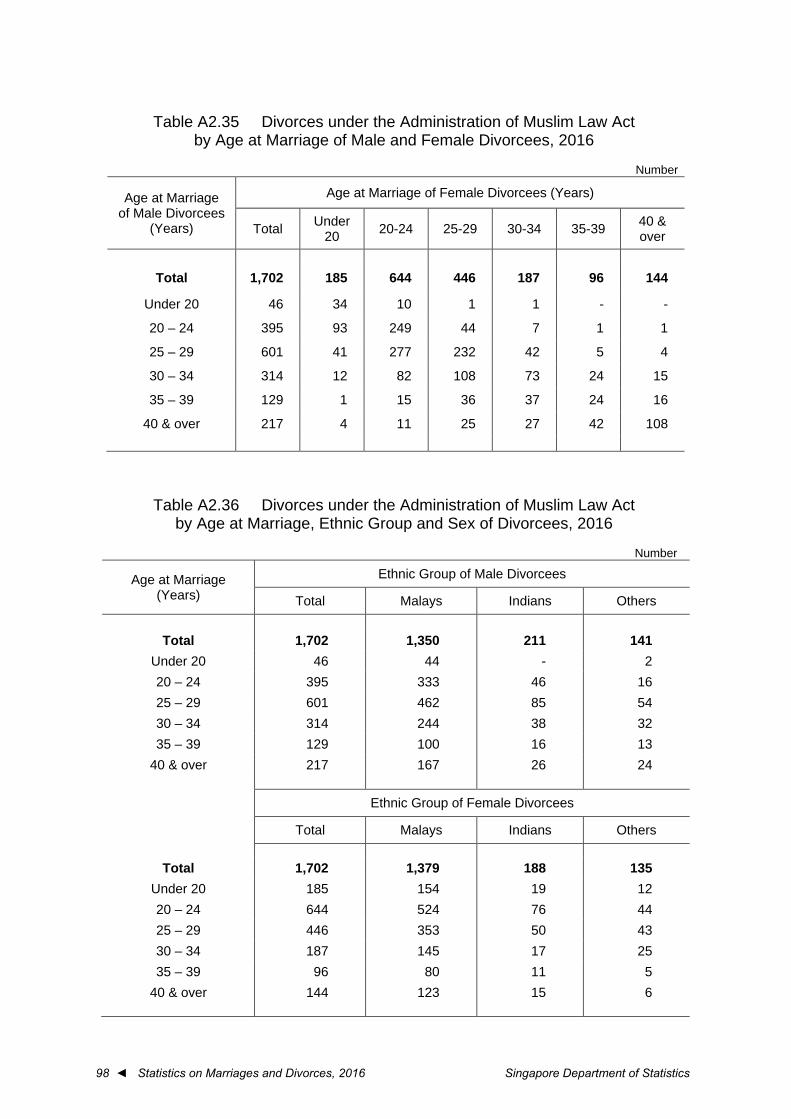
98 ◄ Statistics on Marriages and Divorces, 2016 Singapore Department of Statistics
Table A2.35 Divorces under the Administration of Muslim Law Act
by Age at Marriage of Male and Female Divorcees, 2016
Number
Age at Marriage of Male Divorcees
(Years)
Age at Marriage of Female Divorcees (Years)
Total Under 20 20-24 25-29 30-34 35-39 40 &
over
Total 1,702 185 644 446 187 96 144
Under 20 46 34 10 1 1 - -
20 – 24 395 93 249 44 7 1 1
25 – 29 601 41 277 232 42 5 4
30 – 34 314 12 82 108 73 24 15
35 – 39 129 1 15 36 37 24 16
40 & over 217 4 11 25 27 42 108
Table A2.36 Divorces under the Administration of Muslim Law Act by Age at Marriage, Ethnic Group and Sex of Divorcees, 2016
Number
Age at Marriage (Years)
Ethnic Group of Male Divorcees
Total Malays Indians Others
Total 1,702 1,350 211 141 Under 20 46 44 - 2 20 – 24 395 333 46 16 25 – 29 601 462 85 54 30 – 34 314 244 38 32 35 – 39 129 100 16 13
40 & over 217 167 26 24
Ethnic Group of Female Divorcees
Total Malays Indians Others
Total 1,702 1,379 188 135 Under 20 185 154 19 12 20 – 24 644 524 76 44 25 – 29 446 353 50 43 30 – 34 187 145 17 25 35 – 39 96 80 11 5
40 & over 144 123 15 6

Singapore Department of Statistics Statistics on Marriages and Divorces, 2016 ► 99
Table A2.37 Divorces under the Administration of Muslim Law Act by
Duration of Marriage and Ethnic Group of Couple, 2016
Duration of Marriage (Years)
Total Malays Indians Others Inter-ethnic
Total 1,702 1,181 98 14 409
Under 5 499 340 33 6 120
5 – 9 442 283 18 6 135
10 – 14 263 185 13 - 65
15 – 19 168 118 13 - 37
20 – 24 148 111 11 - 26
25 – 29 80 64 5 1 10
30 & over 102 80 5 1 16
Median
Duration (Years)
8.7 9.1 9.1 6.6 8.2
Table A2.38 Divorces under the Administration of Muslim Law Act by Duration of Marriage and Number of Dependent Children under 18 Years, 2016
Number
Duration of Marriage (Years)
Number of Dependent Children under 18 Years
Total 0 1 2 3 4 & over
Total 1,702 752 429 302 161 58
Under 5 499 287 141 56 13 2
5 – 9 442 172 116 101 44 9
10 – 14 263 68 59 58 55 23
15 – 19 168 32 30 51 35 20
20 – 24 148 55 48 28 13 4
25 – 29 80 48 26 5 1 -
30 & over 102 90 9 3 - -
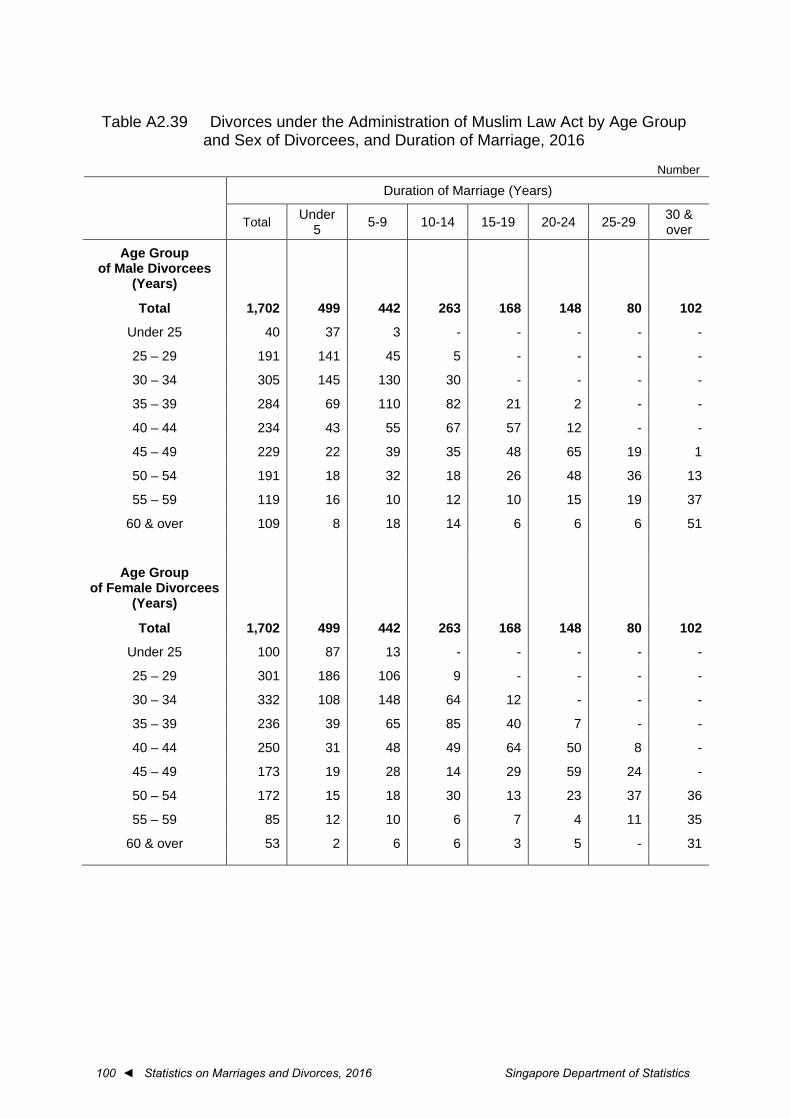
100 ◄ Statistics on Marriages and Divorces, 2016 Singapore Department of Statistics
Table A2.39 Divorces under the Administration of Muslim Law Act by Age Group
and Sex of Divorcees, and Duration of Marriage, 2016
Number
Duration of Marriage (Years)
Total Under 5 5-9 10-14 15-19 20-24 25-29 30 &
over
Age Group of Male Divorcees
(Years)
Total 1,702 499 442 263 168 148 80 102
Under 25 40 37 3 - - - - -
25 – 29 191 141 45 5 - - - -
30 – 34 305 145 130 30 - - - -
35 – 39 284 69 110 82 21 2 - -
40 – 44 234 43 55 67 57 12 - -
45 – 49 229 22 39 35 48 65 19 1
50 – 54 191 18 32 18 26 48 36 13
55 – 59 119 16 10 12 10 15 19 37
60 & over 109 8 18 14 6 6 6 51
Age Group of Female Divorcees
(Years)
Total
1,702 499 442 263 168 148 80 102
Under 25 100 87 13 - - - - -
25 – 29 301 186 106 9 - - - -
30 – 34 332 108 148 64 12 - - -
35 – 39 236 39 65 85 40 7 - -
40 – 44 250 31 48 49 64 50 8 -
45 – 49 173 19 28 14 29 59 24 -
50 – 54 172 15 18 30 13 23 37 36
55 – 59 85 12 10 6 7 4 11 35
60 & over 53 2 6 6 3 5 - 31
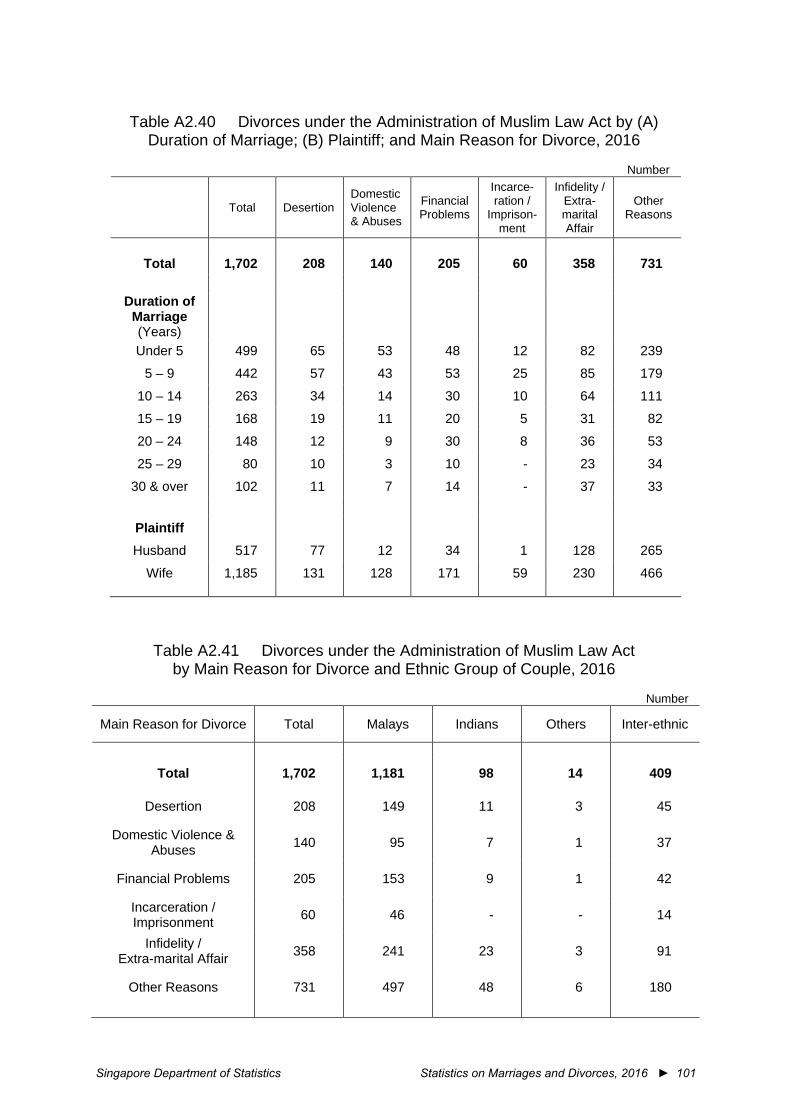
Singapore Department of Statistics Statistics on Marriages and Divorces, 2016 ► 101
Table A2.40 Divorces under the Administration of Muslim Law Act by (A)
Duration of Marriage; (B) Plaintiff; and Main Reason for Divorce, 2016
Number
Total Desertion Domestic Violence & Abuses
Financial Problems
Incarce-ration /
Imprison-ment
Infidelity / Extra-marital Affair
Other Reasons
Total 1,702 208 140 205 60 358 731
Duration of
Marriage (Years)
Under 5 499 65 53 48 12 82 239
5 – 9 442 57 43 53 25 85 179
10 – 14 263 34 14 30 10 64 111
15 – 19 168 19 11 20 5 31 82
20 – 24 148 12 9 30 8 36 53
25 – 29 80 10 3 10 - 23 34
30 & over 102 11 7 14 - 37 33
Plaintiff
Husband 517 77 12 34 1 128 265
Wife 1,185 131 128 171 59 230 466
Table A2.41 Divorces under the Administration of Muslim Law Act by Main Reason for Divorce and Ethnic Group of Couple, 2016
Number
Main Reason for Divorce Total Malays Indians Others Inter-ethnic
Total 1,702 1,181 98 14 409
Desertion 208 149 11 3 45
Domestic Violence & Abuses 140 95 7 1 37
Financial Problems 205 153 9 1 42
Incarceration / Imprisonment 60 46 - - 14
Infidelity / Extra-marital Affair 358 241 23 3 91
Other Reasons 731 497 48 6 180

102 ◄ Statistics on Marriages and Divorces, 2016 Singapore Department of Statistics
Table A2.42 Divorces under the Administration of Muslim Law Act by Age Group
and Sex of Divorcees, and Main Reason for Divorce, 2016
Number
Total Desertion Domestic Violence & Abuses
Financial Problems
Incarcera-tion /
Imprison-ment
Infidelity / Extra-marital Affair
Other Reasons
Age Group of Male
Divorcees (Years)
Total 1,702 208 140 205 60 358 731
Under 25 40 7 4 5 - 11 13
25 – 29 191 30 25 16 10 33 77
30 – 34 305 38 35 38 8 64 122
35 – 39 284 28 23 29 4 59 141
40 – 44 234 25 16 26 11 50 106
45 – 49 229 29 16 34 11 47 92
50 – 54 191 25 7 26 10 35 88
55 – 59 119 12 6 15 6 27 53
60 & over 109 14 8 16 - 32 39
Age Group of Female
Divorcees (Years)
Total
1,702 208 140 205 60 358 731
Under 25 100 14 12 11 4 20 39
25 – 29 301 46 36 33 13 53 120
30 – 34 332 46 35 35 5 65 146
35 – 39 236 20 13 27 9 54 113
40 – 44 250 22 20 37 14 54 103
45 – 49 173 18 7 28 3 31 86
50 – 54 172 22 6 19 4 43 78
55 – 59 85 11 9 7 6 24 28
60 & over 53 9 2 8 2 14 18
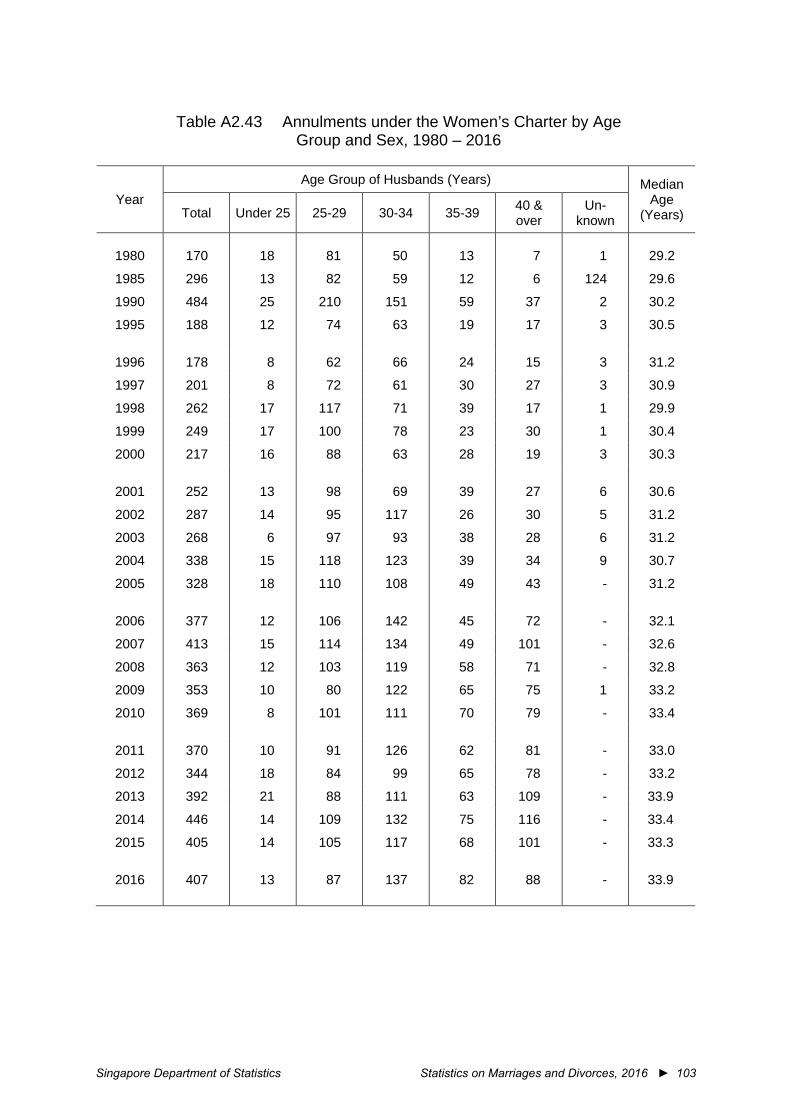
Singapore Department of Statistics Statistics on Marriages and Divorces, 2016 ► 103
Table A2.43 Annulments under the Women’s Charter by Age
Group and Sex, 1980 – 2016
Year Age Group of Husbands (Years) Median
Age (Years) Total Under 25 25-29 30-34 35-39 40 &
over Un-
known
1980 170 18 81 50 13 7 1 29.2
1985 296 13 82 59 12 6 124 29.6
1990 484 25 210 151 59 37 2 30.2
1995 188 12 74 63 19 17 3 30.5
1996 178 8 62 66 24 15 3 31.2
1997 201 8 72 61 30 27 3 30.9
1998 262 17 117 71 39 17 1 29.9
1999 249 17 100 78 23 30 1 30.4
2000 217 16 88 63 28 19 3 30.3
2001 252 13 98 69 39 27 6 30.6
2002 287 14 95 117 26 30 5 31.2
2003 268 6 97 93 38 28 6 31.2
2004 338 15 118 123 39 34 9 30.7
2005 328 18 110 108 49 43 - 31.2
2006 377 12 106 142 45 72 - 32.1
2007 413 15 114 134 49 101 - 32.6
2008 363 12 103 119 58 71 - 32.8
2009 353 10 80 122 65 75 1 33.2
2010 369 8 101 111 70 79 - 33.4
2011 370 10 91 126 62 81 - 33.0
2012 344 18 84 99 65 78 - 33.2
2013 392 21 88 111 63 109 - 33.9
2014 446 14 109 132 75 116 - 33.4
2015 405 14 105 117 68 101 - 33.3
2016 407 13 87 137 82 88 - 33.9
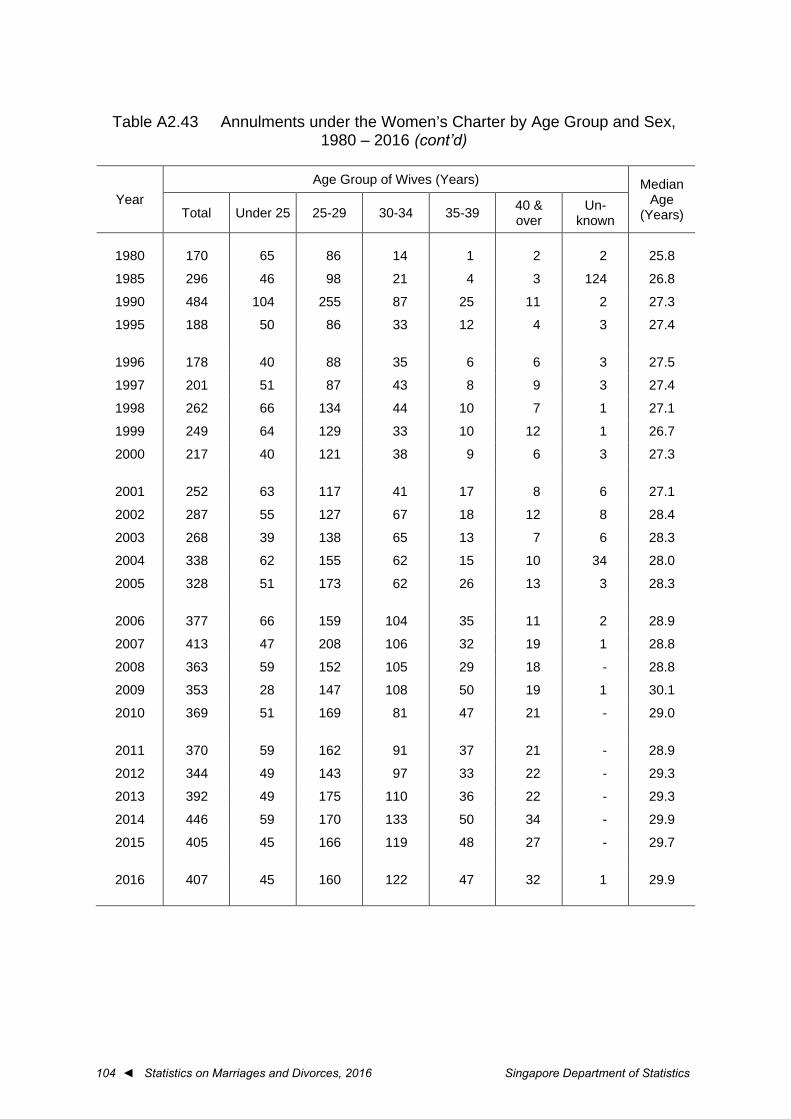
104 ◄ Statistics on Marriages and Divorces, 2016 Singapore Department of Statistics
Table A2.43 Annulments under the Women’s Charter by Age Group and Sex,
1980 – 2016 (cont’d)
Year Age Group of Wives (Years) Median
Age (Years) Total Under 25 25-29 30-34 35-39 40 &
over Un-
known
1980 170 65 86 14 1 2 2 25.8
1985 296 46 98 21 4 3 124 26.8
1990 484 104 255 87 25 11 2 27.3
1995 188 50 86 33 12 4 3 27.4
1996 178 40 88 35 6 6 3 27.5
1997 201 51 87 43 8 9 3 27.4
1998 262 66 134 44 10 7 1 27.1
1999 249 64 129 33 10 12 1 26.7
2000 217 40 121 38 9 6 3 27.3
2001 252 63 117 41 17 8 6 27.1
2002 287 55 127 67 18 12 8 28.4
2003 268 39 138 65 13 7 6 28.3
2004 338 62 155 62 15 10 34 28.0
2005 328 51 173 62 26 13 3 28.3
2006 377 66 159 104 35 11 2 28.9
2007 413 47 208 106 32 19 1 28.8
2008 363 59 152 105 29 18 - 28.8
2009 353 28 147 108 50 19 1 30.1
2010 369 51 169 81 47 21 - 29.0
2011 370 59 162 91 37 21 - 28.9
2012 344 49 143 97 33 22 - 29.3
2013 392 49 175 110 36 22 - 29.3
2014 446 59 170 133 50 34 - 29.9
2015 405 45 166 119 48 27 - 29.7
2016 407 45 160 122 47 32 1 29.9
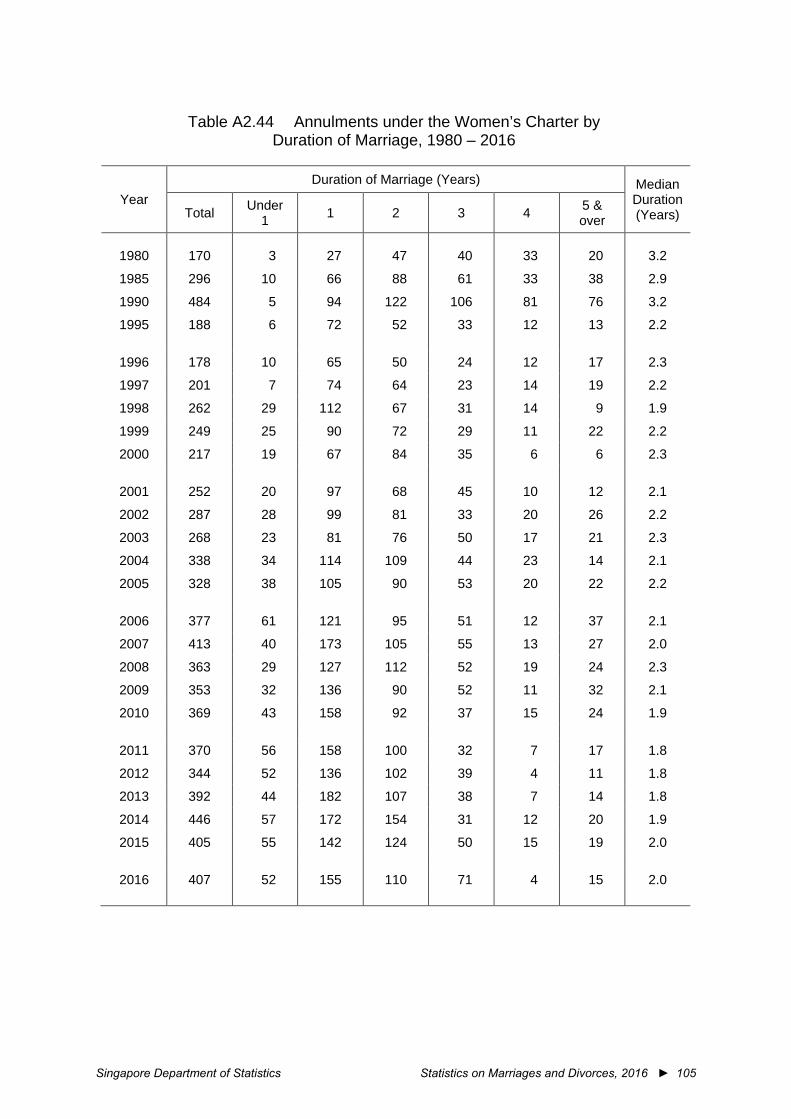
Singapore Department of Statistics Statistics on Marriages and Divorces, 2016 ► 105
Table A2.44 Annulments under the Women’s Charter by
Duration of Marriage, 1980 – 2016
Year Duration of Marriage (Years) Median
Duration (Years) Total Under
1 1 2 3 4 5 & over
1980 170 3 27 47 40 33 20 3.2
1985 296 10 66 88 61 33 38 2.9
1990 484 5 94 122 106 81 76 3.2
1995 188 6 72 52 33 12 13 2.2
1996 178 10 65 50 24 12 17 2.3
1997 201 7 74 64 23 14 19 2.2
1998 262 29 112 67 31 14 9 1.9
1999 249 25 90 72 29 11 22 2.2
2000 217 19 67 84 35 6 6 2.3
2001 252 20 97 68 45 10 12 2.1
2002 287 28 99 81 33 20 26 2.2
2003 268 23 81 76 50 17 21 2.3
2004 338 34 114 109 44 23 14 2.1
2005 328 38 105 90 53 20 22 2.2
2006 377 61 121 95 51 12 37 2.1
2007 413 40 173 105 55 13 27 2.0
2008 363 29 127 112 52 19 24 2.3
2009 353 32 136 90 52 11 32 2.1
2010 369 43 158 92 37 15 24 1.9
2011 370 56 158 100 32 7 17 1.8
2012 344 52 136 102 39 4 11 1.8
2013 392 44 182 107 38 7 14 1.8
2014 446 57 172 154 31 12 20 1.9
2015 405 55 142 124 50 15 19 2.0
2016 407 52 155 110 71 4 15 2.0
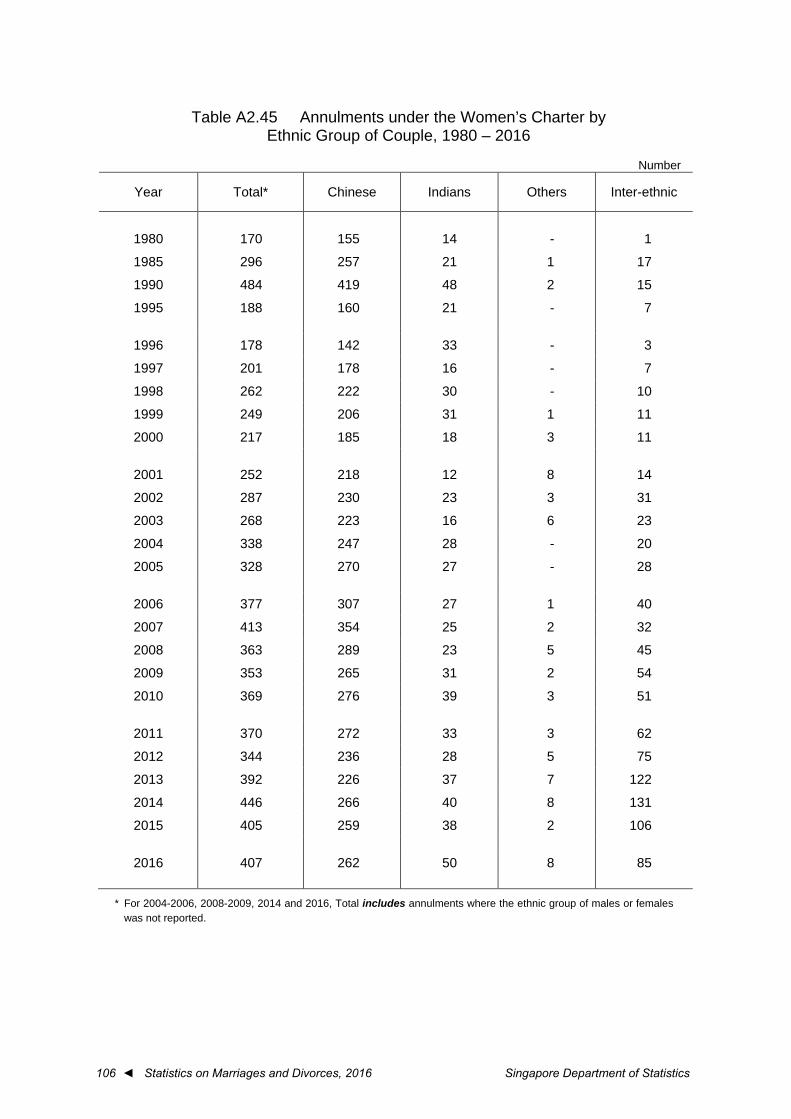
106 ◄ Statistics on Marriages and Divorces, 2016 Singapore Department of Statistics
Table A2.45 Annulments under the Women’s Charter by
Ethnic Group of Couple, 1980 – 2016
Number
Year Total* Chinese Indians Others Inter-ethnic
1980 170 155 14 - 1
1985 296 257 21 1 17
1990 484 419 48 2 15
1995 188 160 21 - 7
1996 178 142 33 - 3
1997 201 178 16 - 7
1998 262 222 30 - 10
1999 249 206 31 1 11
2000 217 185 18 3 11
2001 252 218 12 8 14
2002 287 230 23 3 31
2003 268 223 16 6 23
2004 338 247 28 - 20
2005 328 270 27 - 28
2006 377 307 27 1 40
2007 413 354 25 2 32
2008 363 289 23 5 45
2009 353 265 31 2 54
2010 369 276 39 3 51
2011 370 272 33 3 62
2012 344 236 28 5 75
2013 392 226 37 7 122
2014 446 266 40 8 131
2015 405 259 38 2 106
2016 407 262 50 8 85
* For 2004-2006, 2008-2009, 2014 and 2016, Total includes annulments where the ethnic group of males or females was not reported.
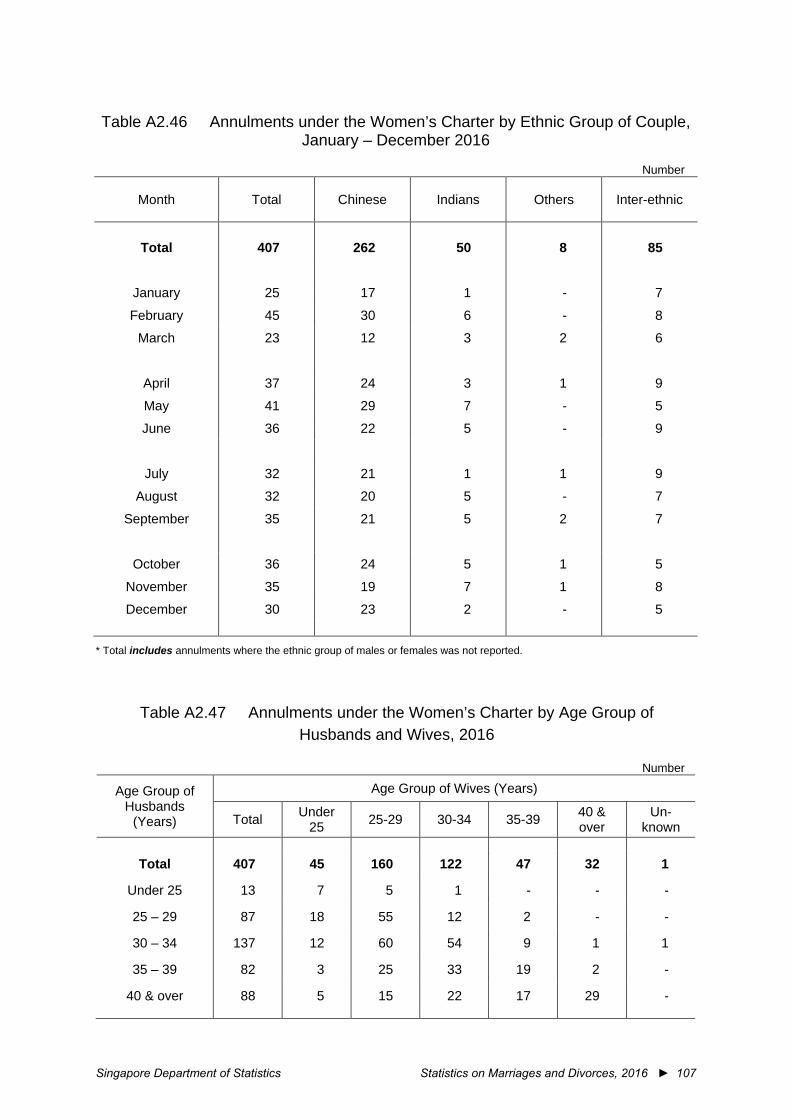
Singapore Department of Statistics Statistics on Marriages and Divorces, 2016 ► 107
Table A2.46 Annulments under the Women’s Charter by Ethnic Group of Couple,
January – December 2016
Number
Month Total Chinese Indians Others Inter-ethnic
Total 407 262 50 8 85
January 25 17 1 - 7
February 45 30 6 - 8
March 23 12 3 2 6
April 37 24 3 1 9
May 41 29 7 - 5
June 36 22 5 - 9
July 32 21 1 1 9
August 32 20 5 - 7
September 35 21 5 2 7
October 36 24 5 1 5
November 35 19 7 1 8
December 30 23 2 - 5
* Total includes annulments where the ethnic group of males or females was not reported.
Table A2.47 Annulments under the Women’s Charter by Age Group of Husbands and Wives, 2016
Number
Age Group of Husbands
(Years)
Age Group of Wives (Years)
Total Under 25 25-29 30-34 35-39 40 &
over Un-
known
Total 407 45 160 122 47 32 1
Under 25 13 7 5 1 - - -
25 – 29 87 18 55 12 2 - -
30 – 34 137 12 60 54 9 1 1
35 – 39 82 3 25 33 19 2 -
40 & over 88 5 15 22 17 29 -
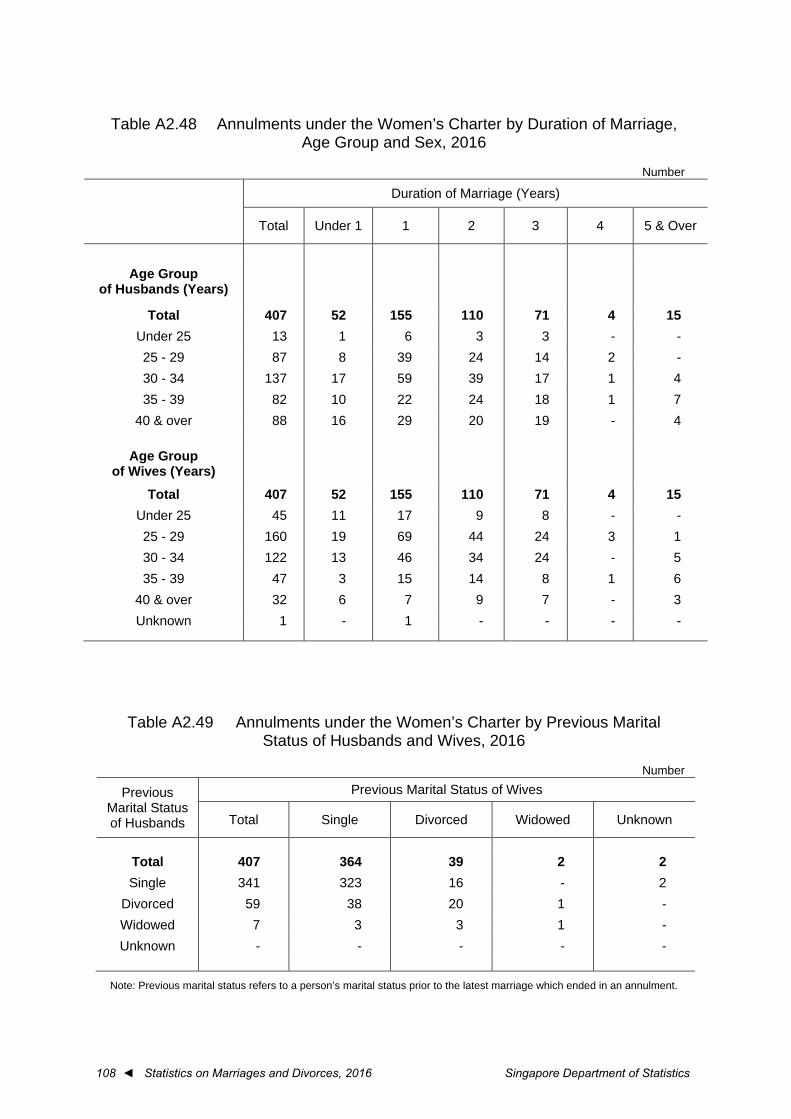
108 ◄ Statistics on Marriages and Divorces, 2016 Singapore Department of Statistics
Table A2.48 Annulments under the Women’s Charter by Duration of Marriage,
Age Group and Sex, 2016
Number
Duration of Marriage (Years)
Total Under 1 1 2 3 4 5 & Over
Age Group of Husbands (Years)
Total 407 52 155 110 71 4 15 Under 25 13 1 6 3 3 - - 25 - 29 87 8 39 24 14 2 - 30 - 34 137 17 59 39 17 1 4 35 - 39 82 10 22 24 18 1 7
40 & over 88 16 29 20 19 - 4
Age Group of Wives (Years)
Total 407 52 155 110 71 4 15 Under 25 45 11 17 9 8 - - 25 - 29 160 19 69 44 24 3 1 30 - 34 122 13 46 34 24 - 5 35 - 39 47 3 15 14 8 1 6
40 & over 32 6 7 9 7 - 3 Unknown 1 - 1 - - - -
Table A2.49 Annulments under the Women’s Charter by Previous Marital Status of Husbands and Wives, 2016
Number
Previous Marital Status of Husbands
Previous Marital Status of Wives
Total Single Divorced Widowed Unknown
Total 407 364 39 2 2 Single 341 323 16 - 2
Divorced 59 38 20 1 - Widowed 7 3 3 1 - Unknown - - - - -
Note: Previous marital status refers to a person’s marital status prior to the latest marriage which ended in an annulment.
Singapore Department of Statistics Statistics on Marriages and Divorces, 2016 ► 109
SOURCE AND DATA COVERAGE Statistics on Marriages
Statistics on marriages registered under the Women’s Charter are obtained from records maintained by the Registry of Marriages. They include all civil marriages solemnized by the Registrar of Marriages, pastors of churches, priests of Hindu temples and other registered solemnizers. For Muslim marriages, statistics are obtained from records of marriages registered under the Administration of Muslim Law Act maintained by the Registry of Muslim Marriages. Statistics on Divorces and Annulments
Statistics on divorces and annulments under the Women’s Charter are obtained from records maintained by the Family Justice Courts.
For divorces under the Administration of Muslim Law Act, statistics are obtained from the register of divorces kept by the Syariah Court. The records on revocation of divorces are obtained from the Registry of Muslim Marriages.
In this publication, time-related variables such as duration of marriage and age of divorcees are based on the date when Interim Judgement was made final for civil divorces, and date of registration for Muslim divorces. However, separations, whether by mutual agreements or otherwise and which do not confer on the parties the right to re-marry, are not covered.
110 ◄ Statistics on Marriages and Divorces, 2016 Singapore Department of Statistics
GLOSSARY Age-Specific Marriage Rate The number of marriages registered within a specific age group during the year, out of every thousand unmarried population in the same age group. Age-Specific Divorce Rate The number of divorces and annulments granted within a specific age group during the year, out of every thousand married population in the same age group. Annulments Annulments granted under Women’s Charter refer to invalidation of a marriage. Parties whose marriages have been annulled are conferred the status of never having been married to each other. Crude Marriage Rate The number of marriages registered in the year per thousand population. Crude Divorce Rate The number of divorces and annulments granted in the year per thousand population.

Singapore Department of Statistics Statistics on Marriages and Divorces, 2016 ► 111
Ethnic Group Classifications of Couple For marriages registered under the Women’s Charter:
“Others” comprises couples of the same ethnicity from other ethnic groups besides Chinese and Indians, namely Malays, Eurasians, Caucasians and other ethnicities as one single ‘Others’ group. E.g. Eurasian-Eurasian, Caucasian-Caucasian, Others-Others
“Inter-ethnic” marriages refer to marriages where both the groom and bride are of different ethnicity. E.g. Indian-Chinese, Eurasian-Caucasian, Chinese-Malay, Chinese-Others
For marriages registered under the Administration of Muslim Law Act:
“Others” comprises Muslim couples of the same ethnicity from other ethnic groups besides Malays and Indians, namely Chinese, Eurasians, Caucasians, and other ethnicities as one single ‘Others’ group. E.g. Eurasian-Eurasian, Caucasian-Caucasian, Others-Others
“Inter-ethnic” marriages refer to marriages where both the groom and bride are of different ethnicity. E.g. Malay-Indian, Malay-Chinese, Indian-Others
General Marriage Rate The number of marriages registered among persons aged 15-49 years during the year, out of every thousand unmarried population in the same age group. General Divorce Rate The number of divorces and annulments granted to married persons aged 20 years and over during the year, out of every thousand married population in the same age group.
PROJECT TEAM
Assistant Director Ms Kua Hui Shan
Statistician
Miss Hoon Si Hui
Lead Manager Ms Karin Huang
Manager
Mr Wong Kwok Wing
Corporate Support Officer Mr Ng Keng Chye
SINGAPORE DEPARTMENT OF STATISTICS INFORMATION DISSEMINATION SERVICES
Statistics Singapore Website
The Statistics Singapore Website was launched by the Singapore Department of Statistics (DOS) in January 1995. Internet users can access the website by connecting to:
http://www.singstat.gov.sg
Key Singapore statistics are available via the following sections: • Statistics
which provides access to the latest statistical findings of DOS as well as statistics compiled by Research and Statistics Units (RSUs) in ministries and statutory boards.
• News which provides a listing of the news released by DOS and RSUs.
• Publications which presents the latest editions of DOS’ publications, papers and articles.
• Browse by Themes which presents official statistics compiled by DOS and RSUs in the various ministries and statutory boards according to themes. Within each theme, relevant statistics and related press releases, publications and references are provided.
Statistical resources are available via:
• Publication and Papers which lists the latest editions of publications released by DOS according to statistical domains at http://www.singstat.gov.sg/publications/publications-and-papers. All softcopy DOS publications are available for free downloading. Statistical tables of DOS publications in Excel format are also available.
• Advance Release Calendar which provides a six months ahead advance release calendar of key statistical indicators.
The website also provides a convenient gateway to international statistical websites under the “Methodologies & Standards” section:
• Guide to International Statistics which provides hyperlinks to international databases and classifications, as well as websites of international bodies and other national statistical offices.
• IMF Dissemination Standards Bulletin Board which provides metadata about Singapore’s key indicators in the real, fiscal, financial and external sectors, including dissemination practices and information about pre-release access of current indicators.
SingStat Express
SingStat Express is a personalised data delivery service which sends the latest press releases, notices of publication, newsletter, occasional and information papers to subscribers via email. SMS alert service is also available to local users. Subscription details are available from the Statistics Singapore Website (http://www.singstat.gov.sg/express).
SINGAPORE DEPARTMENT OF STATISTICS INFORMATION DISSEMINATION SERVICES (cont’d)
Really Simple Syndication
Really Simple Syndication (RSS) is an easy way to stay updated on the latest statistical news released via the Statistics Singapore Website. The SingStat RSS feed delivers statistical news highlights and hyperlinks to the source documents whenever the updates are posted. More information is available at http://www.singstat.gov.sg/services/really-simple-syndication-(rss). SingStat Mobile App
SingStat Mobile App provides users with ready access to the latest key Singapore official statistics through their mobile devices while on the go. Users may visualise data for the latest periods with some 200 charts of commonly used statistics from 25 data categories. The app is available for downloading in iOS and Android devices. More information is available at http://www.singstat.gov.sg/services/singstat-mobile-app. SingStat Table Builder
The SingStat Table Builder contains statistical data series on the Singapore economy and population for users to create customised data tables, plot graphs and charts and export them in different file formats. Explore data trends with the e-service at http://www.singstat.gov.sg/tablebuilder. E-survey
The E-survey enables business organisations to complete and submit their survey forms through the internet. Using secured encryption protocols, the E-survey ensures that the information transmitted through the net is secured and protected. The system features online helps and validation checks to assist respondents in completing their survey forms. With the E-survey, respondents do away with the tedious paper work and manual tasks of mailing or faxing their survey returns to the Department.
Statistical Enquiries and Feedback
If you have any statistical enquiries or comment or suggestions on our statistical publications and electronic services, you are welcomed to:
Email us at [email protected]
Fax to us at (65) 6332-7689 Call us at 1800-3238118* (local callers)
(65) 6332-7738 (overseas callers)
* Calls from mobile telephone lines to 1800 local toll free number may be subject to mobile airtime charges as imposed by the relevant mobile service provider.