Embed Size (px)
Citation preview
2 | P a g e
3 | P a g e
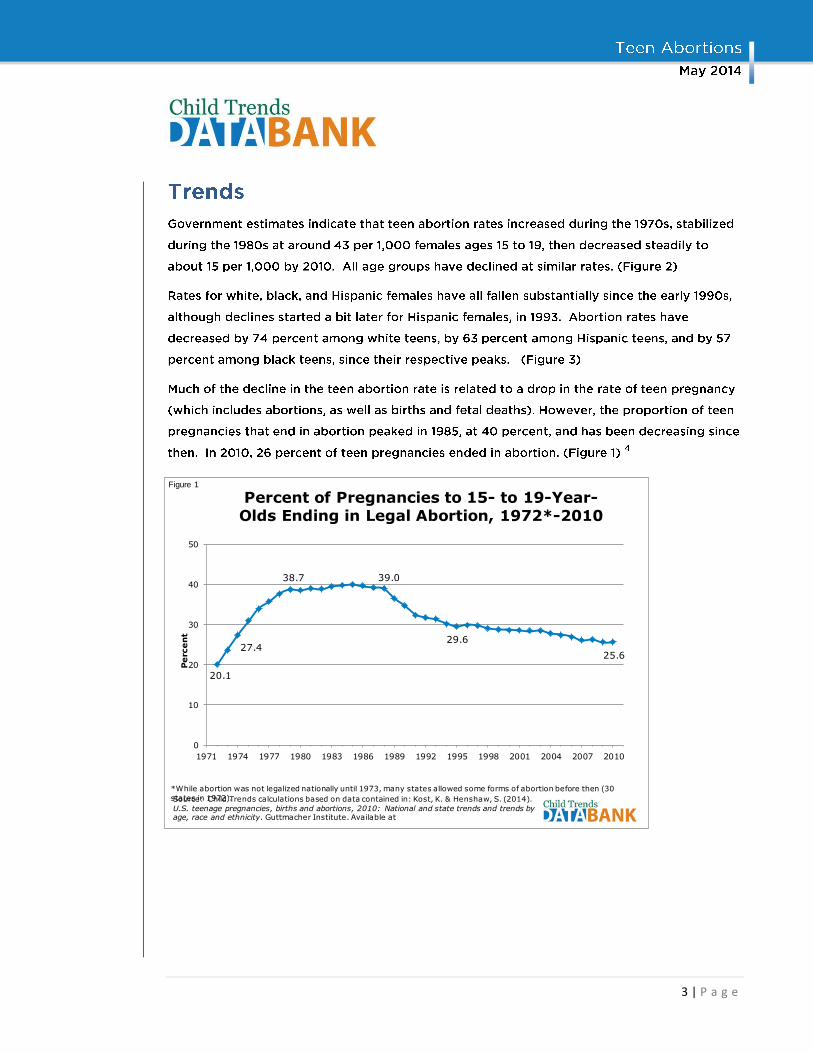
20.1
27.4
38.7 39.0
29.6
25.6
0
10
20
30
40
50
1971 1974 1977 1980 1983 1986 1989 1992 1995 1998 2001 2004 2007 2010
Pe
rce
nt
Percent of Pregnancies to 15- to 19-Year-Olds Ending in Legal Abortion, 1972*-2010
Figure 1
Source: Child Trends calculations based on data contained in: Kost, K. & Henshaw, S. (2014).
U.S. teenage pregnancies, births and abortions, 2010: National and state trends and trends by age, race and ethnicity. Guttmacher Institute. Available at
*While abortion was not legalized nationally until 1973, many states allowed some forms of abortion before then (30
states in 1972).
4 | P a g e
A
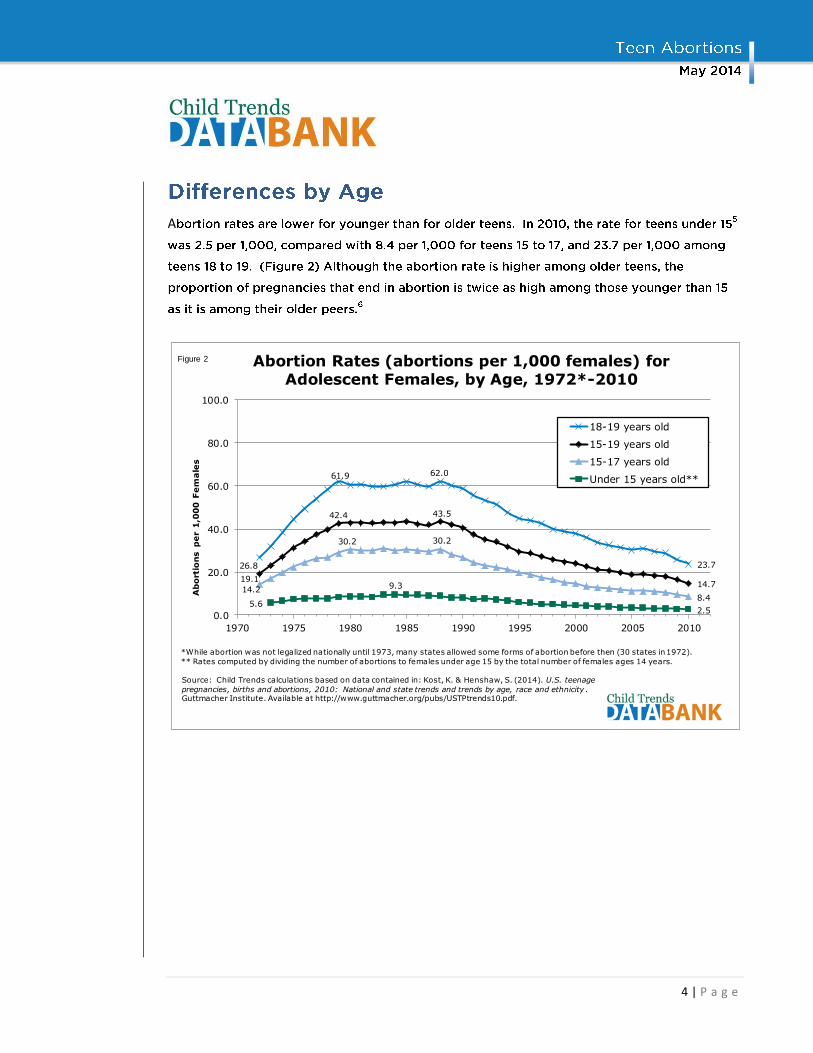
26.8
61.9 62.0
23.7
19.1
42.4 43.5
14.714.2
30.2 30.2
8.45.6
9.3
2.50.0
20.0
40.0
60.0
80.0
100.0
1970 1975 1980 1985 1990 1995 2000 2005 2010
Ab
ort
ion
s p
er
1,0
00
Fe
ma
les
Abortion Rates (abortions per 1,000 females) for Adolescent Females, by Age, 1972*-2010
18-19 years old
15-19 years old
15-17 years old
Under 15 years old**
Figure 2
Source: Child Trends calculations based on data contained in: Kost, K. & Henshaw, S. (2014). U.S. teenage
pregnancies, births and abortions, 2010: National and state trends and trends by age, race and ethnicity . Guttmacher Institute. Available at http://www.guttmacher.org/pubs/USTPtrends10.pdf.
*While abortion was not legalized nationally until 1973, many states allowed some forms of abortion before then (30 states in1972).
** Rates computed by dividing the number of abortions to females under age 15 by the total number of females ages 14 years.
5 | P a g e
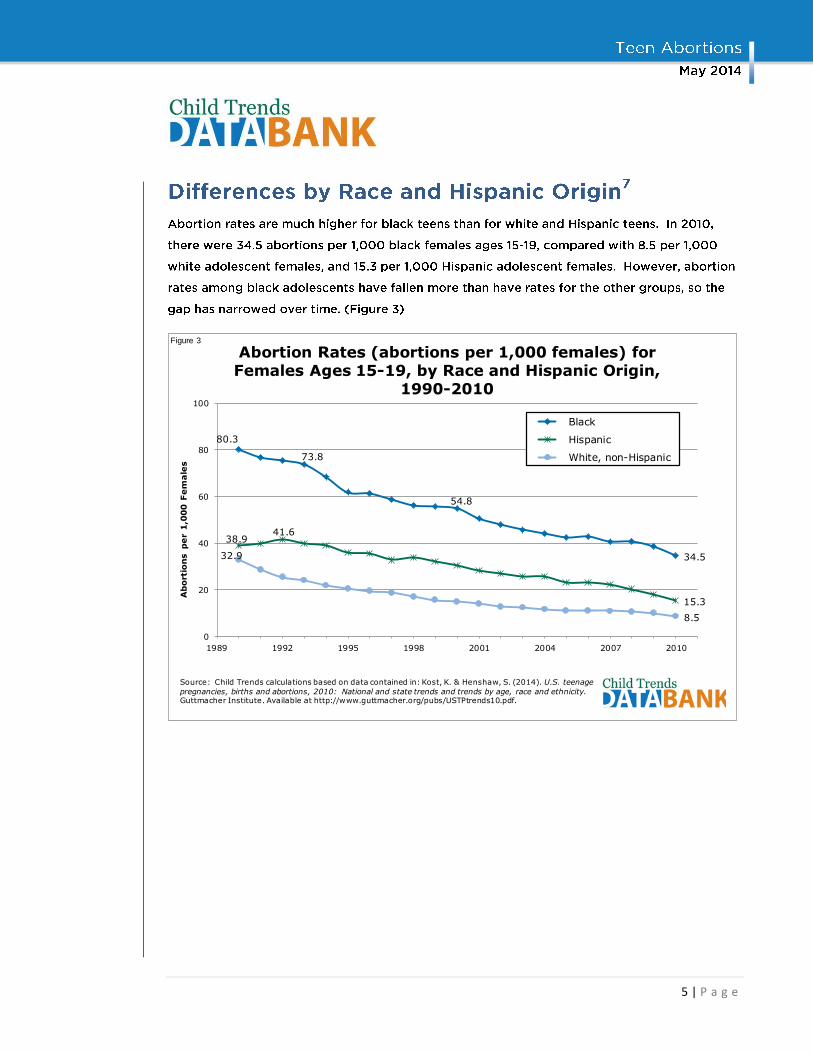
80.3
73.8
54.8
34.5
38.941.6
15.3
32.9
8.5
0
20
40
60
80
100
1989 1992 1995 1998 2001 2004 2007 2010
Ab
ort
ion
s p
er
1,0
00
Fe
ma
les
Abortion Rates (abortions per 1,000 females) for Females Ages 15-19, by Race and Hispanic Origin,
1990-2010
Black
Hispanic
White, non-Hispanic
Source: Child Trends calculations based on data contained in: Kost, K. & Henshaw, S. (2014). U.S. teenage
pregnancies, births and abortions, 2010: National and state trends and trends by age, race and ethnicity. Guttmacher Institute. Available at http://www.guttmacher.org/pubs/USTPtrends10.pdf.
Figure 3
6 | P a g e
7 | P a g e
What Works to Make Progress on This Indicator
8 | P a g e
May 2014
9 | P a g e
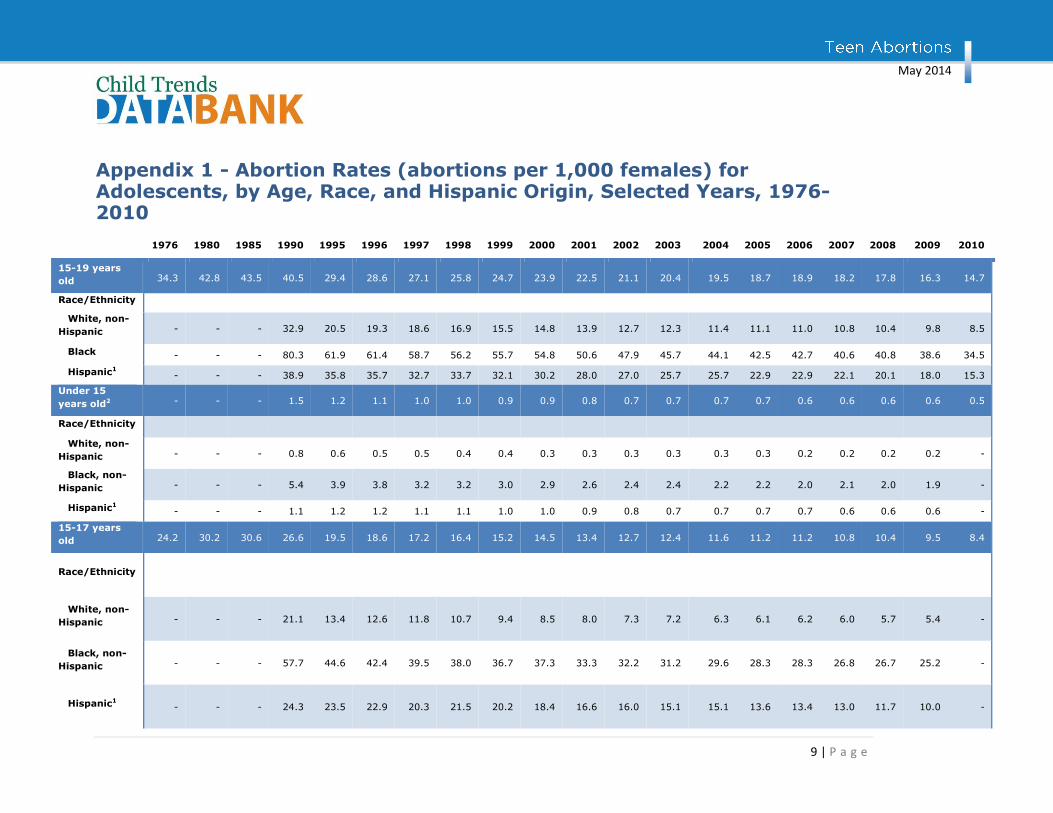
Appendix 1 - Abortion Rates (abortions per 1,000 females) for Adolescents, by Age, Race, and Hispanic Origin, Selected Years, 1976-2010
1976 1980 1985 1990 1995 1996 1997 1998 1999 2000 2001 2002 2003 2004 2005 2006 2007 2008 2009 2010
15-19 years
old 34.3 42.8 43.5 40.5 29.4 28.6 27.1 25.8 24.7 23.9 22.5 21.1 20.4 19.5 18.7 18.9 18.2 17.8 16.3 14.7
Race/Ethnicity
White, non-
Hispanic - - - 32.9 20.5 19.3 18.6 16.9 15.5 14.8 13.9 12.7 12.3 11.4 11.1 11.0 10.8 10.4 9.8 8.5
Black - - - 80.3 61.9 61.4 58.7 56.2 55.7 54.8 50.6 47.9 45.7 44.1 42.5 42.7 40.6 40.8 38.6 34.5
Hispanic1 - - - 38.9 35.8 35.7 32.7 33.7 32.1 30.2 28.0 27.0 25.7 25.7 22.9 22.9 22.1 20.1 18.0 15.3
Under 15
years old2 - - - 1.5 1.2 1.1 1.0 1.0 0.9 0.9 0.8 0.7 0.7 0.7 0.7 0.6 0.6 0.6 0.6 0.5
Race/Ethnicity
White, non-
Hispanic - - - 0.8 0.6 0.5 0.5 0.4 0.4 0.3 0.3 0.3 0.3 0.3 0.3 0.2 0.2 0.2 0.2 -
Black, non-
Hispanic - - - 5.4 3.9 3.8 3.2 3.2 3.0 2.9 2.6 2.4 2.4 2.2 2.2 2.0 2.1 2.0 1.9 -
Hispanic1 - - - 1.1 1.2 1.2 1.1 1.1 1.0 1.0 0.9 0.8 0.7 0.7 0.7 0.7 0.6 0.6 0.6 -
15-17 years
old 24.2 30.2 30.6 26.6 19.5 18.6 17.2 16.4 15.2 14.5 13.4 12.7 12.4 11.6 11.2 11.2 10.8 10.4 9.5 8.4
Race/Ethnicity
White, non-
Hispanic - - - 21.1 13.4 12.6 11.8 10.7 9.4 8.5 8.0 7.3 7.2 6.3 6.1 6.2 6.0 5.7 5.4 -
Black, non-
Hispanic - - - 57.7 44.6 42.4 39.5 38.0 36.7 37.3 33.3 32.2 31.2 29.6 28.3 28.3 26.8 26.7 25.2 -
Hispanic1 - - - 24.3 23.5 22.9 20.3 21.5 20.2 18.4 16.6 16.0 15.1 15.1 13.6 13.4 13.0 11.7 10.0 -
May 2014
10 | P a g e
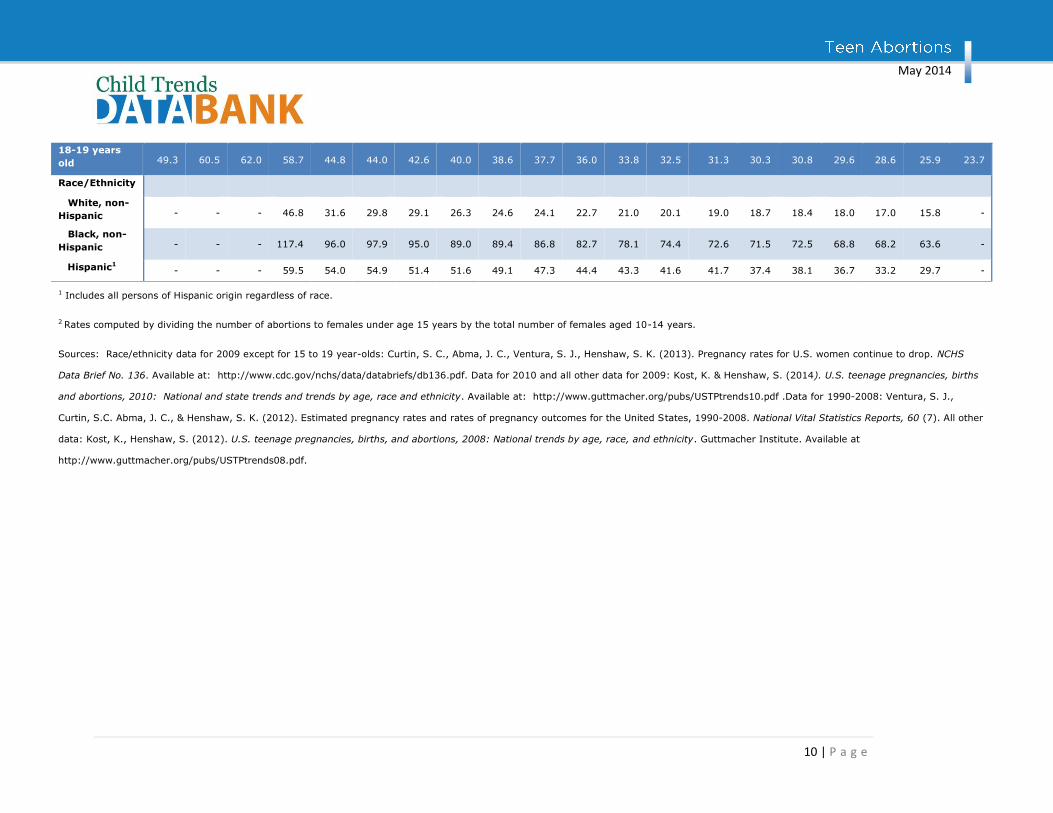
18-19 years
old 49.3 60.5 62.0 58.7 44.8 44.0 42.6 40.0 38.6 37.7 36.0 33.8 32.5 31.3 30.3 30.8 29.6 28.6 25.9 23.7
Race/Ethnicity
White, non-
Hispanic - - - 46.8 31.6 29.8 29.1 26.3 24.6 24.1 22.7 21.0 20.1 19.0 18.7 18.4 18.0 17.0 15.8 -
Black, non-
Hispanic - - - 117.4 96.0 97.9 95.0 89.0 89.4 86.8 82.7 78.1 74.4 72.6 71.5 72.5 68.8 68.2 63.6 -
Hispanic1 - - - 59.5 54.0 54.9 51.4 51.6 49.1 47.3 44.4 43.3 41.6 41.7 37.4 38.1 36.7 33.2 29.7 -
1 Includes all persons of Hispanic origin regardless of race.
2 Rates computed by dividing the number of abortions to females under age 15 years by the total number of females aged 10-14 years.
Sources: Race/ethnicity data for 2009 except for 15 to 19 year-olds: Curtin, S. C., Abma, J. C., Ventura, S. J., Henshaw, S. K. (2013). Pregnancy rates for U.S. women continue to drop. NCHS
Data Brief No. 136. Available at: http://www.cdc.gov/nchs/data/databriefs/db136.pdf. Data for 2010 and all other data for 2009: Kost, K. & Henshaw, S. (2014). U.S. teenage pregnancies, births
and abortions, 2010: National and state trends and trends by age, race and ethnicity. Available at: http://www.guttmacher.org/pubs/USTPtrends10.pdf .Data for 1990-2008: Ventura, S. J.,
Curtin, S.C. Abma, J. C., & Henshaw, S. K. (2012). Estimated pregnancy rates and rates of pregnancy outcomes for the United States, 1990-2008. National Vital Statistics Reports, 60 (7). All other
data: Kost, K., Henshaw, S. (2012). U.S. teenage pregnancies, births, and abortions, 2008: National trends by age, race, and ethnicity. Guttmacher Institute. Available at
http://www.guttmacher.org/pubs/USTPtrends08.pdf.