Embed Size (px)
Citation preview
ARTICLE IN PRESS
Energy Policy ] (]]]]) ]]]–]]]
Contents lists available at ScienceDirect
Energy Policy
0301-42
doi:10.1
� Corr
E-m
Melissa
Pleasimpl
journal homepage: www.elsevier.com/locate/enpol
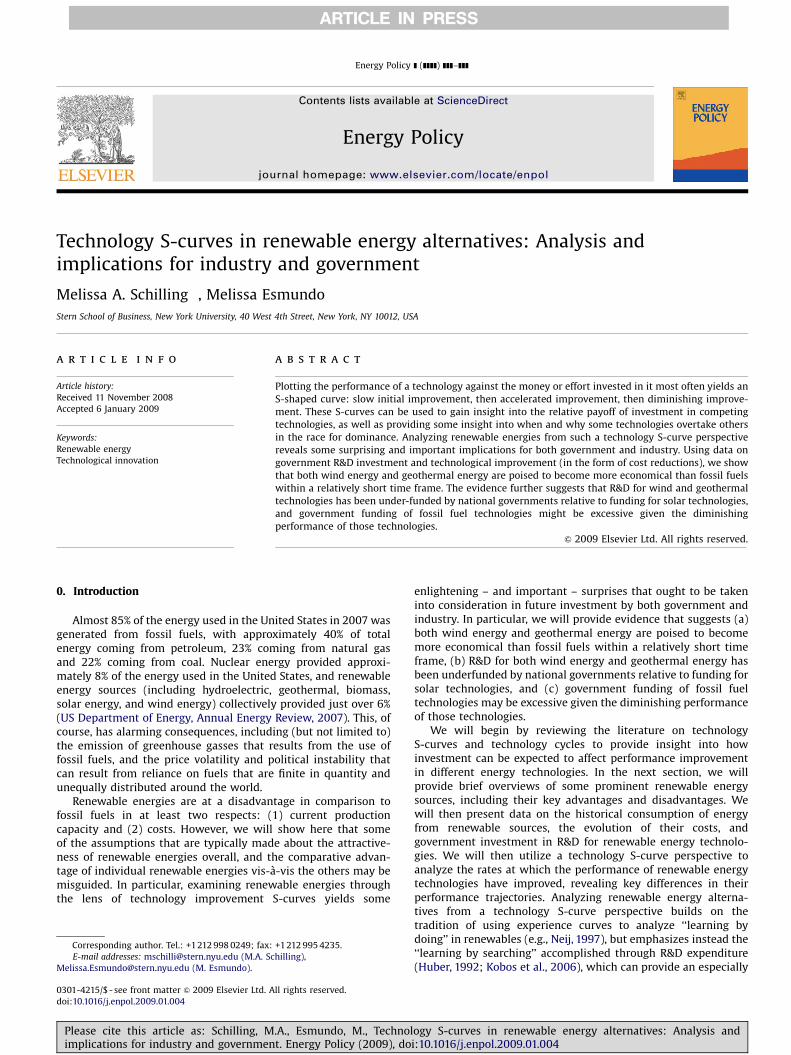
Technology S-curves in renewable energy alternatives: Analysis andimplications for industry and government
Melissa A. Schilling �, Melissa Esmundo
Stern School of Business, New York University, 40 West 4th Street, New York, NY 10012, USA
a r t i c l e i n f o
Article history:
Received 11 November 2008
Accepted 6 January 2009
Keywords:
Renewable energy
Technological innovation
15/$ - see front matter & 2009 Elsevier Ltd. A
016/j.enpol.2009.01.004
esponding author. Tel.: +1212 998 0249; fax:
ail addresses: [email protected] (M.A. Sc
[email protected] (M. Esmundo).
e cite this article as: Schilling, Mications for industry and governmen
a b s t r a c t
Plotting the performance of a technology against the money or effort invested in it most often yields an
S-shaped curve: slow initial improvement, then accelerated improvement, then diminishing improve-
ment. These S-curves can be used to gain insight into the relative payoff of investment in competing
technologies, as well as providing some insight into when and why some technologies overtake others
in the race for dominance. Analyzing renewable energies from such a technology S-curve perspective
reveals some surprising and important implications for both government and industry. Using data on
government R&D investment and technological improvement (in the form of cost reductions), we show
that both wind energy and geothermal energy are poised to become more economical than fossil fuels
within a relatively short time frame. The evidence further suggests that R&D for wind and geothermal
technologies has been under-funded by national governments relative to funding for solar technologies,
and government funding of fossil fuel technologies might be excessive given the diminishing
performance of those technologies.
& 2009 Elsevier Ltd. All rights reserved.
0. Introduction
Almost 85% of the energy used in the United States in 2007 wasgenerated from fossil fuels, with approximately 40% of totalenergy coming from petroleum, 23% coming from natural gasand 22% coming from coal. Nuclear energy provided approxi-mately 8% of the energy used in the United States, and renewableenergy sources (including hydroelectric, geothermal, biomass,solar energy, and wind energy) collectively provided just over 6%(US Department of Energy, Annual Energy Review, 2007). This, ofcourse, has alarming consequences, including (but not limited to)the emission of greenhouse gasses that results from the use offossil fuels, and the price volatility and political instability thatcan result from reliance on fuels that are finite in quantity andunequally distributed around the world.
Renewable energies are at a disadvantage in comparison tofossil fuels in at least two respects: (1) current productioncapacity and (2) costs. However, we will show here that someof the assumptions that are typically made about the attractive-ness of renewable energies overall, and the comparative advan-tage of individual renewable energies vis-a-vis the others may bemisguided. In particular, examining renewable energies throughthe lens of technology improvement S-curves yields some
ll rights reserved.
+1 212 995 4235.
hilling),
.A., Esmundo, M., Technolt. Energy Policy (2009), do
enlightening – and important – surprises that ought to be takeninto consideration in future investment by both government andindustry. In particular, we will provide evidence that suggests (a)both wind energy and geothermal energy are poised to becomemore economical than fossil fuels within a relatively short timeframe, (b) R&D for both wind energy and geothermal energy hasbeen underfunded by national governments relative to funding forsolar technologies, and (c) government funding of fossil fueltechnologies may be excessive given the diminishing performanceof those technologies.
We will begin by reviewing the literature on technologyS-curves and technology cycles to provide insight into howinvestment can be expected to affect performance improvementin different energy technologies. In the next section, we willprovide brief overviews of some prominent renewable energysources, including their key advantages and disadvantages. Wewill then present data on the historical consumption of energyfrom renewable sources, the evolution of their costs, andgovernment investment in R&D for renewable energy technolo-gies. We will then utilize a technology S-curve perspective toanalyze the rates at which the performance of renewable energytechnologies have improved, revealing key differences in theirperformance trajectories. Analyzing renewable energy alterna-tives from a technology S-curve perspective builds on thetradition of using experience curves to analyze ‘‘learning bydoing’’ in renewables (e.g., Neij, 1997), but emphasizes instead the‘‘learning by searching’’ accomplished through R&D expenditure(Huber, 1992; Kobos et al., 2006), which can provide an especially
ogy S-curves in renewable energy alternatives: Analysis andi:10.1016/j.enpol.2009.01.004
ARTICLE IN PRESS
Perf
orm
ance
Effort
Limit of Technology
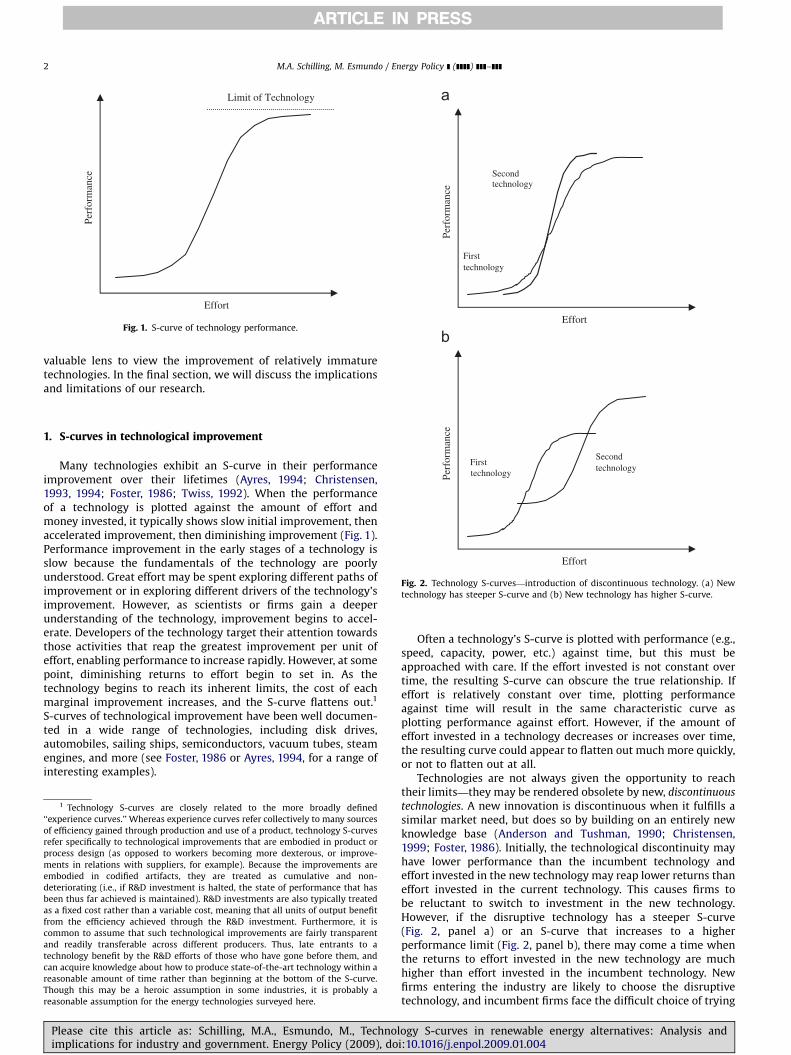
Fig. 1. S-curve of technology performance.Effort
Perf
orm
ance
Firsttechnology
Secondtechnology
M.A. Schilling, M. Esmundo / Energy Policy ] (]]]]) ]]]–]]]2
valuable lens to view the improvement of relatively immaturetechnologies. In the final section, we will discuss the implicationsand limitations of our research.
Perf
orm
ance
Effort
Secondtechnology
Firsttechnology
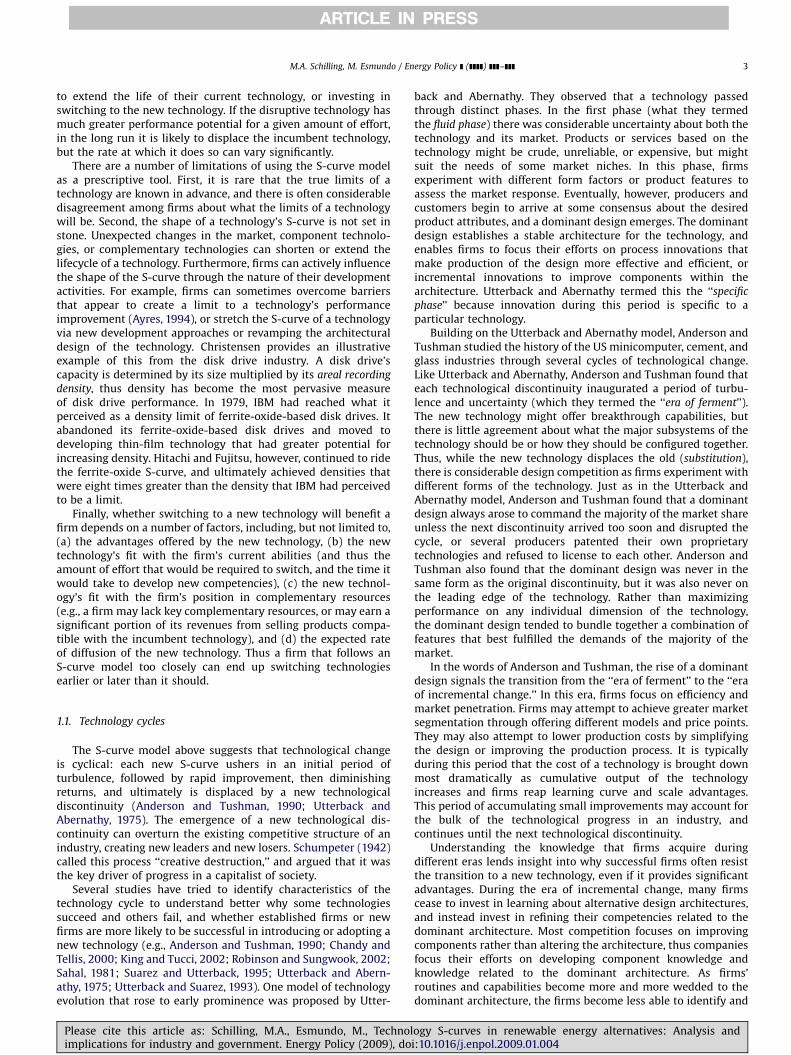
Fig. 2. Technology S-curves—introduction of discontinuous technology. (a) New
technology has steeper S-curve and (b) New technology has higher S-curve.
1. S-curves in technological improvement
Many technologies exhibit an S-curve in their performanceimprovement over their lifetimes (Ayres, 1994; Christensen,1993, 1994; Foster, 1986; Twiss, 1992). When the performanceof a technology is plotted against the amount of effort andmoney invested, it typically shows slow initial improvement, thenaccelerated improvement, then diminishing improvement (Fig. 1).Performance improvement in the early stages of a technology isslow because the fundamentals of the technology are poorlyunderstood. Great effort may be spent exploring different paths ofimprovement or in exploring different drivers of the technology’simprovement. However, as scientists or firms gain a deeperunderstanding of the technology, improvement begins to accel-erate. Developers of the technology target their attention towardsthose activities that reap the greatest improvement per unit ofeffort, enabling performance to increase rapidly. However, at somepoint, diminishing returns to effort begin to set in. As thetechnology begins to reach its inherent limits, the cost of eachmarginal improvement increases, and the S-curve flattens out.1
S-curves of technological improvement have been well documen-ted in a wide range of technologies, including disk drives,automobiles, sailing ships, semiconductors, vacuum tubes, steamengines, and more (see Foster, 1986 or Ayres, 1994, for a range ofinteresting examples).
1 Technology S-curves are closely related to the more broadly defined
‘‘experience curves.’’ Whereas experience curves refer collectively to many sources
of efficiency gained through production and use of a product, technology S-curves
refer specifically to technological improvements that are embodied in product or
process design (as opposed to workers becoming more dexterous, or improve-
ments in relations with suppliers, for example). Because the improvements are
embodied in codified artifacts, they are treated as cumulative and non-
deteriorating (i.e., if R&D investment is halted, the state of performance that has
been thus far achieved is maintained). R&D investments are also typically treated
as a fixed cost rather than a variable cost, meaning that all units of output benefit
from the efficiency achieved through the R&D investment. Furthermore, it is
common to assume that such technological improvements are fairly transparent
and readily transferable across different producers. Thus, late entrants to a
technology benefit by the R&D efforts of those who have gone before them, and
can acquire knowledge about how to produce state-of-the-art technology within a
reasonable amount of time rather than beginning at the bottom of the S-curve.
Though this may be a heroic assumption in some industries, it is probably a
reasonable assumption for the energy technologies surveyed here.
Please cite this article as: Schilling, M.A., Esmundo, M., Technolimplications for industry and government. Energy Policy (2009), do
Often a technology’s S-curve is plotted with performance (e.g.,speed, capacity, power, etc.) against time, but this must beapproached with care. If the effort invested is not constant overtime, the resulting S-curve can obscure the true relationship. Ifeffort is relatively constant over time, plotting performanceagainst time will result in the same characteristic curve asplotting performance against effort. However, if the amount ofeffort invested in a technology decreases or increases over time,the resulting curve could appear to flatten out much more quickly,or not to flatten out at all.
Technologies are not always given the opportunity to reachtheir limits—they may be rendered obsolete by new, discontinuous
technologies. A new innovation is discontinuous when it fulfills asimilar market need, but does so by building on an entirely newknowledge base (Anderson and Tushman, 1990; Christensen,1999; Foster, 1986). Initially, the technological discontinuity mayhave lower performance than the incumbent technology andeffort invested in the new technology may reap lower returns thaneffort invested in the current technology. This causes firms tobe reluctant to switch to investment in the new technology.However, if the disruptive technology has a steeper S-curve(Fig. 2, panel a) or an S-curve that increases to a higherperformance limit (Fig. 2, panel b), there may come a time whenthe returns to effort invested in the new technology are muchhigher than effort invested in the incumbent technology. Newfirms entering the industry are likely to choose the disruptivetechnology, and incumbent firms face the difficult choice of trying
ogy S-curves in renewable energy alternatives: Analysis andi:10.1016/j.enpol.2009.01.004
ARTICLE IN PRESS
M.A. Schilling, M. Esmundo / Energy Policy ] (]]]]) ]]]–]]] 3
to extend the life of their current technology, or investing inswitching to the new technology. If the disruptive technology hasmuch greater performance potential for a given amount of effort,in the long run it is likely to displace the incumbent technology,but the rate at which it does so can vary significantly.
There are a number of limitations of using the S-curve modelas a prescriptive tool. First, it is rare that the true limits of atechnology are known in advance, and there is often considerabledisagreement among firms about what the limits of a technologywill be. Second, the shape of a technology’s S-curve is not set instone. Unexpected changes in the market, component technolo-gies, or complementary technologies can shorten or extend thelifecycle of a technology. Furthermore, firms can actively influencethe shape of the S-curve through the nature of their developmentactivities. For example, firms can sometimes overcome barriersthat appear to create a limit to a technology’s performanceimprovement (Ayres, 1994), or stretch the S-curve of a technologyvia new development approaches or revamping the architecturaldesign of the technology. Christensen provides an illustrativeexample of this from the disk drive industry. A disk drive’scapacity is determined by its size multiplied by its areal recording
density, thus density has become the most pervasive measureof disk drive performance. In 1979, IBM had reached what itperceived as a density limit of ferrite-oxide-based disk drives. Itabandoned its ferrite-oxide-based disk drives and moved todeveloping thin-film technology that had greater potential forincreasing density. Hitachi and Fujitsu, however, continued to ridethe ferrite-oxide S-curve, and ultimately achieved densities thatwere eight times greater than the density that IBM had perceivedto be a limit.
Finally, whether switching to a new technology will benefit afirm depends on a number of factors, including, but not limited to,(a) the advantages offered by the new technology, (b) the newtechnology’s fit with the firm’s current abilities (and thus theamount of effort that would be required to switch, and the time itwould take to develop new competencies), (c) the new technol-ogy’s fit with the firm’s position in complementary resources(e.g., a firm may lack key complementary resources, or may earn asignificant portion of its revenues from selling products compa-tible with the incumbent technology), and (d) the expected rateof diffusion of the new technology. Thus a firm that follows anS-curve model too closely can end up switching technologiesearlier or later than it should.
1.1. Technology cycles
The S-curve model above suggests that technological changeis cyclical: each new S-curve ushers in an initial period ofturbulence, followed by rapid improvement, then diminishingreturns, and ultimately is displaced by a new technologicaldiscontinuity (Anderson and Tushman, 1990; Utterback andAbernathy, 1975). The emergence of a new technological dis-continuity can overturn the existing competitive structure of anindustry, creating new leaders and new losers. Schumpeter (1942)called this process ‘‘creative destruction,’’ and argued that it wasthe key driver of progress in a capitalist of society.
Several studies have tried to identify characteristics of thetechnology cycle to understand better why some technologiessucceed and others fail, and whether established firms or newfirms are more likely to be successful in introducing or adopting anew technology (e.g., Anderson and Tushman, 1990; Chandy andTellis, 2000; King and Tucci, 2002; Robinson and Sungwook, 2002;Sahal, 1981; Suarez and Utterback, 1995; Utterback and Abern-athy, 1975; Utterback and Suarez, 1993). One model of technologyevolution that rose to early prominence was proposed by Utter-
Please cite this article as: Schilling, M.A., Esmundo, M., Technolimplications for industry and government. Energy Policy (2009), do
back and Abernathy. They observed that a technology passedthrough distinct phases. In the first phase (what they termedthe fluid phase) there was considerable uncertainty about both thetechnology and its market. Products or services based on thetechnology might be crude, unreliable, or expensive, but mightsuit the needs of some market niches. In this phase, firmsexperiment with different form factors or product features toassess the market response. Eventually, however, producers andcustomers begin to arrive at some consensus about the desiredproduct attributes, and a dominant design emerges. The dominantdesign establishes a stable architecture for the technology, andenables firms to focus their efforts on process innovations thatmake production of the design more effective and efficient, orincremental innovations to improve components within thearchitecture. Utterback and Abernathy termed this the ‘‘specific
phase’’ because innovation during this period is specific to aparticular technology.
Building on the Utterback and Abernathy model, Anderson andTushman studied the history of the US minicomputer, cement, andglass industries through several cycles of technological change.Like Utterback and Abernathy, Anderson and Tushman found thateach technological discontinuity inaugurated a period of turbu-lence and uncertainty (which they termed the ‘‘era of ferment’’).The new technology might offer breakthrough capabilities, butthere is little agreement about what the major subsystems of thetechnology should be or how they should be configured together.Thus, while the new technology displaces the old (substitution),there is considerable design competition as firms experiment withdifferent forms of the technology. Just as in the Utterback andAbernathy model, Anderson and Tushman found that a dominantdesign always arose to command the majority of the market shareunless the next discontinuity arrived too soon and disrupted thecycle, or several producers patented their own proprietarytechnologies and refused to license to each other. Anderson andTushman also found that the dominant design was never in thesame form as the original discontinuity, but it was also never onthe leading edge of the technology. Rather than maximizingperformance on any individual dimension of the technology,the dominant design tended to bundle together a combination offeatures that best fulfilled the demands of the majority of themarket.
In the words of Anderson and Tushman, the rise of a dominantdesign signals the transition from the ‘‘era of ferment’’ to the ‘‘eraof incremental change.’’ In this era, firms focus on efficiency andmarket penetration. Firms may attempt to achieve greater marketsegmentation through offering different models and price points.They may also attempt to lower production costs by simplifyingthe design or improving the production process. It is typicallyduring this period that the cost of a technology is brought downmost dramatically as cumulative output of the technologyincreases and firms reap learning curve and scale advantages.This period of accumulating small improvements may account forthe bulk of the technological progress in an industry, andcontinues until the next technological discontinuity.
Understanding the knowledge that firms acquire duringdifferent eras lends insight into why successful firms often resistthe transition to a new technology, even if it provides significantadvantages. During the era of incremental change, many firmscease to invest in learning about alternative design architectures,and instead invest in refining their competencies related to thedominant architecture. Most competition focuses on improvingcomponents rather than altering the architecture, thus companiesfocus their efforts on developing component knowledge andknowledge related to the dominant architecture. As firms’routines and capabilities become more and more wedded to thedominant architecture, the firms become less able to identify and
ogy S-curves in renewable energy alternatives: Analysis andi:10.1016/j.enpol.2009.01.004
ARTICLE IN PRESS
M.A. Schilling, M. Esmundo / Energy Policy ] (]]]]) ]]]–]]]4
respond to a major architectural innovation (Henderson and Clark,1990; Leonard-Barton, 1992). For example, the firm may establishdivisions devoted to the primary components of the architecture,and structure the communication channels between divisions onthe way those components interact. In the firm’s effort to absorband process the vast amount of information available to it, it islikely to establish filters that enable it to identify the informationmost crucial to its understanding of the existing technologydesign (Henderson and Clark, 1990; Linton and Walsh, 2004).As the firm’s expertise, structure, communication channels andfilters all become oriented to maximization of its ability tocompete in the existing dominant design, they become barriers torecognition and reaction to a new technological architecture.
Application of these concepts to energy technology is fairlystraightforward. In the United States the vast majority of energyproduction is based on the use of fossil fuels (e.g., oil, coal). Themethods of producing energy from these fuels are well estab-lished, and there are many firms whose fortunes are tied toefficient fossil fuel production and/or utilization. On the otherhand, technologies that produce energy from renewable resources(e.g., solar, wind, geothermal, hydrogen) are still in the ‘‘fluidphase,’’ or ‘‘era of ferment.’’ It is unclear whether or when any one(or combination) of these technologies will rise to become a newdominant design. As a result, there is relatively little investment inrenewable energy technologies compared to fossil fuel energytechnologies, and that investment is fragmented among severalcontending alternatives (Jacobsson and Johnson, 2000). Nationalgovernments regularly contribute some funding to developmentof alternative energies, and organizations such as Royal DutchShell, General Electric, and Ballard Power are all experimentingwith various forms of solar photo cell technologies, wind turbinetechnologies, and fuel cells. However, the dollar figures of theseefforts pale in comparison to the industry funds that are currentlybeing invested to extend the life of fossil fuels. Furthermore, all ofthe prominent renewable energy alternatives are currently moreexpensive than fossil fuels, slowing both consumer and industrialdemand for these energy technologies despite their environmen-tal benefits. However, as we will show, from a technology S-curveperspective, most of the prominent renewable energy alternativesare yielding much greater gains in performance improvement perR&D dollar spent when compared to performance improvementsin fossil fuel technologies. Furthermore, S-curve analysis suggeststhat some of the renewable energy technologies that are bestpositioned to eclipse fossil fuel technologies in cost efficiency inthe near term have been relatively underfunded compared toother renewable energy technologies, yielding implications forboth government and industrial policy for rethinking renewableenergy investment. We turn now to profiling some of the morenoteworthy renewable energy technologies, offering some limitedinsight into their key advantages and disadvantages, and thenanalyzing their S-curves of technology improvement with respectto R&D investment.
2. Prominent renewable energy alternatives
In this section, we will provide a brief introduction to fiveprominent renewable energy alternatives (hydroelectric power,geothermal power, solar power, wind power, and biomass energy),focusing on (a) the key fundamentals of how they work, (b) theircurrent production capacities,2 and (c) their key advantages anddisadvantages. We will then discuss transmission, intermittencyand fuel-cost issues that pertain to several of the technologies
2 For ease of comparison, we will focus on electricity production capacity in
kilowatts.
Please cite this article as: Schilling, M.A., Esmundo, M., Technolimplications for industry and government. Energy Policy (2009), do
and, finally, provide a summary comparison of costs in cents perkWh over the time period 1980–2005.
2.1. Hydroelectric power
Hydroelectric power refers to the energy that can be capturedfrom flowing water. Most typically this energy is captured usingdams on major rivers, but it can also be captured from water leveldifferentials created by tides, or from the flow of water in the formof waves. In terms of total electricity production, hydroelectricpower is the leading renewable energy resource in the UnitedStates, providing 10% of the electricity used, and accounting forjust under 3% of total energy used in 2005. Hydroelectric power iseven more important in particular regions such as the RockyMountain states (where it accounted for 14% of the electricityused in 2006) and the Pacific coast (where it accounted for 63% ofthe electricity used in 2006). Worldwide, hydroelectric powerprovided one-fifth of the total electricity used, making it secondonly to fossil fuels as a source of energy (ORNL, 2006).
Hydroelectric power’s key advantages are that it is clean(it releases no air emissions nor does it produce solid or liquidwastes), and it is one of the least-expensive sources of electricityin the United States. In 2006, a hydroelectric power plant requiredonly 0.6 cents per kWh to finance its operation and maintenance;by comparison the costs at nuclear and coal plants equaled 2.2and 2.1 cents per kWh respectively. The downside of hydroelectricpower plants is that they are often physically disruptive to thelocal environment as dams replace river ecosystems by lakes,altering or destroying habitats and disrupting fish migrations.Hydroelectric dams are primarily responsible, for example, forreducing the Pacific Northwest salmon population from about16 million to 300,000 by blocking the upstream migration ofspawning fish and by killing young fish that must pass throughturbines as they travel downstream (ORNL, 2006). Hydroelectricdams also affect the water quality of both downstream andupstream waterways through such mechanisms such as increasedsoil erosion, supersaturation of water with gases from the air, andwater stratification which deprives deep water (and the fish thatlive in it) of oxygen (ORNL, 2006). As a result, hydroelectric powerdams have come under heavy fire from environmental protectiongroups for their direct and deleterious impact on a number ofaquatic species.
2.2. Geothermal power
Geothermal energy is heat captured from the earth. Most of thegeothermal energy used as of 2006 came from hydrothermalsources (i.e., hot water or steam sources). However, there ispotential in the long run to also utilize the geothermal energyavailable in the heat of hot, dry rock formations deeper within theEarth’s crust. The amount of geothermal energy is enormous;scientists estimate that United States hot dry rock resources couldsupply all of the United States primary energy needs for at least30,000 years (EERE, 2007a). However, the technology for tappinggeothermal energy is still at a relatively early state of develop-ment, and has drastically limited the amount of geothermalenergy that is commercially available. According to the Geother-mal Energy Association, the United States installed capacityof geothermal energy was approximately 2800 MW electric in2006, putting it at just under 3% of the production capacity ofhydroelectric power, and under 0.3% of total electricity productioncapacity in the United States. Regionally, however, geothermalpower is much more important, accounting for approximately 6%of the energy produced in California, 10% for northern Nevada, and25% for the Island of Hawaii.
ogy S-curves in renewable energy alternatives: Analysis andi:10.1016/j.enpol.2009.01.004
ARTICLE IN PRESS
M.A. Schilling, M. Esmundo / Energy Policy ] (]]]]) ]]]–]]] 5
Geothermal’s key advantages are that there is a large amountof potentially tappable energy, it is mostly clean (steam plantsrelease small amounts of carbon and other emissions into theatmosphere with electricity production; binary plants that utilizelower temperature water release no emissions), and it is reason-ably inexpensive. Estimates by the Energy Efficiency and Renew-able Energy division of the US Department of Energy put the costof electricity production costs for geothermal steam plants at fourto 6 cents per kWh in 2006, and 5 to 8 cents per kWh for binaryplants. Estimates by the National Renewables Energy Laboratorythat use a composite measure of flash steam and binary plantgeothermal energy production posit an even lower cost, rangingfrom 3.1 to 4.3 cents per kWh in 2005. Either set of estimatessuggests that geothermal energy is more expensive than fossilfuels or hydroelectric power, but less expensive than wind, solarpower, or biomass. Geothermal’s key disadvantage is that giventhe state of technology, it is currently very geographicallyconstrained with only limited areas enabling cost-efficient useof geothermal energy. There is also some risk of releasing sulfur orother hazardous gases into the air.
2.3. Solar power
Solar power is divided into two main technologies: thermalsolar (whereby the heat of the sun is captured either passively orthrough concentrating mechanisms such as curved mirrors), andphotovoltaic (also called solar cells), which convert sunlight(photons) directly into electricity via semiconductive materials.Solar power has very large potential capacity (estimates suggestthat the solar energy resources in a 100 square mile area ofNevada could supply the United States with all of its electricity –about 800 GW – using modestly efficient commercial photovoltaicmodules) (DOE–EERE, 2008). However, its commercial capacityis currently very limited. According to the US Department ofEnergy’s Renewable Energy Annual Report, in 2006, the electricitygeneration capacity of solar sources in the United States was just411 MW, or .04% of the total electricity production capacity of theUnited States.
Solar power’s key advantages are that it is clean (it results inno emissions and does not require physical disruption of theenvironment), and it has a large potential capacity. Its keydisadvantage is its cost, which also greatly limits commerciallyavailable capacity. The National Renewable Energy Laboratoryestimates put the cost of solar energy in 2005 at between 11 and15 cents per kWh for concentrating solar and 18–31 cents perkWh for photovoltaic solar. A big part of the cost of photovoltaicsstems from the relatively low efficiency of current photovoltaictechnology and the high materials costs for producing photo-voltaic cells.
2.4. Wind power
Wind power is typically captured through the use of turbines.The total wind energy resource in the United States is very large,with nearly 88 quadrillion BTU (roughly the amount of fossil fuelenergy used yearly in the United States) available from sites withaverage wind speeds over 5.6 m/s at a 10 m height (EERE, 2007b).Though wind is available virtually anywhere, power availablefrom wind increases as the cube of wind speed, making high windareas much more attractive for energy production. As with manyof the renewable energy technologies, commercial capacity isa very small fraction of the potential resource. In 2005, UnitedStates electricity production capacity from wind was over8000 MW, putting it at just under 1% of total US electricityproduction capacity (DOE, Annual Energy Review, 2007). Wind
Please cite this article as: Schilling, M.A., Esmundo, M., Technolimplications for industry and government. Energy Policy (2009), do
energy production is rapidly growing, however, and estimates bythe National Renewable Energy Laboratory for 2006 suggest thatelectricity production capacity was over 10,000 MW, enough topower 2.5 million average American homes.
The key advantages of wind energy are that it is clean (itproduces no emissions and physical disruption of the environ-ment can be minimized), it is reasonably inexpensive, andtechnological advance is yielding rapid efficiency gains, causingits price to fall quickly. Estimates by the National RenewableEnergy Laboratory put wind at between 4.3 and 5.5 cents per kWhin 2005, roughly one-tenth its price in 1980, and slightly moreexpensive than geothermal energy. The key disadvantage of windenergy is that wind farms are often considered unsightly, andcan pose a potential threat to migratory birds. Other oftencited disadvantages are wind’s intermittency, and that the mostattractive wind sites in terms of production capacity are often notnear urban areas, requiring investment in transmission lines.Transmission and intermittency issues are discussed in greaterdetail later in the section.
2.5. Biomass energy
Biomass energy is derived from material produced by livingthings such as plants, animal waste, or bacteria. Plant material(e.g., wood) is often burned; animal waste can provide gases thatare burned to release energy; some plant materials are fermentedto produce alcohol. One of these alcohols, ethanol, is widely usedin blends with gasoline to reduce auto emissions and decreasefossil fuel consumption. In terms of installed US electricityproduction capacity, biomass accounted for approximately10 GW in 2006, just over 1% of total US electricity productioncapacity. Including ethanol in these figures (which is not typicallyused to generate electricity but serves as a direct liquid fuel sourcefor automobiles) raises biomass’ contribution to roughly 3% oftotal energy consumption (EERE, 2007c, d).
The key advantages of biomass are that it provides a renewablealternative for liquid transportation fuels, the technologies arerelatively simple and available, and biomass faces few geographicconstraints. The key disadvantages of biomass are that its usereleases greenhouse gasses into the atmosphere, it is landintensive, and the agricultural production of many biomasssources results in increased use of water, fertilizers, herbicides,and insecticides. Furthermore, the amount of land required toproduce biomass inputs implies that it faces significant long-termproduction capacity constraints. Analysis by the National Renew-able Energy Laboratory puts the cost of biomass energy atbetween 6.6 and 8.0 cents per kWh, depending on the technologyused. This makes biomass energy more expensive than hydro-electric, geothermal, and wind energy.
2.6. Transmission issues, intermittency, and fuel costs
One commonly voiced obstacle to some of the renewablealternatives (particularly wind) is the current lack of transmissioncapacity to move energy from high potential sites (such as theDakotas) to population centers. Building transmission lines is verycostly, and because many power producers usually share majortransmission lines, there is a classic public goods problem:no individual company wants to pay. However, studies by theNational Renewable Energy Laboratory suggest that transmissionobstacles are often overstated. First, both wind and solar powerare well-suited to a distributed energy model (e.g., solar panels onhomes, wind turbines in farmers’ fields) that enables power tobe transmitted to the grid via existing transmission lines. NRELstudies indicate that the wind energy resources that are located
ogy S-curves in renewable energy alternatives: Analysis andi:10.1016/j.enpol.2009.01.004

ARTICLE IN PRESS
M.A. Schilling, M. Esmundo / Energy Policy ] (]]]]) ]]]–]]]6
within a short distance (e.g., 10 miles) of existing transmissionlines are substantial. Second, the transmission capacity problemis often a function more of historic methods of evaluating andallocating the power capability of lines rather than the actualcapability; changes in evaluation and allocation rules are expectedto allow power-generation expansion without requiring additionalwires (DeMeo and Parsons, 2003). Third, while it is often assumedthat large, utility-grade wind turbines cannot be installed onthe distribution grid without expensive upgrades, case studiesindicate that in many cases wind generation can be connected tothe distribution system in amounts up to about the rating of thenearest substation transformer without upgrading. For example,in a study to determine the feasibility of interconnecting largewind turbines to a typical distribution system in northeasternColorado, analysts determined that up to 94.5 MW (63 GE 1.5 MWwind turbines) could be added to the 17 existing substationdistribution grids that makeup the Highline Electric Associationgrid without upgrading the substations, and without causingquality or safety problems (DOE–EERE, 2005).
There are some losses of economies of scale from a highlydistributed model. For example, according to the (American WindEnergy Association), a large wind farm (e.g., 51 MW) can deliverelectricity at a lower cost, roughly $0.036 per kWh, compared to$0.059 per kWh for a small (e.g., 3 MW) wind farm. Often,however, the bigger obstacle is the monopoly granted to a regionalenergy wholesaler, restricting the use of locally generatedelectricity. This problem is already being addressed graduallythrough regulatory reform.
Table 1Cost of energy (COE) for alternative energy sources, expressed in cents per kWh.
Year Renewablesa
Geothermal Concentrating solar Photovoltaics Wi
Upper Lower Upper Lower Upper Lower Upp
1980 13.8 11.3 84.0 69.5 125.0 106.3 51.
1981 13.1 10.6 74.0 57.0 119.0 100.0 47.
1982 12.5 10.0 66.0 46.8 112.5 93.0 43.
1983 11.9 9.4 56.0 38.3 105.0 84.5 38.
1984 11.3 8.8 46.8 27.5 99.0 78.0 36.
1985 10.6 8.1 36.0 24.0 93.0 72.0 31.
1986 10.0 7.5 30.3 21.3 87.5 68.8 28.
1987 9.7 7.2 27.0 19.0 82.0 63.0 25.
1988 9.4 6.9 25.0 17.0 77.0 59.5 22.
1989 8.8 6.3 23.5 16.0 72.0 55.5 20.
1990 8.4 6.3 22.0 15.0 68.8 52.0 17.
1991 8.1 5.9 21.5 14.0 66.0 49.0 15.
1992 7.5 5.6 21.3 14.0 62.5 45.0 13.
1993 6.6 5.3 21.0 13.8 59.0 43.3 12.
1994 6.4 5.1 20.8 13.5 56.3 40.5 11.
1995 6.3 4.9 20.0 13.3 53.0 37.5 9.
1996 6.2 4.8 19.3 13.0 51.0 34.0 8.
1997 5.9 4.4 18.5 12.9 48.0 31.3 8.
1998 5.6 4.0 18.0 12.8 46.0 29.0 7.
1999 5.3 3.8 17.5 12.8 43.8 27.0 7.
2000 5.1 3.8 17.3 12.8 42.5 26.0 7.
2001 5.0 3.7 17.1 12.8 40.5 24.0 6.
2002 4.9 3.6 17.0 12.7 38.0 23.0 6.
2003 4.7 3.4 16.7 12.7 36.0 21.0 6.
2004 4.4 3.2 16.0 12.0 33.0 20.0 6.
2005 4.3 3.1 15.0 11.0 31.0 18.8 5.
a Cost estimates constructed by the National Renewables Energy Laboratory based
Energy, EPRI, PERI; GPRA 2003; and OPT Data book. Costs include capital, operating and
costs due to facility types and scale.b From the Energy Information Agency’s Electric Power Annual, in constant $2005
included for calculating costs for fossil fuel plants as the average plant age is roughlyc Derived by multiplying the price per BTU of each fossil fuel by the total BTU conte
fossil fuel production by the accumulated BTU content of total fossil fuel production, a
Please cite this article as: Schilling, M.A., Esmundo, M., Technolimplications for industry and government. Energy Policy (2009), do
There are also challenges associated with management of theelectricity load from intermittent resources like wind and solar, tomeet fluctuating energy demands. Whereas energy from fossilfuels, biomass, hydropower and geothermal can be turned on andoff, wind and solar energy are reliant upon environmentalconditions. However, it is important to note that utility operatorsalso cannot control electricity demand, and thus utilities arealready designed to accommodate fluctuating loads throughdistributed capacity. Wind and solar increase the amount ofvariability that must be accommodated by the utility system, butNREL estimates suggest that the incremental costs of accommo-dating this variability are relatively small. Energy producers inCalifornia have found that wind and solar power are verycomplementary because peak solar production is during themiddle of the day, and peak wind production is in the morningand evening.
Finally, a key advantage commonly overlooked with respectto energy alternatives such as wind, solar, and geothermalpower is that there are no fuel costs, now or in the future,which removes one major component of price instability(though it is important to note that there will still be pricerisk related to the cost of construction materials such assteel, silicon, etc.). US utility companies traditionally havenot worried much about long- or short-term price risk becausemost are regulated monopolies and can pass their costson to consumers. However, as utilities are become increasinglyderegulated, price stability will become a crucial competitivedimension.
Fossil fuelsb
nd Coal Natural gas Petroleum Fossil fuel compositec
er Lower
3 43.0
5 40.0
3 36.3
8 32.5
0 29.0
3 25.3
8 22.5
3 18.8
5 16.8
0 14.8
6 12.5 1.6 2.1 2.6 1.7
0 11.3 1.5 1.9 2.1 1.6
8 10.0 1.5 1.9 2.0 1.5
0 8.8 1.4 2.0 1.9 1.5
3 7.6 1.3 1.7 1.8 1.4
8 6.9 1.3 1.6 1.8 1.3
8 6.3 1.2 1.8 1.9 1.3
4 5.9 1.1 1.8 1.7 1.2
8 5.3 1.1 1.5 1.4 1.2
5 5.0 1.1 1.6 1.5 1.1
3 4.9 1.0 2.3 2.2 1.3
7 4.7 1.1 2.3 2.0 1.2
4 4.6 1.1 1.9 1.8 1.1
3 4.5 1.0 2.6 2.2 1.4
0 4.4 1.1 2.8 2.2 1.5
5 4.3 1.2 3.5 2.9 1.8
on data compiled from multiple sources including National Labs, Department of
maintenance costs. Values in constant $2005. Upper and lower values differences in
. Costs include fuel, operations, and maintenance. Capital costs are not typically
40 years. Data were unavailable prior to 1990.
nt of the production of each fossil fuel and dividing this accumulated value of total
nd then converting to cents per kWh.
ogy S-curves in renewable energy alternatives: Analysis andi:10.1016/j.enpol.2009.01.004

ARTICLE IN PRESS
M.A. Schilling, M. Esmundo / Energy Policy ] (]]]]) ]]]–]]] 7
2.7. Summary of comparison of costs
Table 1 shows a comparison of cost estimates for the variousrenewable energy alternatives (with the exception of hydro-electric power and biomass energy, for which yearly cost datawere unavailable) and the most important fossil fuel energysources, as well as a fossil fuel composite price created by the USDepartment of Energy based on proportional use of each. Forcomparability, all values have been converted to cents per kWh.As shown, fossil fuels are still less expensive on average thanrenewable energies, but wind power and geothermal power aregetting close to fossil fuel prices, particularly since wind andgeothermal are still on sharply decreasing cost trajectorieswhereas fossil fuels are now increasing in price due to thecombination of having exhausted nearly all of the options fortechnological improvement and encountering the diseconomies of
0
20,000,000
40,000,000
60,000,000
80,000,000
100,000,000
120,000,000
1949
1952
1955
1958
1961
1964
1967
1970
197
Bill
ions
BTU
s
Fossil Fuels
Nuclear Electric Power
Renewable EnergyElectricity Imports
Total
Fig. 3. US Energy Consumptio
1949
0
500,000
1,000,000
1,500,000
2,000,000
2,500,000
3,000,000
3,500,000
4,000,000
1951
1953
1955
1957
1959
1961
1963
1965
1967
1969
1971
1973
Bill
ions
BTU
HydroelectricBiomassGeothermalSolarWind
Fig. 4. US Renewable Energy Consu
Please cite this article as: Schilling, M.A., Esmundo, M., Technolimplications for industry and government. Energy Policy (2009), do
scale inherent in reliance upon finite inventories of naturalresources.
In the next section, we show that evaluation of thesetechnologies using a technology-improvement S-curve approachthat incorporates the rate of investment in the technologiesproves even more illuminating about the future of thesetechnologies.
3. R&D investment and cost improvement in energytechnologies
US energy consumption grew by 312% from 1949 to 2005, andthe vast majority of that energy was supplied by fossil fuels (seeFig. 3). Of the energy provided by fossil fuels, roughly 27% camefrom coal, 26% from natural gas, and 47% from petroleum. Over
319
7619
7919
8219
8519
8819
9119
9419
9720
0020
03
n by Source, 1949–2005.
1975
1977
1979
1981
1983
1985
1987
1989
1991
1993
1995
1997
1999
2001
2003
2005
P
mption (detailed), 1949–2005.
ogy S-curves in renewable energy alternatives: Analysis andi:10.1016/j.enpol.2009.01.004
ARTICLE IN PRESS
0.00
0.50
1.00
1.50
2.00
2.50
3.00
3.50
4.00
4.50
5.00
1949
1952
1955
1958
1961
1964
1967
1970
1973
1976
1979
1982
1985
1988
1991
1994
1997
2000
2003
Con
stan
t $20
05
CoalNatural GasCrude Oil
Fossil Fuel Composite
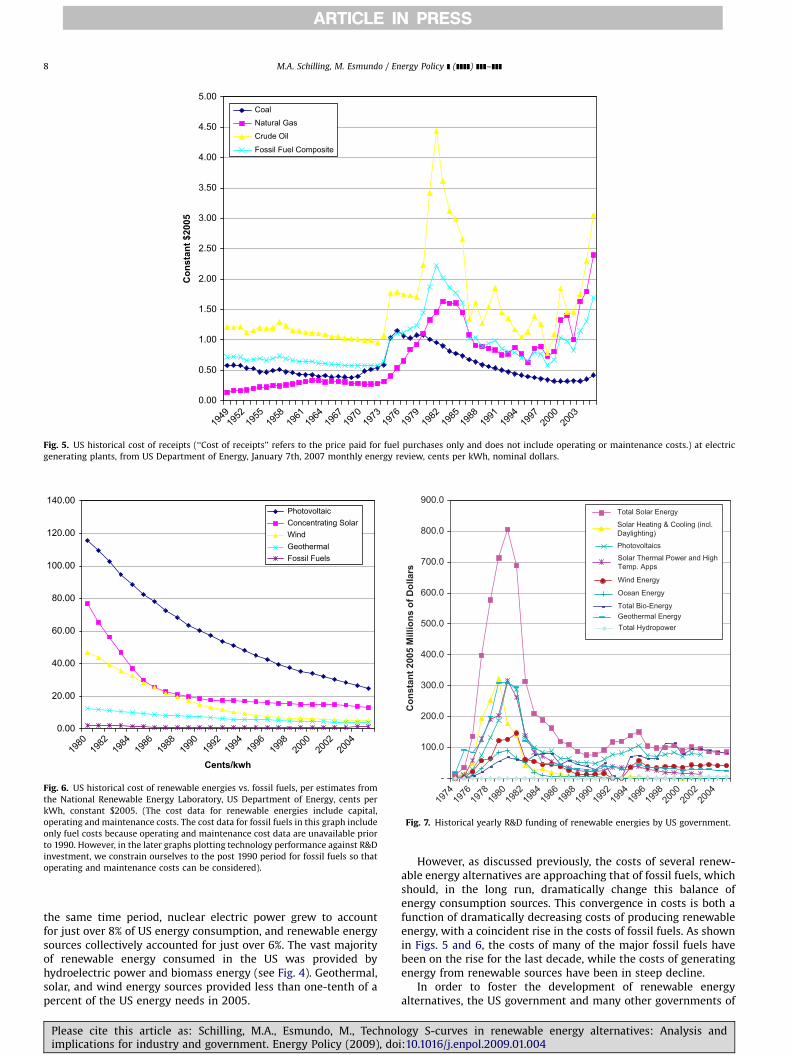
Fig. 5. US historical cost of receipts (‘‘Cost of receipts’’ refers to the price paid for fuel purchases only and does not include operating or maintenance costs.) at electric
generating plants, from US Department of Energy, January 7th, 2007 monthly energy review, cents per kWh, nominal dollars.
1980
0.00
20.00
40.00
60.00
80.00
100.00
120.00
140.00
1982
1984
1986
1988
1990
1992
1994
1996
1998
2000
2002
2004
Cents/kwh
PhotovoltaicConcentrating SolarWindGeothermalFossil Fuels
Fig. 6. US historical cost of renewable energies vs. fossil fuels, per estimates from
the National Renewable Energy Laboratory, US Department of Energy, cents per
kWh, constant $2005. (The cost data for renewable energies include capital,
operating and maintenance costs. The cost data for fossil fuels in this graph include
only fuel costs because operating and maintenance cost data are unavailable prior
to 1990. However, in the later graphs plotting technology performance against R&D
investment, we constrain ourselves to the post 1990 period for fossil fuels so that
operating and maintenance costs can be considered).
-
100.0
200.0
300.0
400.0
500.0
600.0
700.0
800.0
900.0
1974
1976
1978
1980
1982
1984
1986
1988
1990
1992
1994
1996
1998
2000
2002
2004
Con
stan
t 200
5 M
illio
ns o
f Dol
lars
Total Solar Energy
Solar Heating & Cooling (incl.Daylighting)
Photovoltaics
Solar Thermal Power and HighTemp. Apps
Wind Energy
Ocean Energy
Total Bio-EnergyGeothermal EnergyTotal Hydropower
Fig. 7. Historical yearly R&D funding of renewable energies by US government.
M.A. Schilling, M. Esmundo / Energy Policy ] (]]]]) ]]]–]]]8
the same time period, nuclear electric power grew to accountfor just over 8% of US energy consumption, and renewable energysources collectively accounted for just over 6%. The vast majorityof renewable energy consumed in the US was provided byhydroelectric power and biomass energy (see Fig. 4). Geothermal,solar, and wind energy sources provided less than one-tenth of apercent of the US energy needs in 2005.
Please cite this article as: Schilling, M.A., Esmundo, M., Technolimplications for industry and government. Energy Policy (2009), do
However, as discussed previously, the costs of several renew-able energy alternatives are approaching that of fossil fuels, whichshould, in the long run, dramatically change this balance ofenergy consumption sources. This convergence in costs is both afunction of dramatically decreasing costs of producing renewableenergy, with a coincident rise in the costs of fossil fuels. As shownin Figs. 5 and 6, the costs of many of the major fossil fuels havebeen on the rise for the last decade, while the costs of generatingenergy from renewable sources have been in steep decline.
In order to foster the development of renewable energyalternatives, the US government and many other governments of
ogy S-curves in renewable energy alternatives: Analysis andi:10.1016/j.enpol.2009.01.004
ARTICLE IN PRESS
1974
-
1,000.0
2,000.0
3,000.0
4,000.0
5,000.0
6,000.0
7,000.0
1976
1978
1980
1982
1984
1986
1988
1990
1992
1994
1996
1998
2000
2002
2004
Cum
ulat
ive
Spen
d, C
onst
ant 2
005
$ m
illio
ns
Total Solar Energy
Solar Heating & Cooling (incl. Daylighting)
Photovoltaics
Solar Thermal Power and High Temp. Apps
Wind Energy
Ocean Energy
Total Bio-Energy
Geothermal Energy
Total Hydropower
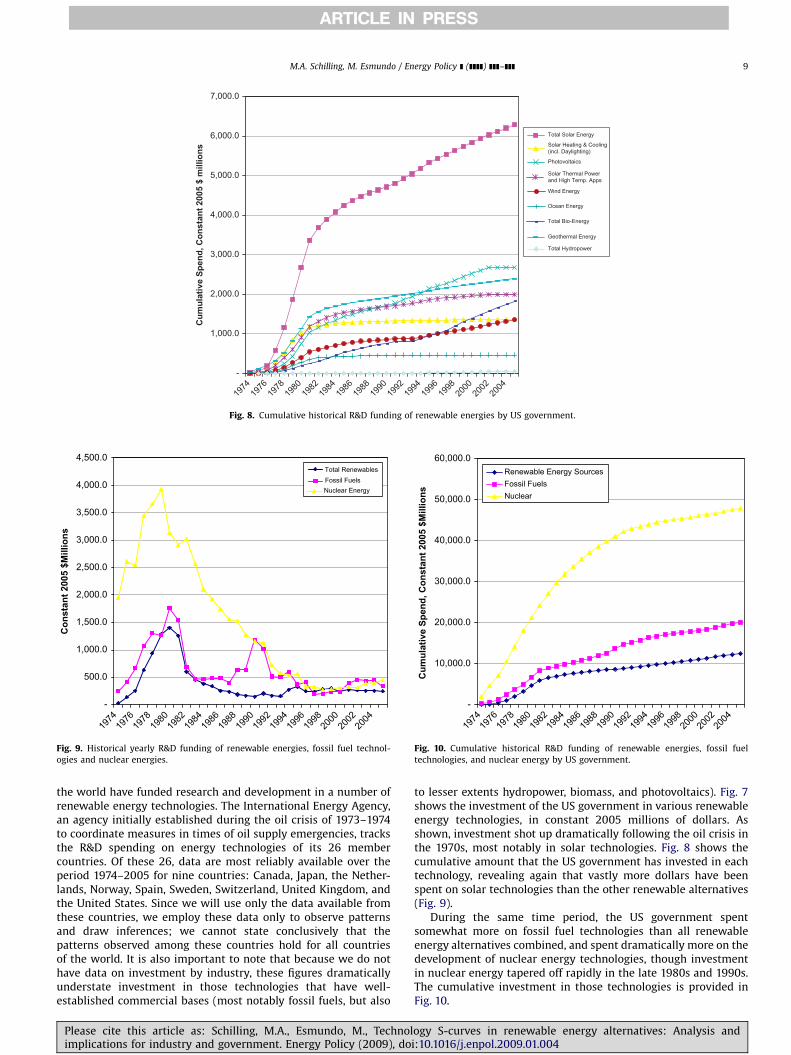
Fig. 8. Cumulative historical R&D funding of renewable energies by US government.
-
500.0
1,000.0
1,500.0
2,000.0
2,500.0
3,000.0
3,500.0
4,000.0
4,500.0
1974
1976
1978
1980
1982
1984
1986
1988
1990
1992
1994
1996
1998
2000
2002
2004
Con
stan
t 200
5 $M
illio
ns
Total RenewablesFossil FuelsNuclear Energy
Fig. 9. Historical yearly R&D funding of renewable energies, fossil fuel technol-
ogies and nuclear energies.
1974
-
10,000.0
20,000.0
30,000.0
40,000.0
50,000.0
60,000.0
1976
1978
1980
1982
1984
1986
1988
1990
1992
1994
1996
1998
2000
2002
2004
Cum
ulat
ive
Spen
d, C
onst
ant 2
005
$Mill
ions
Renewable Energy SourcesFossil FuelsNuclear
Fig. 10. Cumulative historical R&D funding of renewable energies, fossil fuel
technologies, and nuclear energy by US government.
M.A. Schilling, M. Esmundo / Energy Policy ] (]]]]) ]]]–]]] 9
the world have funded research and development in a number ofrenewable energy technologies. The International Energy Agency,an agency initially established during the oil crisis of 1973–1974to coordinate measures in times of oil supply emergencies, tracksthe R&D spending on energy technologies of its 26 membercountries. Of these 26, data are most reliably available over theperiod 1974–2005 for nine countries: Canada, Japan, the Nether-lands, Norway, Spain, Sweden, Switzerland, United Kingdom, andthe United States. Since we will use only the data available fromthese countries, we employ these data only to observe patternsand draw inferences; we cannot state conclusively that thepatterns observed among these countries hold for all countriesof the world. It is also important to note that because we do nothave data on investment by industry, these figures dramaticallyunderstate investment in those technologies that have well-established commercial bases (most notably fossil fuels, but also
Please cite this article as: Schilling, M.A., Esmundo, M., Technolimplications for industry and government. Energy Policy (2009), do
to lesser extents hydropower, biomass, and photovoltaics). Fig. 7shows the investment of the US government in various renewableenergy technologies, in constant 2005 millions of dollars. Asshown, investment shot up dramatically following the oil crisis inthe 1970s, most notably in solar technologies. Fig. 8 shows thecumulative amount that the US government has invested in eachtechnology, revealing again that vastly more dollars have beenspent on solar technologies than the other renewable alternatives(Fig. 9).
During the same time period, the US government spentsomewhat more on fossil fuel technologies than all renewableenergy alternatives combined, and spent dramatically more on thedevelopment of nuclear energy technologies, though investmentin nuclear energy tapered off rapidly in the late 1980s and 1990s.The cumulative investment in those technologies is provided inFig. 10.
ogy S-curves in renewable energy alternatives: Analysis andi:10.1016/j.enpol.2009.01.004
ARTICLE IN PRESS
0
2000
4000
6000
8000
10000
12000
1974
1976
1978
1980
1982
1984
1986
1988
1990
1992
1994
1996
1998
2000
2002
2004
Cum
ulat
ive
Spen
d, C
onst
ant $
Mill
ions
Total SolarSolar Heating & Cooling (Incl. Daylighting)PhotovoltaicsSolar Thermal Power and High Temp. AppsWind Energy
Ocean Energy
Total Bio-Energy
Geothermal Energy
Total Hydropower
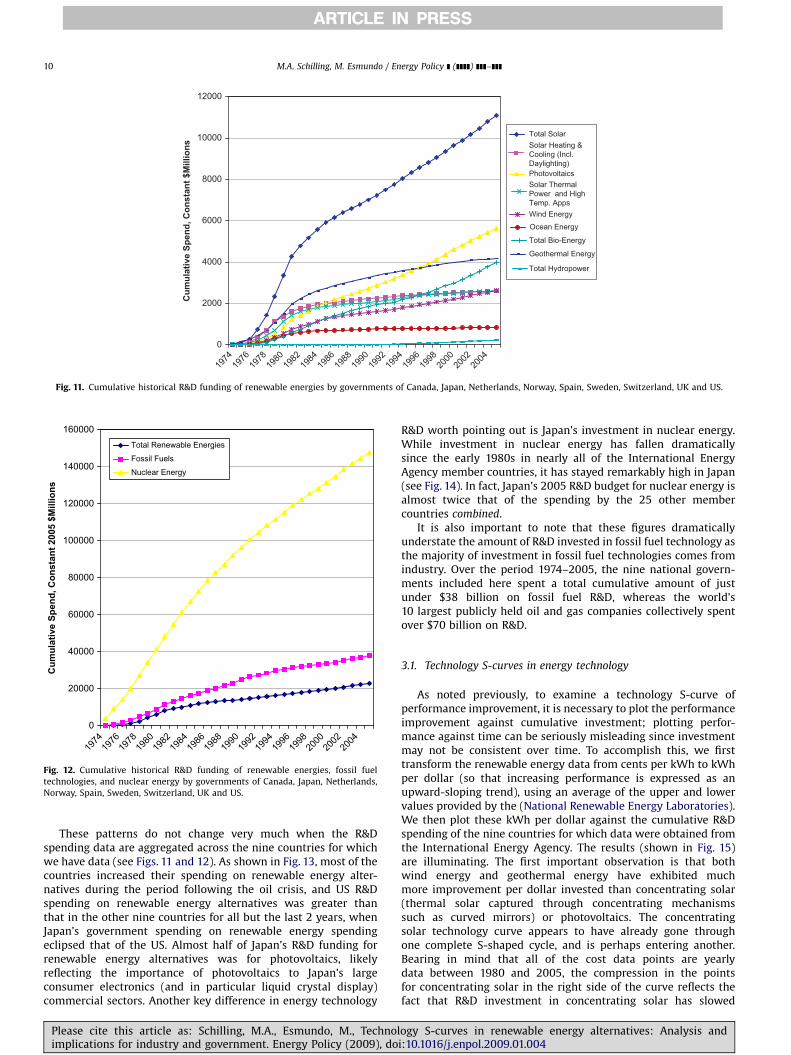
Fig. 11. Cumulative historical R&D funding of renewable energies by governments of Canada, Japan, Netherlands, Norway, Spain, Sweden, Switzerland, UK and US.
0
20000
40000
60000
80000
100000
120000
140000
160000
1974
1976
1978
1980
1982
1984
1986
1988
1990
1992
1994
1996
1998
2000
2002
2004
Cum
ulat
ive
Spen
d, C
onst
ant 2
005
$Mill
ions
Total Renewable Energies
Fossil Fuels
Nuclear Energy
Fig. 12. Cumulative historical R&D funding of renewable energies, fossil fuel
technologies, and nuclear energy by governments of Canada, Japan, Netherlands,
Norway, Spain, Sweden, Switzerland, UK and US.
M.A. Schilling, M. Esmundo / Energy Policy ] (]]]]) ]]]–]]]10
These patterns do not change very much when the R&Dspending data are aggregated across the nine countries for whichwe have data (see Figs. 11 and 12). As shown in Fig. 13, most of thecountries increased their spending on renewable energy alter-natives during the period following the oil crisis, and US R&Dspending on renewable energy alternatives was greater thanthat in the other nine countries for all but the last 2 years, whenJapan’s government spending on renewable energy spendingeclipsed that of the US. Almost half of Japan’s R&D funding forrenewable energy alternatives was for photovoltaics, likelyreflecting the importance of photovoltaics to Japan’s largeconsumer electronics (and in particular liquid crystal display)commercial sectors. Another key difference in energy technology
Please cite this article as: Schilling, M.A., Esmundo, M., Technolimplications for industry and government. Energy Policy (2009), do
R&D worth pointing out is Japan’s investment in nuclear energy.While investment in nuclear energy has fallen dramaticallysince the early 1980s in nearly all of the International EnergyAgency member countries, it has stayed remarkably high in Japan(see Fig. 14). In fact, Japan’s 2005 R&D budget for nuclear energy isalmost twice that of the spending by the 25 other membercountries combined.
It is also important to note that these figures dramaticallyunderstate the amount of R&D invested in fossil fuel technology asthe majority of investment in fossil fuel technologies comes fromindustry. Over the period 1974–2005, the nine national govern-ments included here spent a total cumulative amount of justunder $38 billion on fossil fuel R&D, whereas the world’s10 largest publicly held oil and gas companies collectively spentover $70 billion on R&D.
3.1. Technology S-curves in energy technology
As noted previously, to examine a technology S-curve ofperformance improvement, it is necessary to plot the performanceimprovement against cumulative investment; plotting perfor-mance against time can be seriously misleading since investmentmay not be consistent over time. To accomplish this, we firsttransform the renewable energy data from cents per kWh to kWhper dollar (so that increasing performance is expressed as anupward-sloping trend), using an average of the upper and lowervalues provided by the (National Renewable Energy Laboratories).We then plot these kWh per dollar against the cumulative R&Dspending of the nine countries for which data were obtained fromthe International Energy Agency. The results (shown in Fig. 15)are illuminating. The first important observation is that bothwind energy and geothermal energy have exhibited muchmore improvement per dollar invested than concentrating solar(thermal solar captured through concentrating mechanismssuch as curved mirrors) or photovoltaics. The concentratingsolar technology curve appears to have already gone throughone complete S-shaped cycle, and is perhaps entering another.Bearing in mind that all of the cost data points are yearlydata between 1980 and 2005, the compression in the pointsfor concentrating solar in the right side of the curve reflects thefact that R&D investment in concentrating solar has slowed
ogy S-curves in renewable energy alternatives: Analysis andi:10.1016/j.enpol.2009.01.004

ARTICLE IN PRESS
0
200
400
600
800
1000
1200
1400
1600
1974
1975
1976
1977
1978
1979
1980
1981
1982
1983
1984
1985
1986
1987
1988
1989
1990
1991
1992
1993
1994
1995
1996
1997
1998
1999
2000
2001
2002
2003
2004
2005
Con
stan
t 200
5 $M
illio
ns
CanadaJapanNetherlandsNorwaySpainSwedenSwitzerlandUKUS
Fig. 13. R&D spending on renewable energies by country.
0
500
1000
1500
2000
2500
3000
3500
4000
4500
1974
1976
1978
1980
1982
1984
1986
1988
1990
1992
1994
1996
1998
2000
20
0220
04
Con
stan
t 200
5 $M
illio
ns
Canada
Japan
Netherlands
Norway
Spain
Sweden
Switzerland
UK
US
Fig. 14. R&D spending on nuclear energy by country.
M.A. Schilling, M. Esmundo / Energy Policy ] (]]]]) ]]]–]]] 11
significantly, consistent with the previous data shown onR&D investment. The photovoltaics curve appears to be at thevery beginning of an S-curve with a much slower performanceimprovement rate than the other technologies. Significantly morehas been spent on photovoltaics than on the other renewables, yetit has thus far achieved a much lower performance, at least interms of kWh per dollar.
Both wind energy and geothermal energy, on the other hand,show very sharply increasing performance curves. Wind energyshows the archetypal s-shape, suggesting that it may already beentering a period of slowing performance improvement (though,as noted previously, changes in technological trajectories are not
Please cite this article as: Schilling, M.A., Esmundo, M., Technolimplications for industry and government. Energy Policy (2009), do
uncommon and S-curves are by no means deterministic).Geothermal energy shows exponential growth, achieving morekWh per dollar than the other three technologies and showing noindication of slowing performance improvement.
To analyze these curves further, we begin with the assumptionthat performance improvement in renewable energy technologieswill approximate the Pearl curve most commonly used intechnology studies
y ¼ L=ð1þ ae�biÞ
where y refers to performance, L refers to the expected limit ofperformance, and i refers to cumulative investment. Then a is a
ogy S-curves in renewable energy alternatives: Analysis andi:10.1016/j.enpol.2009.01.004

ARTICLE IN PRESS
0
5
10
15
20
25
30
0Cumulative R&D Spend, Constant 2005 $Millions
kWh
per D
olla
r
PhotovoltaicsConcentrating SolarWind EnergyGeothermal Energy
1000 2000 3000 4000 5000 6000 7000
Fig. 15. Technology S-curves: kWh per dollar vs. cumulative government R&D funding for photovoltaics, total solar, wind energy, and geothermal energy, 1980–2005.
(Investment dollars are cumulative over the period 1974–2005 but performance is shown only from 1980 forward as this is when the earliest cost data is available from the
National Renewable Energy Laboratory).
0
10
20
30
40
50
60
0Cumulative R&D Spend, Constant 2005 $Millions
kWh
per D
olla
r
Predicted y Performance
1000 2000 3000 4000 5000 6000 7000 8000
Fig. 16. Predicted vs. actual performance for wind energy, by cumulative R&D investment.
M.A. Schilling, M. Esmundo / Energy Policy ] (]]]]) ]]]–]]]12
coefficient that determines the height of the curve and b
determines its slope.We can reformulate the relationship as
logeððL=yÞ � 1Þ ¼ logea� bi
By defining
Y ¼ logeððL=yÞ � 1Þ
a ¼ logea
b ¼ �b
we obtain the linear formula
Y ¼ aþ bi
Please cite this article as: Schilling, M.A., Esmundo, M., Technolimplications for industry and government. Energy Policy (2009), do
which enables us to use linear regression to assess the fit of thecurve and the coefficients a and b. A range of values can be usediteratively for the limit (L) to examine its impact on the fit of thecurve.
For the wind energy data, a very good fit (Adjusted R squared of0.96; sum of squared errors 50.11) was achieved with a limit of 50(about 2.5 times the highest observed value), an intercept of 1.87,and a slope of 0.00069 (see Fig. 16). The sum of squared errorsfor the regression decreases as the limit decreases, whichmay suggest that we are in the ‘‘dominant design’’ or ‘‘era ofincremental change’’ state, though as noted before, S-curvesare not deterministic and there may be reasons to expectanother upturn in the performance improvement rate given the
ogy S-curves in renewable energy alternatives: Analysis andi:10.1016/j.enpol.2009.01.004

ARTICLE IN PRESS
0
50
100
150
200
250
300
0Cumulative R&D Spend, Constant 2005 $Millions
kWh
per D
olla
r
Predicted y Performance
2000 4000 6000 8000 10000 12000 14000 16000 18000
Fig. 17. Predicted vs. actual performance for wind energy, by cumulative R&D investment.
0
10
20
30
40
50
60
70
80
90
100
20000Cumulative R&D Spend, Constant 2005 $Millions
kWh
per D
olla
r
Fossil Fuels
22000 24000 26000 28000 30000 32000 34000 36000 38000 40000
Fig. 18. Technology S-curves: kWh per dollar vs. cumulative government R&D funding for fossil fuels, 1990–2005.
M.A. Schilling, M. Esmundo / Energy Policy ] (]]]]) ]]]–]]] 13
rather minimal investment that has thus far gone into windenergy.3 If 50 kWh per dollar is an appropriate limit for windenergy, the regression coefficients suggest that this limit shouldbe reached by the time cumulative investment reaches 6 billiondollars.
For the geothermal energy data, a very good fit (Adjusted R
squared of 0.95; sum of squared errors 44.57) was achieved with alimit of 276 (about 10 times the highest observed value), anintercept of 2.00, and a slope of 0.00024 (see Fig. 17). For these
3 It is also important to note that the appearance of a slowing performance
improvement in wind for the last couple of years may be due to data inaccuracies
in figures available from the National Renewable Energy Laboratory as their
aggregations include more estimated data points for very recent years than in the
older data.
Please cite this article as: Schilling, M.A., Esmundo, M., Technolimplications for industry and government. Energy Policy (2009), do
data the sum of squared errors decreases as the limit increases,suggesting that geothermal may still be in a very early (‘‘fluid’’)state of development. If 276 kWh per dollar is an appropriate limitfor wind energy, the regression coefficients suggest that this limitshould be reached by the time cumulative investment reaches16 billion dollars. Perhaps more important, the regressioncoefficients suggest that geothermal energy should becomeless expensive than the current composite fossil fuel price at acumulative R&D investment of less than $7.5 billion. Even ifwe lower the expected limit for geothermal energy radically,to 100 kWh per dollar for example, the results suggest thatgeothermal energy will become less than expensive than thecurrent composite fossil fuel price at a cumulative investment ofless than $9.8 billion. Needless to say, if fossil fuels continue theirupward price trends, both wind energy and geothermal energy
ogy S-curves in renewable energy alternatives: Analysis andi:10.1016/j.enpol.2009.01.004
ARTICLE IN PRESS
M.A. Schilling, M. Esmundo / Energy Policy ] (]]]]) ]]]–]]]14
will become more economical than fossil fuels before thesecumulative investment amounts are reached.4
The S-curve for technology improvement for the fossil fuelcomposite is shown in Fig. 18 (because the scale of R&Dinvestment in fossil fuels has been so much greater than thatfor renewables, it was impractical to plot the fossil fuels S-curve inthe same figure). As with renewables, the cost data are plottedagainst cumulative R&D investment data. The result, however,does not look much like an S-curve, and in recent yearsperformance has deteriorated rapidly. To understand this resultit is important to note that fossil fuel technologies were alreadylong mature by the 1990s. Coal’s biggest advances in bothperformance and use occurred between 1875 and 1925; petro-leum and natural gas experienced their biggest advances between1920 and 1970. Thus, in the case of fossil fuels, we are viewingonly the portion of the S-curve that would be expected to be flat,well after the big gains have already been achieved. As technologyimprovements slowed in fossil fuels, its performance curvebecame much more heavily influenced by volatility in fuel pricesthan by investments in R&D. This illustrates a key point abouttechnology S-curves: scarcity in the inputs required for atechnology can lead to diseconomies of scale, causing the S-curveto ultimately turn downward—not because of R&D investment,but despite it.
4. Conclusion
In the preceding discussion we utilized a technology S-curveapproach to analyze performance trajectories in several promi-nent renewable energy technologies, and compared them with theperformance trajectories of fossil fuel technologies.
There are a number of limitations of this analysis. First, it isnotoriously difficult to estimate the average costs of energyproduction since these costs vary depending on a myriad offactors, including facility scale and age, the type of technologyemployed, the quality of the energy input, etc. Energy costestimates are thus almost inevitably plagued with a degree ofimprecision. Furthermore, to draw inferences about the relation-ship between investment and cost we were reliant upon data fromnine countries when it would have been preferable to have datafrom all government and industry sources.
Despite these limitations, however, we believe this analysisoffers several important insights. First, the technology S-curvescreated by plotting performance against investment suggest thatR&D investments in fossil fuel technologies by government isprobably excessive: fossil fuel technologies do not appear to bereaping performance improvements from R&D investment, and infact are experiencing declining performance despite the signifi-cant investment. On the other hand, the cost data indicate thatfossil fuels are still, despite their deteriorating performance, lessexpensive than the renewable alternatives considered here, so itshould not be surprising that they account for the bulk ofcommercial energy production and consumption.
Second, the results suggest that renewable energy sources(particularly wind and geothermal) have been significantly under-funded relative to their potential payoffs. The technology S-curvesfor both wind energy and geothermal energy show majorperformance gains as a function of R&D investment, and bothappear to be poised to become economically comparable, if not
4 This conclusion is based on an assumption of relatively stable market prices
for construction materials for wind power and geothermal power facilities.
Significant increases (or decreases) in such prices would influence both the
likelihood and the timing of wind and geothermal energies becoming more
economical than fossil fuels.
Please cite this article as: Schilling, M.A., Esmundo, M., Technolimplications for industry and government. Energy Policy (2009), do
superior, to fossil fuels with modest investment. However,government R&D investment in these technologies has beendiminutive. The collective government R&D investment in windenergy and geothermal energy by the nine countries consideredhere totaled just over $2.6 billion and $4.1 billion, respectively,over the 1974–2005 period. Over that same period, the samegovernments spent almost $38 billion on fossil fuel technologies.Of the countries examined here, the United States, Norway, Japan,and Canada still invest more government dollars yearly on R&Dfor fossil fuel technologies than for all of the renewable energiescombined. By contrast, Spain, Sweden, Switzerland, and the UnitedKingdom spend more R&D on renewable energies than fossil fueltechnologies.
Third, the technology cycles perspective offered here suggeststhat investment in fossil fuel technologies by incumbent firms maystill be rational as most of these firms are likely to haveconsiderable asset positions and strategic commitments in fossilfuel energies that make it currently more profitable to focus onfossil fuel energy sources than renewable energy sources.However, the data suggest that new entrants into the energyindustry are likely to benefit more from investment in wind orgeothermal energy alternatives than fossil fuel, biomass, or solartechnologies. Furthermore, the rates of performance improvementin renewable energies (and performance erosion in fossil fuels)suggest that incumbent firms should begin (if they have not doneso already) to develop strategies for transition to renewableenergy options lest they become victims of disruptive technolo-gical change. While it can sometimes be shareholder-wealthmaximizing for a firm to practice a harvest strategy of sticking toan obsolescing technology until the firm’s demise, the comple-mentary asset positions of oil and gas companies in energyproduction infrastructure and distribution probably make transi-tioning to renewable energies a more attractive option from bothshareholder and social welfare perspectives.
Acknowledgements
The authors wish to gratefully acknowledge the suggestionsand assistance of Jorn Aabakken (National Renewable EnergyLaboratory), William Baumol, Henry C. Co, Alyssa A Frederick, andPaul Hesse (US Department of Energy).
References
American Wind Energy Association. /www.awea.orgS.Anderson, Philip, Tushman, Michael, 1990. Technological discontinuities and
dominant designs: a cyclical model of technological change. AdministrativeScience Quarterly 35, 604–634.
Ayres, R.U., 1994. Toward a non-linear dynamics of technological progress. Journalof Economic Behavior and Organization 24, 35–69.
Chandy, Rajesh K., Tellis, Gerard, 2000. The incumbent’s curse? Incumbency, size,and radical product innovation. Journal of Marketing 64 (3), 1–18.
Christensen, Clayton M., 1993. The rigid disk drive industry: a history of commercialand technological turbulence. Business History Review 67, 531–588.
Christensen, Clayton M., 1994. Exploring the limits of the technology s-curve.Production and Operations Management 1 (4), 334–366.
Christensen, Clayton, 1999. Innovation and the General Manager. Irwin McGrawHill, New York.
DeMeo, Ed., Parsons, Brian., 2003. Some common misconceptions about windpower. Presented at the All States Wind Summit, Austin, Texas. May 22.
Foster, Richard N., 1986. Innovation: The Attacker’s Advantage. Summit Books, NY.Henderson, Rebecca, Clark, Kim, 1990. Architectural innovation: the reconfigura-
tion of existing product technologies and the failure of established firms.Administrative Science Quarterly 35, 9–30.
Huber, G.P., 1992. Organizational learning: the contributing processes and theliteratures. Organization Science 2, 88–115.
Jacobsson, S., Johnson, A., 2000. The diffusion of renewable energy technology: ananalytical framework and key issues for research. Energy Policy 28, 625–640.
King, Andrew, Tucci, Christopher, 2002. Incumbent entry into new market niches:the role of experience and managerial choice in the creation of dynamiccapabilities. Management Science 48, 171–186.
ogy S-curves in renewable energy alternatives: Analysis andi:10.1016/j.enpol.2009.01.004

ARTICLE IN PRESS
M.A. Schilling, M. Esmundo / Energy Policy ] (]]]]) ]]]–]]] 15
Kobos, P.H., Erickson, J.D., Drennen, T.E., 2006. Technological learning andrenewable energy costs: implications for US renewable energy policy. EnergyPolicy 34, 1645–1658.
Leonard-Barton, Dorothy, 1992. Core capabilities and core rigidities: a paradox inmanaging new product development. Strategic Management Journal 13, 111–125.
Linton, J.D., Walsh, S.T., 2004. Integrating innovation and learning curve theory: anenabler for moving nanotechnologies and other emerging process technologiesinto production. R&D Management 34, 517–526.
National Renewable Energy Laboratories. /www.nrel.govS.Neij, L., 1997. Use of experience curves to analyse the prospects for diffusion and
adoption of renewable energy technology. Energy Policy 23, 1099–1107.Oak Ridge National Laboratory (ORNL). 2006. Hydropower: Licensed to protect the
environment. Interview retrieved from /http://www.ornl.gov/info/ornlreview/rev26-34/text/hydmain.htmlS in January, 2007.
Robinson, William T, Sungwook, Min, 2002. Is the first to market the first to fail?Empirical evidence for industrial goods businesses. Journal of MarketingResearch 39, 120–128.
Sahal, Devendra, 1981. Patterns of Technological Innovation. Addison-WesleyPublishing Co., Reading, MA.
Schumpeter, Joseph A., 1942. Capitalism, Socialism, and Democracy. Harper &Brothers Publishers, New York.
Suarez, Fernando F., Utterback, James M., 1995. Dominant designs and the survivalof firms. Strategic Management Journal 16, 415–430.
Twiss, B.C., 1992. Forecasting for technologists and engineers: a practical guide forbetter decisions. IEE Management of Technology Series 15. Peter Peregrinus,London.
Please cite this article as: Schilling, M.A., Esmundo, M., Technolimplications for industry and government. Energy Policy (2009), do
United States Department of Energy (DOE), Annual Energy Review. 2007. Retrievedfrom /www.eia.doe.govS in March, 2007.
United States Department of Energy, Energy Efficiency and RenewableEnergy (EERE). 2005. Distributed Wind Generation Study for NortheastColorado. December, 1. Retrieved from /www1.eere.energy.govS in January,2009.
United States Department of Energy, Energy Efficiency and RenewableEnergy (EERE). 2007a. Overview of Geothermal Technologies. Retrieved from/www1.eere.energy.govS in March, 2007.
United States Department of Energy, Energy Efficiency and Renewable Energy(EERE). 2007b. Overview of Wind Technologies. Retrieved from /www1.eere.energy.govS in March, 2007.
United States Department of Energy, Energy Efficiency and Renewable Energy(EERE). 2007c. Overview of Biomass Technologies. Retrieved from /www1.eere.energy.govS in March, 2007.
United States Department of Energy, Energy Efficiency and Renewable Energy(EERE). 2007d. Biomass Program. Retrieved from /www1.eere.energy.govS inFebruary, 2007.
United States Department of Energy, Energy Efficiency and Renewable Energy(EERE). 2008. Learning about PV: the Myths of Solar Electricity. Retrieved from/www1.eere.energy.gov/solar/myths.htmlS in January, 2009.
Utterback, James M., Abernathy, William J., 1975. A dynamic model of process andproduct innovation. Omega: The International Journal of Management Science3, 639–656.
Utterback, James M., Suarez, Fernando F., 1993. Innovation, competition andindustry structure. Research Policy 22, 1–21.
ogy S-curves in renewable energy alternatives: Analysis andi:10.1016/j.enpol.2009.01.004