Embed Size (px)
Citation preview
#MAX17#MAX17
Technology MythBusters:Truths and Numbers for Wi-Fi, Broadband, Cable TVMonday, October 22:45 – 3:45 p.m.
#MAX17
Beyond Revenue Share, Contracts and Exclusivity
Today’s Discussion

#MAX17
Mike CocoPresident
Choice Property Resources, Inc.
Jesse WalkerDirector of Sales
Engineering
Spectrum Community Solutions
Matt Wootton Director MDU National Accounts & Mixed Use
AT&T Connected Communities
Barney PullamVice President, Business
Process
Waterton
Meet the Experts
#MAX17
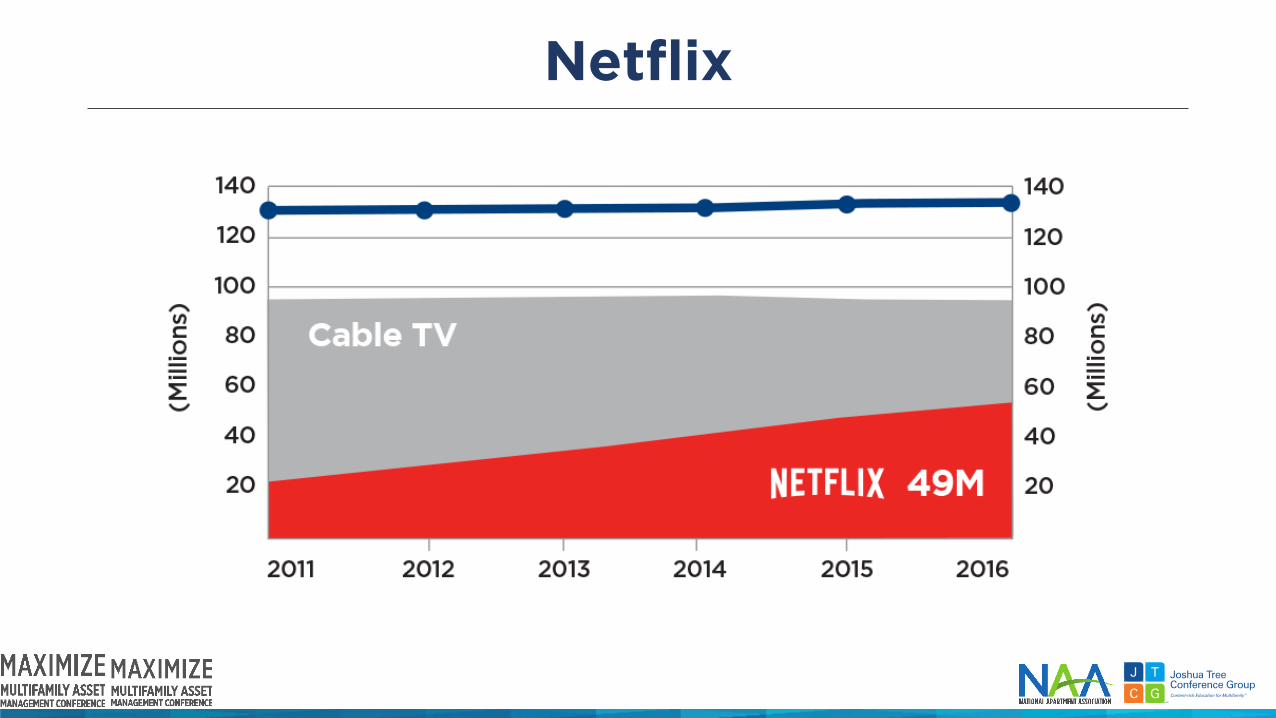
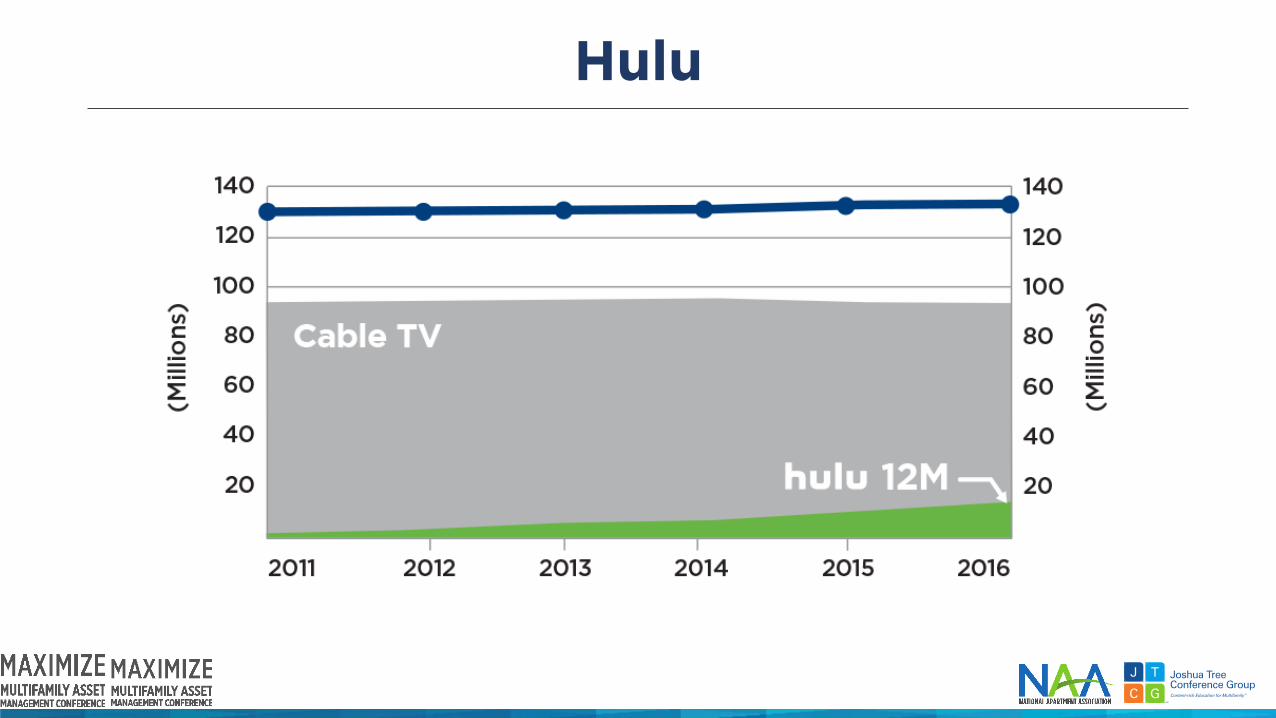
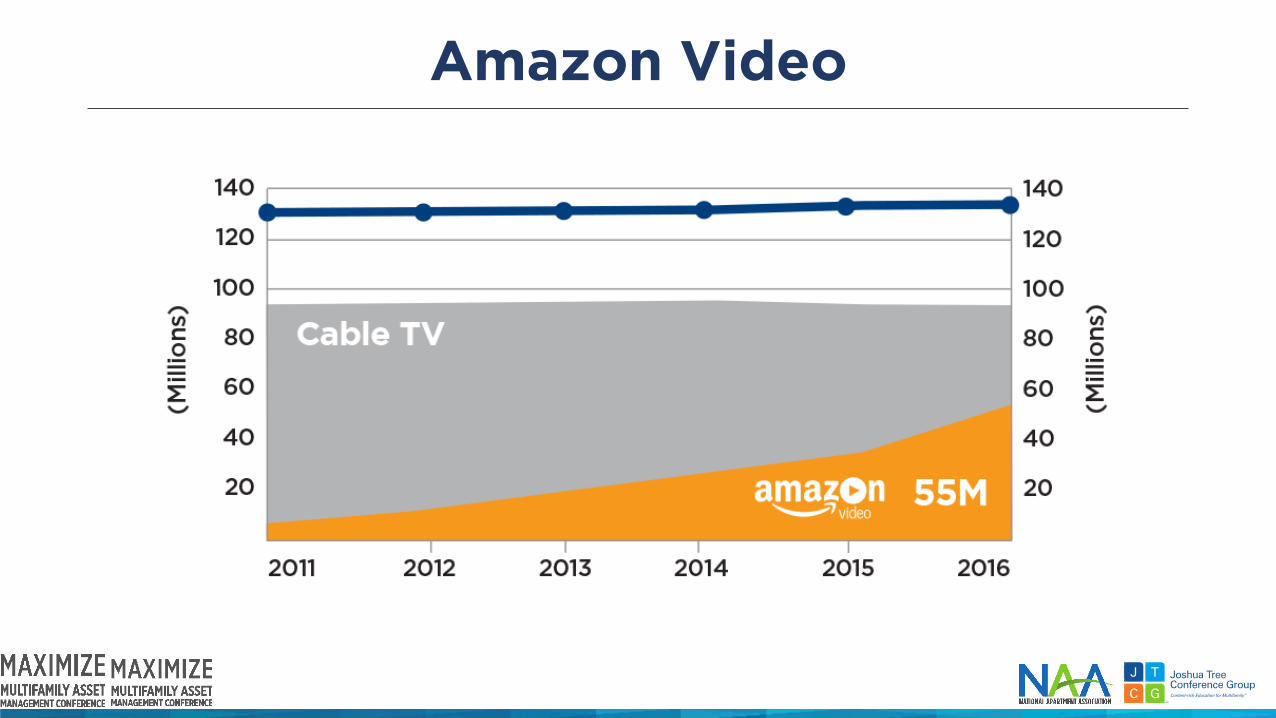
Myth #1: Cable TV is dead.
#MAX17
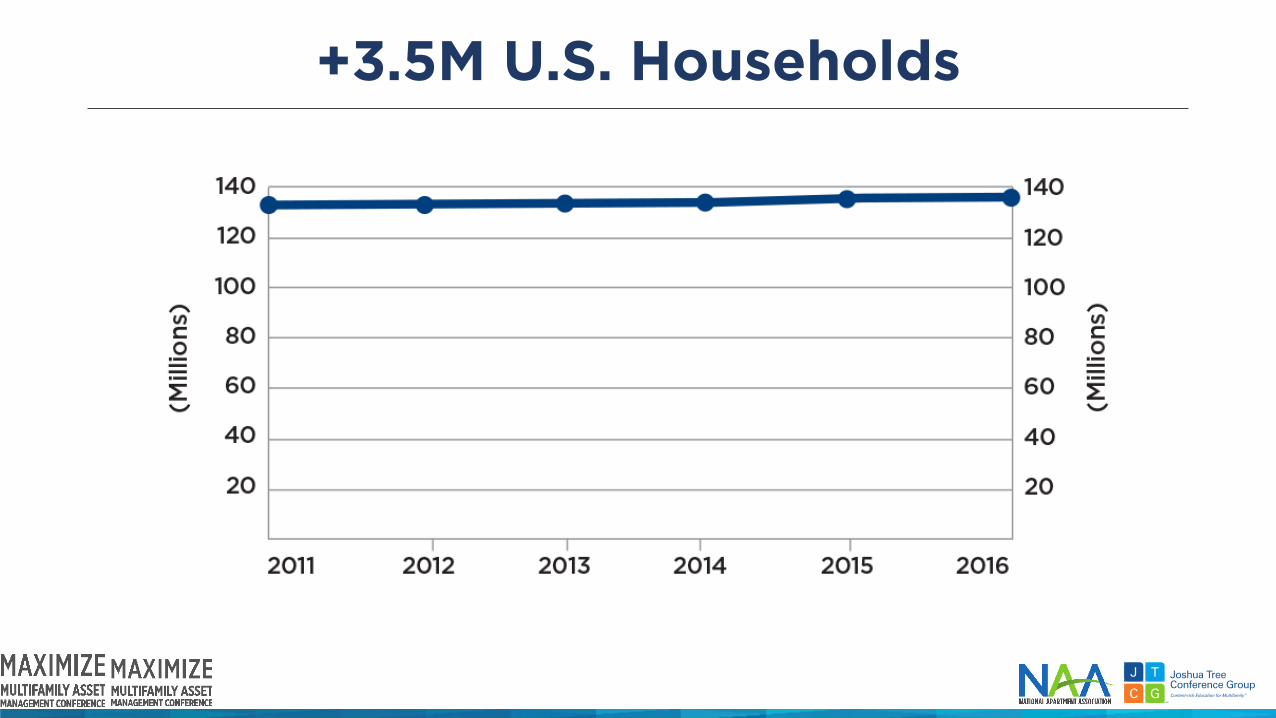
+3.5M U.S. Households
#MAX17
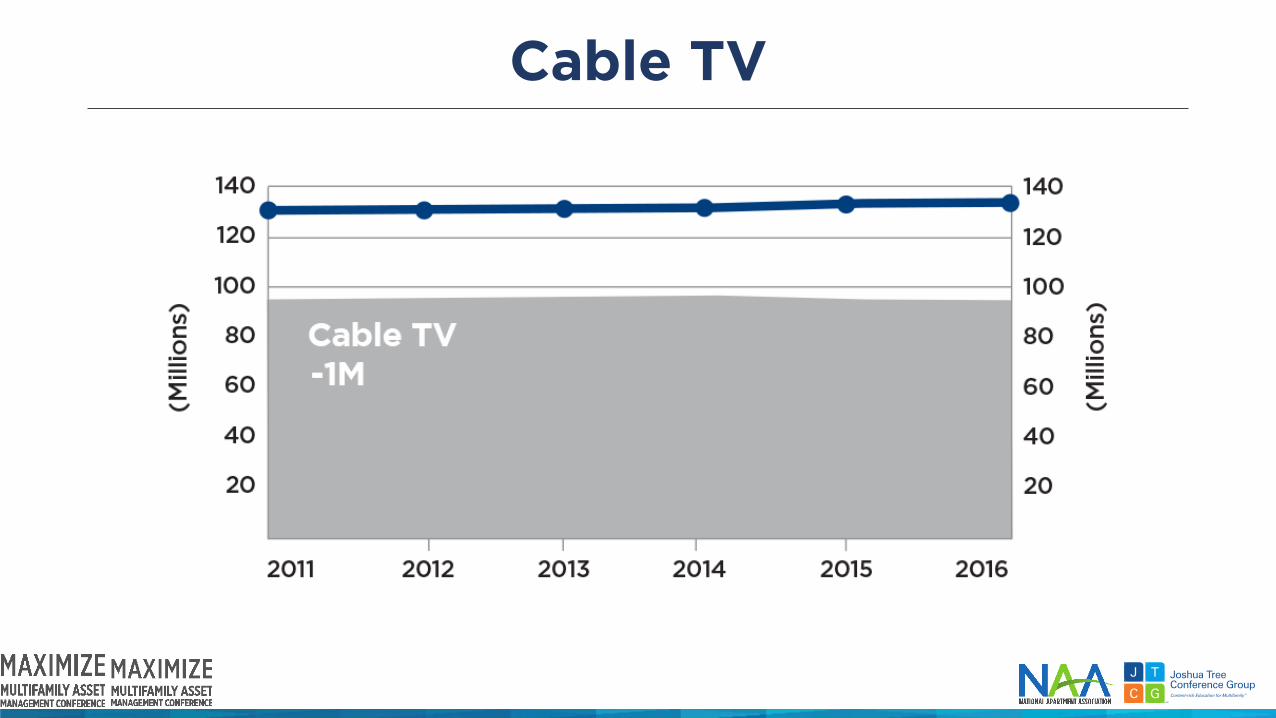
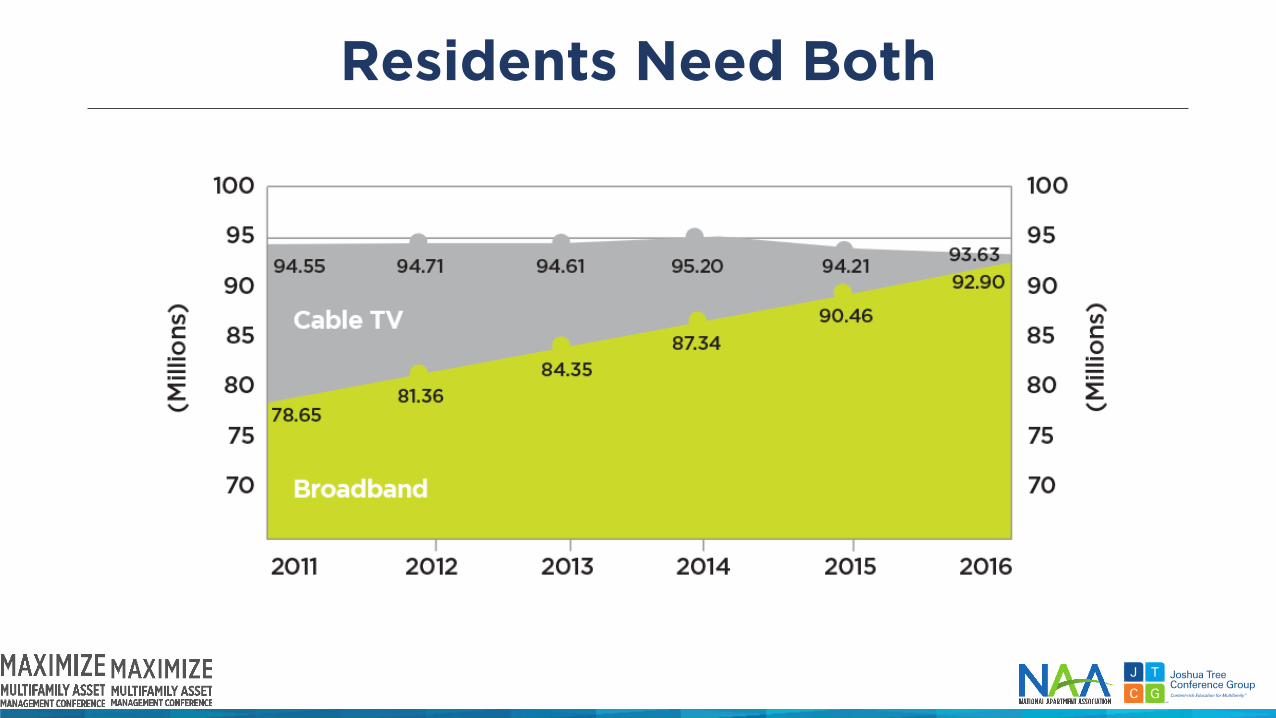
Cable TV
#MAX17
Netflix
#MAX17
Hulu
#MAX17
Amazon Video
#MAX17
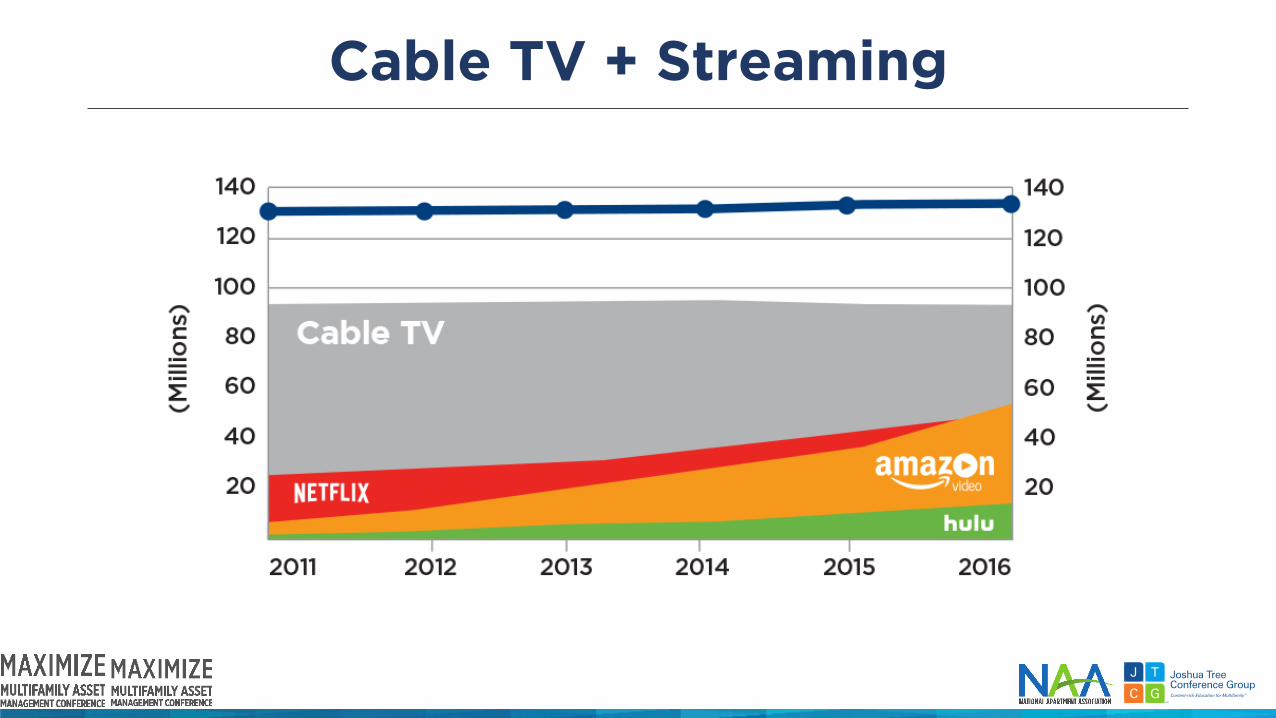
Cable TV + Streaming
#MAX17
Residents Need Both
#MAX17
Verdict: Cable TV is not Dead
#MAX17
Myth #2: Only Millennials Need Bandwidth
#MAX17
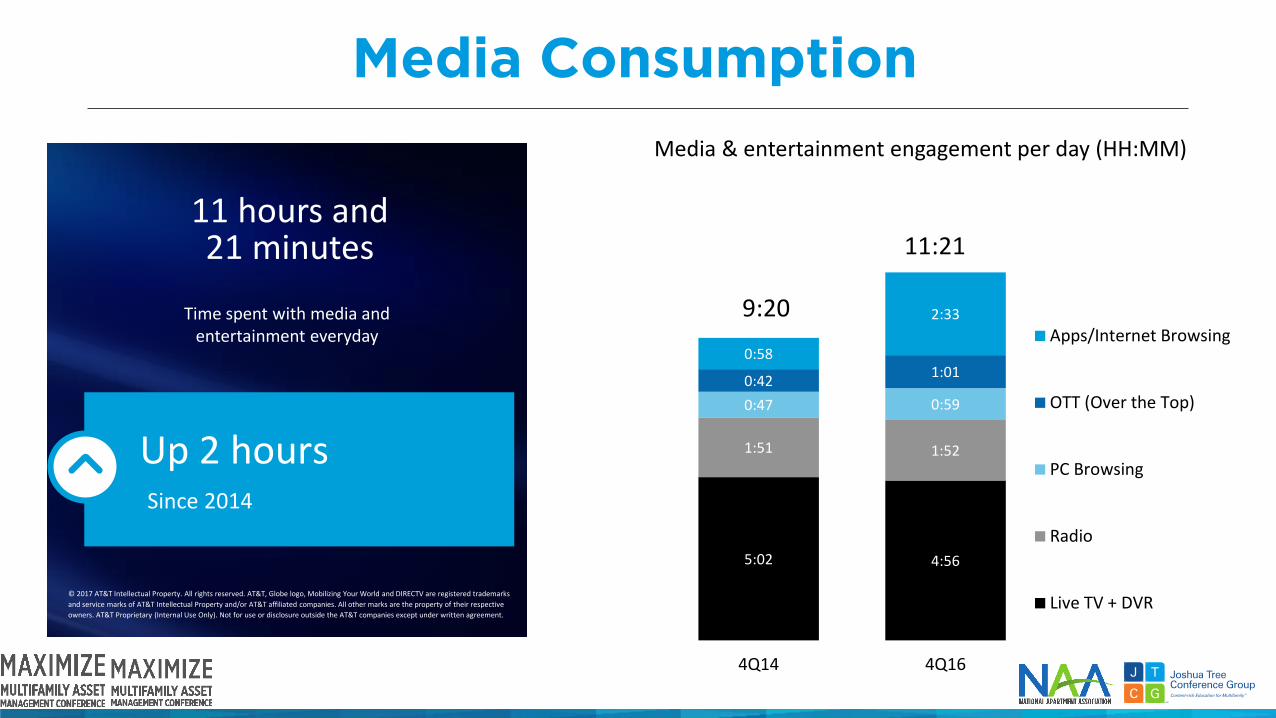
11 hours and 21 minutes
Time spent with media and entertainment everyday
Up 2 hours Since 2014
© 2017 AT&T Intellectual Property. All rights reserved. AT&T, Globe logo, Mobilizing Your World and DIRECTV are registered trademarks and service marks of AT&T Intellectual Property and/or AT&T affiliated companies. All other marks are the property of their respective owners. AT&T Proprietary (Internal Use Only). Not for use or disclosure outside the AT&T companies except under written agreement.
9:20
11:21
5:02 4:56
1:51 1:52
0:47 0:590:42 1:010:58
2:33
4Q14 4Q16
Apps/Internet Browsing
OTT (Over the Top)
PC Browsing
Radio
Live TV + DVR
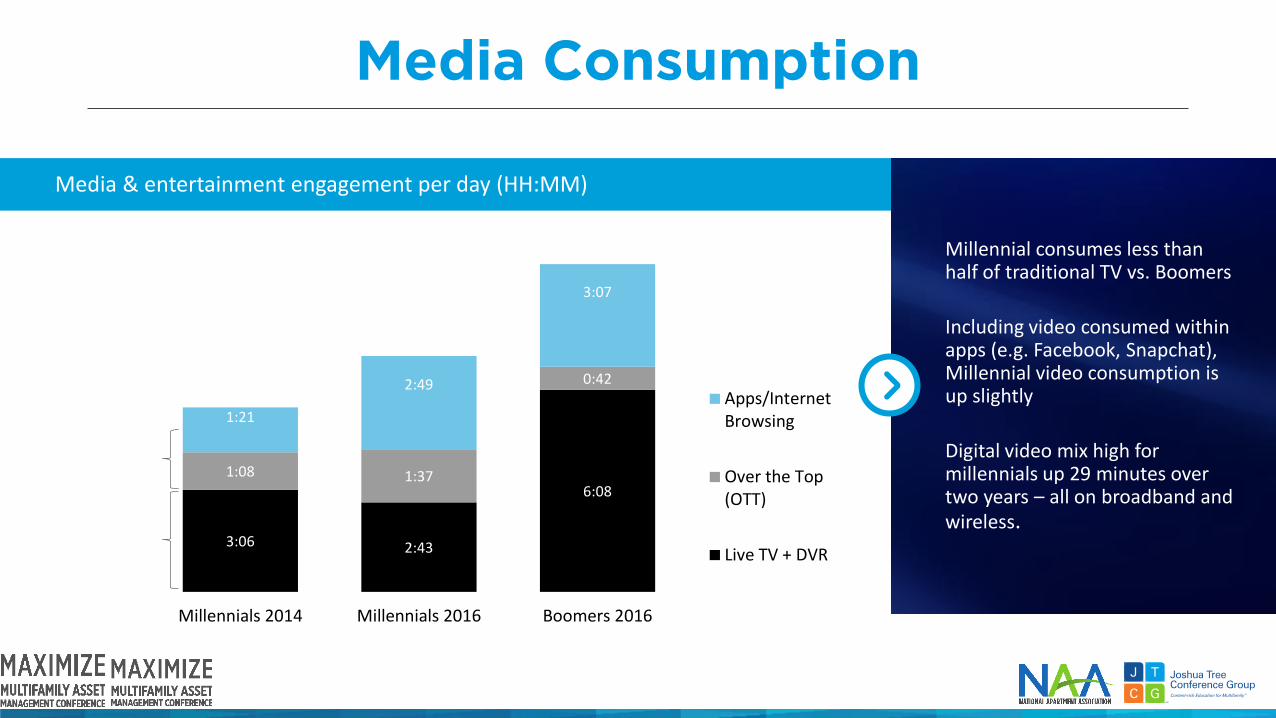
Media & entertainment engagement per day (HH:MM)
Media Consumption
#MAX17
Millennial consumes less than half of traditional TV vs. Boomers
Including video consumed within apps (e.g. Facebook, Snapchat), Millennial video consumption is up slightly
Digital video mix high for millennials up 29 minutes over two years – all on broadband and wireless.
Media & entertainment engagement per day (HH:MM)
3:06 2:43
6:081:08 1:37
0:42
1:21
2:49
3:07
Millennials 2014 Millennials 2016 Boomers 2016
Apps/InternetBrowsing
Over the Top(OTT)
Live TV + DVR
Media Consumption
#MAX17
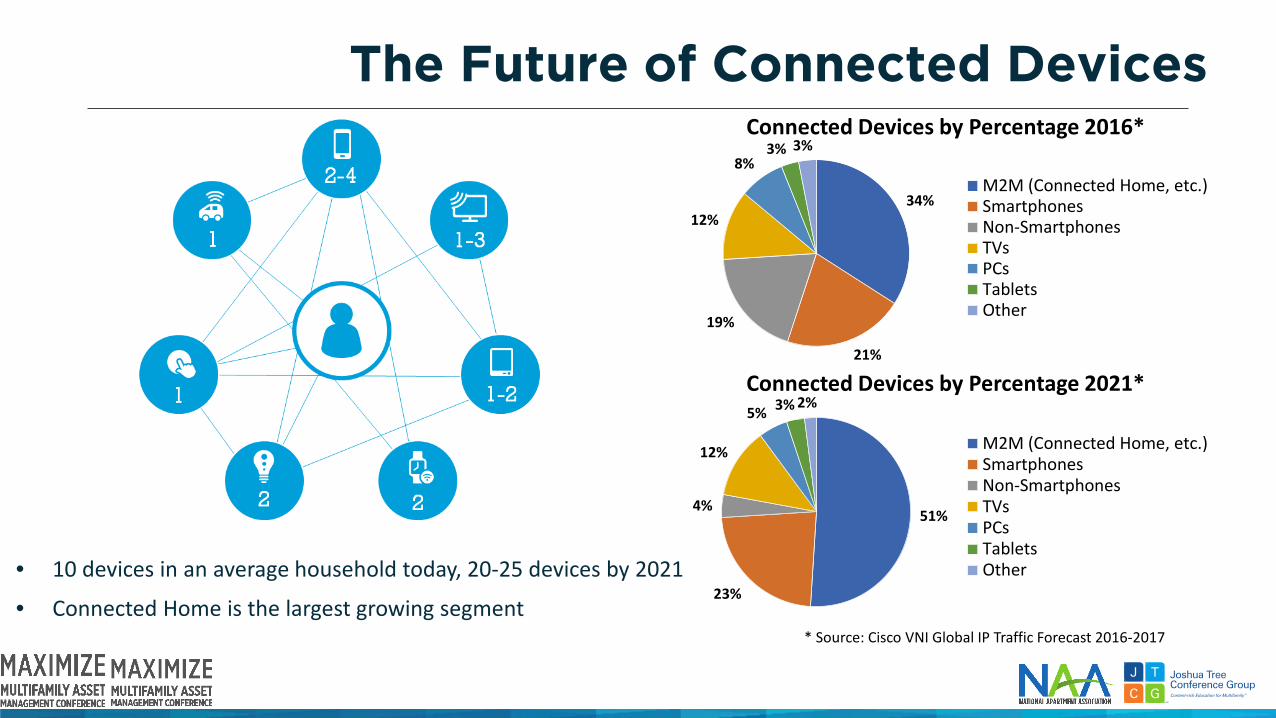
• 10 devices in an average household today, 20-25 devices by 2021
• Connected Home is the largest growing segment
The Future of Connected Devices
34%
21%
19%
12%
8%3% 3%
Connected Devices by Percentage 2016*
M2M (Connected Home, etc.)SmartphonesNon-SmartphonesTVsPCsTabletsOther
51%
23%
4%
12%
5% 3% 2%Connected Devices by Percentage 2021*
M2M (Connected Home, etc.)SmartphonesNon-SmartphonesTVsPCsTabletsOther
* Source: Cisco VNI Global IP Traffic Forecast 2016-2017
#MAX17
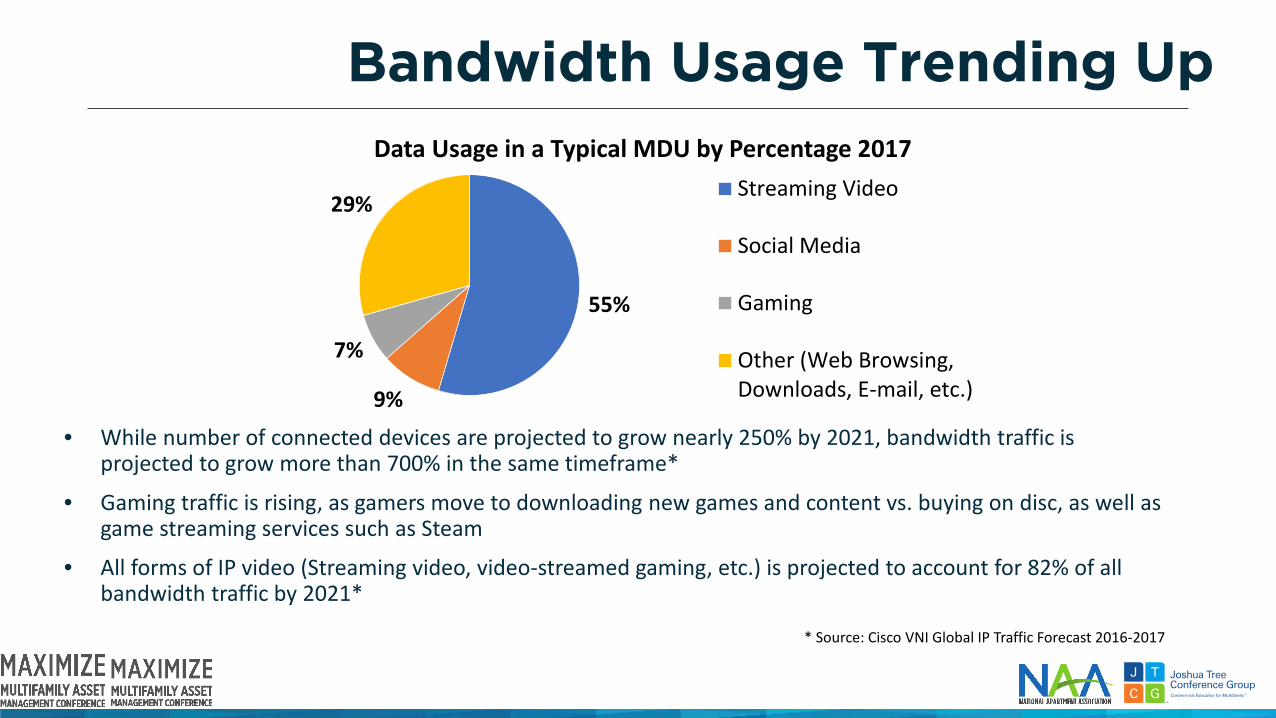
Bandwidth Usage Trending Up
55%
9%
7%
29%
Data Usage in a Typical MDU by Percentage 2017Streaming Video
Social Media
Gaming
Other (Web Browsing,Downloads, E-mail, etc.)
• While number of connected devices are projected to grow nearly 250% by 2021, bandwidth traffic is projected to grow more than 700% in the same timeframe*
• Gaming traffic is rising, as gamers move to downloading new games and content vs. buying on disc, as well as game streaming services such as Steam
• All forms of IP video (Streaming video, video-streamed gaming, etc.) is projected to account for 82% of all bandwidth traffic by 2021*
* Source: Cisco VNI Global IP Traffic Forecast 2016-2017
#MAX17
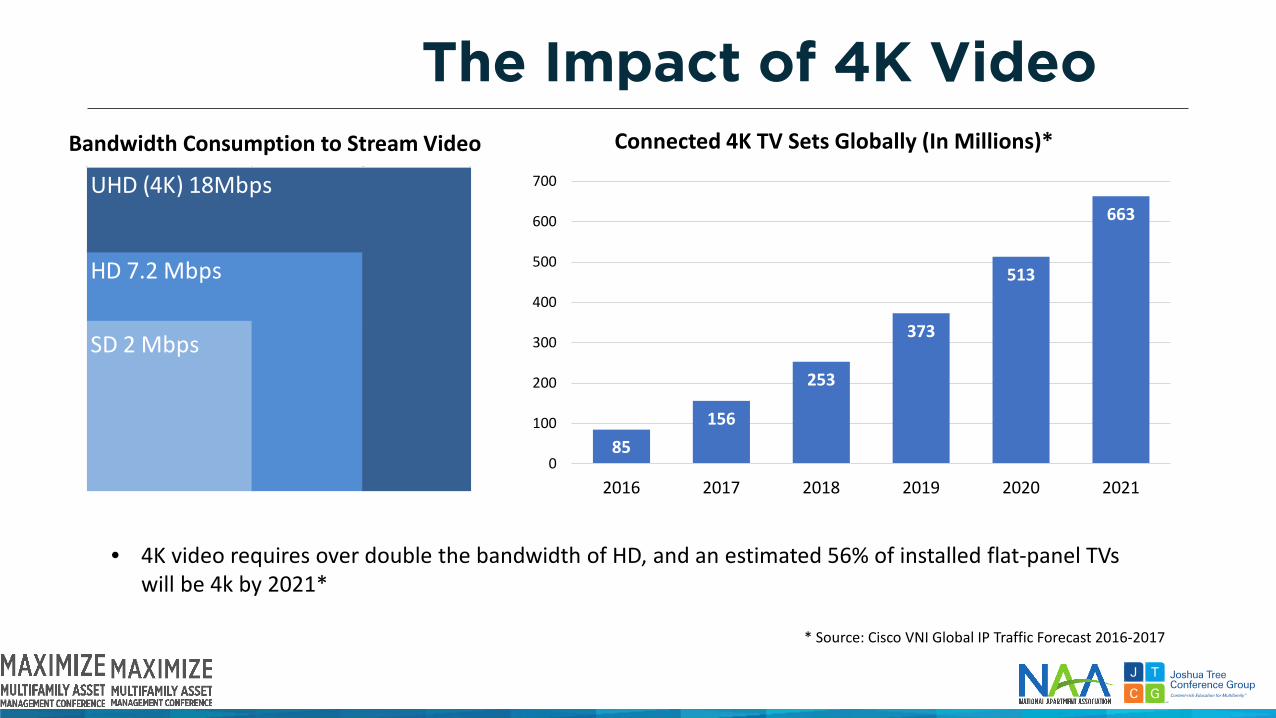
The Impact of 4K Video
* Source: Cisco VNI Global IP Traffic Forecast 2016-2017
UHD (4K) 18Mbps
HD 7.2 Mbps
SD 2 Mbps
85156
253
373
513
663
0
100
200
300
400
500
600
700
2016 2017 2018 2019 2020 2021
Connected 4K TV Sets Globally (In Millions)*
• 4K video requires over double the bandwidth of HD, and an estimated 56% of installed flat-panel TVs will be 4k by 2021*
Bandwidth Consumption to Stream Video
#MAX17
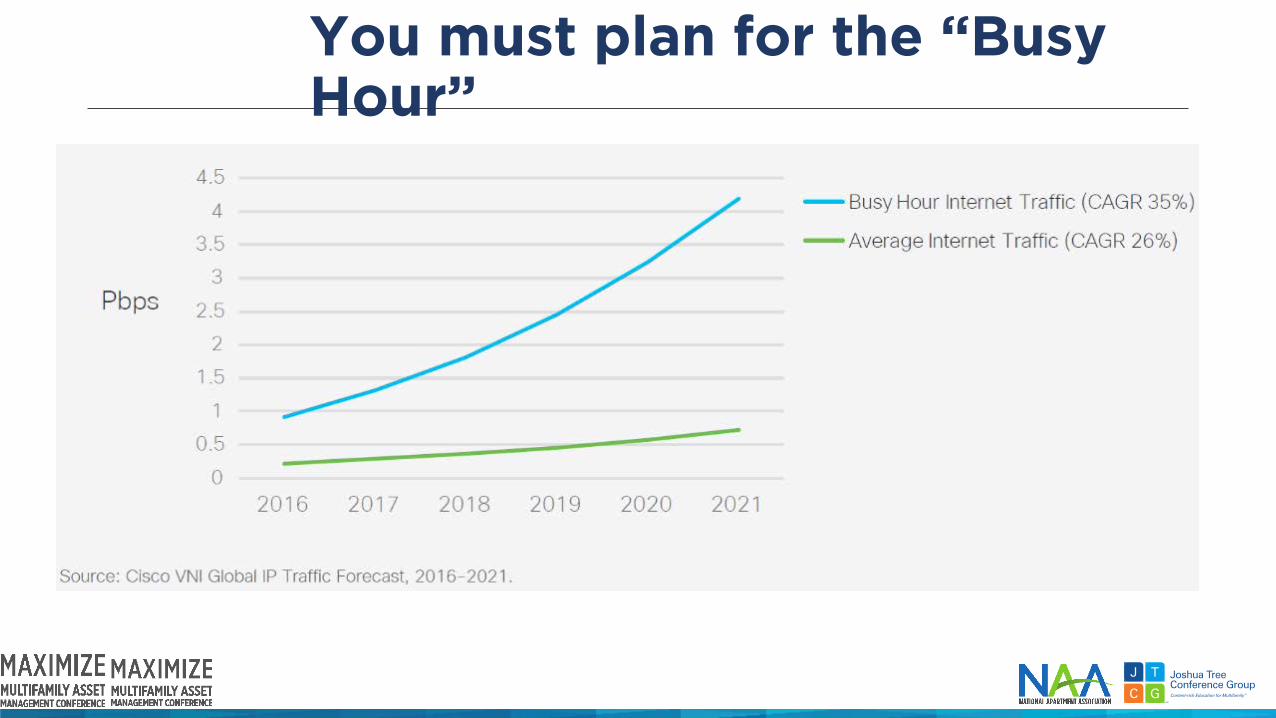
You must plan for the “Busy Hour”
#MAX17
Verdict: All Residents Need Bandwidth
#MAX17
Myth #3: Isn’t it all moving to wireless?
#MAX17
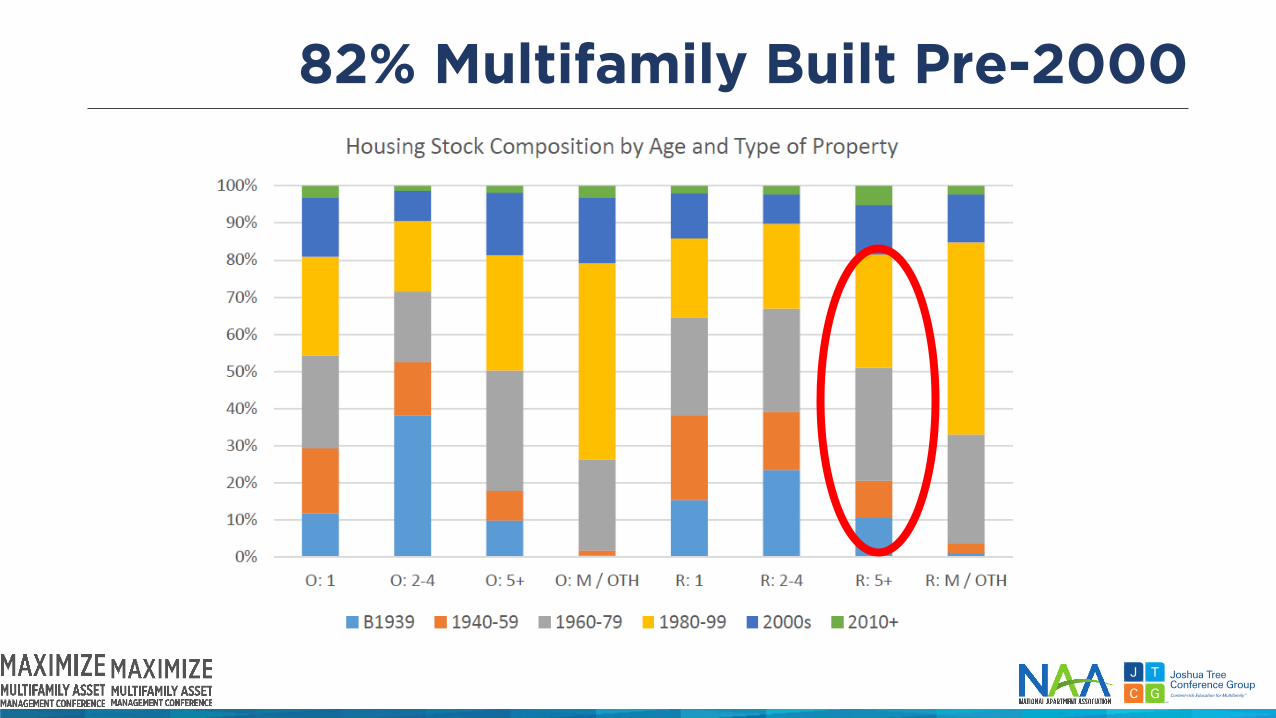
82% Multifamily Built Pre-2000
#MAX17
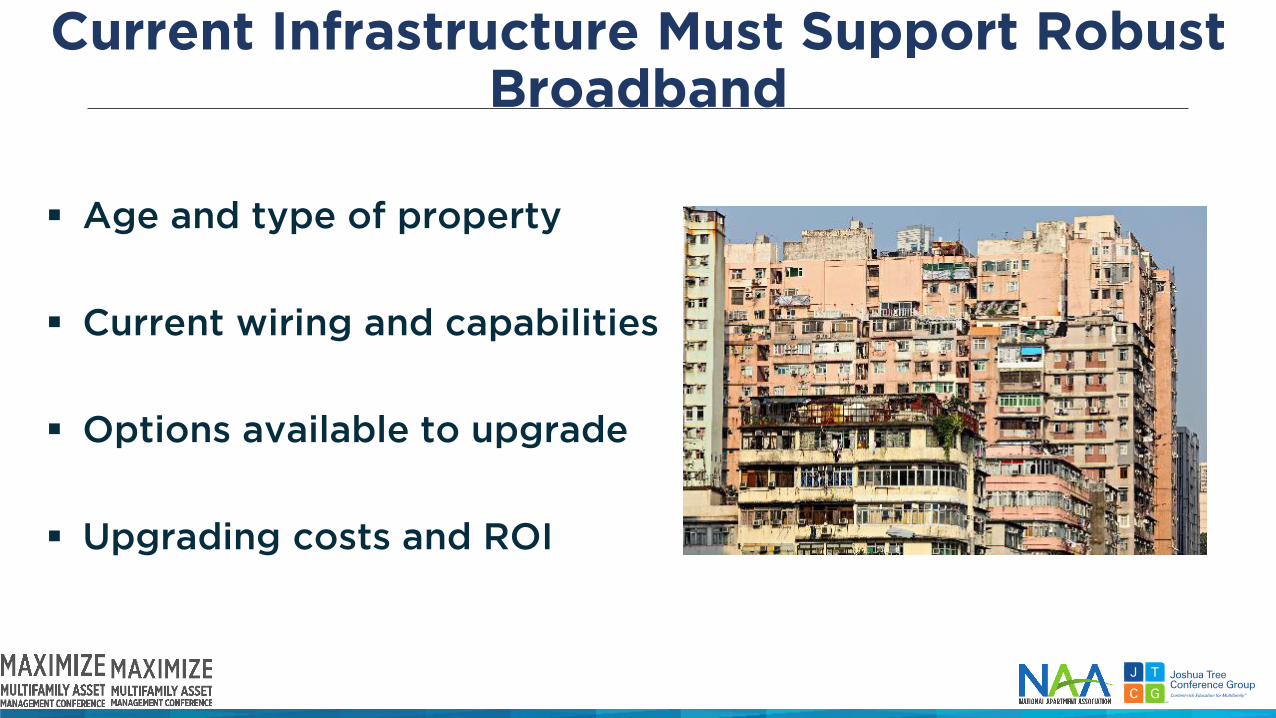
Current Infrastructure Must Support Robust Broadband
Age and type of property
Current wiring and capabilities
Options available to upgrade
Upgrading costs and ROI
#MAX17
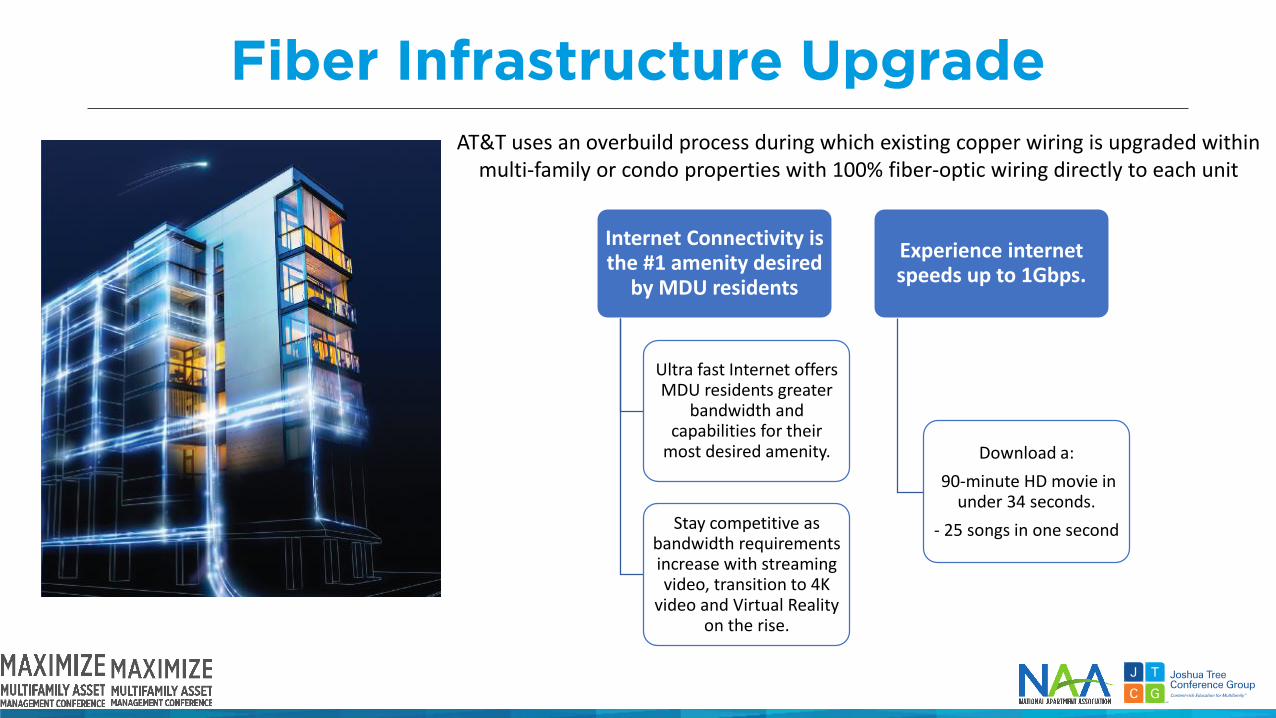
Fiber Infrastructure Upgrade AT&T uses an overbuild process during which existing copper wiring is upgraded within
multi-family or condo properties with 100% fiber-optic wiring directly to each unit
Internet Connectivity is the #1 amenity desired
by MDU residents
Ultra fast Internet offers MDU residents greater
bandwidth and capabilities for their
most desired amenity.
Stay competitive as bandwidth requirements increase with streaming video, transition to 4K
video and Virtual Reality on the rise.
Experience internet speeds up to 1Gbps.
Download a:90-minute HD movie in
under 34 seconds.- 25 songs in one second
#MAX17
Behind all this wireless…
#MAX17
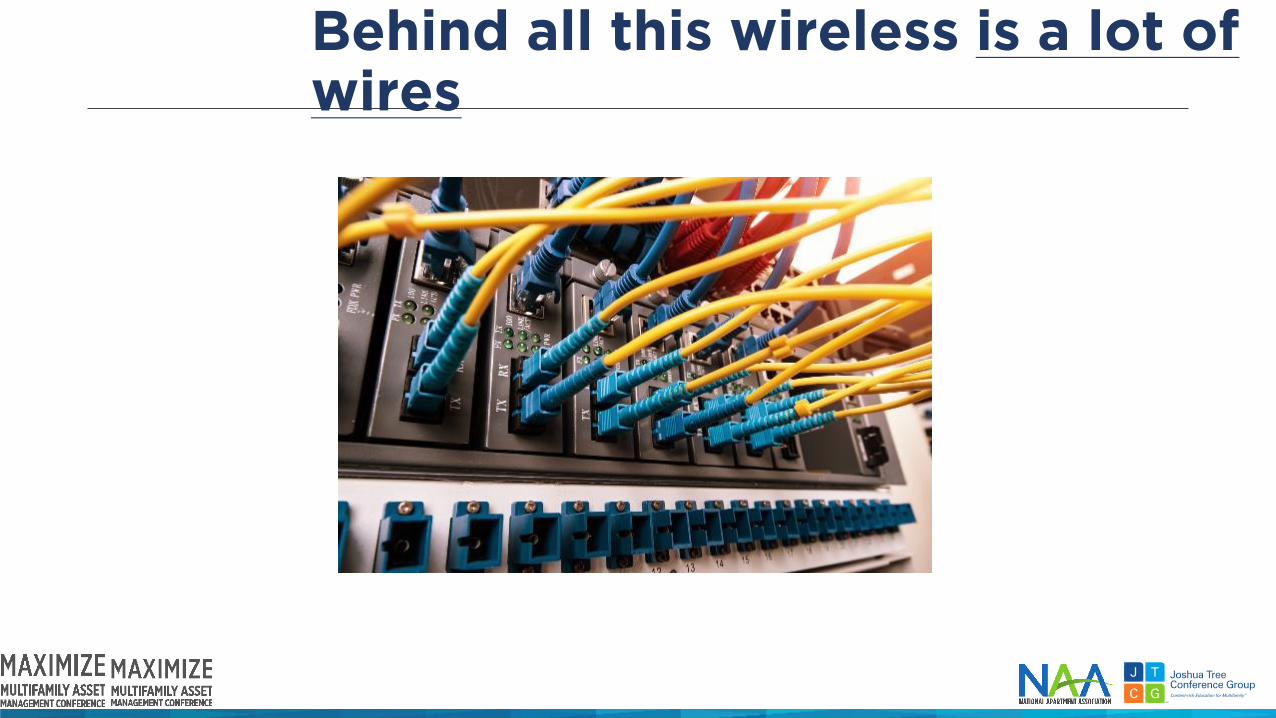
Behind all this wireless is a lot of wires
#MAX17
Verdict: Even with Wireless, Need Infrastructure
#MAX17
Myth #4: All Wi-Fi is Created Equal
#MAX17
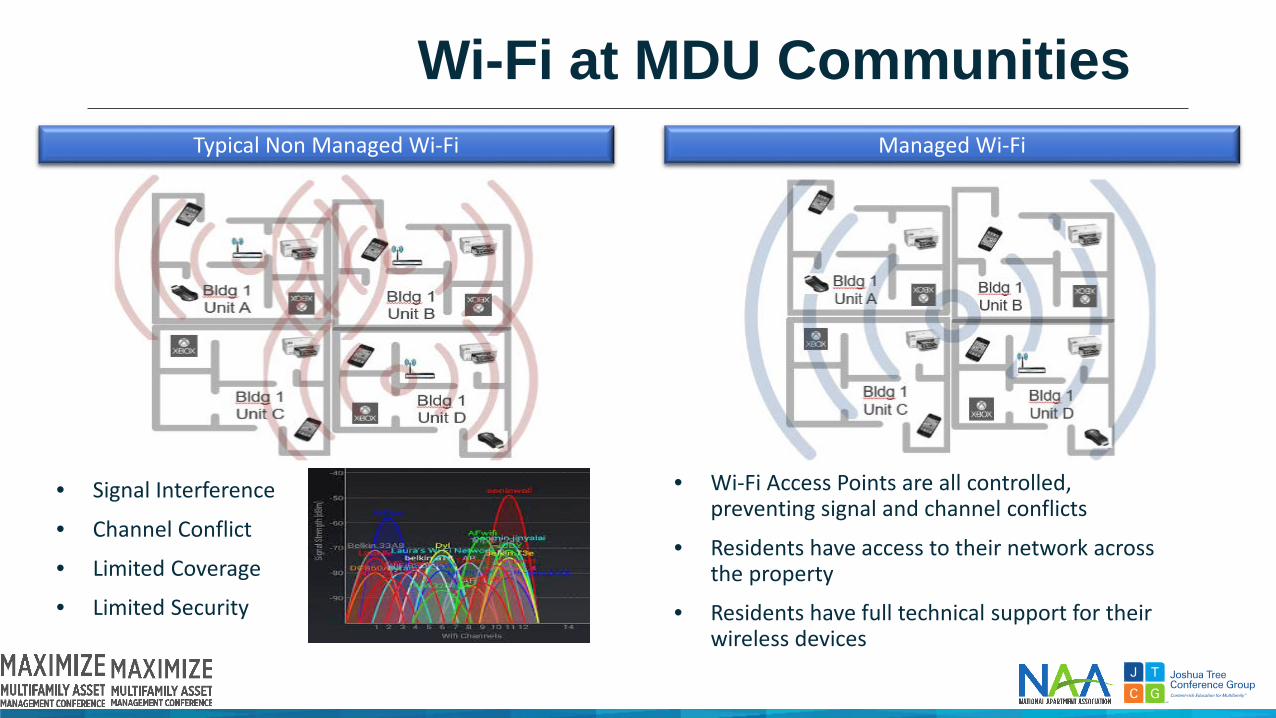
Wi-Fi at MDU CommunitiesTypical Non Managed Wi-Fi
• Signal Interference
• Channel Conflict
• Limited Coverage
• Limited Security
Managed Wi-Fi
• Wi-Fi Access Points are all controlled, preventing signal and channel conflicts
• Residents have access to their network across the property
• Residents have full technical support for their wireless devices
#MAX17
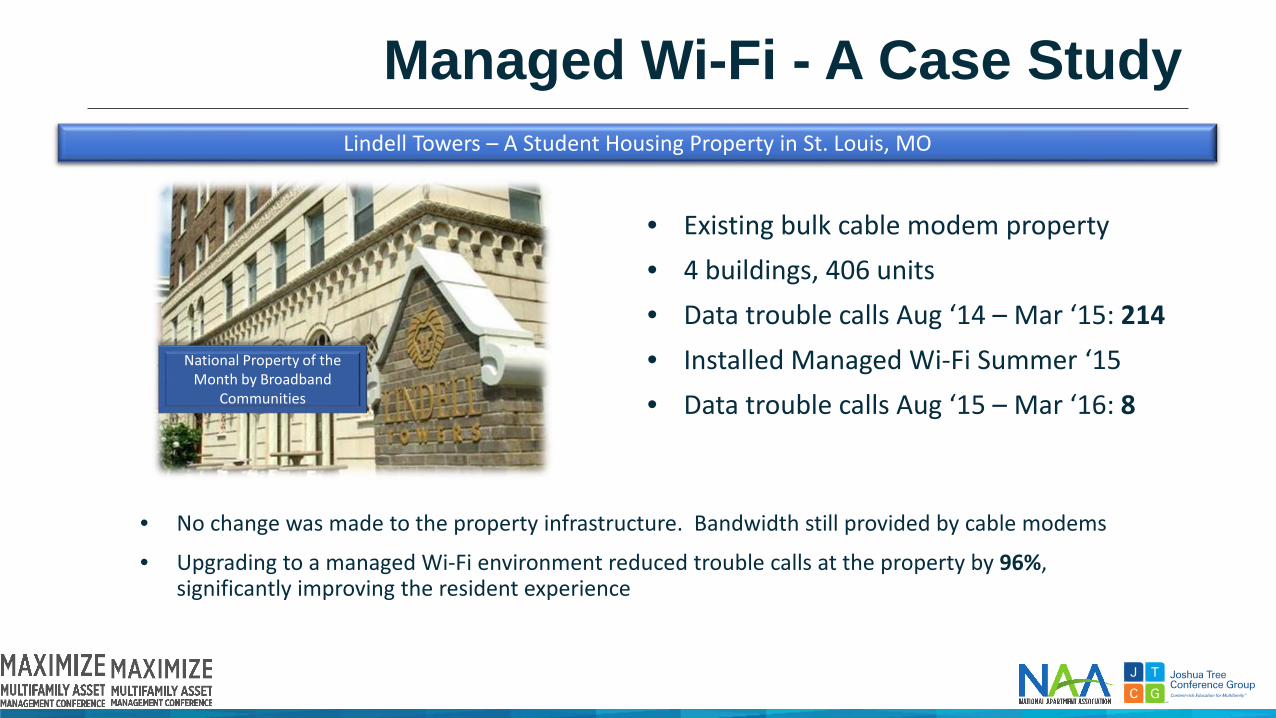
Lindell Towers – A Student Housing Property in St. Louis, MO
• Existing bulk cable modem property• 4 buildings, 406 units• Data trouble calls Aug ‘14 – Mar ‘15: 214• Installed Managed Wi-Fi Summer ‘15• Data trouble calls Aug ‘15 – Mar ‘16: 8
National Property of the Month by Broadband
Communities
Managed Wi-Fi - A Case Study
• No change was made to the property infrastructure. Bandwidth still provided by cable modems
• Upgrading to a managed Wi-Fi environment reduced trouble calls at the property by 96%, significantly improving the resident experience
#MAX17
Verdict: All Wi-Fi is Not Created Equal
#MAX17
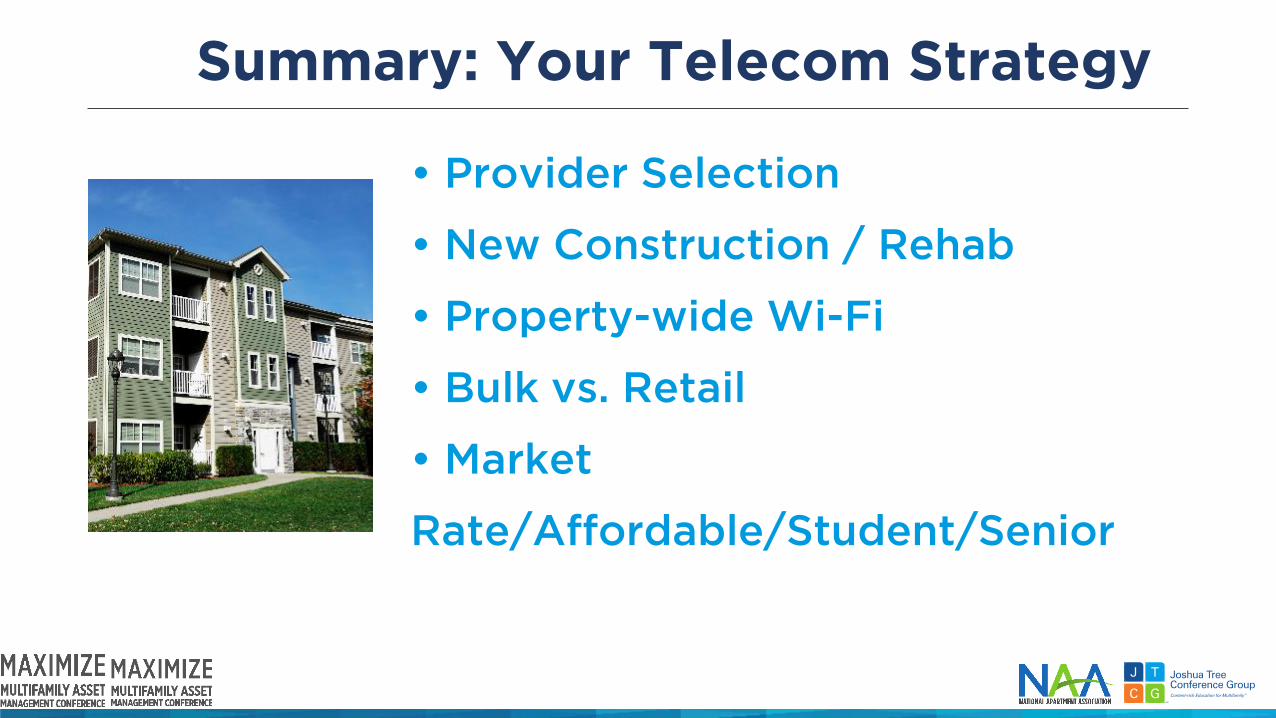
Summary: Your Telecom Strategy
• Provider Selection
• New Construction / Rehab
• Property-wide Wi-Fi
• Bulk vs. Retail
• Market
Rate/Affordable/Student/Senior
#MAX17
Questions?

#MAX17
Mike [email protected]
Jesse [email protected]
Matt Wootton [email protected]
Barney [email protected]
Contact Us