Embed Size (px)
Citation preview

MPRAMunich Personal RePEc Archive
Technology intensity of Indianmerchandise exports
Sanchita Mukherjee
Centre For Development Studies, Trivandrum, India
April 2009
Online at http://mpra.ub.uni-muenchen.de/35694/MPRA Paper No. 35694, posted 2. January 2012 21:30 UTC

1
Technology Intensity of Indian Merchandise Exports
Sanchita Mukherjee
Abstract
In the light of substantive improvement in the India’s export performance, this paper examines whether our exports have diversified to more technology intensive products. The analysis is focused mainly on merchandise export of India in the post liberalised period. The classification of merchandise export according to their technology intensity is based on OECD classification for the same. The analysis is done at 2-digit level for all commodities and at 3-digit level for some selected commodities. The study reveals that, India’s Export is dominated by medium-low technology intensive commodities. Export of low technology intensive is still prominent, while medium-high technology is showing signs of improvement, especially in recent periods. India has still to go long way, before making a mark in export of high technology intensive commodities.
1 Introduction It is well-known that India has followed export pessimistic trade policies from the initial years of planning till the economic reforms initiated in 1990s. The process of reforms has raised the expectations on India’s trade performance. It has been argued that in the liberalised open market regime, India’s competitive advantage has increased (Dholakia and Kapur, 2004). This has led to an improvement in India’s export performance in the post-reform period. The total value of India’s merchandise exports has increased from US$ 1.3 billion in 1950-51 to US$ 63.8 billion in 2003-04 with a compound annual growth rate of 7.6 per cent. The higher growth in exports as compared to Gross Domestic Product (GDP) has resulted in increase of export to GDP ratio. Exports of manufactured products accounted for 56 per cent of the manufacturing GDP originating from the manufacturing sector in 2003-04, as against 27 per cent in 1990-91, revealing the growing significance of exports as a major constituent of demand. Exports of manufactures in the post-reform period indeed played a “lead” role rather than being led by domestic output growth (Mallik, 2005). India’s IT-BPO exports have also achieved a spectacular growth in recent years. As per the NASSCOM’s data, the software and ITES (Information Technology Enabled Services) exports from India have grown from Rs. 58,240 crore in 2003-04 to Rs. 103,200 crore in 2005-06.
In light of the above facts, it would be interesting to find out whether change in volume of India’s export has brought out any change to its components. The main objective of this study is to analyse India’s export in terms of its composition. The study begins with a brief review of India’s export performance during both the pre- and post-liberalisation period. This is followed by a detailed literature review on the issue of determinants of India’s export growth and composition of India’s export. We have used Dummy variable regression technique to analyse the composition of the India’s export. The findings have been discussed in the last section.
2 India’s Overall Export Performance
2.1 Pre-liberalisation Performance
Exports were largely neglected during the first and second Five Year Plans (FYP). The justification given behind it was inelasticity of Indian exports. In 1950s, world merchandise
2
export grew at 6.3 per cent annually, while Indian exports were stagnated. World merchandise export expanded further to 8.8 per cent in 1960s, whereas India’s merchandise export improved somewhat and grew at 3.6 per cent annually during the same period. Hence, it is obvious that India failed to make the best use of trade possibilities available in the1950s and 1960s. The share of India in world exports declined sharply from 1.4 per cent during the 1950s to 0.9 per cent during the 1960s (Veeramani, 2007). Since then various implicit and explicit measures of export promotion have been adopted to overcome the adverse effects of overvalued exchange rate and government policies prevailed for export.
In the 1970s, world export grew at very high rate of 20.7 per cent annually. Buoyancy of world demand and a relatively favourable domestic policy provided an atmosphere conducive to a rapid growth of exports from India. Thus, India’s exports of merchandise and services grew at the annual rate of about 18 per cent and 27 per cent respectively during the 1970s (Veeramani, 2007). According to Joshi and Little (1994), high export growth in the 1970s was mainly due to depreciation of Real Effective Exchange Rate (REER), provision of export subsidy, a relatively liberal import policy for export production along with buoyant world demand. Despite the high growth, India’s share in world merchandise exports declined to 0.5 per cent during the 1970s from 0.9 per cent during the 1960s. This is attributed to the fact that the growth rate of world exports remained higher than that of India during the 1970s.
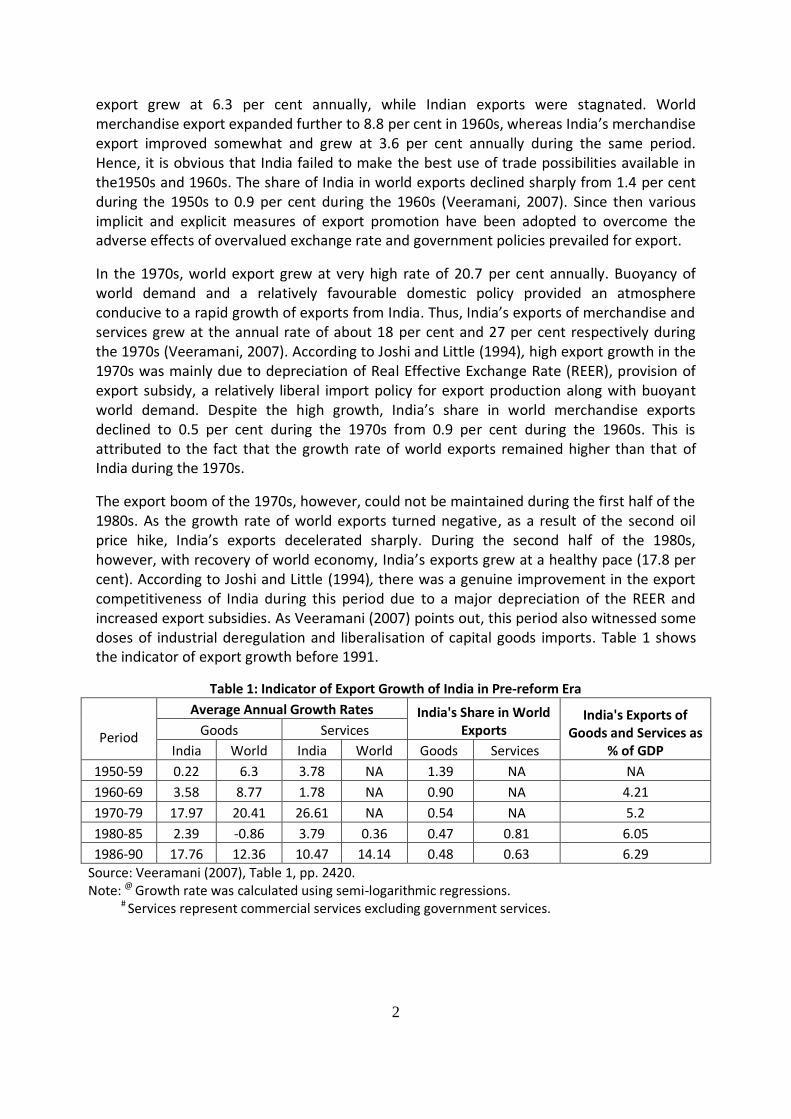
The export boom of the 1970s, however, could not be maintained during the first half of the 1980s. As the growth rate of world exports turned negative, as a result of the second oil price hike, India’s exports decelerated sharply. During the second half of the 1980s, however, with recovery of world economy, India’s exports grew at a healthy pace (17.8 per cent). According to Joshi and Little (1994), there was a genuine improvement in the export competitiveness of India during this period due to a major depreciation of the REER and increased export subsidies. As Veeramani (2007) points out, this period also witnessed some doses of industrial deregulation and liberalisation of capital goods imports. Table 1 shows the indicator of export growth before 1991.
Table 1: Indicator of Export Growth of India in Pre-reform Era
Period
Average Annual Growth Rates India's Share in World Exports
India's Exports of Goods and Services as
% of GDP
Goods Services
India World India World Goods Services
1950-59 0.22 6.3 3.78 NA 1.39 NA NA
1960-69 3.58 8.77 1.78 NA 0.90 NA 4.21
1970-79 17.97 20.41 26.61 NA 0.54 NA 5.2
1980-85 2.39 -0.86 3.79 0.36 0.47 0.81 6.05
1986-90 17.76 12.36 10.47 14.14 0.48 0.63 6.29
Source: Veeramani (2007), Table 1, pp. 2420. Note: @ Growth rate was calculated using semi-logarithmic regressions. # Services represent commercial services excluding government services.
3
2.2 Post-liberalisation Trend
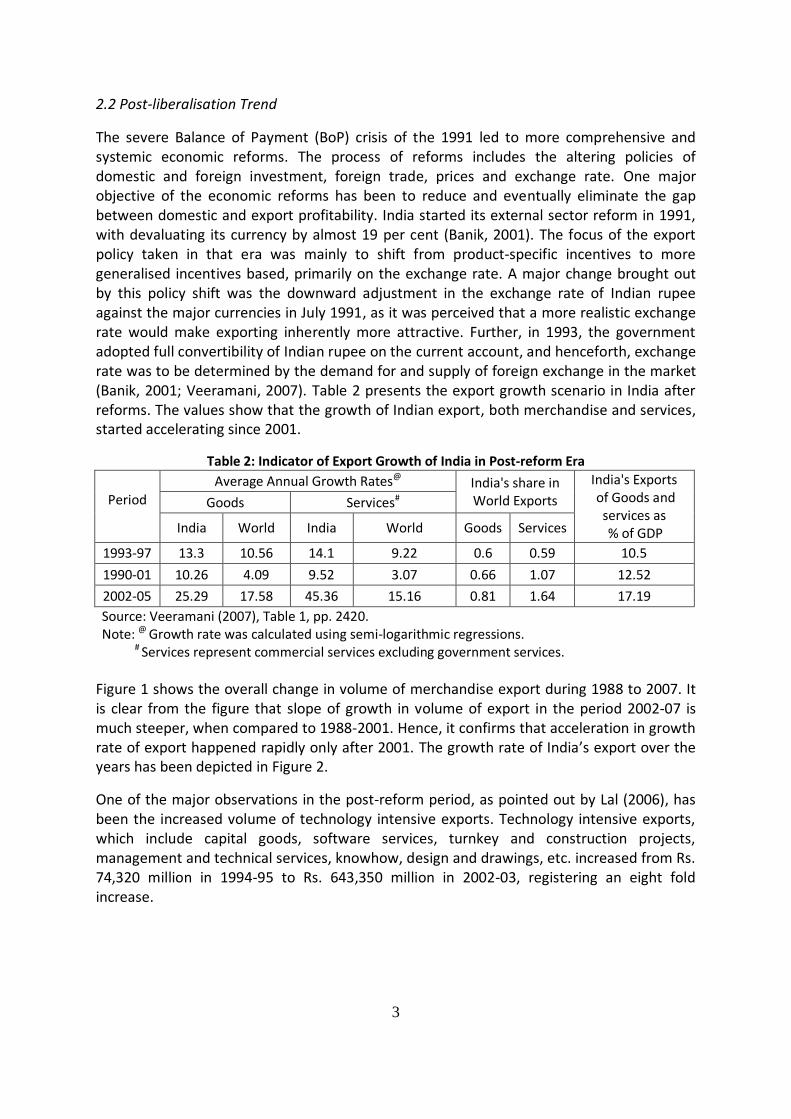
The severe Balance of Payment (BoP) crisis of the 1991 led to more comprehensive and systemic economic reforms. The process of reforms includes the altering policies of domestic and foreign investment, foreign trade, prices and exchange rate. One major objective of the economic reforms has been to reduce and eventually eliminate the gap between domestic and export profitability. India started its external sector reform in 1991, with devaluating its currency by almost 19 per cent (Banik, 2001). The focus of the export policy taken in that era was mainly to shift from product-specific incentives to more generalised incentives based, primarily on the exchange rate. A major change brought out by this policy shift was the downward adjustment in the exchange rate of Indian rupee against the major currencies in July 1991, as it was perceived that a more realistic exchange rate would make exporting inherently more attractive. Further, in 1993, the government adopted full convertibility of Indian rupee on the current account, and henceforth, exchange rate was to be determined by the demand for and supply of foreign exchange in the market (Banik, 2001; Veeramani, 2007). Table 2 presents the export growth scenario in India after reforms. The values show that the growth of Indian export, both merchandise and services, started accelerating since 2001.
Table 2: Indicator of Export Growth of India in Post-reform Era
Period
Average Annual Growth Rates@ India's share in World Exports
India's Exports of Goods and
services as % of GDP
Goods Services#
India World India World Goods Services
1993-97 13.3 10.56 14.1 9.22 0.6 0.59 10.5
1990-01 10.26 4.09 9.52 3.07 0.66 1.07 12.52
2002-05 25.29 17.58 45.36 15.16 0.81 1.64 17.19
Source: Veeramani (2007), Table 1, pp. 2420. Note: @ Growth rate was calculated using semi-logarithmic regressions. # Services represent commercial services excluding government services.
Figure 1 shows the overall change in volume of merchandise export during 1988 to 2007. It is clear from the figure that slope of growth in volume of export in the period 2002-07 is much steeper, when compared to 1988-2001. Hence, it confirms that acceleration in growth rate of export happened rapidly only after 2001. The growth rate of India’s export over the years has been depicted in Figure 2.
One of the major observations in the post-reform period, as pointed out by Lal (2006), has been the increased volume of technology intensive exports. Technology intensive exports, which include capital goods, software services, turnkey and construction projects, management and technical services, knowhow, design and drawings, etc. increased from Rs. 74,320 million in 1994-95 to Rs. 643,350 million in 2002-03, registering an eight fold increase.

4
Figure 1: Export Performance of India over the Year (US$ billions) Source: WITS and UNCOMTRAD
Figure 2: Annual Export Growth Rate of India Source: WITS and UNCOMTRADE
-10.00%
-5.00%
0.00%
5.00%
10.00%
15.00%
20.00%
25.00%
30.00%

5
3 Literature Review
Out of the voluminous literature on various issues relating to India’s exports, in this section we will limit our review to two issues: determinants of India’s exports growth and composition of India’s exports.
3.1 Determinants of India’s Export Growth
There are many literatures trying to figure out the factors fuelling acceleration of India’s export growth. Some literature brings out the significance of demand side factor compared to supply side. According to Roy (2007) demand factors are found to be more predominant in explaining India’s export performance at the disaggregate level during 1960-1999, while export price is the only significant supply factor. Banik (2001) also stress on the impact of demand-side factors on India’s export performance rather than supply-side bottlenecks.
Dholakia and Kapur (2004), analysing the determinants of export performance of Indian firm using ‘Tobit Model’, showed that improved export level depends positively on number of variables such as firm size, liberalisation of imports, risk taken by firm, comparative advantage towards capital intensive production, product development, profitability and sales. They also found that advertisement expenditure does not play any significant role in liberalised regime. Kumar and Pradhan (2007) found that the relationship between firm size and export behaviour is non-linear and represented by an inverted U-shaped curve. They also pointed out that outward investment and innovative activities influences export competitiveness of a firm. Lall and Kumar (1981) and Lall (1986) observed negative influence of R&D expenditure in the Indian engineering and chemical firms on their export behaviour. Studies by Dholakia and Kapur (1999) and Goldar and Banga (1999), for Indian firms, found a positive relationship between technology imports and export performance. The role played by import intensity in determining the export performance of firms is, as observed from the studies on the same country, however, controversial. For instance, while Pant (1993), EXIM (1996) and Dholakia and Kapur (1999) found positive influence, Siddharthan (1989) and Patibandla (1992) found a negative relationship between import intensity and firm level export performance in India.
Srinivasan (1997) has stressed on the importance of trade openness for rapid growth of export. The same conclusion has also derived from Singh (1964). Malik (2005) and Marjit et al. (2000) discards the effect of exchange rate on India’s export.
Another study by Veeramani (2007), attempting to investigate the sources of India’s export growth during the pre- and post-reform periods, showed that the pace of India’s export growth has been distinctly high in the post-reform period, and it have been growing at a faster rate than the rate of growth of world export in contrast to pre-reform period. However, acceleration of India’s export growth was prominent since 2002. This acceleration was mainly driven by a buoyant world economy. Competitiveness effect has been found to be positive throughout the post-reform period. He also emphasises that India’s export have been adversely affected by the appreciation of REER in post-reform period.
Investigating India’s export specialisation in IT services, Nagraj (2008) draws out the importance of policy choices along with fuller utilisation of India’s stock of technical and

6
scientific manpower. The reforms of 1990s slashed the tariffs on hardware across the board without correcting for the inverted duty structure. As a result, India was able to utilise its low cost engineering skills to produce software services for export, though the country lost an opportunity to create an efficient hardware industry.
Meyer (2007) explains that the rise of India’s IT industry draws its success on India’s supply of well-educated, English-speaking and affordable workers. Although this alone cannot explain India’s export specialisation in IT services. The study points out two significant observations: Firstly, India makes extensive use of the off-shoring model by which Western firms relocate part of their production to low-wage countries. However, the presence of off-shoring is not enough as an explanation. Secondly, the specialisation in IT services comes – at least partly – at the expense of other high-tech manufacturing exports, and this is confirmed by the analysis of the study. Figure 3, adopted from Meyer (2007), shows India’s comparative advantage in IT sector exports.
Figure 3: Share of Computer and ITES and other Business Services in total Exports (average of 2000-05; in per cent) Source: Meyer (2007).
3.2 Composition of India’s Export
Studies on composition of India’s export reveal that labour intensive commodities still dominate country’s export basket. There have not been any dynamic changes in the export structure even after liberalisation (Lall, 1999; Aggarwal, 2001). Analysing export competitiveness at 3-digit SITC level, Tendulkar (2000) showed that India had sustained presence only in certain labour-intensive products.
According to Paulino (2008) India portrays significant shares of primary product and medium-technology manufactured exports. However, the proportion of primary products’ exports (mostly foodstuff) has decreased by around 50 per cent during the last decade. There has also been a compositional shift from low technology to medium technology manufactures.
0 5 10 15 20 25
Sudan
Russia
China
Japan
germany
united States
Finland
Egypt
Ireland
India
Isarael
cyprus
Share of Computers and ITES in Total Exports

7
Kumar and Siddarthan (1997) and Siddarthan (1999) have also emphasised on the fact that the share of exports of high-tech goods is small in India. These studies have shown that less developed countries enjoyed a competitive edge only in medium- and low-tech industries due to many factors, such as unaffiliated licensees and high transaction costs.
Aggarwal (2001), using a ‘Tobit Model’ analysis of Indian export firms and classifying the firms into high-tech, medium-high tech, medium-low tech and low-tech based on the OECD classification of manufacturing industries, shows two important implications: First, it appears that the economy is not fully integrated with the global economy and that the existing industrial and technological capabilities need reorientation to attract efficiency seeking FDI, i.e. high-tech industries are not attracting efficiency seeking FDI as had been expected. In medium-high tech sectors, the performance is somewhat better. However, even in this group the results are not robust. Second, India’s competitive advantages still lie in low-tech sectors.
Kumar and Pradhan (2007) have also shown that Indian manufacturing has not changed significantly with three-fifths of manufacturing value added still contributed by low- and medium-low technology intensive industries.
According to Meyer (2007), India’s prominent position as an offshore hub for IT and IT-based business services does not translate into a general specialisation in sophisticated products. In fact, India’s share of high-technology manufacturing exports is markedly below than that of other countries. Only 2.8 per cent of India’s total exports are classified as high technology. Figure 4, adopted from Meyer (2007), clearly shows that India has bias for IT, but not high-tech exports.
Figure 4: Share of IT and HT Exports in total Exports during 2000-05 (per cent) Source: Meyer (2007).
0 10 20 30 40 50 60
Sudan
Norway
Portugal
Egypt
India
Cyprus
China
Japan
United States
Finland
United Kingdom
Isarel
Ireland
Phillipines
Share of IT Share of HT

8
Based on the above facts, we analyse the composition of India’s merchandise export and try to find out if there has been any change in composition of export in terms of technology component after the economic liberalisation. This has been done in two steps: first, looking at the shares of different commodity groups in total exports and the growth rate of exports by 2-digit industries, and second, we have employed dummy variable regression technique to examine the statistical significance of change in composition of exports. We have followed the OECD guidelines for classifying industries on the basis of technology intensity. However, we limit our study only for merchandise export. This is because for services exports it is difficult to separate out and define technology intensive components. Even in IT sector, many jobs are labour intensive. And also disaggregated level data on all the components of services is not available for the timeline considered in this study.
4 Technology Composition of India’s Merchandise Export 4.1 Data and Classification For the analysis of this chapter we have collected export data available from WITS- UNCOMTRADE according to SITC, Revision-3 classification. We have classified the industries according to OECD classification of manufacturing industries (OECD Science, Technology and Industry Scoreboard, 2007). This list is prepared based on sectoral approach, which was adopted in 1994 which is prepared at an aggregated level. A more disaggregated list is available, according to product approach, based on SITC, Rev-3. However, that list is solely concerned with products in the high technology category (Hatzichronoglou, 1997). But this study is based on comparisons between the categories of high-tech, medium-high tech, medium-low tech and low-tech, and hence, we are unable to use that list. The technology classification of industries is given in Table 3.
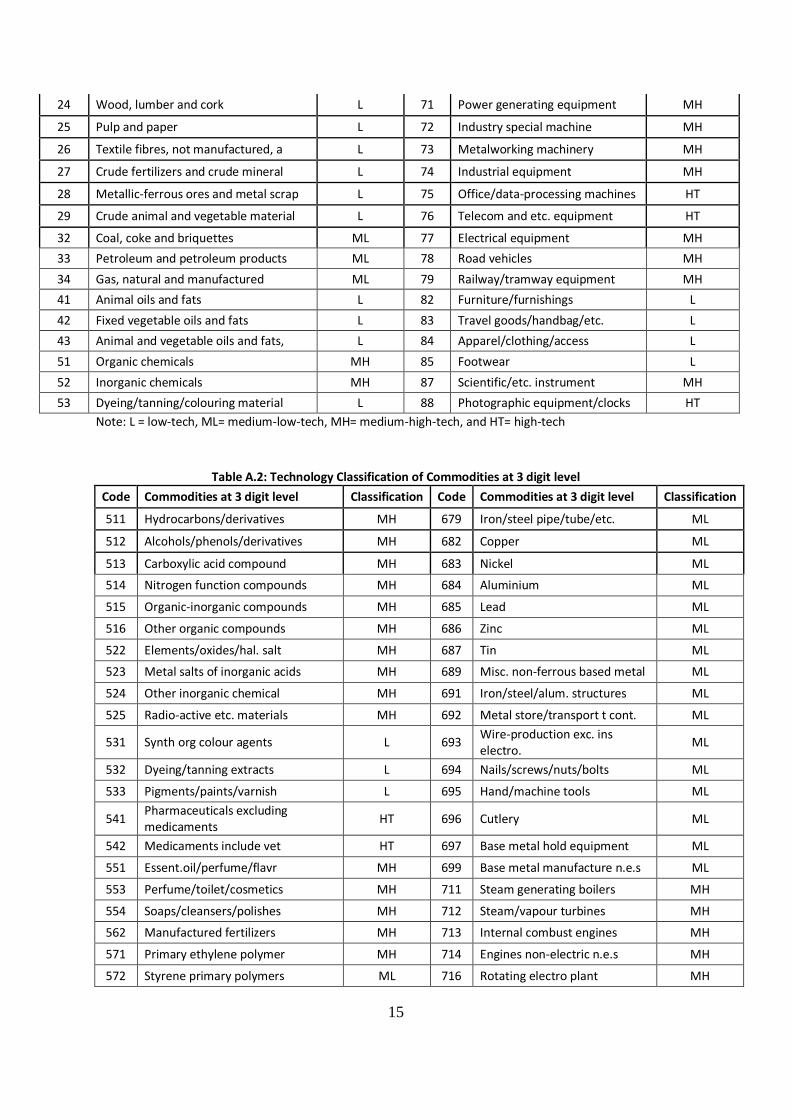
The analysis is done first at 2-digit level disaggregated commodities. These commodities are grouped into low-technology intensive, medium-low technology intensive, medium-high intensive technology intensive and high-technology intensive industries, following the OECD guideline. However, ‘goods not classified by not any kind’ (SITC, Rev3- Code 9) has not been included, as it can’t be grouped and also its average annual share in total export is very less (3.54 per cent). (The classification of commodities at 2-digit and 3-digit level is provided in appendix (Table-A.1 and Table-A.2)
For further analysis, we have considered 3-digit level disaggregated data for few selected commodities: chemicals (SITC, Rev3- Code-5), manufactured goods (SITC, Rev3- Code-6) and machinery & transport equipment (SITC, Rev3- Code-7). These chemicals and machinery & transport equipment includes large number of high-technology and medium-high technology intensive commodities. Manufactured goods constitute of medium-low and low-technology intensive commodities, but this has the highest share (73.76 per cent).
4.2 Methodology In this section we have employed dummy variable regression technique to find the statistical significance of the results observed in the previous section. We have examined the average annual share of commodity groups, average annual growth rate of export commodities and average annual growth of shares. For annual share of commodity, we have computed the mean. However, for growth rate and growth of share we have computed

9
median as the data set is much skewed, because of less number of observations of high technology intensive commodities. Therefore, the use of mean may not be appropriate in this case. In a dummy variable regression without constant, coefficients give the mean and median (taking anti-log of the coefficients) for a semi-log model. The model used for estimation is specified below:
eDbDbDbDbY 44332211 Where,
Y = ‘average annual share of commodity groups’ or ‘average annual growth rate’ or ‘average annual growth of shares’ b1, b2, b3 and b4 are ‘coefficients’ of the regression model D1, D2, D3 and D4 are ‘dummies’, which take values- D1= 1, if high technology (HT); 0 otherwise D2= 1, if medium-high technology (MH); 0 otherwise D3= 1, if medium-low technology (ML); 0 otherwise D4= 1, if low technology (LT); 0 otherwise e= the usual ‘residual term’
Table 3: OECD Classification of Manufacturing Industries based on Technology
High-technology Industries
Aircraft and spacecraft
Pharmaceuticals
Office, accounting and computing machinery
Radio, TV and communications equipment
Medical, precision and optical instruments Medium-high Technology Industries
Electrical machinery and apparatus, nec.
Motor vehicles, trailers and semitrailers
Chemicals excluding pharmaceuticals
Railroad equipment and transport equip, nec.
Machinery and equipment, nec. Medium-low Technology Industries
Building and repairing of ships and boats
Rubber and plastics products
Coke, petroleum products and nuclear fuel
Other non-metallic mineral products
Basic metals and fabricated metal products
Low-technology Industries
Manufacturing, nec., Recycling
Wood, pulp, paper, paper products, etc
Food products, beverages and tobacco
Textiles, textile products, leather and footwear

10
Table 5: Regression Results for 2-digit level disaggregation Variable Period HT MH ML LT N R2
Share (mean) Overall 0.9 (1.36)
1.1 (0.88)
3.2*** (0.95)
1.5*** (0.52)
60 0.28
I 0.8 (1.57)
1.0 (0.98)
2.7** (1.07)
1.7** (0.59)
60 0.26
II 1.0 (1.22)
1.3** (0.79)
3.7*** (0.86)
1.3*** (0.47)
60 0.34
Growth (median) Overall 18.2*** (0.60)
20.1*** (0.39)
44.7*** (0.43)
30.0*** (0.23)
60 0.86
I 18.2*** (0.65)
16.4*** (0.42)
49.4*** (0.46)
24.5*** (0.26)
59 0.85
II 13.5*** (0.55)
24.5*** (0.36)
33.1*** (0.39)
30.0*** (0.21)
60 0.88
Growth in Shares (median)
Overall 3.0 (0.94)
4.1*** (0.57)
22.2*** (0.63)
22.2*** (0.41)
45 0.69
I 5.5*** (0.83)
5.5*** (0.59)
22.2*** (0.59)
30.0*** (0.42)
45 0.72
II 1.8 (0.98)
4.5*** (0.56)
24.5*** (0.76)
24.5*** (0.40)
35 0.74
Note: The values in parenthesis are standard error. ***, **, * significant at 1%, 5% and 10% level of significance respectively.
Estimation of the specified model has been done for the entire post-liberalisation period (1992-2007) as well as for the two sub-periods- Period-I: 1992 to 2001 and Period-II: 2002 to 2007 at both the 2-digit and 3-digit level of disaggregation. 4.3 Results of Regression Analysis The findings of the regression estimates for the 2-digit and 3-digit levels disaggregated commodities are presented in Table 5 and Table 6 respectively. From Table 5 it is obvious that at the 2-digit level disaggregation medium-low technology commodities have the highest share, while that of high-technology and medium-high technology commodities are statistically insignificant, for the first period. However, in the second period, although the share is still dominated by medium-low technology commodities but there have been noticeable improvement in the share of medium-high technology commodities. In terms of growth, again medium-low technology group takes the limelight in both periods, but significant increase can be noticed in case of medium-high technology group, as well as marginal improvement in case of low-technology group. While median growth in share is highest for medium-low technology group and low-technology group, it is insignificant in case of high-technology group in the second period. At the 3-digit level disaggregation, low-technology group has the highest share followed by medium-low technology group, while others are insignificant. In second period, share of low-technology group declines, while that of medium-low technology group and medium-high technology group marginally improves. The share of high-technology group still remains insignificant.

11
Table 6: Regression Results for 3-digit level disaggregation
Variable Period HT MH ML LT N R2
Share (Mean) Overall 0.67 (0.72)
0.37 (0.29)
1.03*** (0.34)
1.40*** (0.52)
133 0.12
I 0.63 (0.79)
0.32 (0.31)
1.00** (0.38)
1.61*** (0.57)
133 0.11
II 0.71 (0.61)
0.44* (0.25)
1.07*** (0.30)
1.04** (0.44)
133 0.15
Growth (Median) Overall 26.6*** (0.26)
25.8*** (0.10)
38.5*** (0.12)
13.2*** (0.19)
133 0.94
I 23.1*** (0.33)
20.9*** (0.13)
34.8*** (0.16)
13.3*** (0.24)
132 0.91
II 26.0*** (0.22)
26.8*** (0.08)
36.2*** (0.10)
14.6*** (0.15)
133 0.96
Growth in Shares (Median)
Overall 9.3*** (0.46)
9.0*** (0.19)
15.5*** (0.22)
6.0*** (0.46)
110 0.76
I 20.3*** (0.62)
11.2*** (0.24)
14.3*** (0.26)
5.3*** (0.46)
108 0.70
II 9.9*** (0.62)
7.5*** (0.23)
11.5*** (0.27)
1.0 (0.62)
90
0.67
Note: The values in parenthesis are standard error. ***, **, * significant at 1%, 5% and 10% level of significance respectively.
Growth has been found to be highest for medium-low technology group followed by medium-high technology and high-technology groups. In the second period, marginal increase can be noticed for all the groups. In case of growth in share, medium-low technology group is leading, while low-technology group is the lowest. There has been decline in growth in share for all categories in the second period, with low-technology group having the lowest. Conclusion
The findings of this study suggest that the composition of India’s export has not yet changed in favour of technology intensive commodities. Medium-low technology intensive commodities are leading the share, while medium-high technology commodities are showing signs of improvement. Export performance of high-technology intensive products is still poor, as its share is still insignificant. Low-technology intensive commodities still have prominent share in India’s export. However, in case of the 3-digit classification growth rate and share of growth of low-technology intensive goods are lowest among all the categories. These results are consistent with earlier findings (Aggarwal, 2001; Kumar and Pradhan, 2007; Kumar and Siddarthan, 1997; Siddarthan, 1999; Meyer, 2007; Paulino, 2008; and Tendulkar, 2000).
The observed trend may be explained by the fact that India still has comparative advantage in labour intensive products. Veeramani (2007) has computed comparative advantage effect and found that India has comparative advantage in food items, certain type of crude

12
materials, textiles, leather and rubber products, footwear, and travel goods. All these commodities fall in the category of either low-technology or medium-low technology, and hence, are labour intensive. Veeramani also showed that India has least comparative advantage in machinery & transport equipment industries, which comes under the medium-high and high-technology category. Hence, to conclude, although India’s export performance has improved consistently over the period since liberalisation, but it still has to go a long way before making a mark in export of high-technology intensive commodities.
References
Aggarwal, A. (2001), “Liberalisation, Multinational Enterprises and Export Performance: Evidence from Indian Manufacturing”, Indian Council for Research on International Economic Relations.
Banik, N. (2001), “An Analysis of India’s Exports during 1990s”, Economic and Political
Weekly, 36(44): pp. 4222-30. Dholakia, R. H. And D. Kapur (2004), “Determinants of Export Performance of Indian Firms-
A Strategic Perspective”, IIMA Working Paper No. 2004/08/01, Indian Institute of Management, Ahmadabad.
Dholakia, R. H. and D. Kapur (1999), “Trade, Technology and Wage Effects of the Economic
Policy Reforms on the Indian Private Corporate Sector”, The Indian Journal of Labour Economics, 42(4): pp. 981-92.
EXIM (1996), “Export and Import Performance: A Firm Level Survey of Companies assisted
by Export-Import Bank of India – 1992-1995”, Occasional Paper No. 45. Goldar, B. and R. Banga (1999), “Changing Export Orientation of Indian Industrial Firms,
1990-91 to 1996-97”, Institute of Economic Growth, New Delhi. Hatzichronoglou, T. (1997), "Revision of the High-Technology Sector and Product
Classification", OECD Science, Technology and Industry Working Papers, No. 1997/2, OECD Publishing.
Joshi, V. and I. M. D. Little (1994), “India: Macroeconomics and Political Economy, 1964-
1991”, World Bank and Oxford University Press, Washington DC and New Delhi. Kumar, N. and J. P. Pradhan (2007), “Knowledge-based Exports from India: Recent Trends,
Patterns and Implications”, in N. Kumar and K. J. Joseph (Ed), International Competitiveness and Knowledge-based Industries in India, Oxford University Press, New Delhi.
Kumar, N. and J. P. Pradhan (2007), “Knowledge-based Exports from India: A Firm-level
Analysis of Determinants”, in N. Kumar and K. J. Joseph (Ed), International

13
Competitiveness and Knowledge-based Industries in India, Oxford University Press, New Delhi.
Kumar, N. and N. S. Siddharthan (1997), “Technology, Market Structure and
Internationalisation”, Routledge, New York and London. Lal, M. (2006), “Technology Exports’- Capabilities and Competitiveness”, IIFT, Science Tech
Entrepreneur. Lall, S. (1999), “India’s Manufactured Exports: Comparative Structure and Prospects”, World
Development, 27(10): pp. 1769-86. Lall, S. and R. Kumar (1981), “Firm-Level Export Performance in an Inward Looking
Economy: The Indian Engineering Industry”, World Development, 9(5): pp. 453-63. Lall, S. (1986), “Technological Development and Export Performance in LDCs: Leading
Engineering and Chemical Firms in India”, Review of World Economics, 122(1): 80-92. Mallik, J. K. (2005), “India’s Exports Policy Defeating Exchange Rate Arithmetic”, Economic
and Political Weekly, 40(52): pp. 5486-96. Marcato, G. and L. Malfi (2007), “Testing the OECD Classification of Manufacturing
Industries based on Technology”, available at www.decon.unipd.it/personale/curri/marcato/testing-OECD.pdf
Marjit, S., B. Dasgupta and S. Mitra (2000), “Currency Devaluation and Exports: Separating
Actual from Statistical”, Economic and Political Weekly, 35(18): pp. 1553-58. Meyer, T. (2007), “India’s Specialisation in IT Exports Off-shoring can’t defy Gravity”,
Working Paper 27, Deutsche Bank Research. Nagraj, R. (2008), “India’s Recent Economic Growth: a Closer Look”, Economic and Political
Weekly, 53(14): pp. 55-61. OECD Science, Technology and Industry Scoreboard, 2007. Pant, M. (1993), “Export Performance, Transnational Corporations and the Manufacturing
Sector: A Case Study of India”, Indian Economic Review, 28(1): pp. 41-54. Patibandla, M. (1992), “Scale Economies and Exports in an Import Substituting Regime-
Some Observations for Indian Industry”, Economic and Political Weekly, 27(9): pp. M24-30.
Paulino, A. and U. Santos (2008), “Export Productivity and Specialization in China, Brazil,
India and South Africa”, Research Paper 2008/28, World Institute for Development of Economics Research.

14
Siddarthan, N. S. (1999), “WTO and Globalisation of Enterprises”, Economic and Political
Weekly, 34(21): pp. 1287-91. Siddharthan, N. S. (1989), “Impact of Import Liberalization on Export Intensities: Study of
the Indian Private Corporate Sector”, The Indian Economic Journal, 37: pp. 103-11. Singh, M. (1964), “India’s Export Trends”, Oxford: Clarendon Press. Roy, S. S. (2007), “Demand and Supply Factors in the Determination of India’s Disaggregated
Manufactured Exports: A Simultaneously Error-Correction Approach”, CDS Working Paper 383, Centre for Development Studies.
Srinivasan, T.N., (1997): “India’s Export Performance: A Comparative Analysis”, SCID
Working Paper 5, January. Tendulkar, S. D. (2000), “Indian Export and Economic Growth Performance in Asian
Perspective”, Working Paper no.54, December, Indian Council of Research on International Economic Relations, New Delhi.
Veeramani, C. (2007), “Sources of India’s Export Growth in Pre- and Post-Reform periods”,
Economic and Political Weekly, 42(25): pp. 2419-27. Appendix
Table A.1: Technology Classification of Commodities at 2 digit level
Code Commodities at 2 digit level Classification Code Commodities at 2 digit level Classification
0 Live animals L 54 Pharmaceutical products HT
1 Meat and meat preparations L 55 Perfume/cosmetic/cleanser MH
2 Dairy products and eggs L 56 Manufactured fertilizers MH
3 Fish and fish preparations L 57 Plastics in primary form ML
4 Cereals and cereal preparations L 58 Plastics non-primary form ML
5 Fruit and vegetables L 59 Chemical material/products MH
6 Sugar, sugar preparations and honey L 61 Leather manufactures L
7 Coffee, tea, cocoa, spices & manufactures
L 62 Rubber manufactures ML
8 Feed.-stuff for animals L 63 Cork/wood manufactures L
9 Miscellaneous food preparations L 64 Paper/paperboard/article L
11 Beverages L 65 Textile yarn/fabric/art. L
12 Tobacco and tobacco manufactures L 66 Non-metal mineral manuf. ML
21 Hides, skins and fur skins, undress L 67 Iron and steel ML
22 Oil-seeds, oil nuts and oil kernels L 68 Non-ferrous metals ML
23 Crude rubber including synthetic an L 69 Metal manufactures ML
15
24 Wood, lumber and cork L 71 Power generating equipment MH
25 Pulp and paper L 72 Industry special machine MH
26 Textile fibres, not manufactured, a L 73 Metalworking machinery MH
27 Crude fertilizers and crude mineral L 74 Industrial equipment MH
28 Metallic-ferrous ores and metal scrap L 75 Office/data-processing machines HT
29 Crude animal and vegetable material L 76 Telecom and etc. equipment HT
32 Coal, coke and briquettes ML 77 Electrical equipment MH
33 Petroleum and petroleum products ML 78 Road vehicles MH
34 Gas, natural and manufactured ML 79 Railway/tramway equipment MH
41 Animal oils and fats L 82 Furniture/furnishings L
42 Fixed vegetable oils and fats L 83 Travel goods/handbag/etc. L
43 Animal and vegetable oils and fats, L 84 Apparel/clothing/access L
51 Organic chemicals MH 85 Footwear L
52 Inorganic chemicals MH 87 Scientific/etc. instrument MH
53 Dyeing/tanning/colouring material L 88 Photographic equipment/clocks HT
Note: L = low-tech, ML= medium-low-tech, MH= medium-high-tech, and HT= high-tech
Table A.2: Technology Classification of Commodities at 3 digit level Code Commodities at 3 digit level Classification Code Commodities at 3 digit level Classification
511 Hydrocarbons/derivatives MH 679 Iron/steel pipe/tube/etc. ML
512 Alcohols/phenols/derivatives MH 682 Copper ML
513 Carboxylic acid compound MH 683 Nickel ML
514 Nitrogen function compounds MH 684 Aluminium ML
515 Organic-inorganic compounds MH 685 Lead ML
516 Other organic compounds MH 686 Zinc ML
522 Elements/oxides/hal. salt MH 687 Tin ML
523 Metal salts of inorganic acids MH 689 Misc. non-ferrous based metal ML
524 Other inorganic chemical MH 691 Iron/steel/alum. structures ML
525 Radio-active etc. materials MH 692 Metal store/transport t cont. ML
531 Synth org colour agents L 693 Wire-production exc. ins electro.
ML
532 Dyeing/tanning extracts L 694 Nails/screws/nuts/bolts ML
533 Pigments/paints/varnish L 695 Hand/machine tools ML
541 Pharmaceuticals excluding medicaments
HT 696 Cutlery ML
542 Medicaments include vet HT 697 Base metal hold equipment ML
551 Essent.oil/perfume/flavr MH 699 Base metal manufacture n.e.s ML
553 Perfume/toilet/cosmetics MH 711 Steam generating boilers MH
554 Soaps/cleansers/polishes MH 712 Steam/vapour turbines MH
562 Manufactured fertilizers MH 713 Internal combust engines MH
571 Primary ethylene polymer MH 714 Engines non-electric n.e.s MH
572 Styrene primary polymers ML 716 Rotating electro plant MH

16
573 Vinyl chloride etcpolym ML 718 Power generating equipment n.e.s
MH
574 Polyacetals/polyesters.. ML 721 Agriculture machine ex tractor MH
575 Plastic nes-primary form ML 722 Tractors MH
579 Plastic waste/scrap ML 723 Civil engineering plant MH
581 Plastic tube/pipe/hose ML 724 Textile/leather machinery MH
582 Plastic sheets/film/etc ML 725 Paper industry machinery MH
583 Monofilament rods/sticks ML 726 Printing industry machine MH
591 Household/garden chemical MH 727 Food processing machines MH
592 Starches/glues/etc. MH 728 Special industry machines MH
593 Explosives/pyrotechnics MH 731 Mach-tools remove materials MH
597 Oil etc additives/fluids MH 733 Mtl m-tools w/o mtl-rmvl. MH
598 Misc chemical prods n.e.s MH 735 Metal machine tool parts MH
611 Leather L 737 Metalworking machine n.e.s MH
612 Leather manufactures L 741 Industry heat/cool equipment MH
621 Materials of rubber ML 742 Pumps for liquids MH
625 Rubber tyres/treads ML 743 Fans/filters/gas pumps MH
629 Articles of rubber n.e.s ML 744 Mechanical handling equipment
MH
633 Cork manufactures L 745 Non-electrical machines n.e.s MH
634 Veneer/plywood/etc. L 746 Ball/roller bearings MH
635 Wood manufactures n.e.s. L 747 Taps/cocks/valves MH
641 Paper/paperboard L 748 Mech. transmission equipment MH
642 Cut paper/board/articles L 749 Non-electro parts/accessories/machines
MH
651 Textile yarn L 751 Office machines HT
652 Cotton fabrics, woven L 752 Computer equipment HT
653 Man-made woven fabrics L 759 Office equip. parts/accessories. HT
654 Woven textile fabric n.e.s L 761 Television receivers HT
655 Knit/crochet fabrics L 762 Radio broadcast receiver HT
656 Tulle/lace/embr./trim etc. L 763 Sound/TV /recorders etc. HT
657 Special yarns/fabrics L 764 Telecomm equipment n.e.s HT
658 Made-up textile articles L 771 Elect power transmission equip MH
659 Floor coverings etc. L 772 Electric circuit equipment MH
661 Lime/cement/construction material
ML 773 Electrical distrib. equipment MH
662 Clay/refractory material ML 774 Medical etc./ all diagnostic equipment
MH
663 Mineral manufactures n.e.s ML 775 Domestic equipment MH
664 Glass ML 776 Valves/transistors/etc. MH
665 Glassware ML 778 Electrical equipment n.e.s MH
666 Pottery ML 781 Passenger cars etc. MH
667 Pearls/precious stones ML 782 Goods/service vehicles MH

17
671 Pig iron etc. /ferrous alloy ML 783 Road motor vehicles n.e.s MH
672 Primary/prods iron/steel ML 784 Motor vehicle parts/access MH
673 Flat rolled iron/steel products ML 785 Motorcycles/cycles/etc. MH
674 Rolled plated m-steel ML 786 Trailers/caravans/etc. MH
675 Flat rolled alloy steel ML 791 Railway vehicles/equipment MH
676 Iron/steel bars/rods/etc. ML 792 Aircraft/spacecraft/etc. HT
677 Iron/steel railway materials ML 793 Ships/boats/etc. ML
678 Iron/steel wire ML
Note: L = low-tech, ML= medium-low-tech, MH= medium-high-tech, and HT= high-tech