Embed Size (px)
Citation preview
Technology And The Evolution of Credit
Christopher Rios | Director, Finance Operations
October 16, 2016
2
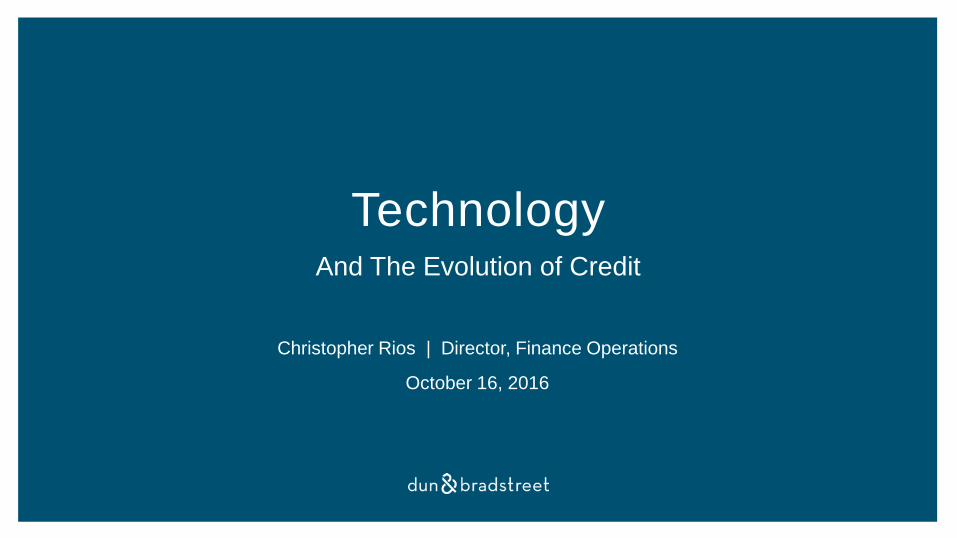
Today’s Conversation
EVOLUTION
TECHNOLOGY
MODELING AND ANALYTICS
SALES ENABLEMENT
GOVERNANCE
Changing Times
Efficiency and Scalability
Organizational Optimization
Creating Synergy
Oversight and Accountability
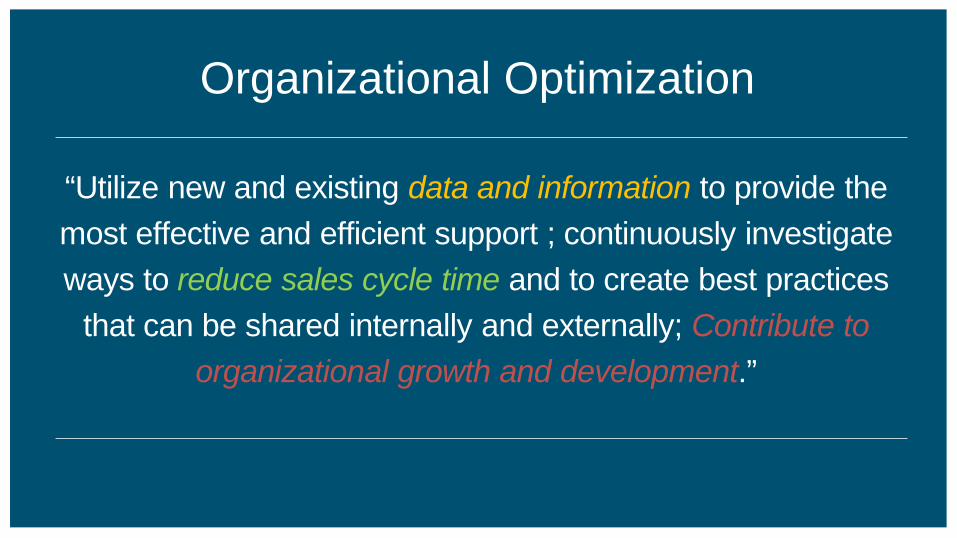
Organizational Optimization
“Utilize new and existing data and information to provide the most effective and efficient support ; continuously investigate ways to reduce sales cycle time and to create best practices
that can be shared internally and externally; Contribute to organizational growth and development.”
4
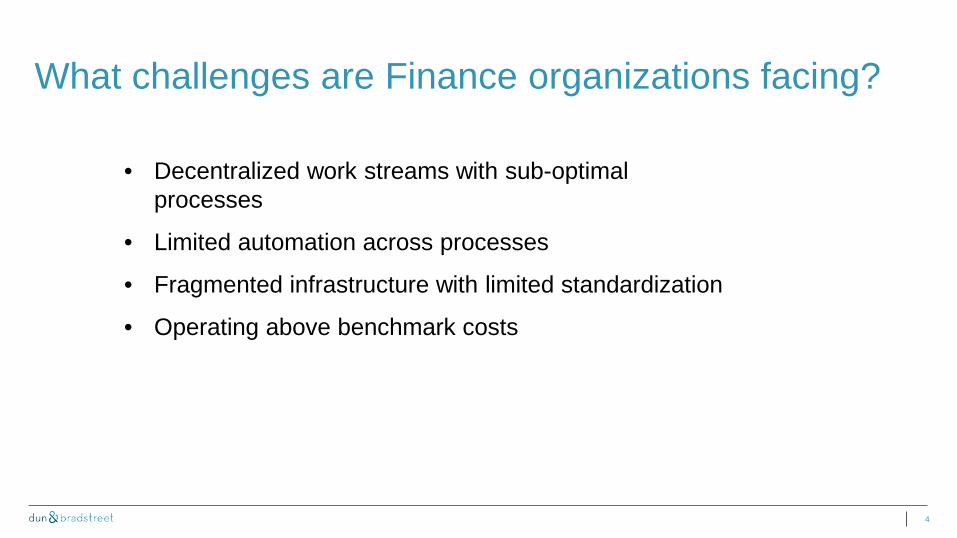
What challenges are Finance organizations facing?
• Decentralized work streams with sub-optimal processes
• Limited automation across processes
• Fragmented infrastructure with limited standardization
• Operating above benchmark costs
EVOLUTION: A Process of Slow Change and
Development
6
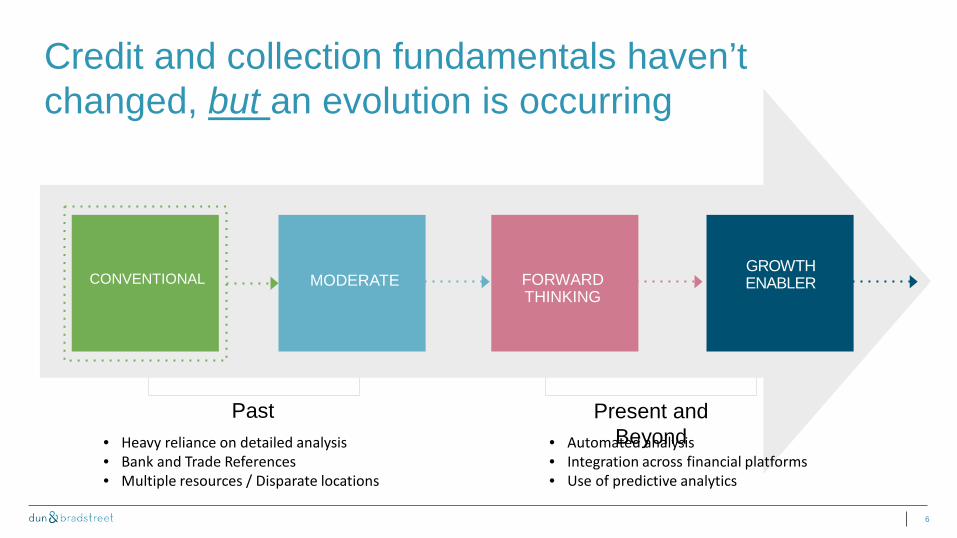
Credit and collection fundamentals haven’t changed, but an evolution is occurring
CONVENTIONAL MODERATE FORWARD THINKING
GROWTH ENABLER
Past Present and Beyond • Heavy reliance on detailed analysis
• Bank and Trade References • Multiple resources / Disparate locations
• Automated analysis • Integration across financial platforms • Use of predictive analytics
7
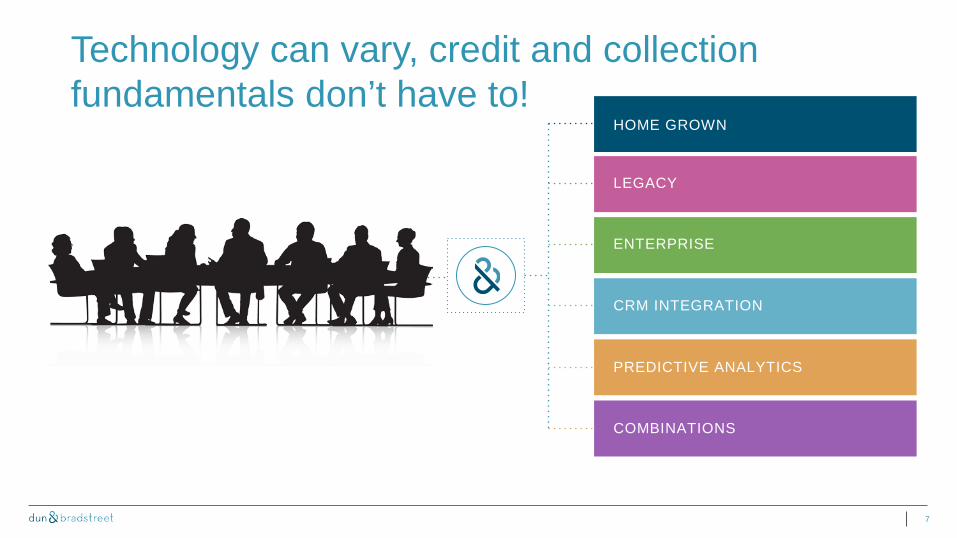
Technology can vary, credit and collection fundamentals don’t have to!
HOME GROWN
LEGACY
ENTERPRISE
CRM INTEGRATION
PREDICTIVE ANALYTICS
COMBINATIONS
8
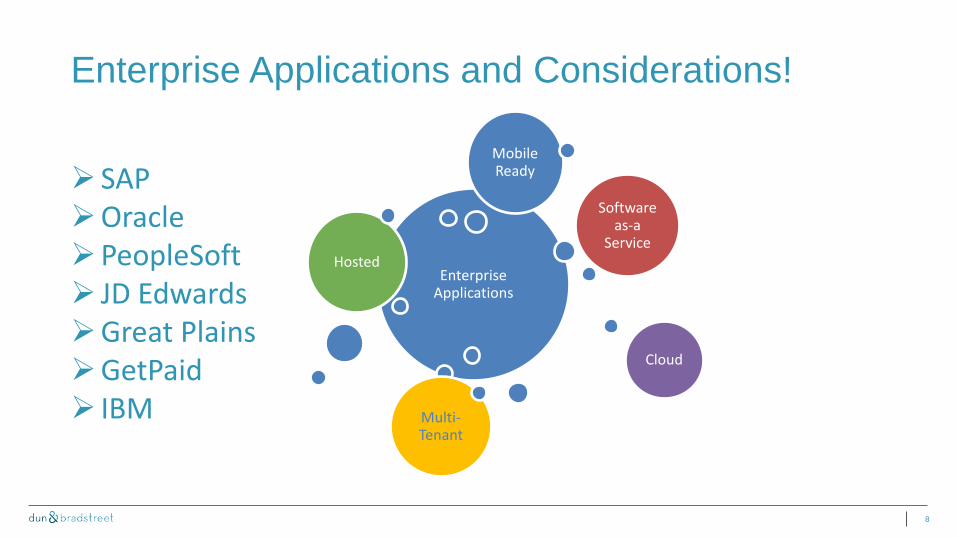
Enterprise Applications and Considerations!
Enterprise Applications
Hosted
Softwareas-a
Service
Cloud
Multi-Tenant
Mobile Ready SAP
Oracle PeopleSoft JD Edwards Great Plains GetPaid IBM
An increasing reality is that Finance is being asked to DO MORE with LESS!
10
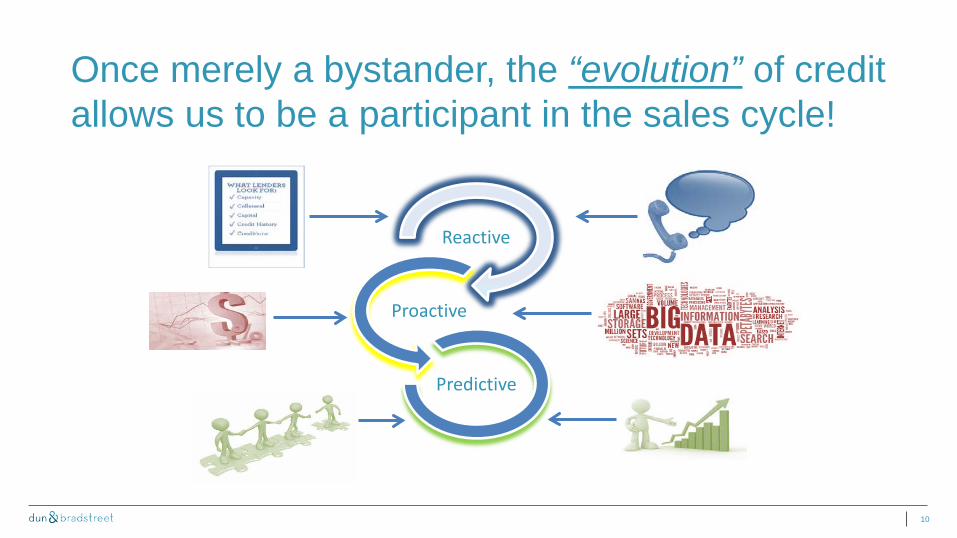
Once merely a bystander, the “evolution” of credit allows us to be a participant in the sales cycle!
Reactive
Predictive
Proactive
11
The byproduct of automation is improved sales cycle time!
• 10,000 opportunities/quarter • 75% (7,500 Opps) Auto-Approved • 100% manual review process • Proactive credit-decisioning • Increased resource requirements • Resource requirements reduced 30% • No integration with CRM • Created synergy between Finance and Sales • Non-participant in sales cycle • DSO reduced • Reactive model • Increased cash flow
SALES
OPPORTUNITY CRM
ORDER MANAGEMENT
CREDIT REVIEW
AR OM ED
Manual Review Process
Manual Feedback Loop
Dun & Bradstreet’s Conventional Credit Decisioning Process
SALES
OPPORTUNITY CRM
ORDER MANAGEMENT
AUTOMATED CREDIT
DECISIONING
AR OM ED
Scorecard
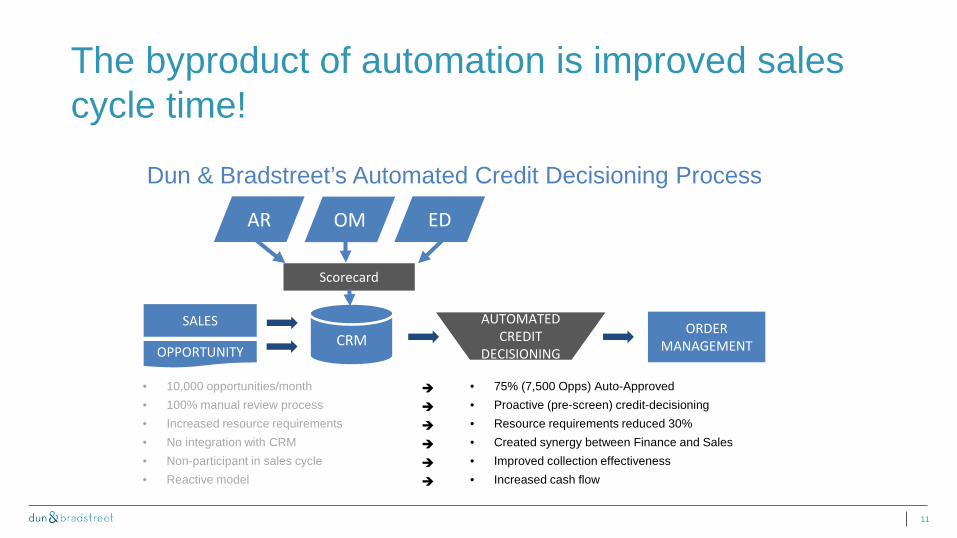
Dun & Bradstreet’s Automated Credit Decisioning Process
• 10,000 opportunities/month • 75% (7,500 Opps) Auto-Approved • 100% manual review process • Proactive (pre-screen) credit-decisioning • Increased resource requirements • Resource requirements reduced 30% • No integration with CRM • Created synergy between Finance and Sales • Non-participant in sales cycle • Improved collection effectiveness • Reactive model • Increased cash flow
12
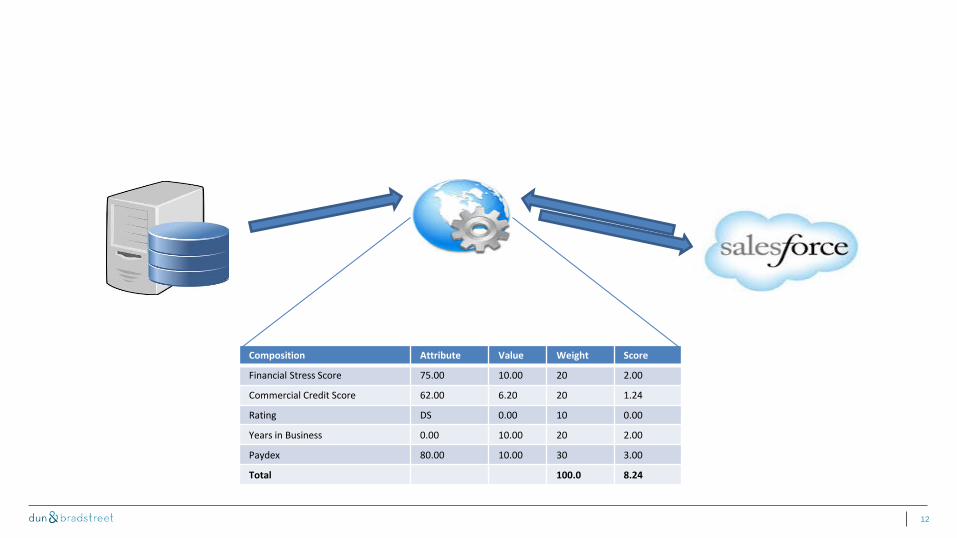
Composition Attribute Value Weight Score
Financial Stress Score 75.00 10.00 20 2.00
Commercial Credit Score 62.00 6.20 20 1.24
Rating DS 0.00 10 0.00
Years in Business 0.00 10.00 20 2.00
Paydex 80.00 10.00 30 3.00
Total 100.0 8.24
13
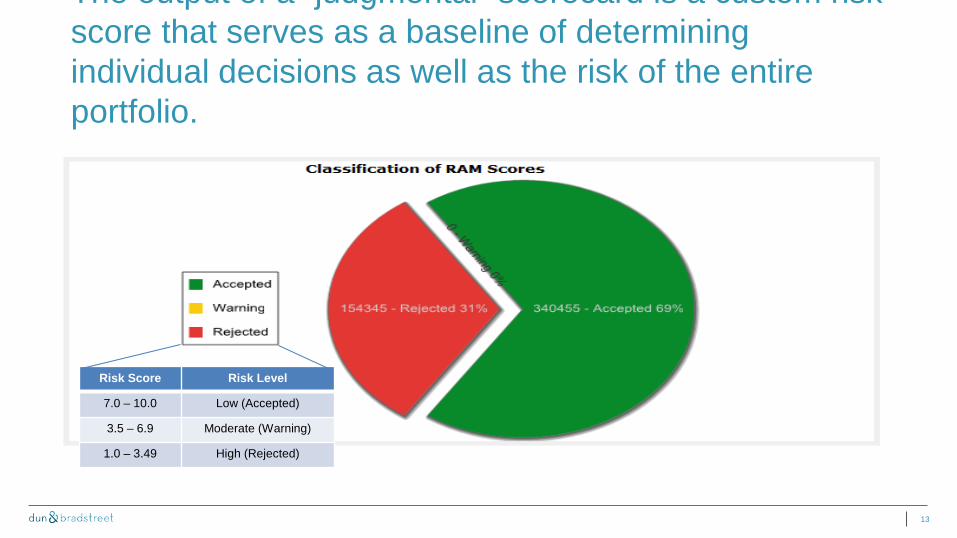
The output of a judgmental scorecard is a custom risk score that serves as a baseline of determining individual decisions as well as the risk of the entire portfolio.
Risk Score Risk Level
7.0 – 10.0 Low (Accepted)
3.5 – 6.9 Moderate (Warning)
1.0 – 3.49 High (Rejected)
14
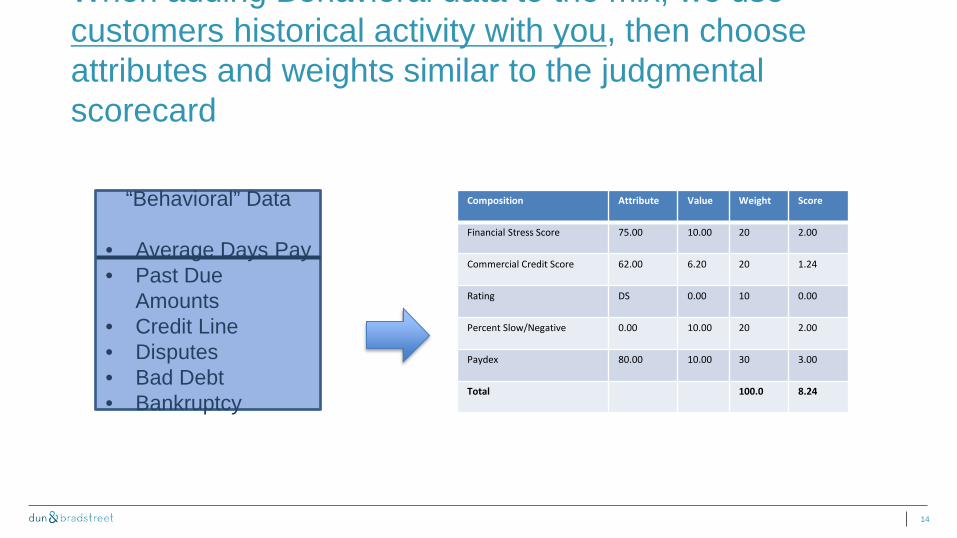
When adding Behavioral data to the mix, we use customers historical activity with you, then choose attributes and weights similar to the judgmental scorecard
Composition Attribute Value Weight Score
Financial Stress Score 75.00 10.00 20 2.00
Commercial Credit Score 62.00 6.20 20 1.24
Rating DS 0.00 10 0.00
Percent Slow/Negative 0.00 10.00 20 2.00
Paydex 80.00 10.00 30 3.00
Total 100.0 8.24
“Behavioral” Data
• Average Days Pay • Past Due
Amounts • Credit Line • Disputes • Bad Debt • Bankruptcy
15
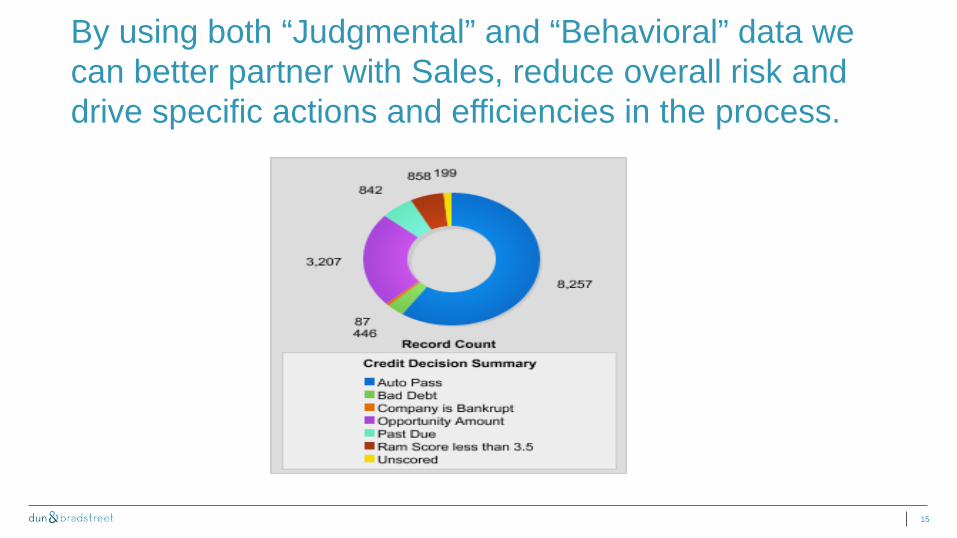
By using both “Judgmental” and “Behavioral” data we can better partner with Sales, reduce overall risk and drive specific actions and efficiencies in the process.
16
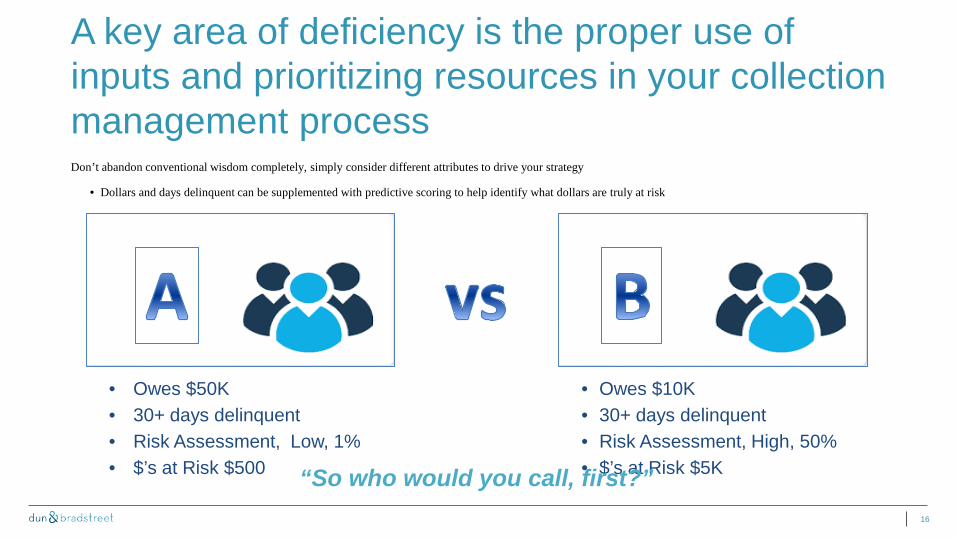
A key area of deficiency is the proper use of inputs and prioritizing resources in your collection management process Don’t abandon conventional wisdom completely, simply consider different attributes to drive your strategy
• Dollars and days delinquent can be supplemented with predictive scoring to help identify what dollars are truly at risk
• Owes $50K • 30+ days delinquent • Risk Assessment, Low, 1% • $’s at Risk $500
• Owes $10K • 30+ days delinquent • Risk Assessment, High, 50% • $’s at Risk $5K “So who would you call, first?”
17
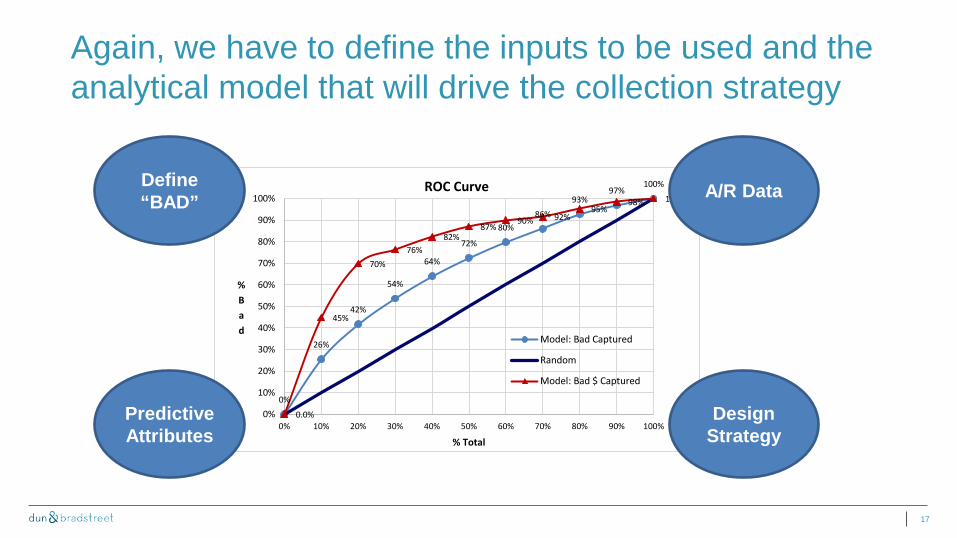
Again, we have to define the inputs to be used and the analytical model that will drive the collection strategy
0%
26%
42%
54%
64%
72%
80% 86%
93% 97%
100%
0.0%
45%
70% 76%
82% 87%
90% 92% 95%
98% 100%
0%
10%
20%
30%
40%
50%
60%
70%
80%
90%
100%
0% 10% 20% 30% 40% 50% 60% 70% 80% 90% 100%
%Bad
% Total
ROC Curve
Model: Bad Captured
Random
Model: Bad $ Captured
Define “BAD”
Design Strategy
Predictive Attributes
A/R Data
18
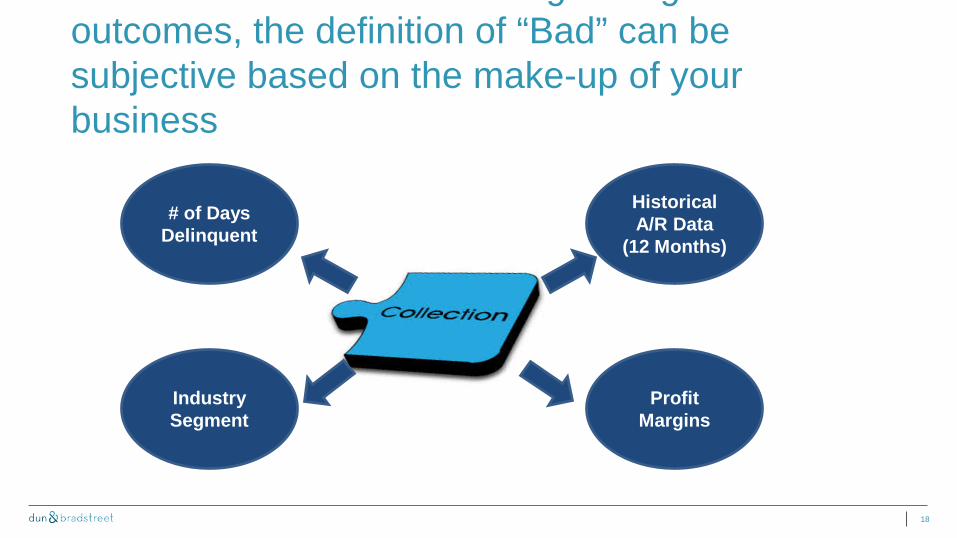
g g outcomes, the definition of “Bad” can be subjective based on the make-up of your business
# of Days Delinquent
Industry Segment
Profit Margins
Historical A/R Data
(12 Months)
19
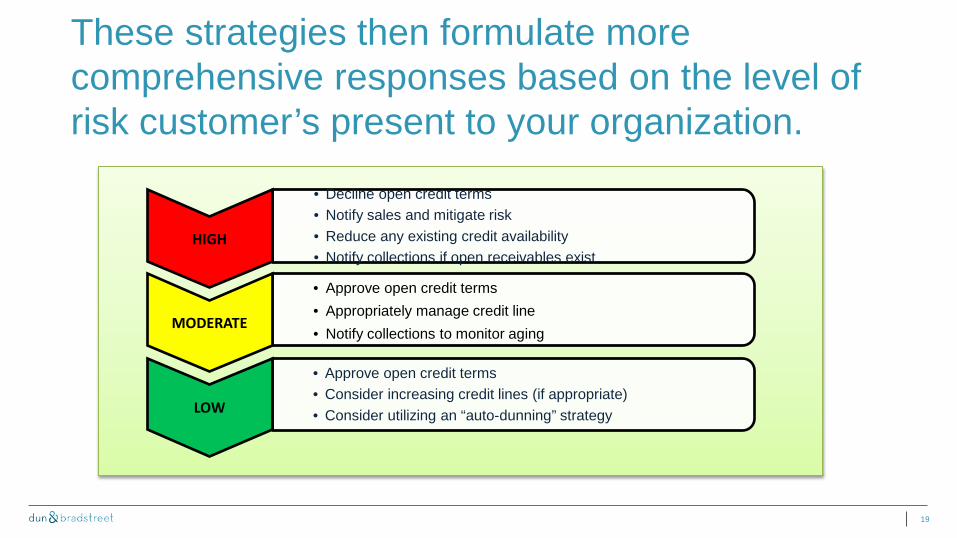
These strategies then formulate more comprehensive responses based on the level of risk customer’s present to your organization.
• Decline open credit terms • Notify sales and mitigate risk • Reduce any existing credit availability • Notify collections if open receivables exist
HIGH
• Approve open credit terms • Appropriately manage credit line • Notify collections to monitor aging
MODERATE
• Approve open credit terms • Consider increasing credit lines (if appropriate) • Consider utilizing an “auto-dunning” strategy LOW
20
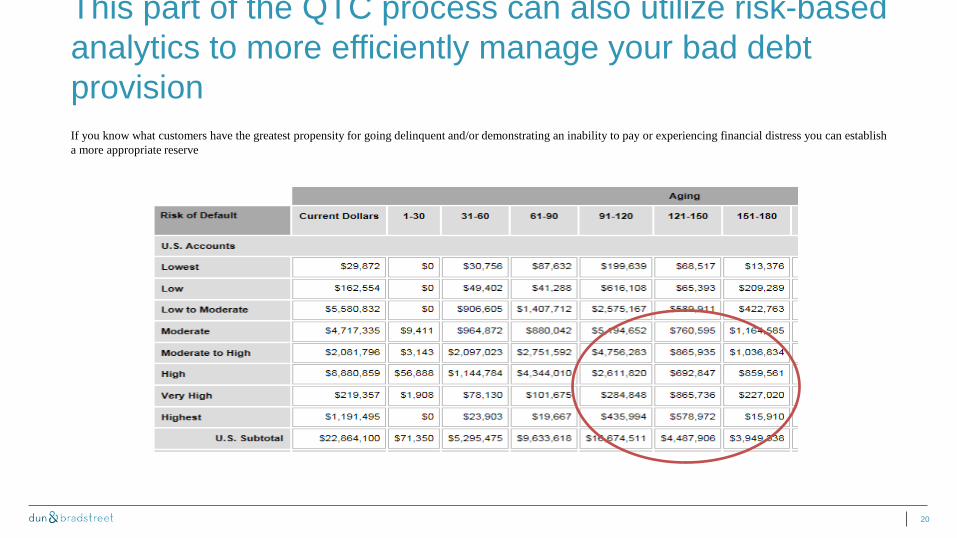
This part of the QTC process can also utilize risk-based analytics to more efficiently manage your bad debt provision If you know what customers have the greatest propensity for going delinquent and/or demonstrating an inability to pay or experiencing financial distress you can establish a more appropriate reserve
How do we change the perception of being a barrier to an Enabler and Partner?
22
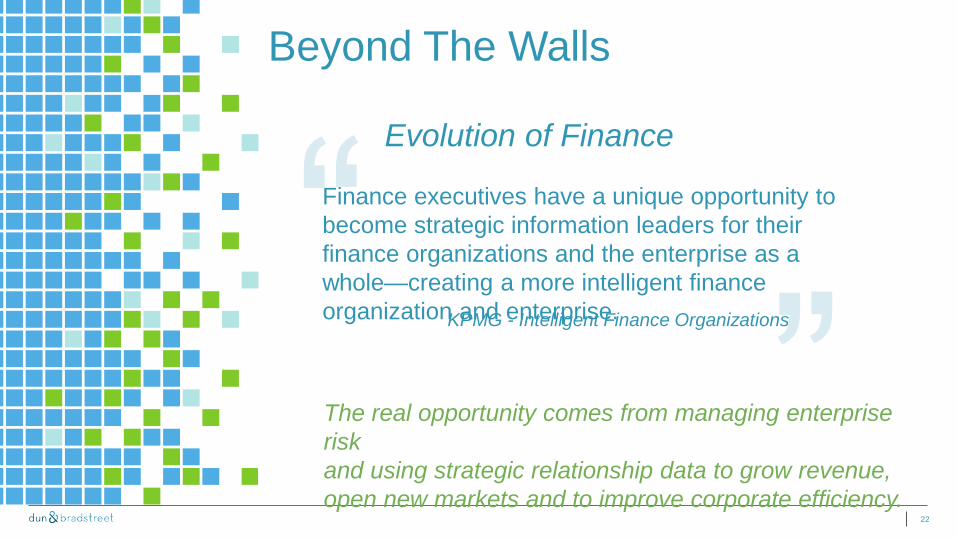
Beyond The Walls
Evolution of Finance
The real opportunity comes from managing enterprise risk and using strategic relationship data to grow revenue, open new markets and to improve corporate efficiency.
Finance executives have a unique opportunity to become strategic information leaders for their finance organizations and the enterprise as a whole—creating a more intelligent finance organization and enterprise. KPMG - Intelligent Finance Organizations
23
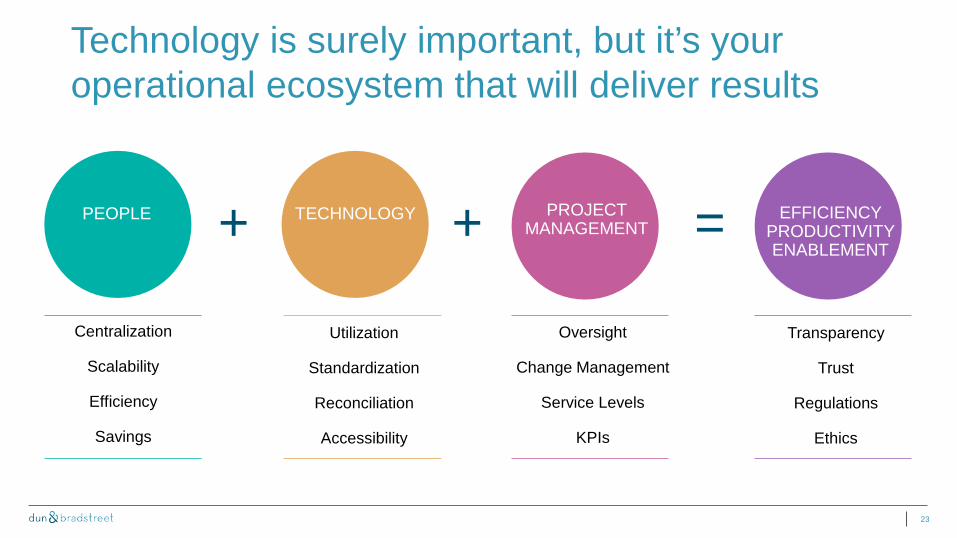
Technology is surely important, but it’s your operational ecosystem that will deliver results
PEOPLE TECHNOLOGY EFFICIENCY PRODUCTIVITY ENABLEMENT
Centralization
Scalability
Efficiency
Savings
Utilization
Standardization
Reconciliation
Accessibility
Transparency
Trust
Regulations
Ethics
+ = PROJECT MANAGEMENT
Oversight
Change Management
Service Levels
KPIs
+
24
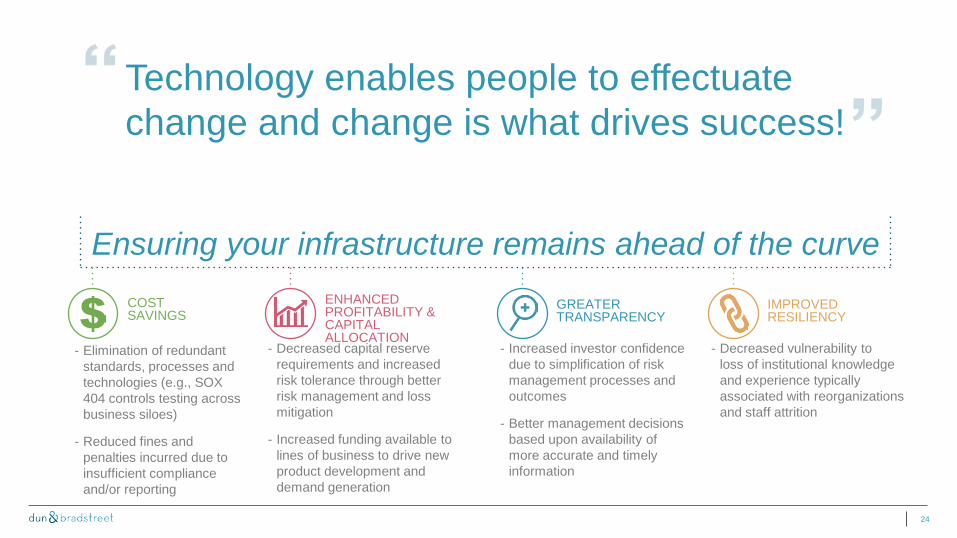
Technology enables people to effectuate change and change is what drives success!
COST SAVINGS
- Elimination of redundant standards, processes and technologies (e.g., SOX 404 controls testing across business siloes)
- Reduced fines and penalties incurred due to insufficient compliance and/or reporting
- Decreased capital reserve requirements and increased risk tolerance through better risk management and loss mitigation
- Increased funding available to lines of business to drive new product development and demand generation
ENHANCED PROFITABILITY & CAPITAL ALLOCATION
- Increased investor confidence due to simplification of risk management processes and outcomes
- Better management decisions based upon availability of more accurate and timely information
GREATER TRANSPARENCY
- Decreased vulnerability to loss of institutional knowledge and experience typically associated with reorganizations and staff attrition
IMPROVED RESILIENCY
Ensuring your infrastructure remains ahead of the curve
25
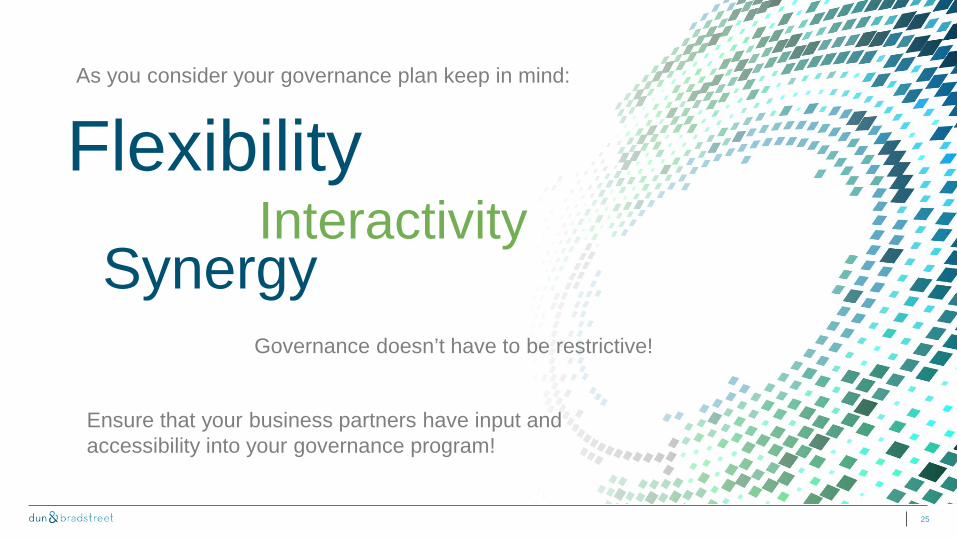
Flexibility Interactivity
As you consider your governance plan keep in mind:
Governance doesn’t have to be restrictive!
Ensure that your business partners have input and accessibility into your governance program!
Synergy
Thank You
#DnBData