Embed Size (px)
Citation preview

Technology Entry in the Presence of Patent Thickets
IFS Working Paper W16/02
Bronwyn H. Hall Christian HelmersGeorg von Graevenitz
TechnologyEntryinthePresenceofPatentThickets*
BronwynH.Hall(UCBerkeley,NBER,IFS,andNIESR)§
ChristianHelmers(SantaClaraUniversity)GeorgvonGraevenitz(QueenMaryUniversityofLondon,CCP,CREATe)
January16,2016
Abstract
WeanalyzetheeffectofpatentthicketsonentryintotechnologyareasbyfirmsintheUK. We present a model that describes incentives to enter technology areascharacterizedbyvarying technologicalopportunity, complexityof technology,and thepotentialforhold‐upinpatentthickets.Weshowempiricallythatourmeasureofpatentthicketsisassociatedwithareductionoffirsttimepatentinginagiventechnologyareacontrolling for the level of technological complexity and opportunity. Technologicalareascharacterizedbymoretechnologicalcomplexityandopportunity,incontrast,seemoreentry.Ourevidenceindicatesthatpatentthicketsraiseentrycosts,whichleadstolessentryintotechnologiesregardlessofafirm’ssize.JELcodes:O34,O31,L20,K11Keywords:IPR,patents,entry,technologicalopportunity,technologicalcomplexity,hold‐up
*WearegratefultotheIntellectualPropertyOfficeoftheUnitedKingdomforresearchsupportandtotheNationalInstituteofEconomicandSocialResearchforhospitalitywhilethispaperwasbeingwritten.Theviewsexpressedherearethoseoftheauthors.TheyarenotnecessarilythoseoftheUKIntellectualPropertyOfficeorNIESR.TherevisionofthispaperhasbenefittedfromcommentsbyparticipantsinseminarsattheUKIPO,theUSPTO,theNBERSummerInstitute,theUniversityofCaliforniaatBerkeley,TILEC,TilburgUniversity,theUniversityofWuppertalandtheTIGERconference2014inToulouse.WewouldliketothankJonathanHaskel,ScottStern,DietmarHarhoff,StefanWagnerandMeganMacGarvieforcomments,andIainCockburn,DietmarHarhoff,andStefanWagnerforverygeneroussupportwithadditionaldata.§Correspondingauthor:[email protected]
1
1 Introduction
Thepasttwodecadeshaveseenanenormousincreaseinpatentfilingsworldwide(Finketal.,2013).Therearesignsthatthelevelofpatentingincertainsectorshasbecomesohighastodiscourageinnovation(FederalTradeCommission,2011;BessenandMeurer,2008;JaffeandLerner,2004;FederalTradeCommission,2003).Themainreasonisthatcompanies inadvertently block each other’s innovations because of multipleoverlappingpatentrightsinso‐called“patentthickets”(Shapiro,2001).Patentthicketsarisewhere individual products drawon innovations protected by hundreds or eventhousands of patents, often with fuzzy boundaries. These patents belong to manyindependent and usually competing firms. Patent thickets can lead to hold‐up ofinnovations, increases in the complexity of negotiations over licenses, increases inlitigation, and they create incentives to add more and weaker patents to the patentsystem(Allisonetal.,2015).Thisincreasestransactioncosts,reducesprofitsthatderivefrom the commercialization of innovation, and ultimately may reduce incentives toinnovate.There is a growing theoretical (Bessen and Maskin, 2009; Clark and Konrad, 2008;FarrellandShapiro,2008;FershtmanandKamien,1992)andlegalliteratureonpatentthickets (Chien and Lemley, 2012; Bessen etal., 2011). Relatedwork analyzes firms’attemptstoformpatentpoolstoreducehold‐up(JoshiandNerkar,2011;Lerneretal.,2007;LernerandTirole,2004)and theparticularchallengesposed in thiscontextbystandardessentialpatents(LernerandTirole,2013).The existing empirical evidenceonpatent thickets is largely concernedwith showingthat they exist andmeasuring their density (Graevenitz etal., 2011; Ziedonis, 2004).There is less evidence on the effects patent thickets have for firms. Cockburn andMacGarvie(2011)demonstratethatpatentinglevelsaffectproductmarketentryinthesoftware industry. They show that a 1 per cent increase in the number of existingpatentsisassociatedwitha0.8percentdropinthenumberofproductmarketentrants.ThisresultechoesearlierfindingsbyLerner(1995)whoshowedforasmallsampleofU.S.biotechcompaniesthatfirst‐timepatentinginagiventechnologyisaffectedbythepresence of other companies’ patents. Bessen andMeurer (2013) suggest that patentthickets also lead to increased litigation related to hold‐up. Patent thickets haveremainedaconcernofantitrustagenciesandregulatorsintheUnitedStatesforoveradecade (FederalTradeCommission, 2011, 2003;USDoJ andFTC, 2007). Reforms thataddresssomeofthefactorscontributingtothegrowthofpatentthicketshaverecentlybeenintroducedintheU.S.(AmericaInventsAct(AIA)of2011)1andbytheEuropeanPatentOffice(EPO).
1For further informationsee http://www.gpo.gov/fdsys/pkg/BILLS-112hr1249enr/pdf/BILLS-112hr1249enr.pdf

2
Inspiteoftheavailabletheoreticalandempiricalevidence,itisfrequentlyarguedthatpatentthicketsareafeatureofrapidlydevelopingtechnologiesinwhichtechnologicalopportunitiesabound(Teeceetal.,2014).Thicketsarethusseenasareflectionoffasttechnological progress that is paired with increased technological complexity (LewisandMott,2013).Thissuggeststhatatrade‐offbetweentechnologicalopportunityandgrowthontheonehandandincreasedtransactioncostsduetotheemergenceofpatentthicketsontheothermayexist.Thechallengeinassessingthistrade‐offistodevelopaframeworkthatcapturesthemainincentivesthatleadtopatentthicketsaswellasthemostimportanteffectsofthickets.This paper contributes to the literature by analyzing the effect of patent thickets onentryintonewtechnologyareas.Ourfocusonentryintopatentingcapturesthepositiveeffectsofgreatertechnologicalopportunityandnegativeeffectsofgreatertransactioncostsimposedbyacomplexpatentlandscapecharacterizedbythickets.Weareabletoquantifybotheffectsempirically.Thepapermakestwocontributions:first,weextendthetheoreticalmodelofpatentingin complex technologies introduced by Graevenitz etal. (2013) to free entry and theinteraction between incumbents and entrants. Our model shows that technologicalcomplexity and technological opportunity increase entry in the context of patentthickets, while potential for hold‐up in patent thickets reduces entry. Whereascomplexity and opportunity are shown to have countervailing effects on patentingincentivesinGraevenitzetal.(2013),wefindthatbothfactorsincreasetheincentivesto enter. However, hold‐up potential clearly reduces entry incentives. These findingsreflectthefactthatpatentthicketsariseduetoincreasedtechnologicalopportunityandcomplexitybutcreateapotentialforhold‐up.Thesecondcontributionofthepaperconsistsofanempiricaltestofthesepredictionsusingfirm‐leveldataonUKfirmsandtheirpatentingintheUKandEurope.Weexploitpatent data at both the EPO and the USPTO in order to construct measures oftechnological opportunity, technological complexity and hold‐up potential and relatethesetoentryintonewtechnologyareasbyUKfirms.Ourempiricalanalysisconfirmsthatentryincreasesintechnologyareascharacterizedbygreatertechnologicalopportunityandcomplexity.However,wealsoshowthat thehold‐uppotentialofpatentthicketshasnegativeandsubstantiveeffectsonentry intopatenting. While we cannot quantify the overall net welfare effect, our results dosuggestthatthicketsraiseentrycostsforlargeandsmallfirmsalike.Totheextentthatmoreoriginalandradicalratherthanincrementalideascomefromnewentrantsratherthan incumbents, this is likely to havenegative long‐run consequenceson innovationandproductmarketcompetition.Theremainderofthispaperisorganizedasfollows.Section2presentsamodelofentryintopatenting ina technologyareaandderivesseveral testablepredictions.Section3

3
describes thedata, and the empiricalmeasurement of the key concepts in themodel.Section4discussesourresultsandSection5providesconcludingremarks.
2 TheoreticalModel
Thissectionsummarizesthemainresultsofatwo‐stagemodelofentryintopatentingand of subsequent patenting decisions. The model shows how complexity of atechnology, technological opportunity and the expectation of hold‐up affect firms’decisions to enter a technology area. The incentives to patent in such a setting areanalyzedbyGraevenitzetal. (2013).Wegeneralize theirmodel toanalyze entry intotechnologyareasbyincumbentsandnewentrants.Patentsystemsprovideprotectionofinnovationsintechnologiesthatvarysignificantlyintheircomplexityandforwhichthedegreeoftechnologicalopportunitychangeswiththe underlying science base. We model varying complexity and opportunity acrosstechnology areas as follows: each technology area is divided into technologicalopportunities. Firms invest inR&Dper opportunity to developnewproducts.Havinginvested,firmscanchoosetoprotecttheiracquiredknowledgebyapplyingforpatentson facets of each opportunity. Where the technology is discrete, e.g. chemistry, anopportunity consists of one facet. Opportunities in complex technologies comprisemultiplefacets.Anincreaseintechnologicalopportunitycorrespondstoanincreaseinthe number of opportunities in a technology area. An increase in complexitycorrespondstoanincreaseinthenumberoffacetsperopportunity.Weassumethatallfacetsandopportunitiesaresymmetrical.Thenfirmscanrandomlyselect which facets and opportunities to patent. The role of the patent office in thismodel is to randomly assign facets to firms,whenmultiple firms apply for the samefacet. Firms only decide howmany technological opportunities to invest in and howmanyfacetsineachopportunitytopatent.Thevalueofafirm’spatentportfoliowithinagiventechnologicalopportunitydependsonthenumberoffacetsofanopportunitythathavebeenpatentedoverallandtheshareofthosepatentsheldbythefirm.Indecidinghowmanypatentapplicationstosubmiteachfirmtakesintoaccountcostsofresearchinganopportunity,costsofupholdingthepatentandlegalcostsofexploitingthepatentportfolio.In thismodel opportunity increases incentives to patent in discrete technologies, butreduces these incentives in complex technologies. Opportunity relaxes firms’competition to patent all facets per opportunity in complex technologies. However,given the level of opportunity, greater complexity leads firms to patentmore as theyseek toensure that they canexploit theopportunity fullyandas they seek toprotecttheirbargainingpositionamongfirmsholdingpatentsonanopportunity.Thisleadstocountervailingeffectsofopportunityandcomplexityonpatentingincentivesincomplex

4
technologies.Graevenitzetal.(2013)provideevidenceofthisusingdataonEuropeanpatenting.The countervailing effects of complexity and opportunity on patenting incentives incomplex technologiesraisethequestionhowcomplexityandopportunityaffectentry.We show below that complexity and opportunity both increase incentives to entercomplextechnologies.Itisperhapssurprisingthat,conditionalonthenumberoffirms,more opportunity should reduce patenting incentives, while increasing incentives toenterintopatenting.Asweshowbelowoneeffectisthepreconditionfortheother.Greater complexity increases incentives to enter a technology area as firms are lesslikelytocompeteforthesamepatentswithineachopportunitywhencomplexityrises.Complexity is frequently associated with increased potential for hold‐up. Hold‐uppotentialderives tosomedegreefromtheallocationofpatentswithinanopportunitythatresultsfromfirms’patentingefforts.Wheremorethantwofirmsholdasubstantialstake on an opportunity the complexity of bargaining increases. We account for thethreatofhold‐upseparatelyandshowthatincreasesinthatreducepatentingandentry.Thereforewemeasurecomplexityandhold‐upseparatelyinourempiricalmodel.
2.1 NotationandAssumptions
The key variables of the model are the complexity of a technology k, measured by0( )kF��\ ,thedegreeoftechnologicalopportunity,measuredby 0( )kO
��\ ,andhold‐uppotentialhk.ThevalueofallFkpatentsinanopportunityisVk.Inthesimplestdiscretesetting this is the value of the one patent (facet) that covers each technologicalopportunity. Inmore complex technologies this is the value of controlling all patents(facets) on a technological opportunity. Firms (indexed by i) choose the number ofopportunitiesoitoinvestinandthenumberoffacetsfiperopportunitytopatent.
In equilibrium only 0 1ˆ(1 (1 ( / ) ))Nk k kF f F � � �� facets are patented, where kf is the
equilibriumnumberof facetschosenbyapplicantsandNO is thenumberof firmsthathavechosenaspecificopportunity.2Since maybesmallerthanFk thetotalvalueofpatenting in a technology is . Graevenitz etal. (2013) assume that thevalue function is convex in covered facets. In Appendix C we show that thisassumptioncanberelaxed.Wegeneralizethemodelbyintroducingaconcavefunctionrelatingtheshareofpatentsthefirmholdsonanopportunity(sik)totheproportionofthe value Vk the firm can extract through licensing and its own sales: Δ(sik). Thiscapturesthebenefitsthatapatentportfolioconfersinthemarketfortechnology.
2ThepropertiesofN0aresummarizedinAppendixC.
kF�
( ) ( )k kV F V Fd�
( )k kV F�

5
Insumtheassumptionswemakeonthevaluefunctionandportfoliobenefitsare:
( ): (0) 0, 0k
VVF VFw
!w �
(1)
2
2
( ) ( )( ): (0) 0, 0 and 0ik ik
ik ik
d s d sPBds ds' '
' ! � (2)
Themodelcontainsthreetypesofpatentingcosts:• Costs of R&D per opportunity, which depend on overall R&D activity in that
technologyarea: .
• Costsofmaintainingeachgrantedpatentinforce,Ca.• CostsofcoordinatingR&DondifferenttechnologicalopportunitiesCc(oi),where
0c
i
Co
w!
w (3)
TheseassumptionsimplythatR&Dcostsarefixedcosts.3Weallowfortheendogenousdetermination of the level of R&D fixed costs, which rise as more opportunities areresearchedsimultaneouslybyrivalfirms.ThisreflectscompetitionforinputsintoR&Dthatarefixedintheshortrun.CoordinatingdifferentR&Dprojectsalsolimitsthescopeofthefirm’sR&Doperations.Wheremultiplefirmsownfacetsonanopportunity,theirlegalcostsL(γik,sik,hk)dependontheabsolutenumberofpatentedfacets(γik),ontheshareofpatentsperopportunitythata firmholds(sik),andontheextenttowhichtheyfacehold‐up(hk).Thefirsttwochannels capture the costs of defending a patent portfolio as the number of patentsincreases,whileleavingscopeforeffectsonbargainingcoststhatderivefromtheshareof patents owned:4The hold‐up parameter captures contexts in which several firms’core technologies become extremely closely intertwined. Then each firm has tosimultaneously negotiate with many others to commercialize its products, whichsignificantlyraisescosts.
3Italsoimpliesthatthereisnotechnologicaluncertainty.However,introducingtechnologicaluncertaintyintothemodeldoesnotchangethemaincomparativestaticsresults.4Graevenitz et al. (2013) analysealternativeassumptionsonlegalcosts.
� �0ON
jjC o¦

6
2 2
2 2
2 2
( ): ( , , ), where 0, 0, 0, 0,
0, 0, 0
ik ik kik ik ik ik
k ik k ik k
L L L LLC L s hs s
L L Lh h s h
JJ J
J
w w w w! t d t
w w w w
w w w! ! !
w w w w w
(4)
Allremainingcrosspartialderivativesofthelegalcostsfunctionarezero.
Inwhatfollows,weusethefollowingdefinitions:
( ) ( ), , , , and
( ) ( )i i k k k k i k
k k k k kk k k k k k k i
o f F V F s d s f FO F V F F s ds F f
Z I P [ Kw ' w{ {
w ' w
� � �� � � .
2.2 PatentingandEntry
Firm i’s profits in technology k, is a function of the number ofopportunitiesoi inwhich the firm invests, thenumberof facetsperopportunity fi thefirm seeks to patent, the total number of patentable facets per opportunity Fk, thenumber of technological opportunities a technology offers Ok, the number of firmsenteringthetechnologyNk,andthedegreeofhold‐upinthattechnologyhk.Inthissectionweanalyzethefollowingtwo‐stagegameG*:
Stage1:Firmsenteruntil ( , , , , , ) 0ik i i k k k ko f F O N hS ;5
Stage2:Firmssimultaneouslychoosethenumberofopportunities,oi,toinvestinandthenumberoffacetsperopportunity,fi,topatentinordertomaximizeprofitsπik.Wesolvethegamebybackwardinductionandderivelocalcomparativestaticsresultsfor the symmetric extremal equilibria of the second stage game. For the subsequentanalysis it is important to note that all equilibria of this second stage game aresymmetric.Incasethatthesecondstagegamehasmultipleequilibriawefocusontheproperties of the extremal equilibria when providing comparative statics results(Milgrom and Roberts, 1994; Amir and Lambson, 2000; Vives, 2005). Equilibriumvaluesofthefirms’choicesaredenotedbyasuperscriptandwedropthefirmspecificsubscriptsinwhatfollows,e.g., .
Atstagetwoofthegameeachfirmmaximizesthefollowingobjectivefunction:
� �0( , ) ( ) ( ) ( , , ) ( ) ( )ONik i i i k ik ik ik k j i k a c ijo f o V F s L s h C o f p C C oS J ' � � � �¦� (5)
5WetreatNkasacontinuousvariablehere,whichisanabstractionthatsimplifiesouranalysis.
( , , , , , )ik i i k k k ko f F O N hS
kI

7
This expression shows that per opportunityk, the firmderivesprofits from its shareofpatentedfacets,whilefacinglegalcostsL toappropriatethoseprofits,
aswellascostsofR&DC0,costsofmaintainingitspatentportfolioCa,andcoordinationcostsacrossopportunitiesCc.
2.3 SimultaneousEntrywithMultipleFacets
2.3.1 ComparativestaticsofpatentingWeshowthatthesecondstageofthisgameissmoothsupermodular:Proposition1
The second stagepatentinggame,defined inparticularbyassumptions (VF,eq.2), (PB,eq.3)and(LC,eq.5)issmoothsupermodularif k ikP [! andifownershipofthetechnologyisexpectedtobefragmented.
This result generalizes Proposition 1 derived by Graevenitz etal. (2013).6Given thisresultwecanshowthat:Proposition2
Thepotentialforhold‐upincomplextechnologiesreducespatentingincentives.
InAppendixDweshowthattheexpectedlegalcostsofhold‐upreducethenumberofopportunities that firms invest in. In addition, firms with larger portfolios are moreexposedtohold‐upandbenefit less fromtheshareofpatents theyhavepatentedperopportunity.Botheffectscombinetoreducethenumberoffacetseachfirmappliesfor.
2.3.2 ComparativestaticsofentryInAppendixCwe show that there is a freeentry equilibrium. In this equilibrium thefollowingpropositionshold:Proposition4
Underfreeentrygreatercomplexityofatechnologyincreasesentry.
In the model, complexity has countervailing effects: first of all it increases profits,because it is less likely that duplicative R&D arises making each opportunity morevaluable, this clearly increases incentives to enter. Next, given the level of patentapplications( fk ),complexityreducestheprobabilitythateachfacetispatented,whichreducesprofitsandentry incentives.Finally, complexityreducescompetition foreachfacet,whichincreasestheprobabilityofpatentingandincreasesinnovationincentives.6Inourversionofthemodel,itisnolongerthecasethatthevaluefunctionhastobeincreasinginthenumberofpatentedfacetsforsupermodularityofthepatentinggame.WerelegatefurtherdiscussionofthisresulttoAppendixC.
/ik k i ks p f F{ �

8
Overallweshowthat thepositiveeffectsoutweighthenegativeeffectsand incentivesforentryrisewithcomplexityofatechnology.To derive Proposition 4, consider how equilibrium profits are affected by thecomplexity of the technology Fk, the degree of technological opportunityOk, and thepotentialforhold‐uphk:
,,
ˆ ˆˆ ( )( , ) ˆˆˆ ( ) ( ) ( ) 0ˆ ˆk kk k
k kp F k k k kF F
k k k k
s so f Lo V FF F s s
S H H K P [§ ·ª º'w w
� � � !¨ ¸« »¨ ¸w w¬ ¼© ¹�
� (6)
,,
ˆ ˆ ˆ ˆˆ ( )( , ) ˆˆˆ ( ) ( ) ( ) 0ˆ ˆ ˆ ˆk Ok O
O k k O Op N k k k kF N
k k O k k O k
N s s C N oo f Lo V FO O N s s N o s
S H H K P [§ ·ª ºw ' ww w
� � � � !¨ ¸« »¨ ¸w w w w¬ ¼© ¹�
� (7)
ˆˆ( , ) ˆ 0k k
o f Loh h
Sw w � �
w w (8)
Proposition4followsfromtheImplicitFunctiontheoremonceweknowthesignofthederivativeofprofitsw.r.t.F.Underfreeentryfirms’profitsdecreasewithentry:
k kk
NF NFS Sw w w
�w ww
(9)
Therefore, the Implicit Function theorem implies that the sign of the effect ofcomplexityFonentrydependsonthesignoftheeffectofcomplexityonprofits.Equation(6)shows that theeffectof complexityonprofitsdependson thedifferencebetweentheelasticities and .Theelasticity isderivedinAppendixC.1:
2,
1 1ˆ 12
ˆ1k k
kO
p F Ok
NN
IH
I
§ ·� �¨ ¸
© ¹ �
(10)
Thiselasticityisnegativefor ˆ 1/ 2kI � .Theresultimpliesthatthefirstterminbracketsinequation(6)ispositive.ThesecondtermispositivewhengameG*issupermodular.Overall this implies that greater complexity induces entry. ˆ 1/ 2kI � is one of tworestrictions required for supermodularity of game G*. This demonstrates thatcomplexityincreasesentryinsettingsinwhichfirmsareplayingasupermodulargameandinwhichcomplexityalsoinducesmorepatenting.7
7When ˆ 1/ 2kI t wenolongerhavetheassumptionsnecessarytoshowsupermodularity.Thissituationcorrespondstothecasewhereonefirmhasmorethanhalfthepatentsinaparticulartechnologyopportunitywithinatechnologyarea.Thusourresultsmaynotholdwhenaspecificopportunityishighly
,k kF FH � ˆkK ,kp FH

9
Proposition5
Underfreeentrygreatertechnologicalopportunityincreasesentry.
For any given number of entrants an increase in technological opportunity reducescompetition between firms for patents. This increases firms’ expected profits andincreasesentry.ContinuingfromtheproofofProposition4above,bytheImplicitFunctiontheoremthesignofthederivativeofprofitsw.r.t.technologicalopportunitydeterminestheeffectoftechnologicalopportunityonentry:
k kk
NO NOS Sw w w
�w ww
(11)
Anincreaseintechnologicalopportunityincreasesprofitsandentry.InAppendixCweshow that the term in brackets in Equation (7) is negative under free entry. Profitsincrease as technological opportunity increases, because fewer firms enter peropportunity.Proposition6
Underfreeentrythepotentialforhold‐upreducesentry.
Anincreaseinthepotentialforhold‐upraisesfirms’expectedlegalcosts.Thisreducesexpectedprofitsandlowerspotentialforentry.To derive this prediction, note that by the Implicit Function theorem the sign of thederivativeofprofitsw.r.t.thelevelofhold‐upinatechnologyareadeterminestheeffectofhold‐uponentry:
k kk
Nh NhS Sw w w
�w ww
(12)
Hence,equation(8)showsthattheeffectofhold‐uponentryderivesfromtheincreasedlegalcoststhatthepossibilityofhold‐upimposesonaffectedfirms.
2.4 Entry and Incumbency
Theprevioussectionsetsoutamodel inwhichall firmsenteredandthen invested inpatents.Atbothstagesfirms’decisionsweresimultaneous.InAppendixD.5weextendthemodeltoasettinginwhichsomefirms,theincumbents, facelowercosts( ,where ) of entering opportunities. This captures the fact that incumbents haveconcentrated.Ingeneralthiswillnotbethecase,especiallyatourlevelofempiricalanalysis,butitwouldbeinterestingtoexplorethispossibilityinfuturework.
OC �<
0< !

10
previous experience of doing R&D in a technology area. We demonstrate that ourresultsarerobusttothisextensionofthemodel.
2.5 Predictions of the Model
Ourmodelpredictshowtheprobabilityofentryintopatentingdependsonopportunity,complexity, hold‐up potential and incumbents’ experience. Herewe summarize thesepredictions,whicharetestedempiricallybelow:8Prediction1
Greatertechnologicalopportunityincreasestheprobabilityofentry.
Greater technological opportunity reduces competition for facets per opportunity,whichraisesexpectedprofitsandtherebyattractsentry.Prediction2
Greatercomplexityofatechnologyincreasestheprobabilityofentry.
Greatercomplexityhascountervailingeffects: itreducescompetitionperfacetaswellas duplicative R&D, attracting entry. It also increases the likelihood that some of atechnologyremainsunpatented,reducingitsoverallvalueandentry.Ourmodelshowsthatoverallcomplexityincreasesentry.Prediction3
Greaterpotentialforhold‐upreducestheprobabilityofentry.
Hold‐uppotentialincreasesexpectedcostsofentry,reducingit.Prediction4
Moreexperiencedincumbentsaremorelikelytoentertechnologicalopportunitiesnewtothem.
We show that incumbency advantage raises the number of opportunities thatincumbentsenter.Thisimpliesthattheyalsoenternewopportunities,whichtheyhavenot previouslybeen active in. This expansion of activity by incumbents crowds outentrybynewentrants.
3 DataandEmpiricalModel
This section of the paper describes the data we use in the empirical test of ourtheoreticalpredictions.Inparticular,wediscusshowwemeasureentry,howthesetofpotentialentrantsisidentified,andwhichmeasuresandcovariatesareused.8Graevenitzetal.(2013)testedpredictionsfromamorerestrictiveversionofthemodelonthelevelofpatentapplicationsusingdatafromtheEuropeanPatentOffice.
11
Ourempiricalmodelisahazardratemodeloffirmentryintopatentinginatechnologyarea as a function of technological opportunity, technological complexity, hold‐uppotentialthatcharacterizeatechnologyarea.Wetestthepredictionssetoutattheendoftheprevioussectionforthesevariablesandfortheeffectofafirm’spriorexperiencein patenting. Additional firm level covariates include the age and size of firms. Themodelsweestimatearestratifiedattheindustry level.Thatis,theunitofobservationfor each entryhazard is a firm‐technology area, but thehazard shapes and levels areallowed to vary by the industry that the firm is in. This approach recognizes thatpatentingpropensitiesvaryacrossindustriesforreasonsthatmaynotbetechnological(e.g.,strategicreasons,orreasonsarisingfromthehistoricaldevelopmentofthesector).WeuseacombinationoffirmleveldatafortheentirepopulationofUKfirmsregisteredwithCompaniesHouseanddataonpatentingattheEuropeanPatentOfficeandattheIntellectual Property Office for the UK. The firm data comes from the data held atCompanies House provided by Bureau van Dijk in their FAME database. Europeanpatent registers do not include reference numbers from company registers, nor doesBureau vanDijk provide the identification numbers used bypatent offices inEurope.Linking the data from patent registers to firm register data requires matching ofapplicant names in patent documents and firm names in firm registers. In our workbothafirm’scurrentandpreviousname(s)wereusedformatchinginordertoaccountforchanges in firmnames.Formoredetailsonthematchingof firm‐andpatent‐leveldataseeAppendixA.Economic studiesof entry are frequentlyhamperedby theproblemof identifying thecorrectsetofpotentialentrants(BresnahanandReiss,1991;Berry,1992).Inourcasethis problem is slightly mitigated by the fact that one set of potential entrants intopatentinginaspecifictechnologyareaconsistsofallthosefirmsthatcurrentlypatentinother technology areas.We complement this groupof firmswith a set of comparablefirmsfromthepopulationofUKfirmsthathavenotpatentedpreviously.Toconstruct thesamplewedeletedall firms fromthedata forwhichwehavenosizemeasure,becauseofmissingdataonassets.Weselectpreviouslynon‐patenting firmsfrom the population of all UK firms in two steps: 1)we delete all firms in industrialsectorswithlittlepatenting(amountingtolessthan2percentofallpatenting);and2)wechooseasampleofnon‐patentingfirmsthatmatchesoursampleofpatentingfirmsby industry, size class, and age class. In principle, this approach will result in anendogenous (choice‐based) sample.Howeverour focus is on industry and technologyarealeveleffectsratherthanfirm‐leveleffects.Thereforewedonotexpectthesamplingapproach we adopt to introduce systematic biases into the estimates we report. Weprovide a number of robustness checks to ensure that our results are stable. Thesereveal that sample composition does not affect the key resultswe present below. All

12
estimatesarebasedondataweightedbytheprobabilitythatafirmisinoursample.9The sample that results fromour selection criteria is a set of firmswithnon‐missingassets in manufacturing, oil and gas extraction and quarrying, construction, utilities,trade, and selected business services including financial services that includes all(approximately 10,000) firms applying for a patent at the EPO or UKIPO during the2001‐2009periodandanother10,000firmsthatdidnotapplyforapatent.Thedefinitionoftechnologyareasthatweuseisbasedonthe2008versionoftheISI‐OST‐INPItechnologyclassification(denotedTF34classes).ThelistisshowninTable1,alongwiththenumberofEPOandUKIPOpatentsappliedforbyUKfirmswithprioritydatesbetween2002and2009.Acomparisonofthefrequencydistributionofpatentingacrossthetechnologyareasfromthetwopatentofficesshowsthatfirmsaremorelikelyto apply for patents in Chemicals at the EPO, while Electrical and MechanicalEngineeringpredominateinthenationalpatentdata(seethebottompanelinTable1).We treat entry intoeach technologyareaasa separatedecisionmadeby firms.Morethanhalfof firmsweobservepatent inmorethanoneareaand10percentpatent inmore than four. From the20,000 firmsobserved, eachofwhich canpotentially enterintoeachoneofthe34technologyareas,weobtainabout700,000observationsatrisk.We cluster the standard errors by firm, so our models are effectively firm randomeffects models for entry into 34 technology areas. Allowing firm choices to vary bytechnology area is sensible under the assumption that firms’ patenting strategies arecontingentupontechnologyandindustrylevelfactorsandarenothomogeneousacrosstechnologyareas.WeconfirmedthevalidityofthisassumptionthroughinterviewswithleadingUKpatentattorneys.There are some technology‐industry combinations that donot occur, e.g. audio‐visualtechnology and the paper industry, telecommunications technology and thepharmaceutical industry. In order to reduce the size of the sample, we drop alltechnology‐industrycombinationsforwhichLybbertandZolas(2014)findnopatentingin their data and forwhich therewas nopatentingby anyUK firm from the relevantindustry inthecorrespondingtechnologycategory.Thisremovesabout30percentofobservations from the data. We provide a robustness check for this procedure inAppendixB.
[Table1here]
9Tocheckthis,weestimatedthemodelwithandwithoutweightsbasedonoursamplingmethodologyandfindlittledifferenceintheresults.

13
3.1 Variables
DependentVariable‐EntryThe dependent variable is a dichotomous variable taking the value one if a firm hasentered a technology area k at time t and otherwise the value zero. Entry into atechnologyareaismeasuredbythefirsttimeafirmappliesforapatentthatisclassifiedinthattechnologyarea,datedbythepriorityyearofthepatent.
TechnologicalopportunityOur first prediction from the theoretical model is that there will be more entry intechnology areas with greater technological opportunity. Additional reasons that asector may have more or less patenting include sector “size” or “breadth” and thepropensityoffirmstopatentinparticulartechnologiesforstrategicreasonsorbecauseof varying patent effectiveness in protecting inventions. To control for bothtechnological opportunity and these other factors, we include the logarithm of theaggregateEPOpatentapplicationsinthetechnologysectorduringtheyear.Tocaptureopportunitymore specificallywealso include thepast5‐yeargrowth rate in thenon‐patent(scientificpublication)referencescitedinpatentsinthattechnologyclassattheEPO.10Wehavefoundthatthegrowthrateinnon‐patentreferencesisabetterpredictorof entry than the level of non‐patent references, which has been used previously.Presumably thegrowth rate is abetter indicatorbecause it captureneworexpandedtechnologicalopportunity.Technologycomplexity
The second prediction of the theoretical model is that technological complexityincreases entry, other things equal.Our interpretationof complexity is that it impliesmanyinterconnectionsbetweeninventions inaparticular field,ratherthanaseriesoffairlyisolatedinventionsthatdonotconnecttoeachother.Toconstructsuchameasure,weuse theconceptofnetworkdensityapplied tocitationsamongall thepatents thathave issued in theparticular technologyareaduring the10yearsprior to thedateofpotentialentry.WeusecitationsattheU.S.patentoffice,bothbecausethesearericher(averaging7orsocitesperpatentduringthisperiodversus3fortheEPO)andalsotominimizecorrelationwiththethicketsmeasure,whichisbasedonEPOdata.11Thenetworkdensitymeasureiscomputedasfollows:inanyyeart,thereareNktpatentsthathavebeenappliedforintechnologyareakbetween1975andyeart.Eachofthesepatentscanciteanyofthepatentsthatwereappliedforearlier,whichimpliesthatthe10SeeGraevenitzetal.(2013)foramoreextensivediscussionofthisvariableintheliterature.11ItisimportanttoemphasizethatalthoughpatentofficescooperateandsharesearchreportscitationslistedonU.S.patentsarelargelyproposedbytheapplicant,whilstthecitationslistedonEPOandIPOpatentsareinsertedbytheexaminer.Thisexplainswhythetwomeasuresarenothighlycorrelated.

14
maximumnumberof citationswithin the technologyarea isgivenbyNkt(Nkt‐1)/2.Wecounttheactualnumberofcitationsmadeandnormalizethembythisquantity,scalingthemeasurebyonemillionforvisibility,givenitssmallsize.
PatentThicketsThethirdpredictionofourmodelisthatgreaterpotentialforhold‐upreducesentry.Wemeasurethepotentialforhold‐upinpatentthicketsusingthetriplescountproposedbyvonGraevenitzetal. (2011).This isanarrowerinterpretationofthismeasurethan inseveral previous papers, where it has been used as a proxy for complexity of atechnology. In thosepaperscomplexityandhold‐uppotentialhave thesameeffect. Incontrast, our model provides opposite predictions for the effects of complexity of atechnologyandpotentialforhold‐up.Thetriplesmeasurecorrespondstoacountofthenumberoffullyconnectedtriadsonthesetoffirms’criticalpatentcitations.AttimeteachunidirectionallinkbetweentwofirmsAandBcorrespondstooneormorecriticalreferencestofirmA’spatentsinthesetofpatentsappliedforbyfirmBintheyearst,t‐1andt‐2.WeusethesamemeasureoftriplesasHarhoffetal.(2015),whichcontainsalltriplesineachtechnologyarea.Thecitationdata used is extracted fromPATSTAT (October 2011 edition).12Wenormalizethecountoftriplesbyaggregatepatentinginthesamesector,sothatthetriplesvariablerepresents the intensity with which firms potentially hold blocking patents on eachotherrelativetoaggregatepatentingactivityinthetechnology.The triplesmeasure has been used in a number of papers since itwas suggested byGraevenitz et al. (2011). They show that counts of triples by technical area aresignificantly higher for technologies classified as complex than for areas classified asdiscrete by Cohen et al. (2000). Fischer and Henkel (2012) find that the measurepredictspatentacquisitionsbyNon‐PracticingEntities.Graevenitzetal.(2013)usethemeasuretostudypatentingincentivesinpatentthicketsandHarhoffetal.(2015)showthatoppositiontopatentapplicationsfallsinpatentthickets,particularlyforpatentsofthosefirmsthatarecaughtupinthethickets.Asarobustnesscheck,wehavealsoexploredtheuseofduples,i.e.thecountofmutualblockingrelationships,tomeasurehold‐uppotential.Combiningbothmeasuresinoneregression leads to thorny problems of interpretation. Taken alone themeasure hassimilareffectsasthetriplesmeasureinthiscontext.
[Table2here]
12TriplesdatawaskindlyprovidedbyHarhoffetal.(2015).
15
CovariatesItiswellknownthatfirmsizeandindustryareimportantpredictorsofwhetherafirmpatents at all (Bound etal. 1984 for U.S. data). Hall etal. (2013) show this for UKpatentingduringtheperiodstudiedhere.Therefore,inallofourregressionswecontrolforfirmsize,industrialsector,andyearofobservation.Weincludethelogarithmofthefirm’sreportedassetsandasetofyeardummiesinalltheregressions.13Tocontrolforindustrialsector,westratifybyindustry,whicheffectivelymeansthateachindustryhasitsownhazardfunction,whichisshiftedupordownbytheotherregressors.We also expect the likelihood that a firm will enter a particular technology area todepend on its prior patenting experience overall, aswell as its age. Long‐establishedfirmsarelesslikelytobeexploringnewtechnologyareasinwhichtocompete.Thusweincludethelogarithmoffirmageandthelogarithmofthestockofpriorpatentsappliedfor inanytechnologybythefirm, laggedoneyeartoavoidanyendogeneityconcerns.ThevariablesonfirmsizeandpatentstockalsoallowustotestPrediction4abouttheeffectofincumbencyadvantageonentry.
3.2 DescriptiveStatisticsOur estimation sample contains about 20,000 firms and 700,000 firm‐TF34 sectorcombinations. During the 2002‐2009 period there are about 10,000 entries intopatenting for the first time in a technology area by these firms. Table A‐2 shows thedistributionofthenumberofentriesperfirm:2,531enteroneclass,andtherestentermorethanone.TableA‐2showsthepopulationofUKfirmsobtainedfromFAMEinourindustries, together with the shares in each industry that have applied for a UK orEuropean patent during the 2001‐2009period. These shares range fromover 10 percentinPharmaceuticalsandR&DServicestolessthan0.1percentinConstruction,OilandGasServices,RealEstate,Law,andAccounting.
EmpiricalModelWeusehazardmodelstoestimatetheprobabilityofentryintoatechnologyarea.Themodels express the probability that a firm enters into patenting in a certain areaconditionalonnothavingenteredyetasafunctionofthefirm’scharacteristicsandthetime since the firmwas “at risk,”which is the time since the founding of the firm. Insomecases,ourdatadonotgobackasfarasthefoundingdateofthefirm,andinthesecasesthedataare“left‐censored.”Whenwedonotobservetheentryofthefirmintoaparticular technology sector by the last year (2009), the data is referred to as “right‐censored.”InAppendixB,wediscuss the choice of the survivalmodels thatweuse for analysis,13ThechoiceofassetsasasizemeasurereflectsthefactthatitistheonlysizevariableavailableforthemajorityofthefirmsintheFAMEdataset.

16
how to interpret the results, and present some robustness checks. We estimate twoclassesoffailureorsurvivalmodels:1)proportionalhazard,wherethehazardoffailureover timehas the same shape for all firms, but the overall level is proportional to anindex thatdependson firmcharacteristics;and2) accelerated failure time,where thesurvivalrateisacceleratedordeceleratedbythecharacteristicsofthefirm.Inthebodyofthepaperwepresentresultsusingthewell‐knownCoxproportionalhazardsmodelstratifiedbyindustry.Resultsfromtheacceleratedfailuretimemodelsweresimilarbuttheestimatedeffectsaresomewhatlarger(showninAppendixB). As indicated earlier, our data for estimation are for the 2002‐2009 period, butmanyfirmshavebeenatriskofpatentingformanyyearspriortothat.Theoldestfirminourdatasetwasfoundedin1856andtheaveragefoundingyearwas1992.BecausetheEPOwasonlyfoundedin1978,wechosetousethatyearastheearliestdateanyofourfirmsisatriskofenteringintopatenting.Thatis,wedefinedtheinitialyearasthemaximumof the founding year and 1978. Table B‐2 in the appendix presents estimates of ourmodelusing1900insteadof1978astheearliestatriskyearandfindslittledifferencein the estimates.14We conclude that the precise assumption of the initial period isinnocuous.Ourassumptionamountstoassumingthattheshapeofthehazardforfirmsfoundedbetween1856and1978butotherwiseidenticalisthesameduringthe2002‐2009period.AppendixTableB‐1showsexploratoryregressionsmadeusingvarioussurvivalmodels.None of the choicesmade large differences to the coefficients of interest, so thatwefocus here on the results from the Cox proportional hazards model, estimated withstratificationbytwo‐digitindustry.Theeffectofthestratificationisthatweallowfirmsin each of the industries to have a different distribution of the time until entry intopatentingconditionalontheregressors.Thatis,eachindustryhasitsown“failure”timedistribution,where failure isdefinedasentry intopatenting ina technologyarea,butthe levelof thisdistribution isalsomodifiedby the firm’ssize,aggregatepatenting inthetechnology,networkdensity,andthetriplesdensity.
4 Results
Our estimates of the model for entry into patenting are shown in Table 3. Allregressionscontrolforsize,age,andindustry.Bothsizeandagearestronglypositivelyassociated with entry into patenting in a new technological area. Our indicator oftechnological opportunity and technology class size, the log of current patent14Themaindifferenceisinthefirmagecoefficient.Becausethemodelsarenonlinear,thiscoefficientisidentifiedeveninthepresenceofyeardummiesandvintage/cohort(whichisimpliedbythesurvivalmodelformulation).Howeveritwillbehighlysensitivetotheassumptionsaboutvintageduetotheage‐year‐cohortidentity.
17
applications in the technology class, is also positively associatedwith entry into thatclass,aspredictedbyourmodel.Column3ofTable3 contains thebasic result fromourdataandestimation,which isfullyconsistentwiththepredictionsofourmodel:greatercomplexityasmeasuredbycitation network density increases the probability of entry into a technology area, asdoes technological opportunity,measuredboth as prior patenting in the class and asgrowthintherelevantscienceliterature.Controllingforbothtechnologicalopportunityandcomplexity, firmsarediscouraged fromentry intoareaswithagreaterdensityoftriplerelationshipsamongexistingfirms.Weinterpretthislatterresultasanindicatorof the discouraging effect of holdup possibilities or the legal costs associated withnegotiationofrightsordefenseinthecaseoflitigation.Wewereconcernedthatournetworkdensity(complexity)andtriplesdensity(hold‐uppotential)measuresmightbetoocloselyrelatedtoconveyseparateinformation,butwefoundthattherawcorrelationbetweenthesetwovariableswas‐0.001.Tocheckfortheimpactofpotentialcorrelationconditionalonyear,industry,andtheothervariables,incolumns 1 and 2 of Table 3 we included these twomeasures of complexity/thicketsseparatelyandfoundthatalthoughthecoefficientswereveryslightlylowerinabsolutevalue,theresultsstillhold,althoughitisclearthattheaggregateclasssizeiscorrelatednegatively with the triples density via the denominator of the density (compare thechangeinthelog(patentsinclass)coefficientbetweencolumns1and2).AsweshowinAppendixB,theestimatedcoefficientsinthetableareestimatesoftheelasticityoftheyearlyhazardratewithrespecttothevariable,anddonotdependontheindustryspecificproportionalhazard.Aonestandarddeviationincreaseinthelogof network density is associated with a 32 percent increase in the hazard of entry(0.13*2.78),while a one standard deviation in the log of triples density is associatedwith a 20 percent decrease in the hazard of entry (0.14*1.44). Thus the differencesacross these technologyareas in thewillingnessof firms toenter them is substantial,bearinginmindthattheaverageprobabilityofentryisonlyabout1.5percentinthissample.
[Table3here]
Therearefixedcoststopatenting,andafirmmaybemorelikelytoenterintopatentinginanewareaifitalreadypatentsinanotherarea.Totestthisidea,inthefourthcolumnof Table 3,we add the logarithm of past patenting by the firm. Firmswith a greaterprior patenting history are indeed more likely to enter a new technology area –doublingafirm’spastpatentsleadstoanalmost100%higherhazardofentry.In the last column we interact the log of assets with the log of patents, the log ofnetworkdensity, thegrowthofnon‐patent literature,and the logof triplesdensity toseewhethertheseeffectsvarybyfirmsize.Theresultsshowthatthenetworkdensityandtechnologicalopportunityeffectsdeclineslightlywithfirmsize.Thetriplesdensityeffectdoesnotshowanysizerelationship,suggestingthathold‐upconcernsaffectfirms

18
of all sizes proportionately.We show this graphically in Figure 1,which overlays thecoefficientsasafunctionoffirmsizeontheactualsizedistributionofourfirms.Fromthegraphonecanseethat the impactofaggregatepatentinginasector ishigherandmorevariablethantheimpactofthenetworkdensity,andthatbothfalltozeroforthelargest firms.Growth innon‐patent literature ispositivelyassociatedwith technologyentry forsmall firms,butnegatively for large firms, suggesting theroleplayedby thesmaller firms in newer technologies based on science. Large firms seemnot to be asactive in these areas. Controlling for all these features of a technology, the impact oftriplesdensity isuniformlynegativeacross firmsize,which contradicts theview thatthepotentialforhold‐updiscouragesentrybysmallerfirmsmorethanbylargerfirms.
4.1 Robustness
TableB‐2intheappendixexploressomevariationsofthesampleusedforestimationinTable3.Column1ofTableB‐2isthesameascolumn4ofTable3forcomparison.Thefirst change (column 2) was to add back all the technology‐industry combinationswhereLybbertandZolas(2012)findnopatentingintheirdataandwheretherewasnoentrybyanyUK firm fromthe relevant industry into that technologycategory.Theseobservations are about 20 per cent of the sample. The impact of network density onentry is weaker, but the impact of triples density and the technological opportunityvariablesisconsiderablystronger.Thatis,technologyarea‐industrycombinationswithno patenting are also those where the technology area displays low technologicalopportunity.Nextweremovedall the firmswithassetsgreater than12.5millionpounds, to checkwhetherlargefirmswereresponsibleforourfindings.15Thisremovedabout2percentofthe20,000firms.Column3ofTableB‐2showsthattheresultsdonotchangeagreatdeal, although they are somewhat stronger. In column 4, we removed thetelecommunications technology sector from the estimation, because it is such a largetriplesoutlier.Onceagain,therewas littlechangetotheestimates.ThelastcolumnofTable B‐2 shows the results of defining the minimum entry year as 1900. With theexceptionof firmage, thecoefficientsarenearly identical to those incolumn1of thetable.
1512.5millionpoundsisacutoffbasedonthedefinitionofSmallandMedium‐sizedEnterprises(SMEs)asfirmswithfewerthan250employees.Wedonothaveemploymentforallourfirms,soweassumethatassetsareapproximately50thousandpoundsperemployeeinordertocomputethismeasure.Forsmallfirmsonly,thisyieldsanassetscutoffof2.5millionpounds.

19
5 Conclusion
Patentthicketsariseforamultitudeofreasons;theyaremainlydrivenbyanincreaseinthenumberofpatentfilingsandconcomitantreductions inpatentquality(that is, theextent to which the patent satisfies the requirements of patentability) as well asincreasedtechnologicalcomplexityandinterdependenceoftechnologicalcomponents.Thetheoreticalanalysisofpatentthickets(Shapiro,2001)andthequalitativeevidenceprovided by the FTC in a number of reports (FTC, 2003; 2011) suggest that thicketsimpose significant costson some firms.The subsequent literaturehas focusedon themeasurement of thickets (e.g. Graevenitz etal. 2011; Ziedonis, 2004) and has linkedthicketstochangesinfirms’IPstrategiesinanumberofdimensions.Thereisstillalackofevidenceontheeffectofpatentthicketsaswellastheirwelfare implicationsat theaggregatelevel.The empirical analysis of the effects of patent thickets must contend with twochallenges: first,patent thicketshave tobemeasuredandsecondly,effectsof thicketsmustbeseparatedfromeffectsofotherfactorsthatarecorrelatedwiththegrowthofthickets,inparticulartechnologicalcomplexity.This paper confronts both challenges. We show that our empirical measure for thedensityofthicketscaptureseffectsofpatentthicketspredictedbytheory.ThissupportsresultsbyvonGraevenitzetal.(2011,2013)andHarhoffetal.(2015)showingthatthecoefficients on the triples measure capture predicted effects of patent thickets onpatenting and opposition. The paper also separates the impact of patent thickets onentryfromeffectsoftechnologicalopportunityandcomplexityandshowsthatthehold‐up potential created by thickets reduces entry into patenting. Controlling fortechnologicalopportunityandcomplexityisimportantbecausebotharecorrelatedwithentryintopatentingandthepresenceofthickets.Itisalsoworthemphasizingthatourmeasureofthicketsispurgedofeffectsthataredrivenbypatentingtrendsinparticulartechnologies.Thatis,ourresultsarenotduetothelevelofinventionandtechnologicalprogresswithinatechnologyfield.Our results demonstrate that patent thickets significantly reduce entry into thosetechnology areas inwhich growing complexity and growing opportunity increase theunderlying demand for patent protection. These are the technology areas, which areassociated most with productivity growth in the knowledge economy. However, thewelfare consequences of our finding are unclear. Reduced entry into new technologyareas could bewelfare‐enhancing: As iswell known from the industrial organizationliterature,entry intoamarketmaybeexcessive ifentrycreatesnegativeexternalitiesfor active firms, for instance due to business stealing. This is likely to be true ofpatentingtoo.Furthermore,Aroraetal.(2008)showthatthepatentpremiumdoesnotcoverthecostsofpatentingfortheaveragepatent(exceptforpharmaceuticals).Theseandrelatedfactsmightleadonetoconcludethatlowerentryintopatentingislikelytoincreasewelfareandthatthicketsraisewelfarebyreducingentry.

20
Incontrast,reducedentryintopatentinginnewtechnologyareasmayalsobewelfare‐reducing,foratleasttworeasons.First,thereistheobviousargumentthatthebenefitsfrom more innovation may exceed any business stealing costs (as has been shownempirically in the past by others, e.g., Bloom et al. 2013), so that some desirableinnovationmaybedeterredbyhighentrycosts.Evenifthiswerenottrue,thereisnoreasontobelievethatfirmsthatdonotenterintopatentingduetothicketsarethosewewishtodeter.Giventheincumbencyadvantage,itislikelythatthefailuretoenterintopatenting in theseareas reflects less innovationby thosewhobring themostoriginalideas,thatis,bythosewhoareinventing“outsidethebox.”

21
References
AmirR,andV.E.Lambson,2000.OntheeffectsofentryinCournotmarkets.TheReviewofEconomicStudies67(2),235–254.
Arora,A.,Ceccagnoli,M.,&Cohen,W.M.(2008).R&DandthePatentPremium.InternationalJournalofIndustrialOrganization,26(5),1153‐1179.
Arundel,A.,Patel,P.,2003.StrategicPatenting,BackgroundReportfortheTrendChartPolicyBenchmarkingWorkshopNewTrends.Availableathttp://proinno.intrasoft.be/reports/documents/TCW15_background_paper.pdf.
Berneman,L.P.,Cockburn,I.,Agrawal,A.,Shankar,I.,2009.U.S./CanadianLicensingIn2007‐08:SurveyResults.lesNouvelles1–8.
Berry,S.,1992.Estimationofamodelofentryintheairlineindustry,Econometrica,60,889‐917.
Bessen,J.,Maskin,E.,2007.SequentialInnovation,Patents,andImitation.RANDJournalofEconomics40,611‐635.
Bessen,J.,Meurer,M.,2013.ThePatentLitigationExplosion.LoyolaUniversityChicagoLawJournal45(2):401‐440.
Bessen,J.,Meurer,M.,2008.Patentfailure:howjudges,bureaucrats,andlawyersputinnovatorsatrisk.Princeton,NJ:PrincetonUniversityPress.
Bloom,N.,M.Schankerman,andJ.vanReenen,2013.Idenitfyingtechnologyspilloversandproductmarketrivalry,Econometrica81(4),1347–1393.
Bound,J.,Cummins,C.,Griliches,Z.,Hall,B.,Jaffe,A.,1984.WhodoesR&Dandwhopatents?R&DPatentsandproductivity,Z.Griliches(ed.).Chicago,UniversityofChicagoPress.
BresnahanT.,ReissP.,1991.Entryandcompetitioninconcentratedmarkets,JournalofPoliticalEconomy,99,977‐1009.
Cockburn,I.M.,MacGarvie,M.J.,2011.EntryandPatentingintheSoftwareIndustry.ManagementScience57,915–933.
Cockburn,I.M.,MacGarvie,M.J.,Muller,E.,2010.Patentthickets,licensingandinnovativeperformance.IndustrialandCorporateChange19,899–925.
Cohen,W.M.,Nelson,R.R.,Walsh,J.P.,2000.ProtectingtheirIntellectualAssets:AppropriabilityConditionsandWhyU.S.ManufacturingFirmsPatent(orNot).Cambridge,MA:NBERWorkingPaperNo.7552.
Farrell,J.andMerges,R.P.(2004).IncentivestoChallengeandtoDefendPatents:WhyLitigationWon’tReliablyFixPatentOfficeErrorsandWhyAdministrativePatentReviewMightHelp,BerkeleyTechnologyLawJournal,19(3),943‐970.
Farrell,J.,Shapiro,C.,2008.Howstrongareweakpatents?AmericanEconomicReview

22
98,1347–1369.FederalTradeCommission,2003.ToPromoteInnovation‐TheProperBalanceof
CompetitionandPatentLawandPolicy.Washington,DC:GPO.Availableathttp://www.ftc.gov/reports/innovation/P040101PromotingInnovationandCompetitionrpt0704.pdf
FederalTradeCommission,2011.TheEvolvingIPMarketplace:.AligningPatentNoticeandRemediesWithCompetition.Washington,DC.Availableathttp://www.ftc.gov/os/2011/03/110307patentreport.pdf
Fischer,T.,&Henkel,J.,2012.Patenttrollsonmarketsfortechnology–AnempiricalanalysisofNPEs’patentacquisitions.ResearchPolicy,41(9),1519‐1533.
Graevenitz,vonG.,Wagner,S.,Harhoff,D.,2011.Howtomeasurepatentthickets—Anovelapproach.EconomicsLetters111,1–4.
Graevenitz,vonG.,Wagner,S.,Harhoff,D.,2013.Incidenceandgrowthofpatentthickets:theimpactoftechnologicalopportunitiesandcomplexity.JournalofIndustrialEconomics,61(3),521‐563.
Grindley,P.C.,Teece,D.J.,1997.ManagingIntellectualCapital:LicensingandCross‐LicensinginSemiconductorsandElectronics.CaliforniaManagementReview39,8–41.
Hall,B.H.,2005.ExploringthePatentExplosion.JournalofTechnologyTransfer30,35–48.
Hall,B.H.,Harhoff,D.,2004.PostGrantReviewSystemsattheU.S.PatentOffice‐DesignParametersandExpectedImpact.BerkeleyTechnologyLawJournal19,981–1015.
Hall,B.H.,Helmers,C.,vonGraevenitz,G.,Rosazza‐Bondibene,C.,2012a.Astudyofpatentthickets.DraftReporttotheUKIPO,1–66.
Hall,B.H.,Helmers,C.,Rogers,M.,Sena,V.,2013.Theimportance(ornot)ofpatentstoUKfirms.OxfordEconomicPapers65(3):603‐629.http://dx.doi.org/doi:10.1093/oep/gpt012
Hall,B.H.,Ziedonis,R.H.,2001.Thepatentparadoxrevisited:anempiricalstudyofpatentingintheUSsemiconductorindustry,1979‐1995.RANDJournalofEconomics101–128.
Harhoff,D.andM.Reitzig(2004).DeterminantsofOppositionagainstEPOPatentGrants–TheCaseofBiotechnologyandPharmaceuticals,InternationalJournalofIndustrialOrganization,22(4),443‐480.
Harhoff,D.,2006.PatentQuantityandQualityinEurope‐TrendsandPolicyImplicationsCollection.InB.KahinandF.Foray(eds),AdvancingKnowledgeandtheKnowledgeEconomy.Cambridge,MA:MITPress,331‐350.
Harhoff,D.,Graevenitz,von,G.,Wagner,S.,2015.ConflictResolution,PublicGoodsand

23
PatentThickets.ManagementScience,forthcoming.http://dx.doi.org/10.1287/mnsc.2015.2152
Harhoff,D.,Hall,B.,Graevenitz,G.V.,Hoisl,K.,Wagner,S.,Gambardella,A.,Giuri,P.,2007.TheStrategicUseofPatentsanditsImplicationsforEnterpriseandCompetitionPolicies.FinalreportforECTenderNoENTR/05/82,1–307.
Hegde,D.,Mowery,D.C.,Graham,S.J.H.,2009.PioneeringInventorsorThicketBuilders:WhichU.S.FirmsUseContinuationsinPatenting?ManagementScience55,1214–1226.
Helmers,C.,RogersM.,SchautschickP.,2011.IntellectualPropertyattheFirm‐LevelintheUK:TheOxfordFirm‐LevelIntellectualPropertyDatabase.UniversityofOxford,DepartmentofEconomicsDiscussionPaperNo.546.
Lemley,M.,Shapiro,C.,2005.Probabilisticpatents.JournalofEconomicPerspectives19,75–98.
Lemley,M.,Shapiro,C.,2007.PatentHoldupandRoyaltyStacking.TexasLawReview85:1991.
Lerner,J.,1995.Patentingintheshadowofcompetitors.JournalofLawandEconomics38,463‐495.
Lerner,J.andJ.Tirole,2013.Standard‐EssentialPatents,NBERWorkingPaper19664.Lewis,J.I.D.andR.M.Mott,2013.Theskyisnotfalling:Navigatingthesmartphone
patentthicket,WIPOMagazine,February2013,http://www.wipo.int/wipo_magazine/en/2013/01/article_0002.html
Lybbert,T.J.,Zolas,N.J.2014.GettingPatents&EconomicDatatoSpeaktoEachOther:An‘AlgorithmicLinkswithProbabilities’ApproachforJointAnalysesofPatenting&EconomicActivity.ResearchPolicy43(3),530‐542.
MilgromP.andJ.Roberts,1994.Comparingequilibria.AmericanEconomicReview84(3),441–459.
Palmer,J.A.andK.Kreutz‐Delgado,2003.Ageneralframeworkforcomponentestimation.Proceedingsofthe4thInternationalSymposiumonIndependentComponentAnalysis.
Reitzig,M.,Henkel,J.,Heath,C.,2007.Onsharks,trolls,andtheirpatentprey—Unrealisticdamageawardsandfirms’strategiesof“beinginfringed.”ResearchPolicy36,134–154.
Schmoch,U.,2009.DocumentIPC/CE/41/5,Annex,ConceptionofaTechnologyClassificationforCountryComparisons,41thsessionoftheIPCCommitteeofExperts.1–15.
Shapiro,C.,2000.Navigatingthepatentthicket:Crosslicenses,patentpools,andstandardsetting.Innovationpolicyandtheeconomy1:119–150.

24
Somaya,D.,2003.Strategicdeterminantsofdecisionsnottosettlepatentlitigation.StrategicManagementJournal24,17–38.
Teece,D.,E.Sherry,andP.Grindley,2014.Patentsand"PatentWars"inWirelessCommunications:AnEconomicAssessment,DigiworldEconomicJournal95,85‐98.
U.S.DepartmentofJustice,FederalTradeCommission,2007.AntitrustEnforcementandIntellectualPropertyRights:PromotingInnovationandCompetition,1–217.
Vives,X.,2005.Complementaritiesandgames:Newdevelopments.JournalofEconomicLiteratureXLIII(2),437–479.
WIPO,2011.TheSurgeinWorldwidePatentApplications(No.4/4).WIPO.Availableathttp://www.wipo.int/edocs/mdocs/pct/en/pct_wg_4/pct_wg_4_4.pdf
Ziedonis,R.H.,2004.Don'tFenceMeIn:FragmentedMarketsforTechnologyandthePatentAcquisitionStrategiesofFirms.ManagementScience50,804–820.

25
Appendix A: Data
OuranalysisreliesonanupdatedversionoftheOxford‐Firm‐Level‐Database,whichcombinesinformationonpatents(UKandEPO)withfirm‐levelinformationobtainedfromBureauvanDijk’sFinancialAnalysisMadeEasy(FAME)database(formoredetailsseeHelmersetal.(2011)fromwhichthedatadescriptioninthissectiondraws).Theintegrateddatabaseconsistsoftwocomponents:afirm‐leveldatasetandIPdata.Thefirm‐leveldataistheFAMEdatabasethatcoverstheentirepopulationofregisteredUKfirms.16Theoriginalversionofthedatabase,whichformedthebasisfortheupdatecarriedoutbytheUKIPO,reliedontwoversionsoftheFAMEdatabase:FAMEOctober2005andMarch2009.ThemainmotivationforusingtwodifferentversionsofFAMEisthatFAMEkeepsdetailsof“inactive”firms(seebelow)foraperiodoffouryears.Ifonlythe2009versionofFAMEwereused,intellectualpropertycouldnotbeallocatedtoanyfirmthathasexitedthemarketbefore2005,whichwouldbiasthematchingresults.FAMEisavailablesince2000,whichdefinestheearliestyearforwhichtheintegrateddatasetcanbeconstructedconsistently.TheupdateundertakenbytheUKIPOusedtheApril2011versionofFAME.However,sincetherearesignificantreportingdelaysbycompanies,evenusingtheFAME2011versionmeansthatthelatestyearforwhichfirm‐leveldatacanbeusedreliablyis2009.FAMEcontainsbasicinformationonallfirms,suchasname,registeredaddress,firmtype,industrycode,aswellasentryandexitdates.Availabilityoffinancialinformationvariessubstantiallyacrossfirms.IntheUK,thesmallestfirmsarelegallyrequiredtoreportonlyverybasicbalancesheetinformation(shareholders'fundsandtotalassets).Thelargestfirmsprovideamuchbroaderrangeofprofitandlossinformation,aswellasdetailedbalancesheetdataincludingoverseasturnover.Lackofthesekindsofdataforsmallandmedium‐sizedfirmsmeansthatourstudyfocusesontotalassetsasameasureoffirmsizeandgrowth.ThepatentdatacomefromtheEPOWorldwidePatentStatisticalDatabase(PATSTAT).DataonUKandEPOpatentpublicationsbyBritishentitiesweredownloadedfromPATSTATversionApril2011.Duetotheaverage18monthsdelaybetweenthefilingandpublicationdateofapatent,usingtheApril2011versionmeansthatthepatentdataarepresumablyonlycompleteuptothethirdquarterin2009.Thiseffectivelymeansthatwecanusethepatentdataonlyupto2009underthecaveatthatitmightbesomewhatincompletefor2009.Patentdataareallocatedtofirmsbytheyearinwhichafirmappliedforthepatent.
16FAMEdownloadsdatafromCompaniesHouserecordswherealllimitedcompaniesintheUKareregistered.

26
Sincepatentrecordsdonotincludeanykindofregisterednumberofacompany,itisnotpossibletomergedatasetsusingauniquefirmidentifier;instead,applicantnamesintheIPdocumentsandfirmnamesinFAMEhavetobematched.Bothafirm'scurrentandpreviousname(s)wereusedformatchinginordertoaccountforchangesinfirmnames.Matchingonthebasisofcompanynamesrequiresnamesinbothdatasetstobe`standardized'priortothematchingprocessinordertoensurethatsmall(butoftensystematic)differencesinthewaynamesarerecordedinthetwodatasetsdonotimpedethecorrectmatching.FormoredetailsonthematchingseeHelmersetal.(2011).
[TablesA‐1,A‐2,andA‐3here]
27
Appendix B: Estimating survival models
Thisappendixgivessomefurtherinformationaboutthevarioussurvivalmodelsweestimatedandtherobustnesschecksthatwereperformed.Weestimatedtwogeneralclassesoffailureorsurvivalmodels:1)proportionalhazard,wherethehazardoffailureovertimehasthesameshapeforallfirms,buttheoveralllevelisproportionaltoanindexthatdependsonfirmcharacteristics;and2)acceleratedfailuretime,wherethesurvivalrateisacceleratedordeceleratedbythecharacteristicsofthefirm.Wetransform(2)toahazardratemodelforcomparisonwith(1),usingtheusualidentitybetweentheprobabilityofsurvivaltotimetandtheprobabilityoffailureattgivensurvivaltot‐1.Thefirstmodelhasthefollowingform:
� � first patents in at has no patents in , | iPr i j t i j s t X� �
� �( ), ( , ) i ih X t h t exp X E
whereidenotesafirm,jdenotesatechnologysector,andtdenotesthetimesinceentryintothesample.h(t)isthebaselinehazard,whichiseitheranon‐parametricoraparametricfunctionoftimesinceentryintothesample.Theimpactofanycharacteristicxonthehazardcanbecomputedasfollows:
� � � � � � � �� �
, , 1 , or
,i i
ii i i
h X t h X th t exp X
x x X tE E E
w w
w w
Thusifxismeasuredinlogs,βmeasurestheelasticityofthehazardratewithrespecttox.Notethatthisquantitydoesnotdependonthebaselinehazardh(t),butisthesameforanyt.Weusetwochoicesforh(t):thesemi‐parametricCoxestimateandtheWeibulldistributionptp‐1.ByallowingtheCoxh(t)orptovaryfreelyacrosstheindustrialsectors,wecanallowtheshapeofthehazardfunctiontobedifferentfordifferentindustrieswhileretainingtheproportionalityassumption.Inordertoallowevenmoreflexibilityacrossthedifferentindustrialsectors,wealsousetwoacceleratedfailuretimemodels,thelog‐normalmodelandthelog‐logisticmodel.Thesehavethefollowingbasicform:
log( )log-normal: ( ) 1 i
j
tS t OV
ª º �)« »
« »¬ ¼
11/log-logistic: ( ) 1 ( ) jiS t t JO
�ª º �¬ ¼
whereS(t)isthesurvivalfunctionandλi=exp(Xiβ).Weallowtheparametersσ(log‐normal)orγ(log‐logistic)tovaryfreelyacrossindustries(j).Thatis,forthesemodels,boththemeanandthevarianceofthesurvivaldistributionarespecifictothe2‐digit

28
industry.Inthecaseofthesetwomodels,theelasticityofthehazardwithrespecttoacharacteristicxdependsontimeandontheindustry‐specificparameter(σorγ),yieldingamoreflexiblemodel.Forexample,thehazardrateforthelog‐logisticmodelisgivenbythefollowingexpression:
� �1/ 1 1/
1/
log ( )( )
1 ( )
j j
j
i
j i
td S th tdt t
J J
J
OJ O
� ��
�
Fromthiswecanderivetheelasticityofthehazardratewithrespecttoaregressorx:17
1/
log ( )
(1 ) j
ij
i i
h tx t J
EO
w �
w �
Oneimplicationofthismodelisthereforethatboththehazardandtheelasticityofthehazardwithrespecttotheregressorsdependont,thetimesincethefirmwasatriskofpatenting.Wesamplethefirmsduringasingledecade,the2000s,butsomeofthefirmshavebeeninexistencesincethe19thcentury.Thisfactcreatesabitofaproblemforestimation,becausethereisnoreasontothinkthatthepatentingenvironmenthasremainedstableduringthatperiod.WeexploredvariationsintheassumedfirstdateatriskinTableB‐2,findingthatthechoicemadelittledifference.Accordingly,wehaveusedaminimumatriskyearof1978forestimationinthemaintableinthetext.
[TablesB‐1andB‐2here]
17Weassumethatxisinlogarithms,asistrueforourkeyvariables,sothiscanbeinterepretedasanelasticity.

C Previous Results
To help the reader this appendix summarizes a number of results derived by Graevenitz et al. (2013) aswell as some additional results that are useful.
C.1 The Probability of Patenting a Facet
The probability pk that a firm obtains a patent on a facet is:
pk(f 6k, F,NO(O,o 6k, N)) =NOX
j=0
1
j + 1
✓NO
j
◆NO�jY
l=0
✓1� fl
Fk
◆ NOY
m=NO�j
fmFk
. (C.1)
Then, the expected number of patents a firm owns when it applyies for fi facets is �k ⌘ pkfi.For the comparative statics of entry stage it is useful to know that the elasticity of pk w.r.t. F is negative
if �k <12 :
@pk@Fk
=NOX
i=0
1
i+ 1
✓NO
i
◆(1� �k)
NO�i�ik(�1)
✓NO
Fk
� NO � i
F � f
◆(C.2)
Then the elasticity ✏pk,Fkis:
✏pk,Fk=N2
O
⇣�k � 1
2(1 +1
NO)⌘
1� �k
(C.3)
C.2 The Expected Number of Rival Investors
The expected number of rival firms NO that undertake R&D on the same technology opportunity as firm i
can be expressed as a sum of products:
NO =NX
j=0
j
✓N
j
◆N�jY
l=0
(1� !l)NY
m=N�i
!m. (C.4)
Graevenitz et al. (2013) show that NO is increasing in !n, where n 2 {l,m}.In the second stage equilibrium NO can be rewritten as:
NO =NX
j=0
j
✓N
j
◆(1� !k)
(N�j)!jk. (C.5)
Incumbency Advantage
In the case in which there are incumbents and entrants the expected number of rival firms NO has torewritten slightly. To do this define:
!In ⌘ oIi
�O !E
n ⌘ oEi�O (C.6)
1

We assume that in a previous period Np firms entered and of these a fraction � are still active. Thenthe expected number of rival firms NO that undertake R&D on the same technology opportunity as firm i
is:
NO =�NPX
j=0
j
✓�NP
j
◆(1� !J
k )(N�j)(!J
k )j +
NX
j=0
j
✓N
j
◆(1� !E
k )(N�j)(!E
k )j. (C.7)
C.3 The Expected Number of Facets Covered
In the second stage equilibrium the expected number of facets covered through the joint efforts of all firmsinvesting in a technological opportunity is:
Fk = Fh1� (1� �k)
(NO+1)i
(C.8)
The derivative of this expression with respect to F is positive:
@Fk
@Fk
= 1�⇣1� �k
⌘NO⇣1 + �kNO
⌘� 0 . (C.9)
The elasticities of Fk with respect to fk and F are:
⌘k =�k(1� �k)NO
1� (1� �k)(NO+1)(C.10)
✏Fk,Fk=1� (1� �k)(NO)(1 + �jNO)
1� (1� �k)(NO+1). (C.11)
which shows that 1 � ✏FkFk� 0 as the denominator in the fraction is always greater than the numerator. It
is useful to observe that the upper bound of the elasticity ⌘k is decreasing in NO. To see this note that theelasticity can be expressed as:
⌘k =(1� �k)NO
(No + 1)⇣1� �k
No
2! + �2kNo(NO�1)
3! ...⌘ . (C.12)
This shows that the upper bound of the elasticity decreases in NO: lim�k!0 ⌘k = 1�(NO + 1) 1. Here
we use the binomial expansion of (1� �k)No+1. The expression also shows that the lower bound of ⌘k |�k=1
is zero.
2

D Results
This appendix contains derivations for the propositions set out in Section 2 of the paper.
D.1 Supermodularity of the Second Stage Game
This section sets out the main results needed to show that the second stage of game G⇤ is supermodular.Consider the first order conditions that determine the equilibrium number of facets (f ) and technolog-
ical opportunities (o):
@⇡ik
@oi= V�(sik)� L(�ik, sik)� Co(⌃
Noj=1oj)� �ikCa �
@Cc
@oi= 0 , (D.13)
@⇡ik
@fi=
oipk
Fk
✓V µk⌘ik
�(sik)
sik� Fk
✓@L
@�ik+ Ca
◆�+hV
d�
dsik� @L
@sik
i(1� ⌘ik)
◆= 0 . (D.14)
Now, consider the cross-partial derivatives which must be positive, if the second stage game is supermod-ular. First, we derive the cross partial derivative with respect to firms’ own actions:
@2⇡ik
@oi@fi=
pk
Fk
✓V µk⌘ik
�(sik)
sik� Fk
✓@L
@�ik+ Ca
◆�+hV
d�
dsik� @L
@sik
i(1� ⌘ik)
◆= 0 . (D.15)
This expression corresponds to the first order condition (D.14) for the optimal number of facets.Now consider effects of rivals’ actions on firms’ own actions:
@2⇡k
@oi@om=
@Fk
@om
sik
Fk
"V�
sik(µk � ⇠ik) +
@L
@sik
#+
@pk@om
fi
Fk
"⇣V
d�
dsik� @L
@sik
⌘� Fk
✓@L
@�ik+ Ca
◆#
(D.16)
� @Co
@⌃Noj=1oj
,
@2⇡k
@oi@fm=
@Fk
@fm
sik
Fk
"V�
sik(µk � ⇠ik) +
@L
@sik
#+
@pk@fm
fi
Fk
"⇣V
d�
dsik� @L
@sik
⌘� Fk
✓@L
@�ik+ Ca
◆#,
(D.17)
@2⇡k
@fi@om=
@Fk
@om
"@V
@Fk
+@2V
@Fk2 Fk⌘ik �
@L
@�ik� Ca +
@2L
@sik2sik
Fk
(1� ⌘ik)
#
+@⌘ik@om
⇣V�
sik(µk � ⇠ik) +
@L
@sik
⌘� @pk
@om
"@2L
@�ik2fi +
@2L
@sik2fi
Fk
(1� ⌘ik)
#, (D.18)
@2⇡k
@fi@fm=
@Fk
@fm
"@V
@Fk
�
sik
�⇠ik(1� ✏Fk,f
) + ✏Fk,f
�+
@2V
@Fk2 Fk⌘ik
�
sik� @L
@�ik� Ca +
@2L
@sik2sik
Fk
(1� ⌘ik)
#
+@⌘ik@fm
⇣V�
sik(µk � ⇠ik) +
@L
@sik
⌘� @pk
@fm
"@2L
@�ik2fi +
@2L
@sik2fi
Fk
(1� ⌘ik)
#. (D.19)
The second stage game is supermodular, if the equations (D.16)-(D.19) are non-negative. The fol-
3

lowing results show that the conditions noted in Section 2 above must hold simultaneously if the game issupermodular.
Using the first order condition (D.14), which will hold for any interior equilibrium, it can be shownthat:
"⇣V
d�
dsik� @L
@sik
⌘� Fk
✓@L
@�ik+ Ca
◆#= �⌘ik
V�
sik(µk � ⇠ik) +
@L
@sik
!. (D.20)
If�V �
sik(µk�⇠ik)+
@L@sik
�> 0, then the second term in the cross-partial derivatives (D.16) and (D.17) is the
product of two negative expressions, and then equation (D.17) is positive. Equation (D.16) is also positivein a free entry equilibrium: the negative term at the end is less than the negative term in the derivative ofprofits w.r.t. Nk in Section 2, which is otherwise the same as equation (D.16): @Co
@Nooo > @Co
@Noo.
Turning to equations (D.18) and (D.19) we can show that:
@⌘ik@om
=@2Fk
@fi@om
fi
Fk
� @Fk
@fi
@Fk
@om
fi
Fk2 = �Fk
�1 @Fk
@om
✓�k
1� �k
+ ⌘ik
◆(D.21)
@⌘ik@fm
=@2Fk
@fi@fm
fi
Fk
� @Fk
@fi
@Fk
@fm
fi
Fk2 = �Fk
�1 @Fk
@fm
✓�k
1� �k
+ ⌘ik
◆(D.22)
This result allows us to rewrite equations (D.18) and (D.19) as follows:
@2⇡k
@fi@om=
1
Fk
@Fk
@om
"✓V�
sik(µk � ⇠ik) +
@L
@sik
◆✓1� 2⌘ik �
�
1� �
◆+
@2V
@Fk2 Fk⌘ik +
@2L
@sik2sik
Fk
(1� ⌘ik)
#
� @pk@om
"@2L
@�ik2fi +
@2L
@sik2fi
Fk
(1� ⌘ik)
#, (D.23)
@2⇡k
@fi@fm=
1
Fk
@Fk
@fm
"✓V�
sik(µk � ⇠ik) +
@L
@sik
◆✓1� 2⌘ik �
�
1� �
◆+
@2V
@Fk2 Fk⌘ik +
@2L
@sik2sik
Fk
(1� ⌘ik)
#
� @pk@fm
"@2L
@�ik2fi +
@2L
@sik2fi
Fk
(1� ⌘ik)
#. (D.24)
Given assumptions (VF) and (LC) these two equations will be positive if�V �
sik(µk � ⇠ik) +
@L@sik
�> 0 and⇣
1� 2⌘ik � �1��
⌘> 0. We analyze each condition in more detail next:
1. Given our assumptions on the legal cost function (LC, eq. 4) the condition�V 4(sk)
sk(µk� ⇠k+
@L@sk
�>
0 , V 4(sk)sk
(µk � ⇠k > � @L@sk
implies that µk > ⇠k. The elasticity of the value function w.r.t.additional covered patents must exceed the elasticity of the portfolio benefits function w.r.t. theshare of patents held by the firm. This condition is less restrictive than the assumption in Graevenitzet al. (2013) that µk > 1, since we are assuming that ⇠k < 1.
2. (1 � 2⌘k) � �k
1��k> 0 , (1 � 2�) > (1 � �)(NO+1). This holds for any �k < 1
2 and No suffi-ciently large. These restrictions imply a setting in which the ownership of patents belonging to eachopportunity is fragmented amongst many firms. It is more likely to arise if the technology is highlycomplex, otherwise the condition that �k <
12 is less likely to hold.
4

In Appendix D.4 we derive the conditions under which the equilibrium of game G⇤ is unique. If there isa unique solution to the optimization problem of the firm at which profits are maximized, then this requiresthat @2⇡k/@f 2 < 0. The restrictions that i) µk < 1 and ii) the share of overall profits which the firm obtainsis decreasing at the margin in the share of patents the firm holds (@2�/@s2k < 0) ensure that there is alwayssuch a unique interior solution.
In this game G⇤ the comparative statics of patenting are the same as in the main model analyzed inGraevenitz et al. (2013). Specifically we can show that the following effects hold in this game:
@2⇡
@oi@Fk
> 0,@2⇡
@fi@Fk
> 0,@2⇡
@oi@Ok
< 0,@2⇡
@fi@Ok
< 0 (D.25)
This implies that complexity of the technology increases firms’ patent applications while increased tech-nological opportunity reduces firms’ patenting applications.
D.2 Effect of Hold-up on Patenting
Here we show that Proposition 2 holds. Consider the following cross-partial derivatives for the effects ofhigher legal costs L due to hold-up:
@2⇡k
@o@hk
= �@L(�k, sk, hk)
@hk
< 0 , (D.26)
@2⇡k
@f@hk
= � opk
Fk
✓Fk
✓@2L
@�k@hk
◆+
@2L
@sk@hk
(1� ⌘k)
◆< 0 . (D.27)
The first of these conditions shows that the expected legal costs of hold-up reduce the number of opportu-nities a firm invests in, in equilibrium. The second condition shows that firms with larger portfolios will bemore exposed to hold up and will benefit less from the share of patents they have patented per opportunity.Both of these effects reduce the number of facets each firm applies for.
D.3 Free Entry EquilibirumProposition 3There is a free entry equilibrium at which the marginal entrant can just break even, if R&D fixed costs per
opportunity (Co) increase in the number of entrants.
In a free entry equilibrium it must be the case that the following conditions hold:
⇡k(ok, fk, Nk) > 0 ^ ⇡k(ok, fk, Nk + 1) < 0 . (D.28)
The effect of entry on profits at the first stage of game G⇤ can be shown to be:
@⇡(o, f)
@Nk
= o@NO
@Nk
sk
Fk
@Fk
@NO
V µ�(sk)
sk�✓V (Fk)
@�
@sk� @L
@sk
◆�
5

+@pk@NO
f
Fk
"✓V (Fk)
@�
@sk� @L
@sk
◆� Fk
✓@L
@�k+ Ca
◆#� @Co
@Nooo
!. (D.29)
This expression can be further simplified:
@⇡(o, f)
@Nk
= o✏NO,NskN
�✏Fk,No
� ✏pk,No ⌘k�
V�(sk)
sk
⇣µk � ⇠k
⌘+
@L
@sk
�� @Co
@Noo
Noo
sk
!. (D.30)
The first two terms in brackets in this derivative are positive and so is the third term. We can show thatthe limits of ✏Fk,No
and ✏Fk,fin No are both zero. Therefore the above derivative is negative as long as the
R&D fixed costs per opportunity are increasing in No. This is the condition set out in Proposition 3.
D.4 Uniqueness of the second stage equilibrium
We show that stage 2 of game G⇤ is supermodular. This implies that there exists at least one equilibrium ofthe stage game. An alternative way of deriving existence of the second stage equilibrium for game G⇤ is toanalyze the conditions under which the Hessian of second derivatives of the profit function (H⇡) is negativesemidefinite. This matrix consists of four derivatives of which only one leads to additional restrictions onthe model.
It is easy to see that @2⇡@oi2
< 0 due to the coordination costs Cc(oi) and the restrictions we impose withassumption (FVC). The two cross-partial derivatives are both zero in equilibrium - refer to equation D.15.
Therefore, the only expression that remains to analyze is @2⇡@fi
2 .
@2⇡
@fi2 =
oipk
Fk
"@2V
@Fk2
@Fk
@fi
!2�Fk
pk+ 2
@V
@Fk
@Fk
@fi
d�
dsik(1� ⌘ik) + V
d2�
s2ik
pk
Fk
(1� ⌘ik)2
� @2L
@�ik2p2k �
@2L
@sik2
✓@sik@fi
◆2
� 2
✓V
d�
dsik� @L
@sik
◆(1� ⌘ik) ⌘ik
fi
#.
This can be further simplified:
@2⇡
@fi2 =
oipk
Fk
"@2V
@Fk2
@Fk
@fi
!2�Fk
pk+ V
d2�
s2ik
pk
Fk
(1� ⌘ik)2 � @2L
@�ik2p2k
� @2L
@sik2pk
Fk
(1� ⌘ik)2 � 2
✓V�
sik⇠ik(1� µk)�
@L
@sik
◆(1� ⌘ik) ⌘ik
fi
#. (D.31)
If we impose the restriction that the second derivative of the value function is negative and that theelasticity of the value function, µk < 1, then the first and the last terms in the above expression arenegative. The sign of the second term in the expression depends on sign{ @2�
@sik2}, which we will assume isnegative. The third and fourth terms in the above expression are negative given the conditions imposed onthe legal cost function above.
6

D.5 Entry and Incumbency
In this section we analyze a game in which incumbents have lower costs of entry and demonstrate that ourmain predictions are robust.
We assume that a fraction � (0 < � < 1) of the previously active NP firms remain as incumbents. Thefirms enter until the marginal profit from entry is reduced to zero.
Objective Functions
First, consider the objective functions of incumbents and entrants and the patenting game they are involvedin. We analyze this game and show when it is supermodular.
Given symmetry of technological opportunities (Assumption S) the expected value of patenting forentrant and incumbent firm’s in a technology area k is:
⇡Iik(o
Ii , f
Ii ) =oIi
0
@V (Fk)�(sIik)� L(�Iik, s
Iik)�
0
@Co(NP��1+NEX
j=1
oj)�
1
A� f Ii pkCa
1
A� Cc(oIi ) .
(D.32)
⇡Eik(o
Ei , f
Ei ) =oEi
0
@V (Fk)�(sEik)� L(�Eik, s
Eik)� Co(
NP�+NE�1X
j=1
oj)� fEi pkCa
1
A� Cc(oEi ) . (D.33)
Define a game GE in which:
• There are NP� incumbent firms and the number of entrants, NE , is determined by free entry.
• Entrants and incumbents simultaneously choose the number of technological opportunities oIi , oEi 2[0, On] and the number of facets applied for per opportunity f I
i , fEi 2 [0, F n]. Firms’ strategy sets
Sn are elements of R4.
• Firms’ payoff functions ⇡ik, defined at (D.32,D.33), are twice continuously differentiable and de-pend only on rivals’ aggregate strategies.
• Assumptions (VF, eqn. 1) and (LC, eqn. 4) describe how the expected value and the expected costof patenting depend on the number of facets owned per opportunity.
Firms’ payoffs depend on their rivals’ aggregate strategies because the probability of obtaining a patenton a given facet is a function of all rivals’ patent applications. Note that the game is symmetric withinthe two groups of firms as it is exchangeable in permutations of the players. This implies that symmetricequilibria exist, if the game can be shown to be supermodular (Vives, 2005).1
1Note also that only symmetric equilibria exist as the strategy spaces of players are completely ordered.
7

First order conditions for game GE:
@⇡Iik
@oIi= V�(sik)� L(�ik, sik)�
0
@Co(NP��1+NEX
j=1
oj)�
1
A� �ikCa �@Cc
@oIi= 0 , (D.34)
@⇡Iik
@f Ii
=oIi pk
Fk
✓V µ✏Fkfi
4(sik)
sik� Fk
✓@L
@�ik+ Ca
◆�+hV@4(sik)
@sik� @L
@sik
i(1� ⌘ik)
◆= 0 ,
(D.35)
@⇡Eik
@oEi= V�(sik)� L(�ik, sik)� Co(
NP�+NE�1X
j=1
oj)� �ikCa �@Cc
@oEi= 0 , (D.36)
@⇡Eik
@fEi
=oEi pk
Fk
✓V µ✏Fkfi
4(sik)
sik� Fk
✓@L
@�ik+ Ca
◆�+hV@4(sik)
@sik� @L
@sik
i(1� ⌘ik)
◆= 0 .
(D.37)
Proposition 7In game GE
the equilibrium number of facets chosen by incumbents and entrants is the same: f I = fE.
We show in Appendix C.2 that in the game with incumbents the number of rivals per opportunity NO
becomes a function of both oI , oE . The first order conditions determining f I , fE both depend on the totalnumber of entrants per technological opportunity NO and so both on oI , oE . This is the only way in whichrivals’ choices of the number of opportunities to pursue enter these first order conditions2. Therefore thetwo conditions are identical and Proposition 7 holds.
Proposition 8The second stage of game GE
is smooth supermodular under the same conditions as game G⇤. Comparative
statics results for game G⇤also apply to game GE
.
The first order conditions characterizing the game with incumbents and entrants are identical to thosefor the game without incumbents as long as = 0. As this variable is a constant it does not enterinto the second order conditions which we analyze to establish supermodularity and which underpin thecomparative statics predictions in Propositions 4-6.
Proposition 9In the second stage of game GE
incumbents enter more technological opportunities, if they have a cost
advantage in undertaking R&D ( > 0).
The first order conditions determining the equilibrium number of opportunities chosen by incumbents andentrants are identical if firms R&D fixed costs per opportunity are the same ( = 0). Therefore oI| =0 = oE .As the cost advantage of incumbents in undertaking R&D grows this increases the number of opportunitieschosen by incumbents:
@2⇡Iik
@oI@ = 1 > 0 . (D.38)
2Clearly the factors outside the brackets in equations (D.35), (D.37) also depend on these variables, but these do not affectthe equilibrium values of fE
i , f Ij .
8

Proposition 10In the second stage of game GE
the number of entrants decreases as the cost advantage of incumbents
increases.
Due to the supermodularity of the second stage game, increases in incumbents’ choices of the numberof opportunities to invest in will raise the number of opportunities entrants invest in as well as the numbersof facets entrants and incumbents seek to patent in equilibrium. The increases in oI and oE will raise thefixed costs of entry into new opportunities, Co, which then reduces entry.
ReferencesGRAEVENITZ, G., S. WAGNER, AND D. HARHOFF (2013): “Incidence and Growth of Patent Thickets: The Impact
of Technological Opportunities and Complexity,” The Journal of Industrial Economics, 61, 521–563.
VIVES, X. (2005): “Complementarities and Games: New Developments,” Journal of Economic Literature, XLIII,437–479.
9

Technology categories GB pats EP pats Total GB pats EP patsElec machinery, energy 1,321 1,101 2,422 6.1% 4.4%Audio‐visual tech 633 549 1,182 2.9% 2.2%Telecommunications 1,181 1,206 2,386 5.5% 4.8%Digital communication 590 732 1,323 2.7% 2.9%Basic comm processes 302 146 447 1.4% 0.6%Computer technology 1,481 1,302 2,783 6.8% 5.2%IT methods for mgt 256 224 480 1.2% 0.9%Semiconductors 269 248 518 1.2% 1.0%Optics 392 481 873 1.8% 1.9%Measurement 1,216 1,458 2,674 5.6% 5.8%Analysis bio materials 132 426 557 0.6% 1.7%Control 592 542 1,134 2.7% 2.2%Medical technology 996 1,561 2,558 4.6% 6.3%Organic fine chemistry 182 1,538 1,720 0.8% 6.2%Biotechnology 193 950 1,143 0.9% 3.8%Pharmaceuticals 277 1,876 2,153 1.3% 7.5%Polymers 114 280 394 0.5% 1.1%Food chemistry 88 458 547 0.4% 1.8%Basic materials chemistry 314 1,050 1,363 1.5% 4.2%Materials metallurgy 161 318 479 0.7% 1.3%Surface tech coating 287 284 571 1.3% 1.1%Chemical engineering 507 724 1,231 2.3% 2.9%Environmental tech 296 344 640 1.4% 1.4%Handling 996 813 1,809 4.6% 3.3%Machine tools 428 356 784 2.0% 1.4%Engines,pumps,turbine 887 942 1,829 4.1% 3.8%Textile and paper mach 235 304 539 1.1% 1.2%Other spec machines 742 623 1,365 3.4% 2.5%Thermal process and app 410 261 671 1.9% 1.0%Mechanical elements 1,149 854 2,002 5.3% 3.4%Transport 1,063 930 1,993 4.9% 3.7%Furniture, games 1,064 612 1,675 4.9% 2.5%Other consumer goods 630 507 1,137 2.9% 2.0%Civil engineering 2,237 960 3,196 10.3% 3.8%Total 21,619 24,959 46,578
Electrical engineering 6,032 5,508 11,540 27.9% 22.1%Instruments 3,328 4,468 7,796 15.4% 17.9%Chemistry 2,418 7,822 10,240 11.2% 31.3%Mechanical engineering 5,910 5,083 10,993 27.3% 20.4%Other Fields 3,930 2,079 6,009 18.2% 8.3%* Weighting by owners does not affect the numbers, since they all get added back into the same cell.Weighting by classes means that a patent in multiple TF34 sectors is downweighted in each of the sectors.
Weighted by #owners & #classes* Sector shares
Table 1Patenting by Fame firms on Patstat (priority years 2002‐2009)

Technology categoriesAggregate
EPO patentsNumber of
EPO triples@Triples per
1000 patents
US Citation network density#
Average non‐patent
referencesElec machinery, energy 56,714 7751 136.7 39.4 0.420Audio‐visual tech 34,131 13268 388.7 63.5 0.449Telecommunications 62,288 27049 434.3 79.1 1.235Digital communication 36,975 16529 447.0 178.5 1.397Basic comm processes 10,035 2289 228.1 110.8 1.162Computer technology 60,577 21956 362.4 54.3 1.529IT methods for mgt 9,312 34 3.7 144.2 0.920Semiconductors 24,544 9974 406.4 94.0 1.070Optics 28,458 7767 272.9 58.0 0.806Measurement 44,320 2503 56.5 45.6 1.000Analysis bio materials 11,787 26 2.2 319.4 7.040Control 17,612 308 17.5 112.1 0.445Medical technology 66,062 4411 66.8 206.2 0.614Organic fine chemistry 41,137 3993 97.1 32.9 5.253Biotechnology 33,192 365 11.0 89.6 17.332Pharmaceuticals 52,671 11222 213.1 76.6 6.391Macromolecular chemistry 21,307 3722 174.7 92.7 1.236Food chemistry 9,955 140 14.1 326.3 2.701Basic materials chemistry 27,679 1929 69.7 84.8 1.498Materials metallurgy 16,935 405 23.9 91.7 1.130Surface tech coating 17,429 363 20.8 59.4 0.803Chemical engineering 24,494 443 18.1 66.2 0.797Environmental tech 12,708 858 67.5 206.9 0.487Handling 30,343 252 8.3 66.9 0.137Machine tools 24,040 508 21.1 64.0 0.191Engines,pumps,turbine 32,602 6678 204.8 85.4 0.210Textile and paper mach 23,145 2640 114.1 84.9 0.312Other spec machines 29,826 319 10.7 65.7 0.422Thermal process and app 15,290 335 21.9 146.3 0.189Mechanical elements 32,716 1301 39.8 57.8 0.168Transport 48,875 10929 223.6 68.3 0.203Furniture, games 19,847 206 10.4 107.6 0.166Other consumer goods 19,734 301 15.3 105.6 0.194Civil engineering 28,817 171 5.9 117.1 0.150Total 1,025,555 160,945 156.9 100.3 0.800
Electrical engineering 294,575 98,850 335.6 60.4 1.042Instruments 168,239 15,015 89.2 96.3 1.181Chemistry 257,507 23,440 91.0 71.1 4.977Mechanical engineering 236,836 22,962 97.0 70.1 0.227Other Fields 68,398 678 9.9 110.8 0.167
@ Triples based on all EPO patenting, priority years 2002‐2009 (see text for definition and further explanation).# Network density is 1,000,000 times the number of within technology citations between 1976 and the current year divided by the potential number of such citations.
UKIPO and EPO patents: numbers, triples and network density 2002‐2009Table 2

VariableLog (network density) 0.115*** 0.127*** 0.107*** 0.184***
(0.024) (0.023) (0.021) (0.052)Log (triples density ‐0.138*** ‐0.139*** ‐0.101*** ‐0.100*** in class) (0.011) (0.011) (0.010) (0.023)Log (patents in class) 0.317*** 0.506*** 0.545*** 0.514*** 0.822***
(0.025) (0.031) (0.030) (0.027) (0.071)5‐year growth of non‐ 0.060*** 0.084*** 0.072*** ‐0.009 0.103* patent refs in class) (0.022) (0.022) (0.022) (0.021) (0.056)Log assets 0.270*** 0.270*** 0.270*** 0.142*** 0.513***
(0.011) (0.011) (0.011) (0.013) (0.083)Log firm age in years 1.135*** 1.135*** 1.136*** 0.773*** 0.767***
(0.104) (0.104) (0.104) (0.130) (0.131)Log (pats applied for 0.836*** 0.836*** by firm previously) (0.021) (0.021)Log (network density) ‐0.010* * Log assets (0.006)Log (triples density) ‐0.001 * Log assets (0.003)Log (patents in class) ‐0.040*** * Log assets (0.008)Log (average NPL refs) ‐0.015** * Log assets (0.006)Industry dummies stratified# stratified# stratified# stratified# stratified#Year dummies yes yes yes yes yesLog likelihood ‐65.96 ‐65.86 ‐65.84 ‐58.69 ‐58.67Degrees of freedom 12 12 13 14 18Chi‐squared 1270.6 1429.1 1517.2 3465.1 3458.6
The sample is matched on size class, sector, and age class. Estimates are weighted by sampling probability.Coefficients for the hazard of entry into a patenting class are shown.Standard errors are clustered on firm. *** (**) denote significance at the 1% (5%) level.
# Estimates are stratified by industry ‐ each industry has its own baseline hazard.
Table 3Hazard of entry into patenting in a TF34 Class
538,452 firm‐TF34 observations with 10,665 entries (20,384 firms)
Cox Proportional Hazard Model
Time period is 2002‐2009 and minimum entry year is 1978. Sample is UK firms with nonmissing assets, all patenting firms and a matched sample of non‐patenting firms

Number of sectors
Number of firms
Number of entries
1 2,531 2,5312 1,347 2,6943 647 1,9414 271 1,0845 155 7756 71 4267 45 3158 29 2329 20 18010 14 14011 4 4412 2 2413 3 3914 0 0
15 or more 13 240Total 5,152 10,665
Table A1Number of TF34 sectors entered
between 2002 and 2009
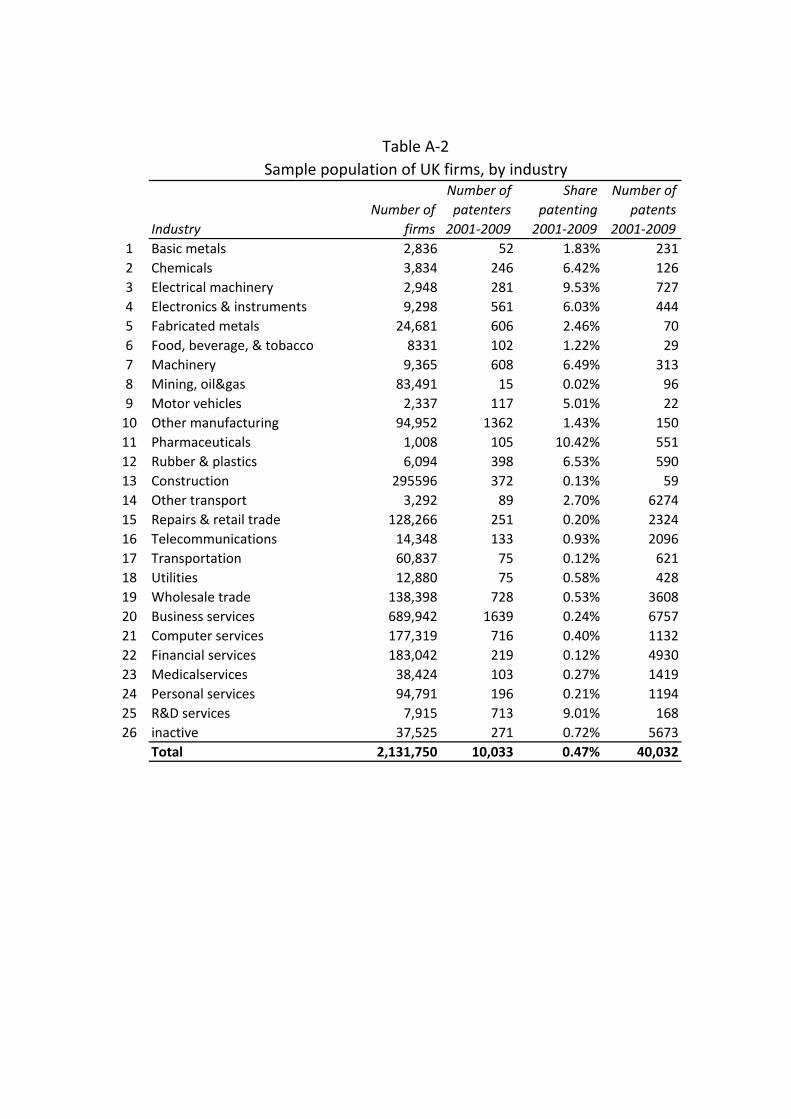
IndustryNumber of
firms
Number of patenters 2001‐2009
Share patenting 2001‐2009
Number of patents
2001‐20091 Basic metals 2,836 52 1.83% 2312 Chemicals 3,834 246 6.42% 1263 Electrical machinery 2,948 281 9.53% 7274 Electronics & instruments 9,298 561 6.03% 4445 Fabricated metals 24,681 606 2.46% 706 Food, beverage, & tobacco 8331 102 1.22% 297 Machinery 9,365 608 6.49% 3138 Mining, oil&gas 83,491 15 0.02% 969 Motor vehicles 2,337 117 5.01% 2210 Other manufacturing 94,952 1362 1.43% 15011 Pharmaceuticals 1,008 105 10.42% 55112 Rubber & plastics 6,094 398 6.53% 59013 Construction 295596 372 0.13% 5914 Other transport 3,292 89 2.70% 627415 Repairs & retail trade 128,266 251 0.20% 232416 Telecommunications 14,348 133 0.93% 209617 Transportation 60,837 75 0.12% 62118 Utilities 12,880 75 0.58% 42819 Wholesale trade 138,398 728 0.53% 360820 Business services 689,942 1639 0.24% 675721 Computer services 177,319 716 0.40% 113222 Financial services 183,042 219 0.12% 493023 Medicalservices 38,424 103 0.27% 141924 Personal services 94,791 196 0.21% 119425 R&D services 7,915 713 9.01% 16826 inactive 37,525 271 0.72% 5673
Total 2,131,750 10,033 0.47% 40,032
Table A‐2Sample population of UK firms, by industry

Technology
Total patenting in sector by GB
firmsFirst time patenter
Patented previously in another
tech Total entryFirst time patenter
Patented previously in another
techElec machinery, energy 1763.7 214 250 26.3% 12.1% 14.2%Audio‐visual tech 788.3 148 192 43.1% 18.8% 24.4%Telecommunications 1874.4 146 179 17.3% 7.8% 9.5%Digital communication 1054.0 92 141 22.1% 8.7% 13.4%Basic comm processes 256.5 21 93 44.4% 8.2% 36.3%Computer technology 2167.2 291 251 25.0% 13.4% 11.6%IT methods for mgt 283.2 117 157 96.7% 41.3% 55.4%Semiconductors 347.2 38 118 44.9% 10.9% 34.0%Optics 584.7 55 130 31.6% 9.4% 22.2%Measurement 1765.3 226 269 28.0% 12.8% 15.2%Analysis bio materials 339.0 39 111 44.3% 11.5% 32.7%Control 712.1 165 241 57.0% 23.2% 33.8%Medical technology 1668.4 184 209 23.6% 11.0% 12.5%Organic fine chemistry 1569.4 36 83 7.6% 2.3% 5.3%Biotechnology 701.6 41 99 20.0% 5.8% 14.1%Pharmaceuticals 1700.7 54 80 7.9% 3.2% 4.7%Polymers 224.4 27 112 61.9% 12.0% 49.9%Food chemistry 492.7 36 87 25.0% 7.3% 17.7%Basic materials chemistry 1020.2 85 144 22.4% 8.3% 14.1%Materials metallurgy 360.8 54 109 45.2% 15.0% 30.2%Surface tech coating 400.7 77 195 67.9% 19.2% 48.7%Chemical engineering 842.7 142 213 42.1% 16.9% 25.3%Environmental tech 446.6 106 166 60.9% 23.7% 37.2%Handling 1326.3 274 290 42.5% 20.7% 21.9%Machine tools 577.8 106 180 49.5% 18.3% 31.2%Engines,pumps,turbine 1443.4 82 160 16.8% 5.7% 11.1%Textile and paper mach 442.0 77 137 48.4% 17.4% 31.0%Other spec machines 847.4 180 234 48.9% 21.2% 27.6%Thermal process and app 455.7 105 159 57.9% 23.0% 34.9%Mechanical elements 1445.9 223 317 37.3% 15.4% 21.9%Transport 1288.2 213 236 34.9% 16.5% 18.3%Furniture, games 1239.2 288 223 41.2% 23.2% 18.0%Other consumer goods 788.1 194 246 55.8% 24.6% 31.2%Civil engineering 2045.8 463 255 35.1% 22.6% 12.5%Total 33263.6 4599 6066 32.1% 13.8% 18.2%
Electrical engineering 8534.5 1067 1381 28.7% 12.5% 16.2%Instruments 5069.5 669 960 32.1% 13.2% 18.9%Chemistry 7760.0 658 1288 25.1% 8.5% 16.6%Mechanical engineering 7826.7 1260 1713 38.0% 16.1% 21.9%Other Fields 4073.0 945 724 41.0% 23.2% 17.8%
Table A3Entry into techology area 2002‐2009
Numbers Shares

Variable Cox PH Weibull Log logistic Log normalLog (network density) 0.108*** 0.111*** 0.308*** 0.247***
(0.021) (0.021) (0.096) (0.040)Log (triples density ‐0.100*** ‐0.098*** ‐0.511*** ‐0.258*** in class) (0.010) (0.010) (0.071) (0.024)Log (patents in class) 0.513*** 0.513*** 2.177*** 1.095***
(0.027) (0.027) (0.304) (0.089)5‐year growth of non‐ (0.013) ‐0.001 ‐0.077 ‐0.039 patent refs in class) (0.022) (0.021) (0.084) (0.038)Log assets 0.149*** 0.130*** 0.529*** 0.198***
(0.013) (0.013) (0.082) (0.024)Log (pats applied for 0.848*** 0.860*** 5.685*** 3.973*** by firm previously) (0.021) (0.019) (0.917) (0.368)Industry dummies stratified# stratified# stratified# stratified#Year dummies yes yes yes yesLog likelihood ‐58.8 ‐96,051.0 ‐114,127.0 ‐111,662.1Degrees of freedom 13 38 38 38Chi‐squared 3183.2 4560.1 168.4 300.1
*** (**) denote significance at the 1% (5%) level.Time period is 2002‐2009 and minimum entry year is 1978. Sample is all UK firms with nonmissing assets.AFT ‐ Accelerated Failure Time models# Estimates are stratified by industry ‐ each industry has its own baseline hazard.
All estimates are weighted estimates, weighted by sampling probability. For the Cox and Weibull models, coefficients shown are elasticities of the hazard w.r.t. the variable. For the log‐logistic, ‐beta is shown.
538,452 firm‐TF34 observations with 10,665 entries (20,384 firms)Proportional hazard AFT
Table B‐1Hazard of entry into patenting in a TF34 Class ‐ Comparing models

Variable (1) (2) (3) (4) (5)Log (network density) 0.107*** ‐0.008 0.114*** 0.107*** 0.108***
(0.021) (0.019) (0.024) (0.021) (0.021)Log (triples density ‐0.101*** ‐0.183*** ‐0.114*** ‐0.103*** ‐0.103*** in class) (0.010) (0.008) (0.011) (0.009) (0.009)Log (patents in class) 0.514*** 0.623*** 0.605*** 0.520*** 0.518***
(0.027) (0.024) (0.031) (0.027) (0.027)5‐year growth of non‐ ‐0.009 ‐0.196*** ‐0.002 ‐0.012 ‐0.012 patent refs in class) (0.021) (0.020) (0.025) (0.021) (0.021)Log assets 0.142*** 0.138*** 0.186*** 0.139*** 0.146***
(0.013) (0.013) (0.018) (0.013) (0.013)Log firm age in years 0.773*** 0.588*** 0.739*** 0.778*** 0.021
(0.130) (0.145) (0.155) (0.131) (0.246)Log (lagged firm‐level 0.836*** 0.947*** 0.954*** 0.840*** 0.878*** patent stock) (0.021) (0.019) (0.033) (0.021) (0.021)Year dummies yes yes yes yes yes
Observations 538,452 692,038 452,313 523,547 538,452Firms 20,384 20,384 17,993 20,384 20,384Entries 10,665 10,665 8,149 10,340 10,665Entry rate 1.98% 1.54% 1.96% 1.97% 1.98%Log likelihood ‐58.69 ‐54.60 ‐40.59 ‐56.94 ‐53.81Degrees of freedom 14 14 14 14 14Chi‐squared 3465.1 5065.8 1688.8 3459.1 3137.4
*** (**) denote significance at the 1% (5%) level.
Weibull model stratified by industry. (1) Estimates from Table 3, for comparison.
(3) SMEs: firms with assets>12.5 million GBP removed. (4) The Telecom tech sector is removed. (5) The minimum founding year is 1900 instead of 1978.
(2) Observations for tech sectors of firms whose industry has no such patenting (Lybbert‐Kolas) and where there is no entry by any UK firm in that industry are included.
All estimates are weighted estimates, weighted by sampling probability. Coefficients shown are negative of the estimates (larger coefficient increases entry probability).
Time period is 2002‐2009 and minimum entry year is 1978. Sample is UK firms with nonmissing assets, all patenting firms and a matched sample of non‐patenting firms
Hazard of entry into patenting in a TF34 Class ‐ RobustnessTable B‐2