Embed Size (px)
Citation preview
0.
Technology adoption and the multiple dimensions offood security: the case of maize in Tanzania
Emiliano Magrini 1 Mauro Vigani 2
1Economic and Social Affairs (ESA), Food and Agricultural Organization, Rome, Italy
2European Commission, JRC-IPTS, Seville, Spain
3rd AIEAA Conference, Alghero, 25-27 June 2014
Magrini and Vigani, 2014 Technology Adoption and Food Security 3rd AIEAA Conference 1 / 20
0.
Outline of the presentation
1 Introduction
2 Methodology
3 Variables and Data
4 Empirical Results
5 Conclusions
6 Appendix
Magrini and Vigani, 2014 Technology Adoption and Food Security 3rd AIEAA Conference 2 / 20
1. Introduction
Introduction
Lack of adequate productive resources is one of the most severe causes of foodinsecurity. Agricultural technologies have a special role because they might boostcrop productivity, allowing for higher production and lower food prices and -potentially - increasing welfare
Many authors try to estimate the impact of technology adoption on HH welfareusing indirect monetary (income and expenditure) and/or production measures(farm production and yields), and its consequent effect on synthetic povertyindexes
Overall, this strand of literature shows that technologies have a positive impact onwelfare for some African countries (i.e. Ethiopia, Nigeria, Tanzania, Uganda andZambia) and contribute to reduce poverty.
However, monetary and production indicators can only partially capture the impacton food availability and food access while a number of further assumptions arenecessary to impute also a causal relationship with food utilization and stability.
Magrini and Vigani, 2014 Technology Adoption and Food Security 3rd AIEAA Conference 3 / 20
1. Introduction
Aim and Added Values
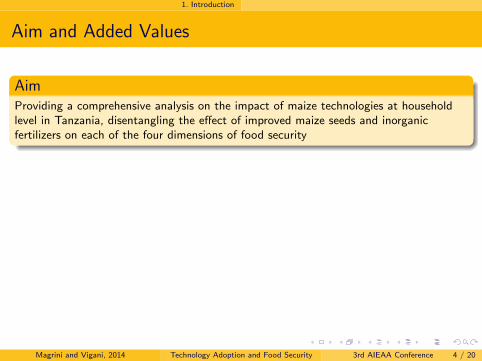
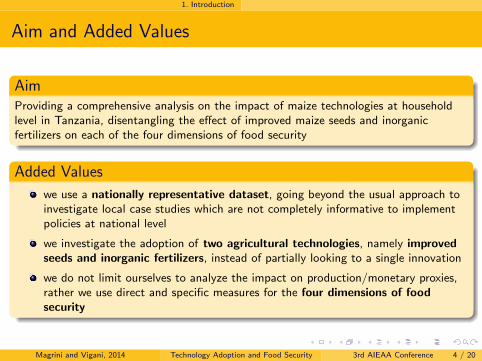
AimProviding a comprehensive analysis on the impact of maize technologies at householdlevel in Tanzania, disentangling the effect of improved maize seeds and inorganicfertilizers on each of the four dimensions of food security
Added Values
we use a nationally representative dataset, going beyond the usual approach toinvestigate local case studies which are not completely informative to implementpolicies at national level
we investigate the adoption of two agricultural technologies, namely improvedseeds and inorganic fertilizers, instead of partially looking to a single innovation
we do not limit ourselves to analyze the impact on production/monetary proxies,rather we use direct and specific measures for the four dimensions of foodsecurity
Magrini and Vigani, 2014 Technology Adoption and Food Security 3rd AIEAA Conference 4 / 20
1. Introduction
Aim and Added Values
AimProviding a comprehensive analysis on the impact of maize technologies at householdlevel in Tanzania, disentangling the effect of improved maize seeds and inorganicfertilizers on each of the four dimensions of food security
Added Values
we use a nationally representative dataset, going beyond the usual approach toinvestigate local case studies which are not completely informative to implementpolicies at national level
we investigate the adoption of two agricultural technologies, namely improvedseeds and inorganic fertilizers, instead of partially looking to a single innovation
we do not limit ourselves to analyze the impact on production/monetary proxies,rather we use direct and specific measures for the four dimensions of foodsecurity
Magrini and Vigani, 2014 Technology Adoption and Food Security 3rd AIEAA Conference 4 / 20
1. Introduction
Linking Technology Adoption to FS pillars: Hypotheses
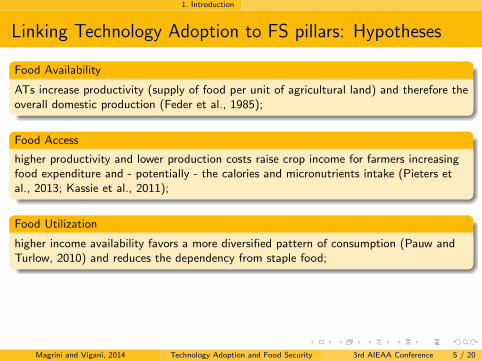
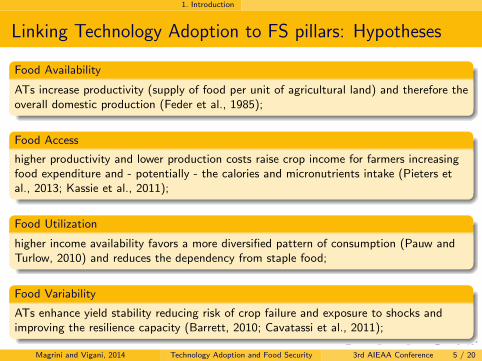
Food Availability
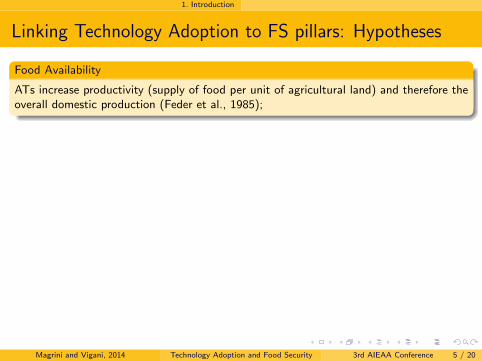
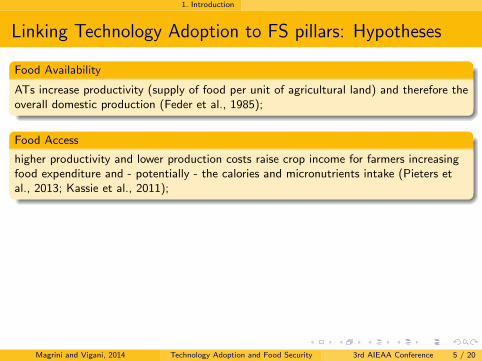
ATs increase productivity (supply of food per unit of agricultural land) and therefore theoverall domestic production (Feder et al., 1985);
Food Access
higher productivity and lower production costs raise crop income for farmers increasingfood expenditure and - potentially - the calories and micronutrients intake (Pieters etal., 2013; Kassie et al., 2011);
Food Utilization
higher income availability favors a more diversified pattern of consumption (Pauw andTurlow, 2010) and reduces the dependency from staple food;
Food Variability
ATs enhance yield stability reducing risk of crop failure and exposure to shocks andimproving the resilience capacity (Barrett, 2010; Cavatassi et al., 2011);
Magrini and Vigani, 2014 Technology Adoption and Food Security 3rd AIEAA Conference 5 / 20
1. Introduction
Linking Technology Adoption to FS pillars: Hypotheses
Food Availability
ATs increase productivity (supply of food per unit of agricultural land) and therefore theoverall domestic production (Feder et al., 1985);
Food Access
higher productivity and lower production costs raise crop income for farmers increasingfood expenditure and - potentially - the calories and micronutrients intake (Pieters etal., 2013; Kassie et al., 2011);
Food Utilization
higher income availability favors a more diversified pattern of consumption (Pauw andTurlow, 2010) and reduces the dependency from staple food;
Food Variability
ATs enhance yield stability reducing risk of crop failure and exposure to shocks andimproving the resilience capacity (Barrett, 2010; Cavatassi et al., 2011);
Magrini and Vigani, 2014 Technology Adoption and Food Security 3rd AIEAA Conference 5 / 20
2. Methodology
Matching Techniques
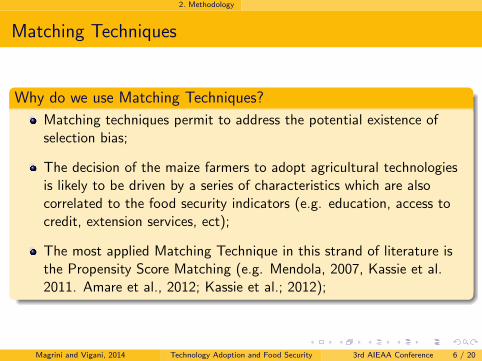
Why do we use Matching Techniques?
Matching techniques permit to address the potential existence ofselection bias;
The decision of the maize farmers to adopt agricultural technologiesis likely to be driven by a series of characteristics which are alsocorrelated to the food security indicators (e.g. education, access tocredit, extension services, ect);
The most applied Matching Technique in this strand of literature isthe Propensity Score Matching (e.g. Mendola, 2007, Kassie et al.2011. Amare et al., 2012; Kassie et al.; 2012);
Magrini and Vigani, 2014 Technology Adoption and Food Security 3rd AIEAA Conference 6 / 20
2. Methodology
Matching Techniques (2)
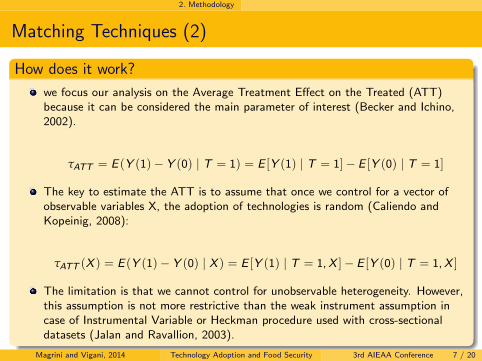
How does it work?
we focus our analysis on the Average Treatment Effect on the Treated (ATT)because it can be considered the main parameter of interest (Becker and Ichino,2002).
τATT = E (Y (1)− Y (0) | T = 1) = E [Y (1) | T = 1]− E [Y (0) | T = 1]
The key to estimate the ATT is to assume that once we control for a vector ofobservable variables X, the adoption of technologies is random (Caliendo andKopeinig, 2008):
τATT (X ) = E (Y (1)− Y (0) | X ) = E [Y (1) | T = 1,X ]− E [Y (0) | T = 1,X ]
The limitation is that we cannot control for unobservable heterogeneity. However,this assumption is not more restrictive than the weak instrument assumption incase of Instrumental Variable or Heckman procedure used with cross-sectionaldatasets (Jalan and Ravallion, 2003).
Magrini and Vigani, 2014 Technology Adoption and Food Security 3rd AIEAA Conference 7 / 20
2. Methodology
PSM Procedure
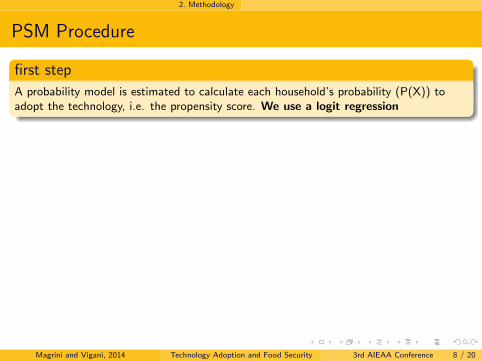
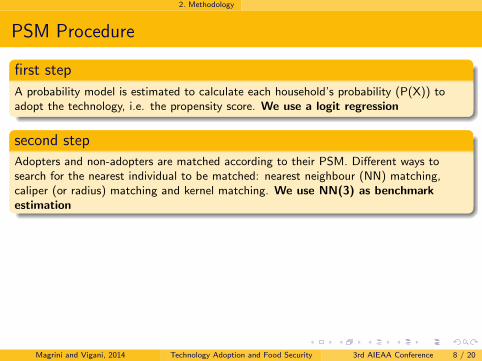
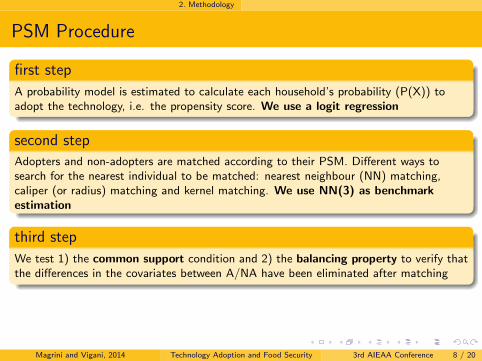
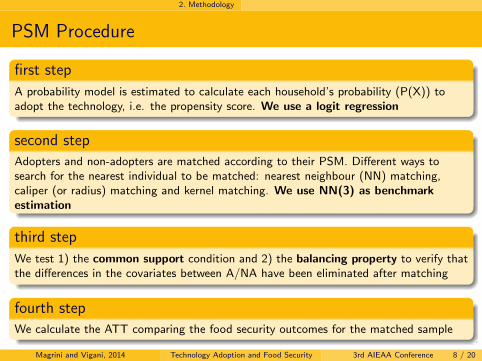
first step
A probability model is estimated to calculate each household’s probability (P(X)) toadopt the technology, i.e. the propensity score. We use a logit regression
second stepAdopters and non-adopters are matched according to their PSM. Different ways tosearch for the nearest individual to be matched: nearest neighbour (NN) matching,caliper (or radius) matching and kernel matching. We use NN(3) as benchmarkestimation
third step
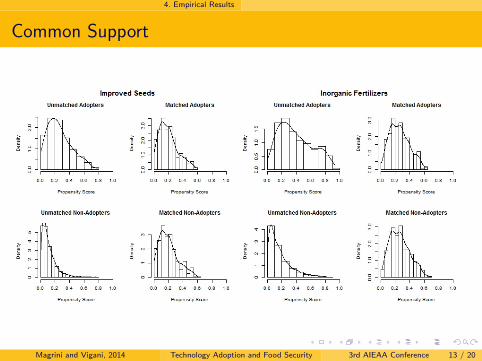
We test 1) the common support condition and 2) the balancing property to verify thatthe differences in the covariates between A/NA have been eliminated after matching
fourth stepWe calculate the ATT comparing the food security outcomes for the matched sample
Magrini and Vigani, 2014 Technology Adoption and Food Security 3rd AIEAA Conference 8 / 20
2. Methodology
PSM Procedure
first step
A probability model is estimated to calculate each household’s probability (P(X)) toadopt the technology, i.e. the propensity score. We use a logit regression
second stepAdopters and non-adopters are matched according to their PSM. Different ways tosearch for the nearest individual to be matched: nearest neighbour (NN) matching,caliper (or radius) matching and kernel matching. We use NN(3) as benchmarkestimation
third step
We test 1) the common support condition and 2) the balancing property to verify thatthe differences in the covariates between A/NA have been eliminated after matching
fourth stepWe calculate the ATT comparing the food security outcomes for the matched sample
Magrini and Vigani, 2014 Technology Adoption and Food Security 3rd AIEAA Conference 8 / 20
3. Variables and Data
The Data
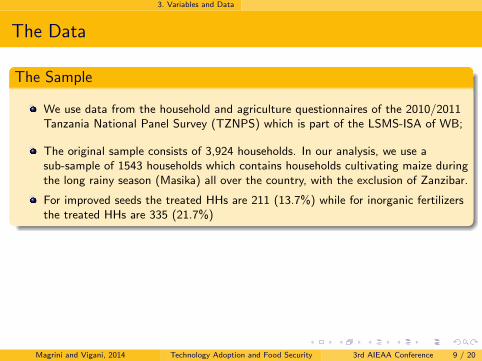
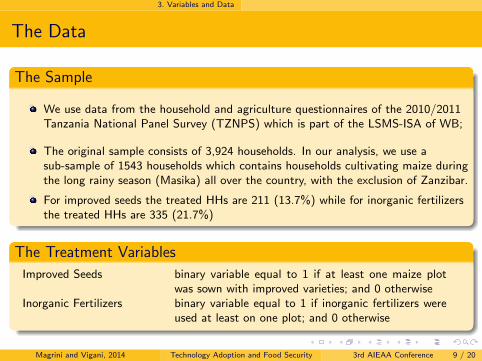
The Sample
We use data from the household and agriculture questionnaires of the 2010/2011Tanzania National Panel Survey (TZNPS) which is part of the LSMS-ISA of WB;
The original sample consists of 3,924 households. In our analysis, we use asub-sample of 1543 households which contains households cultivating maize duringthe long rainy season (Masika) all over the country, with the exclusion of Zanzibar.
For improved seeds the treated HHs are 211 (13.7%) while for inorganic fertilizersthe treated HHs are 335 (21.7%)
The Treatment Variables
Improved Seeds binary variable equal to 1 if at least one maize plotwas sown with improved varieties; and 0 otherwise
Inorganic Fertilizers binary variable equal to 1 if inorganic fertilizers wereused at least on one plot; and 0 otherwise
Magrini and Vigani, 2014 Technology Adoption and Food Security 3rd AIEAA Conference 9 / 20
3. Variables and Data
The Data
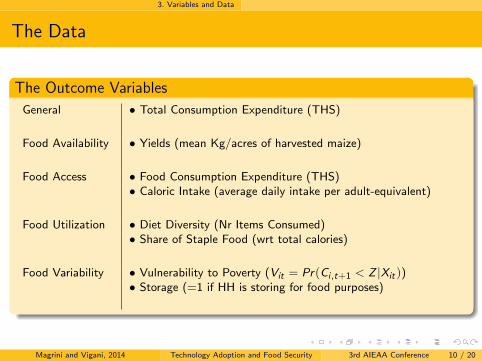
The Outcome Variables
General • Total Consumption Expenditure (THS)
Food Availability • Yields (mean Kg/acres of harvested maize)
Food Access • Food Consumption Expenditure (THS)• Caloric Intake (average daily intake per adult-equivalent)
Food Utilization • Diet Diversity (Nr Items Consumed)• Share of Staple Food (wrt total calories)
Food Variability • Vulnerability to Poverty (Vit = Pr(Ci ,t+1 < Z |Xit ))• Storage (=1 if HH is storing for food purposes)
Magrini and Vigani, 2014 Technology Adoption and Food Security 3rd AIEAA Conference 10 / 20
3. Variables and Data
The Data
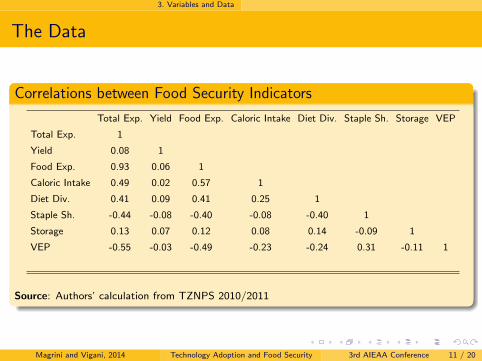
Correlations between Food Security Indicators
Total Exp. Yield Food Exp. Caloric Intake Diet Div. Staple Sh. Storage VEP
Total Exp. 1
Yield 0.08 1
Food Exp. 0.93 0.06 1
Caloric Intake 0.49 0.02 0.57 1
Diet Div. 0.41 0.09 0.41 0.25 1
Staple Sh. -0.44 -0.08 -0.40 -0.08 -0.40 1
Storage 0.13 0.07 0.12 0.08 0.14 -0.09 1
VEP -0.55 -0.03 -0.49 -0.23 -0.24 0.31 -0.11 1
Source: Authors’ calculation from TZNPS 2010/2011
Magrini and Vigani, 2014 Technology Adoption and Food Security 3rd AIEAA Conference 11 / 20
4. Empirical Results
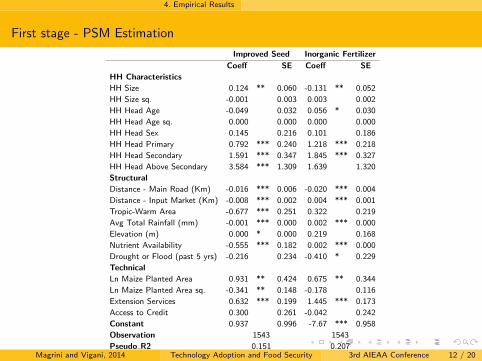
First stage - PSM Estimation
Improved Seed Inorganic Fertilizer
Coeff SE Coeff SE
HH Characteristics
HH Size 0.124 ** 0.060 -0.131 ** 0.052
HH Size sq. -0.001 0.003 0.003 0.002
HH Head Age -0.049 0.032 0.056 * 0.030
HH Head Age sq. 0.000 0.000 0.000 0.000
HH Head Sex 0.145 0.216 0.101 0.186
HH Head Primary 0.792 *** 0.240 1.218 *** 0.218
HH Head Secondary 1.591 *** 0.347 1.845 *** 0.327
HH Head Above Secondary 3.584 *** 1.309 1.639 1.320
Structural
Distance - Main Road (Km) -0.016 *** 0.006 -0.020 *** 0.004
Distance - Input Market (Km) -0.008 *** 0.002 0.004 *** 0.001
Tropic-Warm Area -0.677 *** 0.251 0.322 0.219
Avg Total Rainfall (mm) -0.001 *** 0.000 0.002 *** 0.000
Elevation (m) 0.000 * 0.000 0.219 0.168
Nutrient Availability -0.555 *** 0.182 0.002 *** 0.000
Drought or Flood (past 5 yrs) -0.216 0.234 -0.410 * 0.229
Technical
Ln Maize Planted Area 0.931 ** 0.424 0.675 ** 0.344
Ln Maize Planted Area sq. -0.341 ** 0.148 -0.178 0.116
Extension Services 0.632 *** 0.199 1.445 *** 0.173
Access to Credit 0.300 0.261 -0.042 0.242
Constant 0.937 0.996 -7.67 *** 0.958
Observation 1543 1543
Pseudo R2 0.151 0.207
Source: Authors’ calculation from TZNPS 2010/2011
* Significant at 10%; ** Significant at 5%; * Significant at 1%
Magrini and Vigani, 2014 Technology Adoption and Food Security 3rd AIEAA Conference 12 / 20
4. Empirical Results
Common Support
Magrini and Vigani, 2014 Technology Adoption and Food Security 3rd AIEAA Conference 13 / 20
4. Empirical Results
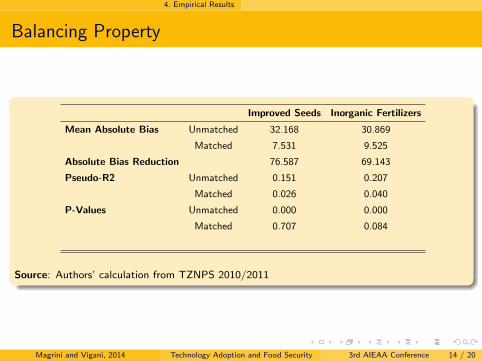
Balancing Property
Improved Seeds Inorganic Fertilizers
Mean Absolute Bias Unmatched 32.168 30.869
Matched 7.531 9.525
Absolute Bias Reduction 76.587 69.143
Pseudo-R2 Unmatched 0.151 0.207
Matched 0.026 0.040
P-Values Unmatched 0.000 0.000
Matched 0.707 0.084
Source: Authors’ calculation from TZNPS 2010/2011
Magrini and Vigani, 2014 Technology Adoption and Food Security 3rd AIEAA Conference 14 / 20
4. Empirical Results
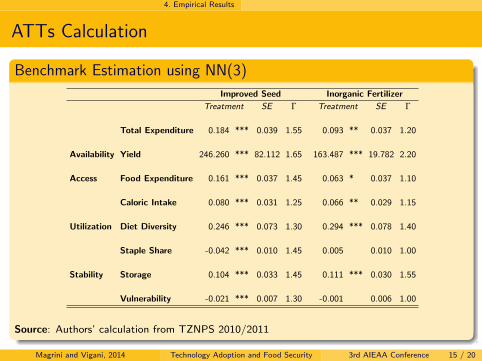
ATTs Calculation
Benchmark Estimation using NN(3)
Improved Seed Inorganic Fertilizer
Treatment SE Γ Treatment SE Γ
Total Expenditure 0.184 *** 0.039 1.55 0.093 ** 0.037 1.20
Availability Yield 246.260 *** 82.112 1.65 163.487 *** 19.782 2.20
Access Food Expenditure 0.161 *** 0.037 1.45 0.063 * 0.037 1.10
Caloric Intake 0.080 *** 0.031 1.25 0.066 ** 0.029 1.15
Utilization Diet Diversity 0.246 *** 0.073 1.30 0.294 *** 0.078 1.40
Staple Share -0.042 *** 0.010 1.45 0.005 0.010 1.00
Stability Storage 0.104 *** 0.033 1.45 0.111 *** 0.030 1.55
Vulnerability -0.021 *** 0.007 1.30 -0.001 0.006 1.00
Source: Authors’ calculation from TZNPS 2010/2011
Magrini and Vigani, 2014 Technology Adoption and Food Security 3rd AIEAA Conference 15 / 20
4. Empirical Results
Robustness Tests
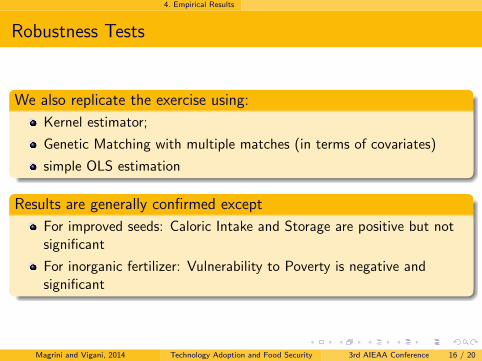
We also replicate the exercise using:
Kernel estimator;
Genetic Matching with multiple matches (in terms of covariates)
simple OLS estimation
Results are generally confirmed except
For improved seeds: Caloric Intake and Storage are positive but notsignificant
For inorganic fertilizer: Vulnerability to Poverty is negative andsignificant
Magrini and Vigani, 2014 Technology Adoption and Food Security 3rd AIEAA Conference 16 / 20
5. Conclusions
Conclusions
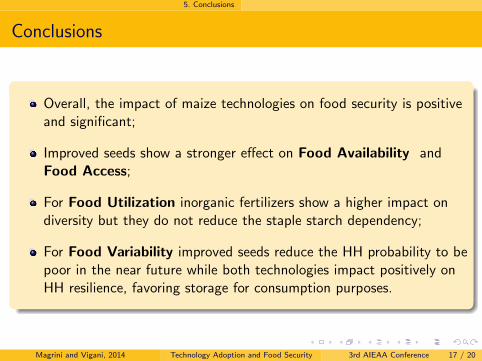
Overall, the impact of maize technologies on food security is positiveand significant;
Improved seeds show a stronger effect on Food Availability andFood Access;
For Food Utilization inorganic fertilizers show a higher impact ondiversity but they do not reduce the staple starch dependency;
For Food Variability improved seeds reduce the HH probability to bepoor in the near future while both technologies impact positively onHH resilience, favoring storage for consumption purposes.
Magrini and Vigani, 2014 Technology Adoption and Food Security 3rd AIEAA Conference 17 / 20
5. Conclusions
THANK YOU FOR YOUR ATTENTION!!!
Magrini and Vigani, 2014 Technology Adoption and Food Security 3rd AIEAA Conference 18 / 20
6. Appendix
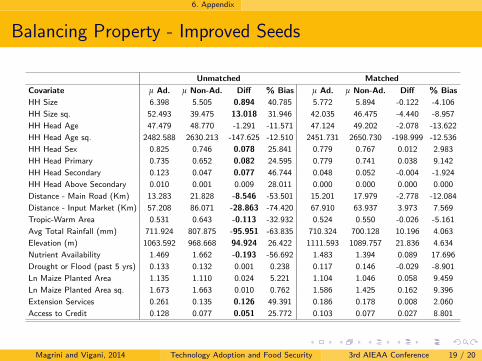
Balancing Property - Improved Seeds
Unmatched Matched
Covariate µ Ad. µ Non-Ad. Diff % Bias µ Ad. µ Non-Ad. Diff % Bias
HH Size 6.398 5.505 0.894 40.785 5.772 5.894 -0.122 -4.106
HH Size sq. 52.493 39.475 13.018 31.946 42.035 46.475 -4.440 -8.957
HH Head Age 47.479 48.770 -1.291 -11.571 47.124 49.202 -2.078 -13.622
HH Head Age sq. 2482.588 2630.213 -147.625 -12.510 2451.731 2650.730 -198.999 -12.536
HH Head Sex 0.825 0.746 0.078 25.841 0.779 0.767 0.012 2.983
HH Head Primary 0.735 0.652 0.082 24.595 0.779 0.741 0.038 9.142
HH Head Secondary 0.123 0.047 0.077 46.744 0.048 0.052 -0.004 -1.924
HH Head Above Secondary 0.010 0.001 0.009 28.011 0.000 0.000 0.000 0.000
Distance - Main Road (Km) 13.283 21.828 -8.546 -53.501 15.201 17.979 -2.778 -12.084
Distance - Input Market (Km) 57.208 86.071 -28.863 -74.420 67.910 63.937 3.973 7.569
Tropic-Warm Area 0.531 0.643 -0.113 -32.932 0.524 0.550 -0.026 -5.161
Avg Total Rainfall (mm) 711.924 807.875 -95.951 -63.835 710.324 700.128 10.196 4.063
Elevation (m) 1063.592 968.668 94.924 26.422 1111.593 1089.757 21.836 4.634
Nutrient Availability 1.469 1.662 -0.193 -56.692 1.483 1.394 0.089 17.696
Drought or Flood (past 5 yrs) 0.133 0.132 0.001 0.238 0.117 0.146 -0.029 -8.901
Ln Maize Planted Area 1.135 1.110 0.024 5.221 1.104 1.046 0.058 9.459
Ln Maize Planted Area sq. 1.673 1.663 0.010 0.762 1.586 1.425 0.162 9.396
Extension Services 0.261 0.135 0.126 49.391 0.186 0.178 0.008 2.060
Access to Credit 0.128 0.077 0.051 25.772 0.103 0.077 0.027 8.801
Magrini and Vigani, 2014 Technology Adoption and Food Security 3rd AIEAA Conference 19 / 20
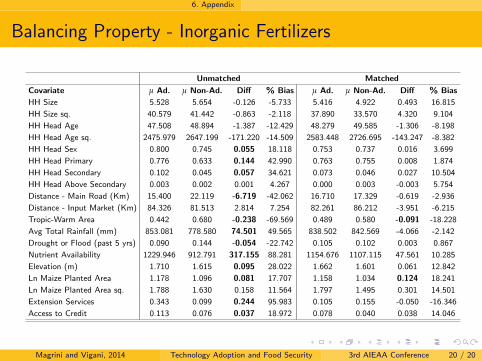
6. Appendix
Balancing Property - Inorganic Fertilizers
Unmatched Matched
Covariate µ Ad. µ Non-Ad. Diff % Bias µ Ad. µ Non-Ad. Diff % Bias
HH Size 5.528 5.654 -0.126 -5.733 5.416 4.922 0.493 16.815
HH Size sq. 40.579 41.442 -0.863 -2.118 37.890 33.570 4.320 9.104
HH Head Age 47.508 48.894 -1.387 -12.429 48.279 49.585 -1.306 -8.198
HH Head Age sq. 2475.979 2647.199 -171.220 -14.509 2583.448 2726.695 -143.247 -8.382
HH Head Sex 0.800 0.745 0.055 18.118 0.753 0.737 0.016 3.699
HH Head Primary 0.776 0.633 0.144 42.990 0.763 0.755 0.008 1.874
HH Head Secondary 0.102 0.045 0.057 34.621 0.073 0.046 0.027 10.504
HH Head Above Secondary 0.003 0.002 0.001 4.267 0.000 0.003 -0.003 5.754
Distance - Main Road (Km) 15.400 22.119 -6.719 -42.062 16.710 17.329 -0.619 -2.936
Distance - Input Market (Km) 84.326 81.513 2.814 7.254 82.261 86.212 -3.951 -6.215
Tropic-Warm Area 0.442 0.680 -0.238 -69.569 0.489 0.580 -0.091 -18.228
Avg Total Rainfall (mm) 853.081 778.580 74.501 49.565 838.502 842.569 -4.066 -2.142
Drought or Flood (past 5 yrs) 0.090 0.144 -0.054 -22.742 0.105 0.102 0.003 0.867
Nutrient Availability 1229.946 912.791 317.155 88.281 1154.676 1107.115 47.561 10.285
Elevation (m) 1.710 1.615 0.095 28.022 1.662 1.601 0.061 12.842
Ln Maize Planted Area 1.178 1.096 0.081 17.707 1.158 1.034 0.124 18.241
Ln Maize Planted Area sq. 1.788 1.630 0.158 11.564 1.797 1.495 0.301 14.501
Extension Services 0.343 0.099 0.244 95.983 0.105 0.155 -0.050 -16.346
Access to Credit 0.113 0.076 0.037 18.972 0.078 0.040 0.038 14.046
Magrini and Vigani, 2014 Technology Adoption and Food Security 3rd AIEAA Conference 20 / 20