Embed Size (px)
Citation preview
MAY 2015 v.1 alleninstitute.org Overview brain-map.org page 1 of 26
TECHNICAL WHITE PAPER: OVERVIEW
SUMMARY
The Ivy Glioblastoma Atlas Project (Ivy GAP) is a collaborative partnership between the Ben and Catherine Ivy Foundation, which generously provided the financial support, the Allen Institute for Brain Science, and the Ben and Catherine Ivy Center for Advanced Brain Tumor Treatment. The goal of the project is to provide online resources to scientists and physicians dedicated to the development of innovative treatments and diagnostics that will enhance the quality of life and survival of patients with brain cancer.
These resources represent an unprecedented platform for exploring the anatomic and genetic basis of glioblastoma at the cellular and molecular levels. They include two interactive databases linked together by de-identified tumor specimen numbers to facilitate comparisons across data modalities:
• The open public image database on www.brain-map.org providing in situ hybridization (ISH) and RNA sequencing (RNA-Seq) data, which map gene expression across the anatomic structures and putative cancer stem cell clusters in glioblastoma. The associated histological dataset is annotated and is suitable for neuropathological examination.
• A companion database (Ivy GAP Clinical and Genomic Database) offering detailed clinical, genomic, and expression array data sets that are designed to elucidate the pathways involved in glioblastoma development and progression. This database requires registration for access.
The hope is that researchers will mine these data and identify trends, correlations, and interesting leads for further studies with significant translational and clinical outcomes.
AIMS AND STUDIES The Ivy GAP addresses three main questions focused on the biology of glioblastoma:
• What are the molecular signatures of the anatomic structures? • What are the molecular signatures of putative cancer stem cell clusters? • What is the extent of heterogeneity within and between tumors at the anatomic and molecular levels?
Six studies were designed to identify the molecular signatures and measure heterogeneity (Table 1). ISH was used to screen for gene expression enriched in particular structures and cell clusters, and laser microdissection followed by RNA sequencing were used to generate the transcriptomes and identify genetic markers. For definitions of anatomic structures and terms, please see the Ontology section below.
TECHNICAL WHITE PAPER
MAY 2015 v.1 alleninstitute.org Overview brain-map.org page 2 of 26
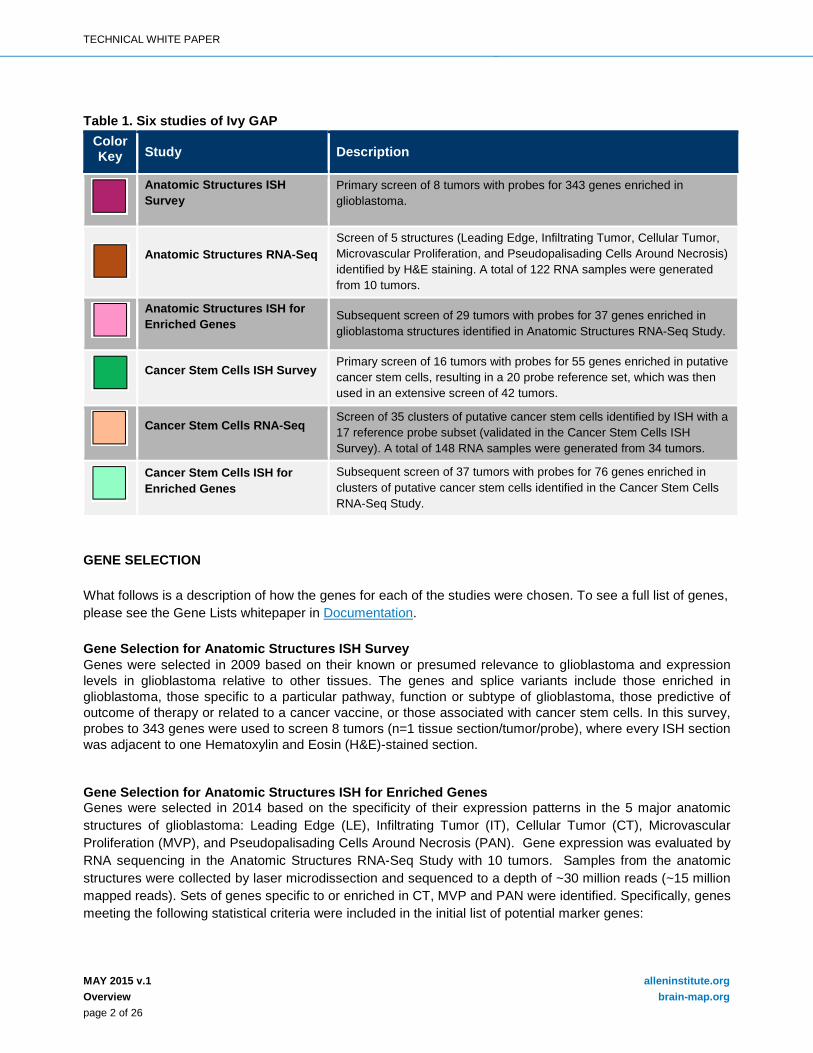
Table 1. Six studies of Ivy GAP
Color Key Study Description
Anatomic Structures ISH Survey
Primary screen of 8 tumors with probes for 343 genes enriched in glioblastoma.
Anatomic Structures RNA-Seq Screen of 5 structures (Leading Edge, Infiltrating Tumor, Cellular Tumor, Microvascular Proliferation, and Pseudopalisading Cells Around Necrosis) identified by H&E staining. A total of 122 RNA samples were generated from 10 tumors.
Anatomic Structures ISH for Enriched Genes
Subsequent screen of 29 tumors with probes for 37 genes enriched in glioblastoma structures identified in Anatomic Structures RNA-Seq Study.
Cancer Stem Cells ISH Survey
Primary screen of 16 tumors with probes for 55 genes enriched in putative cancer stem cells, resulting in a 20 probe reference set, which was then used in an extensive screen of 42 tumors.
Cancer Stem Cells RNA-Seq
Screen of 35 clusters of putative cancer stem cells identified by ISH with a 17 reference probe subset (validated in the Cancer Stem Cells ISH Survey). A total of 148 RNA samples were generated from 34 tumors.
Cancer Stem Cells ISH for Enriched Genes
Subsequent screen of 37 tumors with probes for 76 genes enriched in clusters of putative cancer stem cells identified in the Cancer Stem Cells RNA-Seq Study.
GENE SELECTION What follows is a description of how the genes for each of the studies were chosen. To see a full list of genes, please see the Gene Lists whitepaper in Documentation. Gene Selection for Anatomic Structures ISH Survey Genes were selected in 2009 based on their known or presumed relevance to glioblastoma and expression levels in glioblastoma relative to other tissues. The genes and splice variants include those enriched in glioblastoma, those specific to a particular pathway, function or subtype of glioblastoma, those predictive of outcome of therapy or related to a cancer vaccine, or those associated with cancer stem cells. In this survey, probes to 343 genes were used to screen 8 tumors (n=1 tissue section/tumor/probe), where every ISH section was adjacent to one Hematoxylin and Eosin (H&E)-stained section. Gene Selection for Anatomic Structures ISH for Enriched Genes Genes were selected in 2014 based on the specificity of their expression patterns in the 5 major anatomic structures of glioblastoma: Leading Edge (LE), Infiltrating Tumor (IT), Cellular Tumor (CT), Microvascular Proliferation (MVP), and Pseudopalisading Cells Around Necrosis (PAN). Gene expression was evaluated by RNA sequencing in the Anatomic Structures RNA-Seq Study with 10 tumors. Samples from the anatomic structures were collected by laser microdissection and sequenced to a depth of ~30 million reads (~15 million mapped reads). Sets of genes specific to or enriched in CT, MVP and PAN were identified. Specifically, genes meeting the following statistical criteria were included in the initial list of potential marker genes:
TECHNICAL WHITE PAPER
MAY 2015 v.1 alleninstitute.org Overview brain-map.org page 3 of 26
1. The difference between the expression levels in that structure and all other structures was greater than 2-fold;
2. P<0.05 for each pairwise comparison between that structure and every other structure using the “edgeR” R function;
3. P<0.00001 when comparing across all five structures using repeated measures ANOVA, which accounts for the tumor or block effects of each sample; and
4. Gene expression levels were within the RPKM range of 20>1000. This strategy identified several hundred genes, which were further filtered based on expression patterns in other resources. For example, genes with ubiquitous patterning in the mouse brain as described by the Allen Brain Atlas (http://mouse.brain-map.org/) were excluded from consideration. Additionally, genes with expression levels correlated with age in the BrainSpan Atlas of the Developing Human Brain (http://www.brainspan.org/) were prioritized. Genes representing multiple GBM structures were included for each structural category. Finally, weighted gene co-expression network analysis was also used to identify groups of genes whose expression was enriched in particular structures or tumors. As most genes specific for leading edge or infiltrating tumor also showed high expression in normal brain tissue, a different strategy (described below) was used for ISH gene selection. The final lists of genes to assess in the Anatomic Structures ISH for Enriched Genes study were selected and ranked as follows.
1. PAN, MVP, and CT genes were chosen as described above. 2. An additional set of MVP/PAN genes were chosen for being highly expressed in both structures. 3. LE and IT genes were chosen either for being correlated with the expression of NREP (C5orf13), a
marker for infiltrating or invasive cells (Mariani et al., 2001), or for having a rostral migratory stream pattern as determined from data from the Allen Mouse Brain Atlas (http://mouse.brain-map.org/).
In this study, probes to 37 genes enriched in the 5 glioblastoma structures were used to screen 29 tumors (n=1 tissue section/block/probe), where every ISH section was adjacent to one H&E-stained section. Gene Selection for Cancer Stem Cells ISH Survey Genes were selected in 2013 based on their generally accepted association with cells isolated from GBM that displayed at least some stem-like properties (e.g. PROM1). In a pre-survey pilot, probes to 55 genes were used to screen 16 tumors (n=1 tissue section/block and 1 or 2 blocks/tumor/probe), where every ISH section was adjacent to one H&E-stained section. The following gene expression patterns were recorded for each anatomic feature:
a) CThbv, CTmvp: ISH signal was significantly enriched in subsets of HBV or MVP, and not necessarily in every tissue block of every tumor. Probes that labeled all blood vessels were excluded.
b) CTpan, CTpnn, CTpnz: ISH signal was significantly enriched in PAN, Pseudopalisading Cells but No visible Necrosis (PNN), or Peri-Necrotic Zone (PNZ, cells bordering necrosis but no obvious pseudopalisading cells) in CT.
c) CT blood vessel-associated: ISH signal was significantly enriched in cells surrounding blood vessels. d) CT sporadic: ISH signal was observed in patches of cells within CT without a distinct histological
association. e) Majority CT: ISH signal was detected in a majority of tumor cells. f) Majority LE, IT: ISH signal was significantly enriched in LE and/or IT. g) Ubiquitous: ISH signal was observed in majority of cells across many anatomic regions. h) Scattered: ISH signal was detected in very few scattered cells. i) None: ISH signal was not detected.
TECHNICAL WHITE PAPER
MAY 2015 v.1 alleninstitute.org Overview brain-map.org page 4 of 26
In the survey, a set of 20 probes was selected for genes whose expression pattern was consistent with a, b, c, or d, or any combination of these four, and was used to screen 41 tumors (n=2 tissue sections/block and up to 7 blocks/probe). Every ISH section was adjacent to one H&E-stained section. Each of the resulting images was evaluated according to its gene expression patterns (a-i). From this survey, 17 probes were chosen for the Cancer Stem Cells RNA-Seq study.
Gene Selection for Cancer Stem Cells RNA-Seq In 2014, 17 genes were selected from the Cancer Stem Cells ISH Survey for use as references to guide the isolation of putative cancer stem cell clusters by laser microdissection of 34 tumors, a subset of the 41 tumors used in the same study. Each cluster of cells expressing at least one of the reference genes was associated with one of the following anatomic correlates:
• CT (blood vessel-associated or sporadic gene expression in CT); • CT-control (area of CT with low to undetectable expression of reference gene); • CThbv or CTmvp (HBV or MVP in CT); and • CTpan, CTpnn, or CTpnz (PAN, PNN, or PNZ in CT).
In this study, 1-3 reference genes were used to isolate putative cancer stem cell clusters in each tissue block, and each ISH section was associated with an adjacent or nearby H&E-stained section. Gene Selection for Cancer Stem Cells ISH for Enriched Genes Identification of genes enriched in putative cancer stem cell clusters required an analysis of genes expressed in RNA samples from both RNA-Seq studies because the genes enriched in the structures predominated in all the cancer stem cell RNA samples. First, all samples were grouped by the anatomic structure from which they were isolated. Then expression levels of each of the 10 reference genes marking CT samples were assessed in each sample, and RNA samples expressing multiple reference genes were separated from those expressing no or few reference genes. Genes differentially expressed between these two groups of CT samples were then selected as potential candidate genes for further analysis by ISH. This process was then repeated for the 8 and 4 reference genes in PAN and MVP, respectively, to identify differentially expressed genes within the PAN samples and MVP samples. Overall, this process identified 200 gene candidates expressed in CT, MVP, or PAN. This list of enriched genes was further divided by weighted gene co-expression network analysis into groups of genes having similar expression profiles, and 90 genes broadly representing these profiles were selected as candidates for the final ISH study. As with the Anatomic Structures ISH for Enriched Genes study, genes with exceptionally high or low expression levels overall were eliminated to increase the likelihood of obtaining reasonable ISH signal intensity and density. The probes were grouped by structure in which the stem cell cluster was most likely to be found, and they were hybridized to tissue blocks known to contain the appropriate anatomic structures. In this study, probes to 76 genes enriched in putative cancer stem cells were used to screen 37 tumors (n=1 tissue section/block/probe), where every ISH section was adjacent to one H&E-stained section. SPECIMEN SELECTION What follows is a description of how the specimens for each of the studies were chosen. To see a full list of specimens, please see the Specimen Lists whitepaper in Documentation.
TECHNICAL WHITE PAPER
MAY 2015 v.1 alleninstitute.org Overview brain-map.org page 5 of 26
Specimen Selection for Ivy GAP The Ivy GAP cohort is comprised of 41 patients who donated 42 tumors to the project. All patients received the standard of care and their detailed clinical data sets are presented in the Ivy GAP Clinical and Genomic Database. Tumors and specimen tissue blocks were selected for each study after a thorough evaluation of tissue integrity, neuropathology, and RNA assessment. Supporting information such as hemisphere and orientation of the tumor in the brain, and the number and spatial relationship of the tissue blocks, appears in the Resected Tumor Image of the Tumor Subdivision section for each tumor on the ISH tab of the web application.
Specimen Selection for Studies of Anatomic Structures Specimens for genes enriched in anatomic structures or features of glioblastoma were identified in a three-step approach. The first study was the Anatomic Structures ISH Survey, and 8 of 12 tumors available at the time of generating the data were selected. Examination of the data showed that expression of a number of 343 genes that had been tested appeared to be enriched in particular anatomic structures, including LE, IT, CT, MVP, and PAN. The second study, the Anatomic Structures RNA-Seq Study, was designed to address this finding directly by sequencing the transcriptomes of the anatomic structures collected from three different blocks per tumor per structure. The 10 tumors that had the greatest number of structures in the least number of tissue blocks were chosen, and 122 RNA samples were collected by laser microdissection for sequencing. The tumors represented in this study were more heterogeneous and more likely to be large relative to tumors selected for other studies. Analysis of the RNA-Seq data led to the identification of genes that were highly enriched in particular structures. The third study, the Anatomic Structures ISH for Enriched Genes Study, was designed to validate the RNA-Seq data with an ISH screen of 37 genes in 29 tumors, which represented several blocks from the 10 tumors used in the RNA-Seq study and an independent set of tumors not yet analyzed.
Specimen Selection for Studies of Putative Cancer Stem Cell Populations Specimens for genes enriched in clusters of putative cancer stem cells were also identified in a three-step approach. The first study was the Cancer Stem Cells ISH Survey, in which 55 genes were assessed in 16 tumors followed by an extensive screen of a 20 gene subset in 42 tumors. Examination of the ISH data set showed that several of the 20 genes appeared to have overlapping expression patterns in many putative cancer stem cell clusters marked by different combinations of genes. These results were analyzed further in the second study, the Cancer Stem Cells RNA-Seq Study, in which 35 clusters or patterns of gene expression were identified by ISH with a 17 probe reference subset in 34 tumors, 7 of which were also assessed in the Anatomic Structures RNA-Seq Study, and isolated by laser microdissection for a total of 148 RNA samples. Of the 35 clusters, 11 genes were associated with CT, 9 with CTpnz , 6 with CTpan , 7 with CThbv, and 2 with CTmvp. The third study, Cancer Stem Cells ISH for Enriched Genes Study, was designed to validate the RNA-Seq data with an ISH screen of 76 genes in 37 tumors, which represented several blocks from the 34 tumors used in the RNA-Seq study, and an independent set not yet analyzed.
ONTOLOGY
The Ivy GAP ontology is a hierarchical organization of glioblastoma anatomic structural features and associated transcriptomes from RNA-Seq samples that were identified by reference histology or reference gene expression patterns (Figure 1). It does not reflect ontological origins of the structural features; it is simply a representation of relationships among the glioblastoma features and gene expression patterns associated with putative cancer stem cell clusters that were identified in the project.
The structural features are commonly identified by neuropathologists in glioblastoma tissue sections stained with Hematoxylin and Eosin (H&E). The major structural regions are Leading Edge (LE), Infiltrating Tumor (IT), and Cellular Tumor (CT) (Figures 2-4). Within each of these regions, particular structural features such as Hyperplastic Blood Vessels (HBV), Microvascular Proliferation (MVP), Necrosis (NE), Perinecrotic Zone (PNZ), and Pseudopalisading Cells around Necrosis (PAN) (Figures 5-9) can be found and are routinely used
TECHNICAL WHITE PAPER
MAY 2015 v.1 alleninstitute.org Overview brain-map.org page 6 of 26
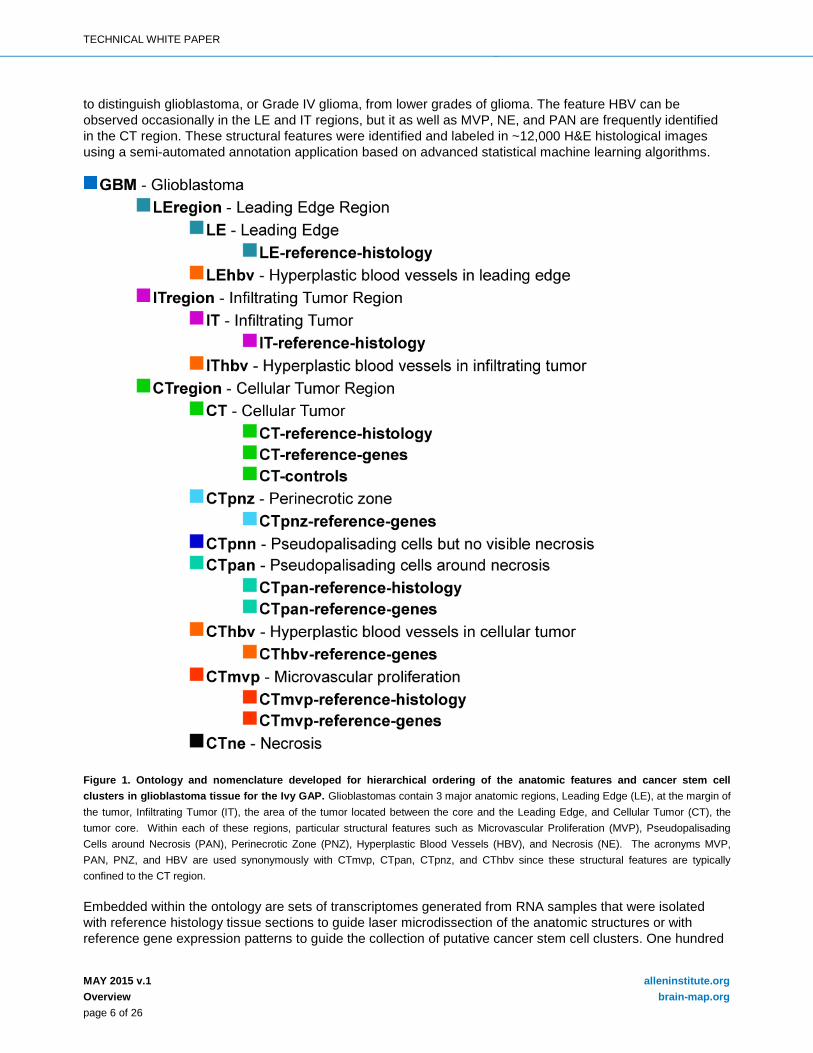
to distinguish glioblastoma, or Grade IV glioma, from lower grades of glioma. The feature HBV can be observed occasionally in the LE and IT regions, but it as well as MVP, NE, and PAN are frequently identified in the CT region. These structural features were identified and labeled in ~12,000 H&E histological images using a semi-automated annotation application based on advanced statistical machine learning algorithms.
Figure 1. Ontology and nomenclature developed for hierarchical ordering of the anatomic features and cancer stem cell clusters in glioblastoma tissue for the Ivy GAP. Glioblastomas contain 3 major anatomic regions, Leading Edge (LE), at the margin of the tumor, Infiltrating Tumor (IT), the area of the tumor located between the core and the Leading Edge, and Cellular Tumor (CT), the tumor core. Within each of these regions, particular structural features such as Microvascular Proliferation (MVP), Pseudopalisading Cells around Necrosis (PAN), Perinecrotic Zone (PNZ), Hyperplastic Blood Vessels (HBV), and Necrosis (NE). The acronyms MVP, PAN, PNZ, and HBV are used synonymously with CTmvp, CTpan, CTpnz, and CThbv since these structural features are typically confined to the CT region.
Embedded within the ontology are sets of transcriptomes generated from RNA samples that were isolated with reference histology tissue sections to guide laser microdissection of the anatomic structures or with reference gene expression patterns to guide the collection of putative cancer stem cell clusters. One hundred
TECHNICAL WHITE PAPER
MAY 2015 v.1 alleninstitute.org Overview brain-map.org page 7 of 26
twenty two RNA samples were sequenced for 5 structures (LE, IT, CT, MVP, and PAN) across 10 tumors, whereas 148 RNA samples were sequenced for 35 stem cell categories and the associated controls across 34 tumors.
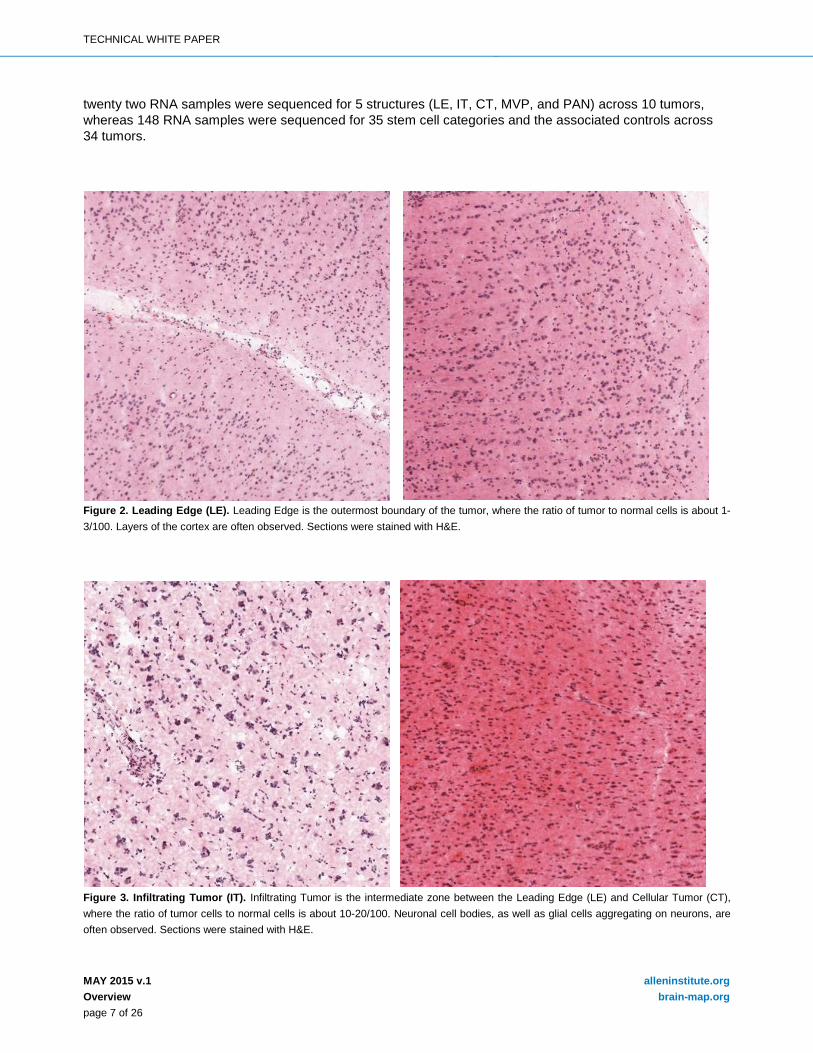
Figure 2. Leading Edge (LE). Leading Edge is the outermost boundary of the tumor, where the ratio of tumor to normal cells is about 1-3/100. Layers of the cortex are often observed. Sections were stained with H&E.
Figure 3. Infiltrating Tumor (IT). Infiltrating Tumor is the intermediate zone between the Leading Edge (LE) and Cellular Tumor (CT), where the ratio of tumor cells to normal cells is about 10-20/100. Neuronal cell bodies, as well as glial cells aggregating on neurons, are often observed. Sections were stained with H&E.
TECHNICAL WHITE PAPER
MAY 2015 v.1 alleninstitute.org Overview brain-map.org page 8 of 26
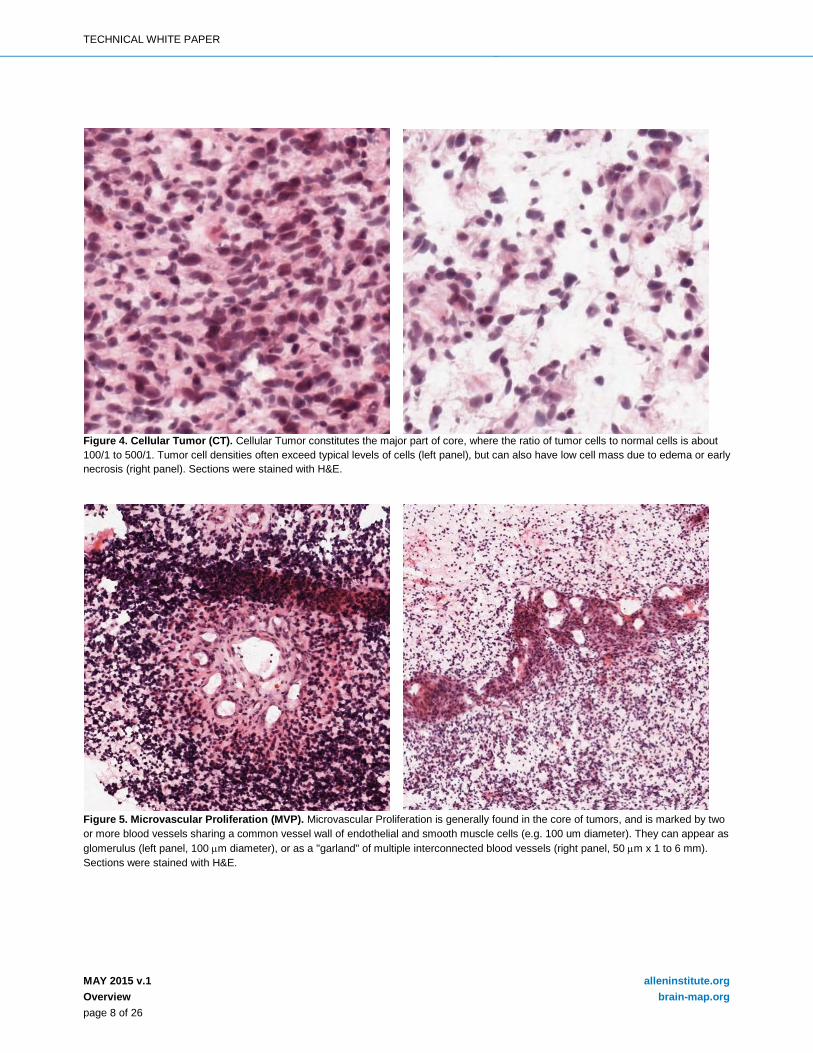
Figure 4. Cellular Tumor (CT). Cellular Tumor constitutes the major part of core, where the ratio of tumor cells to normal cells is about 100/1 to 500/1. Tumor cell densities often exceed typical levels of cells (left panel), but can also have low cell mass due to edema or early necrosis (right panel). Sections were stained with H&E.
Figure 5. Microvascular Proliferation (MVP). Microvascular Proliferation is generally found in the core of tumors, and is marked by two or more blood vessels sharing a common vessel wall of endothelial and smooth muscle cells (e.g. 100 um diameter). They can appear as glomerulus (left panel, 100 µm diameter), or as a "garland" of multiple interconnected blood vessels (right panel, 50 µm x 1 to 6 mm). Sections were stained with H&E.
TECHNICAL WHITE PAPER
MAY 2015 v.1 alleninstitute.org Overview brain-map.org page 9 of 26
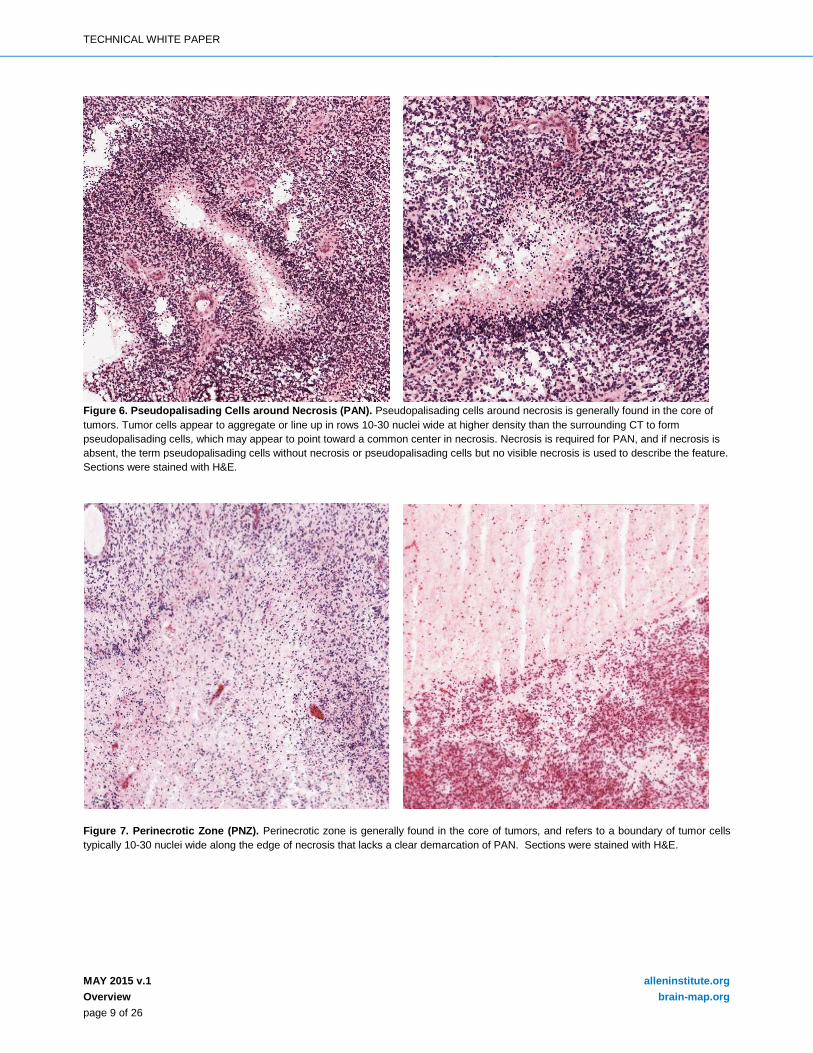
Figure 6. Pseudopalisading Cells around Necrosis (PAN). Pseudopalisading cells around necrosis is generally found in the core of tumors. Tumor cells appear to aggregate or line up in rows 10-30 nuclei wide at higher density than the surrounding CT to form pseudopalisading cells, which may appear to point toward a common center in necrosis. Necrosis is required for PAN, and if necrosis is absent, the term pseudopalisading cells without necrosis or pseudopalisading cells but no visible necrosis is used to describe the feature. Sections were stained with H&E.
Figure 7. Perinecrotic Zone (PNZ). Perinecrotic zone is generally found in the core of tumors, and refers to a boundary of tumor cells typically 10-30 nuclei wide along the edge of necrosis that lacks a clear demarcation of PAN. Sections were stained with H&E.
TECHNICAL WHITE PAPER
MAY 2015 v.1 alleninstitute.org Overview brain-map.org page 10 of 26
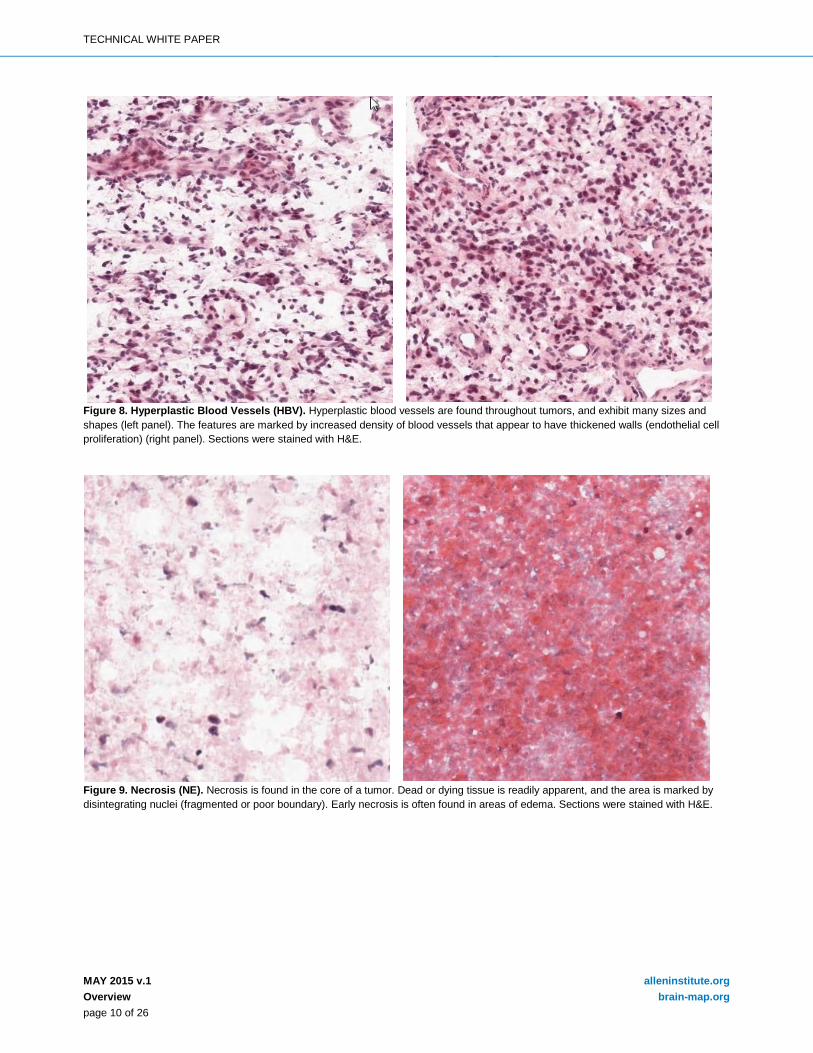
Figure 8. Hyperplastic Blood Vessels (HBV). Hyperplastic blood vessels are found throughout tumors, and exhibit many sizes and shapes (left panel). The features are marked by increased density of blood vessels that appear to have thickened walls (endothelial cell proliferation) (right panel). Sections were stained with H&E.
Figure 9. Necrosis (NE). Necrosis is found in the core of a tumor. Dead or dying tissue is readily apparent, and the area is marked by disintegrating nuclei (fragmented or poor boundary). Early necrosis is often found in areas of edema. Sections were stained with H&E.
TECHNICAL WHITE PAPER
MAY 2015 v.1 alleninstitute.org Overview brain-map.org page 11 of 26
CLINICAL DATA COLLECTION
Patients were enrolled in the Ivy Glioblastoma Atlas Project (Ivy GAP) with Swedish Neuroscience Institute’s Institutional Review Board-approved protocols and consent forms. MRI data sets were collected at clinically determined intervals for each patient. Intra-operative photographs and MRI Stealth images were obtained before and after en bloc resection when possible. Patients received chemotherapy and radiation treatment after surgery. Clinical data sets that were collected included age, gender, molecular subtype, MGMT methylation, EGFR amplification, EGFRvIII deletion, PTEN deletion, IDH1 point mutation, initial KPS, neurosurgery (resection number), hemisphere, chemotherapy, radiation therapy, recurrence by 6 months, and multifocality (Ivy GAP Clinical and Genomic Database).
CLINICAL DATA CATEGORIES Age Patient age in years at time of diagnosis. Younger patients tend to have increased survival rates (Ening et al., 2015). EGFR Amplification A diagnostic test result referring to whether a particular tumor’s epidermal growth factor receptor gene had multiple copies. The gene is frequently amplified gene in glioblastoma (Hobbs et al., 2012). Extent of Resection Degree to which tumor tissue was surgically removed. Complete resection is associated with increased survival rates (Keles et al., 1999). Initial KPS Karnofsky Performance Status when first diagnosed with first tumor. Karnofsky Performance Status is a measure of functional impairment (on a scale of 0-100, 0 referring to dead, 50 to requiring considerable assistance and frequent medical care, and 100 referring to no evidence of disease. High scores are associated with increased survival rates (Ening et al., 2015). Location Structure in brain affected by tumor, e.g. temporal lobe. MGMT Methylation A diagnostic test result referring to whether a tumor’s O-6-methylguanine-DNA methyltransferase DNA repair gene was methylated. Methylated MGMT is associated with increased rates of survival (Hegi et al., 2005). Molecular Subtype Genomic characteristics of tissue block related to classification of patients. The molecular subtype reported throughout the atlas was determined using all CT samples (CT-control and CT-reference histology) collected from multiple blocks of a given tumor. Each CT sample was analyzed using 840 transcripts from the RNA-Seq data as per Verhaak et al., 2010. For a given tumor, if multiple CT samples exhibited distinct subtypes, then the tumor was classified as a mixture of its subtypes. The Classical subtype refers to chromosome 7 amplification, specifically EGFR, paired with chromosome 10 loss. The Mesenchymal subtype is noted for focal hemizygous deletions of a region at 17q11.2, containing the gene NF1. The Proneural subtype is
TECHNICAL WHITE PAPER
MAY 2015 v.1 alleninstitute.org Overview brain-map.org page 12 of 26
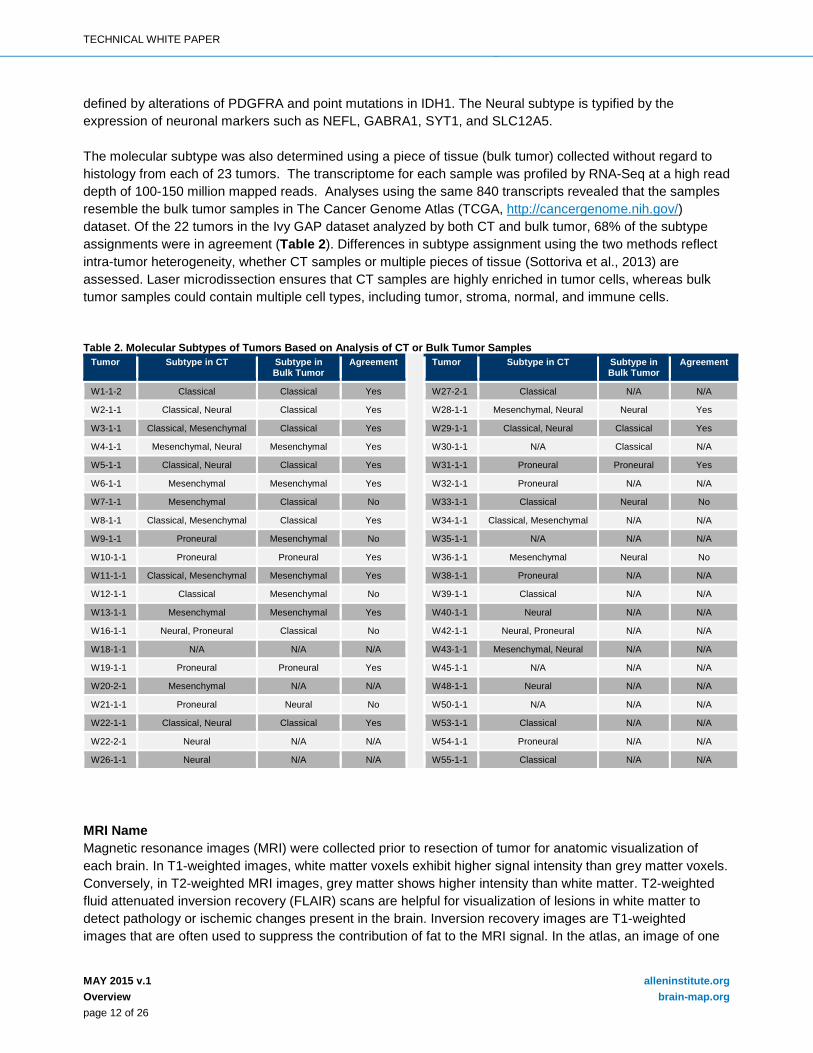
defined by alterations of PDGFRA and point mutations in IDH1. The Neural subtype is typified by the expression of neuronal markers such as NEFL, GABRA1, SYT1, and SLC12A5. The molecular subtype was also determined using a piece of tissue (bulk tumor) collected without regard to histology from each of 23 tumors. The transcriptome for each sample was profiled by RNA-Seq at a high read depth of 100-150 million mapped reads. Analyses using the same 840 transcripts revealed that the samples resemble the bulk tumor samples in The Cancer Genome Atlas (TCGA, http://cancergenome.nih.gov/) dataset. Of the 22 tumors in the Ivy GAP dataset analyzed by both CT and bulk tumor, 68% of the subtype assignments were in agreement (Table 2). Differences in subtype assignment using the two methods reflect intra-tumor heterogeneity, whether CT samples or multiple pieces of tissue (Sottoriva et al., 2013) are assessed. Laser microdissection ensures that CT samples are highly enriched in tumor cells, whereas bulk tumor samples could contain multiple cell types, including tumor, stroma, normal, and immune cells. Table 2. Molecular Subtypes of Tumors Based on Analysis of CT or Bulk Tumor Samples
Tumor Subtype in CT Subtype in Bulk Tumor
Agreement Tumor Subtype in CT Subtype in Bulk Tumor
Agreement
W1-1-2 Classical Classical Yes W27-2-1 Classical N/A N/A
W2-1-1 Classical, Neural Classical Yes W28-1-1 Mesenchymal, Neural Neural Yes
W3-1-1 Classical, Mesenchymal Classical Yes W29-1-1 Classical, Neural Classical Yes
W4-1-1 Mesenchymal, Neural Mesenchymal Yes W30-1-1 N/A Classical N/A
W5-1-1 Classical, Neural Classical Yes W31-1-1 Proneural Proneural Yes
W6-1-1 Mesenchymal Mesenchymal Yes W32-1-1 Proneural N/A N/A
W7-1-1 Mesenchymal Classical No W33-1-1 Classical Neural No
W8-1-1 Classical, Mesenchymal Classical Yes W34-1-1 Classical, Mesenchymal N/A N/A
W9-1-1 Proneural Mesenchymal No W35-1-1 N/A N/A N/A
W10-1-1 Proneural Proneural Yes W36-1-1 Mesenchymal Neural No
W11-1-1 Classical, Mesenchymal Mesenchymal Yes W38-1-1 Proneural N/A N/A
W12-1-1 Classical Mesenchymal No W39-1-1 Classical N/A N/A
W13-1-1 Mesenchymal Mesenchymal Yes W40-1-1 Neural N/A N/A
W16-1-1 Neural, Proneural Classical No W42-1-1 Neural, Proneural N/A N/A
W18-1-1 N/A N/A N/A W43-1-1 Mesenchymal, Neural N/A N/A
W19-1-1 Proneural Proneural Yes W45-1-1 N/A N/A N/A
W20-2-1 Mesenchymal N/A N/A W48-1-1 Neural N/A N/A
W21-1-1 Proneural Neural No W50-1-1 N/A N/A N/A
W22-1-1 Classical, Neural Classical Yes W53-1-1 Classical N/A N/A
W22-2-1 Neural N/A N/A W54-1-1 Proneural N/A N/A
W26-1-1 Neural N/A N/A W55-1-1 Classical N/A N/A
MRI Name Magnetic resonance images (MRI) were collected prior to resection of tumor for anatomic visualization of each brain. In T1-weighted images, white matter voxels exhibit higher signal intensity than grey matter voxels. Conversely, in T2-weighted MRI images, grey matter shows higher intensity than white matter. T2-weighted fluid attenuated inversion recovery (FLAIR) scans are helpful for visualization of lesions in white matter to detect pathology or ischemic changes present in the brain. Inversion recovery images are T1-weighted images that are often used to suppress the contribution of fat to the MRI signal. In the atlas, an image of one
TECHNICAL WHITE PAPER
MAY 2015 v.1 alleninstitute.org Overview brain-map.org page 13 of 26
MRI is presented for each patient’s brain in the Patient, Tumor, MRI Summary section. Each of the images is labeled with a combination of technical terms that indicate what type of scan was generated (below).
• AXIAL: axial plane of brain • FLAIR: fluid attenuation inversion recovery • FSPGR: fast spoiled gradient echo • GRE: gradient echo • POST-GAD: scan collected after patient given gadolinium, a contrast agent • SE: spin echo • SPGR: spoiled gradient echo • STEALTH: surgical navigation system • T1: T1 spin-lattice relaxation time constant • T2: T2 spin-lattice relaxation time constant • 3D: 3 dimensions • 3MM: 3 mm scan slice thickness
Multifocality Whether a tumor was comprised of single or multiple masses. Increased multifocality is associated with decreased rates of survival (Thomas et al., 2013). PTEN deletion A diagnostic test result referring to whether a tumor’s phosphatase and tensin homolog gene had a deletion. PTEN deletion is associated with decreased rates of survival (Sano et al., 1999; Srividya et al., 2011). Resected Tumor Images Images of resected tumors with tissue block subdivisions SNI Link Hyperlink to Swedish Neuroscience Institute’s Ivy GAP Clinical and Genomic Database Specimen Sub-block of tumor used in experiment Study One of six sets of experiments focused on analysis of anatomic structures or putative cancer stem cell clusters in glioblastoma Surgery Primary or recurrent tumor resection. Primary refers to a tumor that begins in the brain. Recurrent refers to a tumor that has redeveloped after its previous removal. Survival Days Patient’s lifespan since initial diagnosis Tumor Site/deidentified patient number – surgery number – tumor multifocality number. W1-1-2 is an example of a coded tumor specimen name, W referring to a site of surgery, and 1-1-2 referring to Patient 1-Neurosurgery 1-Tumor 2. Thus two tumor masses were resected from this patient during the first neurosurgery.
TECHNICAL WHITE PAPER
MAY 2015 v.1 alleninstitute.org Overview brain-map.org page 14 of 26
TISSUE PROCESSING AND HISTOLOGICAL STAINING
The core infrastructure developed for generating the Allen Brain Atlas data (http://www.brain-map.org) was used for processing glioblastoma tissue for the Ivy GAP. The standard operating procedures are described in Lein et al., 2007 and in the Supplementary Materials section of the Allen Mouse Brain Atlas. Modifications of the procedures were required for glioblastoma tissue acquisition and sectioning, ISH, histological staining, image acquisition, data processing, and quality control procedures for each stage of production as described below.
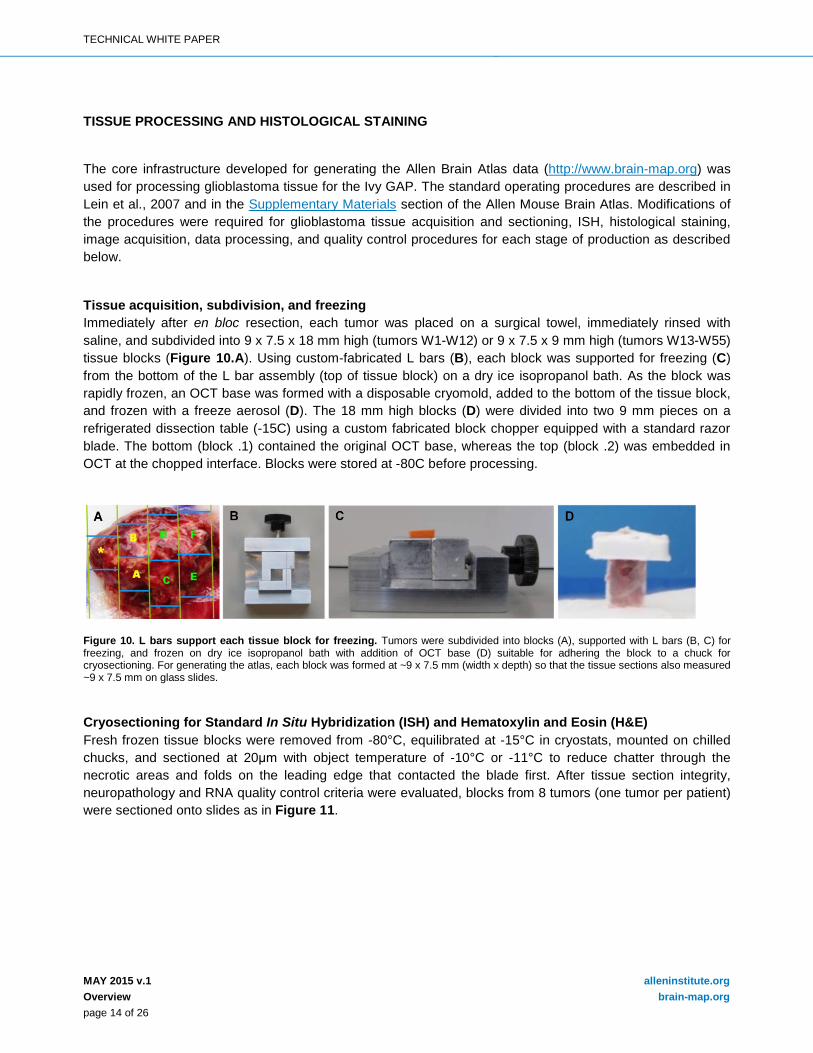
Tissue acquisition, subdivision, and freezing Immediately after en bloc resection, each tumor was placed on a surgical towel, immediately rinsed with saline, and subdivided into 9 x 7.5 x 18 mm high (tumors W1-W12) or 9 x 7.5 x 9 mm high (tumors W13-W55) tissue blocks (Figure 10.A). Using custom-fabricated L bars (B), each block was supported for freezing (C) from the bottom of the L bar assembly (top of tissue block) on a dry ice isopropanol bath. As the block was rapidly frozen, an OCT base was formed with a disposable cryomold, added to the bottom of the tissue block, and frozen with a freeze aerosol (D). The 18 mm high blocks (D) were divided into two 9 mm pieces on a refrigerated dissection table (-15C) using a custom fabricated block chopper equipped with a standard razor blade. The bottom (block .1) contained the original OCT base, whereas the top (block .2) was embedded in OCT at the chopped interface. Blocks were stored at -80C before processing.
Figure 10. L bars support each tissue block for freezing. Tumors were subdivided into blocks (A), supported with L bars (B, C) for freezing, and frozen on dry ice isopropanol bath with addition of OCT base (D) suitable for adhering the block to a chuck for cryosectioning. For generating the atlas, each block was formed at ~9 x 7.5 mm (width x depth) so that the tissue sections also measured ~9 x 7.5 mm on glass slides.
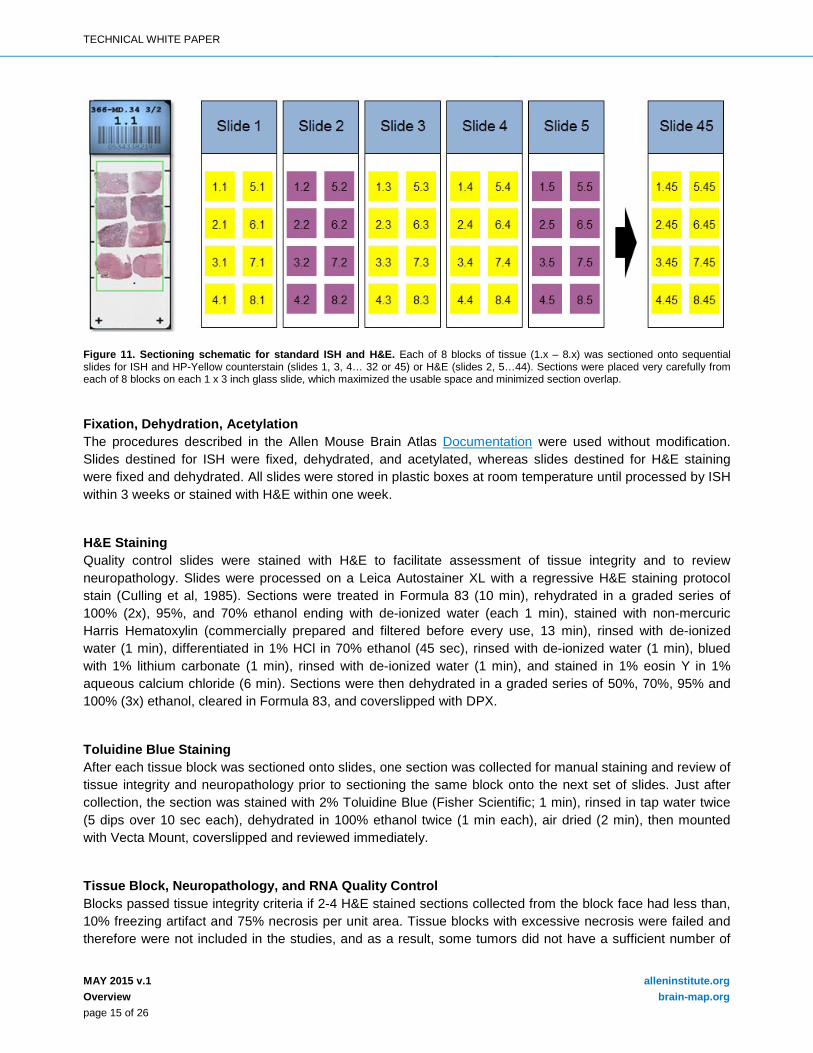
Cryosectioning for Standard In Situ Hybridization (ISH) and Hematoxylin and Eosin (H&E) Fresh frozen tissue blocks were removed from -80°C, equilibrated at -15°C in cryostats, mounted on chilled chucks, and sectioned at 20μm with object temperature of -10°C or -11°C to reduce chatter through the necrotic areas and folds on the leading edge that contacted the blade first. After tissue section integrity, neuropathology and RNA quality control criteria were evaluated, blocks from 8 tumors (one tumor per patient) were sectioned onto slides as in Figure 11.
TECHNICAL WHITE PAPER
MAY 2015 v.1 alleninstitute.org Overview brain-map.org page 15 of 26
Figure 11. Sectioning schematic for standard ISH and H&E. Each of 8 blocks of tissue (1.x – 8.x) was sectioned onto sequential slides for ISH and HP-Yellow counterstain (slides 1, 3, 4… 32 or 45) or H&E (slides 2, 5…44). Sections were placed very carefully from each of 8 blocks on each 1 x 3 inch glass slide, which maximized the usable space and minimized section overlap.
Fixation, Dehydration, Acetylation The procedures described in the Allen Mouse Brain Atlas Documentation were used without modification. Slides destined for ISH were fixed, dehydrated, and acetylated, whereas slides destined for H&E staining were fixed and dehydrated. All slides were stored in plastic boxes at room temperature until processed by ISH within 3 weeks or stained with H&E within one week.
H&E Staining Quality control slides were stained with H&E to facilitate assessment of tissue integrity and to review neuropathology. Slides were processed on a Leica Autostainer XL with a regressive H&E staining protocol stain (Culling et al, 1985). Sections were treated in Formula 83 (10 min), rehydrated in a graded series of 100% (2x), 95%, and 70% ethanol ending with de-ionized water (each 1 min), stained with non-mercuric Harris Hematoxylin (commercially prepared and filtered before every use, 13 min), rinsed with de-ionized water (1 min), differentiated in 1% HCl in 70% ethanol (45 sec), rinsed with de-ionized water (1 min), blued with 1% lithium carbonate (1 min), rinsed with de-ionized water (1 min), and stained in 1% eosin Y in 1% aqueous calcium chloride (6 min). Sections were then dehydrated in a graded series of 50%, 70%, 95% and 100% (3x) ethanol, cleared in Formula 83, and coverslipped with DPX.
Toluidine Blue Staining After each tissue block was sectioned onto slides, one section was collected for manual staining and review of tissue integrity and neuropathology prior to sectioning the same block onto the next set of slides. Just after collection, the section was stained with 2% Toluidine Blue (Fisher Scientific; 1 min), rinsed in tap water twice (5 dips over 10 sec each), dehydrated in 100% ethanol twice (1 min each), air dried (2 min), then mounted with Vecta Mount, coverslipped and reviewed immediately.
Tissue Block, Neuropathology, and RNA Quality Control Blocks passed tissue integrity criteria if 2-4 H&E stained sections collected from the block face had less than, 10% freezing artifact and 75% necrosis per unit area. Tissue blocks with excessive necrosis were failed and therefore were not included in the studies, and as a result, some tumors did not have a sufficient number of
TECHNICAL WHITE PAPER
MAY 2015 v.1 alleninstitute.org Overview brain-map.org page 16 of 26
passing blocks to be included in the atlas. Blocks passed neuropathology criteria if the H&E sections had at least 25% viable cells of core tumor at a high density of cells (50-100 cells/100μm2). The remaining 75% typically consisted of viable cells in core tumor at low to high density, tissue at various stages of necrosis, tissue affected by hemorrhage, absence of cells or tissue, leading edge (tumor cell-free margin), or infiltrating tumor. For blocks that passed tissue integrity and neuropathology criteria, RNA quality was assessed. RNA Integrity Numbers (RINs) ranged from 5.6 to 8.7, with most measurements between 7 and 8. A list of tumors and specimen blocks analyzed in each study appears in the Specimen Lists whitepaper in Documentation. IN SITU HYBRIDIZATION
Probe Design, Synthesis, and Testing For labeling target mRNA in tissue sections using ISH, digoxigenin-labeled riboprobes were designed and synthesized according to specific criteria. Briefly, using sequences obtained from RefSeq and a semi-automated process based on Primer3 software (Rozen and Skaletsky, 2000), probes were designed to be between 400-1000 bases in length (optimally > 600 bases) and to contain no more than 200 bp with > 90% homology to non-target transcripts. To facilitate cross-platform comparisons with existing Affymetrix microarray data from GBM tissue, probes for the Ivy GAP were designed to completely overlap their corresponding Affymetrix array probe when possible. Secondarily, the probes were then designed to have >50% overlap with the existing Allen Mouse Brain Atlas probe when the mouse and human genes were orthologous. Riboprobes were synthesized using standard in vitro transcription (IVT) reactions based on PCR templates prepared from human cDNA clones (NIH Mammalian Gene Collection, Open Biosystems, Huntsville, AL) or pooled cDNA synthesized from human brain total RNA. cDNA was prepared from human brain RNA from prefrontal, temporal, parietal, occipital, and frontal cortical areas as well as medulla and cerebellum (Ambion, Austin, TX) using Superscript III RTS First-Strand cDNA Synthesis Kit (Invitrogen, Carlsbad, CA), then pooled in equal amounts to provide templates for PCR. PCR primers were obtained from Integrated DNA Technologies (Coralville, IA) at a final concentration of 10μM, and designed with GC content between 42% – 62% and an optimal size of 22nt with lower and upper limits of 18nt and 26nt, respectively. For cDNA clones, the clone sequence was compared with RefSeq sequences, and consensus sequences with >98% homology across 80% of the total length were used to develop probes. When a clone was used as a template, a single PCR was used requiring only a forward and reverse primer with an additional SP6 RNA polymerase binding sequence (GCGATTTAGGTGACACTATAG). When using brain cDNA as a template, probes were generated against sequences within a region 3000 bp from the 3’ end using 3 primers: forward, reverse, and a nested reverse primer containing the SP6 RNA polymerase binding sequence. cDNA primers underwent a BLAST analysis to verify amplification of only target sequence. All cDNA reactions were run on the Bioanalyzer for quality control. Standard conditions for PCR and IVT reactions were as described by Lein et al (2007). IVT reactions were diluted to working stocks of 30ng/μl with THE (0.1mM Sodium Citrate pH 6.4, Ambion). Aliquots were stored in low volumes to minimize freeze/thaw cycles. IVT dilutions were stored at -80°C. For hybridization, the probe was diluted 1:100 (to 300ng/ml) or 1:50 (to 600ng/ml) into in situ hybridization buffer (Ambion) in 96-well ISH Probe Plates. A probe was hybridized at 600ng/ml if its gene expression in The Cancer Genome Atlas (TCGA) dataset fell in the lowest or third quartile rank. A list of probes and the concentrations used for each study appear in the Gene List in Documentation. MECOM was always hybridized at 300ng/ml. Each well provides probe for one ISH slide. Probe plates were stored at -20°C until used in an ISH run.
TECHNICAL WHITE PAPER
MAY 2015 v.1 alleninstitute.org Overview brain-map.org page 17 of 26
All PCR and IVT products were run on the Bioanalyzer for size and morphology quality control. Specifically, PCR products that were not of the correct size (+/- 100bp) or that showed multiple products were not used to generate riboprobes. IVT products that were shorter than their predicted size were not used. It is common to see IVT products that run slightly larger than their predicted molecular weight, or as multiple peaks, due to secondary structure of the RNA. IVT products with multiple bands were not used for ISH unless the additional bands were determined to result from secondary structure.
For the Anatomic Structures ISH Survey and the Cancer Stem Cells ISH Survey, probes were tested on the ISH platform optimized for GBM tissue. About 90-95% of the probes passed and were used in the atlas. Probes were failed if they caused excessive ISH artifacts such as streaks, background and signal gradients, and spots on multiple tissue sections. For the Anatomic Structures ISH for Enriched Genes Study and Cancer Stem Cells ISH for Enriched Genes Study, newly designed and synthesized probes were not tested prior to being used in the studies.
Colorimetric In Situ Hybridization and Feulgen-HP Yellow Counterstain The procedures described in the Allen Mouse Brain Atlas Data Production Processes, located in Documentation, were used for the ISH procedures, except that the proteinase K concentration used was one cycle of 5 min at 0.0007U/mL, and TSA+ (2.0μl/slide) was used instead of TSA for all studies other than the first (Anatomic Structures ISH Survey). The chemistry was optimized to detect low signal levels and therefore the ISH reaction product is saturated in many cases. Colorimetric ISH is semi-quantitative at best and is not an absolute measurement of gene expression levels; it is relative to mRNA levels in the range of non-saturating conditions. Feulgen-HP yellow DNA counterstain is a nuclear stain that adds definition to tissue with low ISH background to facilitate automated focus processes during image acquisition and to support gene expression analysis, whether done manually or informatically. After ISH, slides were removed and treated with acid alcohol (70% ethanol adjusted to pH 2.1) to reduce background, 5N hydrochloric acid to prepare the tissue for the counterstain, HP yellow counterstain (Catalog #869, Anatech Ltd) to stain the nuclei, and two final acid alcohol washes to remove non-covalently bound HP yellow stain, all on a Leica autostainer. Slides were coverslipped with Hydro-Matrix Mounting Medium on a Leica CV5030 coverslipper. Coverslipped slides were incubated overnight at 37°C to promote solidification of the mounting media. Prior to scanning, slides were cleaned to remove excess mounting media and debris.
ISH Controls The experimental variability of the automated ISH process was monitored with ISH run controls and ISH tissue controls. The run control probes Drd1a and Calb1 were hybridized to mouse brain tissue sections cut at 25μm thick, one slide per probe and 4 brain sections per slide. If the hybridization pattern of intensity and density of signal, or the background, was considered by personnel dedicated to the quality control of the process to be outside the normal variability, then the experiment was failed and repeated. The tissue control probe MECOM was hybridized to GBM tissue sections cut at 20μm thick for the ISH studies, which contained 8 sections per slide, and 14 μm thick for the ISH reference slides associated with laser microdissections used for the Cancer Stem Cells RNA-Seq Study, which contained 2 sections per slide. MECOM is expressed at low levels predominately in vascular tissue, and was used to monitor ISH signal on all specimen sub-blocks on all ISH runs. Slides containing the mouse or GBM tissue were also processed through hybridization without probe, which was used to monitor non-specific hybridization.
LASER MICRODISSECTION AND RNA-SEQ
TECHNICAL WHITE PAPER
MAY 2015 v.1 alleninstitute.org Overview brain-map.org page 18 of 26
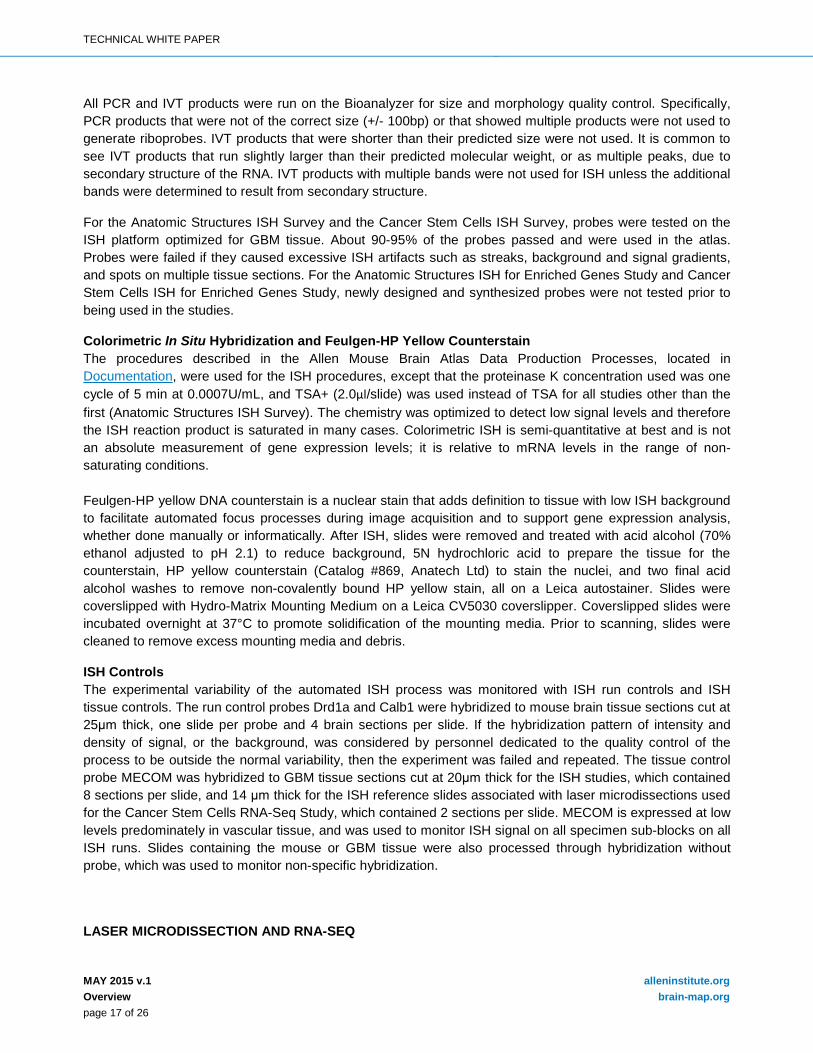
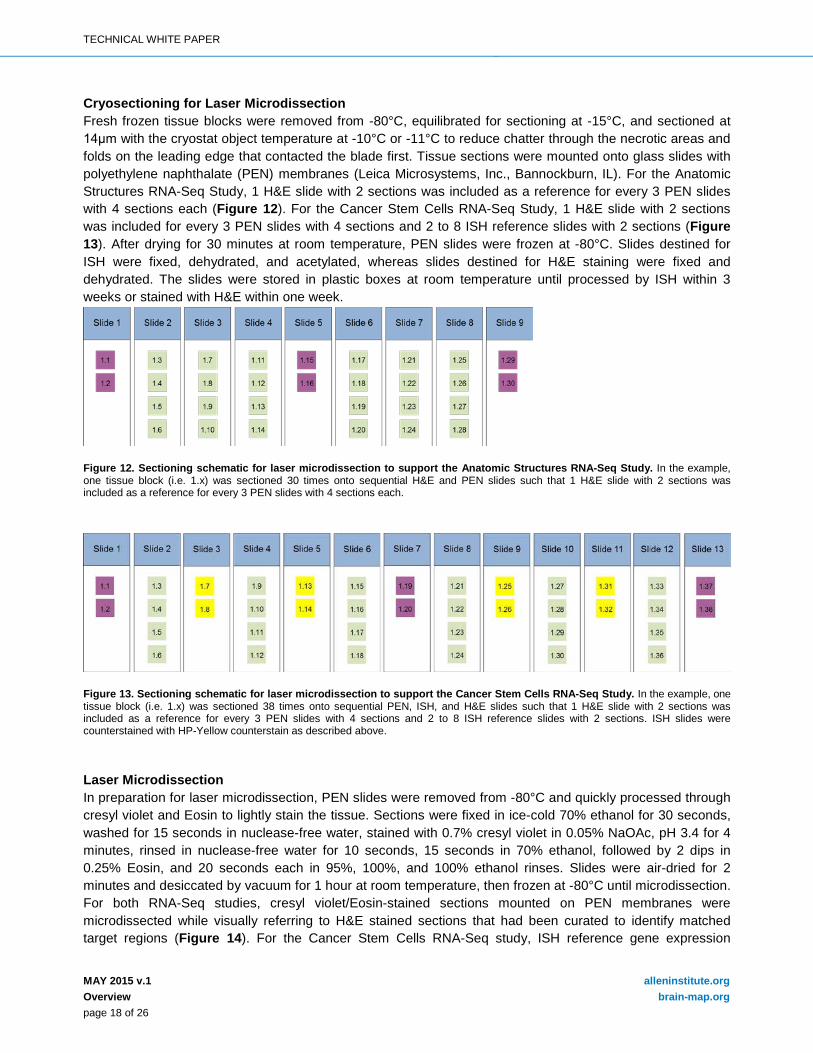
Cryosectioning for Laser Microdissection Fresh frozen tissue blocks were removed from -80°C, equilibrated for sectioning at -15°C, and sectioned at 14μm with the cryostat object temperature at -10°C or -11°C to reduce chatter through the necrotic areas and folds on the leading edge that contacted the blade first. Tissue sections were mounted onto glass slides with polyethylene naphthalate (PEN) membranes (Leica Microsystems, Inc., Bannockburn, IL). For the Anatomic Structures RNA-Seq Study, 1 H&E slide with 2 sections was included as a reference for every 3 PEN slides with 4 sections each (Figure 12). For the Cancer Stem Cells RNA-Seq Study, 1 H&E slide with 2 sections was included for every 3 PEN slides with 4 sections and 2 to 8 ISH reference slides with 2 sections (Figure 13). After drying for 30 minutes at room temperature, PEN slides were frozen at -80°C. Slides destined for ISH were fixed, dehydrated, and acetylated, whereas slides destined for H&E staining were fixed and dehydrated. The slides were stored in plastic boxes at room temperature until processed by ISH within 3 weeks or stained with H&E within one week.
Figure 12. Sectioning schematic for laser microdissection to support the Anatomic Structures RNA-Seq Study. In the example, one tissue block (i.e. 1.x) was sectioned 30 times onto sequential H&E and PEN slides such that 1 H&E slide with 2 sections was included as a reference for every 3 PEN slides with 4 sections each.
Figure 13. Sectioning schematic for laser microdissection to support the Cancer Stem Cells RNA-Seq Study. In the example, one tissue block (i.e. 1.x) was sectioned 38 times onto sequential PEN, ISH, and H&E slides such that 1 H&E slide with 2 sections was included as a reference for every 3 PEN slides with 4 sections and 2 to 8 ISH reference slides with 2 sections. ISH slides were counterstained with HP-Yellow counterstain as described above. Laser Microdissection In preparation for laser microdissection, PEN slides were removed from -80°C and quickly processed through cresyl violet and Eosin to lightly stain the tissue. Sections were fixed in ice-cold 70% ethanol for 30 seconds, washed for 15 seconds in nuclease-free water, stained with 0.7% cresyl violet in 0.05% NaOAc, pH 3.4 for 4 minutes, rinsed in nuclease-free water for 10 seconds, 15 seconds in 70% ethanol, followed by 2 dips in 0.25% Eosin, and 20 seconds each in 95%, 100%, and 100% ethanol rinses. Slides were air-dried for 2 minutes and desiccated by vacuum for 1 hour at room temperature, then frozen at -80°C until microdissection. For both RNA-Seq studies, cresyl violet/Eosin-stained sections mounted on PEN membranes were microdissected while visually referring to H&E stained sections that had been curated to identify matched target regions (Figure 14). For the Cancer Stem Cells RNA-Seq study, ISH reference gene expression
TECHNICAL WHITE PAPER
MAY 2015 v.1 alleninstitute.org Overview brain-map.org page 19 of 26
patterns informed the curation of the H&E stained sections (Figure 15). A Leica LMD6000 (Leica Microsystems, Inc., Bannockburn, IL) was used for microdissection, and the system included an upright research microscope fitted with a diode laser and a CCD camera to acquire live images of slides. The scope and laser were controlled via a dedicated computer running Leica LMD software (v.6.6.2.3552).
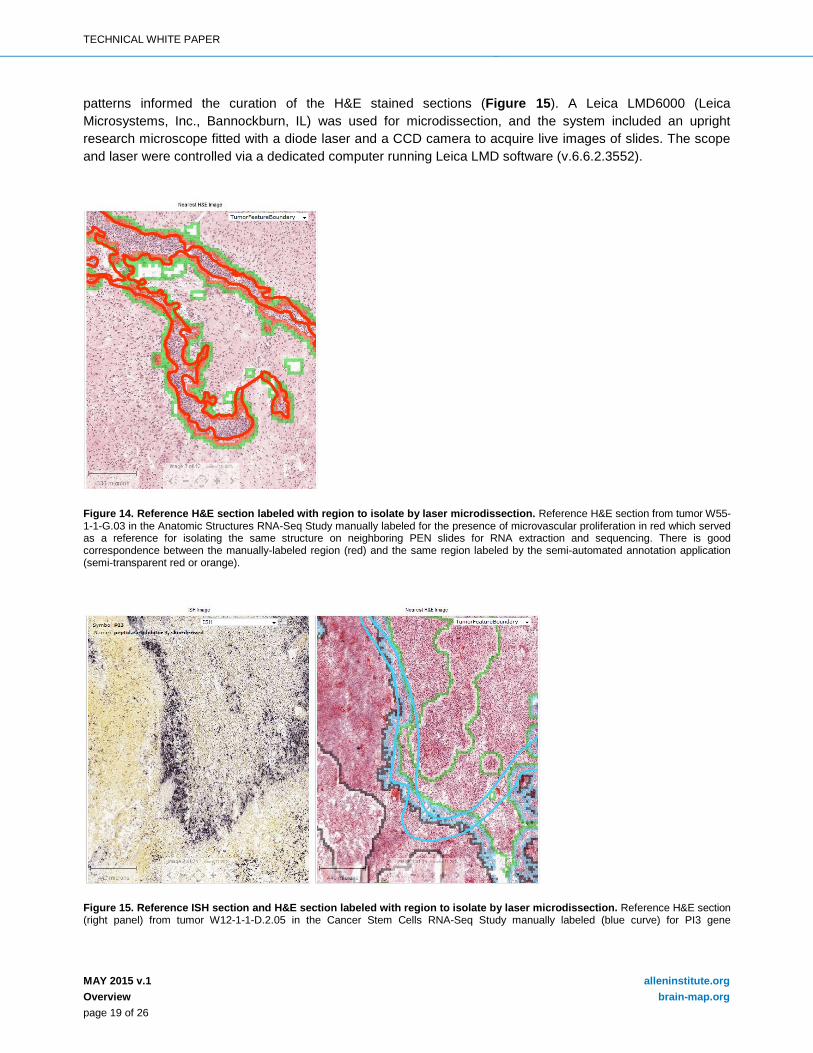
Figure 14. Reference H&E section labeled with region to isolate by laser microdissection. Reference H&E section from tumor W55-1-1-G.03 in the Anatomic Structures RNA-Seq Study manually labeled for the presence of microvascular proliferation in red which served as a reference for isolating the same structure on neighboring PEN slides for RNA extraction and sequencing. There is good correspondence between the manually-labeled region (red) and the same region labeled by the semi-automated annotation application (semi-transparent red or orange).
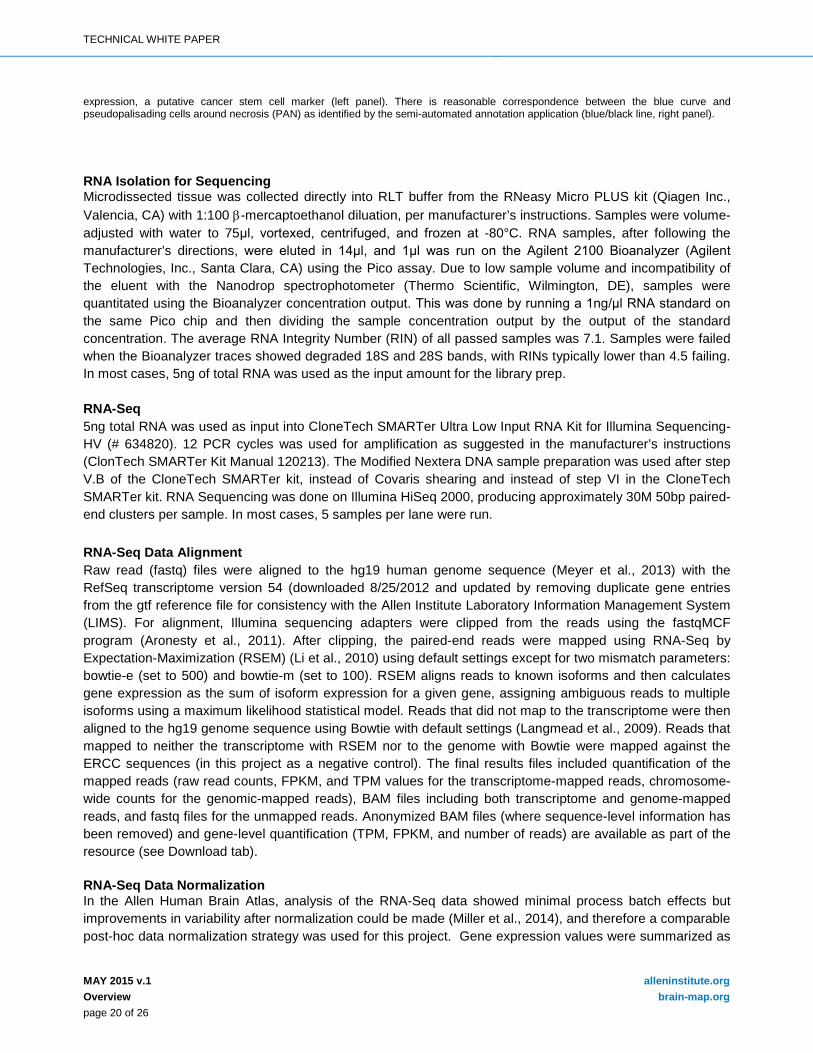
Figure 15. Reference ISH section and H&E section labeled with region to isolate by laser microdissection. Reference H&E section (right panel) from tumor W12-1-1-D.2.05 in the Cancer Stem Cells RNA-Seq Study manually labeled (blue curve) for PI3 gene
TECHNICAL WHITE PAPER
MAY 2015 v.1 alleninstitute.org Overview brain-map.org page 20 of 26
expression, a putative cancer stem cell marker (left panel). There is reasonable correspondence between the blue curve and pseudopalisading cells around necrosis (PAN) as identified by the semi-automated annotation application (blue/black line, right panel). RNA Isolation for Sequencing Microdissected tissue was collected directly into RLT buffer from the RNeasy Micro PLUS kit (Qiagen Inc., Valencia, CA) with 1:100 β-mercaptoethanol diluation, per manufacturer’s instructions. Samples were volume-adjusted with water to 75μl, vortexed, centrifuged, and frozen at -80°C. RNA samples, after following the manufacturer’s directions, were eluted in 14μl, and 1μl was run on the Agilent 2100 Bioanalyzer (Agilent Technologies, Inc., Santa Clara, CA) using the Pico assay. Due to low sample volume and incompatibility of the eluent with the Nanodrop spectrophotometer (Thermo Scientific, Wilmington, DE), samples were quantitated using the Bioanalyzer concentration output. This was done by running a 1ng/μl RNA standard on the same Pico chip and then dividing the sample concentration output by the output of the standard concentration. The average RNA Integrity Number (RIN) of all passed samples was 7.1. Samples were failed when the Bioanalyzer traces showed degraded 18S and 28S bands, with RINs typically lower than 4.5 failing. In most cases, 5ng of total RNA was used as the input amount for the library prep. RNA-Seq 5ng total RNA was used as input into CloneTech SMARTer Ultra Low Input RNA Kit for Illumina Sequencing-HV (# 634820). 12 PCR cycles was used for amplification as suggested in the manufacturer’s instructions (ClonTech SMARTer Kit Manual 120213). The Modified Nextera DNA sample preparation was used after step V.B of the CloneTech SMARTer kit, instead of Covaris shearing and instead of step VI in the CloneTech SMARTer kit. RNA Sequencing was done on Illumina HiSeq 2000, producing approximately 30M 50bp paired-end clusters per sample. In most cases, 5 samples per lane were run. RNA-Seq Data Alignment Raw read (fastq) files were aligned to the hg19 human genome sequence (Meyer et al., 2013) with the RefSeq transcriptome version 54 (downloaded 8/25/2012 and updated by removing duplicate gene entries from the gtf reference file for consistency with the Allen Institute Laboratory Information Management System (LIMS). For alignment, Illumina sequencing adapters were clipped from the reads using the fastqMCF program (Aronesty et al., 2011). After clipping, the paired-end reads were mapped using RNA-Seq by Expectation-Maximization (RSEM) (Li et al., 2010) using default settings except for two mismatch parameters: bowtie-e (set to 500) and bowtie-m (set to 100). RSEM aligns reads to known isoforms and then calculates gene expression as the sum of isoform expression for a given gene, assigning ambiguous reads to multiple isoforms using a maximum likelihood statistical model. Reads that did not map to the transcriptome were then aligned to the hg19 genome sequence using Bowtie with default settings (Langmead et al., 2009). Reads that mapped to neither the transcriptome with RSEM nor to the genome with Bowtie were mapped against the ERCC sequences (in this project as a negative control). The final results files included quantification of the mapped reads (raw read counts, FPKM, and TPM values for the transcriptome-mapped reads, chromosome-wide counts for the genomic-mapped reads), BAM files including both transcriptome and genome-mapped reads, and fastq files for the unmapped reads. Anonymized BAM files (where sequence-level information has been removed) and gene-level quantification (TPM, FPKM, and number of reads) are available as part of the resource (see Download tab). RNA-Seq Data Normalization In the Allen Human Brain Atlas, analysis of the RNA-Seq data showed minimal process batch effects but improvements in variability after normalization could be made (Miller et al., 2014), and therefore a comparable post-hoc data normalization strategy was used for this project. Gene expression values were summarized as
TECHNICAL WHITE PAPER
MAY 2015 v.1 alleninstitute.org Overview brain-map.org page 21 of 26
transcripts per million (TPM) and fragments per kilobase per million (FPKM), as described above, both of which normalize read counts by gene length and for the total number of reads in slightly different ways. These normalized gene-level quantifications are available for download, as mentioned above. To improve display in the website heatmap, the FPKM data matrix was further adjusted for the total transcript count using TbT normalization (Kadota, et al., 2012), which scales each sample based on the summed expression of all genes that are not differentially expressed. FPKM values were TbT normalized in linear space, with the differential expression vector was defined as TRUE if a sample was from cellular tumor and FALSE if otherwise. Sample data was then scaled such that the total log2(FPKM) across the entire data set remained unchanged after normalization. The result of this step was that expression levels for all genes in a particular sample were multiplied by a scalar value close to 1 (in most cases between 0.7-1.3).
IMAGE PROCESSING
Image Acquisition and Processing Whole slides were scanned directly to SVS file format at a resolution of 0.5μm/pixel without down sampling on ScanScope® scanners (Aperio Technologies, Inc; Vista, CA) equipped with a 20x objective and Spectrum software. The raw image files of ~5 GB per image were archived after they were converted to JPEG 2000 file format. The preprocessed images were flipped along the horizontal axis, white balanced, and compressed at a rate of 0.8 to ~400 MB per image. During post-processing (Informatics Data Processing), colorized expression values or heat masks showing ISH signal intensity were generated and the closest H&E stained image of the same specimen was calculated for each ISH section. Image and Annotation Quality Control During review of images, the automated bounding box overlay was manually adjusted if necessary so that each of 8 bounding boxes per slide was placed over the corresponding tissue section, and images of slides with focus or image tile stich misalignments were re-scanned. Images were failed if data analysis was compromised by artifacts (e.g. mechanical damage, mounting medium bubbles, hybridization bubbles, and NBT/BCIP precipitated aggregates) associated with the corresponding tissue section.
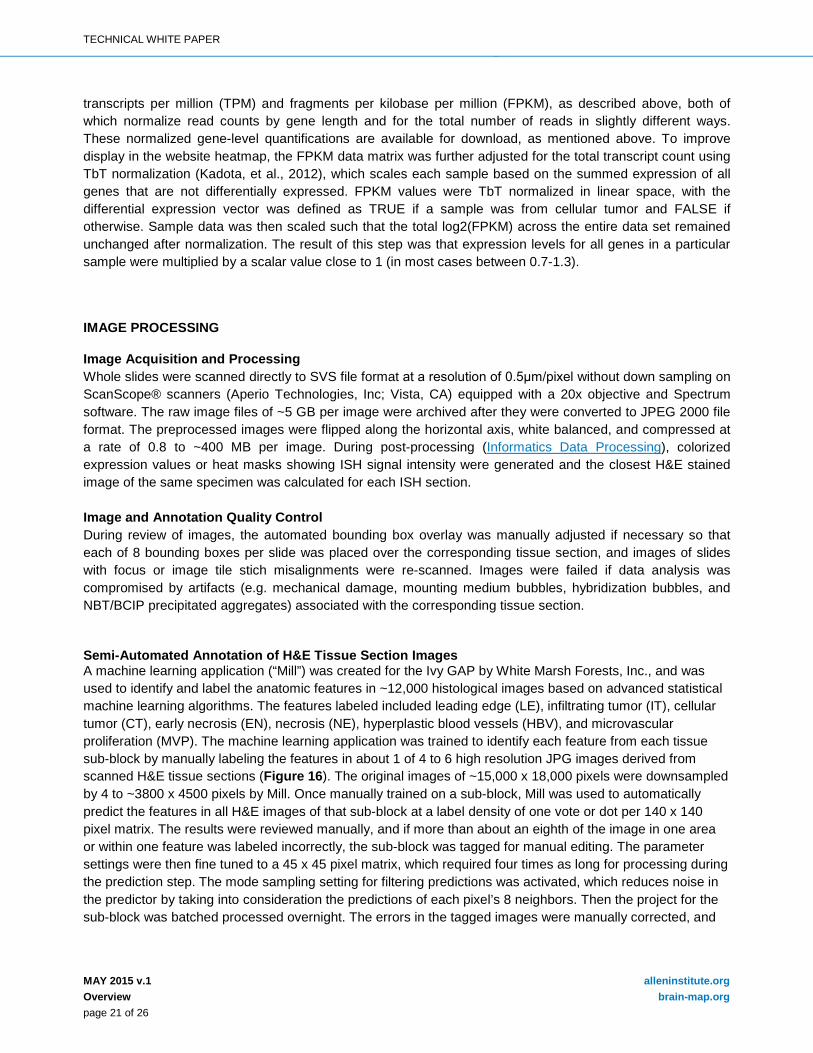
Semi-Automated Annotation of H&E Tissue Section Images A machine learning application (“Mill”) was created for the Ivy GAP by White Marsh Forests, Inc., and was used to identify and label the anatomic features in ~12,000 histological images based on advanced statistical machine learning algorithms. The features labeled included leading edge (LE), infiltrating tumor (IT), cellular tumor (CT), early necrosis (EN), necrosis (NE), hyperplastic blood vessels (HBV), and microvascular proliferation (MVP). The machine learning application was trained to identify each feature from each tissue sub-block by manually labeling the features in about 1 of 4 to 6 high resolution JPG images derived from scanned H&E tissue sections (Figure 16). The original images of ~15,000 x 18,000 pixels were downsampled by 4 to ~3800 x 4500 pixels by Mill. Once manually trained on a sub-block, Mill was used to automatically predict the features in all H&E images of that sub-block at a label density of one vote or dot per 140 x 140 pixel matrix. The results were reviewed manually, and if more than about an eighth of the image in one area or within one feature was labeled incorrectly, the sub-block was tagged for manual editing. The parameter settings were then fine tuned to a 45 x 45 pixel matrix, which required four times as long for processing during the prediction step. The mode sampling setting for filtering predictions was activated, which reduces noise in the predictor by taking into consideration the predictions of each pixel’s 8 neighbors. Then the project for the sub-block was batched processed overnight. The errors in the tagged images were manually corrected, and
TECHNICAL WHITE PAPER
MAY 2015 v.1 alleninstitute.org Overview brain-map.org page 22 of 26
the CSV files were exported. A board-certified neuropathologist was consulted on a regular basis throughout the semi-automated annotation effort.
Figure 16. Machine learning application (Mill) for semi-automated annotation of histology images. In a machine learning training session, Mill (White Marsh Forests, Inc.) was used to manually label images of H&E-stained tissue section with colored boxes, e.g. green for CT and magenta for IT (left panel). Once trained, Mill was used to automatically predict all features of the image and images of nearby tissue sections in its sub-block with a dot matrix (right panel).
Quantification of Nuclei in H&E Tissue Sections
The rule-set based application called Developer (Definiens, Inc.) was used to count the nuclei in the original JPG image of each tissue section, using the same 45 x 45 pixel matrix used by Mill after rescaling. Two layers, representing Hematoxylin and Eosin stained populations, were separated from the JPG image, and nuclei were counted using the watershed algorithm on the Hematoxylin layer. The nuclear count was saved in a CSV file, later merged with the post-processed CSV file of automated annotations from Mill, and used to normalize ISH signal intensity in each anatomic feature for the final gene expression calculations in the Ivy GAP web application.
Post-Processing of CSV Annotation Files
The final set of anatomic annotations for each H&E image was prepared in a series of post-processing steps as outlined below. Then the CSV file was imported into LIMS.
1. Merged the CSV file of annotations with the file for nuclear count. 2. Converted pseudopalisading cells around necrosis (PAN) to pseudopalisading cells no necrosis
(PNN) if there was no necrosis (NE) within 900 pixels of PAN. 3. Provided hierarchy for blood vessels (BV), hyperplastic blood vessels (HBV), and microvascular
proliferation (MVP). 4. Merged early necrosis (EN) with necrosis (NE) to make revised and final NE. 5. Converted cellular tumor (CT) to cellular tumor perinecrotic zone (CTpnz) if there was no necrosis
(NE) within 180 pixels. 6. Made all labels consistent with Ivy GAP ontology. 7. Replaced early training labels hemorrhage (HE), tissue fold (FOLD), ice damage (ICE), and space or
no tissue (SPA) with 0.
TECHNICAL WHITE PAPER
MAY 2015 v.1 alleninstitute.org Overview brain-map.org page 23 of 26
8. Replaced all predictions with 0 on selected images (<10) that were distorted due to sectioning artifacts and that could not be accurately registered to ISH.
9. Sorted files first by y coordinate and then by x coordinate.
INFORMATICS DATA PROCESSING PIPELINE
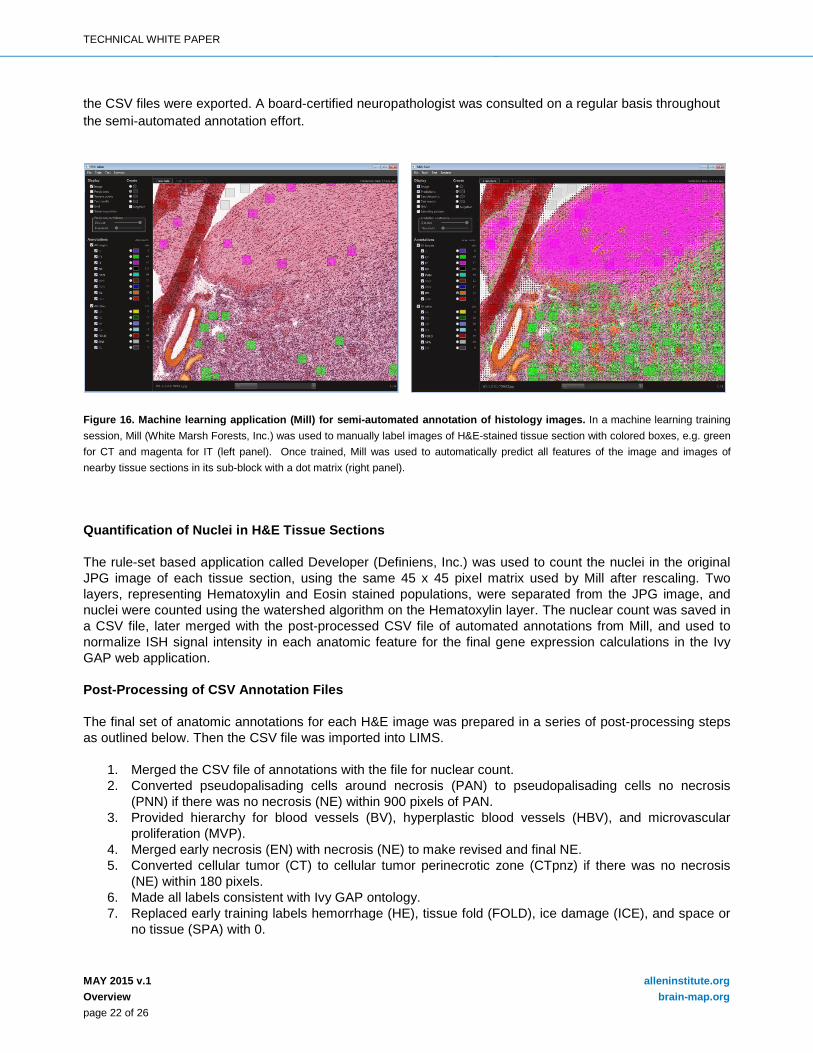
An informatics processing pipeline was developed to support the quantification of gene expression in tumor features, which were labeled in the nearest H&E image with the semi-automated annotation application, and for which the nuclear density was counted in each 45 x 45 pixel grid.
Figure 17. Informatics data processing pipeline to support the quantification of gene expression associated with tumor features
Image Registration A multi-resolution elastic registration algorithm was developed to register the ISH image to the closet H&E image to enable the transfer the anatomical region annotation onto the expression data. Both the H&E and ISH images were first down-sampled and split into RGB channels. Image pyramids were then constructed on the red channel of H&E and the blue channel of ISH to enable multi-resolution registration.

TECHNICAL WHITE PAPER
MAY 2015 v.1 alleninstitute.org Overview brain-map.org page 24 of 26
An elastic registration algorithm (Sorzano et al, 2005) was then applied to each level of the H&E and ISH image pyramids. It minimized the energy function: E=w_i E_img +w_s E_smooth, where E_img is the intensity dissimilarity between the target (H&E) and the warped subject image (ISH); E_smooth is the smoothness of the deformation field of the warped subject image defined by divergence and curl; w_i, w_s are weights of E_img, and E_smooth, respectively.
After registration, the deformation field of the warped ISH was reversely-mapped. The deformation field of the H&E was generated, which indicated where each pixel in the H&E needed to move in order to match a pixel in the corresponding ISH image. The H&E annotation was further mapped onto the unwarped ISH images.
Signal Detection Images of ISH sections counterstained with HP-Yellow were first down-sampled by a factor of 2. The underlying method for ISH detection algorithm used is in principal similar to the one for the Allen Mouse Brain Atlas which is based on adaptive filtering in combination of mathematic morphology operations. However, the image spectral information used for detection is mainly from the Red channel in order to avoid the impact of the HP-Yellow counterstain, though the contrast of the expressors in Red are lower than in Green channel but still deemed sufficient. Additional process was included to separate and remove the expressor-look-alike dark brown objects artifacts. There are also morphometric limitations set for expressor objects to exclude various other types of artifacts such as fragments of coverslip edges.
Signal Unionization and Search Classification results in feature labels and nuclear coverage fractional area for each 45x45 pixel block for each H&E image. Automated ISH annotation was achieved by registering to the ISH to the nearest H&E image and warping the feature labels to fit the ISH image. Small features were dilated to compensate for potential misalignment.
An expression energy value is computed for each feature by summing expressing pixel intensity for each block labeled for that feature normalized by the sum of nuclear coverage fractional area.
A search service was developed to allow users search over the whole dataset for user defined specimen and/or expression profiles.
Tumor feature search: find all tumor blocks containing a specific feature sorted by the normalized area occupied by the feature.
Expression search: find all ISH sections containing a specific feature sorted by expression energy within the feature.
Differential search: find all ISH section with expression energy with higher expression in the target feature compared to a contrast feature.
REFERENCES
Aronesty E (2011) ea-utils: Command-line tools for processing biological sequencing data. Expression Analysis http://code.google.com/p/ea-utils.
Culling CFA, Allison RT, Barr WT (1985) Haemotoxylin and its counterstains. In Cellular Pathology Technique, 4th Edition, pp 160-161. Butterworths, London.
TECHNICAL WHITE PAPER
MAY 2015 v.1 alleninstitute.org Overview brain-map.org page 25 of 26
Ening G, Osterheld F, Capper D, Schmieder K, Brenke C (2015) Charlson comorbidity index: an additional prognostic parameter for preoperative glioblastoma patient stratification. J Cancer Res Clin Oncol, doi:10.1007/s00432-014-1907-9.
Hegi ME, Diserens AC, Gorlia T, Hamou MF, de Tribolet N, Weller M, Kros JM, Hainfellner JA, Mason W, Mariani L, Bromberg JE, Hau P, Mirimanoff RO, Cairncross JG, Janzer RC, Stupp R (2005) MGMT gene silencing and benefit from temozolomide in glioblastoma. N Engl J Med 352:997-1003, doi:10.1056/NEJMoa043331.
Hobbs J, Nikiforova MN, Fardo DW, Bortoluzzi S, Cieply K, Hamilton RL, Horbinski C (2012) Paradoxical relationship between the degree of EGFR amplification and outcome in glioblastomas. Am J Surg Pathol 36:1186-93, doi:10.1097/PAS.0b013e3182518e12.
Kadota K, Nishiyama T, Shimizu K (2012) A normalization strategy for comparing tag count data. Algorithms Mol Biol 7:5, doi: 10.1186/1748-7188-7-5.
Keles GE, Anderson B, Berger MS (1999) The effect of extent of resection on time to tumor progression and survival in patients with glioblastoma multiforme of the cerebral hemisphere. Surg Neurology 52: 371-379.
Langmead B, Trapnell C, Pop M, Salzberg SL (2009) Ultrafast and memory-efficient alignment of short DNA sequences to the human genome. Genome Biol 10:R25, doi: 10.1186/gb-2009-10-3-r25.
Lein ES et al. (2007) Genome-wide atlas of gene expression in the adult mouse brain. Nature 445:168-176.
Li B, Ruotti V, Stewart RM, Thomson JA, Dewey CN (2010) RNA-Seq gene expression estimation with read mapping uncertainty. Bioinformatics 26:493-500, doi: 10.1093/bioinformatics/btp692.
Mariani L, McDonough WS, Hoelzinger DB, Beaudry C, Kaczmarek E, Coons SW, Giese A, Moghaddam M, Seiler RW, Berens ME (2001) Identification and validation of P311 as a glioblastoma invasion gene using laser capture microdissection. Cancer Res 61:4190-4196.
Meyer LR, Zweig AS, Hinrichs AS, Karolchik D, Kuhn RM, Wong M, Sloan CA, Rosenbloom KR, Roe G, Rhead B, et al (2013) The UCSC Genome Browser database: extensions and updates 2013. Nucleic Acids Res 41:D64-69, doi: 10.1093/nar/gks1048
Miller JA, Menon V, Goldy J, Kaykas A, Lee C-K, Smith KA, Shen EH, Phillips JW, Lein ES, Hawrylycz MJ (2014) Improving reliability and absolute quantification of human brain microarray data by filtering and scaling probes using RNA-Seq. BMC Genomics 15:154, doi: 10.1186/1471-2164-15-154.
Ng L , Pathak SD , Kuan C , Lau C , Dong H , Sodt A , Dang C , Avants B , Yushkevich P , Gee JC , Haynor D , Lein E , Jones A , Hawrylycz M (2007) Neuroinformatics for genome-wide 3-D gene expression mapping in the mouse brain. IEEE/ACM Trans Comput Biol Bioinform 4:382-93.
Rozen S, Skaletsky, HJ (2000) Primer3 on the WWW for general users and for biologist programmers. In Bioinformatics Methods and Protocols: Methods in Molecular Biology. pp365-386. Humana Press, Totowa NJ.
Sano T, Lin H, Chen X, Langford LA, Koul D, Bondy ML, Hess KR, Myers JN, Hong YK, Yung WK, Steck PA (1999) Differential expression of MMAC/PTEN in glioblastoma multiforme: relationship to localization and prognosis. Cancer Res 59:1820-4.
TECHNICAL WHITE PAPER
MAY 2015 v.1 alleninstitute.org Overview brain-map.org page 26 of 26
Sorzano CO, Thévenaz P, Unser M (2005) Elastic registration of biological images using vector-spline regularization. IEEE Trans Biomed Eng 52:652-63.
Sottoriva A, Spiteri I, Piccirillo SG, Touloumis A, Collins VP, Marioni JC, Curtis C, Watts C, Tavaré S (2013) Intratumor heterogeneity in human glioblastoma reflects cancer evolutionary dynamics. Proc Natl Acad Sci USA 110:4009-14, doi:10.1073/pnas.1219747110.
Srividya MR, Thota B, Shailaja BC, Arivazhagan A, Thennarasu K, Chandramouli BA, Hegde AS, Santosh V (2011) Homozygous 10q23/PTEN deletion and its impact on outcome in glioblastoma: a prospective translational study on a uniformly treated cohort of adult patients. Neuropathology 31:376-83, doi: 10.1111/j.1440-1789.2010.01178.x.
Thomas RP, Xu LW, Lober RM, Li G, Nagpal S (2013) The incidence and significance of multiple lesions in glioblastoma. J of Neuro-oncology 112: 91-97, doi:10.1007/s11060-012-1030-1.
Verhaak RG, Hoadley KA, Purdom E, Wang V, Qi Y, Wilkerson MD, Miller CR, Ding L, Golub T, Mesirov JP, Alexe G, Lawrence M, O'Kelly M, Tamayo P, Weir BA, Gabriel S, Winckler W, Gupta S, Jakkula L, Feiler HS, Hodgson JG, James CD, Sarkaria JN, Brennan C, Kahn A, Spellman PT, Wilson RK, Speed TP, Gray JW, Meyerson M, Getz G, Perou CM, Hayes DN, Cancer Genome Atlas Research Network (2010) Integrated genomic analysis identifies clinically relevant subtypes of glioblastoma characterized by abnormalities in PDGFRA, IDH1, EGFR, and NF1. Cancer Cell 17:98-110, doi: 10.1016/j.ccr.2009.12.020.