Embed Size (px)
Citation preview

Energy Efficiency Improvements for Motor & Its Drive Systems
ENERGY EFFICIENCY IMPROVEMENTS FOR MOTORS & ITS DRIVE SYSTEMS
Technical Study Report

Energy Efficiency Improvements for Motor & Its Drive Systems
This report was produced under the project entitled “Supporting Action on Climate Change through a Network of National Climate Change Focal Points in South-east Asia” (SEAN-CC) implemented by UNEP and funded by Ministry of Foreign Affairs of the Government of Finland. Dec 2011
Energy Efficiency Improvements for Motor & Its Drive Systems
ABOUT THE TECHNICAL STUDY REPORT
Continuing increase of electricity prices.
With limited natural resources and the ever increasing global demand for energy, it only stands to reason that energy costs will continue to increase into the future. As energy costs rise around the world, the incentive for facilities to operate their equipment more efficiently will compound over time. There are government regulations use to enforce conservation, and compensatory means (e.g., special rate tariffs) that reward users for using less energy.
Energy efficiency improvements – such as through replacement of old standard electric motors, frequently burnt motors, or oversized electric motors by High Efficiency Motors (HEMS) and improving its drive systems - can be an option by which a company can offset their electricity expenses.
Global move towards decarbonisation.
The international movement towards minimizing effects of climate change coupled with clamor from consumers for companies to leave as little carbon footprint in the manufacture of their products motivates firms to explore possibilities for lowering their carbon footprints. Energy efficiency options will be looked at more earnestly, especially so when these are embedded as part of their corporate social responsibility (CSR) objectives.
This Technical Study Report (TRS) provides the ideas and technologies to improve energy efficiency of motors and its drive systems, increase equipment reliability, reduce expense on electricity, and help minimize effects of climate change and lowering carbon footprints.

Energy Efficiency Improvements for Motor & Its Drive Systems
SECTION 1: INTRODUCTION 1
1.1 Type of Electric Motors 11.2 Electric Motor Drive System Applications 31.3 Example of Motor Application 4
SECTION 2: FACTORS AFFECTING MOTOR EFFICIENCY 62.1 Factors Affecting Motor Efficiency 7 A. Motor Performance 7 B. Voltage Variance 7 C. Voltage Unbalance 8 D. Motor Load 8 E. Total Harmonic Distortions 9 F. Power Factor 92.2 Rewound Motoss 92.3 Common Motor Practices that Degrade Lifecycle and Efficiency of Motor 112.4 Piping and Ducting Systems 13
SECTION 3: ENERGY EFFICIENCY TECHNOLOGIES 163.1 Energy Audit 173.2 Standards 173.3 Motor Efficiencies 233.4 Repair or Replacement Based on Lifecycle Approach 253.5 Voltage Stabilization 263.6 Proper Motor Sizing 273.7 ISO50001 - Energy Management Standards 28
SECTION 4: RECOMMENDATIONS 294.1 Electric Motor Asset Management 304.2 Strategies for Electric Motor Drive System (EMDS) Improvement 344.3 Electric Motor Manufactures 364.4 Voltage Stabilizer Manufacturers 39
Contents

Energy Efficiency Improvements for Motor & Its Drive Systems
LIST OF TABLESTable 1 - Motor efficiency classes in different countries and the corresponding 18 international standard Table 2 - Timeline for electric‐motor efficiency classes, testing standards and minimum 19 energy performance Table 3 - Share of efficiency class IE3 in electric motor sales by size, United States (2003) 22
LIST OF FIGURESFigure 1 - Type of motors 3Figure 2 - Effect of voltage variations on induction motor character 8Figure 3 - Impact of misalignment in power consumption 9Figure 4 - 97.9 watts is drawn by motor with aligned shaft 9Figure 5 - 122.1 watts is drawn by motor with misaligned shaft 9Figure 6 - Stator with unequal turns per coil 10Figure 7 - Coil span 10Figure 8 - Open drip proof motor 11Figure 9 - Open terminal box 11Figure 10 - Deformed rotor fins that will cause unbalance 11Figure 11 - High vertical vibration level caused by weak foundation – resonance 11Figure 12 - Misalign pulley and over belt tensioned 12Figure 13 - RU 301. No improvement on its performance after repair 12Figure 14 - Vibration results of scrubber# 1 13Figure 15 - Scrubber 1 structure 13Figure 16 - Alignment result prior to motor replacement 13
SECTION 5: OTHER ENERGY EFFICIENCY IMPROVEMENTS 41 5.1 Rewinding 475.2 Variable Frequency Drives 435.3 Power Quality 445.4 Power Factory Improvement 465.5 Testing and Equipment Requirement 48
SECTION 6: ANNEX 50Annex 1 - Tables with Efficiency Classes: IEC 60034-30 92008) - 50 HZ 51Annex 2 - Tables with Efficiency Classes: IEC 60034-30 92008) - 60 HZ 52Annex 3 - Tables with Efficiency Classes: NEMA Premium 53Annex 4 - ISO 10816-3 Vibration Severity Chart 54Annex 5 - Alignment Tolerance 54
ABBREVIATIONS 55
GLOSSARY 56
REFERENCE 58
SECTION 7: CASE STUDIES 60

Energy Efficiency Improvements for Motor & Its Drive Systems
Figure 17 - Common pipe configuration problems and how to correct them 14Figure 18 - 900 Pipe Elbow had contribute much of the axial vibration 15Figure 19 - Vibration results of pump with 900 pipe elbow 15Figure 20 - Efficiency classes for four‐pole motors of standard 18 IE3, IE2 and IE1 classes, and the new IE4 class Figure 21 - Typical IEC motor nameplate 20Figure 22 - Typical NEMA motor nameplate 20Figure 23 - Market share of efficiency classes in the United States (2001‐06) 21Figure 24 - Motor efficiencies in Canada before and after introduction in 1997 of 21 Energy‐efficiency regulations for general purpose industrial motors Figure 25 - Market share of efficiency classes in Europe under the CEMEP 22 voluntary agreementFigure 26 - Motor loading performances 24Figure 27 - Vibration analysis results 25Figure 28 - IE3 premium - efficiency motor 26Figure 29 - Example of how downsizing can pay for a more efficient motor 27Figure 30 - 125 HP motor load analysis 31Figure 31 - Estimate payback time /ROI (Year) investing on HEM versus repair of motor 32Figure 32A - Estimated energy savings from 20HP/15kW to 100HP/75kW 33Figure 32B - Estimated energy savings from 1HP/0.745kW to 15HP/11kW 33Figure 33 - Estimated carbon dioxide emissions 34Figure 34 - Strategies for EMDS reliability 34Figure 35 - Mean-length-turn 41Figure 36 - Low slot fill 41Figure 37 - SAMATIC 8080 computerize motor rewinding machine 42Figure 38 - Adjustable concentric heads 42Figure 39 - Improved slot fill 43Figure 40 - Improvement of THD and Ieff after correct selection of passive 45 harmonic filters (P = 22kW) Figure 41 - System improvement for harmonics 46Figure 42 - Components of motor current 46Figure 43 - Motor current with PF correction capacitors 47

Energy Efficiency Improvements for Motor & Its Drive Systems
Section 1
<<
SECTION 1
1
Energy Efficiency Improvements for Motor & Its Drive Systems
Section 1
<<
INTRODUCTION
The principal business of an industrial facility is production, not energy efficiency. This is the underlying reason why market forces alone will not achieve industrial energy efficiency on a global basis, “price signals” notwithstanding. High energy prices or constrained energy supply will motivate industrial facilities to try to secure the amount of energy required for operations at the lowest possible price. But price alone will not build awareness within the corporate culture of the industrial firm of the potential for the energy savings, maintenance savings and production benefits that can be realized from the systematic pursuit of industrial energy efficiency. It is this lack of awareness and the corresponding failure to manage energy use with the same attention that is routinely afforded production quality, waste reduction and labor costs that is at the root of the opportunity.
Industrial energy efficiency will definitely reduce energy costs of any industrial facilities. It should begin by evaluating their number one energy consuming culprit: motors, particularly rewound motors. The cavalry of inefficiency comes after the failed motor is rewound. Workmanship and/or quality of materials degrade motor efficiency by almost 5 to 7.6%.
The most common type of motor in use today is the polyphase induction motor, over 90% of which are squirrel cage induction motors. Because of their prevalence throughout the industrial (and commercial) sector, polyphase induction motors offer a great potential savings opportunity in both energy and operational costs during the motor’s useful life.
There are three primary barriers to improving motor system energy efficiency:• Lack of awareness of the energy savings opportunity,• Reluctance of companies to adopt new technologies. The perceived risk of new technologies
sometimes constraints the adoption of newer energy efficient technologies. When a company is used to operating old motor systems without any major problem encountered, the idea of trying untested high efficient motors, may face hesitation, at worst denial.
• Management awareness, attitudes, and perception. When limited information is available, efficiency improvement measures are sometimes perceived risky propositions. Further, they can be perceived as affecting the manufacturing process timelines. In some instances, there is intrinsic company culture that prevents implementing energy efficiency projects that would require additional investment.
1.1 Types of Electric Motors
To ensure that motors are applied properly, it is essential to understand the various types of motors and their operating characteristics. Electric motors fall into two classes, based on the power supply: alternating current (ac) or direct current (dc). The most common types of industrial motors are shown in Figure 1.
Alternating current (ac) motors can be single-phase or polyphase. In terms of quantity, single-phase motors are the most common type, mainly because many small motors are used for residential and commercial applications in which single-phase power is readily available. However, several operating constraints on these motors limit their widespread use in industrial applications. Integral single-phase induction
2

Energy Efficiency Improvements for Motor & Its Drive Systems
Section 1
<<
motors tend to pull large starting currents relative to the motor’s size. In general, they operate less efficiently than three-phase motors of comparable size, and are not available in larger sizes.
In contrast, polyphase motors are used widely in industrial applications. They consume more than half of all the electricity used in industry. Polyphase motors can be found in almost every industrial process, and they often operate continuously to support production processes.
These motors can achieve high efficiencies with favorable torque and current characteristics. The effectiveness and low cost of three-phase motors are major reasons why three-phase power is used so widely in industry. In terms of energy consumption and efficiency improvement opportunities, three-phase motor systems predominate. Therefore, they are the main focus of this TSR.
1.2 Electric Motor Drive System Applications
Motors are used in a myriad of applications, which are broadly categorized as follows:• Industrial applications: pumps, fans, compressed air delivery, conveyors, motive power for other
machinery, etc.• Building applications: pumps, fans, conveyors, lifts, compressors in heating, ventilation and air‐
conditioning systems, etc.• Appliance applications: refrigerators, air conditioners, personal computer and laptop fans, hard
drives, cooking appliances, oven fans, extractor fans, garden appliances, pool pumps, etc.
AC Motors DC Motors Specialty Motors
Single Phase
Induction
Wound Rotor
Polyphase
Synchronous
Squirrel Cage
Series Wound
Shunt Wound
Compound Wound
Permanent Magnet
Switched Reluctance
Figure 1- Type of Motors
3

Energy Efficiency Improvements for Motor & Its Drive Systems
Section 1
<<
1.3 Example of Motor Applications
a) Industrial
b) Buildings
Pumps Compressor
Fans Conveyor
Fans for HVAC Systems Pump
4

Energy Efficiency Improvements for Motor & Its Drive Systems
Section 1
<<
c) Appliances
Elevator or lift Motor for air condition unit
Motor for electric fan Motor for washing machine
Motor for Juicer Motor for pool pump
5

Energy Efficiency Improvements for Motor & Its Drive Systems
Section 2
<<
SECTION 2
6
Energy Efficiency Improvements for Motor & Its Drive Systems
Section 2
<<
2.1 Factors Affecting Motor Efficiency
An adequate assessment of the impact that induction motors can have on your energy bill requires a detailed knowledge of the motor’s many operational and electrical parameters.
A fundamental issue that can affect a motor’s energy usage is its suitability for the intended application. Motors are designed to operate most efficiently at their nameplate rating. The nameplate rating of the motor is commonly disregarded by motor users! Imagine in a sugar mill, their supply voltage is 480V but the nameplate voltages of motors are 440V, 460V, and 480V. No doubt 50% of their motor inventories were rewound. Selecting the wrong motor for a particular application or operating the motor outside its recommended parameters will decrease the motor’s performance, introducing additional losses into the electrical system.
There are many factors affecting performance of AC motor that will affect its efficiency and will end-up burn motor windings. Restoring motor efficiency after rewound becomes a problem.
As long as nobody is given the responsibility for company-wide electric motor asset management, employees in the production environment will continue to act on an ad hoc basis, maintaining, repairing, and replacing motors in the same way they have in the past. The obvious driver for change usually escapes notice since the losses that are generated by a sub-optimal motor are scattered among different cost centers: energy consumption, material waste, lost revenue, extra working hours, reduced productivity, reduced production quality, et cetera. By assigning
FACTORS AFFECTING MOTOR EFFICIENCY
an individual — either inside the company or outsourced — to electric motor asset management, electric motors will receive the focus they deserve.
A. Motor PerformanceThere is a wealth of information about a motor’s performance buried in the characteristics of the electrical signals at the motor’s terminals. With the motor’s nameplate data and these electrical characteristics, it is possible to quantify many energy savings opportunities for a given motor. The fundamental electrical characteristics include the voltage, current, and frequency data for each phase. By collecting data on these fundamental characteristics, monitoring devices can provide additional information needed to maximize energy savings including:
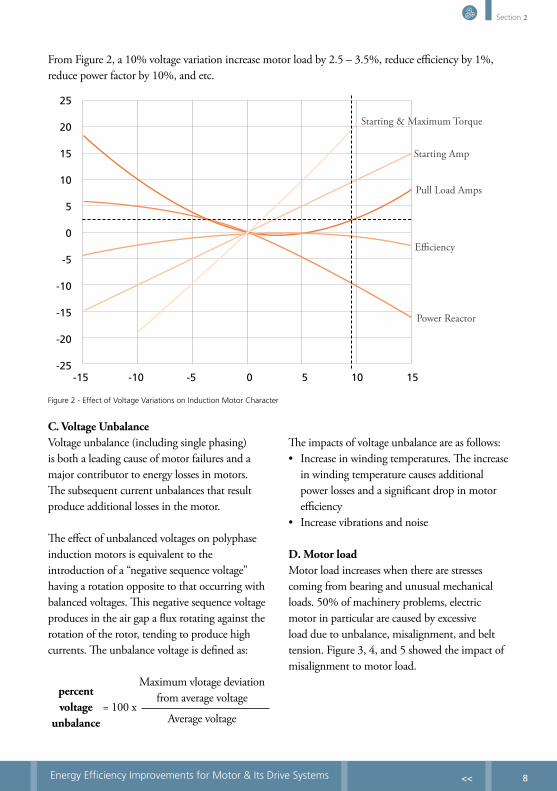
• Voltage variations • Voltage unbalance • Motor load (based on current) • Total harmonic distortion• Power Factor B. Voltage VarianceInduction motors are at times operated on circuits of voltage other than those for which the motors are rated. Under such conditions, the performance of the motor will vary from the rating, as shown in Figure 2. The following are some of the operating results caused by small variation of voltage:
• Motor temperature• Power factor• Starting torque• Slip
7
Energy Efficiency Improvements for Motor & Its Drive Systems
Section 2
<<
From Figure 2, a 10% voltage variation increase motor load by 2.5 – 3.5%, reduce efficiency by 1%, reduce power factor by 10%, and etc.
C. Voltage UnbalanceVoltage unbalance (including single phasing) is both a leading cause of motor failures and a major contributor to energy losses in motors. The subsequent current unbalances that result produce additional losses in the motor.
The effect of unbalanced voltages on polyphase induction motors is equivalent to the introduction of a “negative sequence voltage” having a rotation opposite to that occurring with balanced voltages. This negative sequence voltage produces in the air gap a flux rotating against the rotation of the rotor, tending to produce high currents. The unbalance voltage is defined as:
The impacts of voltage unbalance are as follows:• Increase in winding temperatures. The increase
in winding temperature causes additional power losses and a significant drop in motor efficiency
• Increase vibrations and noise
D. Motor loadMotor load increases when there are stresses coming from bearing and unusual mechanical loads. 50% of machinery problems, electric motor in particular are caused by excessive load due to unbalance, misalignment, and belt tension. Figure 3, 4, and 5 showed the impact of misalignment to motor load.
Figure 2 - Effect of Voltage Variations on Induction Motor Character
25
20
15
10
5
0
-5
-10
-15
-20
-251510 5 0-5-10-15
Pull Load Amps
Power Reactor
Efficiency
Starting Amp
Starting & Maximum Torque
percent voltage
unbalance= 100 x
Maximum vlotage deviationfrom average voltage
Average voltage
8

Energy Efficiency Improvements for Motor & Its Drive Systems
Section 2
<<
Damage bearing
Misaligned shaft
Impact:
• Rotorrubsagainststatorresultingtoburnmotorwinding• Increasepowerconsumption
RotorPower
Figure 3 - Impact of misalignment in power consumption
Figure 4 - 97.9 watts is drawn by motor with aligned shaft. Courtesy of Rotating Equipment Specialists, LLC
Figure 5 - 122.1 watts is drawn by motor with misaligned shaft. Courtesy of Rotating Equipment Specialists, LLC
Other stresses such as: heat, power supply anomalies, humidity, and contamination work in conjunction with time to degrade components.
Motors will survive for several hundred thousand operating hours when these stresses are minimized with the use of technologies to maintain the motor and its drive systems as well as well trained technical personnel.
E. Total Harmonic DistortionsHarmonic distortion is the change in the waveform of the supply voltage from the
ideal sinusoidal waveform. It’s caused by the interaction of distorting customer loads with the impedance of the supply network. Its major adverse effects are the heating of transformers, capacitors, induction motors, and the overloading of neutral conductors that are not rated to carry large currents. Therefore, monitoring Total Harmonic Distortion (THD) is very important to utilities.
F. Power FactorThe term power factor is defined as a ratio of the current drawn that produces real work to the
9

Energy Efficiency Improvements for Motor & Its Drive Systems
Section 2
<<
total current drawn. Like most aspects of modern electrical systems, power factor is a complex issue intertwined with utility rate structures, economic consideration and system capacities.
2.2 Rewound Motors
A study conducted in the Philippines showed that almost 50% of the total motors installed in most industries were rewound.
Many motor users had complained that the lifecycle of motors after rewound is less than two (2) years as compared to a brand new unit. If motor is properly maintained, it will last more than 13 years.
A. WorkmanshipIn most cases, awarding the motor for repair goes to the lowest bidder. The service provider has to get a reasonable profit and has to reduce its cost of goods by using low quality and cheaper materials. The quality of materials, forming a coil (number turns per coil & coil span) could not be ascertained once the motor is assembled. No doubt the motor lifecycle is less than two (2) years.
Figure 6 shows the stator slot is not filled accordingly. Turns/coil end up to be less and common for manual coil forming. Heating that occurs as current flows through the resistance of the stator winding – reduce motor efficiency by as much as 5 – 7.6%.
B. Application of Specific MaterialsImproper selection of magnet copper wires and insulation materials affect the reliability of newly rewound motor. Upgrade Class F to Class H insulation for motor higher than 50HP/37kW will improve efficiency of rewound motors.
Figure 6 - Stator with unequal turns per coil. Courtesy of EASA Technical Manual 2007
Figure 7 - Coil Span
LS
LS
d
Diamond coil Round coil
MLT=(2xLs)+(4x Le) MLT=2(Ls)+πd
Where MLT = Mean length of turn Ls = Straight section of coil Le = Coil extension
Mean length of turn (MLT)
C. Quality AssuranceMaintaining turns/coil and coil span in rewinding a motor is quite difficult for a Rewinder. Figure 7 shows how the coil span - Mean Length Turn (MLT) is calculated. Any increase will increase stator I2R losses and therefore decrease motor efficiency. Conversely, decreasing the MLT where possible will reduce stator I2R losses to help
Le
10
Energy Efficiency Improvements for Motor & Its Drive Systems
Section 2
<<
maintain or even improve efficiency. The goal is to reduce the straight section of the coil where it exits the slot to the minimum required to avoid mechanicals train on the slot cell. Whatever coil shape is used, the coil end turns must not be longer than those of the original winding.
2.3 Common Motor Practices That Degrade Lifecycle And Efficiency Of Motors
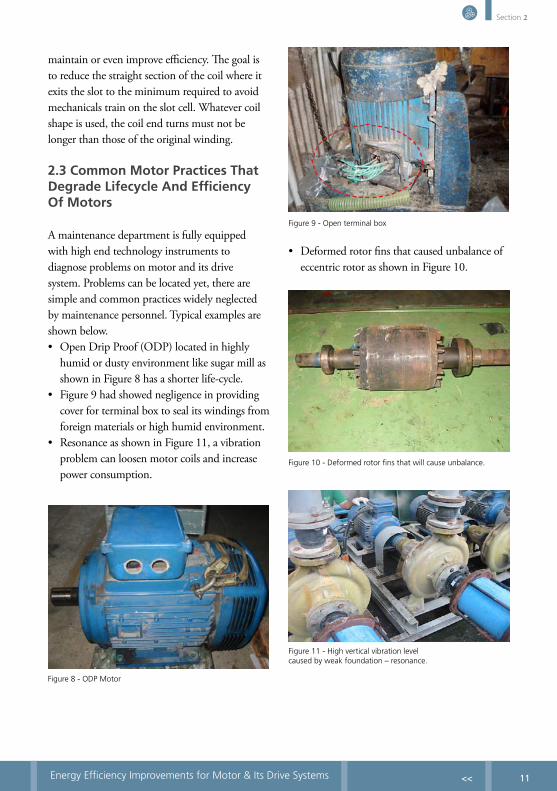
A maintenance department is fully equipped with high end technology instruments to diagnose problems on motor and its drive system. Problems can be located yet, there are simple and common practices widely neglected by maintenance personnel. Typical examples are shown below.• Open Drip Proof (ODP) located in highly
humid or dusty environment like sugar mill as shown in Figure 8 has a shorter life-cycle.
• Figure 9 had showed negligence in providing cover for terminal box to seal its windings from foreign materials or high humid environment.
• Resonance as shown in Figure 11, a vibration problem can loosen motor coils and increase power consumption.
Figure 8 - ODP Motor
Figure 9 - Open terminal box
• Deformed rotor fins that caused unbalance of eccentric rotor as shown in Figure 10.
Figure 10 - Deformed rotor fins that will cause unbalance.
Figure 11 - High vertical vibration level caused by weak foundation – resonance.
11

Energy Efficiency Improvements for Motor & Its Drive Systems
Section 2
<<
The performance of Re-circulating Unit# RU 301 as shown in Figure 12 and 13 failed to improve after repair due to over belt tension and misaligned pulleys.
Figure 12 – misalign pulley and over belt tensioned.
Figure 13 – RU 301. No improvement on its performance after repair
LOCATION: Building 1 - Interstitial, Water Probe Production at Module 1 (1st Phase)
ITEM NO. RU/MUA QTY.
RATING ACTUAL REMARKS/STATUS as of 20 Aug 10kW Amp Voltage Phase L1 L2 L3
1 RU-301 (15hp) 1 11 21 460 3 13 14 13 Operational, subject for VA
(Newly repair)
2 RU-302 (15hp) 1 11 21 460 3 13 14 13 Operational, subject for VA
3 MUA-502 (15hp) 1 11 21 460 3 13 14 13 Operational, subject for VA
There are bearing failures happened while its vibration levels are good as far as ISO 10816-3 is concerned. A case at point is Scrubber #1 of a Sunpower Philippines Mfg Ltd - 125 HP, 240 VAC with full-load current of 308 Amps controlled by a variable frequency drive. This unit is very critical to the operations as far as environment is concerned. The Facility Engineer
noticed unusual noise in the motor and requested for vibration analysis. The vibration results is shown in Figure 14 and found to be within “Acceptable Level”. However, the unusual noise came from the bearing defect as shown by OVL 200 – 2000 Hz (bearing parameter).
Re-circulating Unit & Make Up Air Unit (RU/MUA) for VA
12

Energy Efficiency Improvements for Motor & Its Drive Systems
Section 2
<<
The foundation of Scrubber 1 (Figure 15) is stable and rigid that helps damped its vibration. The motor had drawn a current of 280 amps whose variable frequency drive was set at 52 Hz. Scrubber 1 Motor was aligned using dial indicators and no data or information available at hand.
The alignment (Figure 16) was checked prior to motor replacement and found to have exceeded the allowable tolerance of 0.10 mm for parallel
Figure 14 - Vibration results of Scrubber# 1
Figure 15-Scrubber 1 Structure
Figure 16 - Alignment result prior to motor replacement
offset and 0.08/100 mm for angular error versus that had be marked with “Red”.
The 280 Amps current drawn is calculated to be at 91% of its full-load current and therefore motor was not operating efficiently in spite with the of variable frequency drive (VFD).
Regardless motor is a standard or High Efficiency Motor (HEM) if maintenance on electric motors is not fully executed with care and a high degree of precision will not achieve its lifecycle of > 13 years. This requires investment on predictive maintenance such as vibration analysis, electrical signature analysis, thermal scanner, and motor circuit analyzer. Use of “eye-ball or string” to align pulleys will not work rather than increase power consumption. Again, this requires investment on precision instruments such as laser alignment, professional bearing tools, etc.
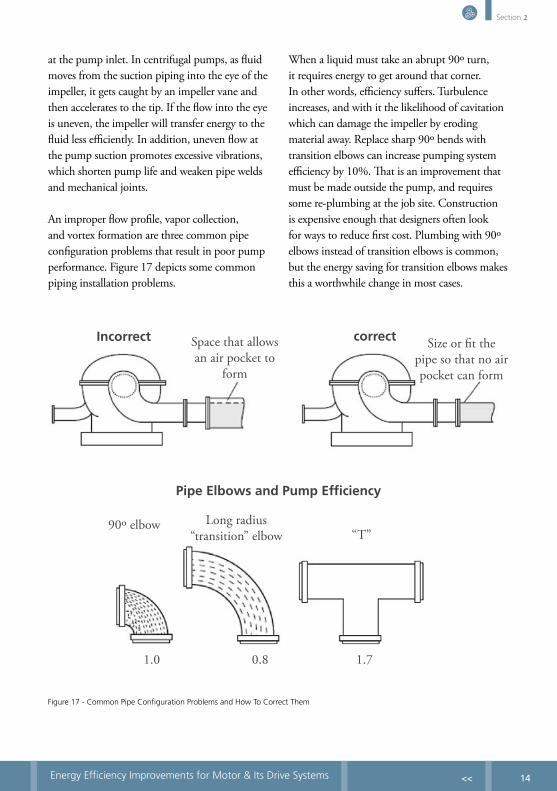
2.4 Piping and Ducting Systems
Designers often overlook the energy costs of piping or duct systems. The effects on power drawn by the motor due to unnecessary pressure drops by avoiding sharp bends, expansions, and contractions and by keeping piping or ducting as straight as possible. For example, orienting valves and system equipment so that they are in line with the pipe run is one useful rule of thumb.
Since centrifugal pumps operate most effectively when the inlet flow has a uniform profile, systems should be designed to avoid non-uniform flow
13
Energy Efficiency Improvements for Motor & Its Drive Systems
Section 2
<<
at the pump inlet. In centrifugal pumps, as fluid moves from the suction piping into the eye of the impeller, it gets caught by an impeller vane and then accelerates to the tip. If the flow into the eye is uneven, the impeller will transfer energy to the fluid less efficiently. In addition, uneven flow at the pump suction promotes excessive vibrations, which shorten pump life and weaken pipe welds and mechanical joints.
An improper flow profile, vapor collection, and vortex formation are three common pipe configuration problems that result in poor pump performance. Figure 17 depicts some common piping installation problems.
When a liquid must take an abrupt 90º turn, it requires energy to get around that corner. In other words, efficiency suffers. Turbulence increases, and with it the likelihood of cavitation which can damage the impeller by eroding material away. Replace sharp 90º bends with transition elbows can increase pumping system efficiency by 10%. That is an improvement that must be made outside the pump, and requires some re-plumbing at the job site. Construction is expensive enough that designers often look for ways to reduce first cost. Plumbing with 90º elbows instead of transition elbows is common, but the energy saving for transition elbows makes this a worthwhile change in most cases.
Incorrect correctSpace that allows an air pocket to
form
Size or fit the pipe so that no air pocket can form
Pipe Elbows and Pump Efficiency
1.0 0.8 1.7
90º elbow Long radius “transition” elbow “T”
Figure 17 - Common Pipe Configuration Problems and How To Correct Them
14

Energy Efficiency Improvements for Motor & Its Drive Systems
Section 2
<<
In Figure 18, the suction pipeline of the pump has two 90º Pipe Elbow that contributed to high vibration level of 22.2 mm/s RMS measured at B3AX (Figure 19). The additional structure to
contain the axial vibration didn’t help. The power drawn by this motor is much higher compared to the adjacent unit of same specifications. The adjacent pump’s pipe has no 90º Pipe Elbow.
90º Pipe ElbowAdditional structure to contain axial vibration
Figure 18 – 90º Pipe Elbow had contribute much of the axial vibration
Figure 19 – Vibration results of Pump with 90º Pipe Elbow
15

Energy Efficiency Improvements for Motor & Its Drive Systems
Section 3
<<
SECTION 3
16

Energy Efficiency Improvements for Motor & Its Drive Systems
Section 3
<<
ENERGY EFFICIENCY TECHNOLOGIES
Overview of Energy Efficiency Technologies
Again, the fundamental issue that can affect a motor’s energy usage is its suitability for the intended application. Motors are designed to operate most efficiently at their nameplate rating. Selecting the wrong motor for a particular application or operating the motor outside its recommended parameters will decrease the motor’s performance, introducing additional losses into the electrical system. Audit and assess all motors utilizing the latest technologies and Minimum Energy Performance Standards (MEPS) to identify many symptoms that result in reduced motor performance including deviations from various nameplate parameters.
3.1 Energy Audit
It is a must to conduct an energy audit for all energy consuming equipment to assess its condition electrically or mechanically. The following information is needed in energy audit:
• Motor nameplate specifications• Supply voltage• Current drawn• Power quality• Vibration problems • Alignment tolerance of motor and driven
equipment shafts
3.2 Standards
To assess performance of motor and its drive system, the following standards are used:
• Minimum Energy Performance Standards (MEPS)
• NEMA Standard MG 1, 14.30 – Effects of Variations of Voltage and Frequency on the Performance of Motor
• ISO 10816 – 3 Vibration Severity Chart• Alignment Tolerance
3.2.1 Minimum Energy Performance Standards (MEPS)
The efficiency of motors depends both on their size and their efficiency quality, which can be characterized by efficiency classes. For small motors, size is the most important factor in determining efficiency; for large motors, efficiency classes are relatively more important. In 2008, in IEC 60034‐30, the International Electrotechnical Commission introduced the precisely defined and open‐ended international efficiency‐classification scheme using IE1, IE2, IE3 and IE41 as the classification system (Figure 20).
In recent years, market share of more efficient motors has been increasing in many regions and countries (Borg and Brunner, 2009). This was particularly the case for the United States, China and other countries, and, to a certain extent, for Europe. To understand this diffusion pattern, it is useful to relate different efficiency‐classification systems to each other, and to relate diffusion to MEPS and other policy measures. Four standardized efficiency classes are currently recognized, although definitions and classification schemes vary slightly from country to country (Table 1).
17

Energy Efficiency Improvements for Motor & Its Drive Systems
Section 3
<<
100
95
90
85
80
75
700.1 1 10 100 1000
Electric motors efficiency classes (4-pole 50 Hz)
Motor output in log scale (kW)
No
min
al e
ffici
ecn
y (%
)
IEC 60034-31:2009
IEC 60034-30:2008
IE4
IE3
IE2
IE1
Source: IEC 60034-30 and IEC 60034-31, draft 2009.
Figure 20 - Efficiency classes for four-pole motors of standard IE3, IE2 and IE1 classes, and the new IE4 class
Motor
Efficiency
Class
InternationalUnited
States
European
Union (old
system
19981)
Europena
Union
(new
system
2009)
Chain Australia
Premium IE3 NEMA Premium - IE3 - -
High IE2 EPAct EFF1 IE2Grade 1 (under
consideration)
AU2006 MEPS
Standard IE1 - EFF2 IE1 Grade 2 AU2002 MEPS
Below IE0 (used only in this paper) - EFF3 -
Grade 3 (current
minimum)-
Abbreviations: EPAct - US Energy Policy Act, 1992; MEPS - minimum energy performance standard;NEMA - US National Electrical Manufacturers Association.Source: A+B International, 2009.Note: 1. With the backing of the European Commission, manufacturers representing 80% of the European product of standard motors, agreed to establish three efficiency bands or classes designated EFF1, Eff2, and EFF3, with EFF1 being the highest band.
Table 1 - Motor efficiency classes in different countries and the corresponding international standard
18<<

Energy Efficiency Improvements for Motor & Its Drive Systems
Section 3
<<
Timeline for implementation of MEPSThe time necessary to enact a motor efficiency standard will be directly impacted by the level of conformance to existing standards. To assure the quickest time to enact a standard the efficiency levels, test methods and labeling will need to conform to NEMA Premium and IEC. By
harmonization of the efficiency test methods and levels the only remaining issues are labeling and timing.
1Super premium efficiency level as defined within IEC 60034‐30 and IEC 60034‐31.
Efficiency levels Efficiency classes
Testing standard Performance standard
IEC 60034-30 IEC 60034-2-1 Mandatory MEPS
Global definition of motor efficiency classes, IEC, 2008
Including stray load losses 2007
Policy goal
Premium efficiency IE3Low uncertainty United States 2001
Europe 2011
High efficiency IE2
United States
Canada
Mexico
Australia
New Zealand
Korea
Brazil
China 2011
Switzerland 2011
Europe 2011 with VSD
Standard efficiency IE1
Medium uncertainly China
Brazil
Costa Rica
Israel
Taiwan
Switzerland 2010
Below standard
Table 2 - Timeline for electric‐motor efficiency classes, testing standards and minimum energy performance standards
Source: A + B international, 2009
19

Energy Efficiency Improvements for Motor & Its Drive Systems
Section 3
<<
Both IEC and NEMA labeling requires that the nominal efficiency be stated on a permanent motor nameplate as shown in Figures 21 and 22. In addition NEMA Premium motors may include a NEMA Premium logo if the manufacture has complied with NEMA standards and sign a memo of understanding with NEMA.
Figure 21 – Typical IEC Motor Nameplate
Figure 22 – Typical NEMA Motor Nameplate
Countries following the NEMA/IEC methods would only need to allow time for manufacturer’s logistics to fill the supply system. Additional labels added by individual countries may serve to identify products in the local market. The addition of country specific labels may inadvertently reduce the number of available motors for that country and disrupt supply to motor users within the country. Countries that add a special labeling scheme may expect to add six to twelve months to implementation and will risk a reduction in available product for local needs.
Should a country elect to use a different test method or efficiency levels the time for manufacturers to comply would be expected to be between three and five years depending upon the level of variation.
NOTE: Tables with efficiency classes: IEC 60034-30 (2008) and NEMA Premium are located in Section 7 under Annex 1 – 3.
The United States and Canada are international leaders in terms of setting motor energy efficiency standards, as they introduced regulations for motors in the late 1990s. As early as 2002, China defined MEPS for electric motors. The European Union passed MEPS legislation for electric motors in 2009 as an implementing measure under the Eco‐design Directive; these will replace the previous industrial voluntary agreement. Australia, Korea, Brazil, Mexico, Taiwan and some other countries with large electricity consumption from motors have already adopted MEPS, as have some smaller economies such as Costa Rica, Israel and New Zealand (Table 2).However, some large motor‐using economies, such as India, Japan and Russia, have not yet adopted MEPS (such measures are understood to be under consideration).
In the United States, market penetration of energy‐efficient motors has been increasing since the late 1990s – particularly since 1998 when MEPS were enforced. In 2001, EPAct motors (equivalent to IE2) reached a market share of about two‐thirds; this figure has since steadily declined, as the US National Electrical Manufacturers Association (NEMA) Premium motors started gaining market share (Figure 23).
In Canada, the energy efficiency of motors is the responsibility of the ministry of Natural Resources Canada (NRCan). In 1994, the Energy Efficiency Act was implemented and in
20

Energy Efficiency Improvements for Motor & Its Drive Systems
Section 3
<<
1997 Canada’s Energy‐Efficiency Regulations for General Purpose Industrial Motors came into effect (Figure 24). In 1999, explosion‐proof and integral‐gear motors (which are not covered in the United States) were also included. For motors in the range of 0.75 kW to 150 kW (1 hp to 200 hp), regulation in Canada corresponds in principle to the MEPS of EPAct of the United States. However, Canada also has some specific regulations, such as allowing the use of 75% load to pass MEPS.
In the United States, market introduction of the most efficient class IE3 (NEMA Premium) started in 2002 and market share has grown steadily. It was introduced as a voluntary product but has been supported since 2006 by a federal procurement decision (the Federal Energy Management Program [FEMP]).
Market penetration of different efficiency classes varies considerably between countries. The share of the most efficient class (IE3) has reached 20% in the United States, but it is virtually zero in the European Union. In the United States, the share
of efficiency classes generally increases with motor size (Table 3). The share of the most efficient class (IE3) reached 75% of sales for the largest motor class; it was only about 10% for smaller motors. The diffusion of motors with higher efficiency starts earlier for larger motors than for smaller ones, since more engineering time and money is usually spent in the search for the best‐matching motor when a large motor has to be renewed.
Figure 23 - Market share of efficiency classes in the United States (2001- 06)
70
60
50
40
30
20
10
02001 2002 2003 2004 2005 2006
Epact
NEMA Premium
Other
Years
Perf
ent
of
un
its
Figure 24 - Motor efficiencies in Canada before and after introduction in 1997 of Energy-Efficiency Regulations for General Purpose Industrial Motors
100
70
75
80
85
90
95
1 2 5 10 20 30 50 20075 125Horsepower
Effi
cien
cy (
%)
Efficiency @1 800 RPM Before Regulation
Efficiency @1 800 RPM After regulation
Source: NRCan
Source: Boteler, 2007
21

Energy Efficiency Improvements for Motor & Its Drive Systems
Section 3
<<
Motor size (kW) HorsepowerSales
(thousands)Market share of
IE3 (%)0.75 - 3.75 1 - 5 932 9.8
4.5 - 15 6 - 20 410 27.6
15 - 37.5 21 - 50 116 48.1
37.5 - 75 51 - 100 41 55.1
75 - 150 101 - 200 22 69.2
150 - 375 201 - 500 11 75.0
Total 1532 20.0
Source: US Census Bureau as cited by Elliott, 2007.
In Europe, electric motors between 1.1kW and 90kW are included in a voluntary agreement between the European Committee of Manufacturers of Electrical Machines and Power Electronics (CEMEP) and the European Union.
Since this agreement was initiated in 1999, the market share of the class Eff3 has been falling due to increasing market penetration of the more efficient class Eff2 (IE1) (Figure 25). The even more
100
90
80
70
60
50
40
30
20
10
01998 1999 2000 20052004200320022001 20072006
%
EFF3 EFF2 = IE1 EFF1 = IE2
60
48101216
4353
3 2
30
8785848380
5444
85 86
29765433
12 12
Figure 25 - Market share of efficiency classes in Europe under the CEMEP voluntary agreement
Source: CEMEP, 2008.
Brazil launched its first regulation of the Energy Efficient Act for electric motors in 2002. This act established two sets of MEPS, for standard (mandatory) and high efficiency (voluntary) motors. An updated regulation from the end of 2005 (Edict 553/2005), established the previous
high efficiency MEPS as mandatory for all motors in the Brazilian market. These new Brazilian MEPS are compatible with those implemented in other countries. Brazilian motor manufacturers had already set a high‐efficiency line in 2006, accounting for about 10% of total production.
Table 3 - Share of efficiency class IE3 in electric motor sales by size, United States (2003)
22

Energy Efficiency Improvements for Motor & Its Drive Systems
Section 3
<<
Nevertheless, it is expected that the expansion of this share to 100% would have a large impact on manufacturers and their pre‐suppliers, mainly for technical reasons (Garcia et al., 2007).
South Korean data on the market share of highly efficient motors were reported by Huseok (2007). After cross‐checking with relevant experts, it has been determined that the term “highly efficient” was used to refer to motors at the IE2 efficiency level.
3.2.2 NEMA Standard MG 1, 14.30
Operation of AC Induction motors at voltage and frequencies other than the nominal value can effect significant changes in the motor operat-ing costs, performance characteristics and life expectancy.
Motor reliability, performance and life-cycle cost are key elements of a successful motor application when viewed from the user’s perspective. Industrial specifications usually address bearing life, vibration, geometry and efficiency with considerable detail to achieve desired results.
In Figure 2, it shows the effects of voltage and frequency variations on motor performance under NEMA MG 1, 14.30.
3.2.3 ISO 10816 – 3 Vibration Severity Chart
ISO 10816-3:2009 gives criteria for assessing vibration measurements when made in situ. The criteria specified apply to machine sets having a power above 15 kW and operating speeds between 120 r/min and 15 000 r/min. Refer to Annex 4, Section 7 for the chart.
3.2.4 Alignment Tolerance
The alignment of shaft centerlines on coupled machines is one of the most important aspects of machine installation. Contrary to popular
opinion, flexible couplings will not always compensate for even moderate amounts of shaft misalignment. Misalignment is any condition in which the shaft centerlines are not in a straight line during operation.
Misalignment generates unnecessary forces. Precision alignment removes these forces resulting in reduced vibration and noise levels, minimized shaft bending and cyclic fatigue, reduced energy costs, and increased bearing, seal, and coupling life. Refer to Annex 5, Section 7 for the tolerance table.
3.3 Motor Efficiencies
Most industries in SEA prefer to rewind the motor rather than replace it with HEM. The price is common denominator. Buying HEM is a capital expenditure while rewinding is a maintenance expense. It’s a common experience that a rewound motor for less than 100HP, its life-cycle is less than two (2) years. Common indicators are high current drawn reaching to >100% full-load current and high operating temperature. This is because there are quality problems in ensuring turns/coil and coil span of magnet wires are within the required specification of the motor. Worst the original winding data is altered, and subsequent rewinding shortens motor life-cycle, and reduces motor efficiency from 5 – 7.6%.
Example – Oil Recycling PlantAn oil recycling plant utilized a reconditioned and/or rewound standard motors in its facility. It has 77 motors ranging from 1 – 50 HP, 230 VAC. An audit on motor performance is shown in Figure 26 & 27 for 7.5HP motor, 1800 RPM. The company is spending US$ 9,225.00 per monthly on electricity bill.
Energy Efficiency (EE) improvements based on the results are as follows:
23

Energy Efficiency Improvements for Motor & Its Drive Systems
Section 3
<<
• The reconditioned motor % loading capacity is 37.12% less than 50% of Full-Load Current. This is considered as oversize and the effects are discussed in Section 3.6 - Proper Motor Sizing. HEM with small capacity of 5 HP is suitable.
• The voltage variance of 8.70% is high enough that affects the performance of motor. Installation of voltage stabilizers will improve voltage unbalance and current unbalance.
• High vibration (Figure 27) levels caused by misalignment and bearing defects – once the HEM is in placed align motor – pump shafts using laser alignment instrument.
A study was conducted for savings if the company will replace all its reconditioned or rewound motors with properly sized HEM.
The total investment in improving the motors is US$92,754. This includes the cost of motors, installation, electrical wiring and mechanical fitting. The project will have an average savings per year of US$64,819. The investment can be recovered after 1.43 years with an NPV of US$334,256 and will give a project and equity IRR of 70% and 200%, respectively.
It is believed possible to achieve a sales price of the generated CERs for around 5 USD/CER through a Programmatic Approach project (PoA), which would then have to be initiated. PoA projects have got a very long lifespan, longer than the technical lifetime of a HEM. This means that the CER’s could be paid for the full 13 years (715 USD/year during 13 years), but to initiate a PoA project is not without complications.
Unbalance Current DrawnL1 L2 L3 Average Max. Dev Unbalance
9.000 8.000 7.5000 8.17 0.667 8.16%
Tolerance Allowable limit is 10%
Unbalance VoltageL1-L2 L2-L3 L3-L1 Average Max. Dev Unbalance
252.000 250.000 248.000 250.00 2.000 0.80%
Tolerance Allowable limit is 2%
Motor Specifications (Nameplate) Reference Standard Limits
HP 7.5Note to determine motor efficiency=IACTUAL/IFLAa) >85% x IFLAcheck losses;b) 75-85% x IFLAhigh efficiency;c) <50% x IFLAcheck right size
kW
Current, IFLA 22
% Load Capacity 37.12%
VoltageNonmial 230 % Voltage Variance=Actual VoltageAve / VoltageNominal
% Voltage Variance 8.70% NEMA MG 1 14.13 0.00
Variable Freq. Drive Setting (Hz) None Rewind
Equipment Name Shower Pump=2
Figure 26 - Motor loading performances
24

Energy Efficiency Improvements for Motor & Its Drive Systems
Section 3
<<
Figure 27 - Vibration Analysis results – Misalignment of shafts.Courtesy of 01dB Metravib/ALPS Maintaineering Services, Inc.
3.4 Repair or Replacement Based On Lifecycle Approach
There are many factors to consider whether to repair or replace a motor with HEM. An HEM replacement may requires retrofitting on the existing setup and proper maintenance, and impact to operations if frequently breakdown.
Life‐cycle cost is the best method to identify optimally integrated Electric Motor Drive Systems (EMDS), but it is still not industry practice. Purchasers do not often ask for this information and manufacturers do not generally offer it. OEM‐designed machines need to be evaluated by life‐cycle cost, not by their initial cost only. A precise performance description at the design stage facilitates the design and delivers an optimal machine.
Why HEM?2
The AC induction motor has been continuously improved by optimizing stator and rotor design (size), and electric material properties and quantity (steel, aluminum and copper). More efficient AC induction motors require longer stacks in stator and longer rotors, amounting to using more and costly active material (Figure 28). With given exterior motor dimensions (frame sizes: European standard EN 50347 [CENELEC, 2001] and United States standard NEMA MG1 [NEMA, 1998]), the potential efficiency gain is limited and costly.
New developments reduce losses by using copper instead of aluminum for the conductor bars
2Energy Efficiency Policy Opportunities for Electric Motor-Drive System.
25

Energy Efficiency Improvements for Motor & Its Drive Systems
Section 3
<<
and end rings in rotors. Aluminum pressure die‐cast rotors (melting temperature 660 °C for aluminum) are now standard in AC motors. It is much more difficult to cast copper in precise forms (with its considerably higher melting temperature of 1,034 °C), but this has been performed successfully (Copper Development Association, 2007). In the United States in 2006, Siemens launched a new series of IE3 (and slightly above) efficient motors with copper rotors.
Now copper rotor motors from 0.1 kW to 100 kW are available. The design effort and the advanced production technology add considerable cost to the product, but this allowed a gain of almost one efficiency class within the same frame size. Some manufacturers offer motor‐stator combinations with either traditional aluminum rotors or special copper rotors. This is done especially for long‐stack motors to avoid larger diameters.
Figure 28 - IE3 Premium-Efficiency motor
There are a number of advantages to using copper rather than aluminum in AC motors:• Lower coefficient of expansion: aluminum will
creep and move approximately 33% more than copper.
• Tensile strength: copper is 300% stronger than aluminum and thus able to withstand high centrifugal force and the repeated hammering from current‐induced forces during each start.
• Higher melting point: copper can better withstand thermal cycling over the life of the motor.
Independent tests show that a copper rotor can reach slightly higher than IE3 performance values, though at a considerable cost premium. In 2007, IEC 60034‐30 defined a future efficiency class, IE4 Super Premium efficiency, with 15% lower losses than IE3. Since then, a more precise definition of the eventual performance level has been given in the draft IEC 60034‐31 (IEC, 2009) wherein the eventual improvement is dependent on 50 Hz, 60 Hz and the number of poles.
3.5 Voltage Stabilization
NEMA Standard MG 1, 14.30 – Effects of Variations of Voltage and Frequency on the Performance of motor suggest that whether the motor is standard, rewound, or HEM, the supplied voltage to the motors must be closer to its nameplate rating. Failure to place a priority on doing so can result in significant reductions in the motor performance and life.
In Southeast Asian (SEA) countries, motor nameplate voltage normal intended design is 230-240V and 460-480V, where generated supply voltage is typically between 240 to 258V, and 440 to 480V.
A study conducted by Austin Bonnett, EASA Technical and Education Consultant revealed the impact of voltage and frequency variation on motor life and performance. The bottom-line is the need to keep the voltage and frequency as close as possible and practical to the nominal values, even when the various motor standards allow for significant variations.
26
Energy Efficiency Improvements for Motor & Its Drive Systems
Section 3
<<
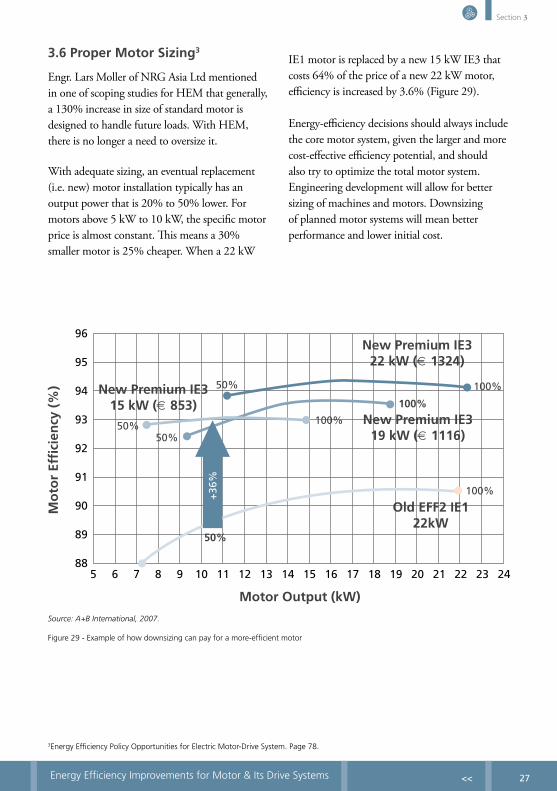
3.6 Proper Motor Sizing3
Engr. Lars Moller of NRG Asia Ltd mentioned in one of scoping studies for HEM that generally, a 130% increase in size of standard motor is designed to handle future loads. With HEM, there is no longer a need to oversize it.
With adequate sizing, an eventual replacement (i.e. new) motor installation typically has an output power that is 20% to 50% lower. For motors above 5 kW to 10 kW, the specific motor price is almost constant. This means a 30% smaller motor is 25% cheaper. When a 22 kW
3Energy Efficiency Policy Opportunities for Electric Motor-Drive System. Page 78.
IE1 motor is replaced by a new 15 kW IE3 that costs 64% of the price of a new 22 kW motor, efficiency is increased by 3.6% (Figure 29).
Energy‐efficiency decisions should always include the core motor system, given the larger and more cost‐effective efficiency potential, and should also try to optimize the total motor system. Engineering development will allow for better sizing of machines and motors. Downsizing of planned motor systems will mean better performance and lower initial cost.
96
95
94
93
92
91
90
89
885 6 10987 11 12 16151413 17 18 22212019 2423
Motor Output (kW)
Mo
tor
Effi
cien
cy (
%)
Old EFF2 IE1 22kW
New Premium IE3 19 kW (€ 1116)
New Premium IE3 22 kW (€ 1324)
New Premium IE3 15 kW (€ 853)
100%
100%
100%50%
50%50%
50%
+36
%
Source: A+B International, 2007.
Figure 29 - Example of how downsizing can pay for a more-efficient motor
100%
27

Energy Efficiency Improvements for Motor & Its Drive Systems
Section 3
<<
3.7 ISO50001 – Energy Management Standards4
Implementing energy efficiency improvement for motors and its drive system is very difficult if company management is not committed to implement and audit the success of it. United Nations Industrial Development Organization (UNIDO) has set a standard to help companies implement it through ISO50001 – Energy Management Standards.
• Energy management systems standards have proven successful in delivering incremental energy and cost savings compared to baseline operations: 1-2% annual incremental efficiency gains in industry.
• Relevant and applicable for large industries and SMEs, no matter what the technological and production processes are
• Gets management involved, engrain measurement and monitoring
• Energy management system standards provide best-practices based, structured and comprehensive guidance on how to integrate energy efficiency into daily management practices using the well-known “plan-do-check-act” approach (ISO 9000, 14000, etc.)
• Complementary policy-driven supporting programs are needed
4Dolf Gielen, Chief – Energy Efficiency and Policy Unit, UNIDO. BEE-IEA Seminar 27 – 28 January 2010. New Delhi, India.
28

Energy Efficiency Improvements for Motor & Its Drive Systems
Section 4
<<
SECTION 4
29

Energy Efficiency Improvements for Motor & Its Drive Systems
Section 4
<<
RECOMMENDATIONSOverview
“When it’s not broke, don’t fix it”. Although motor operating temperature and its current drawn are beyond its limits – no fix unless it breaks down. As long as nobody is given the responsibility for company-wide electric motor asset management, employees in the production environment will continue to act on an ad hoc basis, maintaining, repairing, and replacing motors without further investigating the root cause and how to prevent any repetitive failure.
A resident plant manager of an oil mill misunderstood the motor nameplate 1.15 service factor and referred as the maximum motor efficiency. That is why he instructed his operations manager to maximize the said service factor of expeller’s motors for them to meet their production output. Not bother about the expense on electricity bill as it’s a fix cost and motor rewinding is cheap rather than buy a new HEM.
Another oil mill spends US$ 69,188.00 per month for their electricity bill. The highest motor rating is one unit 125 HP. The total inventory of motors is less than 100 units ranging from fractional to 75HP/56kW. Their electrical supervisor was not good enough in analyzing and resolving one of his seven 50 HP motors for Flaker Machine that frequently burnt. He had complained to his boss that the problem was not in the motor but a mechanical problem on Flaker Machine that resulted to high amperage and end up burn motor windings. His complaint fell on deaf ears and was threaten for termination if said motor problem is not fixed on a given time. To make his life comfortable, he replaced the problematic 50 HP motor to 125 HP whose actual current draw was almost equal to 50 HP.
Prior to repair or replace any failed motor to HEM, supply voltage must be closer to the nameplate voltage of the motor, its foundation must be stable and rigid, alignment of shafts must be within acceptable tolerance, and its vibration levels are within the allowable limits based on ISO 10816-3.
A “Pay Back Analysis Calculator” that can be downloaded from WEG Motor website help calculates the estimated payback time or ROI whether to repair or replace a failed motor to HEM. The results of the calculation state that it’s best to replace fractional HP/KW up to 100 HP/75 kW rather that rewind it.
Electric Motor Asset Management with the implementation of EMDS Strategies - can be an option by which a company can offset their electricity expenses.
4.1 Electric Motor Asset Management
Electric motors are quite often overlooked as a production asset. Even though they are the primary driver in most industrial and tertiary sector companies, electric motors are rarely managed optimally. Improving their energy efficiency, reliability, and availability usually results in improve company’s profit margin.
Management commitmentThere must be a clear management commitment to ensuring the required cooperation of all employees involved. A group who is not involved in the chain of daily operations should be responsible in planning, organizing, implementing, and controlling for every motor there must be savings. The barriers mentioned in Section 1 must be overcome.
30

Energy Efficiency Improvements for Motor & Its Drive Systems
Section 4
<<
The repair/replace decision Prior to make a decision whether to repair or replace, energy audit report must be available. It will be humiliating that after replacing the motor with HEM, the desired savings was not met and in few months it got burned. A solar cell manufacturer has a standard 125 HP
motor TEFC, 1780 RPM controlled by a VFD was replaced with HEM for their scrubber equipment. The 440V uninterruptible power supply (UPS) is used to supply the voltage. The motor was commissioned with the following operating parameters shown in Figure 30.
L1 L2 L3 AVERAGEMAX DEV
(AVE-LOWEST)
% UNBALANCE
125.80 128.00 128.20 127.33 1.53 1.20%
Tolerance Less than 10%
Load Analysis
3-Phase Actual Current Drawn by Motor
L1-L2 L2-L3 L3-L1 AVERAGEMAX DEV
(AVE-LOWEST)
% UNBALANCE
474.00 473.00 475.00 474.00 1.00 0.21%
Tolerance Less than 2%
3-Phase Actual Supplied Voltage
Motor Specifications
Motor Capacity 125 HP 90 kW
Full-load Current, IFLA 145
VoltageNominal 440
VFD Setting, HZ25%
75%
37%
80%
50%
NA✓
%Voltage Variance NEMA MG 1,14.30) 7.73%
% Loading Capacity (Efficiency) 87.82%
Note to determine motor efficiency=IActual/IFLA
a) >85% x IFLA check losses; b) 75-85% x IFLA high efficiencyc) <50% x IFLA check right sizeFigure 30 – 125 HP Motor Load Analysis
Findings:• The % Loading capacity is 87.82% not within
the range of 75-85% full-load current for maximum motor efficiency.
• As VFD setting is increased, the % loading capacity also increases and it was set at 37% speed.
• The % voltage variance of 7.73% is quite high.
Thus, the desired results of energy saving was not met. There was no NEMA efficiency indicated in its nameplate and the buying price was < US$4,139 – cheap! These are unusual if buying a motor is dependent on price along.
31
Energy Efficiency Improvements for Motor & Its Drive Systems
Section 4
<<
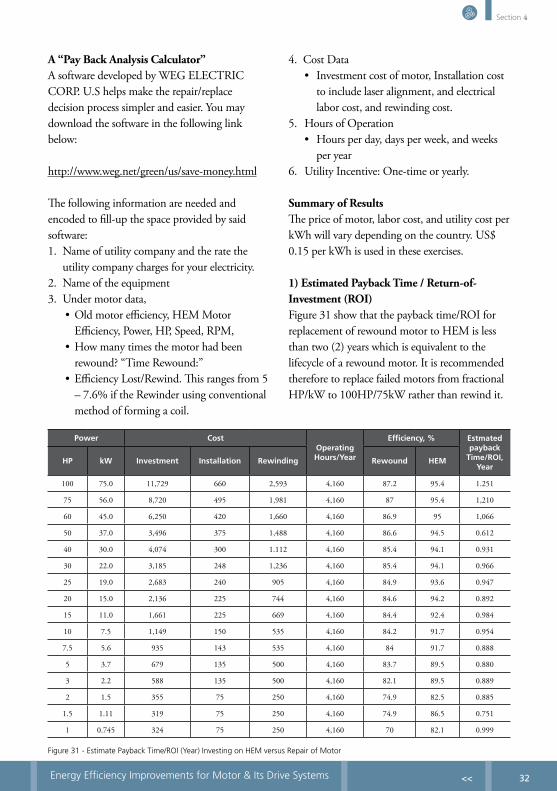
A “Pay Back Analysis Calculator”A software developed by WEG ELECTRIC CORP. U.S helps make the repair/replace decision process simpler and easier. You may download the software in the following link below:
http://www.weg.net/green/us/save-money.html
The following information are needed and encoded to fill-up the space provided by said software:1. Name of utility company and the rate the
utility company charges for your electricity.2. Name of the equipment3. Under motor data,
•Old motor efficiency, HEM Motor Efficiency, Power, HP, Speed, RPM,
•How many times the motor had been rewound? “Time Rewound:”
•Efficiency Lost/Rewind. This ranges from 5 – 7.6% if the Rewinder using conventional method of forming a coil.
4. Cost Data• Investment cost of motor, Installation cost
to include laser alignment, and electrical labor cost, and rewinding cost.
5. Hours of Operation• Hours per day, days per week, and weeks
per year6. Utility Incentive: One-time or yearly.
Summary of ResultsThe price of motor, labor cost, and utility cost per kWh will vary depending on the country. US$ 0.15 per kWh is used in these exercises.
1) Estimated Payback Time / Return-of-Investment (ROI)Figure 31 show that the payback time/ROI for replacement of rewound motor to HEM is less than two (2) years which is equivalent to the lifecycle of a rewound motor. It is recommended therefore to replace failed motors from fractional HP/kW to 100HP/75kW rather than rewind it.
Power CostOperating Hours/Year
Efficiency, % Estmated payback
Time/ROI, Year
HP kW Investment Installation Rewinding Rewound HEM
100 75.0 11,729 660 2,593 4,160 87.2 95.4 1.251
75 56.0 8,720 495 1,981 4,160 87 95.4 1,210
60 45.0 6,250 420 1,660 4,160 86.9 95 1,066
50 37.0 3,496 375 1,488 4,160 86.6 94.5 0.612
40 30.0 4,074 300 1.112 4,160 85.4 94.1 0.931
30 22.0 3,185 248 1,236 4,160 85.4 94.1 0.966
25 19.0 2,683 240 905 4,160 84.9 93.6 0.947
20 15.0 2,136 225 744 4,160 84.6 94.2 0.892
15 11.0 1,661 225 669 4,160 84.4 92.4 0.984
10 7.5 1,149 150 535 4,160 84.2 91.7 0.954
7.5 5.6 935 143 535 4,160 84 91.7 0.888
5 3.7 679 135 500 4,160 83.7 89.5 0.880
3 2.2 588 135 500 4,160 82.1 89.5 0.889
2 1.5 355 75 250 4,160 74.9 82.5 0.885
1.5 1.11 319 75 250 4,160 74.9 86.5 0.751
1 0.745 324 75 250 4,160 70 82.1 0.999
Figure 31 - Estimate Payback Time/ROI (Year) Investing on HEM versus Repair of Motor
32

Energy Efficiency Improvements for Motor & Its Drive Systems
Section 4
<<
2) Estimated Energy SavingsBelow are the estimated savings if standard or rewound motors are replaced by HEM.
Figure 32A - Estimated Energy Savings from 20HP/15kW to 100HP/75kW
Estimated Energy Saving, MWh
Capacity, HP /kW
100/75 75/56 60/45 50/37 40/30 30/22 25/19 20/15
Rewound 377 284 227 190 154 116 97 78
HEM 325 244 196 164 132 99 83 66
Energy Saved 52 40 31 26 22 17 14 12
Energy Saved/Year, US$
7,833 5,978 4,701 3,892 3,370 2,492 2,131 1,812
Figure 32B - Estimated Energy Savings from 1HP/0.745kW to 15HP/11kW
Estimated Energy Saving, MWh
Capacity, HP /kW
15/11 10/7.5 7.5/5.6 5/3.7 3/2.2 2/1.5 1.5/1.11 1/0.745
Rewound 59 39 29 20 12 9 7 5
HEM 50 34 25 17 10 8 5 4
Energy Saved 9 5 4 3 2 1 2 1
Energy Saved/Year, US$
1,237 801 612 357 251 203 192 149
3) Estimated Carbon Dioxide Emissions (Figure 34)Carbon Dioxide (CO2) savings estimation based on electricity produced from Coal at 0.705 of CO2/Lbs.
Estimated Carbon Dioxide Emissions Ton(s)
Capacity, HP /kW
100/75 75/56 60/45 50/37 40/30 30/22 25/19 20/15
Rewound 133.03 100.01 80.11 67 54.4 40.9 34.21 27.47
HEM 114.62 85.97 69.06 57.86 46.48 35.05 29.21 23.22
Carbon Dioxide Savings
18.41 14.04 11.05 9.14 7.92 5.85 5 4.25
33

Energy Efficiency Improvements for Motor & Its Drive Systems
Section 4
<<
Estimated Carbon Dioxide Emissions Ton(s)
Capacity, HP /kW
15/11 10/7.5 7.5/5.6 5/3.7 3/2.2 2/1.5 1.5/1.11 1/0.745
Rewound 20.66 13.81 10.38 6.95 4.25 3.13 2.35 1.68
HEM 17.75 11.92 8.94 6.11 3.67 2.65 1.9 1.33
Carbon Dioxide Savings
2.91 1.89 1.44 0.84 0.58 0.48 0.45 0.35
Figure 33 - Estimated Carbon Dioxide Emissions
4.2 Strategies for Electric Motor Drive System (EMDS) Improvement
From Figure 34, we can identify a number of key issues:1. Energy Audit is composed of Vibration
analysis (VA), Power Quality Audit (PQA), Electrical Signature Analysis (ESA), Insulation Resistance Test, Load Analysis, and Thermal Scanning are best tools for energy audit and detect any incoming defects on the motor and its drive-system.• Vibration Analysis – detects any mechanical
problems that may occur in the motor.
Such as, misalignment, unbalance, bearings, resonance, etc.
• Electrical Signature Analysis – detects any electrical and mechanical problems that may occur in the motor. Such as, rotor bar, air gap problem, stator and rotor problem, and mechanical problems.
• Insulation Resistance Test – is the most common measuring motor winding resistance to ground.
• Power Quality Audit – use to measure energy consumption, measure and recording of Power System Quality (kW, kVA, kVAR), determine Harmonic Problems
Strategies for EMDS Improvement
Review Motor & Its Drive
System
Laser Alignment, Rotor Balancing
Right Application, Amount, Interval
and Clean Lubricant
Partnership with Service
Providers
Motor - Four Essential for ReliabilityDesign: HEM,
Energy Efficiency Opportunities:
VFD, PQ,VOS, PF
Assembly Lubrication Operations
Energy Audit
Motor Database
VA, PQA, ESA, IR Test, Load
Analysis, Thermal Scanning
Lub Analysis
ISO50001 - Energy
Management Standards
Figure 34 - Strategies for EMDS Reliability
34
Energy Efficiency Improvements for Motor & Its Drive Systems
Section 4
<<
Originating from Source or Load, monitor phase balances, power start-up analysis, and troubleshooting.
• Load Analysis – which is covered by PQA is important to determine motor efficiency, as well as if it’s oversize or undersize motor.
• Thermal Scanning - is a non-invasive diagnostic technique that allows us to visualize and quantify changes in the surface temperature of electrical switchgear. An infrared camera convert infrared radiation (heat) emitted from the surface of electrical equipment into electrical impulses. These impulses are mapped as colors which represent the various temperatures. Thermal Imaging identifies equipment flaws and pinpoints any hot spots often invisible to the naked eye.
• Lube Analysis – Large motors whose Babbitt bearings are usually oil lubricated. Routine oil analysis to check the presence of any contaminants that may damage the bearings.
• A motor database - A motor database can keep track of all electric motors in a building, plant, or company. It can list purchase characteristics, operational data, maintenance actions, and measurement data (if available).
• ISO50001 – Energy Management Standards. Most energy efficiency in industry is achieved through changes in how energy is managed in an industrial facility rather through installation of new technologies.
2. Strategies for Electric Motor Drive System Improvement.Precision maintenance implies that standards of maintenance work have to be lifted above what is ordinarily found in the average on-site maintenance workshop and/or among contractors supplying overhaul services.• By reviewing motor and its drive system
efficiencies. Such as; transmission drives (V-belts, gears) by using variable frequency drives (VFD),
• Repair is implemented if the machine condition dictates it, identifying and eliminating the root cause. Such as; Laser alignment and rotor balancing are very important for the reliability of motors and increase its life.
• Lubrication – almost 40% of bearing failures is caused by lubrication due to wrong application of lubricants, insufficient & excessive lubricant, and contamination. Automatic lubricator is a simple gadget that will help increase bearing life.
• Some companies outsource their maintenance – a non-core business to third parties who has the instruments, capability, expertise, and personnel to handle it.
3. Motor – Four Essential for Reliability are as follows• Use of High Efficiency Motor s rather than
rewound or standard motors had proven to be cost effective, save more power, etc.
• Installing Variable Frequency Drives (VFD), Power Quality (PQ) Filters, Voltage Optimizer/Stabilizer (VOS), and Power Factor (PF) corrections help reduce power consumption and increase equipment uptime and reliability.
• Proper implementation of lubrication is a must to prolong bearing life, reduce energy consumption, etc.
• Operations – proper handling in the operation of any equipment and care will help improve reliability.
4. Energy Audit data is useful for maintenance planning but has greater potential for reliability improvements, which are often not realized.
5. Reliability improvements, and hence plant availability, will only be achieved by an
35

Energy Efficiency Improvements for Motor & Its Drive Systems
Section 4
<<
intentional approach to establishing the reasons for machine failure and progressively engineering them out.
6. Assuming that machine reliability statistics are already quite acceptable across the plant, then
further improvements can only is gained from attention to detail in all matters relating to overhaul, lubrication and operation.
4.3 Electric Motor Manufacturers
Motor Manufacturer WebsiteMarathon Home http://www.marathonelectric.com/Marathon Catalog Search by PartNo. http://www.marathonelectric.com/motors/search.aspMarathon Motors http://www.marathonelectric.com/motors/motors.aspMarathon Literature Downloads http://www.marathonelectric.com/motors/literature.jspABM http://www.abm-antriebe.de/ABB http://www.abb.com/motors&drivesABS Pumps http://www.abspumps.com/absgroupdefault.asp?iLanguageID=1AEG http://www.lafert.com/#A.O. Smith http://www.aosmithmotors.com/Alpak CEG http://www.brookcrompton.com/pages/history.htmAllis Chalmers See SiemensAmerican Contex http://www.americancontex.com/Ametek http://www.ametek.com/products/motors.cfmAMK http://www.amkdrives.com/API Portescap US http://www.portescap.com/Entry_Pages/Portescap.htmATB Antriebstechnik http://www.atb-motors.com/ATEK GmbH http://stroter.com/home.htmAurora Pumps http://www.aurorapump.com/Baldor http://www.baldor.com/site_map.aspBauer Gearmotors http://www.eberhardbauer.com/Bauknecht Baumuller http://www.baumuller.com/Bay Motor Products, Inc. http://www.baymotorproducts.com/Berger Lahr GmbH & Co. http://www.schneider-electric-motion.com/Biesse http://www.biesseusa.com/Bison Gear http://www.bisongear.com/Bonfiglioli North America http://www.bonfiglioliusa.com/Bodine Electric http://www.bodine-electric.com/Boehm see BaldorBonora http://www.motoribonora.it/prodottie.htmBrook Crompton http://www.brookcromptonna.com/Brook Crompton UK http://www.brookcrompton.com/Brook Hansen see Brook CromptonBrother/Gearmotors http://www.brother-usa.com/gearmotors/
36

Energy Efficiency Improvements for Motor & Its Drive Systems
Section 4
<<
Brush Electrical Machines http://www.brush.euBrown Boveri BBC see ABBBuehler Motor http://www.buehlermotor.com/Carter Motor Company http://www.cartermotor.com/CEG Motors http://www.ceg.it/ING/Index.aspCentury http://www.aosmith.com/China MS Motor Co.,Ltd http://www.ms-motor.com/Coel http://www.coelmotori.it/Comer http://www.comergroup.it/About%20us.htmContinental Electric Motors, http://www.cecoinc.com/Delco see LincolnDelta Electricals India http://www.delta-motors.com/Dietz Motoren GmbH http://www.dietz-motoren.de/pages/eindex.htmlDoerr http://www.usmotors.com/Help/Emersonref.htmDrive Source International(Dynamatic) http://www.dynamatic.com/Dunkermotoren http://www.motioncontrol.comEAD Motors http://www.eadmotors.com/EBM http://www.ebmpapst.us/Electric Machinery Company, Inc. http://www.electricmachinery.com/Elektra Faurndau http://www.faurndau.com/en/home.htmlElectra-Gear http://electragear.com/Elektrim http://toolmex.com/products/electric-motors/Electro Adda http://www.electroadda.it/IT_Site/3Main.htmlElmo see SiemensElnor Motors http://www.elnor.be/Elte S.r.l. http://www.eltesrl.com/inglese/prodotti.htmEmerson http://www.emersonmotors.com/products/index.htmEmod Motoren http://www.emod-motoren.de/emod_en.htmlETI(Elettra Technology) http://www.etimotors.com/motors.htmElvem Italy http://www.elvem.it/en/products.htmlFairbanks Morse http://www.fairbanksmorsepump.com/Fasco http://www.fasco.com/product.aspFimet http://www.fimet.com/Pages/index.asp?Lingua=ENFimec http://www.fimec.it/Flender Corporation http://www.flender-na.comFlygt http://www.flygtus.com/Franklin Electric http://www.franklin-electric.com/Franz Kessler KG http://franz-kessler.de/EN/index.htmFuan One Dragon Motor Co., Ltd. http://od-motor.com/Gamak Motors http://gamakmotors.co.uk/home.htmlGE Industrial Systems http://www.geindustrial.comGeorgii Kobold http://georgii-kobold.comGlobe Motors http://www.globe-motors.com/home.htmlGorman-Rupp http://www.gormanrupp.com/
37
Energy Efficiency Improvements for Motor & Its Drive Systems
Section 4
<<
Graham (Danfoss See DanfossGroschopp http://www.groschopp.com/Grundfos http://www.grundfos.com/web/homeus.nsfHaslev http://www.hael.dk/Hebei Energetic http://www.china-ox-motor.com/HEMCO USA, INC. http://www.hemco.com/Himmel http://www.americancontex.com/Hindustan Motor M http://www.hindmotors.com/Hitachi America, http://www.hitachi.us/404.htmlHowell http://www.howellelectricmotors.com/Hurst Manufacturing http://www.myhurst.com/hurstmfg/index.jspHwang Hae Electric Corp. http://www.ringblower.net/eng-main.htmHyosung(HICO) http://www.hyosung.comICME http://www.lafert.com/#Imperial Electric Company http://www.imperialelectric.com/products/Industrial Indexing Systems, Inc. http://www.iis-servo.com/Johnson Electric http://www.johnsonelectric.comKatt Electric Motors AKH http://www.katt-motoren.de/index.php/company.htmlKollmorgen Motion Technologies Group http://www.kollmorgen.com/Kurt Maier Motor-Press GmbH http://www.kmmp.de/home_english/home_english.htmLafert North America http://www.lafertna.com/frame.htmLandert-Motoren AG http://www.landert.com/landert_e.phpLEESON Electric http://www.leeson.com/Lenze Ltd. http://www.lenze.com/lenze.comLeroy-Somer, Inc. http://www.leroysomer.com/Lightnin Mixers http://www.lightnin-mixers.com/Lincoln Motors http://www.lincolnmotors.com/Loher Drive Systems, Inc http://www.loher.comLouis Allis http://www.louisallis.com/Mabuchi Motor America Corp. http://www.mabuchi-motor.co.jpMAC Motor Appliance Corporation http://www.macmc.com/acmotorshome.htmMAE http://maepowermotor.com.my/about.htmlMarelli http://www.marellimotori.com/home.asp?*p=82Merkle-Korff Industries http://www.merkle-korff.com/Metric Motor Company http://www.lafertna.com/Myers-Aplex http://www.motorspecialty.com/MGM brake Motors http://www.mgmelectricmotors.com/Minarik Corporation http://www.minarikcorp.com/Morrill Motors, Inc. http://www.morrillmotors.com/Motors Specialty http://www.motorspecialty.com/Motovario Corporation http://www.motovario.com/Navyug Electric Motors http://www.navyugelectricmotors.com/Nord Gear Corporation http://nord.com/Peerless http://www.peerlesselectric.com/
38
Energy Efficiency Improvements for Motor & Its Drive Systems
Section 4
<<
RAE Corporation http://www.raemotors.com/Reliance Electric http://www.reliance.com/Servotronics, Inc. http://www.servotronics.com/Schorch http://www.americancontex.com/SEW-Eurodrive, Inc http://seweurodrive.com/Sicme Motors Italy http://www.sicmemotori.comSiemens http://www.sea.siemens.com/Specialty Motors, Inc. http://www.specialtymotors.com/Sterling Electric, Inc. http://www.sterlingelectric.com/Taizhou Jinweida Motor Co.,Ltd http://www.jinweida.com/en/about.aspTatung Electric http://www.tatungsh.com/tsh/heavy/product(e).htmTECO Westinghouse Motor Company http://www.tecowestinghouse.com/Toshiba Industrial Products http://www.tic.toshiba.comUS Electrical Motors http://www.usmotors.com/default_products.htmWEG Electric Motors http://www.wegelectric.com/Welco Technologies http://www.welco-tech.com/FAQ.aspWEM http://www.wem.com.cn/english.htmWestinghouse http://www.etimotors.com/Yaskawa Electric America, Inc. http://www.yaskawa.com/Yung Yuan Company http://www.superb-motor.com.tw/english/index.htm
4.4 Voltage Stabilizer Manufacturers
Motor Manufacturer Website
NEOPACK INT’L (NEOPOWER DIV.) http://www.neopower.hkStatron AG http://www.statron.com/index.php?id=68ORTEA SpA http://www.ortea.it/index.asp?pg=aziendaAshley-Edison Asia Pte Limited http://www.ashleyedisonasia.com/Schuntermann Transformers Ltd http://www.schuntermann.de/
39

Energy Efficiency Improvements for Motor & Its Drive Systems
Section 5
<<
SECTION 5
40

Energy Efficiency Improvements for Motor & Its Drive Systems
Section 5
<<
OVERVIEW
There are other EE opportunities that can be applied to EMDS. These are as follows:• Rewinding with the use of Computerize Rewinding Machine• Variable Frequency Drives• Power Quality• Power Factor
To properly implement EE opportunities, there are testing and equipment required to validate the results. These are as follows:
• Power Quality Instrument• Vibration Analyzer• Electrical Signature Analyzer (ESA)• Laser Alignment Instrument
5.1 Rewinding
Rewinding is much cheaper than replacing the failed motor with HEM. However, it depends on the service provider’s capabilities, trained personnel, and if equipped with high technology tools, instruments, and equipment.
Figure 36 - Low slot fill
Figure 35 - Mean-length-turn
LS
LS
d
Diamond coil Round coil
MLT=(2xLs)+(4x Le) MLT=2(Ls)+πd
Where MLT = Mean length of turn Ls = Straight section of coil Le = Coil extension
Mean length of turn (MLT)
5.1.1 Common rewinding problems
Conventional method of forming a coil is not that easy if the Rewinder does not pay atten-tion to the Mean-Length-Turn (MLT) of coil as shown in Figure 35 prior to forming it and number of turns/coil that ends up in Figure 36 - relatively low slot fill (40 to 50%). These reduce motor efficiency by an average 5 - 7.6% and lifecycle to less than two years. The common symptoms are high operating temperature and amperage (means more energy is consumed).
Le
41

Energy Efficiency Improvements for Motor & Its Drive Systems
Section 5
<<
5.1.2. The Technology for Coil winding
Stator I2R loss can be reduced by increasing the conductor cross-sectional area and/or decreasing the mean length of turn (MLT). Changing the winding configuration can also increase the stator I2R loss, although some changes (e.g., increasing the cross-sectional area) will reduce it.
Mean length of turn (MLT) In Figure 35, allowing the MLT to increase will increase stator I2R losses and therefore decrease motor efficiency. Conversely, decreasing the MLT where possible will reduce stator I2R losses to help maintain or even improve efficiency. The goal is to reduce the straight section of the coil where it exits the slot to the minimum required to avoid mechanicals train on the slot cell. Whatever coil shape is used, make sure the coil end turns are no longer than those of the original winding.
Samatic 8080 Computerize Rewinding Machine is one of the latest technologies available for motor service provider as shown in Figure 37.
Machine Features:The MLT is achieved with the use of patented “Adjustable Concentric Heads” - one set of heads fit thousands of different motor sizes- perfectly. Each element of the heads moves up and down independently, producing a perfect sized coil every time. The adjustments are made in seconds with the special Set Up jig (Figure 38).
SAMATIC , with its special Adjustable Concentric Heads, and special layering and tensioning features is the perfect tool to achieve the HIGHEST SLOT DENSITY/ FILL RATIO, one of a much higher percent slot fill (60 to 64%) as shown in Figure 39, in any coil shape, and particularly in the concentric winding method.
Benefits:• Automatic Wire Guidance in a manner that
assures perfect layer winding, guaranteed no crossovers,
• Automatic Wire Tensioning works up to 2” total wire width on hand,
• Ease of Coil insertion into slots due to zero crossovers, a major time savings with consistent high quality of coils,
• Sleeves Released Automatically wherever and whenever needed to save valuable connection time (continuity winding),
• Data Bank- Machine remembers all jobs and coil specs for automatic set up,
• PC Adapter is built in with the Swim - 100,000 rewind jobs,
• Data/Re-Design/Analysis software, and • Alarm signals “out-of-wire” and stops machine.
Figure 37 - SAMATIC 8080 Computerize Motor Rewinding Machine. Courtest of http://www.samatic.com/
Samatic Winding Machine
Figure 38 - Adjustable Concentric Heads
SAMATIC’s Adjustable Concentric Heads
Coil span is important
Lap Winding Coil Form
Tensioner to minimize corssed wires
Computerized Coil Winder
42
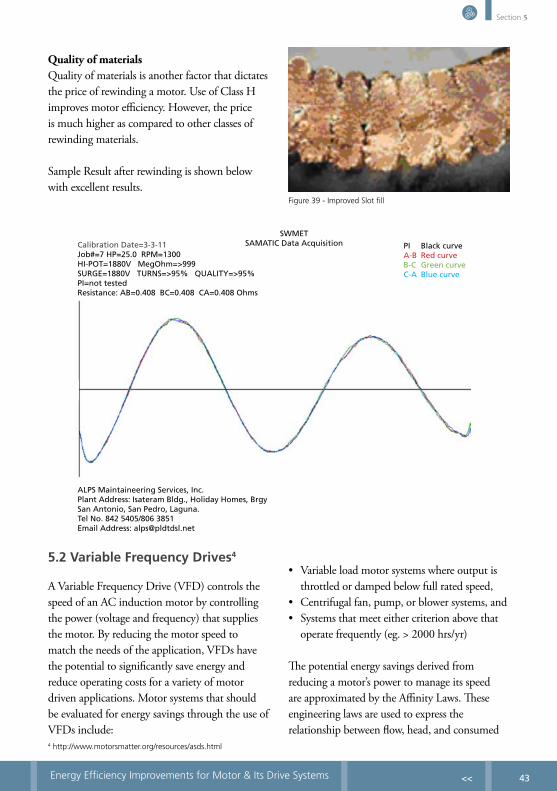
Energy Efficiency Improvements for Motor & Its Drive Systems
Section 5
<<
Quality of materialsQuality of materials is another factor that dictates the price of rewinding a motor. Use of Class H improves motor efficiency. However, the price is much higher as compared to other classes of rewinding materials.
Sample Result after rewinding is shown below with excellent results.
Figure 39 - Improved Slot fill
5.2 Variable Frequency Drives4
A Variable Frequency Drive (VFD) controls the speed of an AC induction motor by controlling the power (voltage and frequency) that supplies the motor. By reducing the motor speed to match the needs of the application, VFDs have the potential to significantly save energy and reduce operating costs for a variety of motor driven applications. Motor systems that should be evaluated for energy savings through the use of VFDs include:
• Variable load motor systems where output is throttled or damped below full rated speed,
• Centrifugal fan, pump, or blower systems, and• Systems that meet either criterion above that
operate frequently (eg. > 2000 hrs/yr)
The potential energy savings derived from reducing a motor’s power to manage its speed are approximated by the Affinity Laws. These engineering laws are used to express the relationship between flow, head, and consumed
4 http://www.motorsmatter.org/resources/asds.html
Calibration Date=3-3-11Job#=7 HP=25.0 RPM=1300HI-POT=1880V MegOhm=>999SURGE=1880V TURNS=>95% QUALITY=>95%PI=not testedResistance: AB=0.408 BC=0.408 CA=0.408 Ohms
ALPS Maintaineering Services, Inc.Plant Address: Isateram Bldg., Holiday Homes, BrgySan Antonio, San Pedro, Laguna.Tel No. 842 5405/806 3851Email Address: [email protected]
PI Black curveA-B Red curveB-C Green curveC-A Blue curve
SWMETSAMATIC Data Acquisition
43

Energy Efficiency Improvements for Motor & Its Drive Systems
Section 5
<<
power in relation to shaft speed for pump and fan applications and can be summarized as follows:• Change in flow is proportional to the change
in shaft speed,• Change in head (pressure) is proportional to
the square of the change in shaft speed, and• Change in power consumed is proportional to
the cube of the change in shaft speed.
Energy Savings ExampleTo illustrate the relationship between motor speed and consumed power, assume a 20HP centrifugal pump operating 3400 hours per year with electric costs at $.10 / kWh. Applying the third affinity law, the yearly electric cost of the motor running at full rated (100%) shaft speed or flow would be: = (Full rated HP) * 0.746 kW/HP * (% full
rated shaft speed)3 * (annual operating hours) * (cost of electricity) OR
= 20 HP * 0.746 kW/HP * (1.0)3 * 3400 hrs/yr. * $0.10/kWh
= US$5,073.00
Running the motor at an average of 70% of full rated speed, the yearly cost of electricity would be as follows: = 20 HP * 0.746 kW/HP * (0.7)3 * 3400 hrs/yr.
* $0.10/kWh = US$1,740.00
In this example, a 65% energy cost savings is gained as a result of a 30% reduction in shaft speed (or flow). In other words, small reductions in speed and flow can lead to significant energy cost savings. Note: the above example does not take into consideration energy losses in the motor system including the efficiency of the motor and drive; actual savings will vary.
Given the significant energy savings potential of VFD technology for many motor applications,
VFD assessment and consideration is an integral part of sound motor management planning. A proper VFD analysis must consider appropriate applications, controls, and power quality including corrective measures for handling harmonics. Consider making VFD analysis and planning part of your motor management plan.
5.3 Power Quality5
Total Harmonic Distortion
Harmonic distortion is the change in the waveform of the supply voltage from the ideal sinusoidal waveform. It’s caused by the interaction of distorting customer loads with the impedance of the supply network. Its major adverse effects are the heating of transformers, capacitors, induction motors, and the overloading of neutral conductors that are not rated to carry large currents. Therefore, monitoring Total Harmonic Distortion (THD) is very important to utilities.
Economic impact of disturbanceHarmonics have a major economic impact:• Premature ageing of equipment means it must
be replaced sooner unless oversized right from the start
• Overloads on the distribution network can require higher subscribed power levels and increase losses
• Distortion of current waveforms provokes nuisance tripping that can stop production
Increasingly serious consequencesOnly ten years ago, harmonics were not yet considered a real problem because their effects on distribution networks were generally minor. However, the massive introduction of power electronics in equipment has made the phenomenon far more serious in all sectors of economic activity.
5 http://www.electrical-installation.org/wiki/Power_harmonics_management
44
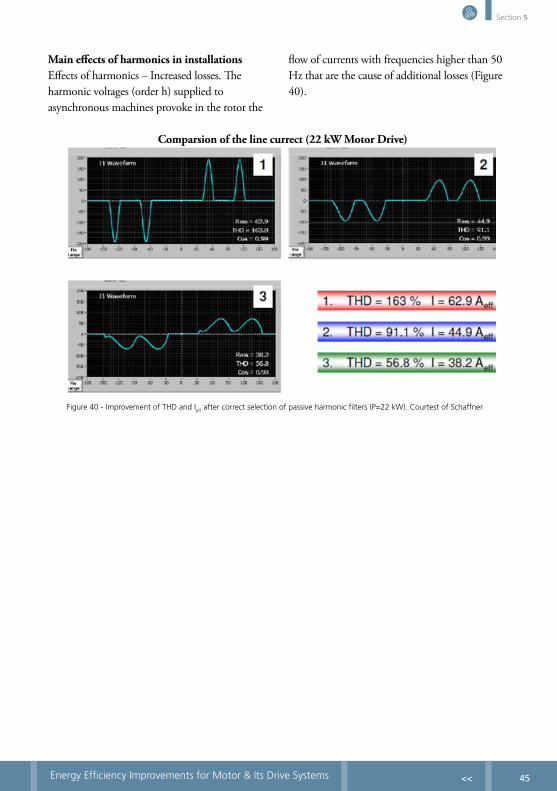
Energy Efficiency Improvements for Motor & Its Drive Systems
Section 5
<<
Main effects of harmonics in installationsEffects of harmonics – Increased losses. The harmonic voltages (order h) supplied to asynchronous machines provoke in the rotor the
flow of currents with frequencies higher than 50 Hz that are the cause of additional losses (Figure 40).
Figure 40 - Improvement of THD and Ieff after correct selection of passive harmonic filters (P=22 kW). Courtest of Schaffner
Comparsion of the line currect (22 kW Motor Drive)
45

Energy Efficiency Improvements for Motor & Its Drive Systems
Section 5
<<
Another improvement for harmonic filter for the following (Figure 41)6:• Harmonic compensation• Reactive power compensation
Current transformers can be
placed upstream or downstream
of the filter
Network connection
Transformer
Compensated load uncompensated load
400 VAC
Figure 41 - System Improvement for Harmonics
6 http://www.schaffner.com/?gclid=CJjA rPI9qoCFUF66wodt2WRGQ
5.4 Power Factor Improvement
The first and most obvious opportunity for motor energy savings is power factor correction. Most monitoring systems provide a wide range of data directly or indirectly associated with power factor including: • Displacement power factor (total and per
phase) • True power factor (total and per phase) • Distortion power factor (total and per phase) • Min/max power factor • Reactive power and energy • Real power and energy • Apparent power and energy
• Load balancing• Flicker compensation
To briefly discuss how power factor relates to energy savings, polyphase induction motors use
Total M
otor Curre
nt
Resistive Current Component
Ind
uct
ive
Cu
rren
t C
om
po
nen
t
?new
Figure 42 - Component of Motor Current
46
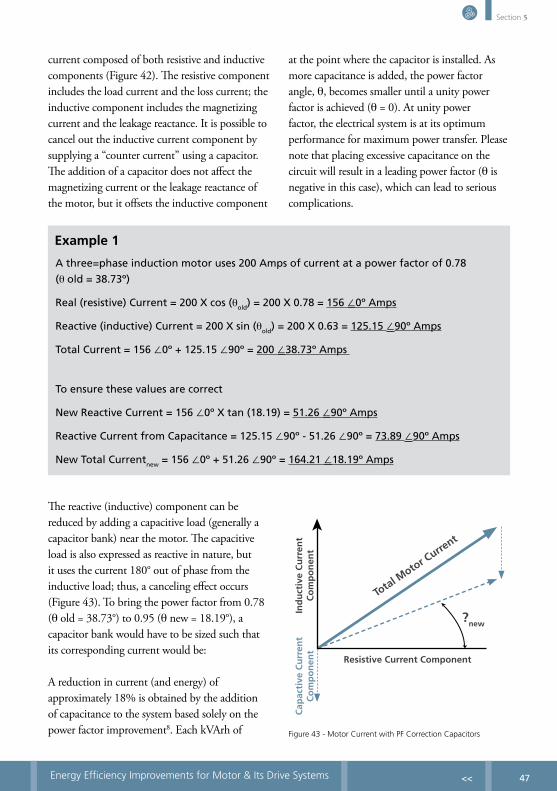
Energy Efficiency Improvements for Motor & Its Drive Systems
Section 5
<<
current composed of both resistive and inductive components (Figure 42). The resistive component includes the load current and the loss current; the inductive component includes the magnetizing current and the leakage reactance. It is possible to cancel out the inductive current component by supplying a “counter current” using a capacitor. The addition of a capacitor does not affect the magnetizing current or the leakage reactance of the motor, but it offsets the inductive component
at the point where the capacitor is installed. As more capacitance is added, the power factor angle, θ, becomes smaller until a unity power factor is achieved (θ = 0). At unity power factor, the electrical system is at its optimum performance for maximum power transfer. Please note that placing excessive capacitance on the circuit will result in a leading power factor (θ is negative in this case), which can lead to serious complications.
Example 1
A three=phase induction motor uses 200 Amps of current at a power factor of 0.78
(θ old = 38.73º)
Real (resistive) Current = 200 X cos (θold) = 200 X 0.78 = 156 ∠0º Amps
Reactive (inductive) Current = 200 X sin (θold) = 200 X 0.63 = 125.15 ∠90º Amps
Total Current = 156 ∠0º + 125.15 ∠90º = 200 ∠38.73º Amps
To ensure these values are correct
New Reactive Current = 156 ∠0º X tan (18.19) = 51.26 ∠90º Amps
Reactive Current from Capacitance = 125.15 ∠90º - 51.26 ∠90º = 73.89 ∠90º Amps
New Total Currentnew = 156 ∠0º + 51.26 ∠90º = 164.21 ∠18.19º Amps
The reactive (inductive) component can be reduced by adding a capacitive load (generally a capacitor bank) near the motor. The capacitive load is also expressed as reactive in nature, but it uses the current 180° out of phase from the inductive load; thus, a canceling effect occurs (Figure 43). To bring the power factor from 0.78 (θ old = 38.73°) to 0.95 (θ new = 18.19°), a capacitor bank would have to be sized such that its corresponding current would be:
A reduction in current (and energy) of approximately 18% is obtained by the addition of capacitance to the system based solely on the power factor improvement8. Each kVArh of
Total M
otor Curre
nt
Resistive Current Component
Ind
uct
ive
Cu
rren
t C
om
po
nen
t
?new
Figure 43 - Motor Current with PF Correction Capacitors
Cap
acti
ve C
urr
ent
Co
mp
on
ent
47
Energy Efficiency Improvements for Motor & Its Drive Systems
Section 5
<<
reactive energy passing through your electrical system produces superfluous line losses and higher energy bills. Permanently-installed monitoring devices can quantify these losses and offer additional savings opportunities within the facility.
8A word of caution: Most industrial systems use motors with adjacent loads that are complex (e.g, non-linear loads such as adjustable speed drives).
These complex load-types may react negatively to the addition of standard power factor correction capacitors due to the capacitors’ interaction with other frequencies produced by the complex loads. More information is available on the internet regarding the interaction between complex-load types and power factor correction capacitors (also see displacement power factor versus true power factor).
5.5 Testing and Equipment Required
Test Instruments
Purpose Manufacturer Website
Laser Alignment Alignment of motor & drive system shafts
Elos - Fixturlaser AB, Sweden
http://www.fixturlaser.com/
Vibration Analyzer Detects mechanical vibration related problems
01dB - Metravib, France http://www.01db-metravib.com/predictive-maintenance.5/?L=1
Electrical Signature Analyzer
Detects electrical related problems
01dB - Metravib, France http://www.01db-metravib.com/predictive-maintenance.5/?L=1
Three Phase Power Quality Analyzer
Detects Harmonic Problems Originating from Source or Load
Fluke http://www.fluke.com/
Thermal Scanning Detects any loose connections in the power system and motor terminals
Fluke http://www.fluke.com/
48

Energy Efficiency Improvements for Motor & Its Drive Systems
Section 5
<<
Equipment Purpose Manufacturer WebsiteVariable Frequency Drives
Controls the speed of an AC induction motor by controlling the power (voltage and frequency)
ABB, Siemens, Toshiba, many more
Refer to their website
Power Quality Harmonic compensation, Reactive power compensation, Load balancing, Flicker compensation
Schaffner http://www.schaffner.com/
Inertial Dynamometer for Three Phase Induction Motors
Dynamic performance tests data, including: speed and torque spectrum, speed and torque oscillations, friction torque, friction spectrum, back EMF, and cogging torque level.
M.E.A. Testing Systems Ltd.
www.meatesting.com
Computerize Rewinding Machine
Ensure quality of MLT, precise turns/coil, excellent wire tension, etc
Jenlor-Samatic Ltd www.samatic.com/
49

Energy Efficiency Improvements for Motor & Its Drive Systems
Section 6
<<
SECTION 6
50

Energy Efficiency Improvements for Motor & Its Drive Systems
Section 6
<<
ANNEXAnnex: Other Tables, ISO 10816-3, and Alignment Tolerance
Annex 1 - Tables with efficiency classes: IEC 60034-30 (2008) – 50 Hz
50 HZIE1-Standard Efficiency IE2-High Efficiency IE3-Premium Efficiency
kW 2-pole 4-pole 6-pole 2-pole 4-pole 6-pole 2-pole 4-pole 6-pole
0.75 72.1 72.1 70.0 77.4 79.6 75.9 80.7 82.5 78.9
1.1 75.0 75.0 72.9 79.6 81.4 78.1 82.7 84.1 81.0
1.5 77.2 77.2 75.2 81.3 82.8 79.8 84.2 85.3 82.5
2.2 79.7 79.7 77.7 83.2 84.3 81.8 85.9 86.7 84.3
3 81.5 81.5 79.7 84.6 85.5 83.3 87.1 87.7 85.6
4 83.1 83.1 81.4 85.8 86.6 84.6 88.1 88.6 86.8
5.5 84.7 84.7 83.1 87.0 87.7 86.0 89.2 89.6 88.0
7.5 86.0 86.0 84.7 88.1 88.7 87.2 90.1 90.4 89.1
11 87.6 87.6 86.4 89.4 89.8 88.7 91.2 91.4 90.3
15 88.7 88.7 87.7 90.3 90.6 89.7 91.9 92.1 91.2
18.5 89.3 89.3 88.6 90.9 91.2 90.4 92.4 92.6 91.7
22 89.9 89.9 89.2 91.3 91.6 90.9 92.7 93.0 92.2
30 90.7 90.7 90.2 92.0 92.3 91.7 93.3 93.6 92.9
37 91.2 91.2 90.8 92.5 92.7 92.2 93.7 93.9 93.3
45 91.7 91.7 91.4 92.9 93.1 92.7 94.0 94.2 93.7
55 92.1 92.1 91.9 93.2 93.5 93.1 94.3 94.6 94.1
75 92.7 92.7 92.6 93.8 94.0 93.7 94.7 95.0 94.6
90 93.0 93.0 92.9 94.1 94.2 94.0 95.0 95.2 94.9
110 93.3 93.3 93.3 94.3 94.5 94.3 95.2 95.4 95.1
132 93.5 93.5 93.5 94.6 94.7 94.6 95.4 95.6 95.4
160 93.8 93.8 93.8 94.8 94.8 94.8 95.6 95.8 95.6
200 94.0 94.0 94.0 95.0 95.1 95.0 95.8 96.0 95.8
220 94.0 94.0 94.0 95.0 95.1 95.0 95.8 96.0 95.8
250 94.0 94.0 94.0 95.0 95.1 95.0 95.8 96.0 95.8
300 94.0 94.0 94.0 95.0 95.1 95.0 95.8 96.0 95.8
330 94.0 94.0 94.0 95.0 95.1 95.0 95.8 96.0 95.8
375 94.0 94.0 94.0 95.0 95.1 95.0 95.8 96.0 95.8
51

Energy Efficiency Improvements for Motor & Its Drive Systems
Section 6
<<
Annex 2 - Tables with efficiency classes: IEC 60034-30 (2008) – 60 Hz
60 HZIE1-Standard Efficiency IE2-High Efficiency IE3-Premium Efficiency
HP kW 2-pole 4-pole 6-pole 2-pole 4-pole 6-pole 2-pole 4-pole 6-pole
1 0.75 77.0 78.0 73.0 75.5 82.5 80.0 77.0 85.5 82.5
1.5 1.1 78.5 79.0 75.0 82.5 84.0 85.5 84.0 86.5 87.5
2 1.5 81.0 81.5 77.0 84.0 84.0 86.5 85.5 86.5 88.5
3 2.2 81.5 83.0 78.5 85.5 87.5 87.5 86.5 89.5 89.5
5 3.7 84.5 85.0 83.5 87.5 87.5 87.5 88.5 89.5 89.5
7.5 5.0 86.0 87.0 85.0 88.5 89.5 89.5 89.5 91.7 91.0
10 7.5 87.5 87.5 86.0 89.5 89.5 89.5 90.2 91.7 91.0
15 11 87.5 88.5 89.0 90.2 91.0 90.2 91.0 92.4 91.7
20 15 88.5 89.5 89.5 90.2 91.0 90.2 91.0 93.0 91.7
25 18.5 89.5 90.5 90.2 91.0 92.4 91.7 91.7 93.6 93.0
30 22 89.5 91.0 91.0 91.0 92.4 91.7 91.7 93.6 93.0
40 30 90.2 91.7 91.7 91.7 93.0 93.0 92.4 94.1 94.1
50 37 91.5 92.4 91.7 92.4 93.0 93.0 93.0 94.5 94.1
60 45 91.7 93.0 91.7 93.0 93.6 93.6 93.6 95.0 94.5
75 55 92.4 93.0 92.1 93.0 94.1 93.6 93.6 95.4 94.5
100 75 93.0 93.2 93.0 93.6 94.5 94.1 94.1 95.4 95.0
125 90 93.0 93.2 93.0 94.5 94.5 94.1 95.0 95.4 95.0
150 110 93.0 93.5 94.1 94.5 95.0 95.0 95.0 95.8 95.8
200 150 94.1 94.5 94.1 95.0 95.0 95.0 95.4 96.2 95.8
250 185 94.1 94.5 94.1 95.4 95.4 95.0 95.8 96.2 95.8
300 220 94.1 94.5 94.1 95.4 95.4 95.0 95.8 96.2 95.8
350 250 94.1 94.5 94.1 95.4 95.4 95.0 95.8 96.2 95.8
400 300 94.1 94.5 94.1 95.4 95.4 95.0 95.8 96.2 95.8
450 330 94.1 94.5 94.1 95.4 95.4 95.0 95.8 96.2 95.8
500 375 94.1 94.5 94.1 95.4 95.4 95.0 95.8 96.2 95.8
52

Energy Efficiency Improvements for Motor & Its Drive Systems
Section 6
<<
Annex 3 - Tables with efficiency classes: NEMA Premium
60 HZ: Induction Motors Rated 600 Volts or Less (Random Wound)Totally Enclosed Fan-Cooled Open Drip-Proof
HP 2-pole 4-pole 6-pole 2-pole 4-pole 6-pole
1 77.0 85.5 82.5 77.0 85.5 82.5
1.5 84.0 86.5 86.5 84.0 86.5 87.5
2 85.5 86.5 87.5 85.5 86.5 88.5
3 85.5 89.5 88.5 86.5 89.5 89.5
5 86.5 89.5 89.5 88.5 89.5 89.5
7.5 88.5 91.0 90.2 89.5 91.7 91.0
10 89.5 91.7 91.7 90.2 91.7 91.0
15 90.2 93.0 91.7 91.0 92.4 91.7
20 91.0 93.0 92.4 91.0 93.0 91.7
25 91.7 93.6 93.0 91.7 93.6 93.0
30 91.7 94.1 93.6 91.7 93.6 93.0
40 92.4 94.1 94.1 92.4 94.1 94.1
50 93.0 94.5 94.1 93.0 94.5 94.1
60 93.6 95.0 94.5 93.6 95.0 94.5
75 93.6 95.0 94.5 93.6 95.4 94.5
100 93.6 95.4 95.0 94.1 95.4 95.0
125 94.1 95.4 95.0 95.0 95.4 95.0
150 94.1 95.8 95.4 95.0 95.8 95.8
200 95.0 95.8 95.4 95.4 96.2 95.8
250 95.0 95.8 95.4 95.8 96.2 95.8
300 95.4 95.8 95.4 95.8 96.2 95.8
350 95.4 95.8 95.4 95.8 96.2 95.8
400 95.8 95.8 95.8 95.8 96.2 95.8
450 95.8 96.2 96.2 95.8 96.2 95.8
500 95.8 96.2 96.2 95.8 96.2 95.8
53
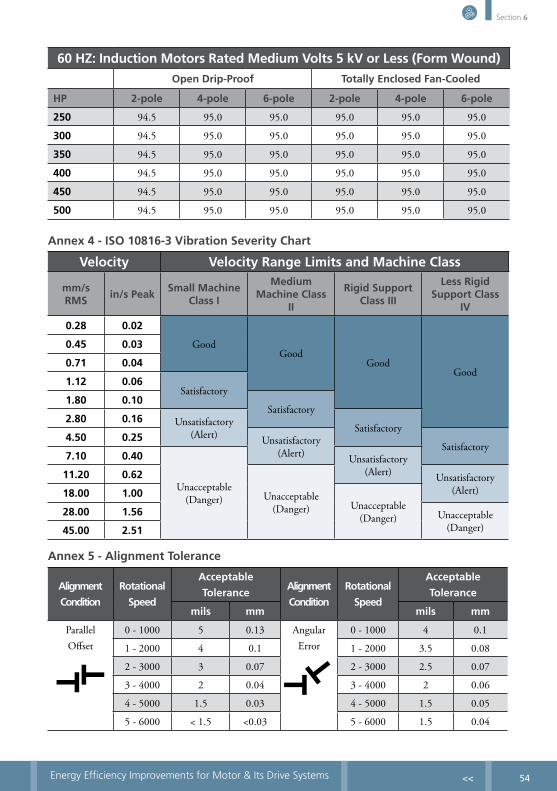
Energy Efficiency Improvements for Motor & Its Drive Systems
Section 6
<<
60 HZ: Induction Motors Rated Medium Volts 5 kV or Less (Form Wound)Open Drip-Proof Totally Enclosed Fan-Cooled
HP 2-pole 4-pole 6-pole 2-pole 4-pole 6-pole
250 94.5 95.0 95.0 95.0 95.0 95.0
300 94.5 95.0 95.0 95.0 95.0 95.0
350 94.5 95.0 95.0 95.0 95.0 95.0
400 94.5 95.0 95.0 95.0 95.0 95.0
450 94.5 95.0 95.0 95.0 95.0 95.0
500 94.5 95.0 95.0 95.0 95.0 95.0
Annex 4 - ISO 10816-3 Vibration Severity Chart
Velocity Velocity Range Limits and Machine Class
mm/s RMS
in/s PeakSmall Machine
Class I
Medium Machine Class
II
Rigid Support Class III
Less Rigid Support Class
IV
0.28 0.02
GoodGood
GoodGood
0.45 0.03
0.71 0.04
1.12 0.06Satisfactory
1.80 0.10Satisfactory
2.80 0.16 Unsatisfactory (Alert) Satisfactory
4.50 0.25 Unsatisfactory (Alert) Satisfactory
7.10 0.40
Unacceptable (Danger)
Unsatisfactory (Alert)11.20 0.62
Unacceptable (Danger)
Unsatisfactory (Alert)18.00 1.00
Unacceptable (Danger)28.00 1.56 Unacceptable
(Danger)45.00 2.51
Annex 5 - Alignment Tolerance
Alignment
Condition
Rotational
Speed
Acceptable
ToleranceAlignment
Condition
Rotational
Speed
Acceptable
Tolerance
mils mm mils mm
Parallel Offset
0 - 1000 5 0.13 Angular Error
0 - 1000 4 0.1
1 - 2000 4 0.1 1 - 2000 3.5 0.08
2 - 3000 3 0.07 2 - 3000 2.5 0.07
3 - 4000 2 0.04 3 - 4000 2 0.06
4 - 5000 1.5 0.03 4 - 5000 1.5 0.05
5 - 6000 < 1.5 <0.03 5 - 6000 1.5 0.04
54

Energy Efficiency Improvements for Motor & Its Drive Systems
Section 6
<<
ABBREVIATIONS
AC Alternating Current CBM Condition Based MaintenanceCEE Consortium for Energy EfficiencyCSR Corporate Social Responsibility DC Direct CurrentEE Energy EfficiencyEISA The Energy Independence and Security Act of 2007EMDS Electric Motor Drive Systems ESA Electrical Signature Analyzer FIT Feed-in-tariff HEM High Efficiency MotorISO International Standard OrganizationsMEPS Motor Energy Performance Standards MLT Mean-Length-Turn NEMA National Electrical Manufacturers Association ODP Open Drip Proof OEM Original Equipment ManufacturerPF Power FactorPQ Power QualitySEA Southeast AsiaSMEs Small-Medium EnterprisesTEFC Totally Enclosed Fan CooledTHD Total Harmonic DistortionTRS Technical Study Report VFD Variable Frequency DriveVOS Voltage Optimizer Stabilizer
55

Energy Efficiency Improvements for Motor & Its Drive Systems
Section 6
<<
GLOSSARY
CERs - Certified Emission Reductions (CERs) are a type of emissions unit (or carbon credits) issued by the Clean Development Mechanism (CDM) Executive Board in exchange for emission reductions through the Kyoto Protocol’s CDM projects. One CER equates to an emission reduction of one ton of CO2, or CO2 equivalent. Methane (CH4) is considered a greenhouse gas 24 times worse than CO2, thus 1 ton of CH4 equals 24 CER’s.
Drive system – The electrical supply, electric motor, speed controls, gear box, or belt system, coupling and driven equipment.
Driven equipment – Examples include pumps, fans, compressors, and conveyor belts.
Enclosure - Different motor enclosures are designed to withstand various levels of exposure to moisture, particles, and chemicals. The four most common types of enclosures are: • Open Drip Proof (ODP) allows air to blow
directly through the motor, but has a cover that prevents drops of liquid from entering. ODP motors are suitable for protected environments.
• Totally Enclosed Fan Cooled (TEFC) motors are designed to prevent outside air from flowing into the frame. Fins and a fan provide cooling. TEFC motors can function outdoors and in dusty or contaminated environments.
• Totally Enclosed Non-ventilated (TENV) motors are not equipped for cooling by means external to the enclosing parts.
• Explosion Proof (EXPL) is a type of TEFC motor designed to prevent sparks or explosions within the motor from igniting flammable materials outside.
Full load current - The current required during full-rated load operation.
Harmonic filter - A harmonic filter is used to eliminate the harmonic distortion caused by devices that draw current in uneven (non sinusoidal) amounts. Among the devices that create harmonics are AC and DC drives, Uninterruptible Power Supplies (UPS) systems, arc welders, arc furnaces, computers, copiers and electronic ballasts. Harmonic currents provide power that cannot be used and also takes up electrical system capacity. Large quantities of harmonics can lead to malfunctioning of the system that results in downtime and increase in operating costs.
Power factor - Measurement of the phase relationship between voltage and current in an electrical system. Induction loads, such as electric motors, tend to reduce power factors. Most three-phase motors have a power-factor rating to indicate how much impact they impose on the system. Significantly low power factors can reduce the efficiency of an entire electrical system, so many utilities charge extra to industrial facilities whose power factor is low. Capacitors can be used to correct this problem.
Power quality - The conditions of voltage level, phase balance, power factor, and harmonics in the power supply. Poor power quality reduces the efficiency and reliability of electrical equipment, including that of motors. Various strategies, such as transformer adjustments and modifications to circuit loads can be used to optimize voltage levels and phase balance, raise the power factor, and minimize harmonics in the electrical distribution system.
56
Energy Efficiency Improvements for Motor & Its Drive Systems
Section 6
<<
Variable-frequency drive (VFD) - A specific technology installed for motors to adapt to variable load.
Voltage stabilizers – A device that controls the output voltage from a varying supply voltage.
Voltage unbalance - In a three phase system, is a condition when the magnitude of at least one phase voltage is not within the acceptable limits of nominal voltage. Three phase induction motors are designed and manufactured such that all three phases of the winding are carefully balanced with respect to the number of turns, placement of the winding, and winding resistance. When line voltages applied to a polyphase induction motor are not exactly the same, unbalanced currents will flow in the stator winding, the magnitude depending upon the amount of unbalance. A small amount of voltage unbalance may increase the current an excessive amount. The effect on the motor can be severe and the motor may overheat to the point of burnout. The voltages should be evenly balanced as closely as can be read on the usually available commercial voltmeter.
57

Energy Efficiency Improvements for Motor & Its Drive Systems
Section 6
<<
REFERENCEMEPS_Guide_1st_Edition_February_2009
Energy-efficiency policy opportunities for electric motor- driven systems. International Energy Agency, by Paul Waide and Conrad U. Brunner. OECD/IEA, 2011.
Electric Motor Asset Management by Bruno De Wachter. ECI Publication No Cu0104, July 2011
Synergizing Partnership for an Energy Efficient and Competitive Philippines. 1st Philippine Energy Efficiency Forum 2011, July 26, 2011 held in Waterfront Cebu City Hotel and Casino.
UNIDO Industrial Energy Efficiency and Technology Programme. Presented by Dolf Gielen, BEE-IEA Seminar, 27 – 28 January 2010, New Delhi, India.
EASA TECHNICAL MANUAL_2007, Section 3.9 Factors Affecting the Performance of AC Motors. Page 3 – 75.
58

Energy Efficiency Improvements for Motor & Its Drive Systems
Section 7
<<
SECTION 7
59

Energy Efficiency Improvements for Motor & Its Drive Systems
Section 7
<<
Overview
Name of Company:Genetron International Marketing
Plant Address: #425 Tubaw St., Bo. Sulucan Angat, Bulacan
Description of Industry: Manufacturing of Chemical Products such as polymer emulsions, inks, fertilizer chemicals, textile auxiliaries, and paper chemicals; also waste transport and treatment of used oil, used oil contaminated materials, and non-halogenated waste organic solvents Contact Person: Gene C. Sebastian, President
Company Profile: Established in 1987, Genetron International Marketing was primarily a trading company that catered to textile manufacturing companies. Broadened by the addition of new ideas and improved formulations of textile auxiliaries such as pre-treatment, bleaching, dyeing and finishing agents, Genetron expanded its operations and went to manufacturing industry. The company’s growth in the succeeding years resulted to the current product portfolio that includes pressure sensitive adhesives, adhesives for papers, corrugated boxes and woodworking, additives for fertilizers, paper chemicals and re-refining of used oil, treatment of used organic solvents and continuous research for mitigations of pollutants.
Project Methodology:This project brief was developed as part of the International Finance Corporation’s scoping
CASE STUDIES – SCOPING STUDIES FOR HEM IN THE PHILIPPINES
study on “Opportunities for High Efficiency Motors”. The study is part of IFC’s Sustainable Energy Finance (SEF) Program that seeks to establish a self-sustaining project development and commercial financing market for energy efficiency and renewable energy projects. The study team conducted walkthrough audits to participating companies to assess their installed motors in terms of proper installation, maintenance, and application. To assess the installed motors and the attached mechanical equipment (the drive system), vibration problems were measured and identified. Companies were also asked on the percentage of rewound motors and the number of times they were rewound per year. Oversized motors were identified by measuring the current consumed. Proper motor maintenance practices such as sealed terminal box and installed motor fan cover were also checked. Voltage problems such as fluctuations and interruptions were also
Fast FactsLocation:
425 Tubaw St. Bo. Sulucan Angat, BulacanLand Area:
12,688 sq. mStorage Tanks Capacity:
1,000 MTWarehouse Floor Area:
2,800 sq. mNumber of Employees:
150Trucks Net Capacity:
87,365 kgTotal Production Capacity/mo:
1,398 MTProduction Capacity (Oil Re-refining)/mo:
300 MTProduction Capacity (Waste Solven)/mo:
50 MT
60

Energy Efficiency Improvements for Motor & Its Drive Systems
Section 7
<<
determined. From these assessments, energy efficiency opportunities were identified with the corresponding financial benefits. This project brief summarizes the findings and recommendations of the study team. Emphasis is given on the financial analysis for this to be useful to the decision makers of the company. The same project brief is given to IFC’s partner financial institutions, Bank of the Philippine Islands and Banco de Oro, which have financing packages under the SEF Program.
Summary of findings1. Areas for Improvements
On motors and drive systems• Around 80% of the motors and the
mechanical equipment attached (the drive system) are old and frequently rewound.
• Motors are consuming more electricity than specified. This is due to the frequency of rewinding, resulting in reduced efficiency and increased power consumption.
• Pumps, blowers, and other mechanical equipment (the driven equipment) are generally oversized.
• There are problems in the installation and maintenance of the motors, as indicated by the vibration measurements.
2. Financial AnalysisAssumptions: Motors Inventory
Motor Capacity (hp) Quantity
50 1
20 15
15 3
10 7
7.5 4
5 20
3 14
2 8
1.5 1
1 4
Life Operating Cycle of HEM
13 years
Frequency of Rewind Once every 2 years
Share of Rewinded Motors
80%
USD Exchange Rate 40 Php
Electricity Price (US$/kWh)
0.15
Operating Hours 7,000 per year
Loan Repayment Period
5 years
Interest Rate 8.0% per annum
Grace Period 1 year
Total investment in improvements US$ 92,754
Simple payback time 1.43 years
Net Present Value US$ 334,256
IRR on Project 70%
IRR on Equity 200%
Life cycle cost for improved setup US$ 6,176,590
Life cycle costs no changes US$ 7,019,242
Savings in life cycle costs US$ 842,652
Generated CERs 143 tCO2 per year
Results:
The total investment in improving the motors is US$92,754. This includes the cost of motors, installation, electrical wiring and mechanical fitting. The project will have an average savings per year of US$64,819. The investment can be recovered after 1.43 years with an NPV of US$334,256 and will give a project and equity IRR of 70% and 200%, respectively.
The IRR on the equity ought to prompt an immediate call for proposals for exchange of the motors and trigger contact to the bank to secure a loan.
61

Energy Efficiency Improvements for Motor & Its Drive Systems
Section 7
<<
It is believed possible to achieve a sales price of the generated CERs for around 5 USD/CER through a Programmatic Approach project (PoA), which would then have to be initiated. PoA projects have got a very long lifespan, longer than the technical lifetime of a HEM. This means that the CER’s could be paid for the full 13 years (715 USD/year during 13 years), but to initiate a PoA project is not without complications.
3. Recommendations:On motors and drive systems• The findings indicate that replacement of the
motors evaluated (Motors Inventory Table) to high efficiency motors (HEMs) requires an investment of US$ 92,754. This amount will be paid off in 1.43 years from the savings generated, assuming the motors are operated for a minimum of 7,000 hours per year. Total savings for the lifetime of the new, high efficiency motors (13 years) is US$ 842,652 with proper installation and maintenance.
• More savings will be realized if new, properly-sized motors and driven equipment are installed. It is important that the voltage specification on the new motors is the same as the voltage supplied in the plant. Based on the voltage readings, it is recommended to replace old motors with 230 VAC high efficiency motors.
• To maintain the service life and reliability of HEMs, the driven equipment must be installed on a stable and rigid foundation, properly aligned and maintained. Good maintenance practices include checking the alignment every six months using laser alignment instruments and measuring the vibration using vibration analyzers.
• Installing variable frequency drive (VFD) will help reduce the electricity bill and still maintain the operating parameters of the processes.
• When VFDs are installed, voltage fluctuation problems may arise. Harmonic filters will help reduce the effects of voltage fluctuation. Voltage stabilizers will also contribute to reduced electricity consumption and increased useful life of the motors and driven equipment.
• To enforce and monitor the energy efficiency initiatives of the company, it is recommended to assign a group dedicated in the implementation of energy efficiency programs and conduct energy audits regularly.
4. ConclusionsReplacing old and inefficient motors listed in the Motors Inventory Table with high efficiency motors, and following a recommended service and maintenance schedule will require an investment cost of US$92,754 and will generate savings of US$842,652 for the 13-year minimum lifetime of HEMs. Payback period for the investment is 1.43 years, assuming a minimum of 7,000 operation hours of the motors. More savings will be realized if the motors are re-sized and if the recommended installation and maintenance practices are implemented. It is important that the voltage specification of the motors is the same as the voltage supplied in the plant. This way, the motors and other equipment in the plant have longer useful lifetime and lower electricity consumption. Establishing an energy efficiency group within the company ensures that all energy efficiency initiatives are implemented and monitored.
62

Energy Efficiency Improvements for Motor & Its Drive Systems
Section 7
<<
CASE STUDIES – SURPLUS, REPAIR, OR REPLACE WITH HEM
Synopsis
Only very few existing companies particularly, Third World Countries in Asian Region invested in High Efficiency Motors. Mostly preferred to invest in surplus or subject the burnt motor for rewind. Unaware, surplus motors may have been subjected to several repairs. The quality of rewinding the motor had shorten the service life to less than six months or if lucky enough, two (2) years. Users commonly experienced high starting current, high current drawn, high operating temperature, or high vibrations are considered as normal condition, a “way of life”, or no attention at all to address the problem. These left the company paying more their electricity bill and increase their maintenance cost.
The objective of this case study is to deliver initiatives that focus on education and the technologies available in the market to help improve motor efficiency and its drive-system thereby reduce electricity bill.
The Problems Of Rewound Motors
There is no assurance that a surplus motor had not been rewound. Common problems of rewound motor are insulation failure as shown in Figure 1.
Further investigation showed in Figure 2 that the rewound motor has relatively low slot fill, which means the turns/coil were not equal or less than the required specification of the motor.
The mean-length-turn (MLT) for diamond coil was also verified and found to be off specification in accordance to Figure 3.
Low slot fill and/or off specs MLT will increase the Stator I2R loss thereby reduce motor efficiency.
It’s Impact To Motor Efficiency
According to Bruno De Wachter, “A motor with low energy efficiency will dissipate its losses as heat. This phenomenon does not only increase the energy cost significantly. In the course of time, the heat will also affect the motor condition, reducing its energy efficiency even further and increasing the risk of unplanned failure.
In most production environments, the cost of the resulting motor downtime can mount to several times the original purchasing value of the motor.”1
1ECI Publication No Cu0104
Figure 1 - Insulation failure
Figure 2 - Relatively low slot fill
63

Energy Efficiency Improvements for Motor & Its Drive Systems
Section 7
<<
Figure 3 - MLT
LS
LS
d
Efficiency Comparison
The maximum motor efficiency is generally in the range of 75% of its full-load current for High Efficient Motors (HEM) as shown by Figure 4. Whereas, the standard motors, its highest efficiency is at full-load current. This means the user is required to shell out more money to operate the motor efficiently.
Based on the experience of service provider for rewinding motors, a rewound motor efficiency is reduced in the range of 5 – 7.6% of its nameplate efficiency.
Repair vs. Replacing 75kW Failed Motor with HEM
50% of the total motor inventory in a sugar mill in Philippines were rewound, and spent almost US$1.38 million monthly on electricity bill. The electricity price is US$ 0.162 per kW-Hr and operating 4,350 hours per year. Generally, lifecycle of motors is 13 years based on the study of Electrical Apparatus Service Association (EASA).
Rewind Motor:Referring to Figure 4, a 75kW standard motor efficiency is 92.5%. After it is rewound, its efficiency is reduced by 5% or equivalent to 87.5% based on 75% Full-Load Current (FLC). The life-cycle is two (2) years.
The cost of rewinding is US$ 2,593.00 using Class H and high quality of materials.
Size Motor
Type
Load
HP kW Full 75% 50% 25%
100 75Efficient 95.3 95.6 95.2 92.7
Standard 92.9 92.5 91.2 86.5
10 7.5Efficient 90.8 91.6 91.1 86.6
Standard 87.0 87.9 86.6 79.9
1 0.745Efficient 84.7 84.8 82.6 74.6
Standard 77.2 74.9 69.2 54.7
Figure 4 - Standard vs. Efficient Motor (Source: E-Source)
Diamond coil Round coil
MLT=(2xLs)+(4x Le) MLT=2(Ls)+πd
Where MLT = Mean length of turn Ls = Straight section of coil Le = Coil extension
Mean length of turn (MLT)
Le
64

Energy Efficiency Improvements for Motor & Its Drive Systems
Section 7
<<
Equation 1: Rewinding Cost/year = Rewinding Cost x life-cycle/year x rewind share = US$ 2,593.00 x 0.5 x 0.5 = US$ 648.0Equation 2: Power consumption = (Motor rated capacity/ efficiency) x annual operating hours x motor load = (75 kW/ 87.5%) x 4,350 hours x 75% load = 279,643 kW-Hrs per yearEquation 3: Power Cost = Power consumption x electricity price = US$ 45,302.00Equation 4: Annual maintenance cost = Installation + laser alignment + wiring cost. = US$ 660.00Equation 5: Total Operating & Maintenance Cost (TOMC) = Equation 1 + Equation 3 + Equation 4Total Operating & Maintenance Cost is,= US$ 46,610.00Equation 6: Life-cycle of Rewound = Equation 5 x life-cycle of motor.Lifecycle of rewound motor = US$ 46,610.00 x 13 years = US$ 605,935.00
Equation 2: Power consumption is, = (75kW x 95.6%) x 4,350 hours x 75% load = 255,949 kW-hours per yearEquation 3: Power cost, = 255,949 x US$ 0.162 per kW-Hr = US$ 41,464.00Equation 5: Total Operating & Maintenance Cost (TOMC) = Equation 3 + Retrofitting Cost = US$ 41,464 + 264 = US$ 41,728.00 per yearEquation 7: Lifecycle of HEM = (Equation 5 x lifecycle of motor) + Price of HEMLifecycle of HEM is, = (41,728.00/yr x 13 yrs) + 12,389.00 = US$ 554,850.00Equation 8: Lifecycle Savings = Equation 6 – Equation 7Lifecycle Savings: = US$ 605,935.00 - US$ 554,850.00 = US$ 51,085.00Equation 9: Simple Payback = (Investment Cost x lifecycle of motors)/Equation 8Simple payback: = (US$ 12,389.00 x 13 yrs)/ US$ 51,085.00 = 3.15 years
Replace with 75kW HEM:The investment cost of 75kW HEM with an efficiency of 95.6% is US$ 12,389.00.
The salvage value is 25% after 13 years. The retrofitting cost is US$ 264.00
65

Energy Efficiency Improvements for Motor & Its Drive Systems
Section 7
<<
Operation and Maintenance Requirements
Proper maintenance increases the longevity of energy-efficient motor investments, generally 10-15 percent. Some key aspects of a solid maintenance program include:• Ensure equipment foundation is stable and
rigid,• Ensure alignment is within acceptable
tolerance,• Implement lubrication program religiously,• Conduct regular vibration analysis and rectify
its root causes, and• Conduct regular electrical signature analysis
and rectify its root causes. • Implementation of ISO50001 – Energy
Management Standards.
66

Energy Efficiency Improvements for Motor & Its Drive Systems
Section 7
<<
At A Glance
With limited natural resources and the ever increasing global demand for energy, it only stands to reason that energy costs will continue to increase into the future. High energy consumption will decrease the profit margin to the user, and possibly remain uncompetitive in the global market.
To effectively reduce energy costs, industrial facilities should begin by evaluating their number one energy consuming culprit: rewound motors.
Common Rewinding Problems
The lowest bid (cut-throat price competition) is common practice in awarding a motor for rewind. The service provider has to look for ways to earn a profit, and these are as follows:
• Partial rewind (Figure 1 & 2)• Limit the warranty to six (6) months resulting
to use of inferior quality of materials, reduce turns/coil and/or mean-length-turn (MLT) as shown in Figure 3.
“CHEAP MOTOR REWINDING PRICE - ENDS UP HIGH OPERATING COST”
Conventional method of forming a coil is not that easy if the Rewinder does not pay attention to the number of turns/coil. The end result is shown in Figure 3 Left Motor that has relatively low slot fill and its MLT were off specification. Those were the major reasons why it was burned after 6 months of operation.
Figure 1 - Slot Insulation failure Figure 2 - Partial Rewind combination of flat & round wires
Figure 3 - Right motor is an original HEM was burnt after 5 years of operation. Left motor was rewound and burned after 6 months
Mean Length Of Turn (MLT)
In Figure 4, allowing the MLT to increase will increase stator I2R losses and therefore decrease motor efficiency. Conversely, decreasing the MLT where possible will reduce stator I2R losses to help maintain or even improve efficiency. The goal is to reduce the straight section of the coil where it exits the slot to the minimum required to avoid mechanicals train on the slot cell.
Table 1 contains the results of an earlier EASA study that show the impact on efficiency of a 10% change in end turn length (about a 5% change in MLT) for typical TEFC (IP54) motors. Where it was feasible, reducing the MLT improved the efficiency over the nominal value. From this it is clear that end turn length and MLT are critical to motor efficiency.
This modification will improve heat transfer, reduce the copper loss and winding temperature and improve motor efficiency. There will be less coil movement, and increased resistance to moisture, due to better varnish retention. Even though these improvements are difficult for the service shop to quantify, they are none the less real and will usually improve motor performance
67

Energy Efficiency Improvements for Motor & Its Drive Systems
Section 7
<<
and reliability. With this modification, the motor’s service factor will be improved and it will be able to withstand wider variations in voltage, ambient and starting conditions.
Motor Efficiency
Motor manufacturers had established highest motor efficiency equivalent to 75% of the full-load current. Motors drawing current more than 75% incur a lot of power losses. Such as, stator core loss (34%), core losses (21%), rotor losses (21%), friction & windage losses (10%), and stray load losses (14%). This has to be investigated further using vibration analysis, motor circuit analysis, voltage unbalance & variance, and power quality measurement.
Figure 4 - MLT
HP/kW PolesEnd turn length
Full load effiency (%)
Total losses (watts)
Change in total losses (%)
50/37 4
10% short 93.1 2746 -2.8
Nominal 93.0 2825
10% long 92.8 2911 3.0
100/75 4
10% short 94.9 4020 -2.6
Nominal 94.8 4129
10% long 94.6 4243 2.8
200/150 4
10% short 95.6 6921 -2.5
Nominal 95.5 7099
10% long 95.3 7278 2.5
50/37 2
10% short 92.7 2935 -2.9
Nominal 92.5 3024
10% long 92.3 3122 3.2
100/75 2
10% short 93.9 4881 -3.3
Nominal 93.7 5047
10% long 93.5 5212 3.3
200/150 2
10% short 95.1 7696 -2.3
Nominal 95.0 7875
10% long 94.9 8075 2.5
Effect of Changes to the End Turn Length on Typical TEFC/IP54, 460V Designs
LS
LS
d
Diamond coil Round coil
MLT=(2xLs)+(4x Le) MLT=2(Ls)+πd
Where MLT = Mean length of turn Ls = Straight section of coil Le = Coil extension
Mean length of turn (MLT)
Le
68

Energy Efficiency Improvements for Motor & Its Drive Systems
Section 7
<<
The Technology for Coil Winding
Computerize motor rewinding machine – Samatic 8080 as shown in Figure 5 help restore motor efficiency if not improved.
The MLT is achieved with the use of patented “Adjustable Concentric Heads” - one set of heads fit thousands of different motor sizes- perfectly. Each element of the heads moves up and down independently, producing a perfect sized coil every time. The adjustments are made in seconds with the special Set Up jig as shown in Figure 6. It has also a special layering and tensioning features and perfect tool to achieve the HIGHEST SLOT DENSITY/FILL RATIO, one of a much higher percent slot fill (60 to 64%), in any coil shape, and particularly in the concentric winding method.
Machine Features• Automatic Wire Guidance in a manner that
assures perfect layer winding, guaranteed no crossovers,
• Automatic Wire Tensioning works up to 2” total wire width on hand,
• Ease of Coil insertion into slots due to zero crossovers, a major time savings with consistent high quality of coils,
• Sleeves Released Automatically wherever and whenever needed to save valuable connection time (continuity winding),
• Data Bank- Machine remembers all jobs and
Figure 5 - SAMATIC 8080 Computerize Motor Rewinding Machine.
Figure 6 - ASAMATIC Adjustable Concentric Heads
SAMATIC’s Adjustable Concentric Heads
Coil span is important
Lap Winding Coil Form
Tensioner to minimize corssed wires
Computerized Coil Winder
coil specs for automatic set up,• PC Adapter is built in with the Swim
- 100,000 rewind jobs,• Data/Re-Design/Analysis software, and • Alarm signals “out-of-wire” and stops machine.
Quality of Materials
Quality of materials is another factor that dictates the price of rewinding a motor. Use of Class H improves motor efficiency according to Electric Power Research Institute, Generation Group, and EASA. However, its price is much higher as compared to other classes of rewinding materials.
Calibration Date=3-3-11Job#=7 HP=25.0 RPM=1300HI-POT=1880V MegOhm=?999SURGE=1880V TURNS=>95% QUAL-ITY=>95%PI=not testedResistance: AB=0.408 BC=0.408 CA=0.408 Ohms
ALPS Maintaineering Services, Inc.Plant Address: Isateram Bldg., Holiday Homes, BrgySan Antonio, San Pedro, Laguna.Tel No. 842 5405/806 3851Email Address: [email protected]
PI Black curveA-B Red curveB-C Green curveC-A Blue curve
SWMETSAMATIC Data Acquisition
Samatic WInding Machine
69

Energy Efficiency Improvements for Motor & Its Drive Systems
Section 7
<<
Sample Result after rewinding is shown below with excellent results.Financial Loss Calculation: Conventional method versus SAMATIC 8080Parameters:High Efficiency Motor Capacity: 7.5 kW TEFC1. Highest motor efficiency is 92.8% at 75% of
the full-load current.2. Electricity rate, US$ 0.17291/kW-Hr3. Operating hours = 7,000
8. Motor Efficiency and Motor Loada. EfficiencySamatic = 92.8% b. Motor Design LoadSamatic = 75%c. EfficiencyConv = 84.1%d. Motor Design Loadconv = 100%
9. Formula9.1. PConsumed= (kW / Efficiency) x Operating Hours x Motor Design Load, %9.2. Power Cost = Pconsumed x Electricity Rate9.3. PowerLoss = Pconv - PSamatic
9.3. FinancialLoss = PowerLoss x Electricity Rate
Calculations
Pconsumed, conv = (7.5 kW/84.1%) x 7,000 hours x 100% = 62,426 kW-Hrs
Pconsumed, Samatic = (7.5 kW/92.8%) x 7,000 hours x 75% = 42,430 kW-HrsPowerLoss = (Pconsumed, conv) – (Pconsumed,Samatic) = 19,996 kW-hoursFinancialLoss = PowerLoss x Electricity Rate = 19,996 kW-Hrs x US$ 0.17291/kW-Hr = US$ 3,457.00
4. Unequal turns/coil and/or mean-length of turn increase load of the motor >100% of its full load current.. Motor efficiency at 100% FLC is 91.7%.
5. Rewindconventional, Price = US$ 220.006. RewindSamatic, Price = US$ 303.00 7. Turns/coil and/or Mean-length of turn are
not equal; the motor efficiency is reduced by 7.6% and operating >100% of its motor load, equivalent to 84.1%.
Conclusion
Quality workmanship is seldom considered in making decisions. The lowest bidder is always the basis in awarding the rewinding works. The rewinding cost using conventional method is very cheap but the overall operating cost is much higher as shown by Financial Loss of US$ 3,457.00. “Cheap motor rewinding price ⇒ ends up high operating cost”.
At 7000 operating hours per year, the financial losses is quite high and it is worth to consider buying a new HEM worth US$ 1,236.00 + freight and taxes. If there are offers lower than the price mentioned, be careful to buy from a reliable and trusted supplier. A 5.6kW with Frame 215T maybe overlook as 7.5kW and of course with same frame number. Motor dimensions are exactly the same, but of different capacity!!
70

Energy Efficiency Improvements for Motor & Its Drive Systems
Section 7
<<
Why Asset Management For Electric Motors?1
In the continuous stress of a production environment, there is often little opportunity to pause and reconsider the way in which electric motors are purchased, maintained, and replaced. As long as nobody is given the responsibility for company-wide electric motor asset management, employees in the production environment will continue to act on an ad hoc basis, maintaining, repairing, and replacing motors in the same way they have in the past, without insight into the Total Cost of Ownership. The obvious driver for change usually escapes notice since the losses that are generated by a sub-optimal motor are scattered among different cost centres: energy consumption, material waste, lost revenue, extra working hours, reduced productivity, reduced production quality, et cetera. By assigning an individual — either inside the company or outsourced — to electric motor asset management, electric motors will receive the focus they deserve.
The Advantages Of Motor Asset Management
1) Improved energy efficiency: New motors have to meet the Minimum Efficiency Performance Standards (MEPS) of the EU. As a result, new motors are more energy efficient than motors currently in service. For motors with significant load variations, a Variable Speed Drive (VSD) can further increase the operational efficiency of the motor. The total efficiency gain can make a significant difference on the annual energy consumption of the site. This alone will justify early motor replacement in most cases.
2) Reduced maintenance costs: Trending motor performance over time enables the prediction of the next service intervals. Improved planning and reduced outage time will reduce overall maintenance costs.
3) Reduced risk of unplanned outages: Asset management incorporating motor replacement before failure greatly reduces the risk of unplanned outages. Unplanned outages can have an impact in many ways. In manufacturing, for example, they can slow down production, destroy goods, lead to equipment damage and additional maintenance, and leave the involved staff idle until the line is running again. In refrigeration rooms, a failure of a cooling system motor can allow the temperature rise to the level where all stored goods are lost. In offices, outages of the HVAC system due to motor failure will affect the productivity of the staff as well as the quality of their work. With motor asset management, the risk for all of these types of losses due to unexpected motor failure is reduced to a minimum.
4) TCO minimized: Asset management aims at a minimum Total Cost of Ownership (TCO) for the motor. It is not just the purchasing and installation cost that must be taken into account; the energy consumption, production efficiency, maintenance costs, and the market value of the motor at its economic end-of-life are factors as well.
1Cu0104-Electric Motor Asset Management
71
Energy Efficiency Improvements for Motor & Its Drive Systems
Section 7
<<
CASE STUDIES – REPLACEMENT OF STANDARD MOTOR TO HIGH EFFICIENCY MOTOR
At a Glance
Evergreen Fiberboard Berhad manufactures Medium Density Fiberboard (MDF) and related products such as knock down furniture, Veneered MDF and Coated Embossed MDF. It has a total production capacity of 230,000 m3 per annum of plain MDF and MDF products. The manufacturing facility’s estimated annual electricity cost is about US$ 4,529,100. Their active involvement in this Case Study demonstrates their commitment to use energy efficiency.
At Evergreen Fiberboard Bhd, a 10-year-old 37 kW rated motor driving the boiler feed water pump for the manufacturing process was selected for the case study. The cost of purchasing and installing the new HEM was fully borne by Evergreen Fiberboard Bhd.
The motor’s parameters were measured under actual load conditions. The motor was then replaced with a suitable High Efficiency Motor (HEM) for measurements under the same conditions.
The HEM reduced energy consumption by 3.8%. For this plant’s operating setup and electricity rates the energy saving would mean an annual cost saving of US$ 485.
This case study also demonstrates the successful application of tax incentives on imported energy efficiency equipment.
Project Overview
As part of Suruhanjaya Tenaga’s energy efficiency promotion campaign, the case study was
undertaken to demonstrate that using HEM’s in manufacturing facilities in Malaysia can result in substantial energy saving thereby reduce utility and production costs and enhancing the competitiveness of the Malaysian manufacturers.
Examples of installations where energy cost savings have been realized using HEMs have been documented by equipment suppliers and users all over the world. Some of these examples have been based on data collected by the equipment suppliers, and on high electricity tariffs. The objective of the conducting case studies in Malaysia is to demonstrate the value of HEMs for reducing energy costs and making businesses more competitive in the Malaysian industries. The case study was undertaken by an independent energy consultant.
Evergreen Fiberboard Bhd was one of the manufacturing companies from diverse industries selected for the study. One Standard Motor in their facility was replaced with a HEM. Accurate equipment and appropriate procedures were used to measure the energy consumption.
Objectives
The study was undertaken between October and November 2004 to meet the following objectives:
• To demonstrate the technical and financial viability of installing HEMs.
• To conduct an actual energy use comparison between standard motor and HEM installed at site under local conditions.
• To assess the potential energy and cost savings for Evergreen Fiberboard Bhd plant if all the relevant standard motors with continuous loading were replaced by equivalent HEMs.
72
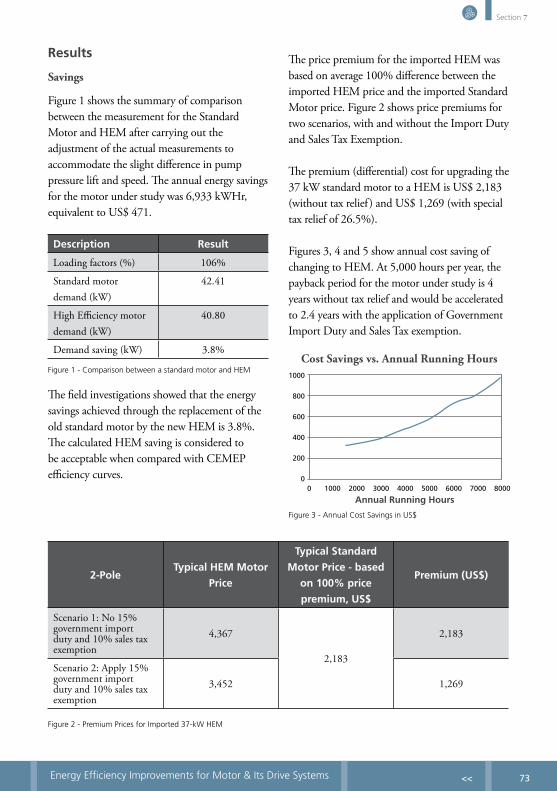
Energy Efficiency Improvements for Motor & Its Drive Systems
Section 7
<<
Results
Savings
Figure 1 shows the summary of comparison between the measurement for the Standard Motor and HEM after carrying out the adjustment of the actual measurements to accommodate the slight difference in pump pressure lift and speed. The annual energy savings for the motor under study was 6,933 kWHr, equivalent to US$ 471.
The field investigations showed that the energy savings achieved through the replacement of the old standard motor by the new HEM is 3.8%. The calculated HEM saving is considered to be acceptable when compared with CEMEP efficiency curves.
Description Result
Loading factors (%) 106%
Standard motor demand (kW)
42.41
High Efficiency motor demand (kW)
40.80
Demand saving (kW) 3.8%
Figure 1 - Comparison between a standard motor and HEM
The price premium for the imported HEM was based on average 100% difference between the imported HEM price and the imported Standard Motor price. Figure 2 shows price premiums for two scenarios, with and without the Import Duty and Sales Tax Exemption.
The premium (differential) cost for upgrading the 37 kW standard motor to a HEM is US$ 2,183 (without tax relief) and US$ 1,269 (with special tax relief of 26.5%).
Figures 3, 4 and 5 show annual cost saving of changing to HEM. At 5,000 hours per year, the payback period for the motor under study is 4 years without tax relief and would be accelerated to 2.4 years with the application of Government Import Duty and Sales Tax exemption.
2-PoleTypical HEM Motor
Price
Typical Standard
Motor Price - based
on 100% price
premium, US$
Premium (US$)
Scenario 1: No 15% government import duty and 10% sales tax exemption
4,367
2,183
2,183
Scenario 2: Apply 15% government import duty and 10% sales tax exemption
3,452 1,269
Figure 2 - Premium Prices for Imported 37-kW HEM
1000
800
600
400
200
01000 2000 3000 4000 5000 6000 7000 8000 0
Figure 3 - Annual Cost Savings in US$
Annual Running Hours
Cost Savings vs. Annual Running Hours
73

Energy Efficiency Improvements for Motor & Its Drive Systems
Section 7
<<
The annual cost savings for the motor under study was US$ 471, based on 4380 hours per year. Longer running hours will, of course, offset the price premium even more quickly by increasing the amount of energy saved.
Considering a motor life span of 15 years, the Return On Investment (ROI) on the motor price premium would be 30% with tax relief and 15% without tax relief.
Findings
Due to different types of motors installed with different efficiencies, an average of 3% increment in HEM efficiency is used to assess the potential cost savings for the whole Evergreen Fiberboard Bhd plant.
Using an average of 3% increment in HEM efficiency, Evergreen Fiberboard Bhd would be able to save approximately 420,000 kWh per annum if all the medium size range 11 – 99 kW standard motors are replaced with equivalent HEMs. This equals to a saving of US$ 28,533.30 per annum at US$ 0.06794 per kWh.
Conclusions
For purchase of new motors to replace failed motors, the investment cost premium of HEMs, in relation to standard motors, can be recovered
3000 4000 5000 6000 7000 8000
8
6
4
2
0
7
5
3
1
SPP, without government import duty and sales tax exemption
SPP, with government import duty and sales tax exemption
Figure 4 - Relationship between the SPP and the Annual Motor Operating Hours for different scenarios
Annual Running Hours
Sim
ple
Pay
bac
k Pe
rio
d
SPP
(yea
rs)
within a short period. It would take a longer time to recover the investment cost if working standard motors are to be replaced with new HEMs, especially in cases where the efficiency improvement is of the order of 3%.
Comments from Evergreen Fiberboard Bhd“This case study has demonstrated that energy efficiency is an effective cost saving tool. As a consideration user of electricity, we would look at all angles, ways and means to reduce the power consumption in our factory as it is one of the biggest cost incurred by us. By reducing the power cost, we can speed it in a more beneficial way. We look forward to using more high efficiency motors and power saving gadgets. We would closely work with all parties to further reduce the power consumption in our factory. We will work toward the government goal of saving electricity”.
Christopher Blaise Marshall, Factory ManagerEvergreen Fiberboard BhdPlo 22, Parti Raja Industrial Estate86400 Parit RajahBatu Pahat, Johor, Malaysia
3000 4000 5000 6000 7000 8000
60%
40%
20%
0%
70%
50%
30%
10%
Ret
urn
in In
vest
men
t (R
OI)
Annual Running Hours
ROI, without government import duty and sales tax exemption
ROI, with government import duty and sales tax exemption
Figure 5 - Relationship between the ROI and the Annual Motor Operating Hours for different scenarios
74
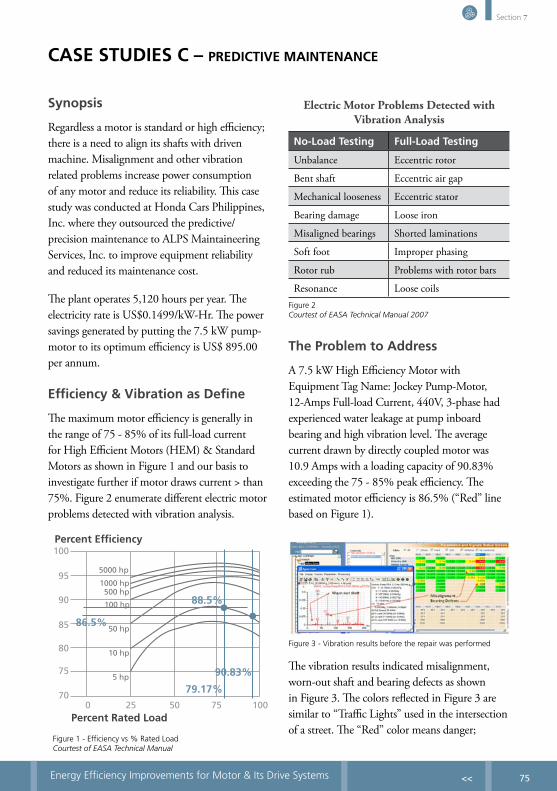
Energy Efficiency Improvements for Motor & Its Drive Systems
Section 7
<<
Synopsis
Regardless a motor is standard or high efficiency; there is a need to align its shafts with driven machine. Misalignment and other vibration related problems increase power consumption of any motor and reduce its reliability. This case study was conducted at Honda Cars Philippines, Inc. where they outsourced the predictive/precision maintenance to ALPS Maintaineering Services, Inc. to improve equipment reliability and reduced its maintenance cost.
The plant operates 5,120 hours per year. The electricity rate is US$0.1499/kW-Hr. The power savings generated by putting the 7.5 kW pump-motor to its optimum efficiency is US$ 895.00 per annum.
Efficiency & Vibration as Define
The maximum motor efficiency is generally in the range of 75 - 85% of its full-load current for High Efficient Motors (HEM) & Standard Motors as shown in Figure 1 and our basis to investigate further if motor draws current > than 75%. Figure 2 enumerate different electric motor problems detected with vibration analysis.
CASE STUDIES C – PREDICTIVE MAINTENANCE
The Problem to Address
A 7.5 kW High Efficiency Motor with Equipment Tag Name: Jockey Pump-Motor, 12-Amps Full-load Current, 440V, 3-phase had experienced water leakage at pump inboard bearing and high vibration level. The average current drawn by directly coupled motor was 10.9 Amps with a loading capacity of 90.83% exceeding the 75 - 85% peak efficiency. The estimated motor efficiency is 86.5% (“Red” line based on Figure 1).
25 50 75 1000
75
80
85
90
70
95
100
79.17%
90.83%
88.5%
86.5%
Percent Efficiency
Percent Rated Load
5 hp
10 hp
50 hp
100 hp
500 hp1000 hp
5000 hp
Figure 1 - Efficiency vs % Rated LoadCourtest of EASA Technical Manual
No-Load Testing Full-Load Testing
Unbalance Eccentric rotor
Bent shaft Eccentric air gap
Mechanical looseness Eccentric stator
Bearing damage Loose iron
Misaligned bearings Shorted laminations
Soft foot Improper phasing
Rotor rub Problems with rotor bars
Resonance Loose coils
Electric Motor Problems Detected with Vibration Analysis
Figure 3 - Vibration results before the repair was performed
The vibration results indicated misalignment, worn-out shaft and bearing defects as shown in Figure 3. The colors reflected in Figure 3 are similar to “Traffic Lights” used in the intersection of a street. The “Red” color means danger;
Figure 2Courtest of EASA Technical Manual 2007
75

Energy Efficiency Improvements for Motor & Its Drive Systems
Section 7
<<
Figure 4 - Motot draws 97.9 Watts with aligned shafts
Figure 5 - Motor drawn 122.1 watts with misaligned shaft.
Courtesy of Rotating Equipment Specialists, LLC
The vibration results indicated misalignment, worn-out shaft and bearing defects as shown in Figure 3. The colors reflected in Figure 3 are similar to “Traffic Lights” used in the intersection of a street. The “Red” color means danger; “Yellow” means warning; and “Green” means go or okay.
Perceptions on Flexible Couplings
Flexible couplings can also reduce vibration transmitted from one piece of equipment to another, and some can insulate the driven equipment shaft against stray electrical currents. Even flexible couplings require a minimal alignment, defined in the instruction sheet for the coupling.
It is a mistake to take advantage of coupling flexibility for excessive misalignment, as flexing of the coupling and of the shaft will impose forces on the motor and driven-equipment bearings. Effects of these forces include premature bearing, seal, or coupling failures, shaft breaking or cracking, and excessive radial and axial vibrations. Secondary effects include loosening of foundation bolts, and loose or broken coupling bolts. Operating life is shortened whenever shafts are misaligned.
The Results Of Vibration Analysis
There were many components damaged in the pump as shown in Figure 6. Lucky enough the motor was not affected severely.
The Corrective Maintenance
The motor bearings were replaced using professional bearing tools. The pump shaft, mechanical seal, and bearings were also replaced. The unit was assembled and aligned using Fixturlaser GO Alignment System as shown in Figure 7. The alignment results shown by Figure 8 were excellent based on 1000 – 2000 RPM alignment tolerance.
Figure 6 - Damaged components of Jockey Pump
“Yellow” means warning; and “Green” means go or okay.
Why Misalignment Draws More Current?
Regardless of High Efficiency Motor or Standard Motor, any misalignment on shaft of motor and its driven machine will generate stress to the shaft and bearings thereby increase power consumption as shown in Figure 4 and 5.
76
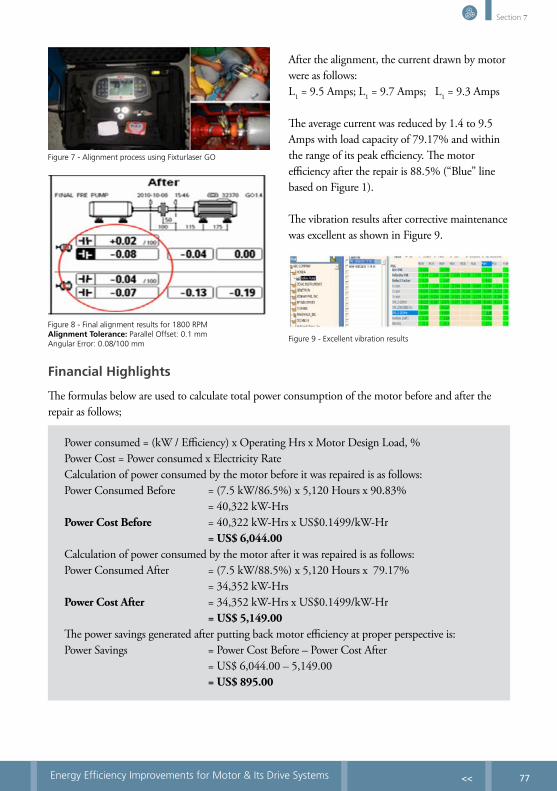
Energy Efficiency Improvements for Motor & Its Drive Systems
Section 7
<<
After the alignment, the current drawn by motor were as follows:L1 = 9.5 Amps; L1 = 9.7 Amps; L1 = 9.3 Amps
The average current was reduced by 1.4 to 9.5 Amps with load capacity of 79.17% and within the range of its peak efficiency. The motor efficiency after the repair is 88.5% (“Blue” line based on Figure 1).
The vibration results after corrective maintenance was excellent as shown in Figure 9.
Figure 7 - Alignment process using Fixturlaser GO
Figure 8 - Final alignment results for 1800 RPM Alignment Tolerance: Parallel Offset: 0.1 mmAngular Error: 0.08/100 mm
Figure 9 - Excellent vibration results
Financial Highlights
The formulas below are used to calculate total power consumption of the motor before and after the repair as follows;
Power consumed = (kW / Efficiency) x Operating Hrs x Motor Design Load, %Power Cost = Power consumed x Electricity RateCalculation of power consumed by the motor before it was repaired is as follows:Power Consumed Before = (7.5 kW/86.5%) x 5,120 Hours x 90.83% = 40,322 kW-HrsPower Cost Before = 40,322 kW-Hrs x US$0.1499/kW-Hr = US$ 6,044.00Calculation of power consumed by the motor after it was repaired is as follows:Power Consumed After = (7.5 kW/88.5%) x 5,120 Hours x 79.17% = 34,352 kW-HrsPower Cost After = 34,352 kW-Hrs x US$0.1499/kW-Hr = US$ 5,149.00The power savings generated after putting back motor efficiency at proper perspective is:Power Savings = Power Cost Before – Power Cost After = US$ 6,044.00 – 5,149.00 = US$ 895.00
77

Energy Efficiency Improvements for Motor & Its Drive Systems
Section 7
<<
Whether to invest in predictive maintenance and precision instruments or outsource to a third party is for Honda Cars Philippines, Inc. to decide and of course depending on the maintenance agreement. In this particular case, all repair works are covered by a separate purchase order.
Honda Cars has more than 308 motor drives and estimated 85 of these units are directly coupled ranging from 7.5 to 56 kW. Let’s take
US$ 895.00 as minimum savings for 85 units to give us an idea whether or not to invest in predictive / precision maintenance instruments.
Figure 10 is the Relevant Project Cash Flow of US$ 88,161; Figure 11 is the Terminal Cash Flow and Net Investment for the purchase of maintenance instruments. Figure 12 is the Discounted Payback Period where the Net Investment Cost is recovered in first year period and save more money up to the fifth year.
Item# DescriptionPump (10 - 75 HP) Units
Per unit x 85 units
1 Annual savings in electricity bill 895 76,075
2 Annual savings in maintenance (labor, spare parts & materials) 346 29,426
3 Annual depreciation (658) (55,916)
4 Revenues 583 49,586
5 Taxes @35% (204) (17,355)
6 Net project income 379 32,231
7 Add back depreciation (non-cash item - itme3) 658 55,930
8 Relevant project cash fow $1,037 $88,161
Figure 10 - Relevant Project Cash Flow
Item# Description Cost
9 Estimated salvage amount of instruments in 5 years 15,579
10 Less taxes %35% (5,452)
11 Terminal cash flow 10,126
Figure 11 - Terminal Cash Flow & Investment
Item# Predicitive/Precision Instrument Description Cost
12 Fixturlaser Go Pro 16,156
13 01dB-Metravib MVP-2C Vibration Analyzer 46,159
14 Net Investment $62,314
78

Energy Efficiency Improvements for Motor & Its Drive Systems
Section 7
<<
Conclusion1
In the continuous stress of a production environment, there is often little opportunity to pause and reconsider the way in which electric motors are purchased, maintained, and replaced. As long as nobody is given the responsibility for company-wide electric motor asset management, employees in the production environment will continue to act on an ad hoc basis, maintaining, repairing, and replacing motors in the same way they have in the past, without insight into the Total Cost of Ownership. The obvious driver for change usually escapes notice since the losses that are generated by a sub-optimal motor are scattered among different cost centers: energy consumption, material waste, lost revenue, extra working hours, reduced productivity, reduced production quality, et cetera. By assigning an individual — either inside the company or outsourced — to electric motor asset management, electric motors will receive the focus they deserve.
1ECI Publication No Cu0104
* Item 11 - Terminal Cash Flow
Figure 12 - Discounted Payback Period
YearProject Relevant
Cash Flow (a)P.V. Factor (b)
P.V. Cash Flow c = a x b
Total to Date
1 88,161 0.893 78,727 $78,727
2 88,161 0.797 70,264 $148,991
3 88,161 0.712 62,770 $211,762
4 88,161 0.636 56,070 $267,832
5 88,161 0.567 49,987 $317,819
6 10,126 0.567 5,741 $323,569
79