Embed Size (px)
Citation preview

Technical Review of Stocks
Update –– 30 May 2017 CIO Wealth Management Research
Peter Lee, Chief Technical Analyst, [email protected], +1-212-713-8888, ext.01
This report provides technical analysis on stocks that, we believe, are of a wide interest. This list is not a template for the construction of your personal portfolio. You should discuss investment decisions with your Financial Advisor. For more information about this report, see Description and Methodology in the Appendix. We would like to thank Praveen Dodda, an employee of Cognizant Group, for his assistance in preparing this research report. Cognizant staff provides research support services to UBS.
ab
This report has been prepared by UBS Financial Services Inc. (UBS FS). Analyst certification and required disclosuresbegin on page 32. UBS does and seeks to do business with companies covered in its research reports. As a result,investors should be aware that the firm may have a conflict of interest that could affect the objectivity of this report.Investors should consider this report as only a single factor in making their investment decision.
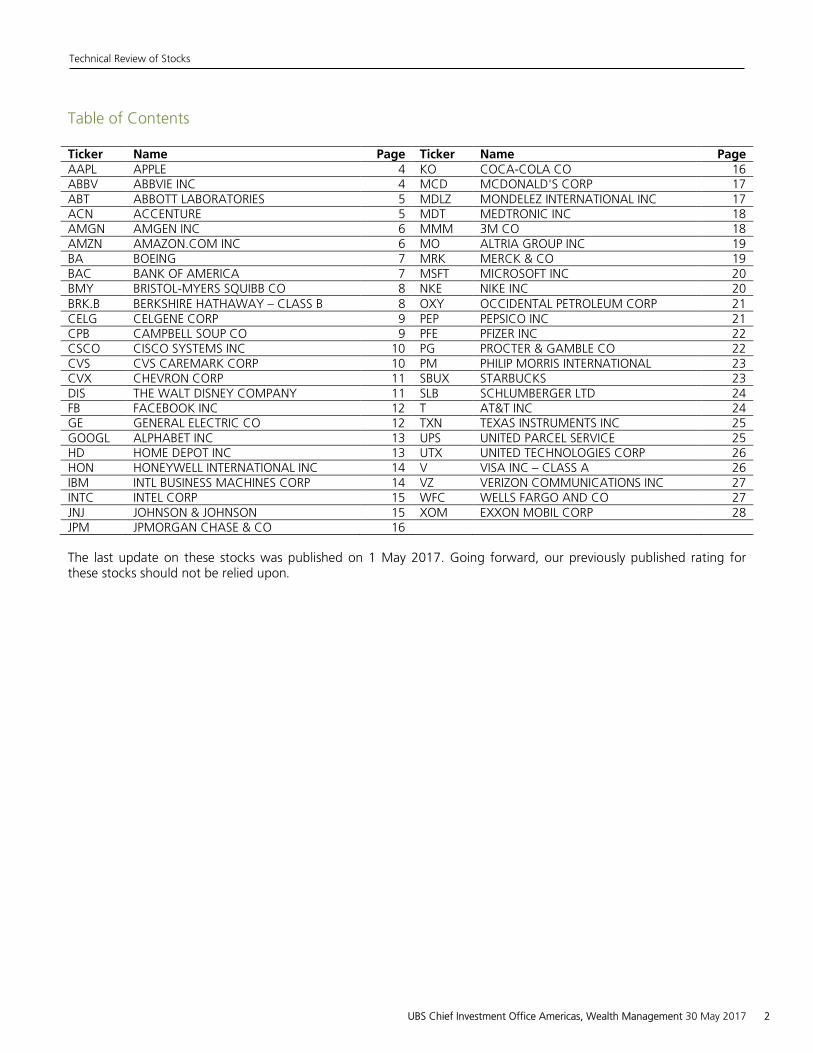
Table of Contents Ticker Name Page Ticker Name Page AAPL APPLE 4 KO COCA-COLA CO 16 ABBV ABBVIE INC 4 MCD MCDONALD'S CORP 17 ABT ABBOTT LABORATORIES 5 MDLZ MONDELEZ INTERNATIONAL INC 17 ACN ACCENTURE 5 MDT MEDTRONIC INC 18 AMGN AMGEN INC 6 MMM 3M CO 18 AMZN AMAZON.COM INC 6 MO ALTRIA GROUP INC 19 BA BOEING 7 MRK MERCK & CO 19 BAC BANK OF AMERICA 7 MSFT MICROSOFT INC 20 BMY BRISTOL-MYERS SQUIBB CO 8 NKE NIKE INC 20 BRK.B BERKSHIRE HATHAWAY – CLASS B 8 OXY OCCIDENTAL PETROLEUM CORP 21 CELG CELGENE CORP 9 PEP PEPSICO INC 21 CPB CAMPBELL SOUP CO 9 PFE PFIZER INC 22 CSCO CISCO SYSTEMS INC 10 PG PROCTER & GAMBLE CO 22 CVS CVS CAREMARK CORP 10 PM PHILIP MORRIS INTERNATIONAL 23 CVX CHEVRON CORP 11 SBUX STARBUCKS 23 DIS THE WALT DISNEY COMPANY 11 SLB SCHLUMBERGER LTD 24 FB FACEBOOK INC 12 T AT&T INC 24 GE GENERAL ELECTRIC CO 12 TXN TEXAS INSTRUMENTS INC 25 GOOGL ALPHABET INC 13 UPS UNITED PARCEL SERVICE 25 HD HOME DEPOT INC 13 UTX UNITED TECHNOLOGIES CORP 26 HON HONEYWELL INTERNATIONAL INC 14 V VISA INC – CLASS A 26 IBM INTL BUSINESS MACHINES CORP 14 VZ VERIZON COMMUNICATIONS INC 27 INTC INTEL CORP 15 WFC WELLS FARGO AND CO 27 JNJ JOHNSON & JOHNSON 15 XOM EXXON MOBIL CORP 28 JPM JPMORGAN CHASE & CO 16 The last update on these stocks was published on 1 May 2017. Going forward, our previously published rating for these stocks should not be relied upon.
Technical Review of Stocks
UBS Chief Investment Office Americas, Wealth Management 30 May 2017 2
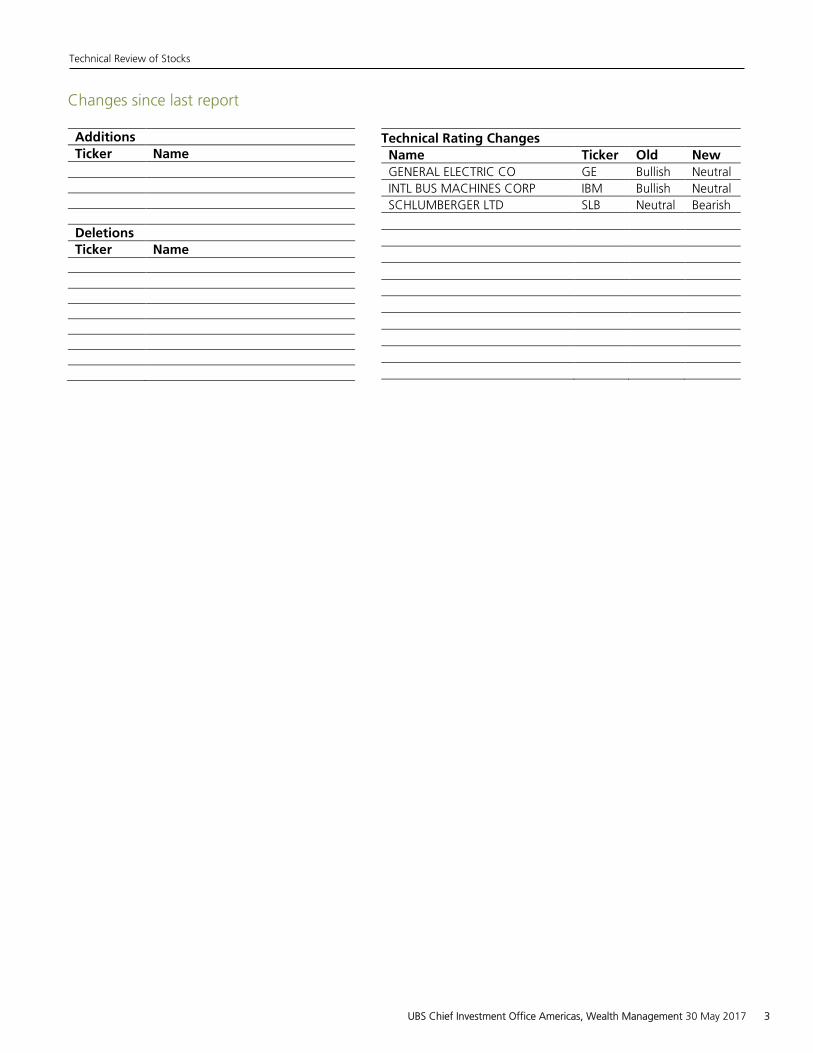
Changes since last report Additions
Ticker Name
Deletions
Ticker Name
Technical Rating Changes
Name Ticker Old New
GENERAL ELECTRIC CO GE Bullish Neutral
INTL BUS MACHINES CORP IBM Bullish Neutral
SCHLUMBERGER LTD SLB Neutral Bearish
Technical Review of Stocks
UBS Chief Investment Office Americas, Wealth Management 30 May 2017 3
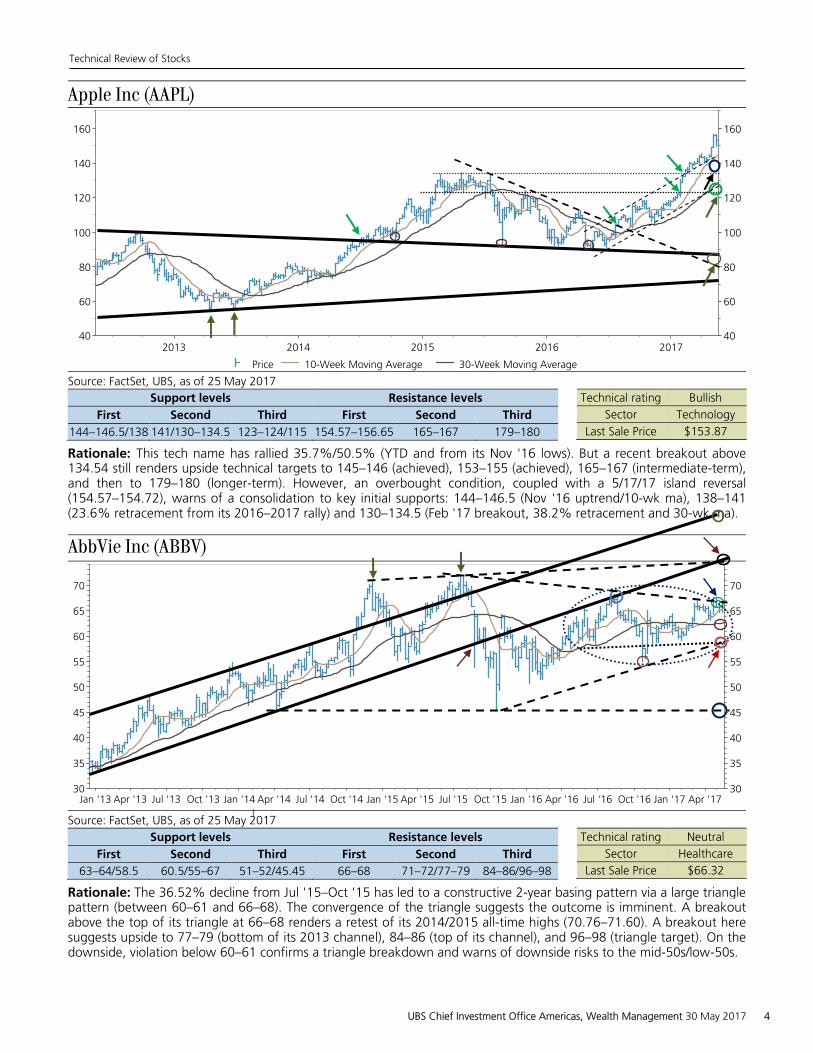
Apple Inc (AAPL)
2013 2014 2015 2016 20174040
6060
8080
100100
120120
140140
160160
Price 10-Week Moving Average 30-Week Moving Average
Source: FactSet, UBS, as of 25 May 2017 Support levels Resistance levels
First Second Third First Second Third
144–146.5/138 141/130–134.5 123–124/115 154.57–156.65 165–167 179–180
Technical rating Bullish
Sector Technology
Last Sale Price $153.87
Rationale: This tech name has rallied 35.7%/50.5% (YTD and from its Nov '16 lows). But a recent breakout above 134.54 still renders upside technical targets to 145–146 (achieved), 153–155 (achieved), 165–167 (intermediate-term),and then to 179–180 (longer-term). However, an overbought condition, coupled with a 5/17/17 island reversal (154.57–154.72), warns of a consolidation to key initial supports: 144–146.5 (Nov '16 uptrend/10-wk ma), 138–141(23.6% retracement from its 2016–2017 rally) and 130–134.5 (Feb '17 breakout, 38.2% retracement and 30-wk ma).
AbbVie Inc (ABBV)
Jan '13 Apr '13 Jul '13 Oct '13 Jan '14 Apr '14 Jul '14 Oct '14 Jan '15 Apr '15 Jul '15 Oct '15 Jan '16 Apr '16 Jul '16 Oct '16 Jan '17 Apr '173030
3535
4040
4545
5050
5555
6060
6565
7070
Price 10-Week Moving Average 30-Week Moving AverageSource: FactSet, UBS, as of 25 May 2017
Support levels Resistance levels
First Second Third First Second Third
63–64/58.5 60.5/55–67 51–52/45.45 66–68 71–72/77–79 84–86/96–98
Technical rating Neutral
Sector Healthcare
Last Sale Price $66.32
Rationale: The 36.52% decline from Jul '15–Oct '15 has led to a constructive 2-year basing pattern via a large triangle pattern (between 60–61 and 66–68). The convergence of the triangle suggests the outcome is imminent. A breakout above the top of its triangle at 66–68 renders a retest of its 2014/2015 all-time highs (70.76–71.60). A breakout here suggests upside to 77–79 (bottom of its 2013 channel), 84–86 (top of its channel), and 96–98 (triangle target). On the downside, violation below 60–61 confirms a triangle breakdown and warns of downside risks to the mid-50s/low-50s.
Technical Review of Stocks
UBS Chief Investment Office Americas, Wealth Management 30 May 2017 4
Abbott Laboratories (ABT)
2013 2014 2015 2016 20172525
3030
3535
4040
4545
5050
Source: FactSet, UBS, as of 25 May 2017 Support levels Resistance levels
First Second Third First Second Third
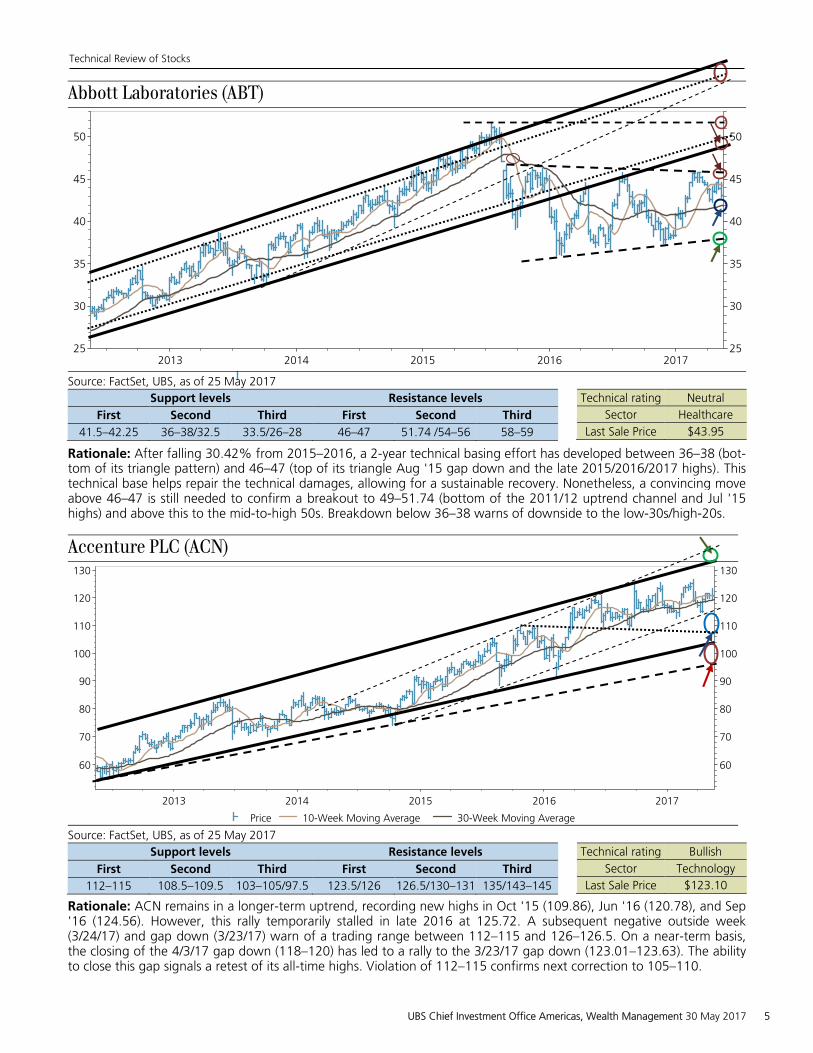
41.5–42.25 36–38/32.5 33.5/26–28 46–47 51.74 /54–56 58–59
Technical rating Neutral
Sector Healthcare
Last Sale Price $43.95
Rationale: After falling 30.42% from 2015–2016, a 2-year technical basing effort has developed between 36–38 (bot-tom of its triangle pattern) and 46–47 (top of its triangle Aug '15 gap down and the late 2015/2016/2017 highs). This technical base helps repair the technical damages, allowing for a sustainable recovery. Nonetheless, a convincing move above 46–47 is still needed to confirm a breakout to 49–51.74 (bottom of the 2011/12 uptrend channel and Jul '15 highs) and above this to the mid-to-high 50s. Breakdown below 36–38 warns of downside to the low-30s/high-20s.
Accenture PLC (ACN)
2013 2014 2015 2016 2017
6060
7070
8080
9090
100100
110110
120120
130130
Price 10-Week Moving Average 30-Week Moving Average
Source: FactSet, UBS, as of 25 May 2017 Support levels Resistance levels
First Second Third First Second Third
112–115 108.5–109.5 103–105/97.5 123.5/126 126.5/130–131 135/143–145
Technical rating Bullish
Sector Technology
Last Sale Price $123.10
Rationale: ACN remains in a longer-term uptrend, recording new highs in Oct '15 (109.86), Jun '16 (120.78), and Sep '16 (124.56). However, this rally temporarily stalled in late 2016 at 125.72. A subsequent negative outside week (3/24/17) and gap down (3/23/17) warn of a trading range between 112–115 and 126–126.5. On a near-term basis, the closing of the 4/3/17 gap down (118–120) has led to a rally to the 3/23/17 gap down (123.01–123.63). The ability to close this gap signals a retest of its all-time highs. Violation of 112–115 confirms next correction to 105–110.
Technical Review of Stocks
UBS Chief Investment Office Americas, Wealth Management 30 May 2017 5
Amgen Inc. (AMGN)
2013 2014 2015 2016 2017
6060
8080
100100
120120
140140
160160
180180
200200
Price 10-Week Moving Average 30-Week Moving Average
Source: FactSet, UBS, as of 25 May 2017 Support levels Resistance levels
First Second Third First Second Third
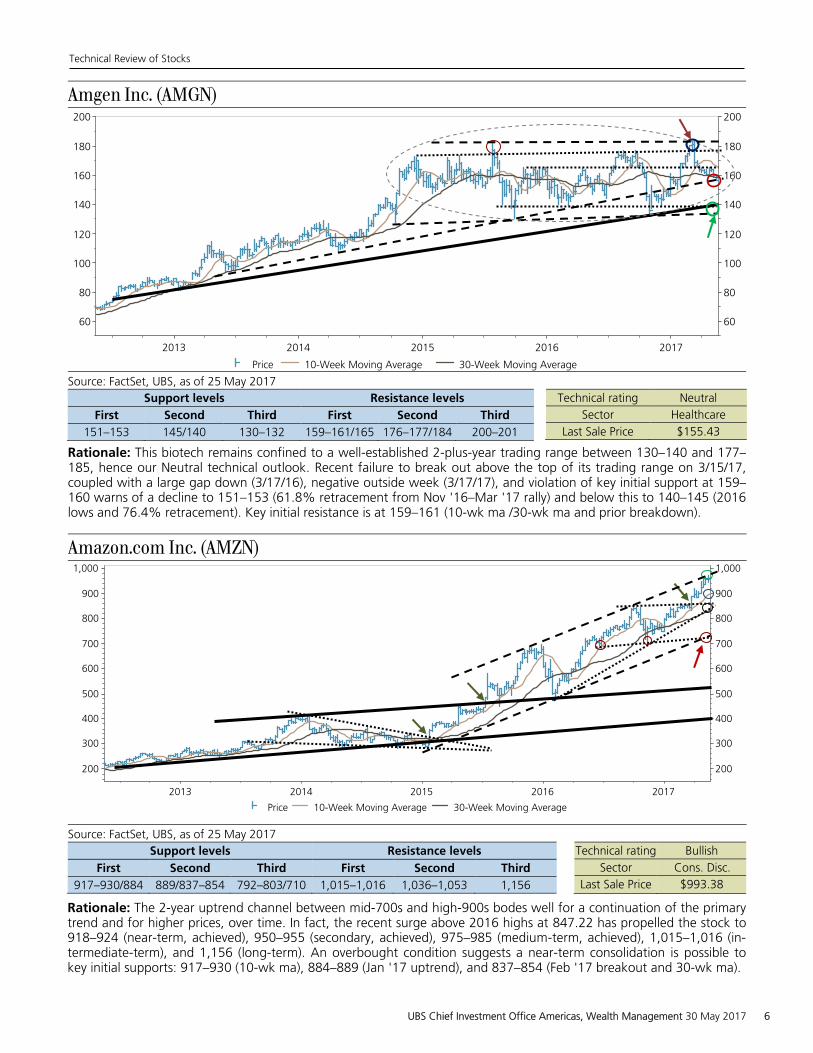
151–153 145/140 130–132 159–161/165 176–177/184 200–201
Technical rating Neutral
Sector Healthcare
Last Sale Price $155.43
Rationale: This biotech remains confined to a well-established 2-plus-year trading range between 130–140 and 177–185, hence our Neutral technical outlook. Recent failure to break out above the top of its trading range on 3/15/17,coupled with a large gap down (3/17/16), negative outside week (3/17/17), and violation of key initial support at 159–160 warns of a decline to 151–153 (61.8% retracement from Nov '16–Mar '17 rally) and below this to 140–145 (2016 lows and 76.4% retracement). Key initial resistance is at 159–161 (10-wk ma /30-wk ma and prior breakdown).
Amazon.com Inc. (AMZN)
2013 2014 2015 2016 2017
200200
300300
400400
500500
600600
700700
800800
900900
1,0001,000
Price 10-Week Moving Average 30-Week Moving Average
Source: FactSet, UBS, as of 25 May 2017 Support levels Resistance levels
First Second Third First Second Third
917–930/884 889/837–854 792–803/710 1,015–1,016 1,036–1,053 1,156
Technical rating Bullish
Sector Cons. Disc.
Last Sale Price $993.38
Rationale: The 2-year uptrend channel between mid-700s and high-900s bodes well for a continuation of the primary trend and for higher prices, over time. In fact, the recent surge above 2016 highs at 847.22 has propelled the stock to 918–924 (near-term, achieved), 950–955 (secondary, achieved), 975–985 (medium-term, achieved), 1,015–1,016 (in-termediate-term), and 1,156 (long-term). An overbought condition suggests a near-term consolidation is possible to key initial supports: 917–930 (10-wk ma), 884–889 (Jan '17 uptrend), and 837–854 (Feb '17 breakout and 30-wk ma).
Technical Review of Stocks
UBS Chief Investment Office Americas, Wealth Management 30 May 2017 6
Boeing (BA)
2013 2014 2015 2016 20176060
8080
100100
120120
140140
160160
180180
200200
Price 10-Week Moving Average 30-Week Moving Average
Source: FactSet, UBS, as of 25 May 2017 Support levels Resistance levels
First Second Third First Second Third
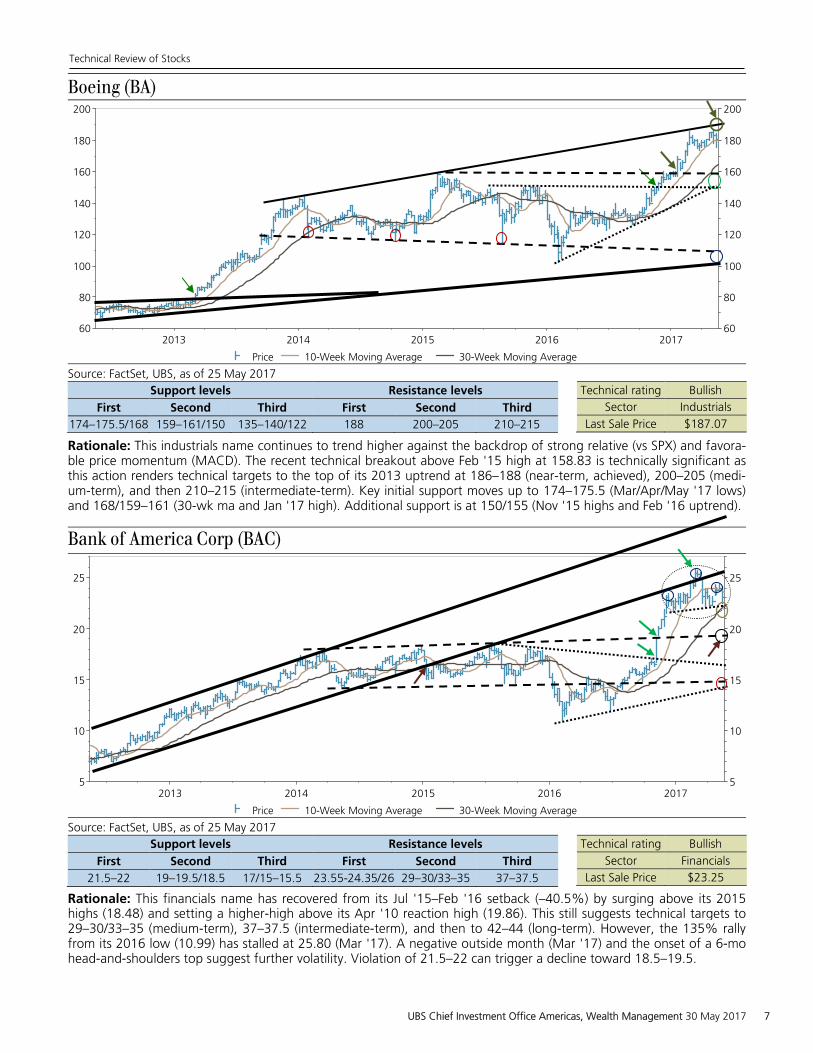
174–175.5/168 159–161/150 135–140/122 188 200–205 210–215
Technical rating Bullish
Sector Industrials
Last Sale Price $187.07
Rationale: This industrials name continues to trend higher against the backdrop of strong relative (vs SPX) and favora-ble price momentum (MACD). The recent technical breakout above Feb '15 high at 158.83 is technically significant as this action renders technical targets to the top of its 2013 uptrend at 186–188 (near-term, achieved), 200–205 (medi-um-term), and then 210–215 (intermediate-term). Key initial support moves up to 174–175.5 (Mar/Apr/May '17 lows) and 168/159–161 (30-wk ma and Jan '17 high). Additional support is at 150/155 (Nov '15 highs and Feb '16 uptrend).
Bank of America Corp (BAC)
2013 2014 2015 2016 201755
1010
1515
2020
2525
Price 10-Week Moving Average 30-Week Moving Average
Source: FactSet, UBS, as of 25 May 2017 Support levels Resistance levels
First Second Third First Second Third
21.5–22 19–19.5/18.5 17/15–15.5 23.55-24.35/26 29–30/33–35 37–37.5
Technical rating Bullish
Sector Financials
Last Sale Price $23.25
Rationale: This financials name has recovered from its Jul '15–Feb '16 setback (–40.5%) by surging above its 2015 highs (18.48) and setting a higher-high above its Apr '10 reaction high (19.86). This still suggests technical targets to 29–30/33–35 (medium-term), 37–37.5 (intermediate-term), and then to 42–44 (long-term). However, the 135% rally from its 2016 low (10.99) has stalled at 25.80 (Mar '17). A negative outside month (Mar '17) and the onset of a 6-mo head-and-shoulders top suggest further volatility. Violation of 21.5–22 can trigger a decline toward 18.5–19.5.
Technical Review of Stocks
UBS Chief Investment Office Americas, Wealth Management 30 May 2017 7
Bristol-Myers Squibb Co (BMY)
2013 2014 2015 2016 2017
3030
4040
5050
6060
7070
8080
Price 10-Week Moving Average 30-Week Moving Average
Source: FactSet, UBS, as of 25 May 2017 Support levels Resistance levels
First Second Third First Second Third
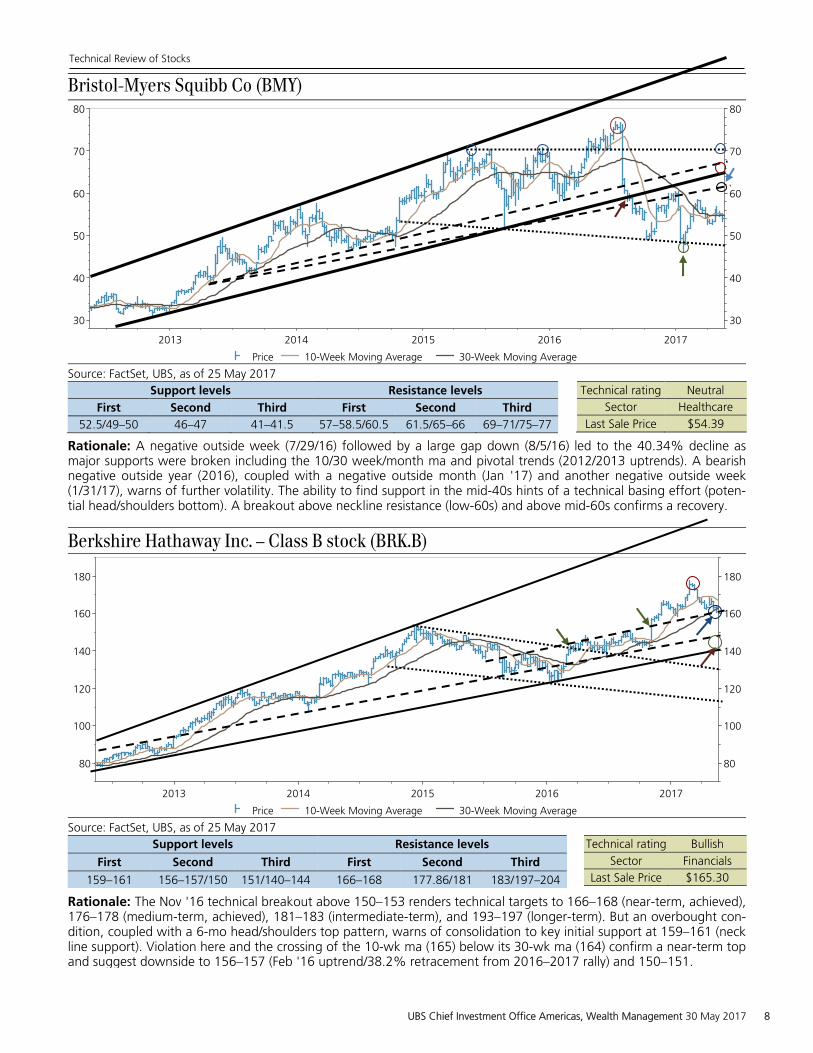
52.5/49–50 46–47 41–41.5 57–58.5/60.5 61.5/65–66 69–71/75–77
Technical rating Neutral
Sector Healthcare
Last Sale Price $54.39
Rationale: A negative outside week (7/29/16) followed by a large gap down (8/5/16) led to the 40.34% decline as major supports were broken including the 10/30 week/month ma and pivotal trends (2012/2013 uptrends). A bearish negative outside year (2016), coupled with a negative outside month (Jan '17) and another negative outside week (1/31/17), warns of further volatility. The ability to find support in the mid-40s hints of a technical basing effort (poten-tial head/shoulders bottom). A breakout above neckline resistance (low-60s) and above mid-60s confirms a recovery.
Berkshire Hathaway Inc. – Class B stock (BRK.B)
2013 2014 2015 2016 2017
8080
100100
120120
140140
160160
180180
Price 10-Week Moving Average 30-Week Moving Average
Source: FactSet, UBS, as of 25 May 2017 Support levels Resistance levels
First Second Third First Second Third
159–161 156–157/150 151/140–144 166–168 177.86/181 183/197–204
Technical rating Bullish
Sector Financials
Last Sale Price $165.30
Rationale: The Nov '16 technical breakout above 150–153 renders technical targets to 166–168 (near-term, achieved), 176–178 (medium-term, achieved), 181–183 (intermediate-term), and 193–197 (longer-term). But an overbought con-dition, coupled with a 6-mo head/shoulders top pattern, warns of consolidation to key initial support at 159–161 (neck line support). Violation here and the crossing of the 10-wk ma (165) below its 30-wk ma (164) confirm a near-term top and suggest downside to 156–157 (Feb '16 uptrend/38.2% retracement from 2016–2017 rally) and 150–151.
Technical Review of Stocks
UBS Chief Investment Office Americas, Wealth Management 30 May 2017 8
Celgene Corp. (CELG)
2013 2014 2015 2016 20172020
4040
6060
8080
100100
120120
140140
Price 10-Week Moving Average 30-Week Moving Average
Source: FactSet, UBS, as of 25 May 2017 Support levels Resistance levels
First Second Third First Second Third
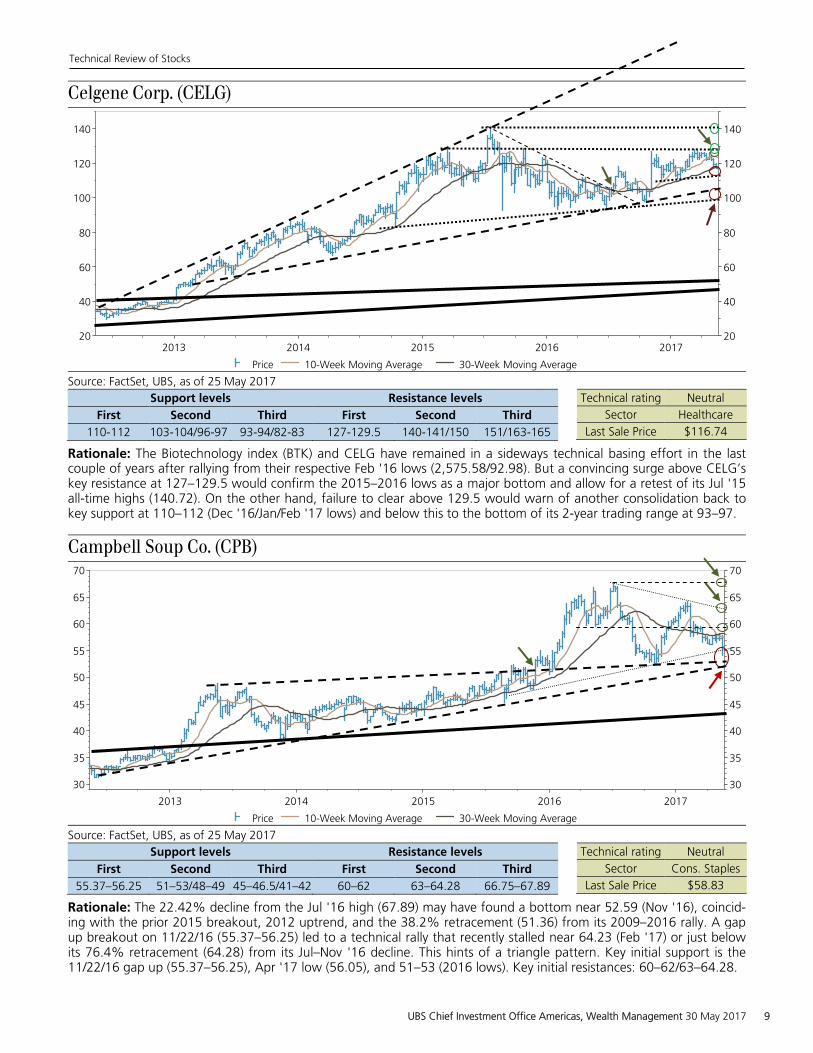
110-112 103-104/96-97 93-94/82-83 127-129.5 140-141/150 151/163-165
Technical rating Neutral
Sector Healthcare
Last Sale Price $116.74
Rationale: The Biotechnology index (BTK) and CELG have remained in a sideways technical basing effort in the last couple of years after rallying from their respective Feb '16 lows (2,575.58/92.98). But a convincing surge above CELG’s key resistance at 127–129.5 would confirm the 2015–2016 lows as a major bottom and allow for a retest of its Jul '15 all-time highs (140.72). On the other hand, failure to clear above 129.5 would warn of another consolidation back to key support at 110–112 (Dec '16/Jan/Feb '17 lows) and below this to the bottom of its 2-year trading range at 93–97.
Campbell Soup Co. (CPB)
2013 2014 2015 2016 2017
3030
3535
4040
4545
5050
5555
6060
6565
7070
Price 10-Week Moving Average 30-Week Moving Average
Source: FactSet, UBS, as of 25 May 2017 Support levels Resistance levels
First Second Third First Second Third
55.37–56.25 51–53/48–49 45–46.5/41–42 60–62 63–64.28 66.75–67.89
Technical rating Neutral
Sector Cons. Staples
Last Sale Price $58.83
Rationale: The 22.42% decline from the Jul '16 high (67.89) may have found a bottom near 52.59 (Nov '16), coincid-ing with the prior 2015 breakout, 2012 uptrend, and the 38.2% retracement (51.36) from its 2009–2016 rally. A gap up breakout on 11/22/16 (55.37–56.25) led to a technical rally that recently stalled near 64.23 (Feb '17) or just below its 76.4% retracement (64.28) from its Jul–Nov '16 decline. This hints of a triangle pattern. Key initial support is the 11/22/16 gap up (55.37–56.25), Apr '17 low (56.05), and 51–53 (2016 lows). Key initial resistances: 60–62/63–64.28.
Technical Review of Stocks
UBS Chief Investment Office Americas, Wealth Management 30 May 2017 9
Cisco Systems Inc (CSCO)
2013 2014 2015 2016 2017
1515
2020
2525
3030
3535
Price 10-Week Moving Average 30-Week Moving Average
Source: FactSet, UBS, as of 25 May 2017 Support levels Resistance levels
First Second Third First Second Third
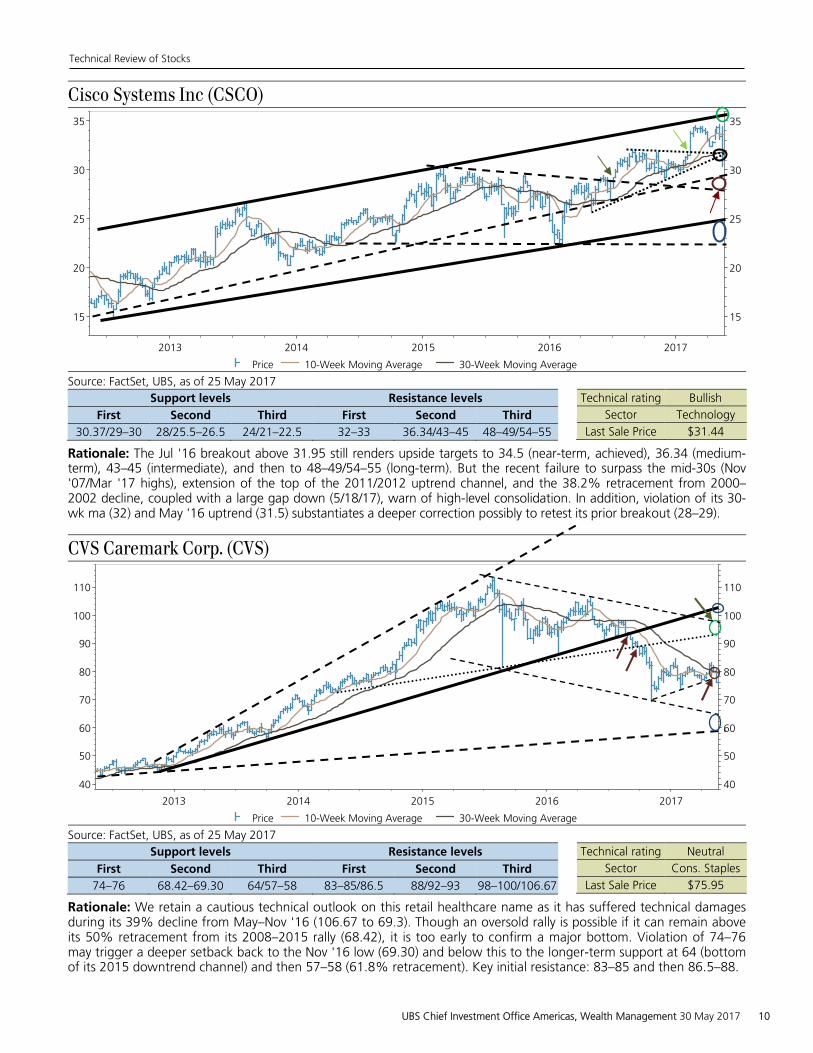
30.37/29–30 28/25.5–26.5 24/21–22.5 32–33 36.34/43–45 48–49/54–55
Technical rating Bullish
Sector Technology
Last Sale Price $31.44
Rationale: The Jul '16 breakout above 31.95 still renders upside targets to 34.5 (near-term, achieved), 36.34 (medium-term), 43–45 (intermediate), and then to 48–49/54–55 (long-term). But the recent failure to surpass the mid-30s (Nov '07/Mar '17 highs), extension of the top of the 2011/2012 uptrend channel, and the 38.2% retracement from 2000–2002 decline, coupled with a large gap down (5/18/17), warn of high-level consolidation. In addition, violation of its 30-wk ma (32) and May '16 uptrend (31.5) substantiates a deeper correction possibly to retest its prior breakout (28–29).
CVS Caremark Corp. (CVS)
2013 2014 2015 2016 2017
4040
5050
6060
7070
8080
9090
100100
110110
Price 10-Week Moving Average 30-Week Moving Average
Source: FactSet, UBS, as of 25 May 2017 Support levels Resistance levels
First Second Third First Second Third
74–76 68.42–69.30 64/57–58 83–85/86.5 88/92–93 98–100/106.67
Technical rating Neutral
Sector Cons. Staples
Last Sale Price $75.95
Rationale: We retain a cautious technical outlook on this retail healthcare name as it has suffered technical damages during its 39% decline from May–Nov '16 (106.67 to 69.3). Though an oversold rally is possible if it can remain above its 50% retracement from its 2008–2015 rally (68.42), it is too early to confirm a major bottom. Violation of 74–76 may trigger a deeper setback back to the Nov '16 low (69.30) and below this to the longer-term support at 64 (bottom of its 2015 downtrend channel) and then 57–58 (61.8% retracement). Key initial resistance: 83–85 and then 86.5–88.
Technical Review of Stocks
UBS Chief Investment Office Americas, Wealth Management 30 May 2017 10
Chevron Corp (CVX)
2013 2014 2015 2016 2017
7070
8080
9090
100100
110110
120120
130130
Source: FactSet, UBS, as of 25 May 2017 Support levels Resistance levels
First Second Third First Second Third
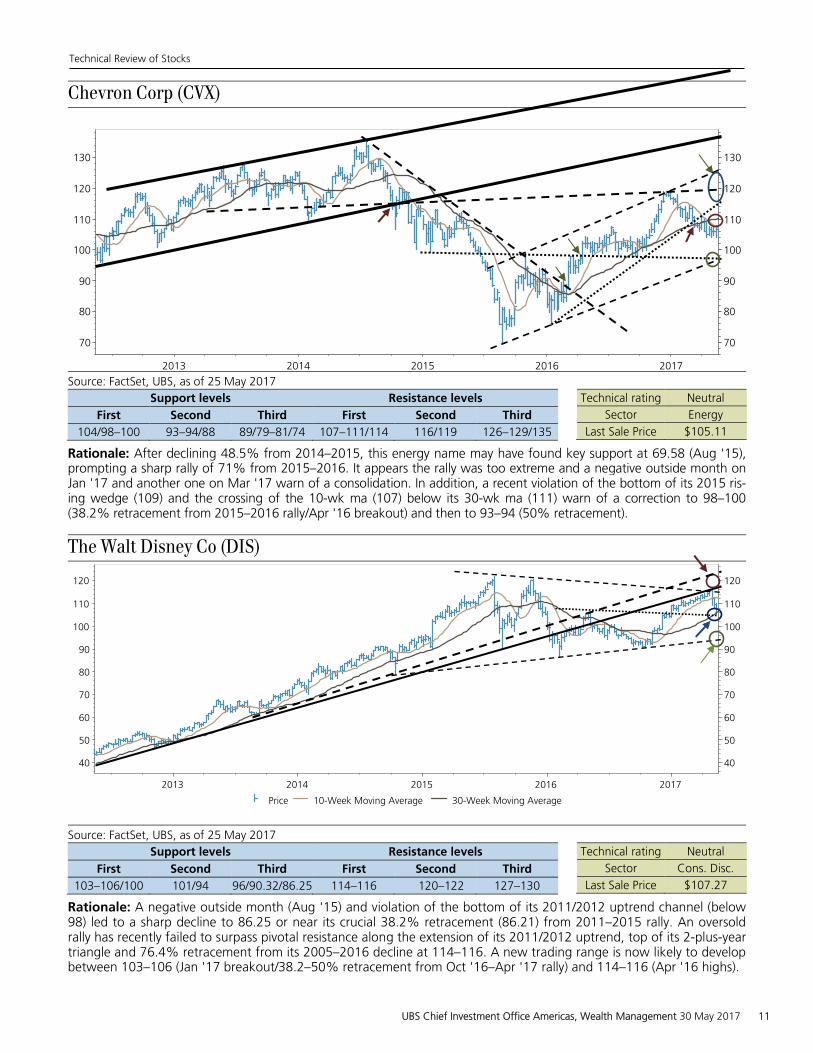
104/98–100 93–94/88 89/79–81/74 107–111/114 116/119 126–129/135
Technical rating Neutral
Sector Energy
Last Sale Price $105.11
Rationale: After declining 48.5% from 2014–2015, this energy name may have found key support at 69.58 (Aug '15), prompting a sharp rally of 71% from 2015–2016. It appears the rally was too extreme and a negative outside month on Jan '17 and another one on Mar '17 warn of a consolidation. In addition, a recent violation of the bottom of its 2015 ris-ing wedge (109) and the crossing of the 10-wk ma (107) below its 30-wk ma (111) warn of a correction to 98–100 (38.2% retracement from 2015–2016 rally/Apr '16 breakout) and then to 93–94 (50% retracement).
The Walt Disney Co (DIS)
2013 2014 2015 2016 2017
4040
5050
6060
7070
8080
9090
100100
110110
120120
Price 10-Week Moving Average 30-Week Moving Average
Source: FactSet, UBS, as of 25 May 2017 Support levels Resistance levels
First Second Third First Second Third
103–106/100 101/94 96/90.32/86.25 114–116 120–122 127–130
Technical rating Neutral
Sector Cons. Disc.
Last Sale Price $107.27
Rationale: A negative outside month (Aug '15) and violation of the bottom of its 2011/2012 uptrend channel (below 98) led to a sharp decline to 86.25 or near its crucial 38.2% retracement (86.21) from 2011–2015 rally. An oversold rally has recently failed to surpass pivotal resistance along the extension of its 2011/2012 uptrend, top of its 2-plus-year triangle and 76.4% retracement from its 2005–2016 decline at 114–116. A new trading range is now likely to develop between 103–106 (Jan '17 breakout/38.2–50% retracement from Oct '16–Apr '17 rally) and 114–116 (Apr '16 highs).
Technical Review of Stocks
UBS Chief Investment Office Americas, Wealth Management 30 May 2017 11
Facebook Inc. (FB)
Jul '12 Jan '13 Jul '13 Jan '14 Jul '14 Jan '15 Jul '15 Jan '16 Jul '16 Jan '17
2020
4040
6060
8080
100100
120120
140140
160160
Price 10-Week Moving Average 30-Week Moving Average
Source: FactSet, UBS, as of 25 May 2017 Support levels Resistance levels
First Second Third First Second Third
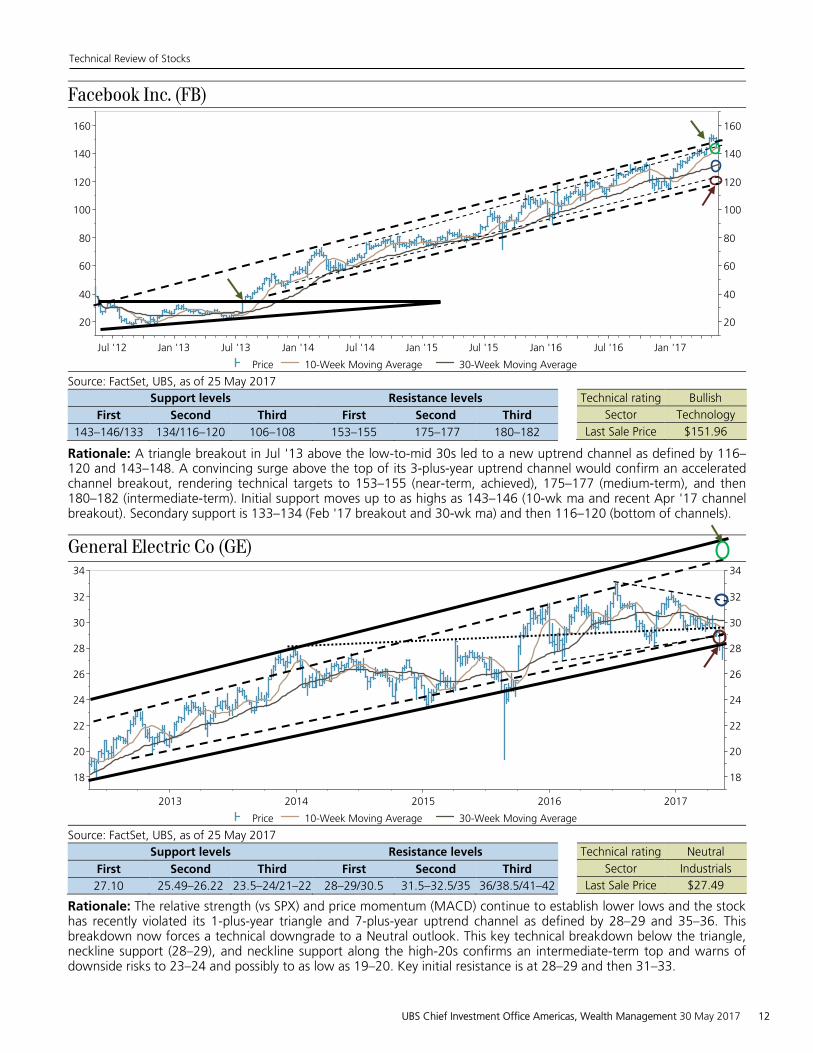
143–146/133 134/116–120 106–108 153–155 175–177 180–182
Technical rating Bullish
Sector Technology
Last Sale Price $151.96
Rationale: A triangle breakout in Jul '13 above the low-to-mid 30s led to a new uptrend channel as defined by 116–120 and 143–148. A convincing surge above the top of its 3-plus-year uptrend channel would confirm an accelerated channel breakout, rendering technical targets to 153–155 (near-term, achieved), 175–177 (medium-term), and then 180–182 (intermediate-term). Initial support moves up to as highs as 143–146 (10-wk ma and recent Apr '17 channel breakout). Secondary support is 133–134 (Feb '17 breakout and 30-wk ma) and then 116–120 (bottom of channels).
General Electric Co (GE)
2013 2014 2015 2016 2017
1818
2020
2222
2424
2626
2828
3030
3232
3434
Price 10-Week Moving Average 30-Week Moving Average
Source: FactSet, UBS, as of 25 May 2017 Support levels Resistance levels
First Second Third First Second Third
27.10 25.49–26.22 23.5–24/21–22 28–29/30.5 31.5–32.5/35 36/38.5/41–42
Technical rating Neutral
Sector Industrials
Last Sale Price $27.49
Rationale: The relative strength (vs SPX) and price momentum (MACD) continue to establish lower lows and the stock has recently violated its 1-plus-year triangle and 7-plus-year uptrend channel as defined by 28–29 and 35–36. This breakdown now forces a technical downgrade to a Neutral outlook. This key technical breakdown below the triangle, neckline support (28–29), and neckline support along the high-20s confirms an intermediate-term top and warns of downside risks to 23–24 and possibly to as low as 19–20. Key initial resistance is at 28–29 and then 31–33.
Technical Review of Stocks
UBS Chief Investment Office Americas, Wealth Management 30 May 2017 12
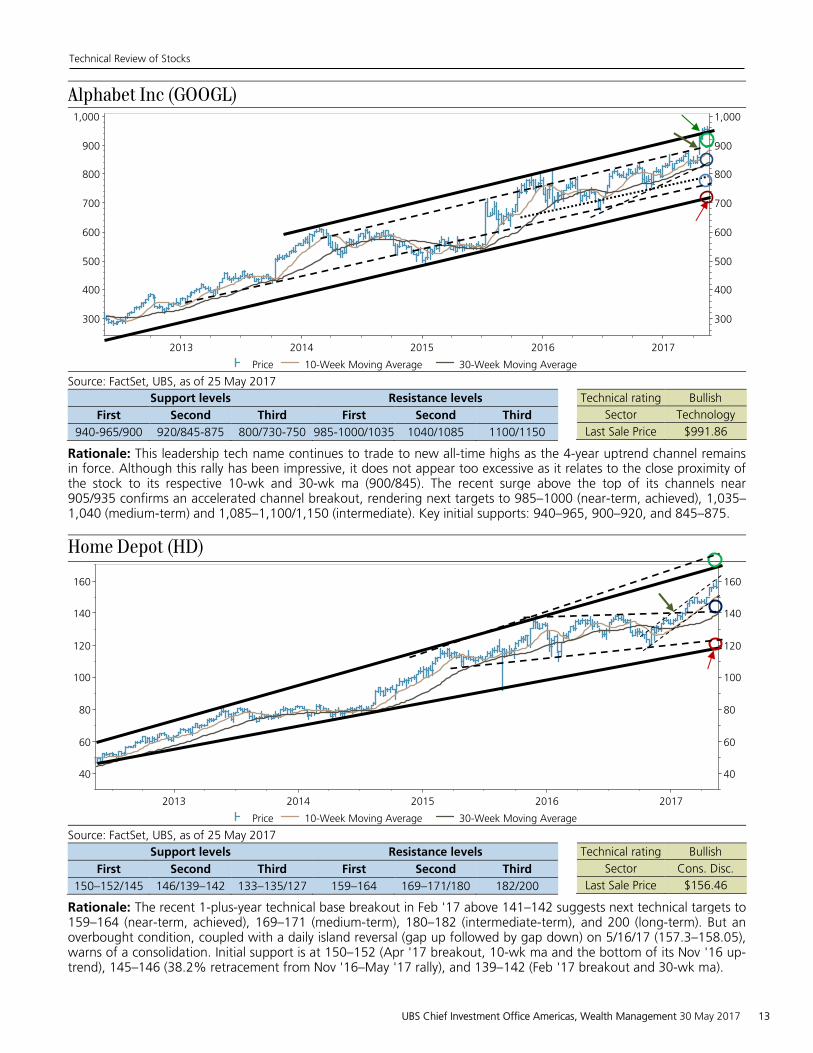
Alphabet Inc (GOOGL)
2013 2014 2015 2016 2017
300300
400400
500500
600600
700700
800800
900900
1,0001,000
Price 10-Week Moving Average 30-Week Moving Average
Source: FactSet, UBS, as of 25 May 2017 Support levels Resistance levels
First Second Third First Second Third
940-965/900 920/845-875 800/730-750 985-1000/1035 1040/1085 1100/1150
Technical rating Bullish
Sector Technology
Last Sale Price $991.86
Rationale: This leadership tech name continues to trade to new all-time highs as the 4-year uptrend channel remains in force. Although this rally has been impressive, it does not appear too excessive as it relates to the close proximity of the stock to its respective 10-wk and 30-wk ma (900/845). The recent surge above the top of its channels near 905/935 confirms an accelerated channel breakout, rendering next targets to 985–1000 (near-term, achieved), 1,035–1,040 (medium-term) and 1,085–1,100/1,150 (intermediate). Key initial supports: 940–965, 900–920, and 845–875.
Home Depot (HD)
2013 2014 2015 2016 2017
4040
6060
8080
100100
120120
140140
160160
Price 10-Week Moving Average 30-Week Moving Average
Source: FactSet, UBS, as of 25 May 2017 Support levels Resistance levels
First Second Third First Second Third
150–152/145 146/139–142 133–135/127 159–164 169–171/180 182/200
Technical rating Bullish
Sector Cons. Disc.
Last Sale Price $156.46
Rationale: The recent 1-plus-year technical base breakout in Feb '17 above 141–142 suggests next technical targets to 159–164 (near-term, achieved), 169–171 (medium-term), 180–182 (intermediate-term), and 200 (long-term). But an overbought condition, coupled with a daily island reversal (gap up followed by gap down) on 5/16/17 (157.3–158.05), warns of a consolidation. Initial support is at 150–152 (Apr '17 breakout, 10-wk ma and the bottom of its Nov '16 up-trend), 145–146 (38.2% retracement from Nov '16–May '17 rally), and 139–142 (Feb '17 breakout and 30-wk ma).
Technical Review of Stocks
UBS Chief Investment Office Americas, Wealth Management 30 May 2017 13
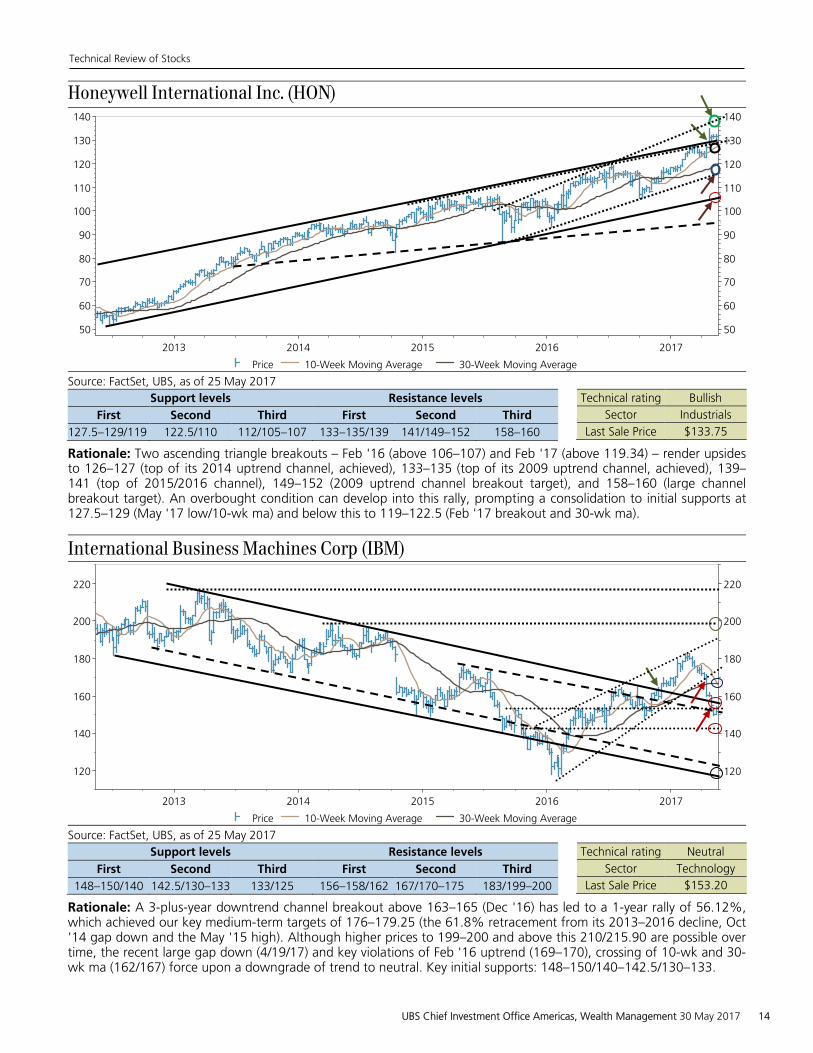
Honeywell International Inc. (HON)
2013 2014 2015 2016 2017
5050
6060
7070
8080
9090
100100
110110
120120
130130
140140
Price 10-Week Moving Average 30-Week Moving Average
Source: FactSet, UBS, as of 25 May 2017 Support levels Resistance levels
First Second Third First Second Third
127.5–129/119 122.5/110 112/105–107 133–135/139 141/149–152 158–160
Technical rating Bullish
Sector Industrials
Last Sale Price $133.75
Rationale: Two ascending triangle breakouts – Feb '16 (above 106–107) and Feb '17 (above 119.34) – render upsidesto 126–127 (top of its 2014 uptrend channel, achieved), 133–135 (top of its 2009 uptrend channel, achieved), 139–141 (top of 2015/2016 channel), 149–152 (2009 uptrend channel breakout target), and 158–160 (large channel breakout target). An overbought condition can develop into this rally, prompting a consolidation to initial supports at127.5–129 (May '17 low/10-wk ma) and below this to 119–122.5 (Feb '17 breakout and 30-wk ma).
International Business Machines Corp (IBM)
2013 2014 2015 2016 2017
120120
140140
160160
180180
200200
220220
Price 10-Week Moving Average 30-Week Moving Average
Source: FactSet, UBS, as of 25 May 2017 Support levels Resistance levels
First Second Third First Second Third
148–150/140 142.5/130–133 133/125 156–158/162 167/170–175 183/199–200
Technical rating Neutral
Sector Technology
Last Sale Price $153.20
Rationale: A 3-plus-year downtrend channel breakout above 163–165 (Dec '16) has led to a 1-year rally of 56.12%,which achieved our key medium-term targets of 176–179.25 (the 61.8% retracement from its 2013–2016 decline, Oct '14 gap down and the May '15 high). Although higher prices to 199–200 and above this 210/215.90 are possible over time, the recent large gap down (4/19/17) and key violations of Feb '16 uptrend (169–170), crossing of 10-wk and 30-wk ma (162/167) force upon a downgrade of trend to neutral. Key initial supports: 148–150/140–142.5/130–133.
Technical Review of Stocks
UBS Chief Investment Office Americas, Wealth Management 30 May 2017 14
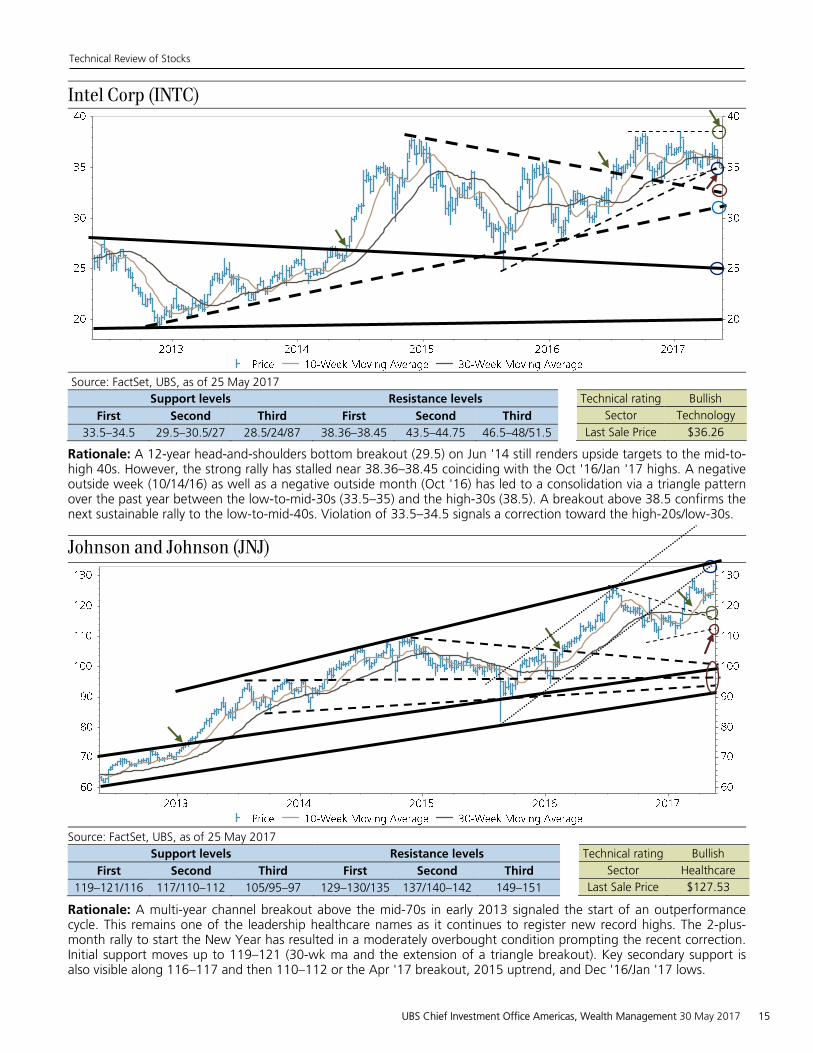
Intel Corp (INTC)
Source: FactSet, UBS, as of 25 May 2017
Support levels Resistance levels
First Second Third First Second Third
33.5–34.5 29.5–30.5/27 28.5/24/87 38.36–38.45 43.5–44.75 46.5–48/51.5
Technical rating Bullish
Sector Technology
Last Sale Price $36.26
Rationale: A 12-year head-and-shoulders bottom breakout (29.5) on Jun '14 still renders upside targets to the mid-to-high 40s. However, the strong rally has stalled near 38.36–38.45 coinciding with the Oct '16/Jan '17 highs. A negative outside week (10/14/16) as well as a negative outside month (Oct '16) has led to a consolidation via a triangle pattern over the past year between the low-to-mid-30s (33.5–35) and the high-30s (38.5). A breakout above 38.5 confirms the next sustainable rally to the low-to-mid-40s. Violation of 33.5–34.5 signals a correction toward the high-20s/low-30s.
Johnson and Johnson (JNJ)
Source: FactSet, UBS, as of 25 May 2017
Support levels Resistance levels
First Second Third First Second Third
119–121/116 117/110–112 105/95–97 129–130/135 137/140–142 149–151
Technical rating Bullish
Sector Healthcare
Last Sale Price $127.53
Rationale: A multi-year channel breakout above the mid-70s in early 2013 signaled the start of an outperformance cycle. This remains one of the leadership healthcare names as it continues to register new record highs. The 2-plus-month rally to start the New Year has resulted in a moderately overbought condition prompting the recent correction. Initial support moves up to 119–121 (30-wk ma and the extension of a triangle breakout). Key secondary support is also visible along 116–117 and then 110–112 or the Apr '17 breakout, 2015 uptrend, and Dec '16/Jan '17 lows.
Technical Review of Stocks
UBS Chief Investment Office Americas, Wealth Management 30 May 2017 15
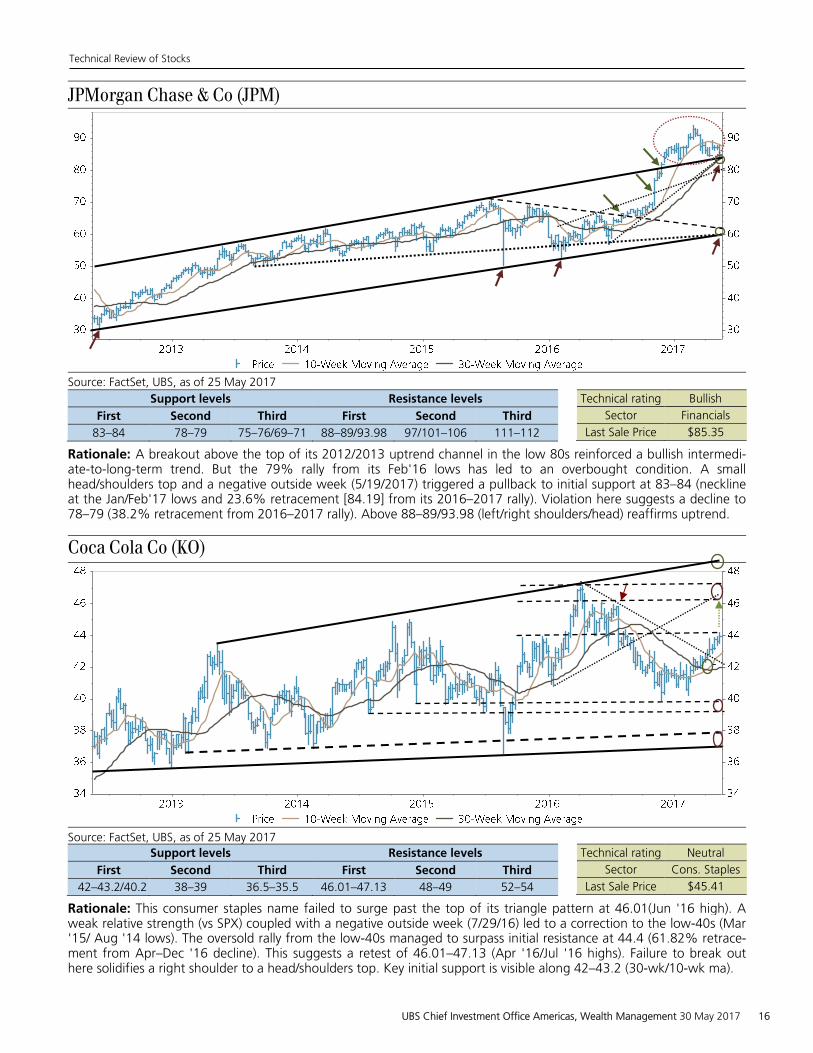
JPMorgan Chase & Co (JPM)
Source: FactSet, UBS, as of 25 May 2017
Support levels Resistance levels
First Second Third First Second Third
83–84 78–79 75–76/69–71 88–89/93.98 97/101–106 111–112
Technical rating Bullish
Sector Financials
Last Sale Price $85.35
Rationale: A breakout above the top of its 2012/2013 uptrend channel in the low 80s reinforced a bullish intermedi-ate-to-long-term trend. But the 79% rally from its Feb'16 lows has led to an overbought condition. A small head/shoulders top and a negative outside week (5/19/2017) triggered a pullback to initial support at 83–84 (neckline at the Jan/Feb'17 lows and 23.6% retracement [84.19] from its 2016–2017 rally). Violation here suggests a decline to 78–79 (38.2% retracement from 2016–2017 rally). Above 88–89/93.98 (left/right shoulders/head) reaffirms uptrend.
Coca Cola Co (KO)
Source: FactSet, UBS, as of 25 May 2017
Support levels Resistance levels
First Second Third First Second Third
42–43.2/40.2 38–39 36.5–35.5 46.01–47.13 48–49 52–54
Technical rating Neutral
Sector Cons. Staples
Last Sale Price $45.41
Rationale: This consumer staples name failed to surge past the top of its triangle pattern at 46.01(Jun '16 high). A weak relative strength (vs SPX) coupled with a negative outside week (7/29/16) led to a correction to the low-40s (Mar'15/ Aug '14 lows). The oversold rally from the low-40s managed to surpass initial resistance at 44.4 (61.82% retrace-ment from Apr–Dec '16 decline). This suggests a retest of 46.01–47.13 (Apr '16/Jul '16 highs). Failure to break out here solidifies a right shoulder to a head/shoulders top. Key initial support is visible along 42–43.2 (30-wk/10-wk ma).
Technical Review of Stocks
UBS Chief Investment Office Americas, Wealth Management 30 May 2017 16
McDonald’s Corp (MCD)
Source: FactSet, UBS, as of 25 May 2017
Support levels Resistance levels
First Second Third First Second Third
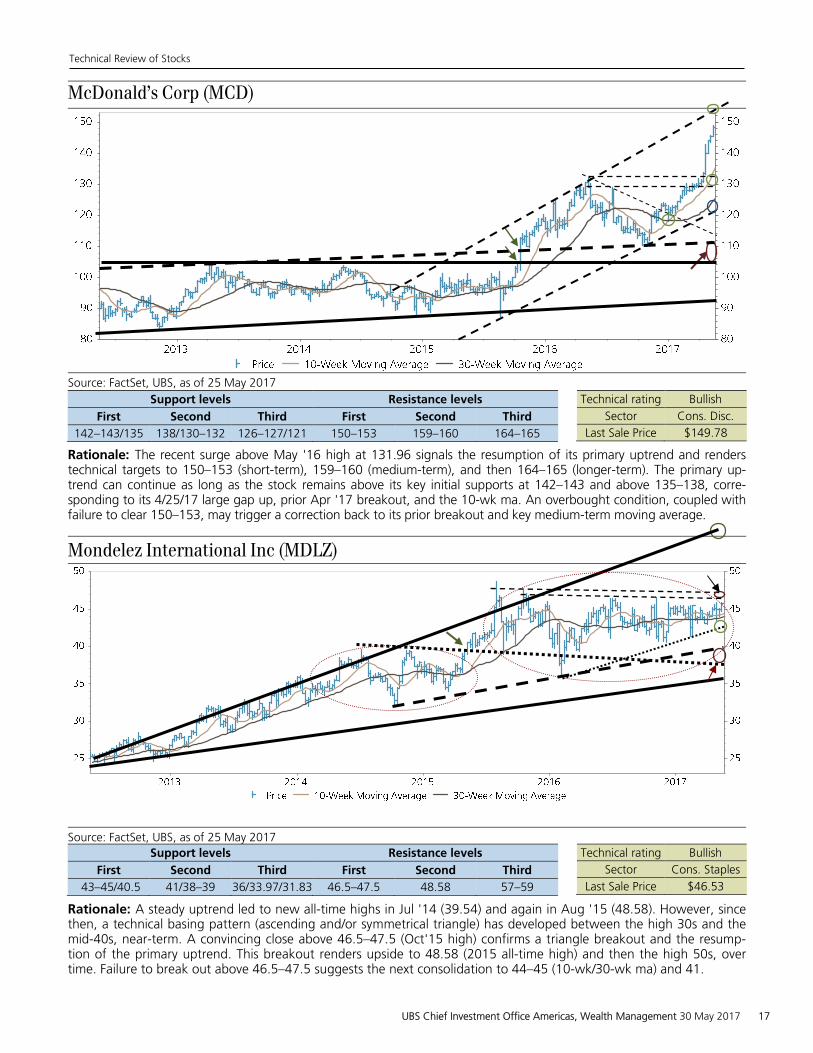
142–143/135 138/130–132 126–127/121 150–153 159–160 164–165
Technical rating Bullish
Sector Cons. Disc.
Last Sale Price $149.78
Rationale: The recent surge above May '16 high at 131.96 signals the resumption of its primary uptrend and renders technical targets to 150–153 (short-term), 159–160 (medium-term), and then 164–165 (longer-term). The primary up-trend can continue as long as the stock remains above its key initial supports at 142–143 and above 135–138, corre-sponding to its 4/25/17 large gap up, prior Apr '17 breakout, and the 10-wk ma. An overbought condition, coupled with failure to clear 150–153, may trigger a correction back to its prior breakout and key medium-term moving average.
Mondelez International Inc (MDLZ)
Source: FactSet, UBS, as of 25 May 2017
Support levels Resistance levels
First Second Third First Second Third
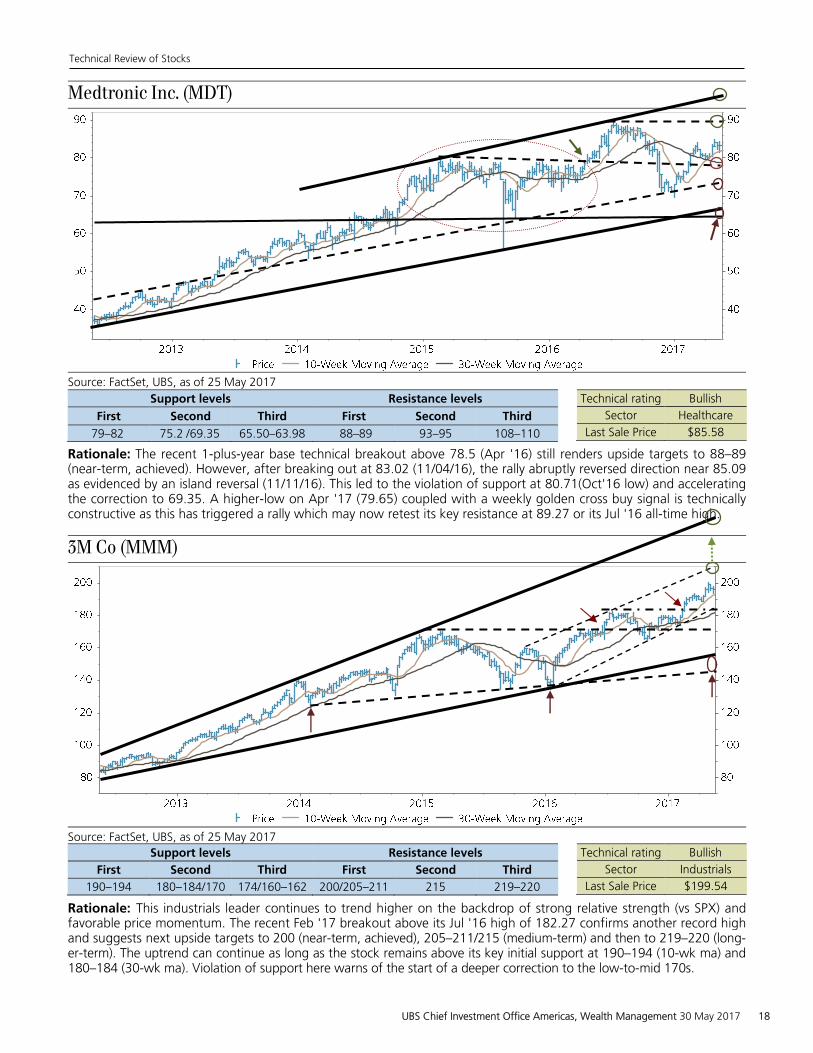
43–45/40.5 41/38–39 36/33.97/31.83 46.5–47.5 48.58 57–59
Technical rating Bullish
Sector Cons. Staples
Last Sale Price $46.53
Rationale: A steady uptrend led to new all-time highs in Jul '14 (39.54) and again in Aug '15 (48.58). However, since then, a technical basing pattern (ascending and/or symmetrical triangle) has developed between the high 30s and the mid-40s, near-term. A convincing close above 46.5–47.5 (Oct'15 high) confirms a triangle breakout and the resump-tion of the primary uptrend. This breakout renders upside to 48.58 (2015 all-time high) and then the high 50s, over time. Failure to break out above 46.5–47.5 suggests the next consolidation to 44–45 (10-wk/30-wk ma) and 41.
Technical Review of Stocks
UBS Chief Investment Office Americas, Wealth Management 30 May 2017 17
Medtronic Inc. (MDT)
Source: FactSet, UBS, as of 25 May 2017
Support levels Resistance levels
First Second Third First Second Third
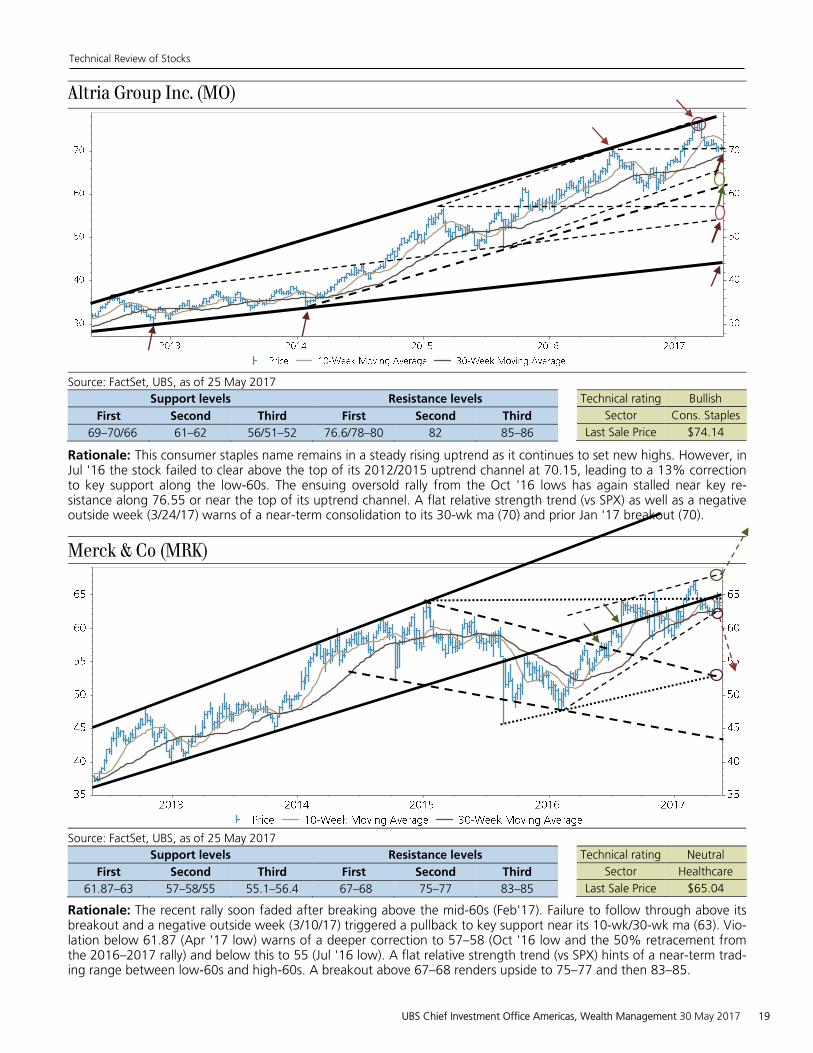
79–82 75.2 /69.35 65.50–63.98 88–89 93–95 108–110
Technical rating Bullish
Sector Healthcare
Last Sale Price $85.58
Rationale: The recent 1-plus-year base technical breakout above 78.5 (Apr '16) still renders upside targets to 88–89 (near-term, achieved). However, after breaking out at 83.02 (11/04/16), the rally abruptly reversed direction near 85.09 as evidenced by an island reversal (11/11/16). This led to the violation of support at 80.71(Oct'16 low) and accelerating the correction to 69.35. A higher-low on Apr '17 (79.65) coupled with a weekly golden cross buy signal is technically constructive as this has triggered a rally which may now retest its key resistance at 89.27 or its Jul '16 all-time high.
3M Co (MMM)
Source: FactSet, UBS, as of 25 May 2017
Support levels Resistance levels
First Second Third First Second Third
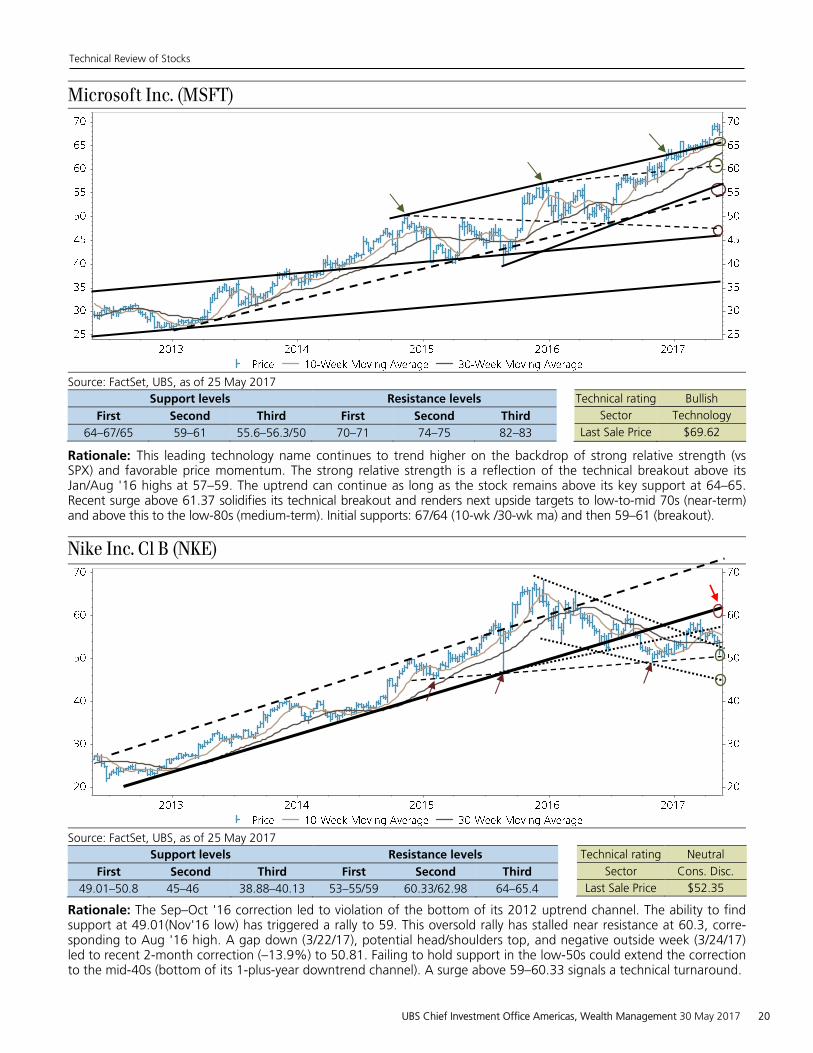
190–194 180–184/170 174/160–162 200/205–211 215 219–220
Technical rating Bullish
Sector Industrials
Last Sale Price $199.54
Rationale: This industrials leader continues to trend higher on the backdrop of strong relative strength (vs SPX) and favorable price momentum. The recent Feb '17 breakout above its Jul '16 high of 182.27 confirms another record high and suggests next upside targets to 200 (near-term, achieved), 205–211/215 (medium-term) and then to 219–220 (long-er-term). The uptrend can continue as long as the stock remains above its key initial support at 190–194 (10-wk ma) and 180–184 (30-wk ma). Violation of support here warns of the start of a deeper correction to the low-to-mid 170s.
Technical Review of Stocks
UBS Chief Investment Office Americas, Wealth Management 30 May 2017 18
Altria Group Inc. (MO)
Source: FactSet, UBS, as of 25 May 2017
Support levels Resistance levels
First Second Third First Second Third
69–70/66 61–62 56/51–52 76.6/78–80 82 85–86
Technical rating Bullish
Sector Cons. Staples
Last Sale Price $74.14
Rationale: This consumer staples name remains in a steady rising uptrend as it continues to set new highs. However, inJul '16 the stock failed to clear above the top of its 2012/2015 uptrend channel at 70.15, leading to a 13% correctionto key support along the low-60s. The ensuing oversold rally from the Oct '16 lows has again stalled near key re-sistance along 76.55 or near the top of its uptrend channel. A flat relative strength trend (vs SPX) as well as a negative outside week (3/24/17) warns of a near-term consolidation to its 30-wk ma (70) and prior Jan '17 breakout (70).
Merck & Co (MRK)
Source: FactSet, UBS, as of 25 May 2017
Support levels Resistance levels
First Second Third First Second Third
61.87–63 57–58/55 55.1–56.4 67–68 75–77 83–85
Technical rating Neutral
Sector Healthcare
Last Sale Price $65.04
Rationale: The recent rally soon faded after breaking above the mid-60s (Feb'17). Failure to follow through above its breakout and a negative outside week (3/10/17) triggered a pullback to key support near its 10-wk/30-wk ma (63). Vio-lation below 61.87 (Apr '17 low) warns of a deeper correction to 57–58 (Oct '16 low and the 50% retracement fromthe 2016–2017 rally) and below this to 55 (Jul '16 low). A flat relative strength trend (vs SPX) hints of a near-term trad-ing range between low-60s and high-60s. A breakout above 67–68 renders upside to 75–77 and then 83–85.
Technical Review of Stocks
UBS Chief Investment Office Americas, Wealth Management 30 May 2017 19
Microsoft Inc. (MSFT)
Source: FactSet, UBS, as of 25 May 2017
Support levels Resistance levels
First Second Third First Second Third
64–67/65 59–61 55.6–56.3/50 70–71 74–75 82–83
Technical rating Bullish
Sector Technology
Last Sale Price $69.62
Rationale: This leading technology name continues to trend higher on the backdrop of strong relative strength (vs SPX) and favorable price momentum. The strong relative strength is a reflection of the technical breakout above its Jan/Aug '16 highs at 57–59. The uptrend can continue as long as the stock remains above its key support at 64–65. Recent surge above 61.37 solidifies its technical breakout and renders next upside targets to low-to-mid 70s (near-term) and above this to the low-80s (medium-term). Initial supports: 67/64 (10-wk /30-wk ma) and then 59–61 (breakout).
Nike Inc. Cl B (NKE)
Source: FactSet, UBS, as of 25 May 2017
Support levels Resistance levels
First Second Third First Second Third
49.01–50.8 45–46 38.88–40.13 53–55/59 60.33/62.98 64–65.4
Technical rating Neutral
Sector Cons. Disc.
Last Sale Price $52.35
Rationale: The Sep–Oct '16 correction led to violation of the bottom of its 2012 uptrend channel. The ability to find support at 49.01(Nov'16 low) has triggered a rally to 59. This oversold rally has stalled near resistance at 60.3, corre-sponding to Aug '16 high. A gap down (3/22/17), potential head/shoulders top, and negative outside week (3/24/17) led to recent 2-month correction (–13.9%) to 50.81. Failing to hold support in the low-50s could extend the correction to the mid-40s (bottom of its 1-plus-year downtrend channel). A surge above 59–60.33 signals a technical turnaround.
Technical Review of Stocks
UBS Chief Investment Office Americas, Wealth Management 30 May 2017 20
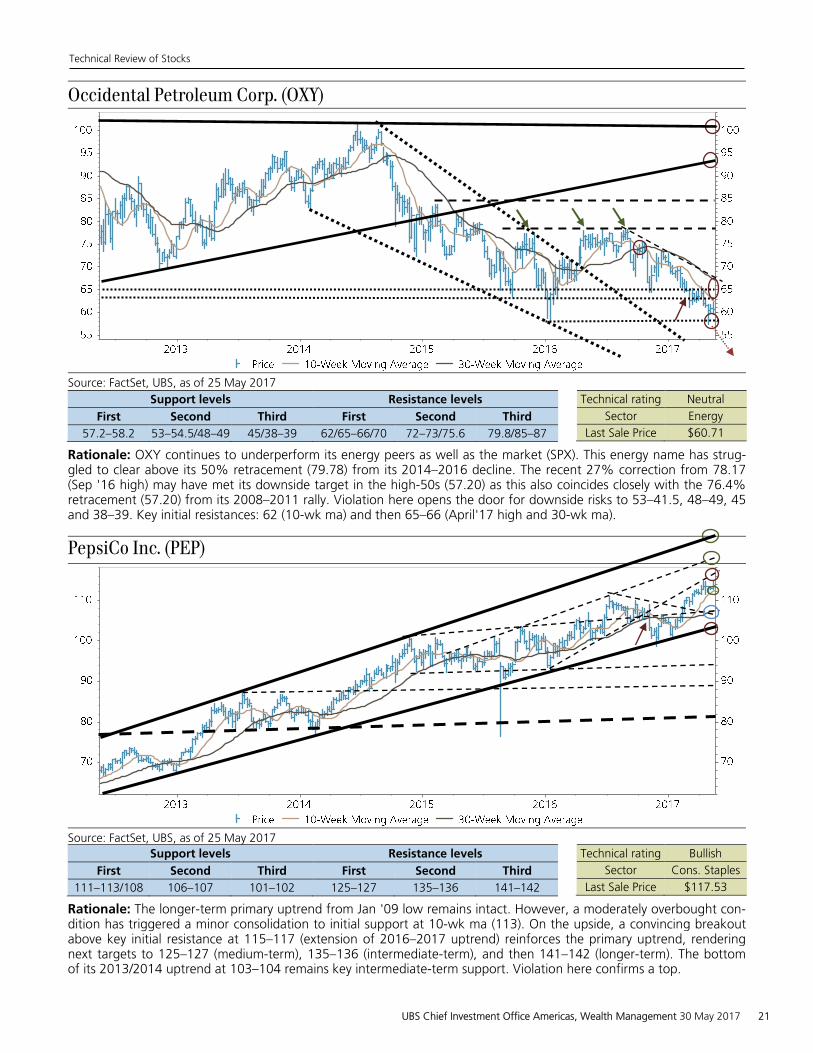
Occidental Petroleum Corp. (OXY)
Source: FactSet, UBS, as of 25 May 2017
Support levels Resistance levels
First Second Third First Second Third
57.2–58.2 53–54.5/48–49 45/38–39 62/65–66/70 72–73/75.6 79.8/85–87
Technical rating Neutral
Sector Energy
Last Sale Price $60.71
Rationale: OXY continues to underperform its energy peers as well as the market (SPX). This energy name has strug-gled to clear above its 50% retracement (79.78) from its 2014–2016 decline. The recent 27% correction from 78.17 (Sep '16 high) may have met its downside target in the high-50s (57.20) as this also coincides closely with the 76.4% retracement (57.20) from its 2008–2011 rally. Violation here opens the door for downside risks to 53–41.5, 48–49, 45 and 38–39. Key initial resistances: 62 (10-wk ma) and then 65–66 (April'17 high and 30-wk ma).
PepsiCo Inc. (PEP)
Source: FactSet, UBS, as of 25 May 2017
Support levels Resistance levels
First Second Third First Second Third
111–113/108 106–107 101–102 125–127 135–136 141–142
Technical rating Bullish
Sector Cons. Staples
Last Sale Price $117.53
Rationale: The longer-term primary uptrend from Jan '09 low remains intact. However, a moderately overbought con-dition has triggered a minor consolidation to initial support at 10-wk ma (113). On the upside, a convincing breakout above key initial resistance at 115–117 (extension of 2016–2017 uptrend) reinforces the primary uptrend, rendering next targets to 125–127 (medium-term), 135–136 (intermediate-term), and then 141–142 (longer-term). The bottom of its 2013/2014 uptrend at 103–104 remains key intermediate-term support. Violation here confirms a top.
Technical Review of Stocks
UBS Chief Investment Office Americas, Wealth Management 30 May 2017 21
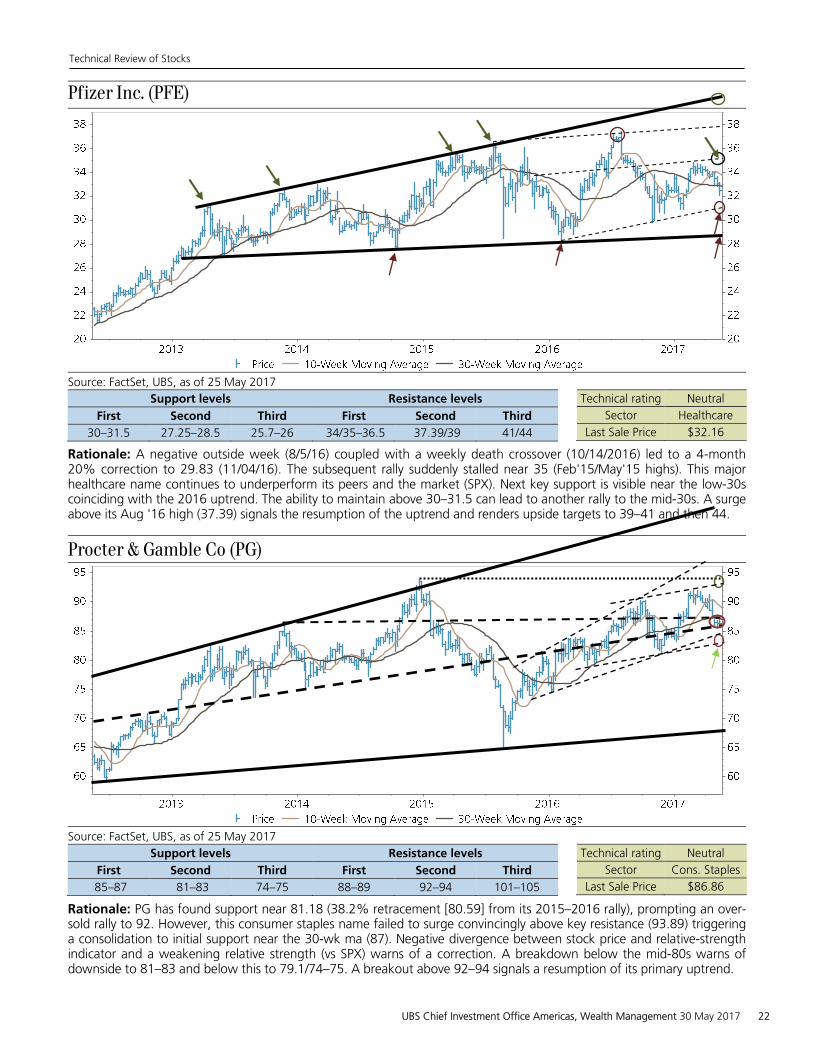
Pfizer Inc. (PFE)
Source: FactSet, UBS, as of 25 May 2017
Support levels Resistance levels
First Second Third First Second Third
30–31.5 27.25–28.5 25.7–26 34/35–36.5 37.39/39 41/44
Technical rating Neutral
Sector Healthcare
Last Sale Price $32.16
Rationale: A negative outside week (8/5/16) coupled with a weekly death crossover (10/14/2016) led to a 4-month 20% correction to 29.83 (11/04/16). The subsequent rally suddenly stalled near 35 (Feb'15/May'15 highs). This major healthcare name continues to underperform its peers and the market (SPX). Next key support is visible near the low-30s coinciding with the 2016 uptrend. The ability to maintain above 30–31.5 can lead to another rally to the mid-30s. A surge above its Aug '16 high (37.39) signals the resumption of the uptrend and renders upside targets to 39–41 and then 44.
Procter & Gamble Co (PG)
Source: FactSet, UBS, as of 25 May 2017
Support levels Resistance levels
First Second Third First Second Third
85–87 81–83 74–75 88–89 92–94 101–105
Technical rating Neutral
Sector Cons. Staples
Last Sale Price $86.86
Rationale: PG has found support near 81.18 (38.2% retracement [80.59] from its 2015–2016 rally), prompting an over-sold rally to 92. However, this consumer staples name failed to surge convincingly above key resistance (93.89) triggering a consolidation to initial support near the 30-wk ma (87). Negative divergence between stock price and relative-strength indicator and a weakening relative strength (vs SPX) warns of a correction. A breakdown below the mid-80s warns of downside to 81–83 and below this to 79.1/74–75. A breakout above 92–94 signals a resumption of its primary uptrend.
Technical Review of Stocks
UBS Chief Investment Office Americas, Wealth Management 30 May 2017 22
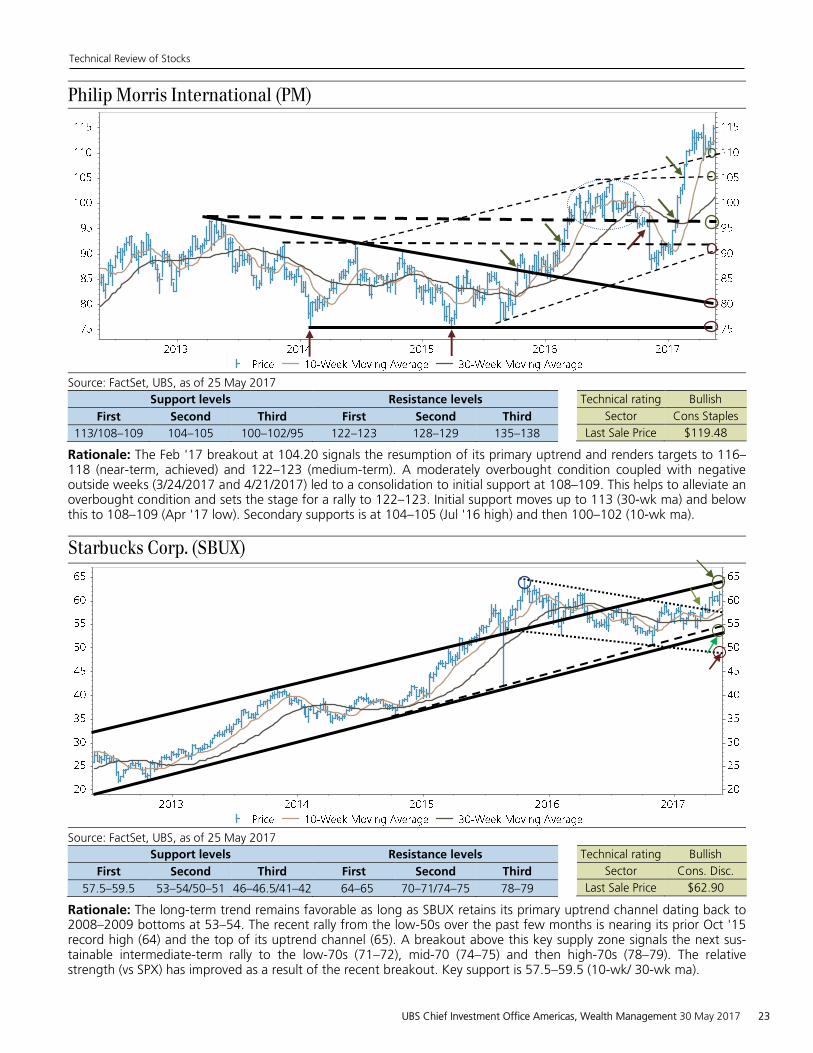
Philip Morris International (PM)
Source: FactSet, UBS, as of 25 May 2017
Support levels Resistance levels
First Second Third First Second Third
113/108–109 104–105 100–102/95 122–123 128–129 135–138
Technical rating Bullish
Sector Cons Staples
Last Sale Price $119.48
Rationale: The Feb '17 breakout at 104.20 signals the resumption of its primary uptrend and renders targets to 116–118 (near-term, achieved) and 122–123 (medium-term). A moderately overbought condition coupled with negative outside weeks (3/24/2017 and 4/21/2017) led to a consolidation to initial support at 108–109. This helps to alleviate an overbought condition and sets the stage for a rally to 122–123. Initial support moves up to 113 (30-wk ma) and below this to 108–109 (Apr '17 low). Secondary supports is at 104–105 (Jul '16 high) and then 100–102 (10-wk ma).
Starbucks Corp. (SBUX)
Source: FactSet, UBS, as of 25 May 2017
Support levels Resistance levels
First Second Third First Second Third
57.5–59.5 53–54/50–51 46–46.5/41–42 64–65 70–71/74–75 78–79
Technical rating Bullish
Sector Cons. Disc.
Last Sale Price $62.90
Rationale: The long-term trend remains favorable as long as SBUX retains its primary uptrend channel dating back to 2008–2009 bottoms at 53–54. The recent rally from the low-50s over the past few months is nearing its prior Oct '15 record high (64) and the top of its uptrend channel (65). A breakout above this key supply zone signals the next sus-tainable intermediate-term rally to the low-70s (71–72), mid-70 (74–75) and then high-70s (78–79). The relative strength (vs SPX) has improved as a result of the recent breakout. Key support is 57.5–59.5 (10-wk/ 30-wk ma).
Technical Review of Stocks
UBS Chief Investment Office Americas, Wealth Management 30 May 2017 23
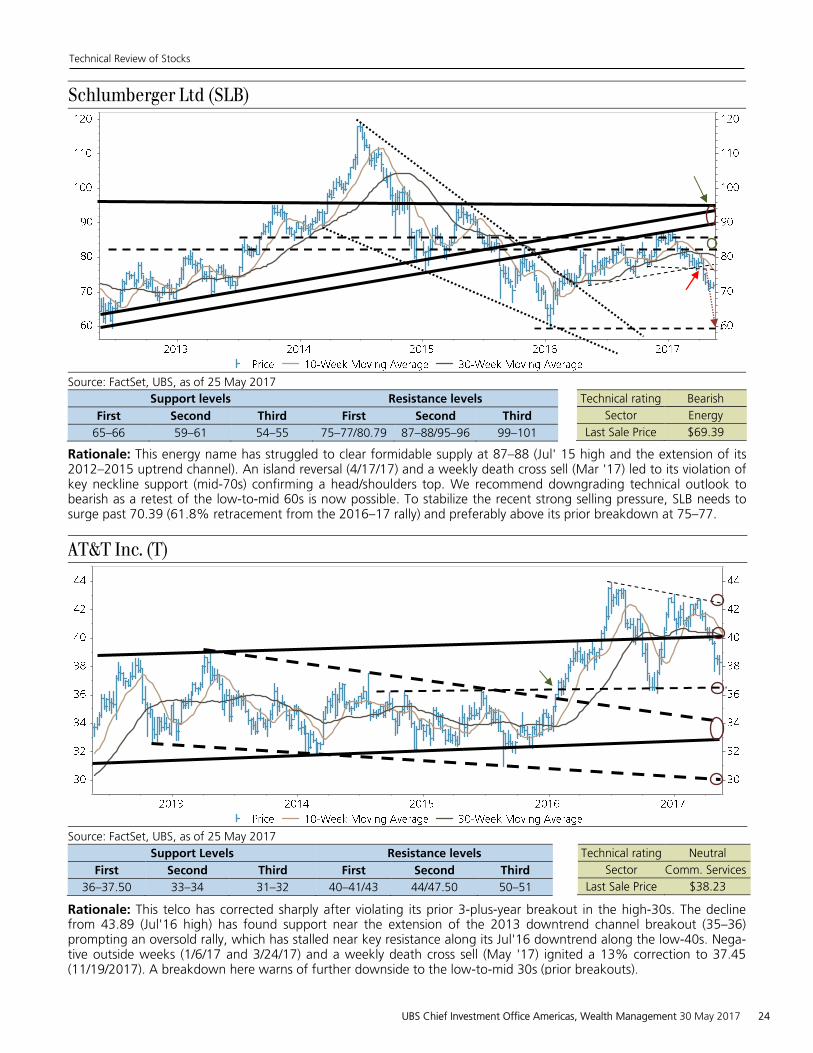
Schlumberger Ltd (SLB)
Source: FactSet, UBS, as of 25 May 2017
Support levels Resistance levels
First Second Third First Second Third
65–66 59–61 54–55 75–77/80.79 87–88/95–96 99–101
Technical rating Bearish
Sector Energy
Last Sale Price $69.39
Rationale: This energy name has struggled to clear formidable supply at 87–88 (Jul' 15 high and the extension of its2012–2015 uptrend channel). An island reversal (4/17/17) and a weekly death cross sell (Mar '17) led to its violation of key neckline support (mid-70s) confirming a head/shoulders top. We recommend downgrading technical outlook to bearish as a retest of the low-to-mid 60s is now possible. To stabilize the recent strong selling pressure, SLB needs to surge past 70.39 (61.8% retracement from the 2016–17 rally) and preferably above its prior breakdown at 75–77.
AT&T Inc. (T)
Source: FactSet, UBS, as of 25 May 2017
Support Levels Resistance levels
First Second Third First Second Third
36–37.50 33–34 31–32 40–41/43 44/47.50 50–51
Technical rating Neutral
Sector Comm. Services
Last Sale Price $38.23
Rationale: This telco has corrected sharply after violating its prior 3-plus-year breakout in the high-30s. The decline from 43.89 (Jul'16 high) has found support near the extension of the 2013 downtrend channel breakout (35–36) prompting an oversold rally, which has stalled near key resistance along its Jul'16 downtrend along the low-40s. Nega-tive outside weeks (1/6/17 and 3/24/17) and a weekly death cross sell (May '17) ignited a 13% correction to 37.45 (11/19/2017). A breakdown here warns of further downside to the low-to-mid 30s (prior breakouts).
Technical Review of Stocks
UBS Chief Investment Office Americas, Wealth Management 30 May 2017 24
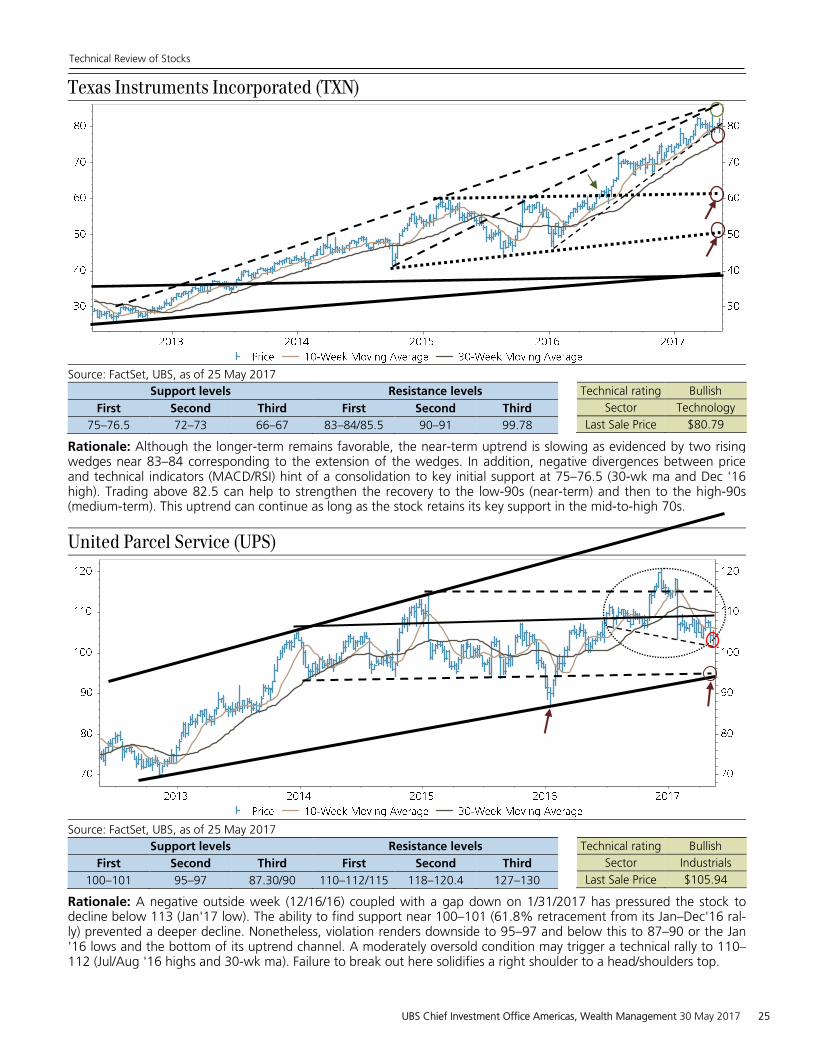
Texas Instruments Incorporated (TXN)
Source: FactSet, UBS, as of 25 May 2017
Support levels Resistance levels
First Second Third First Second Third
75–76.5 72–73 66–67 83–84/85.5 90–91 99.78
Technical rating Bullish
Sector Technology
Last Sale Price $80.79
Rationale: Although the longer-term remains favorable, the near-term uptrend is slowing as evidenced by two rising wedges near 83–84 corresponding to the extension of the wedges. In addition, negative divergences between price and technical indicators (MACD/RSI) hint of a consolidation to key initial support at 75–76.5 (30-wk ma and Dec '16 high). Trading above 82.5 can help to strengthen the recovery to the low-90s (near-term) and then to the high-90s (medium-term). This uptrend can continue as long as the stock retains its key support in the mid-to-high 70s.
United Parcel Service (UPS)
Source: FactSet, UBS, as of 25 May 2017
Support levels Resistance levels
First Second Third First Second Third
100–101 95–97 87.30/90 110–112/115 118–120.4 127–130
Technical rating Bullish
Sector Industrials
Last Sale Price $105.94
Rationale: A negative outside week (12/16/16) coupled with a gap down on 1/31/2017 has pressured the stock to decline below 113 (Jan'17 low). The ability to find support near 100–101 (61.8% retracement from its Jan–Dec'16 ral-ly) prevented a deeper decline. Nonetheless, violation renders downside to 95–97 and below this to 87–90 or the Jan'16 lows and the bottom of its uptrend channel. A moderately oversold condition may trigger a technical rally to 110–112 (Jul/Aug '16 highs and 30-wk ma). Failure to break out here solidifies a right shoulder to a head/shoulders top.
Technical Review of Stocks
UBS Chief Investment Office Americas, Wealth Management 30 May 2017 25
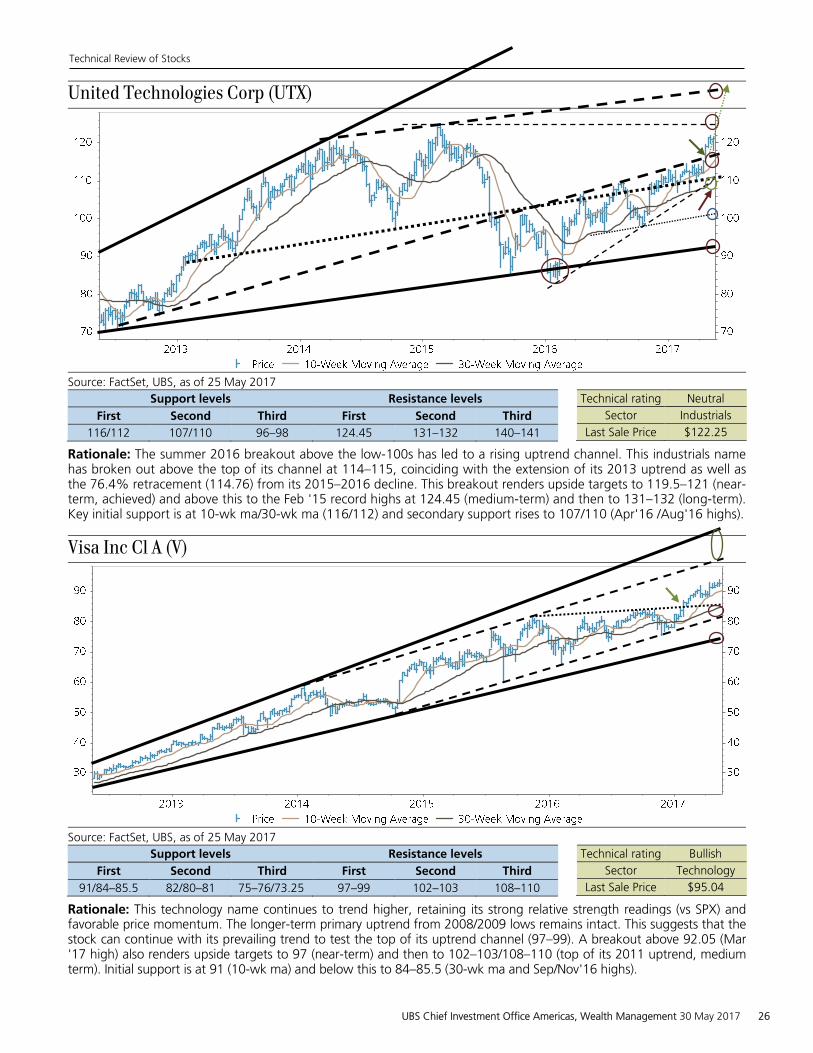
United Technologies Corp (UTX)
Source: FactSet, UBS, as of 25 May 2017
Support levels Resistance levels
First Second Third First Second Third
116/112 107/110 96–98 124.45 131–132 140–141
Technical rating Neutral
Sector Industrials
Last Sale Price $122.25
Rationale: The summer 2016 breakout above the low-100s has led to a rising uptrend channel. This industrials name has broken out above the top of its channel at 114–115, coinciding with the extension of its 2013 uptrend as well as the 76.4% retracement (114.76) from its 2015–2016 decline. This breakout renders upside targets to 119.5–121 (near-term, achieved) and above this to the Feb '15 record highs at 124.45 (medium-term) and then to 131–132 (long-term). Key initial support is at 10-wk ma/30-wk ma (116/112) and secondary support rises to 107/110 (Apr'16 /Aug'16 highs).
Visa Inc Cl A (V)
Source: FactSet, UBS, as of 25 May 2017
Support levels Resistance levels
First Second Third First Second Third
91/84–85.5 82/80–81 75–76/73.25 97–99 102–103 108–110
Technical rating Bullish
Sector Technology
Last Sale Price $95.04
Rationale: This technology name continues to trend higher, retaining its strong relative strength readings (vs SPX) and favorable price momentum. The longer-term primary uptrend from 2008/2009 lows remains intact. This suggests that the stock can continue with its prevailing trend to test the top of its uptrend channel (97–99). A breakout above 92.05 (Mar'17 high) also renders upside targets to 97 (near-term) and then to 102–103/108–110 (top of its 2011 uptrend, medium term). Initial support is at 91 (10-wk ma) and below this to 84–85.5 (30-wk ma and Sep/Nov'16 highs).
Technical Review of Stocks
UBS Chief Investment Office Americas, Wealth Management 30 May 2017 26
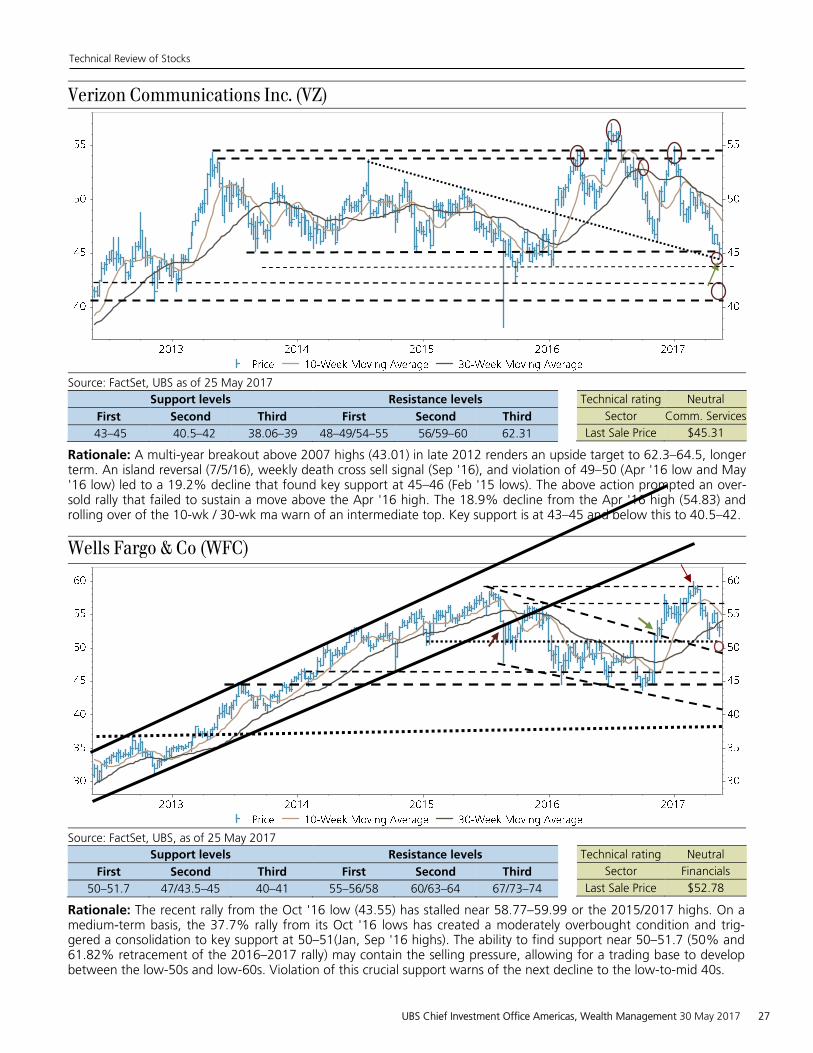
Verizon Communications Inc. (VZ)
Source: FactSet, UBS as of 25 May 2017
Support levels Resistance levels
First Second Third First Second Third
43–45 40.5–42 38.06–39 48–49/54–55 56/59–60 62.31
Technical rating Neutral
Sector Comm. Services
Last Sale Price $45.31
Rationale: A multi-year breakout above 2007 highs (43.01) in late 2012 renders an upside target to 62.3–64.5, longer term. An island reversal (7/5/16), weekly death cross sell signal (Sep '16), and violation of 49–50 (Apr '16 low and May'16 low) led to a 19.2% decline that found key support at 45–46 (Feb '15 lows). The above action prompted an over-sold rally that failed to sustain a move above the Apr '16 high. The 18.9% decline from the Apr '16 high (54.83) and rolling over of the 10-wk / 30-wk ma warn of an intermediate top. Key support is at 43–45 and below this to 40.5–42.
Wells Fargo & Co (WFC)
Source: FactSet, UBS, as of 25 May 2017
Support levels Resistance levels
First Second Third First Second Third
50–51.7 47/43.5–45 40–41 55–56/58 60/63–64 67/73–74
Technical rating Neutral
Sector Financials
Last Sale Price $52.78
Rationale: The recent rally from the Oct '16 low (43.55) has stalled near 58.77–59.99 or the 2015/2017 highs. On a medium-term basis, the 37.7% rally from its Oct '16 lows has created a moderately overbought condition and trig-gered a consolidation to key support at 50–51(Jan, Sep '16 highs). The ability to find support near 50–51.7 (50% and 61.82% retracement of the 2016–2017 rally) may contain the selling pressure, allowing for a trading base to develop between the low-50s and low-60s. Violation of this crucial support warns of the next decline to the low-to-mid 40s.
Technical Review of Stocks
UBS Chief Investment Office Americas, Wealth Management 30 May 2017 27
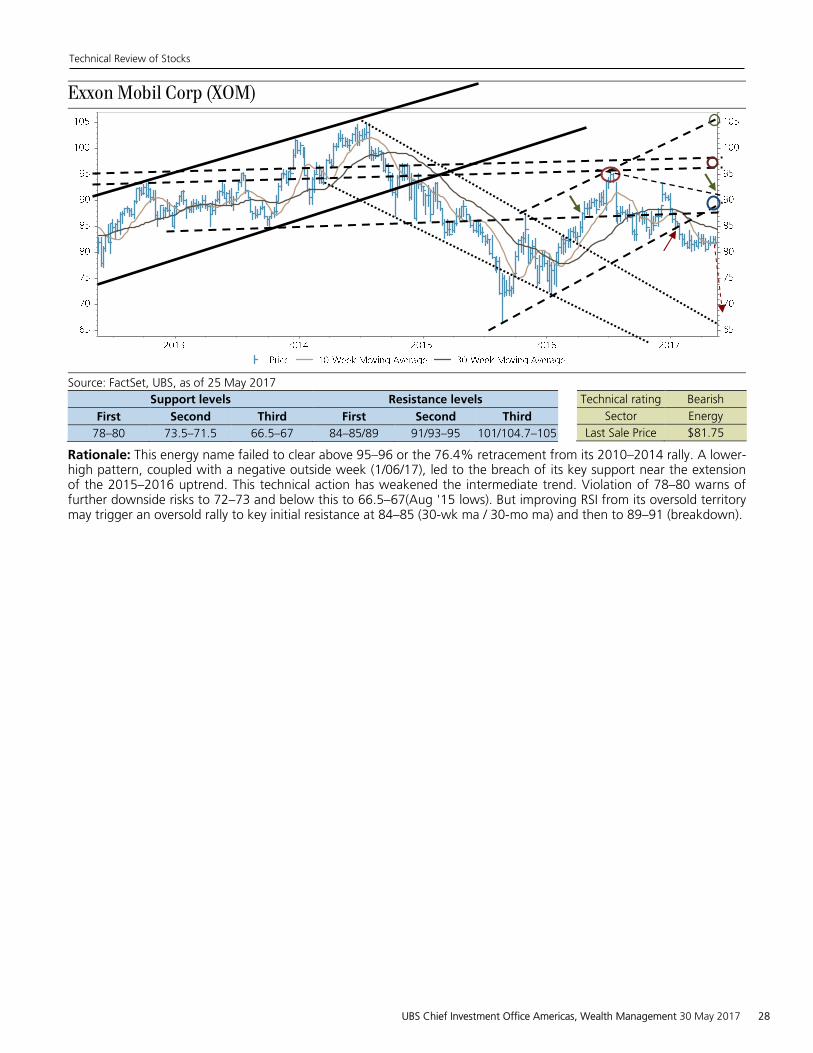
Exxon Mobil Corp (XOM)
Source: FactSet, UBS, as of 25 May 2017
Support levels Resistance levels
First Second Third First Second Third
78–80 73.5–71.5 66.5–67 84–85/89 91/93–95 101/104.7–105
Technical rating Bearish
Sector Energy
Last Sale Price $81.75
Rationale: This energy name failed to clear above 95–96 or the 76.4% retracement from its 2010–2014 rally. A lower-high pattern, coupled with a negative outside week (1/06/17), led to the breach of its key support near the extension of the 2015–2016 uptrend. This technical action has weakened the intermediate trend. Violation of 78–80 warns of further downside risks to 72–73 and below this to 66.5–67(Aug '15 lows). But improving RSI from its oversold territory may trigger an oversold rally to key initial resistance at 84–85 (30-wk ma / 30-mo ma) and then to 89–91 (breakdown).
Technical Review of Stocks
UBS Chief Investment Office Americas, Wealth Management 30 May 2017 28
Appendix
Description and Methodology This report provides technical analysis on a dynamic list of stocks that, we believe, are of a wide interest. Please note that technical views are highly variable and will change with market conditions. Accordingly, these rat-ings are only valid as of the publication date. Because CIO WMR equity sector analysts and WMR technical analysts employ different analytical methodologies, technical recommendations are, at times, contradictory to fundamental recommendations for the same security. For the latest company ratings by WMR sector analysts, please refer to the most recent equity sector research reports, located in the Equity Section on the Online Services Research website. For more background on the content of this report, please see Technical Analysis Research Primer, 18 February 2010.
Appendix
Term / Abbreviation Description / Definition
% +or– Moving Avg (DMA)
The percentage above or below the moving average (see Moving Average) is used to help measure an overbought or oversold condition and is a component of risk management. It is calculated by taking the difference between the group price and its 30–week moving average (see below), and then dividing by the 30–week moving average times 100.
30–Week Moving Average Also known as the 30–week line or 150-day line), this is one of the most popular and respected moving average indicators (see Moving Average) in technical circles. It is calculated by totaling the latest 30 weekly (usually Friday closing) prices and dividing by 30 to arrive at the average. Each week, the most recent week’s figure is added to the total, and the price level from 30 weeks ago is subtracted – hence the term “moving.” Please note that a breakout above or breakdown below this line does not, in and of itself, constitute a buy or sell signal.
Adjusted Relative Strength (ARS) Number gives a 50% weighting to the 1-month relative strength, 30% to the 3-month, and 20% to the 6-month numbers to arrive at a single weighted number.
Base A chart pattern marking a period of accumulation following a downtrend. The larger the base, the greater the upside potential following its completion. A base can take many forms.
Beta A measure of volatility of a security as it relates to the market as a whole. Beta is often calculated using regression analysis. A beta is basically the tendency of a security’s returns to respond to swings in the market. A beta of 1 indicates that the security’s price will move with the market. A beta of less than 1 means the security will be less volatile than the market. A beta of greater than 1 implies that the security’s price will be more volatile than the market.
Blow off stage to a major rally This is often the last stage of a speculative bubble to a major rally. The blow off phase tends to be steep, but short–lived that often affords little opportunity for investors/traders to exit their positions. As price of a security or an asset advanced to an unsustainable level via a parabolic uptrend this give rise to the bursting of the speculative bubble resulting a quick and dramatic decline as inves-tors/traders try to exit the market/security at the same time.
Breakdown A technical term indicating a downside resolution of a chart pattern. Its significance is determined by the same factors governing a breakout.
Breakout A technical term indicating an upside resolution of a chart pattern. Breakouts can take many forms, and their degree of importance is determined by the significance of the chart pattern which preced-ed it.
Broadening Top Formation The Broadening top is a rare technical formation that resembles an inverted triangle pattern. It is formed by price swings that are increasingly widening and expanding volume. The most common of these broadening top patterns are the three ascending peaks and two descending troughs. The combination of wide price swings and increasing volume often convey an increasingly volatile and emotional market that's basically out of control. This pattern is often associated with market tops rather than market bottoms. The confirmation of the Broadening top occurs when the price violates the second of these two troughs.
Technical Review of Stocks
UBS Chief Investment Office Americas, Wealth Management 30 May 2017 29
Appendix
Channel
A chart pattern comprised of two parallel trend lines, which form a trading band. Channels take the form of uptrend, downtrend and horizontal.
Death Cross The opposite of a golden cross, this is a crossover on the chart resulting from a security’s shorter-term moving average falling below its longer-term moving average. Technicians often see this as a bearish technical sign indicating the market has turned negative on the security.
Downtrend Line
A trend line connecting successively lower peaks for a stock (or market). Its technical significance is determined by the same factors governing an uptrend line.
Fan reversal pattern The fan formation is a technical pattern that is based on the use of multiple trend lines to denote a major trend reversal. The fan pattern gets its name as it basically resembles a “fan”. It should have a minimum of three trend lines (uptrends or downtrends). The break out/break down of the third downtrend/uptrend often completes the fan pattern and signals the start of a major trend reversal. The starting point of these trend lines should come from a significant peak or a significant trough.
Fibonacci Retracement Level A technical analysis term used to describe potential areas of support (price stops declining) or re-sistance (price stops rising) on the charts. After a strong rally or decline there is a tendency for a security to retrace a certain portion of its prior move (up or down). Fibonacci retracements use hori-zontal lines to indicate areas of support or resistance at the key Fibonacci levels before continuing in the original direction. These levels are computed by taking the two extreme points and then dividing the vertical distance by the key Fibonacci ratios of 23.6%, 38.2%, 50%, 61.8% and 100%.
FSR Forecast Stock Return is defined as expected percentage price appreciation plus gross dividend yield over the next 12 months.
Gap
An open space in a chart created when a stock (or market) opens either higher than its highest level attained during the prior session (referred to as a gap up or an upside chart gap) or lower than its lowest level reached during the prior day (called a gap down or a downside chart gap). Some gaps are caused by events and should be ignored: ex–dividend gaps, new share issues, and expiration of futures contracts.
Golden Cross A crossover on the chart that involves a security’s shorter-term moving average (such as the 50-day moving average) crossing above its longer-term moving average (such as the 150-day or 200-day moving average). Technicians often interpret this crossing of two moving averages as a bullish tech-nical sign that suggests the market has turned in favor of the security.
Head–and–Shoulders Pattern This technical formation is one of the best known of the reversal patterns. There are two types of head–and–shoulders patterns that often appear on the charts – H/S top and H/S bottom. Both of these patterns often denote the process of a reversal either from a bullish or bearish trend. Head–and–shoulders formation often is comprised of a left shoulder, a head, and a right shoulder, and a line drawn across its shoulders defines its neckline. The breaking of the neckline to the upside con-firms a head–and–shoulders bottom breakout, which signals the start of a bullish reversal favoring higher prices. The violation of neckline to the downside validates a head–and–shoulders top, reaf-firming a bearish reversal of lower prices.
Internal Trend Line A single trend line connecting at least several high and low points for a stock (or market) over time.
Linear Regression Band A common statistical technique often used by investors/traders to better forecast values by utilizing the least squares fit method to plot a trend line. A linear regression band consists of upper and lower bands. These bands are calculated by computing the number of standard deviations above or below of the regression line.
Moving Average (m.a.) This is a technical indicator frequently used in technical analysis to show the average value of a security’s price over a set period of time. This tool is designed to smooth out a stock’s (or market’s) shorter-term fluctuations to provide a better picture of an underlying trend. Moving averages gener-ally are used to measure momentum and define areas of possible support and resistance. Moving averages can be helpful as they emphasize the direction of the dominant or prevailing trend and also tend to smooth out price and volume fluctuations, or “noise,” giving the trader or investor a clearer picture of the security in question. Many moving averages exist.
MRA Market Return Assumption is defined as the one-year local market interest rate plus 5% (a proxy for the equity risk premium and not a forecast).
Technical Review of Stocks
UBS Chief Investment Office Americas, Wealth Management 30 May 2017 30
Appendix
Neckline Support/Resistance This is a trend line that is drawn across the bottoms or tops of the left shoulder, the head and the right shoulder of a potential head–and–shoulders bottom or top pattern. When prices break through this neckline support level and continue falling after forming the right shoulder, it confirms a head–and–shoulders top formation. Conversely, neckline resistance is a trend line drawn across the tops of the left shoulder, the head and the right shoulder. When prices break above this neck-line resistance level and keep on rising, it typically completes the head–and–shoulders bottom pat-tern.
Overbought A technical condition in which the price of a security has risen to such a degree that the price be-comes overvalued or has reached the upper band of its trading range resulting in a potential pull-back in price.
Oversold Opposite of Overbought. A technical condition that occurs when the price of a security has fallen to such a degree that the price becomes undervalued or has reached the lower band of its trading range prompting a potential rally.
Positive/Negative “Outside” Day
When one day’s range (high and low) exceeds the prior day’s range, and the stock (or market) in question closes near its daily peak, this is referred to as a positive “outside” day. A negative “out-side” day would be recorded if the stock (or index) finished near its daily low after having a wider range than the prior session. The same rule can be applied on a weekly and monthly basis as well.
Relative Strength
Relative strength is a performance comparison between a sector, group, or stock and the S&P 500 Index over a specified time frame. Our time frame is often a one–, three–, and six-month basis but does vary according to investment orientation.
RRD Rating/Return Divergence is automatically appended to the rating when stock price movement has caused the prevailing rating to differ from that which would be assigned according to the rating system and will be removed when there is no longer a divergence, either through market movement or analyst intervention.
Support An area where increased buying interest is likely to develop during a decline. These points, which can take several forms (minor, major, etc.), often provide downside protection for an issue in a pri-mary uptrend, but only temporary relief to an issue in a primary uptrend, during which time many support levels are often broken.
Top A chart pattern marking a period of distribution following an uptrend. The larger the top, the great-er the downside potential following its completion. It, too, can take many forms.
Triangle Patterns There are three different types of Triangle patterns – Symmetrical, Descending and Ascending. Symmetrical Triangle is considered to be a continuation pattern that often signals a period of con-solidation in a trend followed by a resumption of the prior trend. It is formed by the convergence of a descending trend and an ascending trend. An Ascending Triangle is a bullish pattern, which is denoted by two trend lines – a flat trend line and an ascending uptrend line. A Descending Triangle is a bearish pattern. It is the opposite of the Ascending Triangle in that there is a flat trend line and a downward sloping downtrend line.
Technical Review of Stocks
UBS Chief Investment Office Americas, Wealth Management 30 May 2017 31
Appendix
Statement of Risk
Equities - Stock market returns are difficult to forecast because of fluctuations in the economy, investor psychology,geopolitical conditions and other important variables.
Required Disclosures
Analyst Certification
Each research analyst primarily responsible for the content of this research report, in whole or in part, certifies that withrespect to each security or issuer that the analyst covered in this report: (1) all of the views expressed accurately reflecthis or her personal views about those securities or issuers; and (2) no part of his or her compensation was, is, or will be,directly or indirectly, related to the specific recommendations or views expressed by that research analyst in the researchreport.
CIO Wealth Management Research equity selection systemEquity sector strategists provide three equity selections: Most Preferred (MP), Least Preferred (LP) and Bellwetherdesignation.
Rating definitionsMost Preferred*: The equity sector strategist expects the stock to outperform the relevant benchmark in the next 12months.Least Preferred*: The equity sector strategist expects the stock to underperform the relevant benchmark in the next12 months.Bellwether: Stocks that are of high importance or relevance to the sector and which the equity sector strategist expectsthe stock to perform broadly in line with the sector benchmark in the next 12 months.*A stock cannot be selected as Most Preferred if UBS Investment Research rates it a Sell, while a UBS Investment ResearchBuy rated stock cannot be selected as Least Preferred.
Restricted: Issuing of research on a company by CIO Americas, WM can be restricted due to legal, regulatory, contractualor best business practice obligations which are normally caused by UBS Investment Bank’s involvement in an investmentbanking transaction in regard to the concerned company.
Technical Research Rating Definitions
Rating Corresponding Rating Category Definition and criteriaBullish Buy Well-defined, reliable uptrend, an increase in the rate of change
(or strong momentum) and confirming technical indicators.Neutral Hold Trading range trend, a flat rate of change and confirming
technical indicators.Bearish Sell Negative or weakened trend, momentum and confirming
technical indicators.N/A Not enough historical data to make an evaluation.
For a complete set of required disclosures relating to the companies that are the subject of this report, please mail arequest to UBS CIO Americas, Wealth Management Business Management, 1285 Avenue of the Americas, 20th Floor,Avenue of the Americas, New York, NY 10019.
Disclosures (30 May 2017)3M Co. 1, 3, 4, Abbott Laboratories 1, 3, 4, AbbVie 1, 2, 5, Accenture Plc 1, 3, 4, 6, Alphabet Inc. Class A 1, 2, 5, 11,Altria Group Inc. 1, 3, 4, Amazon.com Inc. 1, 3, 4, Amgen Inc. 1, 2, 3, 4, 5, 7, 8, Apple Inc. 1, 2, 3, 4, 5, AT&T Inc. 1, 2,3, 4, 10, Bank of America 1, 2, 3, 4, 5, 7, 10, 11, 12, 13, Berkshire Hathaway Inc. 1, 2, 9, Boeing Co. 1, 3, 4, 9, Bristol-Myers Squibb Co. 1, 3, 4, Campbell Soup Co. 1, 3, 4, Celgene Corp. 1, 2, 5, 11, Chevron 1, 2, 3, 4, 11, Cisco SystemsInc. 1, 2, 3, 4, 7, 10, 11, 14, Coca-Cola Co. 1, 2, 3, 4, 5, CVS Health 1, 3, 4, 6, 15, Exxon Mobil 1, 2, 3, 4, 11, Facebook1, General Electric Co. 1, 2, 3, 4, 5, 9, 11, 16, Home Depot Inc. 1, 3, 4, 6, Honeywell International Inc. 1, 2, 3, 4, 6, 11,Intel Corp. 1, 2, 3, 4, 5, 6, 9, 10, 11, Intl Business Machines 1, 2, 3, 4, 5, 10, Johnson and Johnson 1, 2, 3, 4, 7, 8, 10, 11,
Technical Review of Stocks
UBS Chief Investment Office Americas, Wealth Management 30 May 2017 32
Appendix
JPMorgan 1, 2, 3, 4, 5, 7, 11, 17; McDonald's Corp. 1, 3, 4, 6, 9, Medtronic Inc. 1, 2, 5, 6, 10, 11, Merck and Co Inc 1, 2,3, 4, 5, 9, 10, 11, Microsoft Corp. 1, 2, 3, 4, 5, 10, 11, 16, Mondelez International 1, 2, 3, 4, 10, Nike Inc. 1, OccidentalPetroleum 1, PepsiCo Inc. 1, 2, 3, 4, 5, 7, 8, 10, 11, Pfizer Inc. 1, 2, 3, 4, 11, 16, Philip Morris Intl Inc. 1, 2, 3, 4, 7, 8,10, Procter & Gamble Co. 1, 3, 4, Schlumberger 1, 3, 4, Starbucks Corp. 1, 2, 5, 6, 15, Texas Instruments Inc. 1, 3, 4, 6,United Parcel Service Inc. 1, 2, 3, 4, 5, 7, 8, 11, United Technologies Corp. 1, 2, 3, 4, 6, 9, 15, Verizon CommunicationsInc. 1, 2, 3, 4, 7, 8, 10, Visa Inc. 1, 2, 5, Walt Disney Co. 1, 3, 4, 9, 16, Wells Fargo 1, 2, 3, 4, 5, 7, 8, 9, 10, 11,
1. UBS Securities LLC makes a market in the securities and/or ADRs of this company.2. Within the past 12 months, UBS Securities LLC and/or its affiliates have received compensation for products andservices other than investment banking services from this company/entity.3. This company/entity is, or within the past 12 months has been, a client of UBS Financial Services Inc, and non-investment banking securities-related services are being, or have been, provided.4. Within the past 12 months, UBS Financial Services Inc has received compensation for products and services otherthan investment banking services from this company.5. This company/entity is, or within the past 12 months has been, a client of UBS Securities LLC, and non-securitiesservices are being, or have been, provided.6. UBS Financial Services Inc., its affiliates or subsidiaries owns a net long position exceeding 0.5% of the total issuedshare capital of this company.7. UBS AG, its affiliates or subsidiaries expect to receive or intend to seek compensation for investment banking servicesfrom this company/entity within the next three months.8. UBS AG, its affiliates or subsidiaries has acted as manager/co-manager in the underwriting or placement of securitiesof this company/entity or one of its affiliates within the past 12 months.9. The equity analyst covering this company, a member of his or her team, or one of their household members has along common stock position in this company.10. This company/entity is, or within the past 12 months has been, a client of UBS Securities LLC, and investmentbanking services are being, or have been, provided.11. This company/entity is, or within the past 12 months has been, a client of UBS Securities LLC, and non-investmentbanking securities-related services are being, or have been, provided.12. UBS Limited is acting as financial adviser for Lloyds Banking Group on the acquisition of MBNA Ltd from Bank ofAmerica13. UBS Limited is acting as sole financial advisor to HSH Nordbank in relation to the sale of it's non-performing loanportfolio to Macquarie Bank Ltd. and Bank of America Corporation14. UBS is acting as financial advisor to AppDynamics for its acquisition by Cisco Systems Inc.15. UBS AG, its affiliates or subsidiaries beneficially owned 1% or more of a class of this company's common equitysecurities as of last month's end (or the prior month's end if this report is dated less than 10 days after the most recentmonth's end).16. The UBS Wealth Management strategist, a member of his or her team, or one of their household members has along common stock position in this company.17. The equity analyst covering this company was previously an employee of the company during the past 12 monthsand received compensation from the company during that employment.
Technical Review of Stocks
UBS Chief Investment Office Americas, Wealth Management 30 May 2017 33
Appendix
Disclaimer
In certain countries UBS AG is referred to as UBS SA. This publication is for our clients’ information only and is not intendedas an offer, or a solicitation of an offer, to buy or sell any investment or other specific product. It does not constitute apersonal recommendation or take into account the particular investment objectives, financial situation and needs of anyspecific recipient. We recommend that recipients take financial and/or tax advice as to the implications of investing in anyof the products mentioned herein. We do not provide tax advice. The analysis contained herein is based on numerousassumptions. Different assumptions could result in materially different results. Other than disclosures relating to UBS AG,its subsidiaries and affiliates, all information expressed in this document were obtained from sources believed to be reliableand in good faith, but no representation or warranty, express or implied, is made as to its accuracy or completeness. Allinformation and opinions are current only as of the date of this report, and are subject to change without notice. Thispublication is not intended to be a complete statement or summary of the securities, markets or developments referredto in the report. Opinions may differ or be contrary to those expressed by other business areas or groups of UBS AG,its subsidiaries and affiliates. Research publications from Chief Investment Office Americas, Wealth Management(CIO Americas, WM), formerly known as CIO Wealth Management Research,are written by UBS Wealth Managementand UBS Wealth Management Americas, Business Divisions of UBS AG (UBS) or an affiliate thereof (collectively, UBS).UBS Investment Research is written by UBS Investment Bank. Except for economic forecasts, the research process ofCIO Americas, WM is independent of UBS Investment Research. As a consequence research methodologies appliedand assumptions made by CIO Americas, WM and UBS Investment Research may differ, for example, in terms ofinvestment horizon, model assumptions, and valuation methods. Therefore investment recommendations independentlyprovided by the two UBS research organizations can be different. The analyst(s) responsible for the preparation ofthis report may interact with trading desk personnel, sales personnel and other constituencies for the purpose ofgathering, synthesizing and interpreting market information. The compensation of the analyst(s) who prepared this reportis determined exclusively by research management and senior management (not including investment banking). Analystcompensation is not based on investment banking, sales and trading or principal trading revenues, however, compensationmay relate to the revenues of UBS as a whole, of which investment banking, sales and trading and principal tradingare a part.UBS AG, its affiliates, subsidiaries and employees may trade as principal and buy and sell securities identified herein. Atany time, investment decisions (including whether to buy, sell or hold securities) made by UBS and its employees maydiffer from or be contrary to the opinions expressed in UBS research publications. Some investments may not be readilyrealizable since the market in the securities is illiquid and therefore valuing the investment and identifying the risk towhich you are exposed may be difficult to quantify. UBS relies on information barriers to control the flow of informationcontained in one or more areas within UBS, into other areas, units, groups or affiliates of UBS. Some investments may besubject to sudden and large falls in value and on realization you may receive back less than you invested or may be requiredto pay more. Changes in foreign currency exchange rates may have an adverse effect on the price, value or income ofan investment. Past performance of an investment is not a guide to its future performance. Additional information willbe made available upon request. This report is for distribution only under such circumstances as may be permitted byapplicable law. The securities described herein may not be eligible for sale in all jurisdictions or to all categories of investors.Distributed to US persons by UBS Financial Services Inc. or UBS Securities LLC, subsidiaries of UBS AG. UBS SwitzerlandAG, UBS Deutschland AG, UBS Bank, S.A., UBS Brasil Administradora de Valores Mobiliarios Ltda, UBS Asesores Mexico,S.A. de C.V., UBS Securities Japan Co., Ltd, UBS Wealth Management Israel Ltd and UBS Menkul Degerler AS are affiliatesof UBS AG. UBS Financial Services Incorporated of PuertoRico is a subsidiary of UBS Financial Services Inc. UBS FinancialServices Inc. accepts responsibility for the content of a report prepared by a non-US affiliate when it distributes reportsto US persons. All transactions by a US person in the securities mentioned in this report should be effected through aUS-registered broker dealer affiliated with UBS, and not through a non-US affiliate. The contents of this report have notbeen and will not be approved by any securities or investment authority in the United States or elsewhere. UBS FinancialServices Inc. is not acting as a municipal advisor to any municipal entity or obligated person within the meaning of Section15B of the Securities Exchange Act (the "Municipal Advisor Rule") and the opinions or views contained herein are notintended to be, and do not constitute, advice within the meaning of the Municipal Advisor Rule.Version as per May 2017.UBS specifically prohibits the redistribution or reproduction of this material in whole or in part without the prior writtenpermission of UBS and UBS accepts no liability whatsoever for the actions of third parties in this respect.© UBS 2017. The key symbol and UBS are among the registered and unregistered trademarks of UBS. All rights reserved.
Technical Review of Stocks
UBS Chief Investment Office Americas, Wealth Management 30 May 2017 34