Embed Size (px)
Citation preview

Roush Industries, Inc.
Roush Engineering
Gary W. Rogers
Vice President, Advanced Technology
12447 Levan Rd., Livonia, MI 48150 | T: 734-779-7006 | F: 734-779-7972 | www.roush.com
Technical Review of:
The Safer Affordable Fuel-Efficient (SAFE)
Vehicles Rule for Model Years 2021-2026
Passenger Cars and Light Trucks
Final Report
Gary W. Rogers
Vice President, Advanced Technology
Roush Industries, Inc.
October 25, 2018
Roush Industries Page 2 of 37 10/25/2018 2018 NPRM Final Report
About the Author
Gary W. Rogers has been Vice President of Advanced Technology for Roush Industries since
2014. Roush Industries is privately-held with over 4000 employees who perform engineering
research, design, development, testing, precision machining and flexible, low volume
manufacturing and assembly for the automotive and commercial vehicle industries. Roush also
emission certifies, sells and warrants Roush-branded high-performance vehicles and offers
alternative-fueled conversion systems for commercial vehicles and buses which include
propane, natural gas and electric powertrains.
Prior to joining Roush, Mr. Rogers was the founding president of FEV North America, Inc. and
managed this U.S. subsidiary of FEV GmbH for almost 29 years until his retirement in 2013.
FEV is a highly-regarded, powertrain and vehicle engineering research, design, development
and testing company which supports the worldwide automotive, commercial vehicle, marine and
stationary power generation industries. During his tenure, FEV supported EPA in advanced
technology demonstrations and conducted numerous manufacturing cost studies and tear-down
analyses which are referenced in the 2016 Technology Assessment Report for the Final Rule
Making for MY2021-2025 Passenger Cars and Light Trucks.
Specific to the assessment of technology for increasing fuel economy and reduction of
greenhouse gas, Mr. Rogers has served on several National Academies boards and
committees, and coauthored resulting reports. They include:
• Board on Energy & Environmental Systems, The National Academies, (2012-2018)
• Committee for the Assessment of Fuel Economy Technologies for Medium and Heavy-
Duty Vehicles, National Research Council, The National Academies (2013-2018)
• Committee for the Assessment of Technologies for Improving Light-Duty Vehicle Fuel
Economy, National Research Council, National Academy of Sciences (2007-2009)
• Committee on Effectiveness and Impact of Corporate Average Fuel Economy (CAFE)
Standards, National Research Council, National Academy of Sciences (2001– 2002)
In addition, Mr. Rogers has served as a technical reviewer on two (2) reports of importance for
the subject of this technical assessment:
• Assessment of Technologies for Improving Fuel Economy of Light-Duty Vehicles, Phase
2, National Research Council, The National Academy of Sciences (2015)
• Transitions to Alternative Vehicles and Fuels, National Research Council, The National
Academy of Sciences (2013)
Roush Industries Page 3 of 37 10/25/2018 2018 NPRM Final Report
Table of Contents
Executive Summary ...................................................................................................... 4
1.0 Introduction ............................................................................................................. 8
2.0 Review of the 2018 Preliminary Regulatory Impact Analysis .............................. 8
2.1 Vehicle Modeling ................................................................................................ 11
2.2 Incremental Benefits .......................................................................................... 16
2.3 Technology Costs .............................................................................................. 22
3.0 Independent Analysis of Augural Standard-Compliance Pathways ................ 23
3.1 Small SUV Compliance with MY2025 Augural Standards .............................. 24
3.2 Full-Size Pickup Compliance with 2025 Augural Standards .......................... 27
4.0 Conclusions ........................................................................................................... 30
Appendix 1: GT-Power Analysis of Small SUV ......................................................... 31
Appendix 2: GT-Power Analysis of Full-Size Pickup ............................................... 35

Roush Industries Page 4 of 37 10/25/2018 2018 NPRM Final Report
Technical Review of:
The Safer Affordable Fuel-Efficient (SAFE) Vehicles Rule for
Model Years 2021-2026 Passenger Cars and Light Trucks
Final Report
Executive Summary
Introduction
Gary W. Rogers, and Roush Industries, Inc., were retained by the California Department of
Justice, Office of the Attorney General, to conduct a technical review of The Safer Affordable
Fuel-Efficient (SAFE) Vehicles Rule for Model Years 2021-2026 Passenger Cars and Light
Trucks, (83 Fed. Reg. 42,986, Aug. 24, 2018) hereafter referred to as the “Federal Proposal.”
Roush has completed a technical review of the Federal Proposal, including the 2018 Notice of
Proposed Rulemaking (NPRM), the Preliminary Regulatory Impact Analysis (2018 PRIA), and
other associated vehicle simulations, published CAFE modeling results and related appendices.
We have also examined the 2016 Draft Technical Assessment Report (2016 Draft TAR)
submitted by EPA and NHTSA (hereafter referred to as “the Agencies”) as part of the midterm
evaluation of light-duty vehicle final rule.
Review of the 2018 Preliminary Regulatory Impact Analysis
Our assessment finds the 2018 PRIA projected average costs for technology implementation to
achieve the existing standards to be significantly overstated and in conflict with the 2016 Draft
TAR cost estimates generated by the Agencies only two years earlier, as shown in Table ES-1.
Further, we find the 2016 Draft TAR analyses of cost and incremental fuel economy
improvement to achieve the model year MY2025 standard of the augural CAFE and tailpipe
carbon dioxide (CO2)1 standards to be consistent with Roush estimates and other published
data.
Table ES-1: Comparison of 2016 Draft TAR and 2018 PRIA Estimated Compliance Costs
1 The existing GHG emissions standards cover carbon dioxide (CO2), nitrous oxide (N2O), and methane (CH4); this report focuses on the tailpipe CO2 emission standards. 2Due to credit carry-over features in CAFE, the true costs to comply with MY2025 are not realized until MY2028. Such noncompliance is not
permitted in CO2 emission standards.
Predicted Price Increase for MY2025 Vehicle from MY2021 to Comply with
CAFE/CO2
2016 TAR CAFE
(2016$) (MY2028)2
2016 TAR CO2
(2016$)
2018 PRIA CAFE
(2016$)
2018 PRIA CO2
(2016$)
2025 Passenger Car $1,111 $707 $1,730 $1,750
2025 Light Truck $1,246 $1,099 $2,220 $1,960
2025 Combined $1,174 $894 $1,960 $1,850

Roush Industries Page 5 of 37 10/25/2018 2018 NPRM Final Report
Within the scope of effort conducted to date, we found several reasons for the excessively-high
predicted fleet-average costs necessary to comply with the existing standards. They include:
1. Understated Incremental Technology Effectiveness: In many cases, the estimated level
of improvement for individual technology increments are significantly understated due to
inaccurate engine and transmission performance maps or the lack of vehicle system
optimization and calibration which are the state-of-the-art in vehicle system modeling.
2. Understated (or Uncalculated) Synergistic Benefits: In other cases, we found inaccurate
or complete exclusion of synergistic benefits. For example, while maintaining constant
vehicle performance, varying engine characteristics allow other vehicle systems, such as
gear ratio spreads or transmission shift strategies to be optimized for improved fuel
economy. These benefits were often not modeled or calculated in the Federal Proposal.
3. Exclusion of Incremental Technologies Already in Production: Our review identified
several beneficial technologies which were identified, but not utilized in technology
pathways, such as second generation, high compression ratio engines with cooled EGR.
In another case, the use of Miller-cycle in high compression ratio (CR), turbocharged
engines was excluded completely, despite being in production by VW (1.5L) since 20173.
4. Overstated Costs for Incremental Benefits: In other cases, the estimated cost for
incremental technology improvement is significantly overstated, without explanation or
reference. This is particularly true for Atkinson-cycle high compression ratio engines,
and both mild and strong hybrids due to uncharacteristically high battery costs.4
5. Constrained Technology Pathways: Functional constraints exist in the CAFE model
which cause over-compliance in some scenarios, under-compliance in others, artificial
product development cadence and prescribed technology pathways that force illogical
technology application. For example, the CAFE model forces application of cooled EGR
in the pathway higher CR engines with almost no fuel economy improvement predicted.
Coupled with an overly-stated cost, this creates a very illogical, cost-inefficient pathway.
Roush Independent Analysis of Existing Standard-Compliance Pathways
To help quantify the effects the five above-stated issues have on compliance cost exaggeration,
Roush conducted independent fuel economy (FE) technology pathway modeling for two (2)
vehicle classes: 1) Small SUV; and 2) Full-size Pickup.
Roush developed state-of-the-art engine maps based on production engines, which were
adapted using the automotive industry-accepted GT-Power simulation code. We then developed
transmission maps to maximize FE using industry-accepted optimization strategies within the
GT-Drive vehicle simulation code, while maintaining constant vehicle performance. Finally, we
evaluated different engine technologies, varied gear ratios, shift strategies, vehicle weight,
3 “Volkswagen Millerized 1.5L TSI ACT BlueMotion gasoline engine offers diesel-like fuel economy” Green Car Congress, March 19, 2018. (https://www.greencarcongress.com/2018/03/20180319-vw15.html) 4 NHTSA and EPA, The Safer Affordable Fuel-Efficient (SAFE) Vehicles Rule for Model Year 2021 – 2026 Passenger Cars and Light Trucks, Preliminary Regulatory Impact Analysis, Page 1105, Tables 9-3 and 9-4, July 2018
Roush Industries Page 6 of 37 10/25/2018 2018 NPRM Final Report
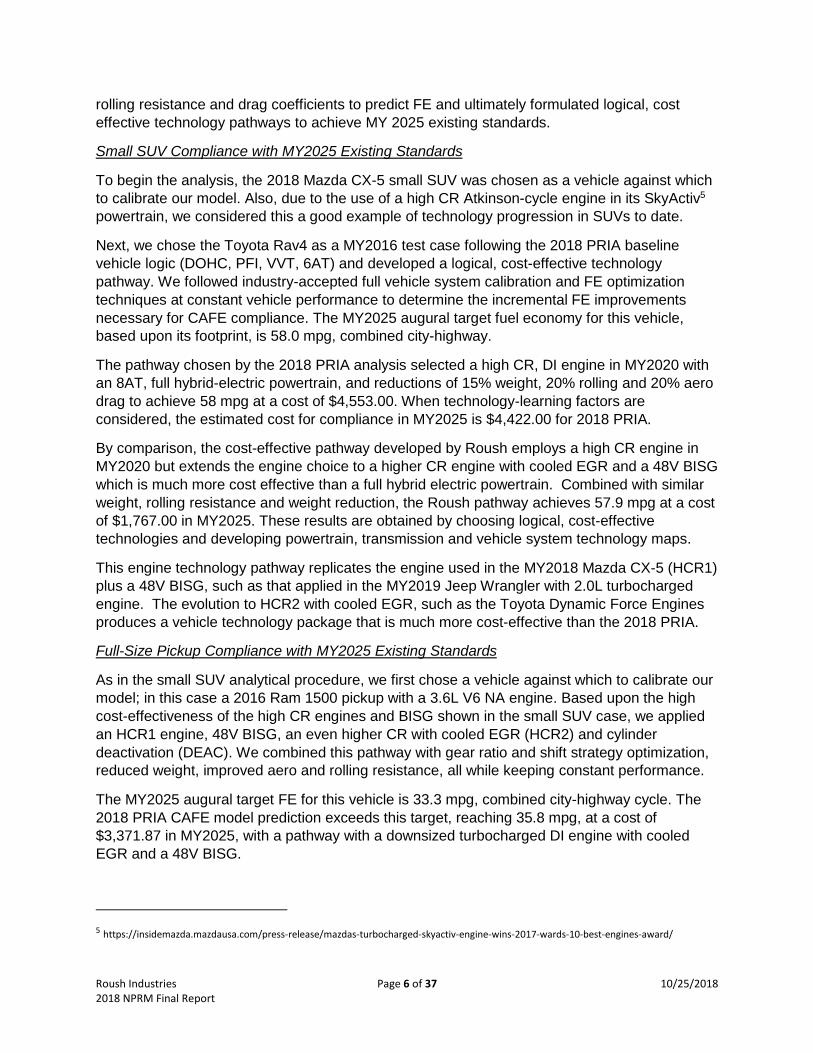
rolling resistance and drag coefficients to predict FE and ultimately formulated logical, cost
effective technology pathways to achieve MY 2025 existing standards.
Small SUV Compliance with MY2025 Existing Standards
To begin the analysis, the 2018 Mazda CX-5 small SUV was chosen as a vehicle against which
to calibrate our model. Also, due to the use of a high CR Atkinson-cycle engine in its SkyActiv5
powertrain, we considered this a good example of technology progression in SUVs to date.
Next, we chose the Toyota Rav4 as a MY2016 test case following the 2018 PRIA baseline
vehicle logic (DOHC, PFI, VVT, 6AT) and developed a logical, cost-effective technology
pathway. We followed industry-accepted full vehicle system calibration and FE optimization
techniques at constant vehicle performance to determine the incremental FE improvements
necessary for CAFE compliance. The MY2025 augural target fuel economy for this vehicle,
based upon its footprint, is 58.0 mpg, combined city-highway.
The pathway chosen by the 2018 PRIA analysis selected a high CR, DI engine in MY2020 with
an 8AT, full hybrid-electric powertrain, and reductions of 15% weight, 20% rolling and 20% aero
drag to achieve 58 mpg at a cost of $4,553.00. When technology-learning factors are
considered, the estimated cost for compliance in MY2025 is $4,422.00 for 2018 PRIA.
By comparison, the cost-effective pathway developed by Roush employs a high CR engine in
MY2020 but extends the engine choice to a higher CR engine with cooled EGR and a 48V BISG
which is much more cost effective than a full hybrid electric powertrain. Combined with similar
weight, rolling resistance and weight reduction, the Roush pathway achieves 57.9 mpg at a cost
of $1,767.00 in MY2025. These results are obtained by choosing logical, cost-effective
technologies and developing powertrain, transmission and vehicle system technology maps.
This engine technology pathway replicates the engine used in the MY2018 Mazda CX-5 (HCR1)
plus a 48V BISG, such as that applied in the MY2019 Jeep Wrangler with 2.0L turbocharged
engine. The evolution to HCR2 with cooled EGR, such as the Toyota Dynamic Force Engines
produces a vehicle technology package that is much more cost-effective than the 2018 PRIA.
Full-Size Pickup Compliance with MY2025 Existing Standards
As in the small SUV analytical procedure, we first chose a vehicle against which to calibrate our
model; in this case a 2016 Ram 1500 pickup with a 3.6L V6 NA engine. Based upon the high
cost-effectiveness of the high CR engines and BISG shown in the small SUV case, we applied
an HCR1 engine, 48V BISG, an even higher CR with cooled EGR (HCR2) and cylinder
deactivation (DEAC). We combined this pathway with gear ratio and shift strategy optimization,
reduced weight, improved aero and rolling resistance, all while keeping constant performance.
The MY2025 augural target FE for this vehicle is 33.3 mpg, combined city-highway cycle. The
2018 PRIA CAFE model prediction exceeds this target, reaching 35.8 mpg, at a cost of
$3,371.87 in MY2025, with a pathway with a downsized turbocharged DI engine with cooled
EGR and a 48V BISG.
5 https://insidemazda.mazdausa.com/press-release/mazdas-turbocharged-skyactiv-engine-wins-2017-wards-10-best-engines-award/

Roush Industries Page 7 of 37 10/25/2018 2018 NPRM Final Report
However, a much more cost-effective path is possible as shown by the Roush-proposed NA,
high CR engine, combined with a BISG, but modeled with accurate effectiveness values and
reasonable cost. The Roush proposal achieves even greater FE, 38.2 mpg by MY2025, and
exceed the augural standards each year from MY2016 to MY2025. At a projected cost of
$2,359.52 in MY2025, the Roush proposal is over $1,000.00 less than the 2018 PRIA analysis
(a projected cost reduction of over 30%) and FE which exceeds the MY2025 target by 15%.
Conclusions
Roush has shown that the use of logical, unrestricted, technology pathways, with incremental
benefits supported by industry-accepted vehicle simulation and dynamic system optimization
and calibration, together with publicly-defensible costs, allows cost-effective solutions to achieve
target fuel economy levels which meet MY2025 existing standards.
It is also important to note that all the technology steps chosen to achieve MY2025 target CAFE
fuel economy levels for our two test cases (Small SUV and Full-Size Pickup) are currently in
production within various platforms across different manufacturers. Therefore, their inclusion in
our exemplar pathways represents a very viable product evolution cycle
Of primary importance is establishing accurate engine maps, transmission maps, fuel economy
optimizing shift strategies, reestablishing transmission gear ratios and shift points as powertrain
and vehicle characteristics change (such as addition of mild hybrid system) and defining
technology pathway algorithms that are consistent with normal product development
constraints. Since we are, in most cases, considering small, incremental improvements in
efficiency, accurate engineering analyses are critical is determining technical viability to achieve
future fuel economy targets.
The development of reasonable cost estimates is also important to understand the probability of
commercial success for future technology approaches. However, variability in worldwide
manufacturing and financial markets, the impact of foreign regulatory climates on new
technology cadence (such as vehicle electrification in China) and other variables make accurate
prediction of component- or system-level costs very challenging. Furthermore, continued
advancements in traditional technology, combined with supplier willingness to reduce margin
with increasing competition, will also influence future technology pricing.
We have not performed a complete fleet-compliance simulation. However, we have identified
many areas for improvement which, if enacted, would likely produce significantly different
results in the overall fleet CAFE compliance assessment.

Roush Industries Page 8 of 37 10/25/2018 2018 NPRM Final Report
Technical Review of:
The Safer Affordable Fuel-Efficient (SAFE) Vehicles Rule for
Model Years 2021-2026 Passenger Cars and Light Trucks
Final Report
1.0 Introduction
Gary W. Rogers, and Roush Industries, Inc., were retained by the California Department of
Justice, Office of the Attorney General, to conduct a technical review of The Safer Affordable
Fuel-Efficient (SAFE) Vehicles Rule for Model Years 2021-2026 Passenger Cars and Light
Trucks, (83 Fed. Reg. 42,986, Aug. 24, 2018) hereafter referred to as the “Federal Proposal.”
The Federal Proposal presents several options to relax the greenhouse gas (GHG) emissions
and corporate average fuel economy (CAFE) standards for model years (MY) 2021 – 2026 with
a primary recommendation to hold the levels constant from MY2020 onward. This rollback
represents a significant relaxation of the existing greenhouse gas emissions standards, the
existing fuel economy standards for MY2021, and the so-called “augural” standards for MY2022
– MY2026 (hereafter referred to as the existing GHG emissions standards or augural CAFE
standards, respectively, or collectively as the existing standards).
Roush has completed a technical review of the Federal Proposal, including the 2018 Notice of
Proposed Rulemaking (NPRM), the Preliminary Regulatory Impact Analysis (2018 PRIA), and
other associated vehicle simulation analyses, published CAFE modeling results and related
appendices.
We have also examined the 2016 Draft Technical Assessment Report (2016 Draft TAR)
submitted by the Environmental Protection Agency and the National Highway Traffic Safety
Administration (hereafter referred to as “the Agencies”) as part of the midterm evaluation of
light-duty vehicle final rule and the 2015 National Research Council report titled “Cost,
Effectiveness, and Deployment of Fuel Economy Technologies for Light-Duty Vehicles” (2015
NRC). In addition, we have reviewed the 2010 EPA Regulatory Impact Analysis (2010 RIA) for
the Agencies’ final rulemaking for model years 2012-2016.
2.0 Review of the 2018 Preliminary Regulatory Impact Analysis
Our assessment finds the 2018 PRIA projected average costs for technology implementation to
achieve the augural MY2022-MY2025 light-duty vehicle standards to be significantly overstated
and in conflict with the 2016 Draft TAR cost estimates generated by the Agencies only two
years earlier. Further, we find the 2016 Draft TAR analyses of cost and incremental fuel
economy improvement of incremental vehicle subsystems to achieve MY2025 CAFE and CO2
standards to be consistent with Roush estimates and other published data.
Roush Industries Page 9 of 37 10/25/2018 2018 NPRM Final Report
Table 1: Comparison of 2016 Draft TAR and 2018 PRIA Estimated Compliance Costs
Within the scope of effort conducted to date, we found several reasons for the excessively-high
predicted fleet-average costs necessary to comply with the existing standards. They include:
1. Understated Incremental Technology Effectiveness: In many cases, the estimated level
of improvement for individual technology increments are significantly understated,
because of inaccurate engine and transmission performance maps, the lack of vehicle
system optimization and calibration which are the state-of-the-art in vehicle system
modeling, or other background information that has not been disclosed. By example, the
fuel economy benefit of start-stop with torque assist from a Belt Integrated Starter
Generator (BISG) is estimated at about 5%, whereas accurate system modeling and a
48V BISG in production (MY2019 Ram Truck) show improvements over 10%7.
2. Understated (or Uncalculated) Synergistic Benefits: In other cases, we found incorrect
application, or exclusion, of synergistic benefits, caused by lack of transient system
modeling. For example, while maintaining constant vehicle performance, changing
engine characteristics can allow other vehicle systems, such as gear ratio spreads,
differential gear ratios, or transmission shift strategies to be optimized for improved fuel
economy. These benefits were often not modeled or calculated in the Federal Proposal.
3. Exclusion of Incremental Technologies Already in Production: Our review identified
several incremental technologies which were identified, but not utilized in technology
pathways, such as second generation, high compression ratio engines with cooled EGR
for knock mitigation. In another example, the use of Miller-cycle features in high
compression ratio, turbocharged engines was excluded completely, even though VW
introduced in a turbocharged engine with Miller-cycle valve timing in MY20178.
4. Overstated Costs for Incremental Benefits: In other cases, the estimated cost for
incremental technology improvement is significantly overstated, without explanation or
reference. This is particularly true for mild hybrids (48V Belt-Integrated Starter
Generators) and strong hybrids (high voltage, parallel hybrid such as Toyota Prius)
where estimated costs are more than 2x the estimated costs in the 2016 Draft TAR.
6 Due to credit carry-over features in CAFE, the true costs to comply with MY2025 are not realized until MY2028. Such noncompliance is not
permitted in CO2 emission standards. 7 “First Drive: 2019 Ram 1500 eTorque Mild Hybrid,” Truck Trend, September 11, 2018, (http://www.trucktrend.com/features/1809-first-drive-
2019-ram-1500-etorque-mild-hybrid) 8 “Volkswagen Millerized 1.5L TSI ACT BlueMotion gasoline engine offers diesel-like fuel economy” Green Car Congress, March 19, 2018.
(https://www.greencarcongress.com/2018/03/20180319-vw15.html)
Predicted Price Increase for MY2025 Vehicle from MY2021 to Comply with
CAFE/CO2
2016 TAR CAFE
(2016$) (MY2028)6
2016 TAR CO2
(2016$)
2018 PRIA CAFE
(2016$)
2018 PRIA CO2
(2016$)
2025 Passenger Car $1,111 $707 $1,730 $1,750
2025 Light Truck $1,246 $1,099 $2,220 $1,960
2025 Combined $1,174 $894 $1,960 $1,850

Roush Industries Page 10 of 37 10/25/2018 2018 NPRM Final Report
5. Constrained Technology Pathways: Functional constraints are present in the CAFE
model which result in over-compliance in some scenarios, under-compliance in others,
and artificial cadence in product development cycles and prescribed step-wise
technology paths that force the application of technologies in illogical ways. For
example, the CAFE model forces application of cooled exhaust gas recirculation within
the evolution of higher compression ratio engines. However, there is almost no fuel
economy improvement predicted. Coupled with an excessively-high approximated cost,
this creates a very illogical, cost-inefficient pathway.
In fact, based upon the rapidly-falling costs of batteries and other hybrid-electric components
observed between calendar year (CY)2016 and CY20189, the 2016 Draft TAR projections for an
“average vehicle” across the U.S. annual new vehicle sales between MY2021 and MY2025 are
likely somewhat overstated. However, the battery and hybrid-related component costs in the
2018 PRIA are excessively high.
Comparison of incremental fuel economy improvements for technology features between 2015
NRC and 2016 Draft TAR found the correlation to be quite good and the incremental technology
fuel economy improvement values very consistent with Roush estimates. However, a direct
comparison for all fleet classes, projected vehicle types and fleet mix was not performed.
The 2016 Draft TAR included a summary table (Table 2) of bundled technology packages and
their estimated improvements in fuel consumption for application to different vehicle classes.10
The table also provides a comparison to the analyses for the original 2012 Rule which were
conducted in 2009. Effectiveness is defined as the percent improvement in fuel economy for a
given technology package over a baseline engine configuration. The 2012 final rule making
(FRM) is compared to the 2016 Draft TAR.
Our assessment of the 2018 PRIA analysis has identified many technical errors, improper
assumptions and unusual analytical model boundary conditions which do not follow normal
industry practices. This is likely due to technology path application logic which controls how
incremental fuel economy (FE) improvement factors and their associated costs are chosen.
9 “USABC Cost Model – 2018,” U.S. Advanced Battery Consortium, LLC, October 22, 2018,
(http://www.uscar.org/guest/article_view.php?articles_id=143) 10 Table 5.64, EPA and NHTSA, Draft Technical Assessment Report, 2016
Table 2: FRM to Draft TAR Engine Technology Package Effectiveness Comparison

Roush Industries Page 11 of 37 10/25/2018 2018 NPRM Final Report
We found, in some cases, unreasonable component and subsystem costs, inaccurate
incremental FE improvement estimations, and likely improperly-generated technology pathways.
These errors result in an over prediction of aggregated individual subsystem costs. In other
cases, the understated incremental FE improvements for individual technology steps requires
an excessive number to technology increments to achieve fuel economy targets. Such factors
will result in overprediction of costs to comply with relevant CAFE and CO2 standards.
2.1 Vehicle Modeling
Our review of the vehicle modeling approach employed in the 2018 PRIA to predict individual
vehicle FE has identified a significant number of errors. Some lead to over prediction of FE
improvement while other errors result in under prediction which influences incremental selection.
Important, however, is that, while utilizing these inputs, the incremental selection algorithm was
observed to produce unrealistic technology pathways, in many cases.
In other cases, the finally-predicted, individual vehicle FE, after all technology enhancements are
applied, appears somewhat reasonable, due to opportunistically offsetting errors. However, the
selection algorithm produces unrealistic pathways, that very significantly affect 2021-2025
projected compliance costs.
Examples:
1. Engine Maps – No Fuel Consumption Penalty at High Load
Several of the base engine maps used in the 2018 PRIA analyses exhibit maximum
thermal efficiency (lowest fuel consumption) at 2000-3000 rpm and at maximum load,
which is unrealistic for normal passenger vehicle engines. Such maps will overpredict
fuel economy for extremely down-sized applications (very small engine in a heavy
vehicle). This is because there is no fuel economy penalty for running the engine at high
loads point where, in reality, BSFC is high due to retarding spark timing to prevent
knocking and fuel enrichment to reduce exhaust temperatures to protect exhaust valves
and turbocharger components.
Figure 1: BSFC map for 2018 PRIA_Eng12 (93 Octane)

Roush Industries Page 12 of 37 10/25/2018 2018 NPRM Final Report
Figure 2: PRIA_Eng 12 (1.6 liter Turbo DI with Dual VVT and intake VVL) on 87 and 93 octane fuel
2. Engine Maps – Variation in Cylinder Size
The engines modelled and used in the 2018 PRIA analyses range from a 2.0L, 4-
cylinder to a 1.2L, 4-cylinder and a 1.0L, 3-cylinder. Within these configurations, the size
of the cylinder varies from 500cc to 300cc. These variations in combustion chamber size
would significantly alter combustion, heat transfer (small cylinders have high surface-to-
volume ratio and higher heat transfer losses), knocking tolerance and other important
operating parameters. Therefore, a more accurate simulation, which would improve
incremental FE improvement, should maintain a 500cc cylinder displacement and vary
the number of cylinders or expected fuel consumption maps.
3. Engine Maps – Continuously Variable Valve Lift
In the 2018 PRIA engine examples, the base turbocharged engine is assumed to have
VVL. With a turbocharged engine, the benefit of VVL over dual VVT is limited.
Accordingly, almost all vehicle manufacturers use lower-cost Dual VVT systems in their
turbocharged engines. The base turbocharged engine assumption is unrealistic with
correspondingly high cost, which, if corrected, would allow appropriate technology
pathways to be used.
4. Engine Maps – Effect of Cooled Exhaust Gas Recirculation
The 2018 PRIA analysis applies cooled EGR to turbocharged engines in an extremely
narrow window at high engine speed and high load. The 2018 PRIA modeling
erroneously excludes the application of cooled EGR in engine operating modes that
highly influence overall vehicle fuel economy. This exclusion of the benefits associated
with knock mitigation and reduced enrichment significantly understates incremental

Roush Industries Page 13 of 37 10/25/2018 2018 NPRM Final Report
improvement. The, Mazda 2.5L turbocharged SkyActiv engine exemplifies a wider-range
cooled EGR strategy.
5. Engine Maps – Skip-Fire Variable Displacement
The 2018 PRIA analysis does not properly consider the very cost-effective benefits of
skip-fire technology which produces the net effect of variable displacement at very low
cost. Due to extremely high estimated cost ($1,250.00 in MY2016), the benefits of this
technology will likely not be chosen in any reasonable technology pathway. If included,
the predicted cost for that pathway will be overestimated by $750.00 - $1,000.00.
6. Engine Maps – Turbocharging plus Miller-Cycle
The 2018 PRIA analysis does not consider the combination of turbocharging and Miller-
Cycle. Much like the Atkinson cycle, Miller-Cycle uses variable valve timing to create a
greater expansion stroke than compression stroke, but applied to turbocharged engines.
The VW 2.0L EA888 Gen3B - DI turbocharged engine utilizes early intake valve closure,
combined with higher boost turbocharging, to achieve acceptable performance while
maintaining the efficiency benefits of Miller-Cycle. It is unreasonable to exclude this
potential technology, since it is already in production. The omission will limit the
effectiveness for turbocharged engines and cause adoption of more expensive solutions,
thereby overstating the cost to achieve target CAFE fuel economy levels.
7. Engine Maps - Gasoline Variable Geometry Turbocharger (VGT)
A VGT enables better low-end torque and drivability without having to use a very small
turbine, a compromise when using conventional turbocharger which increases
backpressure and reduces efficiency over large positions of the engine map. VW
introduced the EA211 TSI Evo engine in Europe in 2017, which is a 1.5-liter DI
turbocharged Miller-Cycle gasoline engine with Variable Geometry Turbocharger (VGT).
The 2018 PRIA does not include gasoline VGT engines which enable, among other
Figure 3: PRIA_Eng13 and -Eng14, downsized 1.2 liter with (left) and without (right) cooled EGR

Roush Industries Page 14 of 37 10/25/2018 2018 NPRM Final Report
advantages, cost-effective Miller-Cycle applications, which under predicts potential FE
improvements.
8. Transmission Maps – Transmission Ratios
The 2018 PRIA analysis assumes that all transmissions with a given number of ratios (8-
speed, 10-speed) maintain the same individual step ratios and shift maps, independent
of the engine or hybrid-electric technology to which it is mated. This will result in
powertrain inefficiencies and under-predict potential fuel economy benefits.
9. Transmission Maps – Shift Busyness
For some engine/vehicle combinations, the 2018 PRIA analysis calculates an extremely
high number of transmission shifts (136 shifts) to occur during the US06 driving cycle.
Such busyness would be completely unacceptable to passengers and over predicts the
energy losses associated with such an extreme number of shifts.
Figure 4: Shifting events
10. Electrification – Belt Integrated Starter Generator (BISG)
BISGs, which allow start-stop and supplemental torque, are gaining in market share. The
introduction of 48-volt systems supports increased efficiencies in other vehicle systems,
such as electrically-driven air conditioning compressors. The 2018 PRIA analysis of a
BISG applied to full size pickup truck predicts a significantly-underpredicted FE

Roush Industries Page 15 of 37 10/25/2018 2018 NPRM Final Report
improvement of 5.3%. For comparison, the FE benefit of a 48-volt BISG in the MY2018
Ram Pickup, showed 10% incremental improvement11.
11. Electrification – Crankshaft Integrated Starter Generator (CISG)
CISGs are integrated into the block to mount the electric motor/generator. The CISGs
allow more torque transfer than belt driven systems and expands the total system
integration to include modifying engine operating parameters for synergistic efficiency
improvements. The 2018 PRIA shown negligible improvement of CISG over BISG, which
is significantly understated. Mitsubishi Electric is supplying the first production system to
Mercedes-Benz12, but current high costs and larger dimensions, compared to BISGs, will
likely delay major market penetration until beyond the MY2025 time-horizon.
Other examples of inaccurate subsystem performance, which result in erroneous vehicle-level
fuel economy improvement and inappropriate technology pathways to achieve fleet FE targets
are included below.
12. The 2018 PRIA transmission modeling does not accurately capture the losses and FE
penalty associated with a shift event.
13. The 2018 PRIA transmission modeling does not incorporate the concept of “Skip shifting”
which is important for reducing shift busyness and increasing FE especially in vehicles
equipped with transmission with a large number of ratios (8-10).
14. In the 2018 PRIA, as powertrain technology is added to individual vehicles, the final
drive ratio is kept a constant. This ignores efficiency benefits due to down-speeding that
are enabled by some of the powertrain technologies identified. Also, the transmission
gear ratios are not optimized for a vehicle - powertrain combination which understates
potential FE improvements.
15. Rolling resistance in the 2018 PRIA is erroneously assumed to be the same across
different vehicle classes. Depending upon the vehicle size, power, acceleration and
performance package, rolling resistance will vary.
16. There is a fuel economy penalty which occurs when the engine engages and
disengages mechanically-derived cylinder deactivation. The 2018 PRIA does not
consider this effect, which overstates the potential benefit. Proper consideration of these
penalties would emphasize the very cost-effective skip-fire technology which was not
included as a potential incremental technology. The net result will be an overestimation
of cost to achieve a FE target.
11 “First Drive: 2019 Ram 1500 eTorque Mild Hybrid,” Truck Trend, September 11, 2018, (http://www.trucktrend.com/features/1809-first-drive-2019-ram-1500-etorque-mild-hybrid) 12 “Mitsubishi Electric Begins Mass-producing Auto Industry’s First Crankshaft ISG System for 48V Hybrid Vehicles,” Public Relations Division, Mitsubishi Electric Corporation, Press Release No. 3141, October 26, 2017

Roush Industries Page 16 of 37 10/25/2018 2018 NPRM Final Report
17. In addition to the discussion above, the 2018 PRIA additionally under predicts the
efficiency improvement of employing a BISG. Taking advantage of the torque assist of
the electric motor/generator, the engine can be further down-speeded, with a change to
the final drive ratio and the transmission shift logic, which are excluded in the 2018 PRIA
analysis. This causes further underprediction of potential FE incremental improvement.
2.2 Incremental Benefits
To accurately predict potential incremental improvements in FE, it is extremely important to
understand the nature of the improvements being sought by each increment (improved
thermodynamics, reduced friction, reduced vehicle weight, etc.). Without this understanding,
the order, relative improvement, and cost-effectiveness of technology packages will vary
significantly, thereby producing inappropriate results and erroneous conclusions.
As a first step, we reviewed the estimated improvements of discrete technology packages used
in the 2018 PRIA and compared them to equivalent technologies which were presented in the
2016 Draft TAR associated with the midterm evaluation for model years 2022-2025. We then
evaluated the reasonableness of the values based upon other peer-reviewed publications and
our 40-year experience in automotive product design and development.
The results of our initial assessment suggest that there are seemingly wide variations in
estimated incremental benefits associated with individual technology packages between the
2016 Draft TAR and 2018 PRIA. Furthermore, even the bases for evaluation can vary
significantly and inappropriate product improvement pathways result.
Examples:
1. Comparison of 2018 PRIA Turbocharged Engine Maps to State-of-the-art Engines
A principle reason for the understatement of incremental fuel economy improvement in
the 2018 PRIA is the overly-conservative estimate of the underlying combustion engine
efficiencies. Many production engines available today use the same technology packages
as those identified in the 2018 PRIA. However, these state-of-the-art production engines
demonstrate significantly higher efficiencies.
Base Turbocharged engine (Turbo1)
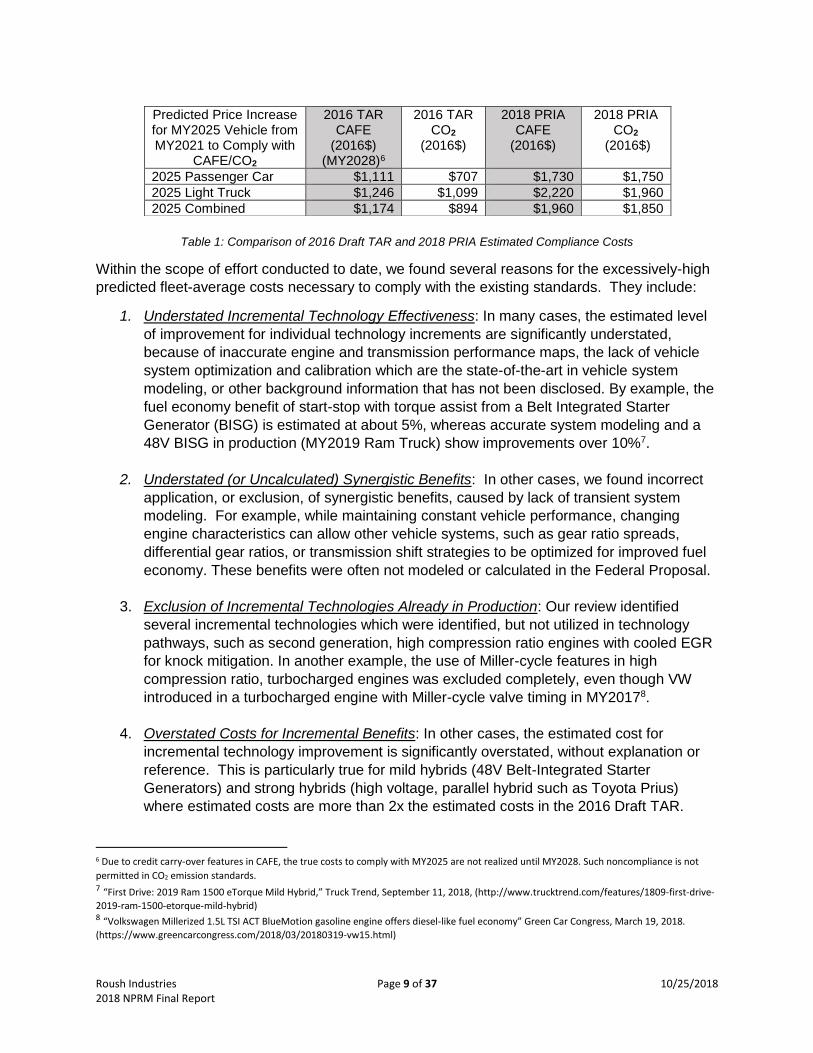
Figures 5, 6 and 7 allow a comparison of the brake-specific fuel consumption (BSFC) of
the baseline turbocharged engine (PRIA_eng12) used in the 2018 PRIA analysis to the
Honda L15B7 1.5L engine available in the 2016 Honda Civic. The units of measure are
grams of fuel consumed per kilowatt hour (g/kWh) of engine output; therefore, lower is
better

Roush Industries Page 17 of 37 10/25/2018 2018 NPRM Final Report
The PRIA_Eng12 turbocharged engine shown in Figure 5 is modeled with continuously
variable valve lift (CVVL) on the intake side. This technology is relatively expensive13
(>$300.00 over VVT in MY2017) but is intended to improve fuel consumption by reducing
the thermodynamic losses due to pumping work while operating at low power levels.
Figure 6 shows a similar BSFC map for the Honda L15B7 turbocharged engine14 that has
continuously variable intake and exhaust camshaft phasing (CVVT) which is less
expensive than CVVL. Figure 7 shows the mathematical difference between the maps.
13 “Cost, Effectiveness, and Deployment of Fuel Economy Technologies for Light-Duty Vehicles,” National Research Council, The National
Academy of Sciences Press, 2015 14 EPA Vehicle and Fuel Emissions Testing Database (https://www.epa.gov/vehicle-and-fuel-emissions-testing/combining-data-complete-
engine-alpha-maps)
Figure 5: BSFC Map of PRIA_Eng12. 1.6L 4-cylinder base turbocharged engine (Source 2018 PRIA)
Roush Industries Page 18 of 37 10/25/2018 2018 NPRM Final Report
Comparison of these fuel consumption maps shows that the Honda engine is almost 10%
more efficient over a significant portion of the map that is most relevant to fuel economy
test cycles. Also, since the L15B7 is the first generation of the new Honda turbocharged
engine, even further fuel consumption improvement is highly likely in the period through
MY2025.
Review of contour shapes in Figure 5 shows that the PRIA_Eng12 is predicted to have its
highest efficiency at very high load and high engine speeds (up to 5,500 rpm). The engine
map shows no degradation in BSFC at engine speeds between 2,000 rpm and 4,500 rpm,
all the way up to peak load (18bar brake mean effective pressure: BMEP).
Figure 6: BSFC map of the Honda 1.5L L15B7 Engine used in the 2016 Honda Civic

Roush Industries Page 19 of 37 10/25/2018 2018 NPRM Final Report
This behavior is unrealistic because turbocharged engines at high loads require retarded
spark timing to prevent knocking and fuel enrichment to prevent overheating of
turbocharger and related components. These factors will increase fuel consumption and
reduce efficiency under real-world conditions.
Another effect of this unrealistic fuel consumption curve would be to predict unreasonably
good fuel consumption at very high power levels for downsized turbocharged engines.
This could bias technology pathways in over-predicting fuel economy benefits for small
engines installed in heavier engines. The predicted performance of the vehicle (drivability,
acceleration, fuel consumption, etc.) would be overly optimistic, creating unrealistic real-
world pathways.
2. Comparison of 2018 PRIA Turbocharged Engine with Cooled EGR to Mazda SkyActiv
Another engine technology pathway is the application of cooled exhaust gas
recirculation (CEGR1) to turbocharged engines which improves fuel economy by helping
to improve knock resistance, which reduces the necessary level of retarding spark timing
to avoid knocking. This allows the compression ratio of the engine to be increased
somewhat, which further improves thermal efficiency.
However, since these are turbocharged engines, which exacerbates knocking tendency,
the increase in compression ratio is less than so-called HCR1 (high compression ratio,
naturally-aspirated, direct injection engine) and HCR2 (HCR1 + cooled EGR) engines
that begin to approach diesel-like efficiencies.
Figure 7: Delta (Honda 1.5L L15B7 – PRIA_Eng12)
Roush Industries Page 20 of 37 10/25/2018 2018 NPRM Final Report
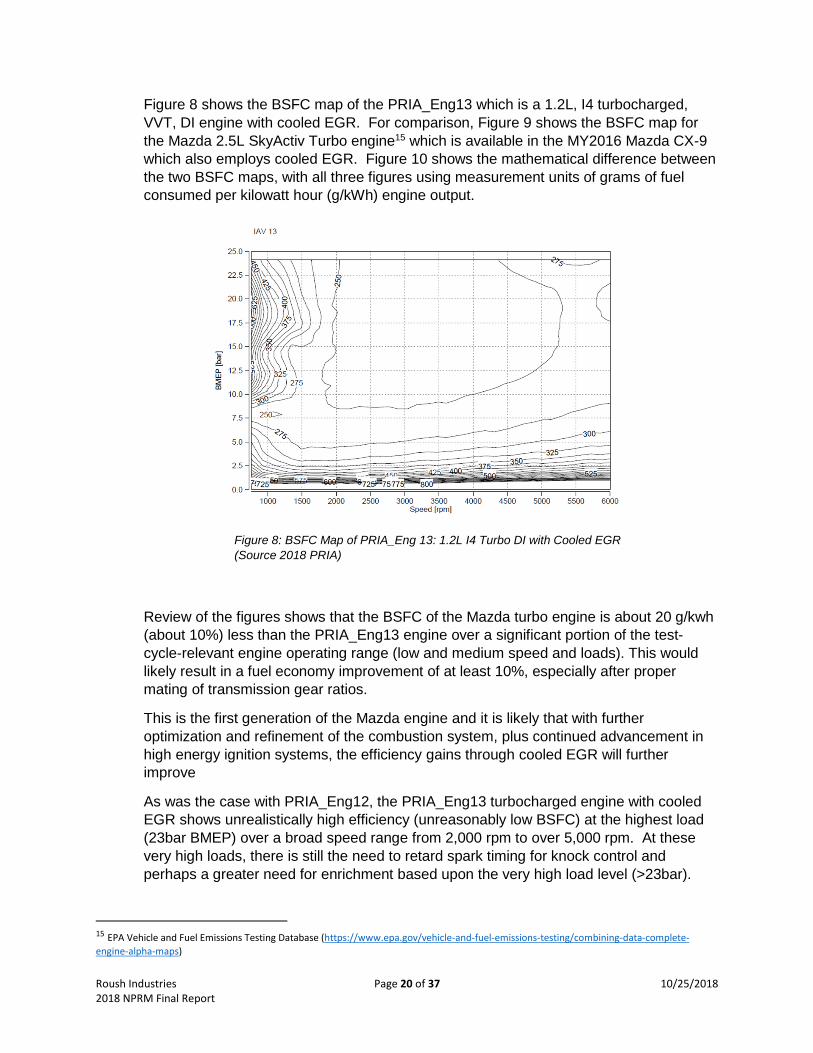
Figure 8 shows the BSFC map of the PRIA_Eng13 which is a 1.2L, I4 turbocharged,
VVT, DI engine with cooled EGR. For comparison, Figure 9 shows the BSFC map for
the Mazda 2.5L SkyActiv Turbo engine15 which is available in the MY2016 Mazda CX-9
which also employs cooled EGR. Figure 10 shows the mathematical difference between
the two BSFC maps, with all three figures using measurement units of grams of fuel
consumed per kilowatt hour (g/kWh) engine output.
Review of the figures shows that the BSFC of the Mazda turbo engine is about 20 g/kwh
(about 10%) less than the PRIA_Eng13 engine over a significant portion of the test-
cycle-relevant engine operating range (low and medium speed and loads). This would
likely result in a fuel economy improvement of at least 10%, especially after proper
mating of transmission gear ratios.
This is the first generation of the Mazda engine and it is likely that with further
optimization and refinement of the combustion system, plus continued advancement in
high energy ignition systems, the efficiency gains through cooled EGR will further
improve
As was the case with PRIA_Eng12, the PRIA_Eng13 turbocharged engine with cooled
EGR shows unrealistically high efficiency (unreasonably low BSFC) at the highest load
(23bar BMEP) over a broad speed range from 2,000 rpm to over 5,000 rpm. At these
very high loads, there is still the need to retard spark timing for knock control and
perhaps a greater need for enrichment based upon the very high load level (>23bar).
15 EPA Vehicle and Fuel Emissions Testing Database (https://www.epa.gov/vehicle-and-fuel-emissions-testing/combining-data-complete-
engine-alpha-maps)
Figure 8: BSFC Map of PRIA_Eng 13: 1.2L I4 Turbo DI with Cooled EGR
(Source 2018 PRIA)
Roush Industries Page 21 of 37 10/25/2018 2018 NPRM Final Report
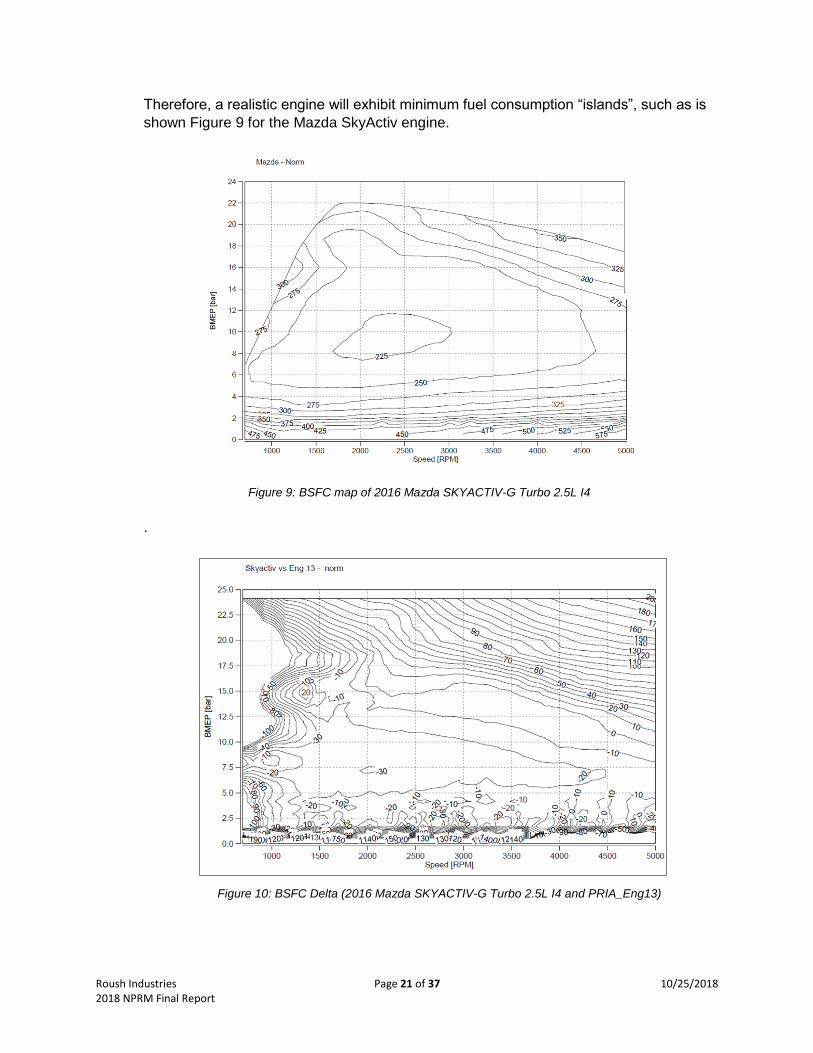
Therefore, a realistic engine will exhibit minimum fuel consumption “islands”, such as is
shown Figure 9 for the Mazda SkyActiv engine.
.
Figure 10: BSFC Delta (2016 Mazda SKYACTIV-G Turbo 2.5L I4 and PRIA_Eng13)
Figure 9: BSFC map of 2016 Mazda SKYACTIV-G Turbo 2.5L I4

Roush Industries Page 22 of 37 10/25/2018 2018 NPRM Final Report
2.3 Technology Costs
As a first step in the assessment of incremental subsystem costs and effectiveness, Roush
compared the estimated costs for technology paths between the 2018 PRIA and the 2016 TAR.
Many significant differences between the cost assumptions were identified are summarized
below.
The Table 3 shows values from 2016 Draft TAR (EPA) and 2018 PRIA (NHTSA) cost analysis
for two engine technology packages. Since the 2018 PRIA and 2016 Draft TAR based their
analysis on different year dollar (2013 for EPA, 2016 for NHTSA), the EPA costs were adjusted
to 2016 dollars, assuming a cumulative 3% rate of inflation.
It is clear, from the comparison results, that the costs for the first technology package (VVT
added to base engine) are very similar equivalent between the two analyses. However, there is
a notable difference when looking at the results for the second engine technology package. The
2018 PRIA costs are in the range of 2.3 to 2.5 times higher than the 2016 Draft TAR estimated
costs. Since the VVT technology costs were almost identical, the difference must result from the
predicted cost of Atkinson-cycle-related (HCR1) technologies.
These are just two examples of engine technology cost comparison. There are many other
cases where cost varies significantly between the 2016 Draft TAR and the 2018 PRIA.
Other Examples:
1. Engine Subsystem – Turbocharger
2018 PRIA costs are generally up to 2 times that of 2016 Draft TAR costs for
turbocharger systems (Turbo 1 /2). The costs from the 2018 PRIA are over estimated
while those of the 2016 Draft TAR are under predicted, assuming the total system is
taken into consideration. Detailed analyses are required to determine which, if either, are
more accurate, including defining all subsystem components including intercoolers,
ducting, heat insulating materials, etc.
Table 3: Technology cost comparison – 2018 PRIA vs EPA

Roush Industries Page 23 of 37 10/25/2018 2018 NPRM Final Report
2. Engine Subsystem – High Compression Ratio
The 2018 PRIA costs for implementing higher compression ratio (excluding variable
compression ratio) are 5x-6x that the 2016 Draft TAR estimated costs. These costs are
extremely high for implementing HCR technologies and will significantly overstate the
incremental cost and bias technology pathways.
3. Engine Subsystem – Cylinder Deactivation
The 2018 PRIA incremental costs to incorporate cylinder deactivation (excluding skip-fire
control) appear low for implementing cylinder deactivation technologies, compared to
2016 Draft TAR and 2015 NAS. Furthermore, the incremental costs remain unchanged
between different engine configurations which will bias technology pathways toward
mechanical solutions which may better be implemented with other cost-effective control
methodologies, such as dynamic skip-firing.
4. Transmission – 8-Speed Dual Clutch Transmission (DCT)
Eight-speed DCTs (DCT8) are currently in production (MY2018), with quantities
increasing significantly. However, the 2018 PRIA predicts incremental costs which are a
factor of 1.4 higher than the 2016 Draft TAR estimated. Roush believes that the learning
factors for such systems are significantly better than those estimated by either the 2018
PRIA or the 2016 Draft TAR.
3.0 Independent Analysis of Augural Standard-Compliance Pathways
To demonstrate the results of applying logical technology pathways to achieve compliance with
augural standards, two (2) representative vehicle classes were chosen for vehicle performance
and fuel economy prediction. Based upon the predicted market shift toward SUVs and other
light-duty trucks, and due to the time constraints of the NPRM comment period, Roush limited
its focus to a small SUV and a full-size Pickup as examples for predictive analysis.
Although the CAFE requirements for light-duty trucks are somewhat less stringent than for
passenger cars, their aerodynamic constraints, weight requirements, trailer towing needs and
associated higher horsepower requirements make them very instructive analytical test cases.
This is especially true, considering market-driven purchase forces, their predicted growth in
market share and therefore their contribution to the U.S. light-duty transportation CO2 inventory.
Roush developed state-of-the-art engine maps based on production engines, which were
adapted using the automotive industry-accepted GT-Power simulation code. We then developed
transmission maps to maximize FE using industry-accepted optimization strategies within the
GT-Drive vehicle simulation code, while maintaining constant vehicle performance. GT-Power
was also used by contractors to Argonne National Laboratory (ANL) to generate input to their
Autonomie vehicle simulation model, which in turn, served as input for the CAFE modeling
performed by the Agencies and presented in the 2018 PRIA. We then developed transmission
maps and utilized industry-accepted optimization strategies within the GT-Drive vehicle
simulation code to calculate vehicle performance and fuel economy parameters.
Roush Industries Page 24 of 37 10/25/2018 2018 NPRM Final Report
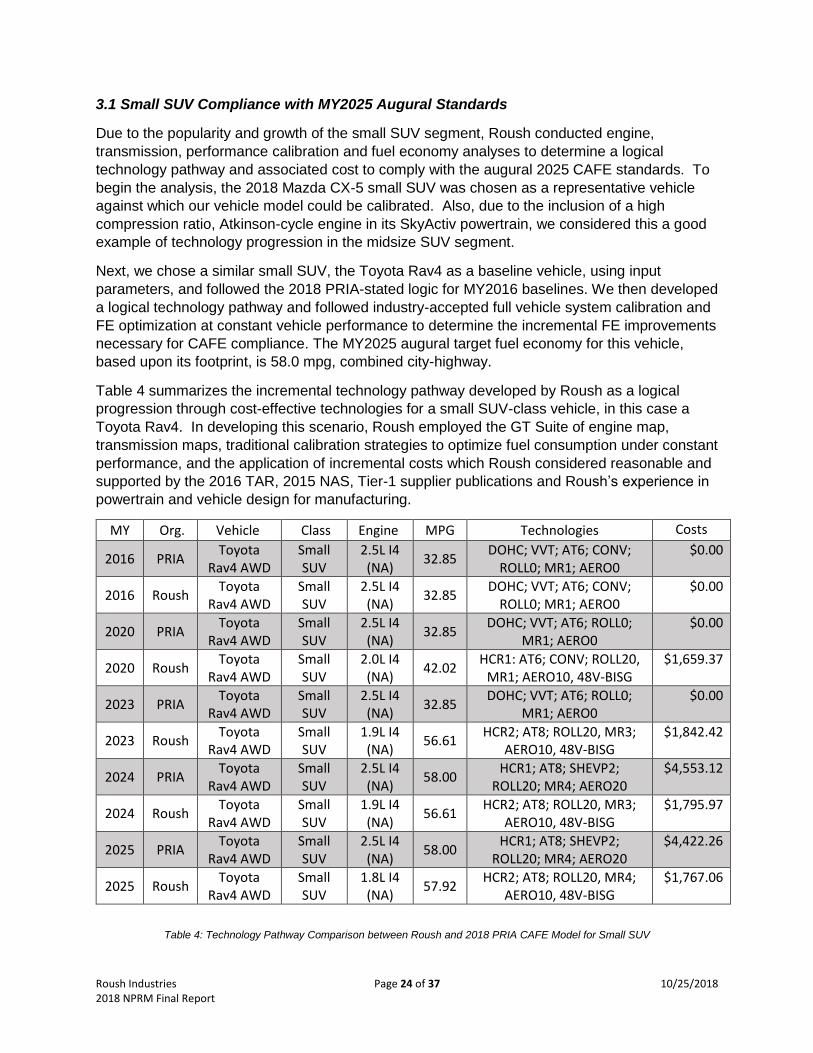
3.1 Small SUV Compliance with MY2025 Augural Standards
Due to the popularity and growth of the small SUV segment, Roush conducted engine,
transmission, performance calibration and fuel economy analyses to determine a logical
technology pathway and associated cost to comply with the augural 2025 CAFE standards. To
begin the analysis, the 2018 Mazda CX-5 small SUV was chosen as a representative vehicle
against which our vehicle model could be calibrated. Also, due to the inclusion of a high
compression ratio, Atkinson-cycle engine in its SkyActiv powertrain, we considered this a good
example of technology progression in the midsize SUV segment.
Next, we chose a similar small SUV, the Toyota Rav4 as a baseline vehicle, using input
parameters, and followed the 2018 PRIA-stated logic for MY2016 baselines. We then developed
a logical technology pathway and followed industry-accepted full vehicle system calibration and
FE optimization at constant vehicle performance to determine the incremental FE improvements
necessary for CAFE compliance. The MY2025 augural target fuel economy for this vehicle,
based upon its footprint, is 58.0 mpg, combined city-highway.
Table 4 summarizes the incremental technology pathway developed by Roush as a logical
progression through cost-effective technologies for a small SUV-class vehicle, in this case a
Toyota Rav4. In developing this scenario, Roush employed the GT Suite of engine map,
transmission maps, traditional calibration strategies to optimize fuel consumption under constant
performance, and the application of incremental costs which Roush considered reasonable and
supported by the 2016 TAR, 2015 NAS, Tier-1 supplier publications and Roush’s experience in
powertrain and vehicle design for manufacturing.
MY Org. Vehicle Class Engine MPG Technologies Costs
2016 PRIA Toyota
Rav4 AWD Small SUV
2.5L I4 (NA)
32.85 DOHC; VVT; AT6; CONV;
ROLL0; MR1; AERO0 $0.00
2016 Roush Toyota
Rav4 AWD Small SUV
2.5L I4 (NA)
32.85 DOHC; VVT; AT6; CONV;
ROLL0; MR1; AERO0 $0.00
2020 PRIA Toyota
Rav4 AWD Small SUV
2.5L I4 (NA)
32.85 DOHC; VVT; AT6; ROLL0;
MR1; AERO0 $0.00
2020 Roush Toyota
Rav4 AWD Small SUV
2.0L I4 (NA)
42.02 HCR1: AT6; CONV; ROLL20,
MR1; AERO10, 48V-BISG $1,659.37
2023 PRIA Toyota
Rav4 AWD Small SUV
2.5L I4 (NA)
32.85 DOHC; VVT; AT6; ROLL0;
MR1; AERO0 $0.00
2023 Roush Toyota
Rav4 AWD Small SUV
1.9L I4 (NA)
56.61 HCR2; AT8; ROLL20, MR3;
AERO10, 48V-BISG $1,842.42
2024 PRIA Toyota
Rav4 AWD Small SUV
2.5L I4 (NA)
58.00 HCR1; AT8; SHEVP2;
ROLL20; MR4; AERO20 $4,553.12
2024 Roush Toyota
Rav4 AWD Small SUV
1.9L I4 (NA)
56.61 HCR2; AT8; ROLL20, MR3;
AERO10, 48V-BISG $1,795.97
2025 PRIA Toyota
Rav4 AWD Small SUV
2.5L I4 (NA)
58.00 HCR1; AT8; SHEVP2;
ROLL20; MR4; AERO20 $4,422.26
2025 Roush Toyota
Rav4 AWD Small SUV
1.8L I4 (NA)
57.92 HCR2; AT8; ROLL20, MR4;
AERO10, 48V-BISG $1,767.06
Table 4: Technology Pathway Comparison between Roush and 2018 PRIA CAFE Model for Small SUV

Roush Industries Page 25 of 37 10/25/2018 2018 NPRM Final Report
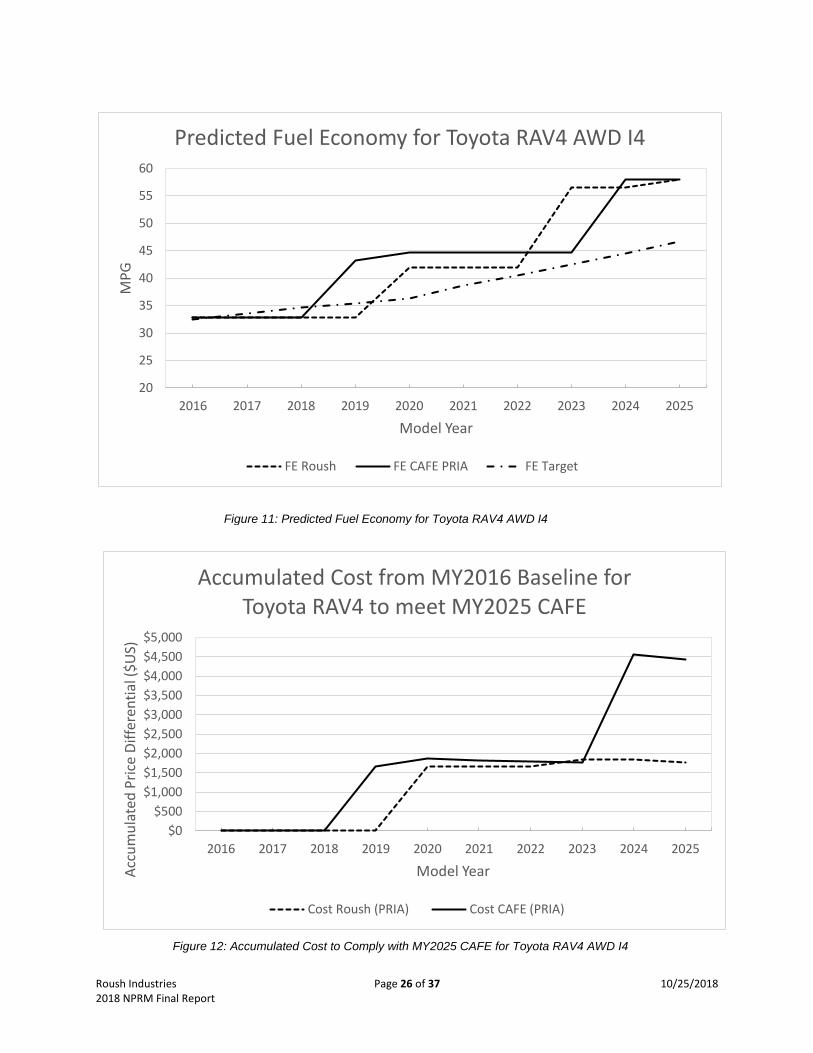
The results from the analysis are further presented in Figure 11 where the incremental fuel
economy improvement is plotted versus vehicle model year, for both the 2018 PRIA results and
the Roush results for a Toyota RAV4 AWD. Also shown is the target CAFE fuel economy by
model year based upon the footprint of the RAV4.
Figure 12 presents the accumulated cost by model year to achieve the fuel economy values
summarized in Table 4 and presented in Figure 11. Again, the 2018 PRIA projection for the
RAV4 is compared to the Roush analysis.
The results show that the use of proper engine and transmission maps, which are optimized
depending upon the engine characteristics, combined with engine displacement and gear ratio
optimization as vehicle weight is reduced, predict that compliance with augural 2025 standards
can be achieved without the application of P2 hybridization, which was chosen by the 2018
PRIA CAFE model
The pathway of engine technology choice replicates applications currently applied in the Mazda
CX-5 (HCR1) plus a 48V BISG, such as that applied in the MY2019 Jeep Wrangler with 2.0L
turbo engine. The evolution to HCR2 with cooled EGR, such as the Toyota Dynamic Force
Engines (but is not available in the CAFE model), together with some minor downsizing of the
engine, combined with a BISG, properly optimized to support engine transients, produces a very
cost-effective package.
The purpose of this analysis is to show that proper design optimization of engine and
transmission subsystems, combined with reasonable estimates for incremental improvement,
especially with the BISG, results in a predicted cost which is 60% less than that of the CAFE
model.
Roush Industries Page 26 of 37 10/25/2018 2018 NPRM Final Report
Figure 12: Accumulated Cost to Comply with MY2025 CAFE for Toyota RAV4 AWD I4
$0
$500
$1,000
$1,500
$2,000
$2,500
$3,000
$3,500
$4,000
$4,500
$5,000
2016 2017 2018 2019 2020 2021 2022 2023 2024 2025
Acc
um
ula
ted
Pri
ce D
iffe
ren
tial
($
US)
Model Year
Accumulated Cost from MY2016 Baseline for Toyota RAV4 to meet MY2025 CAFE
Cost Roush (PRIA) Cost CAFE (PRIA)
20
25
30
35
40
45
50
55
60
2016 2017 2018 2019 2020 2021 2022 2023 2024 2025
MP
G
Model Year
Predicted Fuel Economy for Toyota RAV4 AWD I4
FE Roush FE CAFE PRIA FE Target
Figure 11: Predicted Fuel Economy for Toyota RAV4 AWD I4

Roush Industries Page 27 of 37 10/25/2018 2018 NPRM Final Report
3.2 Full-Size Pickup Compliance with MY2025 Augural Standards
Full-size pickup trucks also represent a relatively large portion of the U.S. light-duty vehicle
market and due to their absolute level of fuel economy and CO2 emissions, they contribute
significantly to the greenhouse gas inventory. In a similar fashion to the small SUV analytical
procedure, we chose a Ram pickup with a 66 sq. ft. footprint and 3.6L V6 NA engine as our
baseline vehicle against which to calibrate our engine and vehicle models.
Based upon the high cost-effectiveness related to high compression ratio and BISG mild
hybridization, as shown in the small SUV case, we proceeded to apply a BISG, HCR1, HCR2
and cylinder deactivation engine strategy, combined with transmission ratio and shift strategy
optimization. We also evaluated the potential for weight reduction and some level of
aerodynamic and rolling resistance improvement, while maintaining constant vehicle
performance.
It is important to note that all the technology steps chosen are currently in production in various
platforms across different manufacturers. Therefore, their inclusion in our exemplar pathway
represents a very viable product evolution cycle.
Table 5 summarizes the incremental technology pathway developed by Roush as a logical
progression through cost-effective technologies for a full-size pickup, in this case a Ram with a
3.6L V6 naturally-aspirated engine. As in the small SUV case, Roush adapted published,
production engine maps with GT-Power and utilized GT-Drive together with transmission maps,
optimized gear ratios, traditional shift strategies and calibration algorithms to optimize fuel
consumption under constant performance. We also applied incremental costs which Roush
considered reasonable and are supported by the 2016 Draft TAR, 2015 NAS, and Roush’s
experience in powertrain and vehicle design for manufacturing.
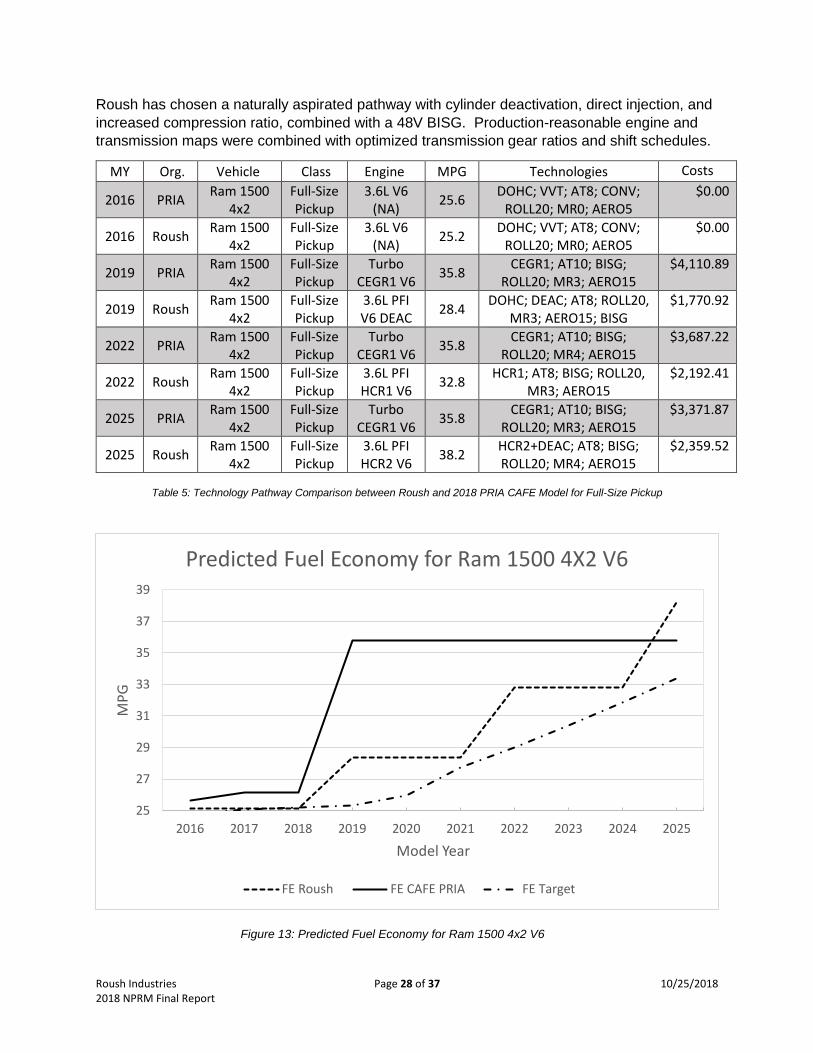
The results from the analysis are further presented in Figure 13 where the incremental fuel
economy improvement is plotted versus vehicle model year, for both the 2018 PRIA results and
the Roush results for the Ram 1500 4x2 V6, together with the target CAFE FE model year.
Figure 14 presents the associated accumulated cost by model year to achieve the FE values
summarized in Table 5 and presented in Figure 13.
The results show that the use of proper engine and transmission maps, which are optimized
depending upon the engine characteristics, combined with engine displacement and gear ratio
optimization as vehicle weight is reduced, predict that compliance with augural 2025 standards
can be achieved very cost-effectively, without the expense of highly-boosted, down-sized
turbocharged engines.
The pathway of engine technology choice replicates applications currently applied in the Mazda
CX-5 (HCR1) plus a 48V BISG, which has been introduced in a Ram pickup and Jeep Wrangler
for MY2019. The evolution to HCR2 with cooled EGR, such as the Toyota Dynamic Force
Engines, combined with a BISG, properly optimized to support engine transients, produces a
very cost-effective package.
As was the case with the small SUV example, this analysis shows that proper design
optimization of engine and transmission subsystems, combined with reasonable estimates for
incremental improvement which are supported by published test data, results in a very cost-
effective method to comply with the MY2025 augural standards. As can be seen from Table 5,
Roush Industries Page 28 of 37 10/25/2018 2018 NPRM Final Report
Roush has chosen a naturally aspirated pathway with cylinder deactivation, direct injection, and
increased compression ratio, combined with a 48V BISG. Production-reasonable engine and
transmission maps were combined with optimized transmission gear ratios and shift schedules.
MY Org. Vehicle Class Engine MPG Technologies Costs
2016 PRIA Ram 1500
4x2 Full-Size Pickup
3.6L V6 (NA)
25.6 DOHC; VVT; AT8; CONV;
ROLL20; MR0; AERO5 $0.00
2016 Roush Ram 1500
4x2 Full-Size Pickup
3.6L V6 (NA)
25.2 DOHC; VVT; AT8; CONV;
ROLL20; MR0; AERO5 $0.00
2019 PRIA Ram 1500
4x2 Full-Size Pickup
Turbo CEGR1 V6
35.8 CEGR1; AT10; BISG;
ROLL20; MR3; AERO15 $4,110.89
2019 Roush Ram 1500
4x2 Full-Size Pickup
3.6L PFI V6 DEAC
28.4 DOHC; DEAC; AT8; ROLL20,
MR3; AERO15; BISG $1,770.92
2022 PRIA Ram 1500
4x2 Full-Size Pickup
Turbo CEGR1 V6
35.8 CEGR1; AT10; BISG;
ROLL20; MR4; AERO15 $3,687.22
2022 Roush Ram 1500
4x2 Full-Size Pickup
3.6L PFI HCR1 V6
32.8 HCR1; AT8; BISG; ROLL20,
MR3; AERO15 $2,192.41
2025 PRIA Ram 1500
4x2 Full-Size Pickup
Turbo CEGR1 V6
35.8 CEGR1; AT10; BISG;
ROLL20; MR3; AERO15 $3,371.87
2025 Roush Ram 1500
4x2 Full-Size Pickup
3.6L PFI HCR2 V6
38.2 HCR2+DEAC; AT8; BISG; ROLL20; MR4; AERO15
$2,359.52
Table 5: Technology Pathway Comparison between Roush and 2018 PRIA CAFE Model for Full-Size Pickup
Figure 13: Predicted Fuel Economy for Ram 1500 4x2 V6
25
27
29
31
33
35
37
39
2016 2017 2018 2019 2020 2021 2022 2023 2024 2025
MP
G
Model Year
Predicted Fuel Economy for Ram 1500 4X2 V6
FE Roush FE CAFE PRIA FE Target
Roush Industries Page 29 of 37 10/25/2018 2018 NPRM Final Report
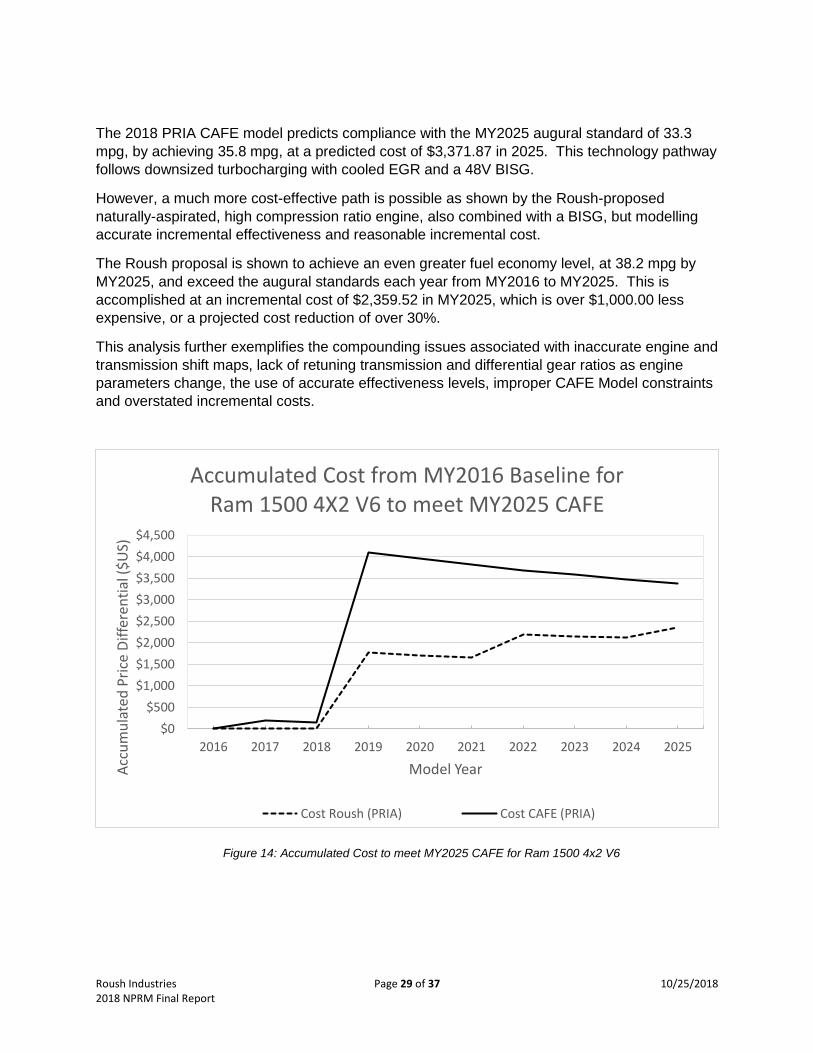
The 2018 PRIA CAFE model predicts compliance with the MY2025 augural standard of 33.3
mpg, by achieving 35.8 mpg, at a predicted cost of $3,371.87 in 2025. This technology pathway
follows downsized turbocharging with cooled EGR and a 48V BISG.
However, a much more cost-effective path is possible as shown by the Roush-proposed
naturally-aspirated, high compression ratio engine, also combined with a BISG, but modelling
accurate incremental effectiveness and reasonable incremental cost.
The Roush proposal is shown to achieve an even greater fuel economy level, at 38.2 mpg by
MY2025, and exceed the augural standards each year from MY2016 to MY2025. This is
accomplished at an incremental cost of $2,359.52 in MY2025, which is over $1,000.00 less
expensive, or a projected cost reduction of over 30%.
This analysis further exemplifies the compounding issues associated with inaccurate engine and
transmission shift maps, lack of retuning transmission and differential gear ratios as engine
parameters change, the use of accurate effectiveness levels, improper CAFE Model constraints
and overstated incremental costs.
$0
$500
$1,000
$1,500
$2,000
$2,500
$3,000
$3,500
$4,000
$4,500
2016 2017 2018 2019 2020 2021 2022 2023 2024 2025
Acc
um
ula
ted
Pri
ce D
iffe
ren
tial
($
US)
Model Year
Accumulated Cost from MY2016 Baseline forRam 1500 4X2 V6 to meet MY2025 CAFE
Cost Roush (PRIA) Cost CAFE (PRIA)
Figure 14: Accumulated Cost to meet MY2025 CAFE for Ram 1500 4x2 V6

Roush Industries Page 30 of 37 10/25/2018 2018 NPRM Final Report
4.0 Conclusions
Roush has shown that the use of logical, unrestricted technology pathways, with incremental
benefits supported by industry-accepted vehicle simulation and dynamic system optimization
and calibration, together with publicly-defensible costs, allows cost-effective solutions to achieve
target fuel economy levels which meet MY2025 existing standards.
It is also important to note that all the technology steps chosen to achieve MY2025 target CAFE
fuel economy levels for our two test cases (Small SUV and Full-Size Pickup) are currently in
production within various platforms across different manufacturers. Therefore, their inclusion in
our exemplar pathways represents a very viable product evolution cycle
Of primary importance is establishing accurate engine maps, transmission maps, fuel economy
optimizing shift strategies, reestablishing transmission gear ratios and shift points as powertrain
and vehicle characteristics change (such as addition of mild hybrid system) and defining
technology pathway algorithms that are consistent with normal product development
constraints. Since we are, in most cases, considering small, incremental improvements in
efficiency, accurate engineering analyses are critical in determining technical viability to achieve
future fuel economy targets.
The development of reasonable cost estimates is also important to understand the probability of
commercial success for future technology approaches. However, variability in worldwide
manufacturing and financial markets, the impact of foreign regulatory climates on new
technology cadence (such as vehicle electrification in China) and other variables make accurate
prediction of component- or system-level costs very challenging. Furthermore, continued
advancements in traditional technology, combined with supplier willingness to reduce margin
with increasing competition, will also influence future technology pricing.
We have not performed a complete fleet-compliance simulation. However, we have identified
many areas for improvement which, if enacted, would likely produce significantly different
results in the overall fleet CAFE compliance assessment.

Roush Industries Page 31 of 37 10/25/2018 2018 NPRM Final Report
Appendix 1: GT-Power Analysis of Small SUV
Fuel Economy GT Model Calibration Results – Mazda CX5
Fuel Economy Analysis Results – Toyota RAV4
Sim Tool MY Manuf Model Platform Engine Drive Transm
CAFE 2016 Mazda CX-5 Skyactiv 2.0L I4 (NA) FWD MT6
GT 2014 Mazda CX-5 Skyactiv 2.0L I4 (NA) FWD MT6
Vehicle Specs
MY Scenario 0 Sim Tool Platf Version Tech Pack Trsm Shft Schd Eng CR Tire RR Coeff Veh Mass (lbm) Diff Ratio Coeff Drag (Cd) Front Area (m^2)
2016 Augural CAFE baseline Autonom AT6 13:1 0.009 3212.0 4.624 0.36 2.65
2016 Augural GT baseline Autonom AT6 13:1 0.009 3212.0 4.624 0.36 2.65
2016 Augural GT baseline GT OptAT6 13:1 0.009 3212.0 4.624 0.33 3.07
GT FE Model Calibration to CAFE (Uses HCR1 and CX-5 specs)
HCR1; MT6; CONV; ROLL0; MR3; AERO5
Overall Information Key Simulation Inputs
MY Scenario 0 Sim Tool Platf Version Tech Pack HWFET UDDS Combined Comb Delta HWFET UDDS Combined
2016Augural
Cafe StdsCAFE baseline ? ? 39.20 0%
2016Augural
Cafe StdsGT baseline 47.86 33.58 38.79 -1.07%
2016Augural
Cafe StdsGT baseline 49.91 33.41 39.24 0.11%
GT FE Model Calibration to CAFE (Uses HCR1 and CX-5 specs)Overall Information
HCR1; MT6; CONV; ROLL0; MR3; AERO5
Simulation Output: MPG EPA Unadj MPG est
48.90 33.70 39.18
Sim Tool MY Manuf Model Platform Engine Drive Transm
GT 2020 to 2025 Toyota RAV4 Skyactiv HCR1, HCR2 and Optimized AT6, AT8 2.0L, 1.8L, 1.8L I4 (NA) AWD AT6, AT8
Vehicle Specs
MY Scenario 0 Sim Tool Platf Version Tech Pack Trsm Shft Schd Eng CR Tire RR Coeff Veh Mass (lbm) Diff Ratio Opt Coeff Drag (Cd) Front Area (m^2)
2016 Augural CAFE baseline DOHC; VVT; AT6; CONV; ROLL0; MR1; AERO0 Autonom AT6 10.4:1 0.009 3570 ? 0.36 2.65
2020 Augural GT v.2020 HCR1; AT6; CONV; ROLL20; MR1; AERO10; 48VBISG GT OptAT6 13:1 0.0072 3570.0 4.5 0.324 2.65
2023 Augural GT v.2023 HCR2; AT8; CONV; ROLL20; MR3; AERO10; 48VBISG GT OptAT8 14:1 0.0072 3480.8 4.0 0.324 2.65
2025 Augural GT v.2025 HCR2; AT8; CONV; ROLL20; MR4; AERO10; 48VBISG GT OptAT8 14:1 0.0072 3382.1 4.0 0.324 2.65
Overall Information Key Simulation Inputs
FE Benefit from Technology Walk (Simulated in GT Power)
MY Scenario 0 Sim Tool Platf Version Tech Pack HWFET UDDS Combined Comb BISG 10% Comb Delta
2016 Augural CAFE baseline DOHC; VVT; AT6; CONV; ROLL0; MR1; AERO0 ? ? 32.85 na 0%
2020 Augural GT v.2020 HCR1; AT6; CONV; ROLL20; MR1; AERO10; 48VBISG 51.30 31.60 38.20 42.02 14%
2023 Augural GT v.2023 HCR2; AT8; CONV; ROLL20; MR3; AERO10; 48VBISG 59.24 46.48 51.47 56.61 36%
2025 Augural GT v.2025 HCR2; AT8; CONV; ROLL20; MR4; AERO10; 48VBISG 60.30 47.70 52.65 57.92 38%
Overall Information Simulation Output: MPG
FE Benefit from Technology Walk (Simulated in GT Power)
Roush Industries Page 32 of 37 10/25/2018 2018 NPRM Final Report

Roush Industries Page 33 of 37 10/25/2018 2018 NPRM Final Report

Roush Industries Page 34 of 37 10/25/2018 2018 NPRM Final Report

Roush Industries Page 35 of 37 10/25/2018 2018 NPRM Final Report
Appendix 2: GT-Power Analysis of Full-Size Pickup
Fuel Economy simulation results of the pickup truck
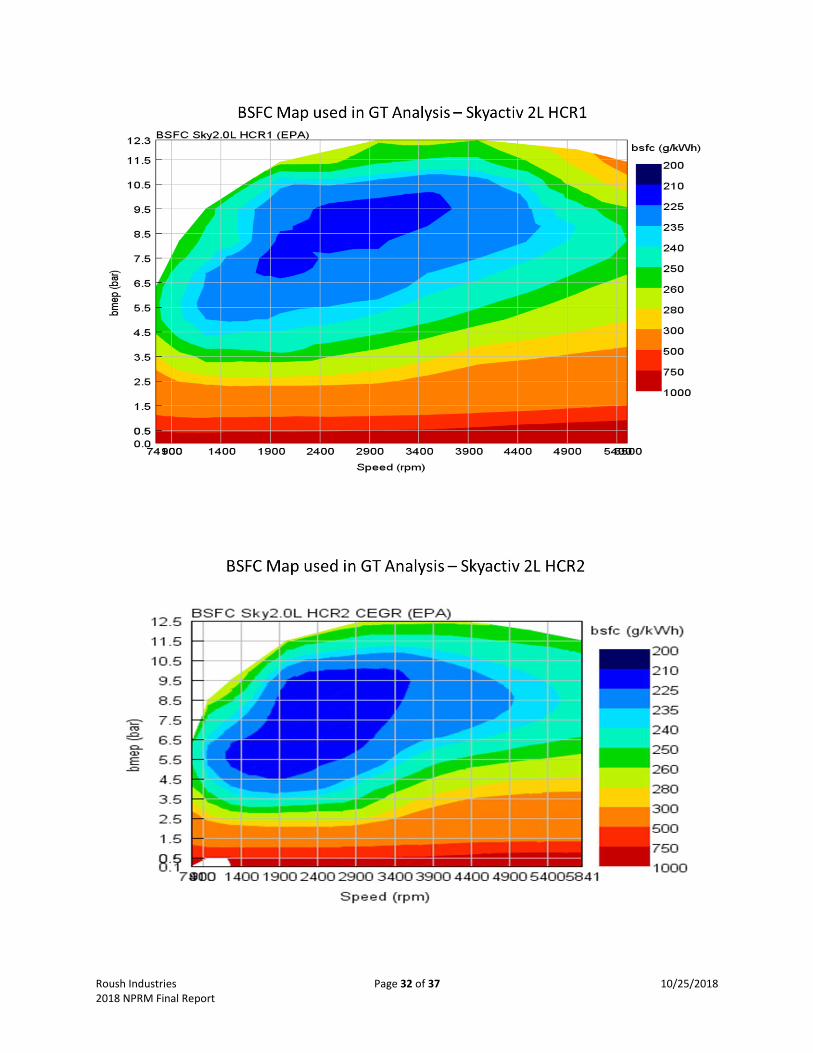
BSFC maps used for the Pickup truck fuel economy simulation
HCR1 Engine map
MY Scenario 0 Sim Tool Platf Version Tech Pack Trsm Shft Schd Eng CR Tire RR Coeff Veh Mass (lbm) Diff Ratio Opt Coeff Drag (Cd) Front Area (m^2)
2016 Augural GT baseline DOHC; VVT; AT8; CONV; ROLL20; MR0; AERO5 Autonom AT8 10.4:1 0.0072 4750 3.98 0.399 3.25
2019 Augural GT v.2016 DOHC; DEAC; VVT; AT8; BISG; ROLL20; MR3; AERO15 GT OptAT8 10.4:1 0.0072 4500 3.70 0.324 3.25
2022 Augural GT v.2019 HCR1; AT8; BISG; ROLL20; MR3; AERO15 GT OptAT8 13:1 0.0072 4500 3.70 0.324 3.25
2025 Augural GT v.2022 HCR2+DEAC; AT8; BISG; ROLL20; MR4; AERO15 GT OptAT8 14:1 0.0072 4275 3.52 0.324 3.25
FE Benefit from Technology Walk (Simulated in GT Power)Overall Information Key Simulation Inputs
Simulation Output: MPG
MY Scenario 0 Sim Tool Platf Version Tech Pack
2016 Augural GT baseline DOHC; VVT; AT8; CONV; ROLL20; MR0; AERO5 25.13
2019 Augural GT v.2016 DOHC; DEAC; VVT; AT8; BISG; ROLL20; MR3; AERO15 28.39
2022 Augural GT v.2019 HCR1; AT8; BISG; ROLL20; MR3; AERO15 32.78
2025 Augural GT v.2022 HCR2+DEAC; AT8; BISG; ROLL20; MR4; AERO15 38.21
Overall Information
FE Benefit from Technology Walk (Simulated in GT Power)
Roush Industries Page 36 of 37 10/25/2018 2018 NPRM Final Report
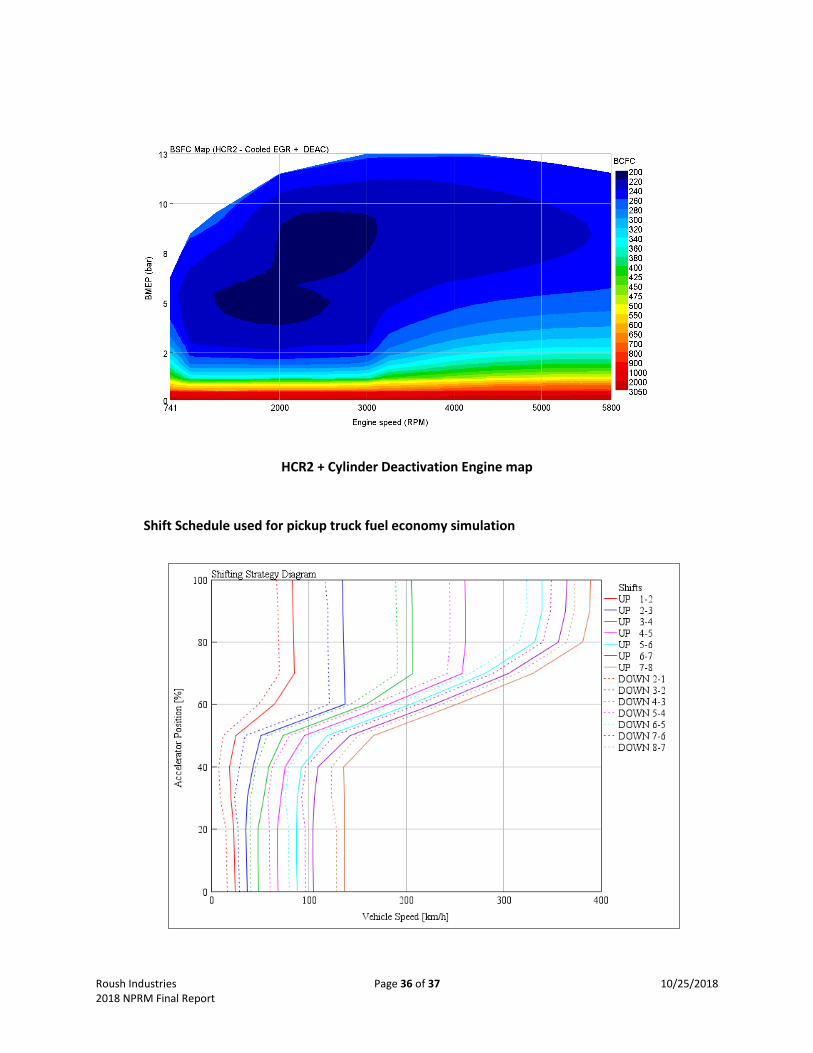
HCR2 + Cylinder Deactivation Engine map
Shift Schedule used for pickup truck fuel economy simulation

Roush Industries Page 37 of 37 10/25/2018 2018 NPRM Final Report
General References used for Engine/Vehicle Simulations
1. Fuel economy data of production vehicles: https://www.fueleconomy.gov/feg/download.shtml
2. Fuel Economy maps used by NHTSA:
https://www.nhtsa.gov/staticfiles/rulemaking/pdf/cafe/IAV_EngineMaps_Details.xlsx
3. HCR1 and HCR2 + Cylinder deactivation maps - https://www.epa.gov/vehicle-and-fuel-
emissions-testing/combining-data-complete-engine-alpha-maps
4. Honda 1.5-turbo engine testing - Stuhldreher, M., Kargul, J., Barba, D., McDonald, J. et al.,
"Benchmarking a 2016 Honda Civic 1.5-liter L15B7 Turbocharged Engine and Evaluating the
Future Efficiency Potential of Turbocharged Engines," SAE Technical Paper 2018-01-0319, 2018
5. Honda 1.5-liter turbo (L15B7) BSFC data - https://www.epa.gov/sites/production/files/2018-
05/honda-1-5l-turbo-prototype-engine-from-2016-sae-paper-alpha-map-package-dated-04-11-
18.zip
6. Mazda 2.5 Skyactiv turbo BSFC map - https://www.epa.gov/vehicle-and-fuel-emissions-
testing/combining-data-complete-engine-alpha-maps
7. Mazda 2.0 Skyactiv engine map - https://www.epa.gov/sites/production/files/2018-04/2014-
mazda-2.0l-skyactiv-engine-tier-2-fuel-alpha-map-package-03-29-18.zip
8. Toyota 2.5-liter High compression ratio engine with cooled EGR - Tadashi Toda, Mitsuto Sakai,
Masashi Hakariya, Toshikazu Kato, “The New Inline 4 Cylinder 2.5L Gasoline Engine with Toyota
New Global Architecture Concept” Vienna Motor Symposium, 2017.
9. VW - VW 2.0-liter EA888-3B Turbo Miller cycle - Dr.-Ing. Rainer Wurms, Dr.-Ing. Ralf Budack, Dr.-
Ing. Michael Grigo, Dr.-Ing. Günther Mendl, Dr.-Ing. Thomas Heiduk, Dr.-Ing. Stefan Knirsch –
“The new Audi 2.0L Engine with innovative rightsizing - A further milestone in TFSI technology”,
Vienna Motor Symposium, 2015