Embed Size (px)
Citation preview
NASA/TMm2000-209891, Vol. 76
Technical Report Series on theBoreal Ecosystem-Atmosphere Study (BOREAS)
Forrest G. Hall and Jaime Nickeson, Editors
Volume 76
BOREAS RSS-19 1996 CASI At-sensor
Radiance and Reflectance Images
John Miller, York University, Ontario, Canada
Jim Freemantle, Earth Observations Laboratory,
Center for Research in Earth and Space Technology (EOL/CRESTECH),
Ontario, Canada
National Aeronautics and
Space Administration
Goddard Space Flight CenterGreenbelt, Maryland 20771
August 2000
https://ntrs.nasa.gov/search.jsp?R=20000116473 2018-07-11T01:08:30+00:00Z
Available from:
NASA Center for AeroSpace Information7121 Standard Drive
Hanover, MD 21076-1320Price Code: A I7
National Technical Information Service
5285 Port Royal Road
Springfield, VA 22161Price Code: A10
BOREAS RSS-19 1996 CASI At-sensor Radiance and Reflectance Images
John R. Miller, Jim R. Freemantle
Summary
The BOREAS RSS-19 team collected CASI images from the Chieftain Navaho aircraft in order toobserve the seasonal change in the radiometric reflectance properties of the boreal forest landscape.CASI was deployed as a site-specific optical sensor as part of BOREAS. The overall objective of theCASI deployment was to observe the seasonal change in the radiometric reflectance properties of theboreal forest landscape. In 1996, image data were collected with CASI on 15 days during a fieldcampaign between 18-July and 01-August, primarily at flux tower sites located at study sites nearThompson, Manitoba, and Prince Albert, Saskatchewan. A variety of CASI data collection strategieswere used to meet the following scientific objectives: 1) canopy bidirectional reflectance, 2) canopybiochemistry, 3) spatial variability, and 4) estimates of up and downwelling PAR spectral albedo, aswell as changes along transects across lakes at the southern site and transects between the NSA andSSA. The images are stored as binary image files.
Note that the 1996 CASI image data are not contained on the BOREAS. CD-ROM set. Inventorylisting files are supplied on the CD-ROM to inform users of the data that were collected. See Sections15 and 16 for information about how to acquire the data. Also see Section 11.2 for notes about ananomaly found with one of the image sizes.
Table of Contents
1) Data Set Overview
2) Investigator(s)3) Theory of Measurements4) Equipment5) Data Acquisition Methods6) Observations7) Data Description8) Data Organization9) Data Manipulations10) Errors11) Notes12) Application of the Data Set13) Future Modifications and Plans14) Software15) Data Access16) Output Products and Availability17) References18) Glossary of Terms19) List of Acronyms20) Document Information
Page 1
1. Data Set Overview
1.1 Data Set Identification
BOREAS RSS-19 1996 CASI At-sensor Radiance and Reflectance Images
1.2 Data Set Introduction
The Compact Airborne Spectrographic Imager (CASI) was deployed as a site-specific opticalsensor as part of the BOReal Ecosystem-Atmosphere Study (BOREAS). The overall objective of the
CASI deployment was to observe the seasonal change in the radiometric reflectance properties of theboreal forest landscape. Image data were collected with CASI on 15 days during the second IntensiveField Campaign (IFC) in 1996 between 18-July and 01-August. Data were collected primarily at fluxtower sites located within the Northern Study Area (NSA) near Thompson, Manitoba, and theSouthern Study Area (SSA) near Prince Albert, Saskatchewan. A subset of the data is available fromthe BOREAS Information System (BORIS).
This BORIS subset contains one spatial image per tower site per IFC per study area. All the datahave been collected at approximately 1500 m Above Ground Level (AGL). The images have beengeocorrected using onboard Global Positioning System (GPS) data. Data have been resampled to 2meter square pixels. Radiance and at-ground modeled reflectance images have been provided. Thissubset of CASI-processed data corresponds to the data for CASI Mission 3 described in Section 5.
1.3 Objective/PurposeCASI was used to generate reflectance images from radiance images collected during the July to
August 1996 time period. These images will be used along with Airborne Visible and Infrared ImagingSpectrometer (AVIRIS), Special Sensor Microwave/Imager (SSM/I), Landsat Thematic Mapper (TM),Geostationary Operational Environmental Satellite (GOES), Advanced Very High ResolutionRadiometer (AVHRR) and Satellite Pour l'Observation de ia Terre (SPOT) images to determine: (i)image-based methods to obtain surface reflectances from airborne optical imagery; (ii) the effect oftemporal/spatial variability of site albedo of the boreal forest; (iii) the role of seasonal changes inunderstory components to changes in reflectance of open boreal canopies; and (iv) theseasonal/temporal variation in closed canopy reflectance as a function of canopy architecture, speciescomposition, canopy biophysical parameters of Leaf Area Index (LAI) and biomass, and phenologicdevelopment and chemistry of foliar components.
1.4 Summary of ParametersRadiance and at-ground modeled reflectance images.
1.5 Discussion
Image data were collected with CASI during 15 days of IFC-2 between 18-Jul and 01-Aug-1996.Data were collected primarily at flux tower sites located within the NSA near Thompson, Manitoba,and the SSA near Prince Albert, Saskatchewan.
In order to aid our BOREAS team collaborators in locating additional information pertaining to theCanadian optical remote sensing component of the BOREAS project, a BOREAS Global HypermediaResearch Information System (B/GHRIS) is under construction at York University/Centre forResearch in the Earth and Space Technology (CRESTech) (Dunlop and Shepherd, 1995). It usesWorld Wide Web (WWW) software to allow collaborators to search, browse, and retrieve distributednetwork-accessible documents. Radiometrically and/or spatially subsampled CASI images areprovided for browsing directly at the collaborator's site. Other information describing the sensors,sensor deployment, flight lines, calibration, field campaigns, field data, calendar of events,bibliography and more are all now available online at http://www.eol.crestech.ca/, providingup-to-date status on CASI data processing and data delivery to BORIS and collaborators.
Page 2
1.6 Related Data SetsBOREASRSS-02Level-lb ASASImagery:At-sensorRadiancein BSQFormatBOREAS RSS-18 Level-1B AVIRIS Imagery: At-sensor Radiance in BIL FormatBOREAS RSS-19 1994 CASI At-sensor Radiance and Reflectance ImagesBOREAS Level-2 MAS Imagery: Reflectance and Temperatures in BSQ FormatBOREAS Level-2 NS001 TMS Images: Reflectance and Temperatures in BSQ Format
2. Investigator(s)
2.1 Investigator(s) Name and TitleDr. John R. Miller
2.2 Title of InvestigationVariation in Radiometric Properties of the Boreal Forest Landscape as a Function of the Ecosystem
Dynamics
2.3 Contact Information
Contact 1:Jim R. Freemantle
Project ScientistEarth Observations LaboratoryCenter for Research in Earth and Space Technology4850 Keele St.North York, OntarioCanada M3J 3K1
(416) 665-5405(416) 665-2032 (fax)[email protected]
Contact 2:Dr. John R. Miller
Dept. of Physics and AstronomyYork University4700 Keele St.North York, OntarioCanada M3J 3K1
(416) 736-2100 x 77729(416) 736-5626 (fax)[email protected]
Contact 3:Jaime Nickeson
Raytheon ITSSNASA GSFCCode 923
Greenbelt, MD 20771(301) 286-3373(301) 286-0239 (fax)[email protected]
Page 3
3. Theory of Measurements
A more complete discussion of the theory behind the measurements can be found in Miller et al., 1995.A short summary is presented here.
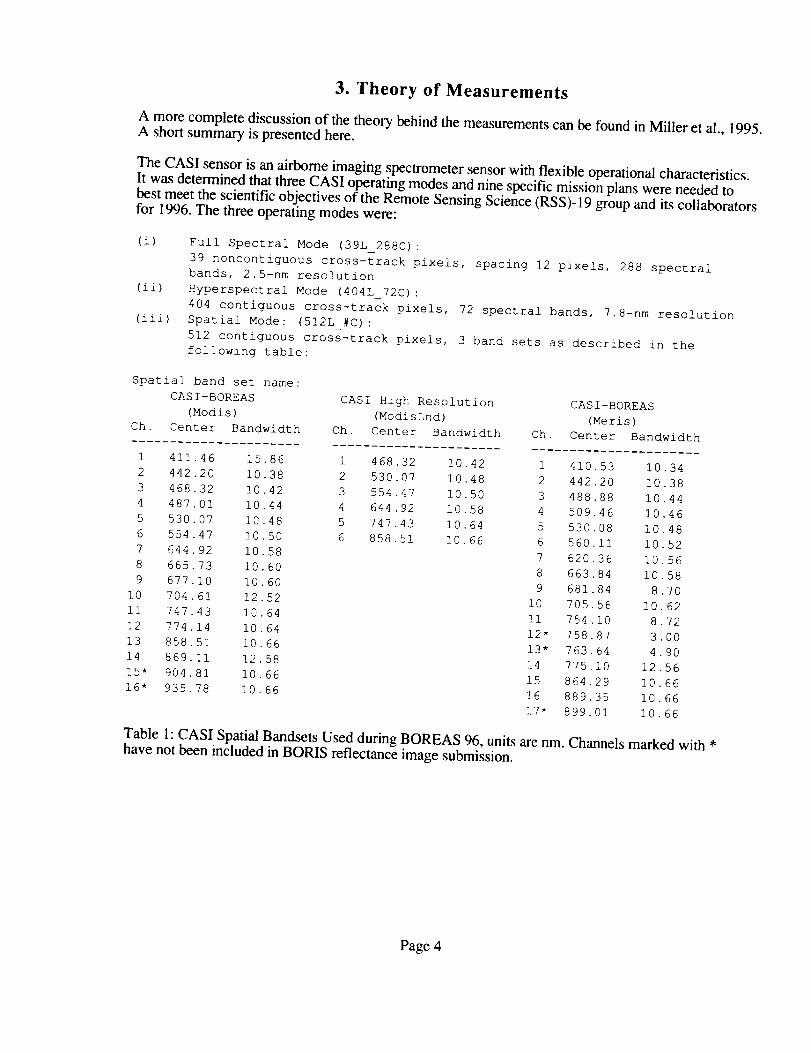
The CASI sensor is an airborne imaging spectrometer sensor with flexible operational characteristics.It was determined that three CASI operating modes and nine specific mission plans were needed tobest meet the scientific objectives of the Remote Sensing Science (RSS)-19 group and its collaboratorsfor 1996. The three operating modes were:
(i) Full Spectral Mode (39L 288C) :
39 noncontiguous cross-track pixels, spacing 12 pixels, 288 spectral
bands, 2.5-nm resolution
(ii) Hyperspectral Mode (404L 72C):
404 contiguous cross-track pixels, 72 spectral bands, 7.8-nm resolution
(iii) Spatial Mode: (512L #C) :
512 contiguous cross-track pixels, 3 band sets as described in the
following table:
Spatial band set name:
CASI-BOREAS CASI High Resolution CASI-BOREAS
(Modis) (ModisLnd) (Meris)
Ch. Center Bandwidth Ch. Center Bandwidth Ch. Center Bandwidth
1
2
3
4
5
6
7
8
9
i0
Ii
12
13
14
15"
16"
411.46
442.20
468.32
487.01
530.07
554.47
644.92
665 73
677 I0
704 61
747 43
774 14
858 51
869 II
904.81
935.78
15.86 1 468.32 10.42 1 410
10.38 2 530.07 10.48 2 442
10.42 3 554.47 10.50 3 488
10.44 4 644.92 10.58 4 509
10.48 5 747.43 10.64 5 530
10.50 6 858.51 I0_66 6 560
10.58 7 620
10.60 8 663
10.60 9 681
12.52 I0 705
10.64 II 754
10.64 12" 758
10.66 13" 763
12.58 14 775
10.66 15 864
10.66 16 889
17" 899
53 10.34
20 10.38
88 10.44
46 10.46
08 10.48
ii 10.52
36 10.56
84 10.58
.84 8.7O
56 10.62
i0 8.72
87 3.00
64 4.90
I0 12.56
29 10.66
35 10.66
01 10.66
Table 1: CASI Spatial Bandsets Used during BOREAS 96, units are nm. Channels marked with *have not been included in BORIS reflectance image submission.
Page 4
4. Equipment
4.1 Instrument DescriptionThe CASI instrument (Itres, 1992) is composed of 10 components weighing a total of 55 kg. The
components of the sensor system augmented at CRESTech and as deployed at BOREAS consist of"• Instrument Control Unit
• Keyboard Unit• Power Supply Unit• Sensor Head Unit
• Video Display Unit• 60-Hz Inverter
• Downwelling Irradiance Probe• Upwelling Irradiance Probe• Zenith Sky Probe• Fiber-Optic Switch Box
The Charge Coupled Device (CCD) sensor is a P86520 series frame transfer device (EEV, Inc.,Chelmsford, UK). The array is thermoelectrically cooled to reduce dark current. The imaging area ofthe array is 512 x 288 pixels with each element measuring 15.5 by 22 lam. The instrument can be runon 110 volts at 2.4 amps. For Direct Current (DC) operation, the inverter supplied with the systemrequires 28 VDC, 13 amps peak. For the optional gyro, another inverter supplies 400-Hz AlternatingCurrent (AC).
The 512 image pixels across the field of view (FOV) of 37.7 degrees give a 1.23-meter groundresolution (cross-track) per 1 km AGL altitude. The along-track ground resolution is approximately theproduct of the integration time and the aircraft speed. The required integration time is directlyproportional to the number of spectral bands and the number of spatial views. The spectral range of theCASI instrument used in the 1996 BOREAS project was 405 to 960 nm. The spectral resolution was2.5-nm full width, half maximum (FWHM), with 288 pixels sampled at 1.8-nm intervals. The 2.5-nmFWHM is nominal; the bandwidth changes with wavelength (Achal, 1991). Measurements of thebandwidth of the CASI used for BOREAS have been taken at CRESTech and are being analyzed.Channel-to-wavelength registration is subject to slight deviations at large view angles because ofspectral sag (Harron et al., 1992; Freemantle et ai., 1991 ).
The CCD sensor is read out and digitized to 12 bits by a programmable electronics system that iscontrolled by an internal single-board computer. Data are recorded on built-in dual digital recorders(Exabyte) that use 8-mm videocassettes as the recording medium. The frame rate isconfiguration-dependent up to a maximum of 85 lines/sec. The CCD can be read out to select and sumrows, to create high spatial resolution bands, or sample columns from the array, to create high spectralresolution views. The CCD sampling configuration can be easily changed by the CASI instrumentoperator and often several different sampling configurations are used during a data collectionexperiment. Additional information about the CASI sensor can be obtained from Itres instruments(http://www.itres.com/).
To collect additional information to correct at-sensor radiance to at-ground reflectance, and tomonitor the temporal stability of the incident illumination, upwelling and downwelling irradianceprobes were mounted in the top and bottom of the aircraft. In 1994, the probe signals were multiplexedonto a single optical fiber by a mechanical optical switching device. This single fiber is connected tothe imaging slit of the CASI. In 1996, two such slit probes were installed at the CASI sensor head toenable the downwelling irradiance to be monitored without multiplexing. The data from the probesappear as additional pixels on the imager CCD. Software is used.to demultiplex the probe signals.
4.1.1 Collection EnvironmentData were collected at various altitudes from 150 m AGL to 2600 m AGL. The CASI sensor can be
tilted forward or aft of the aircraft. Data have been collected at a number of different sensor pitchangles for investigations of Bidirectional Reflectance Distribution Function (BRDF) effects. SeveralCCD sampling configurations were used to collect imagery. Imagery has been collected at the tower
Page 5
flux sitesandauxiliarysites,andalongthetransectbetweenPrinceAlbert,Saskatchewan,andThompson, Manitoba.
4.1.2 Platform
The CASI sensor was flown aboard the Chieftain Navaho aircraft operated by the OntarioProvincial Remote Sensing Office (PRSO). Data were collected at various altitudes from 150 m AGLto 2600 m AGL.
4.1.3 Mission ObjectivesThe complete set of mission objectives for the RSS-19 study is listed below. Note that only
Mission 3 data have been submitted as part of the BOREAS archive data set. Contact the PrincipalInvestigator (PI) or see the CASI Web page for availability of other mission data.
CASI Missions:
Mission 1: Flux Tower Sites: Multiview Canopy Bidirectional Reflectance DataCASI Operating Mode: Spatial Mode (512_ 16C)Pixel: 2 x 2.6 mNadir Swath: 1000 m
CASI multiband imagery in 16 channels was collected over each site at 1525 m altitude AGL for atleast 2 different azimuth angles with respect to the solar plane and at multiple sensor view angles inorder to characterize the seasonal changes in the bidirectional reflectance properties of each flux-towerforest stand. Wherever possible, CASI data were collected coincident with data from the AdvancedSolid-State Array Spectroradiometer (ASAS) sensor National Aeronautics and Space Administration(NASA) Goddard Space Flight Center (GSFC) onboard the C-130 aircraft, and over the PortableApparatus for Rapid Acquisition of Bidirectional Observations of Land and Atmosphere(PARABOLA) field instrument NASA GSFC, both of which are specifically designed to measuresurface bidirectional reflectance properties. For virtually all missions, CASI imagery was collected inthe solar plane with sensor view angles at 45, 30, 15, 0, -15, and -30 degrees and at a 45-degree angleoblique to the solar plane with view angles at +45, 0, -30 degrees. Note that these angles are withrespect to the airplane axis, and will vary somewhat due to aircraft attitude. The operational goalestablished was to obtain overlapping multiview images of at least 200 m in the along-track direction,centered on the site flux tower. With CASI view angle changes made manually by the sensor operator,this objective demanded synchronized tower sighting by the aircrew and sensor tilting by the operatorat intervals during a pass over each flux tower to achieve three overlapping image views per pass.Thus three passes of each flux tower were required for BRDF sampling described above.
Initial comparisons between the Li and Strahler (1992) model and the CASI BRDF data for theSSA Old Jack Pine (OJP) site in the winter campaign are reported by Softer et al. (1995), with furtheranalysis underway.
Mission 2: Flux Tower Sites: Canopy BiochemistryCASI Operating Mode: HyperSpectral Mode (404L_72C)Pixel: 2 x 10 mSwath: 1000 m
Reflectance signatures of forest canopies at high spectral resolution in the CASIvisible/near-infrared (VIS/NIR) spectral region can be related to canopy chlorophyll and nitrogen levels(e.g., Matson et al., 1994). CASI spectral mode imagery was collected at 1525 m AGL for thispurpose over each tower site in the solar plane while viewing in the forward scatter direction at 30degrees to minimize spectral effects of the canopy understory.
Mission 3: Flux Tower Sites: Site MappingCASI Operating Mode: Spatial Mode, 512_16C (or 512_6C) at high (low) altitudesPixel: 2 x 2.6 m and 0.8 x 1.1 mSwath: I000 and 400 m
Page 6
CASIimageryisexpectedtobethehighestspatialresolutionopticaldataavailablein theBOREASdatabaseandthereforehasbeenofparticularinterestto anumberof collaboratorsfor quantifyingthespatialinhomogeneityof site-specificfieldmeasurementsof parameterssuchasLAI, biomass,andcanopycover.Thisisof particularimportanceto thescalingupof borealforestecosystemstateand.processparametersusingremotesensingdata.Forthesepurposes,CASImultiband(16channels)imageryhasbeencollectedin thesolarplaneat 1525m altitudeto coverthe1-kmtargetareaaroundeachflux towersiteinoneimageswathataspatialresolutionof approximately2 m.A secondsetofthreeflightsin thesolarplaneat600mAGL displacedfrom eachotherby300mprovidedCASImultibandimageryin sixchannelsataspatialresolutionof approximately1m.
Mission4: FluxTowerSites:AlbedoCASIOperatingMode:SpatialMode(512_16C)Pixel:0.2x 1.7mSwath:100m
WiththeCASIsensormodificationspermittingcollectionof upanddownwellingspectralirradiancedatasimultaneouslywith thenormalimagery,flightsatlowaltitude(150m AGL) generateameasureof thespatialvariabilityof thespectralalbedoaswell astheupanddownwellingPhotosyntheticallyActiveRadiation(PAR).Thesedatawill alsobeusedtomeasuretheratioofradiancein theGOESvisiblebandtothetotalalbedofor eachcanopytype,therebyenablingE.Smith(RSS-14)to generateseasonalalbedomapsfor theentireBOREASregionfromGOESimagery.Thesesamedataareof interestto J.Cihlar(TerrestrialEcology(TE)-16)andcoworkerstovalidatemodelsfor satelliteestimatesof canopyabsorbedPAR.
Mission5: LakeImageTransectsCASIOperatingModes:MerisMode512L_17CandHyperspectralMode41ML_72CSpatialModePixel:3.2m x 3.3mSwath:1635m;Altitude2500-mAGLHyperspectralPixel:3x 11mSwath:800m;Altitude:2500-mAGL
CASIimagingspectrometerdatawerecollectedonatransectacrossLakeWaskesiuandCandleLakeattheSSA;thisdatacollectionwassimultaneouswith in situwatersamplingandopticalmeasurementsof theabove-surfaceandbelow-surface,upanddownwellingspectralradianceandirradiancesbyR.BukataandJ.Jerome(TE-15).Thesecombineddatawill beusedfor criticalevaluationof modelsandalgorithmsto derivewaterconstituentinformationsuchasconcentrationsofchlorophyll,dissolvedorganiccontent,andtotalsuspendedsolidsfor Case2 waters.Thisalgorithmvalidation/evaluationactivityisdirectlyapplicableto futuresatellitesensorssuchasMediumResolutionImagingSpectrometer(MERIS)andSea-viewingWideField-of-viewSensor(SeaWiFS).
Mission6:AgricultureLineatSSACASIOperatingMode:SpatialMode:Modis512L_16CPixel:3 x 3 mSwath:1635m
A transectat2500m AGL wasselectedtocharacterizetheagriculturetoborealforesttransitionintheSSA.Thistransectwassubjectedto intensivesamplingbyflux aircraft(AirborneFluxesandMeteorology(AFM)-04)andwasimagedwith theCASIsensorin orderto characterizethetrendsandvariabilityin thevegetationgrowth.
Mission7:AtmosphericCorrectionCASIOperatingModes:SpatialMode,16channels;2 HyperspectralModesPixel:variousSwath:various
A variety of multi-altitude, multi-view CASI flights were conducted, supported by surface-basedand aircraft optical depth measurements, in order to evaluate methodologies being used to correctoptical airborne and satellite data from at-sensor radiance to surface reflectance. A system for acquiring
Page 7
downwellingradianceandtotaldownwellingirradiancewasinstalled alongside CASI on the aircraft tocollect needed supplementary atmospheric optical data. These data were collected over the RSS-19 siteat the Prince Albert airport which included canvas standard reflectance panels and an asphalt apron (forwhich BRDF characterization was conducted by RSS-19 personnel from Centre d'Applications et deRecherches en Teledetection (CARTEL), led by University of Sherbrooke researchers Dr. N.T.O'Neill and Dr. A. Royer).
4.1.4 Key VariablesThe CASI sensor directly measures the following quantities: target at-sensor radiance, and
downwelling and upwelling irradiance. The irradiance measurements are experimental and areundergoing intensive investigation at CRESTech. These data may not be available for the 1996BOREAS campaign.
4.1.5 Principles of OperationCASI is a VIS/NIR push-broom imaging spectrograph with a reflection grating and a 2-D CCD
solid-state array detector. The instrument operates by looking down in a fixed direction and imagingsuccessive lines of the scene from the platform, building a 2-D image as the platform moves forward(Anger et al., 1990). The CASI instrument has been used in a variety of applications from forest covermapping to pollution monitoring.
4.1.6 Instrument Measurement GeometryData were collected at various altitudes from 160 m AGL to 2600 m AGL. The CASI sensor can be
tilted forward or aft of the aircraft. Data have been collected at a number of different sensor view
angles from -45 to +45 degrees for investigations of BRDF effects.
4.1.7 Manufacturer of InstrumentItres Instruments#155, 2635-37th Avenue N.E.Calgary, Alberta, CanadaT1Y 5Z6
(403) 250-9944(403) 250-9916 (fax)
4.2 CalibrationThe CASI instrument has been calibrated in the Instrument Services Laboratory at CRESTech. A
two-stage approach was used to determine the absolute and relative radiometric response of theinstrument. An integrating sphere (Thomas et al., 1991 ) was used to determine the relative response ofthe CCD array. For an absolute radiometric calibration, a calibrated Spectralon reflectance panel(Labsphere) and a National Research Council (NRC) traceable calibrated lamp were used. Dark currentdata were taken to remove any instrument-related anomalies. A more detailed description of thecalibration can be found in Harron et al. (1995), Babey and Soffer (1992), and Gray et al. (1997).
Rare gas lamps were used as narrow line sources to determine the spectral calibration of theinstrument. A narrow bandwidth tiltable filter was used to determine the spectral bandpass of theinstrument at selected wavelengths. The transmission of the window used during data collection wascharacterized at a range of view angles to enable correction of CASI data to at-aircraft radiance.
Radiance imagery is converted to at-ground measured reflectance using a variant of the 5S radiativetransfer code, referred to as Canadian Advanced Modified 5S (CAM5S) (O'Neill et al., 1996). Thisprocedure allows correction of the imagery at aircraft altitudes for each pixel in the scene. This is acollaborative project between the University of Sherbrooke, the Canadian Space Agency, CRESTech,and the Canadian Centre for Remote Sensing (CCRS). Further details can be found in Gray et al.,1997.
For an estimate of the absolute calibration error measurements of the NASA field calibration spherewere used. In June 1994, CASI collected imagery of the sphere. Analysis of these images shows thatbetween 500 and 800 nm, the difference between the CASI-measured value and the NASA calibration
Page 8
sphereexpectedvalue(Schafer,1994)waslessthan5%.Onlyonesetof radiancescalefactors(orcalibrationcoefficients)wasusedthroughoutthe1994BOREASfieldseason.Thecalibrationexercisewas,however,repeatedseveraltimesduring1994.If it is assumedthatthecalibrationsetupdidnotchange,analysisof thesedatarevealsthattheCASIresponsecharacteristicsdidnotchangebymorethan3%duringthetimeof the1994BOREASproject.It isexpectedthattheresultfor BOREAS1996imagerywouldbethesameasfor i994.
4.2.1 Specifications(As given by instrument manufacturer Itres)
Field of View: 37.8 degrees across-track, 0.076 degrees along-trackSpectral Range: 545-nm spectral window between about 400 and 1000 nmSpectral Samples: 288 max at 1.9-nm intervalsSpectral Resolution: 2.2-nm FWHM @ 650 nmAperture: f[2.8 to f/11.0Dynamic Range: 12 bitsNoise Floor: 1.4 DN
Signal to Noise Ratio: 420:1 peakData Throughput: 420 Kb or greater
Operating Modes:
Spatial Mode:512 spatial pixels, 19 spectral band maximum
Spectral Mode:288 spectral pixels, 101 adjacent looks48 spectral pixels, 511 adjacent looks
Enhanced Spectral Mode72 spectral pixels, 405 adjacent looks
Full Frame Mode:
288 spectral pixels, 512 spatial pixels
Environmental Operating Conditions:
Temperature: 5 to 40 °C operating, -20 to +60 °C storageRelative Humidity: 20% to 80% noncondensing, 10% to 90% noncondensing storageMaximum Altitude: 3048 m above sea level (unpressurized)
4.2.1.1 Tolerance
None given.
4.2.2 Frequency of CalibrationCalibration data were collected for CASI before each IFC. While only one set of calibration data
has been used to calculate the radiance scale factors, the other calibration data allow tracking of anychanges in the instrument response.
4.2.3 Other Calibration Information
The CASI sensor viewed the NASA GSFC large integrating sphere during IFC-1 during BOREAS1994. Also, an interagency calibration experiment was conducted at the Instrument ServicesLaboratory involving CRESTech, NASA GSFC, and CCRS (Harron et al., 1995) that compared thecalibration radiance sources used at these institutions. See Harron et al. (1995) for details.
Page 9
5. Data Acquisition Methods
The CASI sensor is an airborne imaging spectrometer sensor with flexible operational characteristics.The spectral range of the CASI instrument used in the BOREAS project Was 391 to 916 rim. The CASIsensor was flown aboard the Chieftain Navaho aircraft operated by the PRSO. Data were collected atvarious altitudes from 150 m AGL to 2600 m AGL. The CASI sensor can be tilted forward or aft of
the aircraft. Data have been collected at a number of different sensor pitch angles for investigations ofBDRF effects. Several CCD sampling configurations were used to collect imagery.
The CCD sensor is read out and digitized to 12 bits by a programmable electronics system that iscontrolled by an internal single-board computer. Data are recorded on a built-in digital recorder(Exabyte) that uses 8-mm videocassettes as the recording medium. The frame rate isconfiguration-dependent up to a maximum of 85 lines/sec. The CCD can be read out to select and sumrows, to create high spatial resolution bands, or sample columns from the array, to create high spectralresolution views. The CCD sampling configuration can be easily changed by the CASI instrumentoperator, and often several different sampling configurations are used during a data collectionexperiment.
6. Observations
6.1 Data Notes
None given.
6.2 Field Notes
CASI operator comments are recorded in flight logs stored as part of the CRESTech BOREASCASI image data base. Examination of the incident light probe (ILP) data suggests that the atmosphericconditions varied by more than 10% but not more than 20% for the images that are part of the currentBORIS submission.
7. Data Description
7.1 Spatial Characteristics
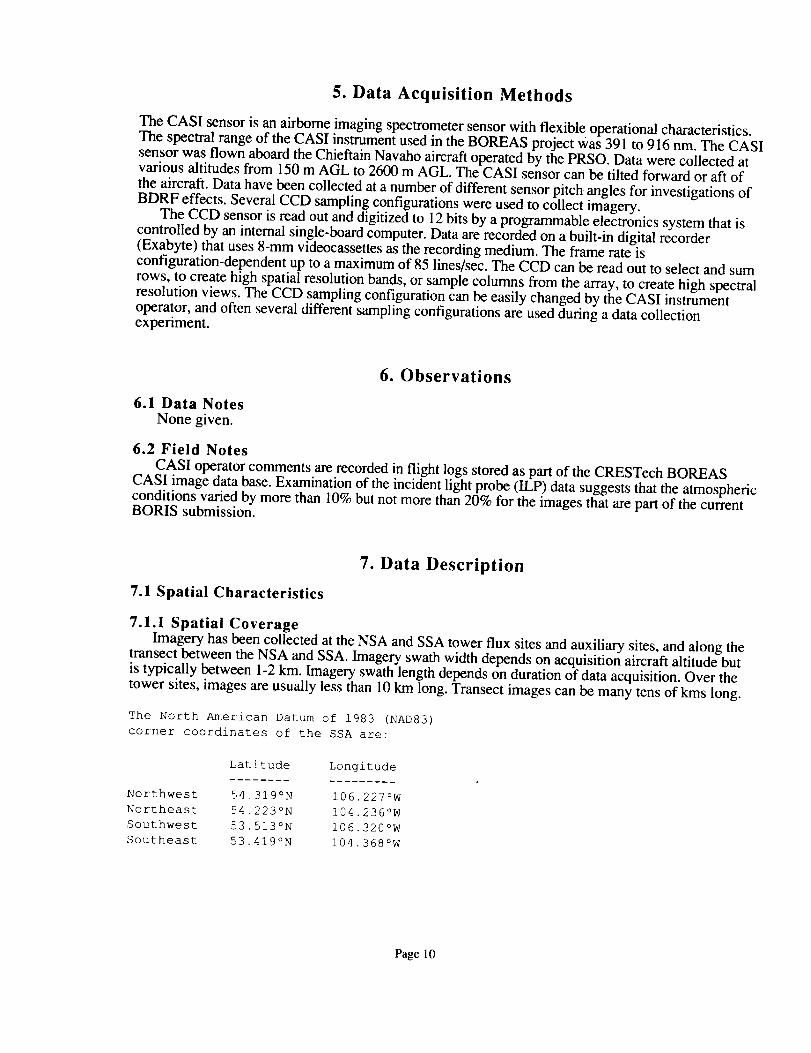
7.1.1 Spatial CoverageImagery has been collected at the NSA and SSA tower flux sites and auxiliary sites, and along the
transect between the NSA and SSA. Imagery swath width depends on acquisition aircraft altitude butis typically between 1-2 km. Imagery swath length depends on duration of data acquisition. Over thetower sites, images are usually less than 10 km long. Transect images can be many tens of kms long.
The North American Datum of 1983 (NAD83)
corner coordinates of the SSA are:
Latitude Longitude
Northwest 54.319°N I06.227°W
Northeast 54.223°N [email protected]°W
Southwest 53.513°N I06.320°W
Southeast 53.419°N I04.368°W
Page 10
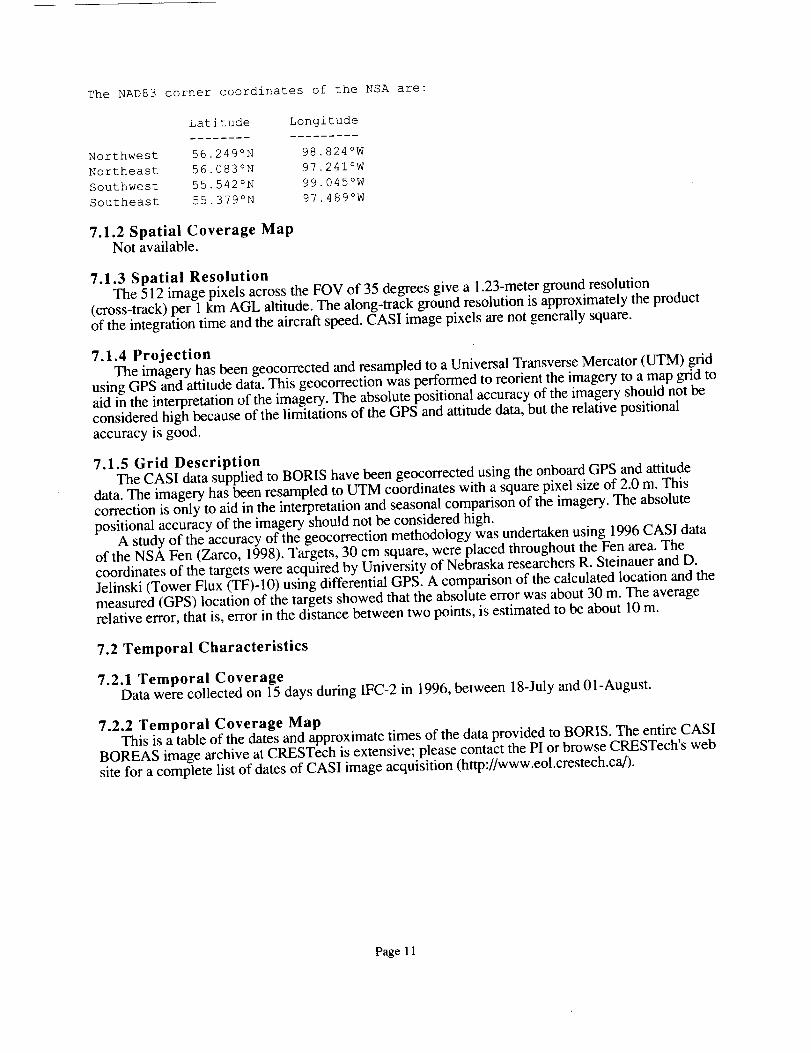
The NAD83 corner coordinates of the NSA are:
Latitude Longitude
Northwest 56.249°N 98.824°W
Northeast 56.083°N 97.241°W
Southwest 55.542°N 99.045°W
Southeast 55.379°N 97.489°W
7.1.2 Spatial Coverage MapNot available.
7.1.3 Spatial ResolutionThe 512 image pixels across the FOV of 35 degrees give a 1.23-meter ground resolution
(cross-track) per 1 km AGL altitude. The along-track ground resolution is approximately the productof the integration time and the aircraft speed. CASI image pixels are not generally square.
7.1.4 ProjectionThe imagery has been geocorrected and resampled to a Universal Transverse Mercator (UTM) grid
using GPS and attitude data. This geocorrection was performed to reorient the imagery to a map grid toaid in the interpretation of the imagery. The absolute positional accuracy of the imagery should not beconsidered high because of the limitations of the GPS and attitude data, but the relative positionalaccuracy is good.
7.1.5 Grid DescriptionThe CASI data supplied to BORIS have been geocorrected using the onboard GPS and attitude
data. The imagery has been resampled to UTM coordinates with a square pixel size of 2.0 m. Thiscorrection is only to aid in the interpretation and seasonal comparison of the imagery. The absolutepositional accuracy of the imagery should not be considered high.
A study of the accuracy of the geocorrection methodology was undertaken using 1996 CASI dataof the NSA Fen (Zarco, 1998). Targets, 30 cm square, were placed throughout the Fen area. Thecoordinates of the targets were acquired by University of Nebraska researchers R. Steinauer and D.Jelinski (Tower Flux (TF)-10) using differential GPS. A comparison of the calculated location and themeasured (GPS) location of the targets showed that the absolute error was about 30 m. The averagerelative error, that is, error in the distance between two points, is estimated to be about 10 m.
7.2 Temporal Characteristics
7.2.1 Temporal CoverageData were collected on 15 days during IFC-2 in 1996, between 18-July and 01-August.
7.2.2 Temporal Coverage MapThis is a table of the dates and approximate times of the data provided to BORIS. The entire CASI
BOREAS image archive at CRESTech is extensive; please contact the PI or browse CRESTech's website for a complete list of dates of CASI image acquisition (http://www.eol.crestech.ca/).
Page 11
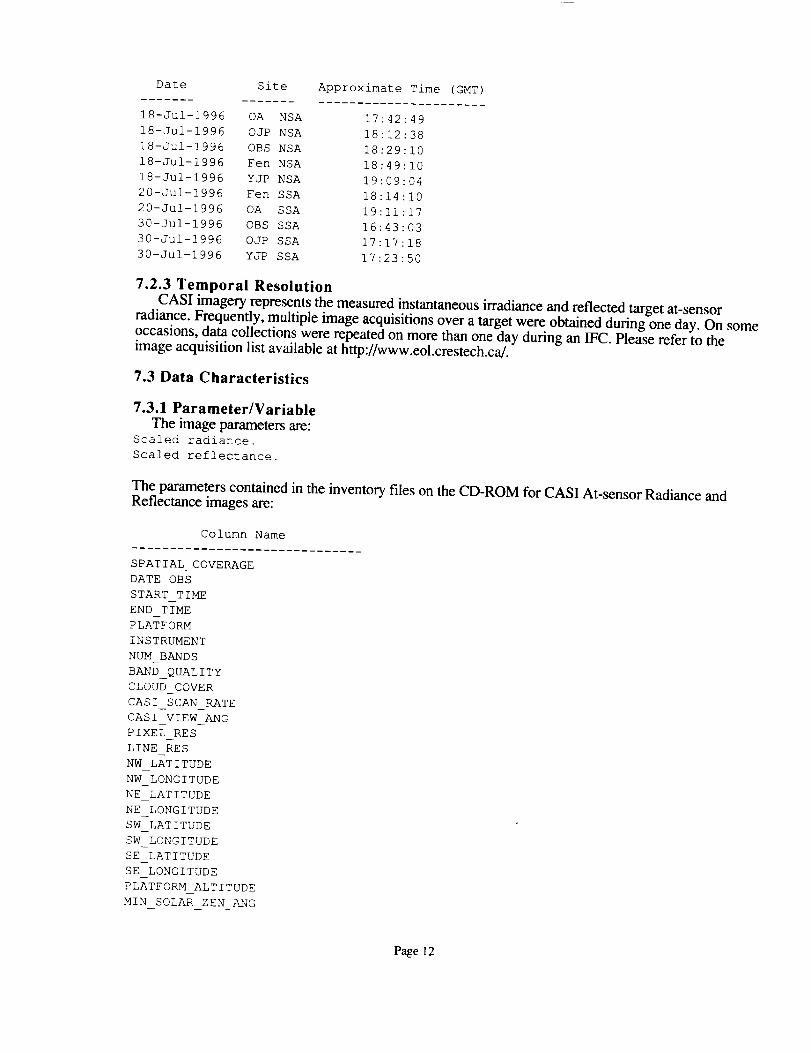
Date Site Approximate Time (GMT)
18-Jui-1996 OA NSA 17:42:49
18-Jui-1996 OJP NSA 18:12:38
18-Jui-1996 OBS NSA 18:29:10
18-Jui-1996 Fen NSA 18:49:10
18-Jui-1996 YJP NSA 19:09:04
20-Jui-1996 Fen SSA 18:14:10
20-Jui-1996 OA SSA 19:11:17
30-Jui-1996 OBS SSA 16:43:03
30-Jui-1996 OJP SSA 17:17:18
30-Jui-1996 YJP SSA 17:23:50
7.2.3 Temporal ResolutionCASI imagery represents the measured instantaneous irradiance and reflected target at-sensor
radiance. Frequently, multiple image acquisitions over a target were obtained during one day. On someoccasions, data collections were repeated on more than one day during an IFC. Please refer to theimage acquisition list available at http://www.eol.crestech.ca/.
7.3 Data Characteristics
7.3.1 Parameter/Variable
The image paramete_ _e:Scaled radiance.
Scaled reflectance.
The parameters contained in the inventory files on the CD-ROM for CASI At-sensor Radiance andReflectance images are:
Column Name
SPATIAL COVERAGE
DATE OBS
START TIME
END TIME
PLATFORM
INSTRUMENT
NUM BANDS
BAND QUALITY
CLOUD COVER
CASI SCAN RATE
CASI VIEW ANG
PIXEL RES
LINE RES
NW LATITUDE
NW LONGITUDE
NE LATITUDE
NE LONGITUDE
SW LATITUDE
SW LONGITUDE
SE LATITUDE
SE LONGITUDE
PLATFORM ALTITUDE
MIN SOLAR ZEN ANG
Page 12
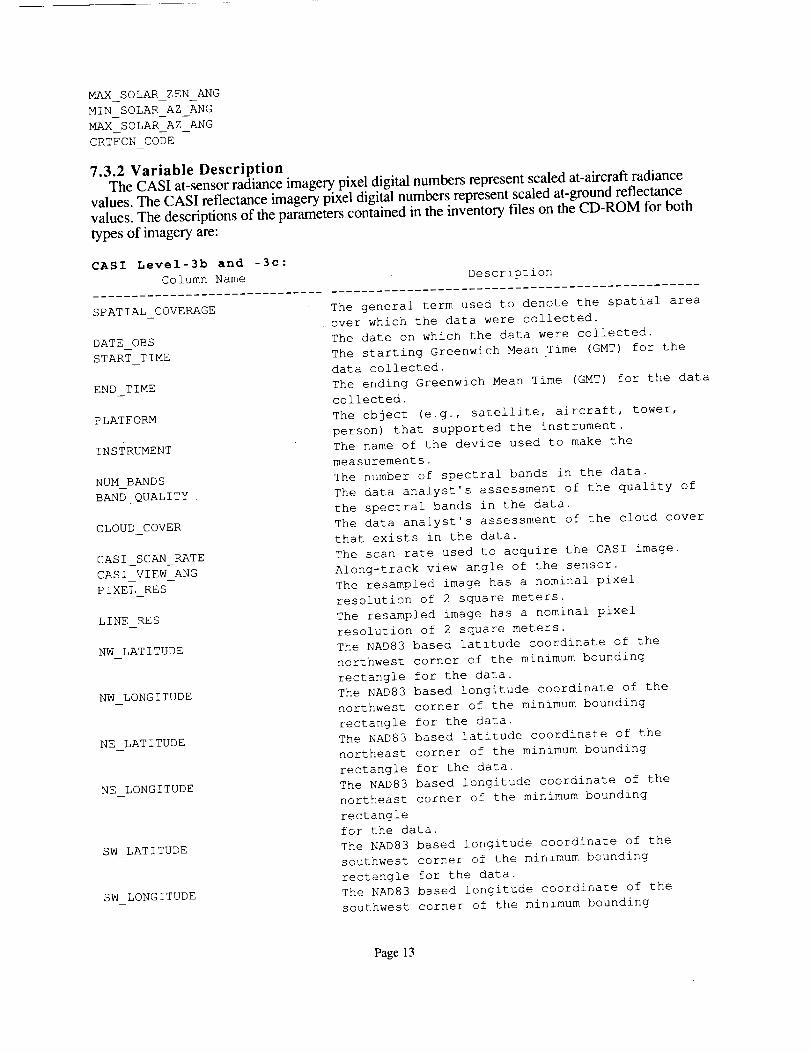
MAX SOLAR ZEN ANG
MIN SOLAR AZ ANG
MAX SOLAR AZ ANG
CRTFCN CODE
7.3.2 Variable DescriptionThe CASI at-sensor radiance imagery pixel digital numbers represent scaled at-aircraft radiance
values. The CASI reflectance imagery pixel digital numbers represent scaled at-ground reflectancevalues. The descriptions of the parameters contained in the inventory files on the CD-ROM for bothtypes of imagery are:
CASI Level-3b and -3c:
Column Name
SPATIAL COVERAGE
DATE OBS
START TIME
END TIME
PLATFORM
INSTRUMENT
NUM BANDS
BAND_QUALITY
CLOUD COVER
CASI SCAN RATE
CASI VIEW ANG
PIXEL RES
LINE RES
NW LATITUDE
NW LONGITUDE
NE LATITUDE
NE LONGITUDE
SW LATITUDE
SW LONGITUDE
Description
The general term used to denote the spatial area
over which the data were collected.
The date on which the data were collected.
The starting Greenwich Mean Time (GMT) for the
data collected.
The ending Greenwich Mean Time (GMT) for the data
collected.
The object (e.g., satellite, aircraft, tower,
person) that supported the instrument.
The name of the device used to make the
measurements.
The number of spectral bands in the data.
The data analyst's assessment of the quality of
the spectral bands in the data.
The data analyst's assessment of the cloud cover
that exists in the data.
The scan rate used to acquire the CASI image.
Along-track view angle of the sensor.
The resampled image has a nominal pixel
resolution of 2 square meters.
The resampled image has a nominal pixel
resolution of 2 square meters.
The NAD83 based latitude coordinate of the
northwest corner of the minimum bounding
rectangle for the data.
The NAD83 based longitude coordinate of the
northwest corner of the minimum bounding
rectangle for the data.
The NAD83 based latitude coordinate of the
northeast corner of the minimum bounding
rectangle for the data.
The NAD83 based longitude coordinate of the
northeast corner of the minimum bounding
rectangle
for the data.
The NAD83 based longitude coordinate of the
southwest corner of the minimum bounding
rectangle for the data.
The NAD83 based longitude coordinate of the
southwest corner of the minimum bounding
Page 13
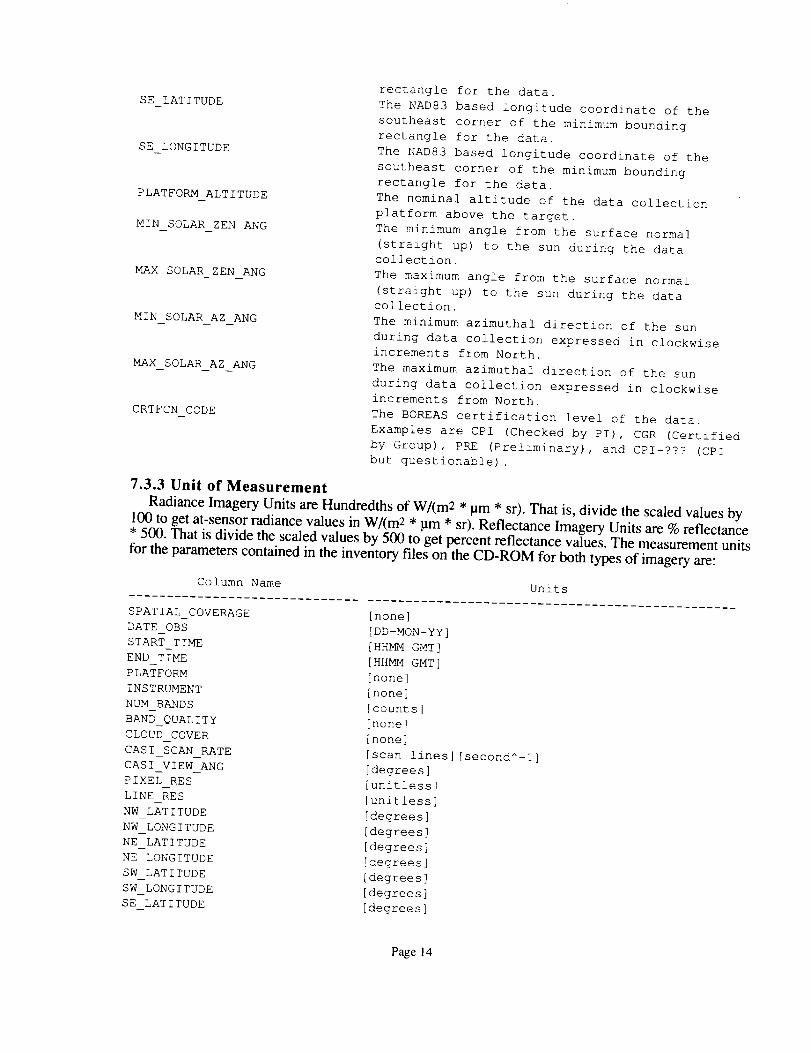
SE LATITUDE
SE LONGITUDE
PLATFORM ALTITUDE
MIN SOLAR ZEN ANG
MAX SOLAR ZEN ANG
MIN SOLAR AZ ANG
MAX SOLAR AZ ANG
CRTFCN CODE
rectangle for the data.
The NAD83 based longitude coordinate of the
southeast corner of the minimum bounding
rectangle for the data.
The NAD83 based longitude coordinate of the
southeast corner of the minimum bounding
rectangle for the data.
The nominal altitude of the data collection
platform above the target.
The minimum angle from the surface normal
(straight up) to the sun during the data
collection.
The maximum angle from the surface normal
(straight up) to the sun during the data
collection.
The minimum azimuthal direction of the sun
during data collection expressed in clockwise
increments from North.
The maximum azimuthal direction of the sun
during data collection expressed in clockwise
increments from North.
The BOREAS certification level of the data.
Examples are CPI (Checked by PI), CGR (Certified
by Group), PRE (Preliminary), and CPI-??? (CPI
but questionable).
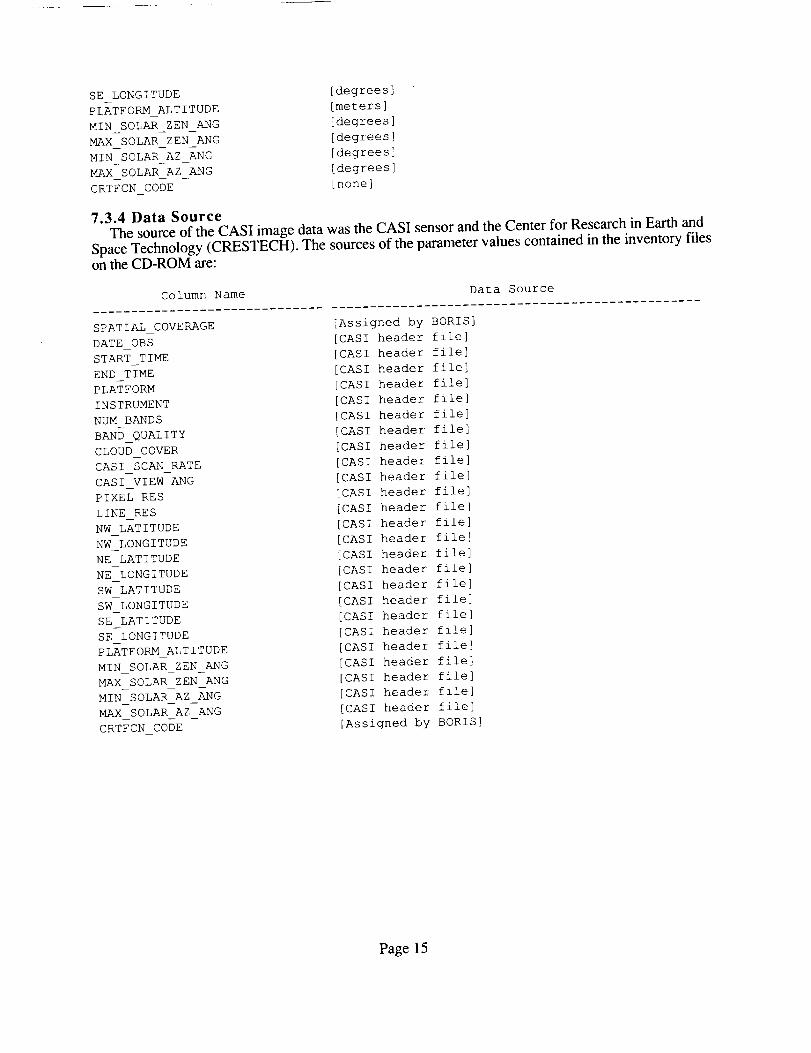
7.3.3 Unit of Measurement
Radiance Imagery Units are Hundredths of W/(m2 * pm * sr). That is, divide the scaled values by
100 to get at-sensor radiance values in W/(m2 * lam * st). Reflectance Imagery Units are % reflectance• 500. That is divide the scaled values by 500 to get percent reflectance values. The measurement unitsfor the parameters contained in the inventory files on the CD-ROM for both types of imagery are:
Column Name Units
SPATIAL COVERAGE
DATE OBS
START TIME
END TIME
PLATFORM
INSTRUMENT
NUM BANDS
BAND_QUALITY
CLOUD COVER
CASI SCAN RATE
CASI VIEW ANG
PIXEL RES
LINE RES
NW LATITUDE
NW LONGITUDE
NE LATITUDE
NE LONGITUDE
SW LATITUDE
SW LONGITUDE
SE LATITUDE
[none]
[DD-MON-YY]
[HHMM GMT]
[HHMM GMT]
[none]
[none]
[counts]
[none]
[none]
[scan lines] [second^-l]
[degrees]
[unitless]
[unitless]
[degrees]
[degrees]
[degrees]
[degrees]
[degrees]
[degrees]
[degrees]
Page 14
SE LONGITUDE [degrees]
PLATFORM ALTITUDE [meters]
MIN SOLAR ZEN ANG [degrees]
MAX SOLAR ZEN ANG [degrees]
MIN SOLAR AZ ANG [degrees]
MAX SOLAR AZ ANG [degrees]
CRTFCN CODE [none]
7.3.4 Data SourceThe source of the CASI image data was the CASI sensor and the Center for Research in Earth and
Space Technology (CRESTECH). The sources of the parameter values contained in the inventory fileson the CD-ROM are:
Column Name Data Source
SPATIAL COVERAGE
DATE OBS
START TIME
END TIME
PLATFORM
INSTRUMENT
NUM BANDS
BAND QUALITY
CLOUD COVER
CASI SCAN RATE
CASI VIEW ANG
PIXEL RES
LINE RES
NW LATITUDE
NW LONGITUDE
NE LATITUDE
NE LONGITUDE
SW LATITUDE
SW LONGITUDE
SE LATITUDE
SE LONGITUDE
PLATFORM ALTITUDE
MIN SOLAR ZEN ANG
MAX SOLAR ZEN ANG
MIN SOLAR AZ ANG
MAX SOLAR AZ ANG
CRTFCN CODE
[Assigned by BORIS]
[CASI header file]
[CASI header file]
[CASI header file]
[CASI header file]
[CASI header file]
[CASI header file]
[CASI header file]
[CASI header file]
[CASI header file]
[CASI header file]
[CASI header file]
[CASI header file]
[CASI header file]
[CASI header file]
[CASI header file]
[CASI header file]
[CASI header file]
[CASI header file]
[CASI header file]
[CASI header file]
[CASI header file]
[CASI header file]
[CASI header file]
[CASI header file]
[CASI header file]
[Assigned by BORIS]
Page 15
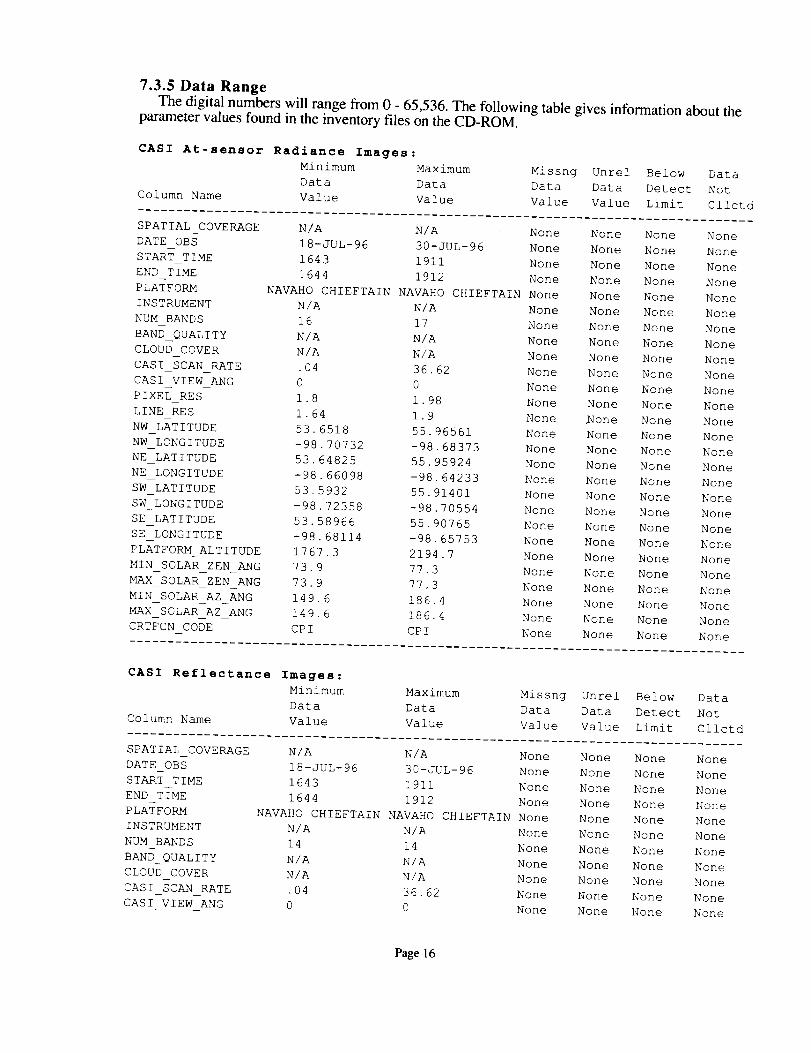
7.3.5 Data RangeThe digital numbers will range from 0 - 65,536. The following table gives information about the
parameter values found in the inventory files on the CD-ROM.
CASI At-sensor Radiance Images :
Minimum Maximum Missng Unrel Below Data
Data Data Data Data Detect Not
Column Name Value Value Value Value Limit Cllctd
SPATIAL COVERAGE N/A N/A
DATE OBS 18-JUL-96 30-JUL-96
START TIME 1643 1911
END TIME 1644 1912
PLATFORM NAVAHO CHIEFTAIN NAVAHO CHIEFTAIN
INSTRUMENT N/A N/A
NUM BANDS 16 17
BAND QUALITY N/A N/A
CLOUD COVER N/A N/A
CASI SCAN RATE .04 36.62
CASI VIEW ANG 0 0
PIXEL RES 1,8 1,98
LINE RES 1.64 1.9
NW LATITUDE 53.6518 55.96561
NW LONGITUDE -98.70732 -98.68373
NE LATITUDE 53.64825 55.95924
NE LONGITUDE -98.66098 -98.64233
SW LATITUDE 53.5932 55.91401
SW LONGITUDE -98.72358 -98.70554
SE LATITUDE 53.58966 55.90765
SE LONGITUDE -98.68114 -98.65753
PLATFORM ALTITUDE 1767.3 2194.7
MIN SOLAR ZEN ANG 73.9 77.3
MAX SOLAR ZEN ANG 73.9 77.3
MIN SOLAR AZ ANG 149.6 186.4
MAX SOLAR AZ ANG 149.6 186.4
CRTFCN CODE CPI CPI
None None None None
None None None None
None None None None
None None None None
None None None None
None None None None
None None None None
None None None None
None None None None
None None None None
None None None None
None None None None
None _one None None
None None None None
None None None None
None None None None
None None None None
None None None None
None None None None
None None None None
None None None None
None None None None
None None None None
None None None None
None None None None
None None None None
None None None None
CASI Reflectance Images:
Minimum Maximum
Data Data
Column Name Value Value
Missng Unrel Below Data
Data Data Detect Not
Value Value Limit Cllctd
SPATIAL COVERAGE N/A N/A
DATE OBS 18-JUL-96 30-JUL-96
START TIME 1643 1911
END TIME 1644 1912
PLATFORM NAVAHO CHIEFTAIN NAVAHO CHIEFTAIN
INSTRUMENT N/A N/A
NUM BANDS 14 14
BAND QUALITY N/A N/A
CLOUD COVER N/A N/A
CASI SCAN RATE .04 36.62
CASI VIEW ANG 0 0
None None None None
None None None None
None None None None
None None None None
None None None None
None None None None
None None None None
None None None None
None None None None
None None None None
None None None None
Page 16
PIXEL RES 1.8 1.98 None None None None
LINE RES 1.64 1.9 None None None None
NW LATITUDE 53.6518 55.96561 None None None None
NW LONGITUDE -98.70732 -98.68373 None None None None
NE LATITUDE 53.64825 55.95924 None None None None
NE LONGITUDE -98.66098 -98.64233 None None None None
SW LATITUDE 53.5932 55.91401 None None None None
SW LONGITUDE -98.72358 -98.70554 None None None None
SE LATITUDE 53.58966 55.90765 None None None None
SE LONGITUDE -98.68114 -98.65753 None None None None
PLATFORM ALTITUDE 1767.3 2194.7 None None None None
MIN SOLAR ZEN ANG 73.9 77.3 None None None None
MAX SOLAR ZEN ANG 73.9 77.3 None None None None
MIN SOLAR AZ ANG 149.6 186.4 None None None None
MAX SOLAR AZ ANG 149.6 186.4 None None None None
CRTFCN CODE CPI CPI None None None None
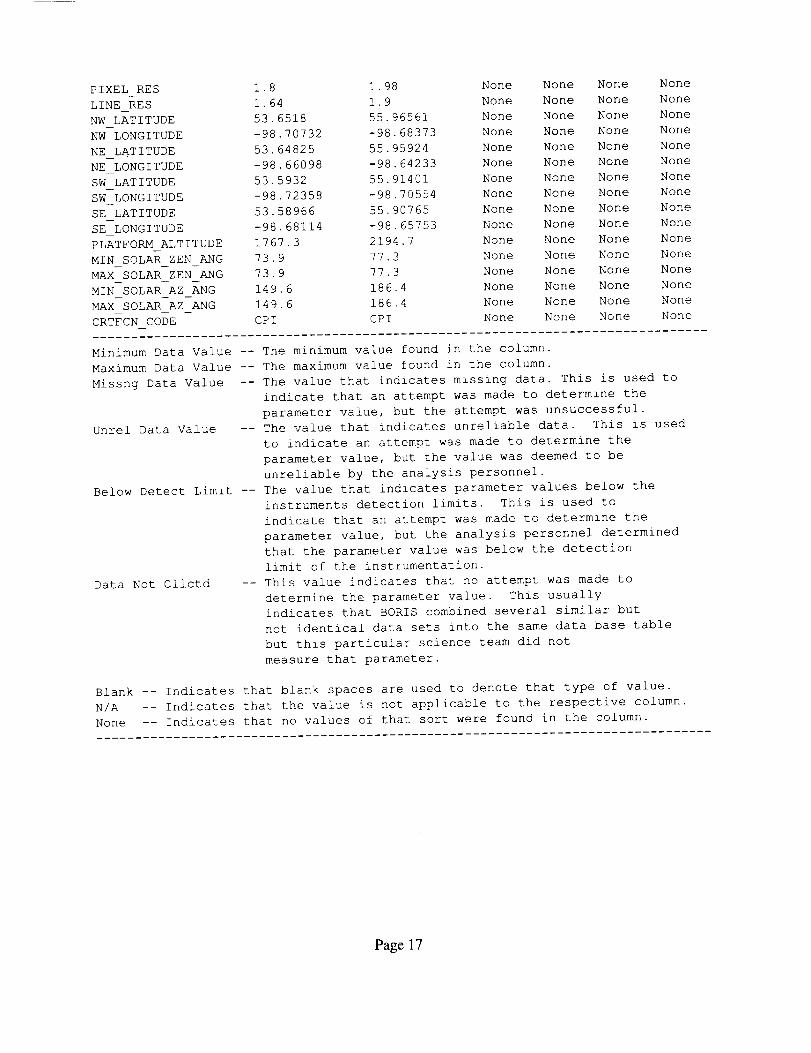
Minimum Data Value -- The minimum value found in the column.
Maximum Data Value -- The maximum value found in the column.
Missng Data Value -- The value that indicates missing data. This is used to
indicate that an attempt was made to determine the
parameter value, but the attempt was unsuccessful.
Unrel Data Value -- The value that indicates unreliable data. This is used
to indicate an attempt was made to determine the
parameter value, but the value was deemed to be
unreliable by the analysis personnel.
Below Detect Limit -- The value that indicates parameter values below the
instruments detection limits. This is used to
indicate that an attempt was made to determine the
parameter value, but the analysis personnel determined
that the parameter value was below the detection
limit of the instrumentation.
Data Not Cllctd -- This value indicates that no attempt was made to
determine the parameter value. This usually
indicates that BORIS combined several similar but
not identical data sets into the same data base table
but this particular science team did not
measure that parameter.
Blank -- Indicates that blank spaces are used to denote that type of value.
N/A -- Indicates that the value is not applicable to the respective column.
None -- Indicates that no values of that sort were found in the column.
Page 17
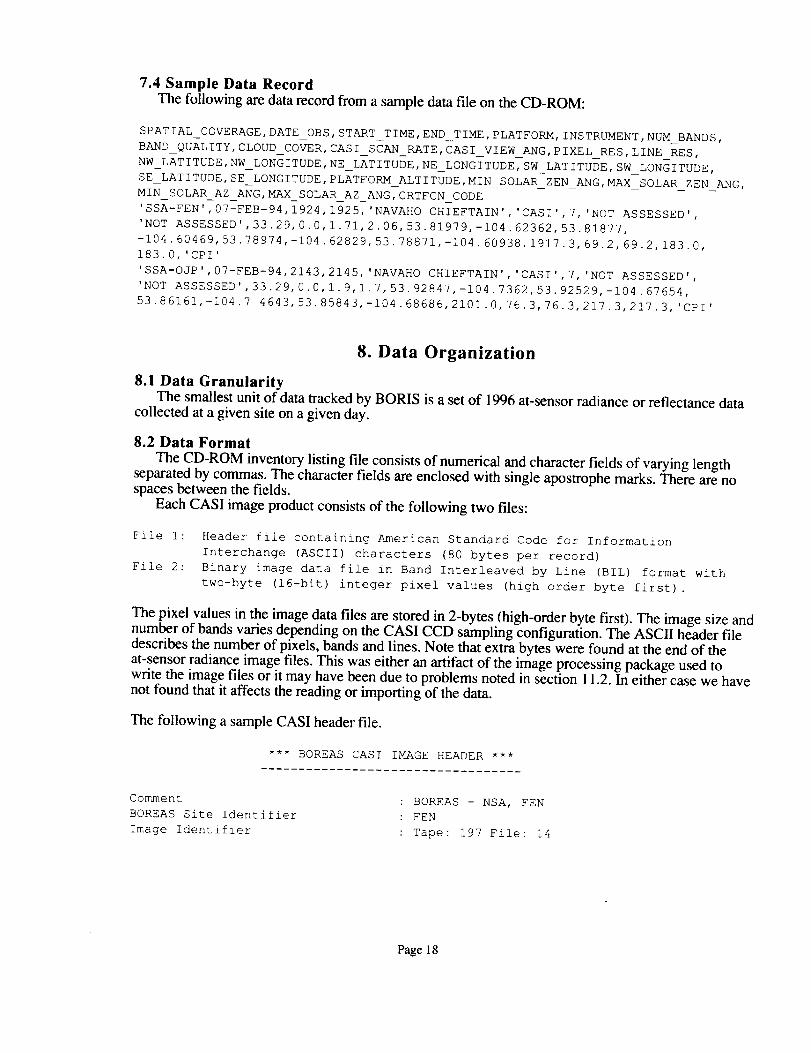
7.4 Sample Data RecordThe following are data record from a sample data file on the CD-ROM:
SPATIAL_COVERAGE,DATE_OBS,STARTTIME,END_TIME,PLATFORM, INSTRUMENT,NUM_BANDS,
BAND QUALITY, CLOUD COVER, CASI SCAN RATE,CASI VIEW ANG, PIXEL RES,LINE RES,
NW LATITUDE,NW LONGITUDE,NE LATITUDE,NE LONGITUDE, SW LATITUDE, SW LONGITUDE,
SE LATITUDE,$E LONGITUDE,PLATFORM ALTITUDE,MIN SOLAR ZEN ANG,MAX SOLAR ZEN _NG,
MIN SOLAR AZ ANG,MAX SOLAR AZ ANG, CRTFCN CODE
'SSA-FEN',07-FEB-94,1924,1925, 'NAVAHO CHIEFTAIN', 'CASI',7, 'NOT ASSESSED',
'NOT ASSESSED',33.29,0.0,1.71,2.06,53.81979,-104.62362,53.81877,
-104.60469,53.78974,-104.62829,53.78871,-104.60938,1917.3,69.2,69.2,183.0,
183.0,'CPI'
'SSA-OJP',07-FEB-94,2143,2145, 'NAVAHO CHIEFTAIN', 'CASI',7, 'NOT ASSESSED',
'NOT ASSESSED',33.29,0.0,1.9,1.7,53.92847,-104.7362,53.92529,-104.67654,
53.86161,[email protected] 4643,53.85843,-I04.68686,2101.0,76.3,76.3,217.3,217.3, 'CPI'
8. Data Organization
8.1 Data GranularityThe smallest unit of data tracked by BORIS is a set of 1996 at-sensor radiance or reflectance data
collected at a given site on a given day.
8.2 Data Format
The CD-ROM inventory listing file consists of numerical and character fields of varying lengthseparated by commas. The character fields are enclosed with single apostrophe marks. There are nospaces between the fields.
Each CASI image product consists of the following two files:
File I: Header file containing American Standard Code for Information
Interchange (ASCII) characters (80 bytes per record)
File 2: Binary image data file in Band Interleaved by Line (BIL) format with
two-byte (16-bit) integer pixel values (high order byte first).
The pixel values in the image data files are stored in 2-bytes (high-order byte first). The image size andnumber of bands varies depending on the CASI CCD sampling configuration. The ASCII header filedescribes the number of pixels, bands and lines. Note that extra bytes were found at the end of theat-sensor radiance image files. This was either an artifact of the image processing package used towrite the image files or it may have been due to problems noted in section 11.2. In either case we havenot found that it affects the reading or importing of the data.
The following a sample CASI header file.
*** BOREAS CASI IMAGE HEADER ***
Comment
BOREAS Site Identifier
Image Identifier
: BOREAS - NSA, FEN
: FEN
: Tape: 197 File: 14
Page 18
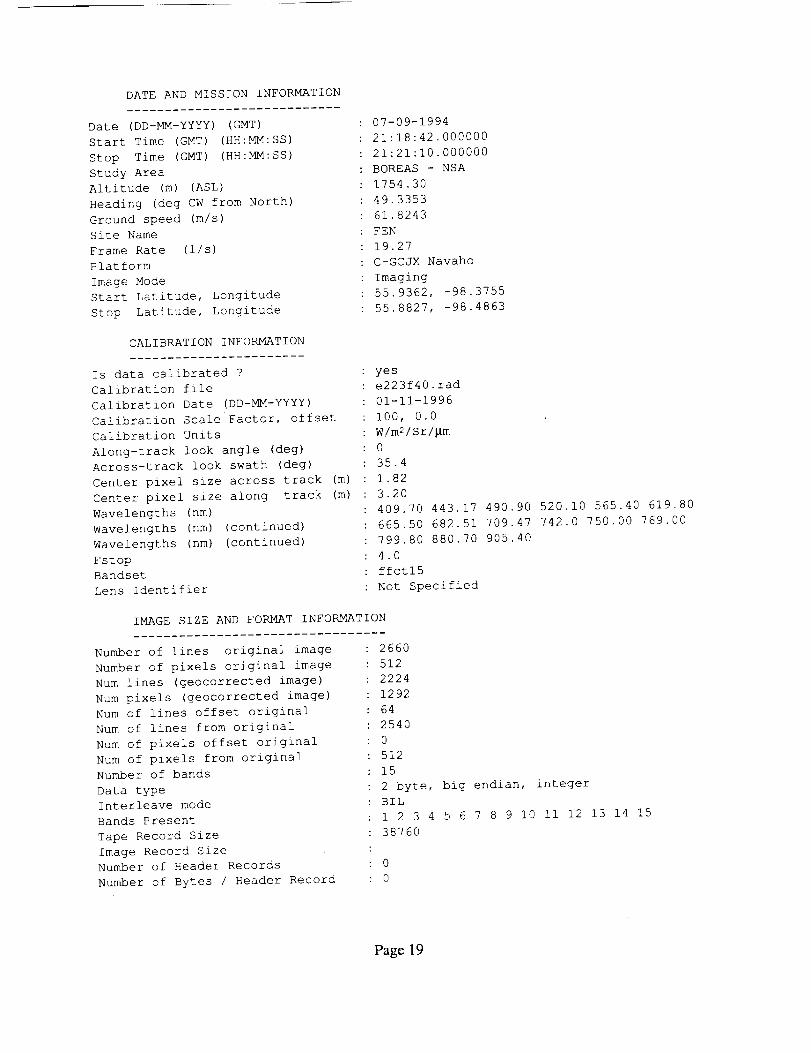
DATE AND MISSION INFORMATION
Date (DD-MM-YYYY) (GMT)
Start Time (GMT) (HH:MM:SS)
Stop Time (GMT) (HH:MM:SS)
Study Area
Altitude (m) (ASL)
Heading (deg CW from North
Ground speed (m/s)
Site Name
Frame Rate (I/s)
Platform
Image Mode
Start Latitude, Longitude
Stop Latitude, Longitude
: 07-09-1994
: 21:18:42.000000
: 21:21:10.000000
BOREAS - NSA
1754.30
49.3353
61.8243
: FEN
19.27
C-GCJX Navaho
Imaging
55.9362, -98.3755
: 55.8827, -98.4863
CALIBRATION INFORMATION
.......................
Is data calibrated v
Calibration file
Calibration Date (DD-MM-YYYY)
Calibration Scale Factor, offset
Calibration Units
Along-track look angle (deg)
Across-track look swath (deg)
: yes
e223f40, rad
01-11-1996
i00, 0.0
W/m2/Sr/_m
: 0
: 35.4
Center pixel size across track (m) : 1.82
Center pixel size along track (m) : 3.20
Wavelengths (nm)
Wavelengths (nm) (continued)
Wavelengths (nm) (continued)
Fstop
Bandset
Lens Identifier
: 409.70 443.17 490.90 520.10 565.40 619.80
: 665.50 682.51 709.47 742.0 750.00 769.00
- 799.80 880.70 905.40
: 4.0
: ffctl5
: Not Specified
IMAGE SIZE AND FORMAT INFORMATION
Number of lines original image
Number of pixels original image
Num lines (geocorrected image)
Num pixels (geocorrected image)
Num of lines offset original
Num of lines from original
Num of pixels offset original
Num of pixels from original
Number of bands
Data type
Interleave mode
Bands Present
Tape Record Size
Image Record Size
Number of Header Records
Number of Bytes / Header Record
: 2660
: 512
: 2224
: 1292
: 64
: 2540
: 0
: 512
: 15
, 2 byte, big endian, integer
: BIL
: 1 2 3 4 5 6 7 8 9 I0 Ii 12 13 14 15
: 38760
: 0
: 0
Page 19
9. Data Manipulations
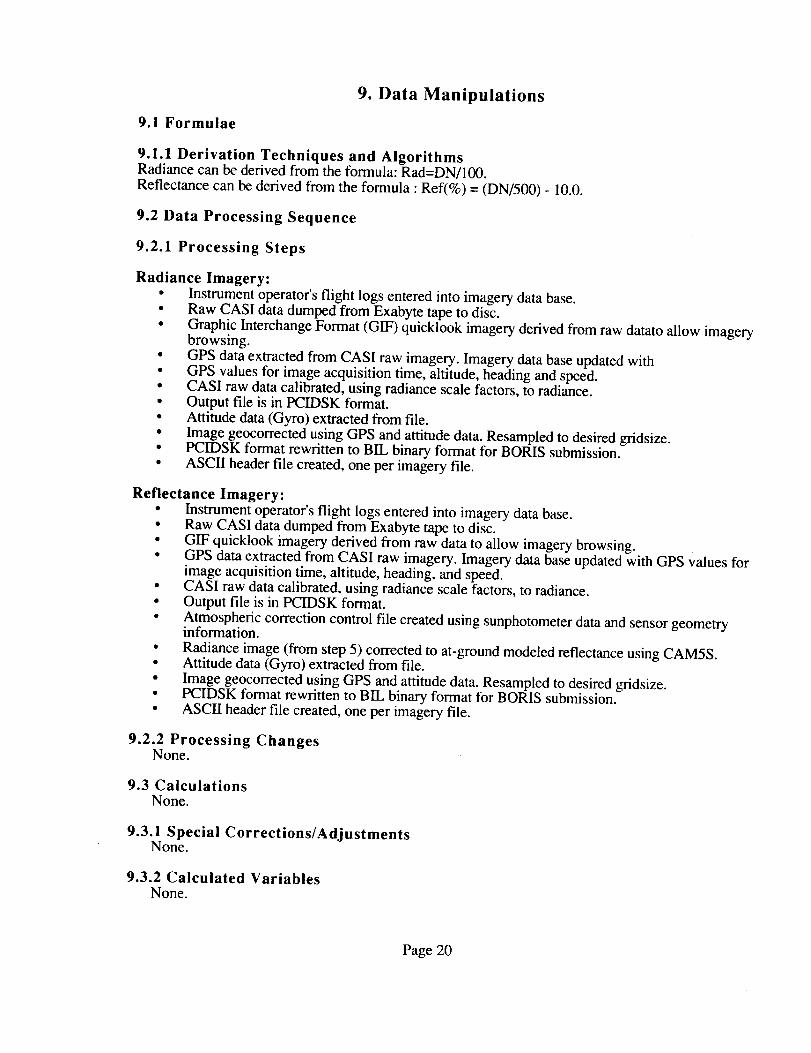
9.1 Formulae
9.1.1 Derivation Techniques and AlgorithmsRadiance can be derived from the formula: Rad=DN/100.
Reflectance can be derived from the formula : Reff%) = (DN/500) - 10.0.
9.2 Data Processing Sequence
9.2.1 Processing Steps
Radiance Imagery:• Instrument operator's flight logs entered into imagery data base.• Raw CASI data dumped from Exabyte tape to disc.• Graphic Interchange Format (GIF) quicklook imagery derived from raw datato allow imagery
browsing.• GPS data extracted from CASI raw imagery. Imagery data base updated with• GPS values for image acquisition time, altitude, heading and speed.• CASI raw data calibrated, using radiance scale factors, to radiance.• Output file is in PCIDSK format.• Attitude data (Gyro) extracted from file.• Image geocorrected using GPS and attitude data. Resampled to desired gridsize.• PCIDSK format rewritten to BIL binary format for BORIS submission.• ASCII header file created, one per imagery file.
Reflectance Imagery:• Instrument operator's flight logs entered into imagery data base.• Raw CASI data dumped from Exabyte tape to disc.• GIF quicklook imagery derived from raw data to allow imagery browsing.• GPS data extracted from CASI raw imagery. Imagery data base updated with GPS values for
image acquisition time, altitude, heading, and speed.• CASI raw data calibrated, using radiance scale factors, to radiance.• Output file is in PCIDSK format.• Atmospheric correction control file created using sunphotometer data and sensor geometry
information.
• Radiance image (from step 5) corrected to at-ground modeled reflectance using CAM5S.• Attitude data (Gyro) extracted from file.• Image geocorrected using GPS and attitude data. Resampled to desired gridsize.• PCIDSK format rewritten to BIL binary format for BORIS submission.• ASCII header file created, one per imagery file.
9.2.2 Processing ChangesNone.
9.3 CalculationsNone.
9.3.1 Special Corrections/AdjustmentsNone.
9.3.2 Calculated VariablesNone.
Page 20
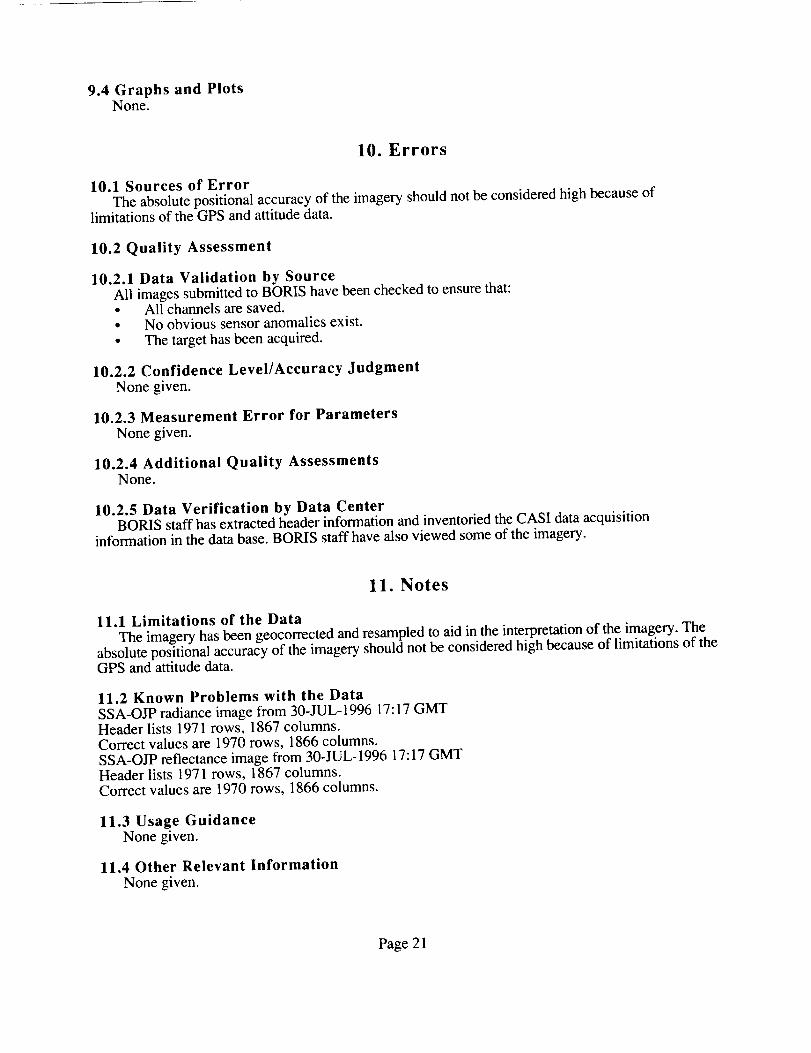
9.4 Graphs and PlotsNone.
10. Errors
10.1 Sources of Error
The absolute positional accuracy of the imagery should not be considered high because oflimitations of the GPS and attitude data.
10.2 Quality Assessment
10.2.1 Data Validation by SourceAll images submitted to BORIS have been checked to ensure that:• All channels are saved.• No obvious sensor anomalies exist.
• The target has been acquired.
10.2.2 Confidence Level/Accuracy JudgmentNone given.
10.2.3 Measurement Error for Parameters
None given.
10.2.4 Additional Quality AssessmentsNone.
10.2.5 Data Verification by Data CenterBORIS staff has extracted header information and inventoried the CASI data acquisition
information in the data base. BORIS staff have also viewed some of the imagery.
11. Notes
11.1 Limitations of the Data
The imagery has been geocorrected and resampled to aid in the interpretation of the imagery. Theabsolute positional accuracy of the imagery should not be considered high because of limitations of theGPS and attitude data.
11.2 Known Problems with the Data
SSA-OJP radiance image from 30-JUL-1996 17:17 GMTHeader lists 1971 rows, 1867 columns.Correct values are 1970 rows, 1866 columns.
SSA-OJP reflectance image from 30-JUL-1996 17:17 GMTHeader lists 1971 rows, 1867 columns.Correct values are 1970 rows, 1866 columns.
11.3 Usage GuidanceNone given.
11.4 Other Relevant Information
None given.
Page 21
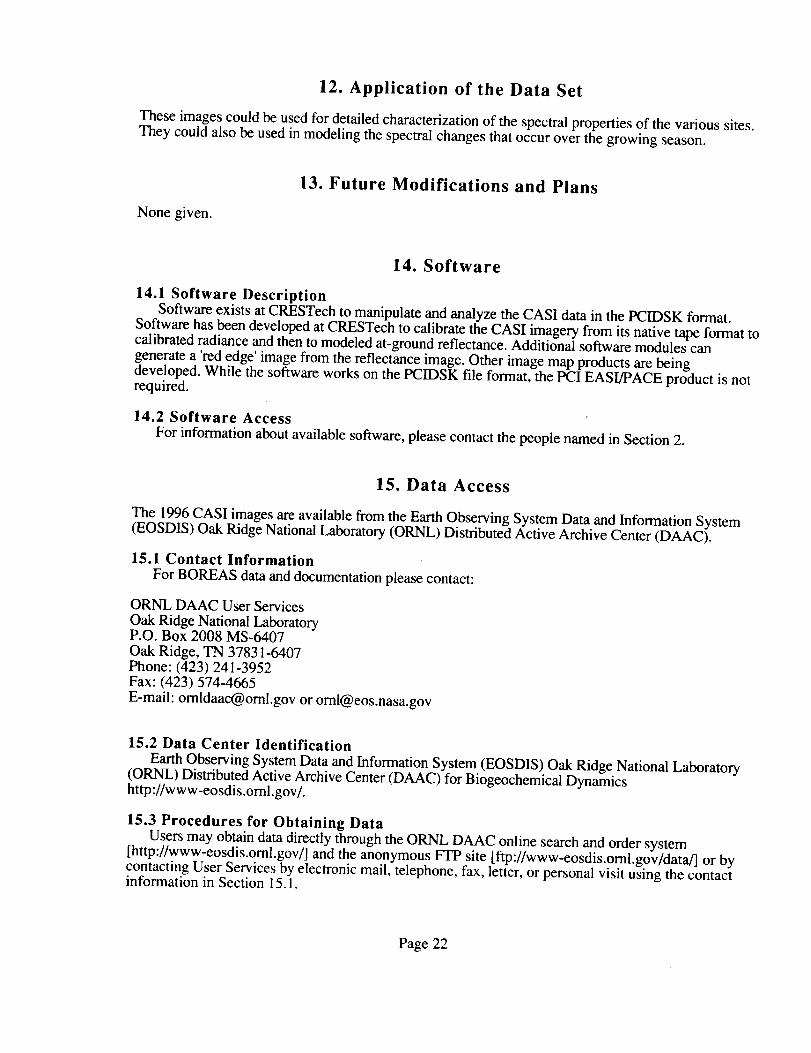
12. Application of the Data Set
These images could be used for detailed characterization of the spectral properties of the various sites.They could also be used in modeling the spectral changes that occur over the growing season.
None given.
13. Future Modifications and Plans
14. Software
14.1 Software DescriptionSoftware exists at CRESTech to manipulate and analyze the CASI data in the PCIDSK format.
Software has been developed at CRESTech to calibrate the CASI imagery from its native tape format tocalibrated radiance and then to modeled at-ground reflectance. Additional software modules cangenerate a 'red edge' image from the reflectance image. Other image map products are beingdeveloped. While the software works on the PCIDSK file format, the PCI EASI/PACE product is notrequired.
14.2 Software Access
For information about available software, please contact the people named in Section 2.
15. Data Access
The 1996 CASI images are available from the Earth Observing System Data and Information System(EOSDIS) Oak Ridge National Laboratory (ORNL) Distributed Active Archive Center (DAAC).
15.1 Contact Information
For BOREAS data and documentation please contact:
ORNL DAAC User Services
Oak Ridge National LaboratoryP.O. Box 2008 MS-6407Oak Ridge, TN 37831-6407Phone: (423) 241-3952Fax: (423) 574-4665E-mail: [email protected] or [email protected]
15.2 Data Center Identification
Earth Observing System Data and Information System (EOSDIS) Oak Ridge National Laboratory(ORNL) Distributed Active Archive Center (DAAC) for Biogeochemical Dynamicshttp://www-eosdis.oml.gov/.
15.3 Procedures for Obtaining DataUsers may obtain data directly through the ORNL DAAC online search and order system
[http://www-eosdis.oml.gov/] and the anonymous FTP site [ftp://www-eosdis.ornl.gov/data/] or bycontacting User Services by electronic mail, telephone, fax, letter, or personal visit using the contactinformation in Section 15.1.
Page 22
15.4 Data Center Status/Plans
The ORNL DAAC is the primary source for BOREAS field measurement, image, GIS, andhardcopy data products. The BOREAS CD-ROM and data referenced or listed in inventories on theCD-ROM are available from the ORNL DAAC.
16. Output Products and Availability
16.1 Tape ProductsCASI image data are available on 8-mm tape media.
16.2 Film ProductsNone.
16.3 Other Products
Although the inventory is contained on the BOREAS CD-ROM set, the actual CASI images arenot. See Section 15 for information about how to obtain the data.
Color GIF images of the BORIS subset are available. Additional imagery has been acquired; pleasebrowse the data base of quicklook images on the CRESTech Web site (http://www.eol.crestech.ca/).
• GPS data.
• Gyro data.• Upwelling and downwelling light probe data, which may become available.
17. References
17.1 Platform/Sensor/Instrument/Data Processing DocumentationDunlop, J.D. and P. Shepherd. 1995. Building a Boreal Forest Virtual Library. DSS Technical Report(Design Document).
Itres Research, Ltd. 1992. Compact Airborne Spectrographic Imager (CASI) User Manual Revision2.1.
17.2 Journal Articles and Study ReportsAchal, S. 1991. Personal Communication.
Anger, C.D., S. Mah, and S.K. Babey. 1994. Technological Enhancements to the Compact AirborneSpectrographic Imager (CASI). Proceedings of the First International Airborne Remote SensingConference and Exhibition, Vol. II, pp. 205-213.
Anger, C.D., S.K. Babey, R.J. Adamson. 1990. A New Approach to Imaging Spectroscopy.Imaging Spectroscopy of the Terrestrial Environment, G. Vane, Editor. Proc. SP1E I298. pp. 72-86.
Babey, S. and R.J. Softer. 1992. Radiometric Calibration of the Compact Airborne SpectrographicImager (CASI). Canadian Journal of Remote Sensing (Special issue on Imaging Spectrometry), Vol.18, No. 4, Oct. 1992, pp. 233-242.
Freemantle, J.R., J.R. Miller, and A.B. Hollinger. 1991. Improvements in Spectral Feature Extractionafter Image Based Refinement of Spectral Calibration of Imaging Spectrometer Data. Proceedings ofthe 14th Canadian Symposium on Remote Sensing. Calgary, Alberta. pp. 347-349.
Page 23
Gray,L.H., J.R.Freemantle,P.R.Shepherd,J.R.Miller, J.W. Harron,andC.H. Hersom.1997.CharacterizationandCalibrationof theCASIAirborneImagingSpectrometerfor BOREAS.CanadianJournalof RemoteSensing(SpecialissueonBOREAS),Vol. 23,No.2, June1997,pp. 188-195.
Harron,J.W.,J.R.Freemantle,A.B. HollingerandJ.R.Miller. 1992.MethodologiesandErrorsintheCalibrationof aCompactAirborneSpectrographicImager.CanadianJoumalof RemoteSensing(Specialissueon ImagingSpectrometry),Vol. 18,No.4, Oct. 1992,pp.243-249.
Harron,J.W., J.R.Freemantle,L.H. Gray,P.R.Shepherd,C.H. Hersom,J.R.Miller, andA.B.Hollinger.1995.Radiometriccalibrationmeasuresfor themulti-temporalBOREASprojects:resultsoftheinter-agencycrosscalibrationandtemporalstabilityof CASIresponsivity.Proceedingsof the17thCanadianSymposiumonRemoteSensing,13-16June,Saskatoon,Saskatchewan,p. 202-207.
Li, X.W. andA.H. Strahler.1992.Geometrical-opticalbidirectionalreflectancemodelingof thediscretecrownvegetationcanopy:effectof crownshapeandmutualshadowing.IEEETransactionsonGeoscienceandRemoteSensing,Vol.GE-30,276-291.
Matson,P.,L. Johnson,C. Billow, J.R.Miller, andR. Pu. 1994.Seasonalpatternsandremotespectralestimationof canopychemistryacrosstheOregonTransect.EcologicalApplications,Vol.4,pp.280-298.
Miller, J.R.,J.R.Freemantle,P.R.Shepherd,L. Gray,N. O'Neill, A. Royer,andE. Senese.1995.Deploymentof CASIto meettheNeedsof BOREASScience.Proceedingsof the17thCanadianSymposiumonRemoteSensing,13-16June,Saskatoon,Saskatchewan,pp. 169-175.
Newcomer,J.,D. Landis,S.Conrad,S.Curd,K. Huemmrich,D. Knapp,A. Morrell,J.Nickeson,A.Papagno,D. Rinker,R. Strub,T. Twine,F.Hall, andP.Sellers,eds.2000.CollectedDataof TheBorealEcosystem-AtmosphereStudy.NASA.CD-ROM.
O'Neill, N.T.,A. Royer,M.N. Nguyen.1996.CanadianAdvancedModified5S(CAM5S).ScientificandTechnicalReportontheDevelopmentof aModifiedVersionof theH5Scodewhichincorporatesmajorfeaturesof the6Scode.CARTELinternalreportCARTEL-1996-020,29pp.
O'Neill,N.T., F.Zagolski,M. Bergeron,A. Royer,J.Miller, andJ.Freemantle.1997.AtmosphericCorrectionValidationof CASIImagesAcquiredovertheBOREASSouthernStudyArea.CanadianJournalof RemoteSensing(SpecialissueonBOREAS),Vol. 23,No.2,June1997,pp. 143-162.
Schafer,J. 1994.PersonalCommunication.
Sellers,P.andF.Hall. 1994.BorealEcosystem-AtmosphereStudy:ExperimentPlan.Version1994-3.0,NASA BOREASReport(EXPLAN94).
Sellers,P.andF.Hall. 1996.BorealEcosystem-AtmosphereStudy:ExperimentPlan.Version1996-2.0,NASA BOREASReport(EXPLAN96).
Sellers,P.,F. Hall, andK.F. Huemmrich.1996.BorealEcosystem-AtmosphereStudy:1994Operations.NASABOREASReport(OPSDOC94).
Sellers,P.,F.Hall, andK.F. Huemmrich.1997.BorealEcosystem-AtmosphereStudy:1996Operations.NASA BOREASReport(OPSDOC96).
Page24
Sellers,P.,F. Hall, H. Margolis,B. Kelly, D. Baldocchi,G. denHartog,J.Cihlar,M.G.Ryan,B.Goodison,P.Crill, K.J.Ranson,D. Lettenmaier,andD.E.Wickland.1995.Theborealecosystem-atmospherestudy(BOREAS):anoverviewandearlyresultsfromthe1994field year.Bulletinof theAmericanMeteorologicalSociety.76(9):1549-1577.
Sellers,P.J.,F.G.Hall, R.D. Kelly, A. Black, D. Baldocchi,J.Berry,M. Ryan,K.J.Ranson,P.M.Crill, D.P.Lettenmaier,H. Margolis,J.Cihlar,J.Newcomer,D. Fitzjarrald,P.G,Jarvis,S.T.Gower,D. Halliwell, D. Williams,B. Goodison,D.E.Wickland,andF.E.Guertin.1997.BOREASin 1997:ExperimentOverview,ScientificResultsandFutureDirections.Journalof GeophysicalResearch102(D24):28,731-28,770.
Shepherd,P.R.,N.T. O'Neill, andT. Piekutowski.1995.Analysis of downwelling and up-wellingdiffuser probe data to determine at-sensor irradiance fluxes. Proceedings of the 17th CanadianSymposium on Remote Sensing, 13-16 June, Saskatoon, Saskatchewan, pp. 337-342.
Softer, R.J., W. Wanner, J.R. Miller, and A.H. Strahler. 1995. Winter boreal forest canopy BRFresults: comparisons between airborne data, laboratory simulations, and geometrical-optical modeldata. Proceedings of IGARSS'95, 10-14 July, Firenze, Italy.
Thomas, P.J., A.B. Hollinger, K.M. Chu, and J.W. Harron. 1991. The ISTS Array Detector TestFacility. Proceedings of the Society of Photo-Optical Instrumentation Engineers, 834, pp. 91-105.
Zarco, P. 1998. Correlations between CO2 fluxes and high spatial resolution reflectance imagery.Master of Science thesis submitted to the University of Dundee.
17.3 Archive/DBMS Usage DocumentationNone.
None.
18. Glossary of Terms
AC
AFM
AGL
AOCI
ASAS
ASCII
AVHRR
AVIRIS
B/GHRIS
BIL
BOREAS
BORIS
BRDF
CARTEL
CASI
CCD
CCRS
19. List of Acronyms
- Alternating Current
- Airborne Fluxes and Meteorology
- Above Ground Level
- Airborne Ocean Color Imager
- Advanced Solid-state Array Spectroradiometer
- American Standard Code for Information Interchange
- Advanced Very High Resolution Radiometer
- Airborne Visible and Infrared Imaging Spectroradiometer
- BOREAS Global Hypermedia Research Information System
- Band Interleaved by Line
- BOReal Ecosystem-Atmosphere Study
- BOREAS Information System
- Bidirectional Reflectance Distribution Function
- Centre d'Applications et de Recherches en Teledetection
- Compact Airborne Spectrographic Imager
- Charge-Coupled Device
- Canada Centre for Remote Sensing
Page 25
CD-ROM - Compact Disk-Read-Only Memory
CRESTech - Centre for Research in Earth and Space Technology
DC - Direct Current
EOL - Earth Observations Laboratory
EOS - Earth Observing System
EOSDIS - EOS Data and Information System
FFC-T - Focused Field Campaign - Thaw
FFC-W - Focused Field Campaign - Winter
FOV - Field of View
FWHM - Full Width, Half Maximum
GIF - Graphic Interchange Format
GIS - Geographic Information System
GMT - Greenwich Mean Time
GOES - Geostationary Operational Environmental Satellite
GPS - Global Positioning System
GSFC - Goddard Space Flight Center
HTML - HyperText Markup Language
HYD - Hydrology
IFC - Intensive Field Campaign
ILP - Incident Light Probe
ISTS - Institute for Space and Terrestrial Science
JPL - Jet Propulsion Laboratory
LAI - Leaf Area Index
MERIS - Medium Resolution Imaging Spectrometer
NAD83 - North American Datum of 1983
NASA - National Aeronautics and Space Administration
NRC - National Research Council
NSA - Northern Study Area
NSERC - Natural Sciences and Engineering Research Council
OA - Old Aspen
OBS - Old Black Spruce
OJP - Old Jack Pine
ORNL - Oak Ridge National Laboratory
PANP - Prince Albert National Park
PAR - Photosynthetically Active Radiation
PARABOLA - Portable Apparatus for Rapid Acquisition of bidirectional
Observations of Land and Atmosphere
PI - Principal Investigator
PRSO - Provincial Remote Sensing Office
RSS - Remote Sensing Science
SeaWiFS - Sea-viewing Wide Field-of-View Sensor
SPOT - Satellite Pour l'Observation de la Terre
SSA - Southern Study Area
SSM/I - Special Sensor Microwave/Imager
TE - Terrestrial Ecology
TF - Tower Flux
TGB - Trace Gas Biogeochemistry
TM - Thematic Mapper
URL - Uniform Resource Locator
UTM - Universal Transverse Mercator
VIS/NIR - Visible/Near-Infrared
WWW - World Wide Web
YJP - Young Jack Pine
Page 26
20. Document Information
20.1 Document Revision Date
Written: 07-May- 1996Last Updated: 10-Nov- 1999
20.2 Document Review Date
BORIS Review: 15-Sep- 1997Science Review: 30-Jan- 1998
20.3 Document ID
20.4 Citation
The CASI instrument was not supported as a facility sensor at BOREAS. The preparation,deployment, and analysis of CASI data were made possible through Natural Sciences and EngineeringResearch Council (NSERC) funding to the PI and funding from the Ontario Government through theInstitute for Space and Terrestrial Science (ISTS), now renamed CRESTech. Users of CASI data arerequested to make contact with the PI to discuss a mutually acceptable form of acknowledgment orcollaboration. Acknowledgements should also include citations of relevant papers in Section 17.2.
If using data from the BOREAS CD-ROM series, also reference the data as:Miller, J.R., "Variation in Radiometric Properties of the Boreal Forest Landscape as a Function of
the Ecosystem Dynamics." In Collected Data of The Boreal Ecosystem-Atmosphere Study. Eds. J.Newcomer, D. Landis, S. Conrad, S. Curd, K. Huemmrich, D. Knapp, A. Morrell, J. Nickeson, A.Papagno, D. Rinker, R. Strub, T. Twine, F. Hall, and P. Sellers. CD-ROM. NASA, 2000.
Also, cite the BOREAS CD-ROM set as:Newcomer, J., D. Landis, S. Conrad, S. Curd, K. Huemmrich, D. Knapp, A. Morrell, J.
Nickeson, A. Papagno, D. Rinker, R. Strub, T. Twine, F. Hall, and P. Sellers, eds. Collected Data ofThe Boreal Ecosystem-Atmosphere Study. NASA. CD-ROM. NASA, 2000.
20.5 Document Curator
20.6 Document URL
Page 27
REPORT DOCUMENTATION PAGE FormApprovedOMB No. 0704-0188
Public reportingburden for this collectionof informationis estimated to average 1hour per response,includingthe time for reviewing instructions,searchingexistingdata sources,gathering and me_ntaining 6aedata needed, end completingand reviewingthe cot[ectionof information. Send commentsregardingthis I_urdenestimate or any other aspect of thisco;lection of information, including suggestions for reducing this burden, to Washington Headquarters Services. Directorate for Information Operations and Reports, 1215 Jefferson
Davis Highway, Suite 1204, Arlington, VA 22202-4302, and tO the Office of Management and Budget, Paperwork Reduction Project (0704-0188), Washington, DC 20503.
!1. AGENCY USE ONLY (Leave b/ank) 2. REPORT DATE 3. REPORT TYPE AND DATES COVERED
August 2000 Technical Memorandum4. TITLE AND SUBTITLE 5. FUNDING NUMBEi_S
Technical Report Series on the Boreal Ecosystem-Atmosphere Study (BOREAS)
BOREAS RSS-19 1996 CASI At-Sensor Radiance and Reflectance Images 923
6. AUTHOR(S) RTOP: 923-462-33-01
John Miller amd Jim Freemantle
Forrect G. Hall and Jaime Nickeson, Editors
7. PERFORMING ORGANIZATION NAME(S) AND ADDRESS (ES) 8. PEFORMING ORGANIZATIONREPORT NUMBER
Goddard Space Flight CenterGreenbelt, Maryland 20771 2000-03136-0
9. SPONSORING / MONITORING AGENCY NAME(S) AND ADDRESS (ES) 10. SPONSORING / MONITORINGAGENCY REPORT NUMBER
National Aeronautics and Space Administration TM--2000-209891
Washington, DC 20546-0001 Vol. 76
i
11. SUPPLEMENTARY NOTES
J. Miller: York University, Ontario, Canada; J. Freemantle: EOL/CRESTECH, Ontario, Canada;
J. Nickeson: Raytheon ITSS
12a. DISTRIBUTION / AVAILABILITY STATEMENT 12b. DISTRIBUTION CODE
Unclassified-Unlimited
Subject Category: 43
Report available from the NASA Center for AeroSpace Information,
7121 Standard Drive, Hanover, MD 21076-1320. (301) 621-0390.ii
13. ABSTRACT (Maximum 200 words)
The BOREAS RSS-19 team collected CASI images from the Chieftain Navaho aircraft in order to
observe the seasonal change in the radiometric reflectance properties of the boreal forest landscape.
CASI was deployed as a site-specific optical sensor as part of BOREAS. The overall objective of the
CASI deployment was to observe the seasonal change in the radiometric reflectance properties of the
boreal forest landscape. In 1996, image data were collected with CASI on 15 days during a field
campaign between 18-July and 01-August, primarily at flux tower sites located at study sites near
Thompson, Manitoba, and Prince Albert, Saskatchewan. A variety of CASI data collection strategies
were used to meet the following scientific objectives: 1) canopy bidirectional reflectance, 2) canopy
biochemistry, 3) spatial variability, and 4) estimates of up and downwelling PAR spectral albedo, as
well as changes along transects across lakes at the southern site and transects between the NSA and
SSA. The images are stored as binary image files.
14. SUBJECTTERMSBOREAS, remote sensing science, CASI,
17. SECURITY CLASSIFICATIONOF REPORT
Unclassified
NSN 7540-01-280-5500
18. SECURITY CLASSIFICATIONOF THIS PAGE
Unclassified
19. SECURITY CLASSIFICATION
OF ABSTRACT
Unclassified
15. NUMBER OF PAGES
2716. PRICE CODE
20. LIMITATION OF ABSTRACT
UL
Standard Form 298 (Rev. 2-89)Prescribed by ANSI Std. Z39 18
298-102