Embed Size (px)
Citation preview
Estimates of Active Fire Properties using AVIRIS, ASTER and MODIS
D.A. RobertsDepartment of GeographyU.C. Santa Barbara
Photograph of the Station Fire behind the Jet Propulsion Laboratoryfrom Philipp Schneider

• Introduction– Remote Sensing of Wildfire– Why Fire Temperature and Area
• Multiple Endmember Spectral Mixture Analysis and Fire– AVIRIS Examples from Simi– MODIS– ASTER
• Early Detection using AVIRIS• Summary
Estimates of Active Fire Properties
• Major Contributors– Phil Dennison and Ted Eckmann
• Agency Support– NASA Solid Earth and Natural Hazards– NASA Regional Earth Science and Applications– NASA EO-1 Science Validation Team– Joint Fire Science Program– NASA Earth System Science Program MODIS: 9-5-2009

Remote Sensing of Wildfire• Pre-fire Conditions
– Fuel Types (Fuel models)– Fuel Condition (live to dead fuels)– Live Fuel Moisture
• Fire Danger (current conditions)– Incorporates measures of fuel properties and weather– Fire Danger Indices
• Active fire– Fire temperature, fire area and perimeters– Fire spread modeling– Emission modeling and suppression
• Post-fire conditions– Burned area– Fire effects– Post-fire recovery

Why Active Fire Properties?
• Improved measures of fire temperature and area may aid in fire suppression efforts
• Fire temperature and burned area are critical for an improved understanding of emissions
• Fire intensity (temperature) impacts post-fire recovery, soil properties
• While the TIR is widely considered the preferred part of the spectrum, the VNIR-SWIR also has considerable potential

0.000E+00
5.000E+03
1.000E+04
1.500E+04
2.000E+04
2.500E+04
3.000E+04
3.500E+04
4.000E+04
4.500E+04
5.000E+04
400 1400 2400 3400 4400 5400 6400
Wavelength (nm)
Rad
ianc
e (W
m-2μm
-1sr
-1)
Solar*50
1600K
1400K
1200K
1000K
Hot Object Emission
• Hot objects emit strongly in the VNIR-SWIR
• As objects cool, peak emission shifts to the TIR and the area under the curve declines
• The spectral shape provides temperature, area under the curve size
AVIRIS
ASTER (6 bands) MODIS(3 SWIR, 1 MID-IR, 3TIR)

Fire Temperature and Area
• Spectral shape is unique to a specific temperature• The area under the curve varies with area and temperature
– Single band estimates of fire properties are under-determined
0.000E+00
2.000E+03
4.000E+03
6.000E+03
8.000E+03
1.000E+04
1.200E+04
400 1400 2400 3400 4400 5400 6400
Wavelength (nm)
Rad
ianc
e (W
m-2μm
-1sr
-1)
1200K
1000K
1600K (0.1)
1000K (0.5)
800K

Multiple Endmember Spectral Mixture Analysis (MESMA)
• Extension of a Simple Mixture Model
– Riλ' = + εiλ
– RMS =
• Number and Types of Endmembers Vary Per Pixel• For fires mixed radiance is a product of modeled
radiance of hot objects and a background– The endmember selected provides temperature– The fraction of hot and cold endmembers provides area
f Pk 1
N
k i k* λ=∑
iλε2
k=1
N
N
∑-1
AVIRIS Fire Temperature and Area (Dennison et al., 2006)
• Multiple Endmember Spectral Mixture Analysis (MESMA) was used to model each pixel in the AVIRIS image
• Tested on the 2003 Simi Fire• Each pixel was modeled as a combination of:
– 1 emitted thermal radiance endmember– 1 reflected solar radiance endmember– Shade (zero radiance)
• Emitted thermal radiance endmembers were modeled using MODTRAN– Ranged from 400-1500 K (260°-2240°F) at increments of 10 K
• Reflected solar radiance endmembers were selected from the image using Endmember Average RMSE (EAR)– Six possible endmembers: riparian, dense chaparral, sparse
chaparral/sagescrub, grass, soil and ash

Reflected Solar Radiance Endmembers
0
0.02
0.04
0.06
0.08
0.1
0.12
400 900 1400 1900 2400Wavelength (nm)
Rad
ianc
e (W
m2 nm
-1sr
-1) Dense Chap
Sparse ChapRiparianGrassSoilAsh
Dennison et al., 2006

Subset of Emitted Thermal Radiance Endmembers
0
0.5
1
1.5
2
2.5
400 900 1400 1900 2400Wavelength (nm)
Rad
ianc
e (W
m-2
nm-1
sr-1
)
1000 K900 K800 K700 K600 K
Dennison et al., 2006

Example: Mixed Radiance
0
0.02
0.04
0.06
0.08
0.1
0.12
0.14
400 900 1400 1900 2400Wavelength (nm)
Rad
ianc
e (W
m-2
nm-1
sr-1
) Soil1000KCombined Radiance
Dennison et al., 2006

Retrieved Temperature Endmembers
Dennison et al., 2006Dennison et al., 2006

Retrieved Fire Fraction
Dennison et al., 2006

Dense Chap.Land Cover Ash
SoilRiparian Sparse Chap.
Grass
Dennison et al., 2006
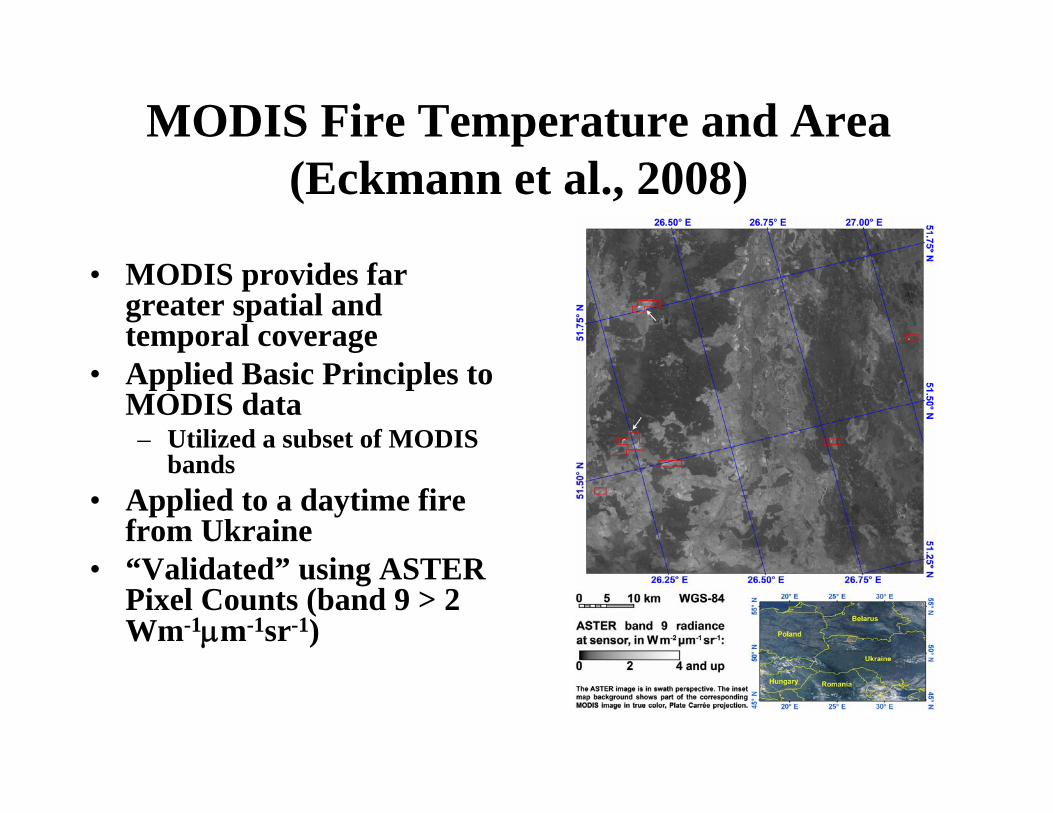
MODIS Fire Temperature and Area(Eckmann et al., 2008)
• MODIS provides far greater spatial and temporal coverage
• Applied Basic Principles to MODIS data– Utilized a subset of MODIS
bands• Applied to a daytime fire
from Ukraine• “Validated” using ASTER
Pixel Counts (band 9 > 2 Wm-1μm-1sr-1)

MODIS Endmembers
*Modtran Hot EMs500-1500K @ 10K
*Convolved to MODIS bands* 7 MODIS bands used in models
Eckmann et al., 2008

MODIS Endmembers
• Also required background spectra– Systematically sampled from MODIS, screened for fires
• Also required “shade” endmember– The equivalent of atmospheric emission– Generated using Modtran with a cold (10K) background
Eckmann et al., 2008

MODIS Fire Pixels(Eckmann et al., 2008)
19 pixels identified with 0 to 2.55% fireFire temperatures tended to be bimodal, most likely due to solar
contamination. This impacts fire area.

MESMA Compared to FRP
Fire Radiative Power (FRP) is estimated from the MODIS 4 μm bandFRP = 4.34x10⁻¹⁹Wm-2K-8*[(T4)8-(T4b)8]
ASTER fire counts match MESMA area better, although neither isperfect
Eckmann et al., 2008

ASTER Night Time ImageSawmill Fire (15 Sept 2006)
• ASTER has a finite field of view– Thus ASTER fire
counts represent mixtures
• MESMA was applied to ASTER imagery to estimate fire temperature and area
Eckmann et al., in press

ASTER Hot Endmembers
• Generated using Modtran4.3
• Parameterized for– Sept 15, 2006 5:54:21 UTC– Mid-latitude Summer– 5 km visibility– 0.503 cm water vapor– 385 ppm CO2– 37.77 N, 118.39 W 1985 m
Eckmann et al., in press

Fire Temperature and Area from ASTER
• Fire temperatures ranged 500 to 1500K, mostly around 1000K
• Fire sizes were generally small, less than 5%
Eckmann et al., in press

Modeled vs Measured Radiance
• Modeled and measured radiance match well
• Examples are given for 740, 910 and 1330 K with areas of 0.826, 0.313 and 0.0075%
Eckmann et al., in press

Early Fire Detection(Dennison and Roberts, 2009)
• MESMA works but is computationally intensive
• A Normalized Difference Index (NDI) was evaluated as a way of detecting fire emitted radiance
• Optimal bands were identified by developing band combinations that produced the highest accuracy compared to MESMA
• Optimal bands were all located in the SWIR
Kappa for fire detectionsHDFI= (Li-Lj)/(Li+Lj)
i
j

Wavelength Dependence of the HFDI
• Emission sources can be mapped by additional radiance in strong atmospheric absorption bands– HFDI= (L2429-
L2061)/(L2429+L2061)• By rapid location of
emission sources, MESMA can be implemented only where needed
Dennison and Roberts, 2009
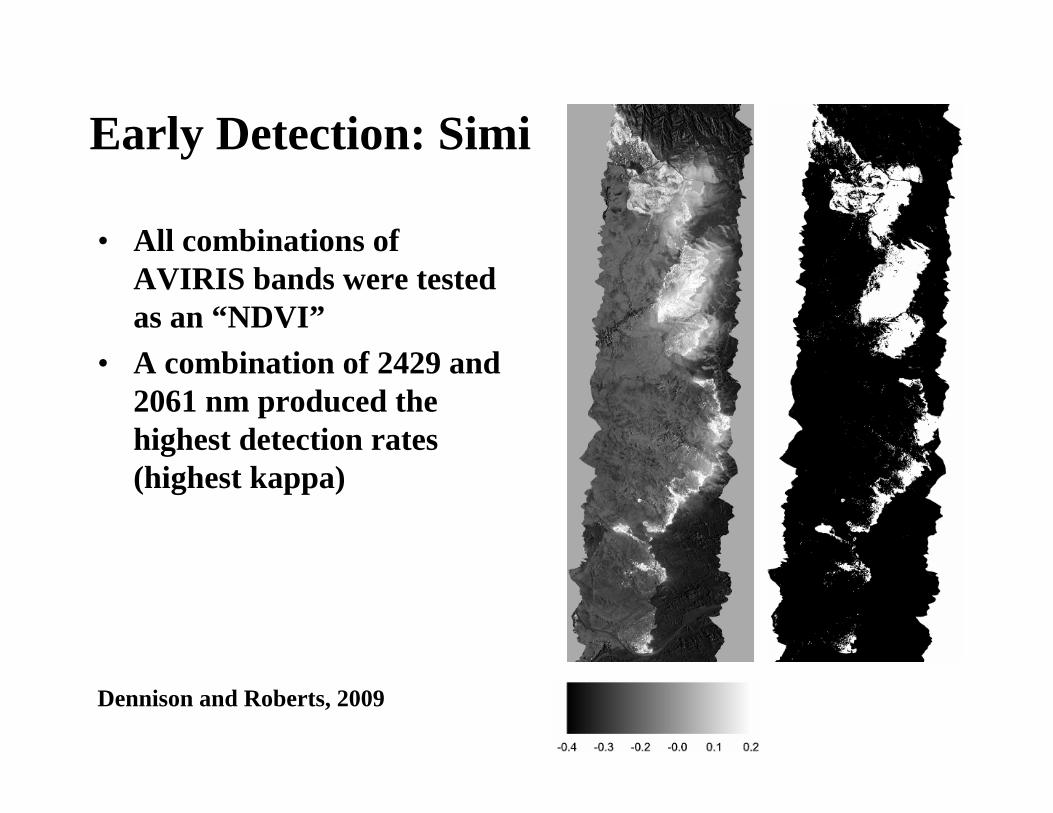
Early Detection: Simi
• All combinations of AVIRIS bands were tested as an “NDVI”
• A combination of 2429 and 2061 nm produced the highest detection rates (highest kappa)
Dennison and Roberts, 2009

Early Detection: Indian Fire
• HFDI was compared to three other approaches– CO2 Index (Dennison, 2006)– K Emission Index (767, 770
nm)(Vodacek et al., 2002)– ASTER Fire Detection
• CO2 Index produced numerous false positives
• K Emission Index severely impacted by smoke
• HFDI and ASTER Fire count very similar
Dennison and Roberts, 2009

Summary
• MESMA has shown considerable promise applied to AVIRIS, ASTER and MODIS for estimating fire area and temperature
• New approaches can be developed to improve MESMA performance– HFDI, followed by MESMA applied to targeted pixels– Duel hot temperatures?
• Future potential is good– MESMA applied to Savanna fires from MODIS
• Shows temporal trends in fire behavior consistent with changes in emissions (Eckmann, in prep)
– Joint AVIRIS/MASTER data sets• HyspIRI precursor science
• But there are issues– Lack of validation data sets is a serious problem
Questions?
Questions?