Embed Size (px)
Citation preview
Approved For Public Release; Distribution Unlimited
yrw
Prepared for Off ice, Chief of Engineers, U. S. Army Project AT60 , Task 01, Work Unit 001
D D C foTPnp n p JUL 19 1976
TECHNICAL REPORT S-76-4
EFFECT OF BACKFILL COMPACTION ON DESIGN CRITERIA FOR HARDENED FACILITIES: RESULTS OF SOIL-STRUCTURE INTERACTION
CALCULATIONS FOR DRY TYPES I AND II BACKFILL MATERIALS
by
Jon E. Windham
Soils and Pavements Laboratory U. S. Army Engineer Waterways Experiment Station
P. O . Box 631, Vicksburg, Miss. 39180
June 1976
„ ip ipf
Destroy this report when no longer needed. Do not return it to the originator.
Unclassified SECUmTV CLASSIFICATION OF THIS PAGE (Whtn Oat* Bntw««
REPORT DOCUMENTATION PAGE i. HEPORT NUMBER ' ""
Technical- Report S-fS-k /
2. 30VT ACCESSION NO. ORIENT'S CATALOG NUMBER
hr tinii IIIIIIIH?
JTFECT OF^ACKFILLCOMPACTION ON DESIGN CBITERIAj FOR HARDENED ^AGILITIES: ^IJULTET^" ^OlC-
STRUCTURE JNTERAGTION JSALGULATIOIJU rüR^Y JYPES J AND IJ EACKFILTTMTERIALS» "~
PERFORMING ORGANIZATION HMtl SHB XBBRIIP
Soils and Pavements Laboratory U. S. Army Engineer Waterways Experiment Station P. 0. Box 631, Vicksburg, Miss. 39180
II. CONTROLLING OFFICE NAME AND ADDRESS
Office, Chief of Engineers, U. S. Army Washington, D. C. 20311* m
U. MONITORING AGENCY NAME • ADDRESSf/f dllletanl Inm Conlmlllnt Olllc»)
ji^A EWer^-ATCö) i^/^J •
READ INSTRUCTIONS BEFORE COMPLETING FORM
I TPE UF WCPOWT ft PERIOD COVERED 1J*
Final ref£l. QfiJ ft— f**
PERFORMING ORG. REMIII NlHreW— - -
AREA ft WORK UNIT NUMBERS
Project AT60, Task 01, Work Uftit_.001
h. RBPBRT wmm* Jun» 076
n iiMiiftftR ■» P »■■!
92 IS. SECURITY CLASS, (ol thli rmporl)
Unclassified IS«. DECLASSIFICATION/DOWNGRADING
SCHEDULE
IS. DISTRIBUTION STATEMENT (ol Ihlt Rtporl)
Approved for public release; distribution unlimited.
17. DISTRIBUTION STATEMENT (ol Hi« abilracl entered In Block 30, II dlllaronl from Report;
18. SUPPLEMENTARY NOTES
IS. KEY WORDS CConlinuc on reverse «(de II n«e«««ary and Identify by block number)
Backfills Compaction (soils) Constitutive properties Dynamic loads
Finite element method Protective structures Soil-structure interaction Underground structures
20. ABSTRACT (Continue on reveree elde II necaesary and Identify by block number; Lfc-
D* The results of a series of two-dimensionalH-&D)' plane-strain, dynamic finite element, structure-medium interaction code calculations are presented. These calculations were made t^ parametrically investigate^the effect of variations in constitutive properties of the backfill region around a hypo- thetical, shallow-buried protective structure.
Two parameter studies were conducted on this plane-strain idealization (Continued)-
(Ffo W) | JAN 73 1^73 p EDITION OF I NOV 85 IS OBSOLETE Unclassified SECURITY CLASSIFICATION OF THIS PAGE flWien Data Enlarad;
ö^/ßO
Unclassified IKCURITV CUAIIIFICATIOM OF THU Mgjgfcjg Dm$m Bnlmtwl)
-^of a simple buried structure while under a long duraticu local surface air- blast loading^ The first ^study investigated tWdifferences in the dynamic response of the structure under this loading due to changing the surrounding backfill from a dense (or well-compacted) glacial till to the same material in a loose (or poorly compacted) condifcionj The second 'pnyoinetar-study"is identical with the first except that dense and loose clay shale materials were simulated.
20. ABSTRACT (Continued^ A ;'/ ' 5 r; )
The calculations''performecT'indicated that,Jfor the particular idealized problem investigated, the use of loose rather than dease backfill results in 4») increased deflections across backfill sections', (j$) increased loads on, deflections of, and thrusts, shears, and bending moments within the structure, and (fcj increased amplitudes of the shock spectra for points on the inside surface of the structure. ^C.
These results are for the case of a 50-psi overpressure loading caused by a megaton range detonation over a stiff structure. Because of the long positive phase duration, negligible stress attenuation occurs in the loose backfill in spite of its high hysteresis. This would not be the case for very short duration airblast loadings. Hence, the trends observed regarding the effect of backfill compaction on dynamic structural response should not be extrapolated to a vastly different airblast loading condition.
/ i LA
«CESSiOii far
NTIS
DOC
WMBOUMEO JUSTIflMm
mi stttiou la<; Sti'ion 0
D
IY IIKIBWIlOII/MAIlKIUf« OflluS
Oisi. »Vmi. irtlVaf Si .Cm
\A
Unclassified SECuaiTY CLASSIFICATION OF THIS PAGEflWi»n Dmlm Enffd)
/■
THE CONTENTS OF THIS REPORT ARE NOT TO BE
USED FOR ADVERTISING, PUBLICATION, OR
PROMOTIONAL PURPOSES. CITATION OF TRADE
NAMES DOES NOT CONSTITUTE AN OFFICIAL EN-
DORSEMENT OR APPROVAL OF THE USE OF SUCH
COMMERCIAL PRODUCTS.
PREFACE
The work reported herein was performed by personnel of the Soil
Dynamics Division (SDD), Soils and Pavements Laboratory (S&PL), of the
U. S. Army Engineer Waterways Experiment Station (WES) during the period
July 19T3-June 1975. It was sponsored by the Office, Chief of Engi-
neers (OCE), under Project AT60, Task 01, Work Unit 001, "Effect of
Backfill Compaction on Design Criteria for Advanced BMD Facilities."
It supports research requirements outlined in Section XII of the Army
QRR for Nuclear Weapons Effects Information. The OCE Technical Moni-
tor for this work was Mr. D. S. Reynolds (DAEN-MCE-D).
The investigation was conducted by Dr. J. E. Windham under the
direction and with the technical assistance of Dr. P. F. Hadala.
Dr. G. Y. Baladi incorporated the cap model into the DUFE finite ele-
ment code. Dr. H, Radhakrishnan, Special Technical Assistant, Auto-
matic Data Processing Center, WES, assisted in many technical aspects
of the computer work.
The work was conducted under the general direction of Dr. J. G.
Jackson, Jr., Chief, SDD. Messrs. J. P. Sale and R. G. Ahlvin were
Chief and Assistant Chief, S&PL, respectively, and COL G. H. Hilt,
CE, was Director of the WES during the investigation and preparation
of this report; Mr. F. R. Brown was Technical Director.
CONTENTS
PREFACE 2
CONVERSION FACTORS, U. S. CUSTOMARY TO METRIC (Si) UNITS OF MEASUREMENT 1+
PART I: INTRODUCTION 5
Background ..... 5 Purpose and Scope 7
PART II: PLAN OF STUDY 9
Finite Element Representation 9 The Hypothetical Structure 10 Constitutive Relations 11 Surface Loadings 11 Time Increment and Duration 12 Output Data 12 Artificial Viscosity 13
PART III: PRESENTATION AND ANALYSIS OF COMPUTATIONAL RESULTS . . ik
Stress and Displacement Patterns at Selected Times .... 1^ Selected Time Histories 20 Shock Spectra Analyses 25
PART IV: SUMMARY, DESIGN IMPLICATIONS, AND RECOMMENDATIONS ... 27
Generalized Results 27 The Specific Problem Considered 27 Recommendations 29
REFERENCES 31
FIGURES 1-50
TABLES 1-5
APPENDIX A: CAP MODEL FITS FOR BACKFILL MATERIALS Al
FIGURES A1-A8
TABLES Al and A2
APPENDIX B: PROBLEMS ENCOUNTERED WITH LOOSE BACKFILL CALCULATIONS Bl
FIGURES B1-B3
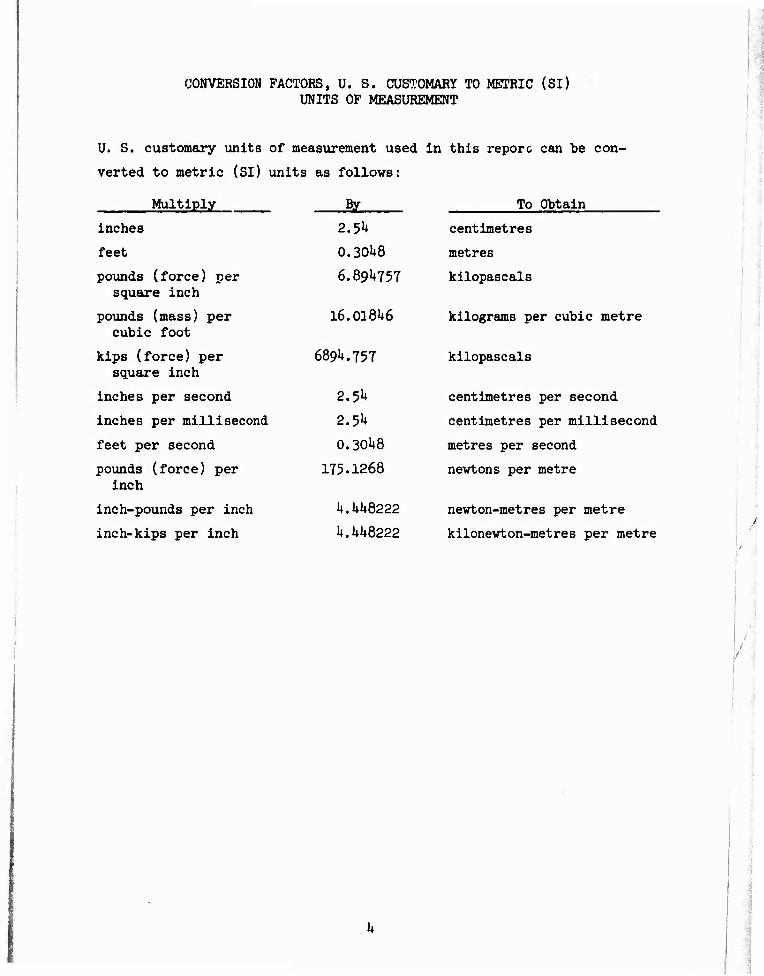
CONVERSION FACTORS, U. S. CUSTOMARY TO METRIC (Si) UNITS OF MEASUREMENT
U. S. customary units of measurement used in this reporc can be con-
verted to metric (SI) units as follows:
Multiply Ry To Obtain
inches 2.3k centimetres
feet 0.30U8 metres
pounds (force) per square inch
6.89^757 kilopascals
pounds (mass) per cubic foot
16.0181+6 kilograms per cubic metre
kips (force) per square inch
689»+. 757 kilopascals
inches per second 2.5!+ centimetres per second
inches per millisecond 2.5U centimetres per millisecond
feet per second 0.301+8 metres per second
pounds (force) per inch
175.1268 newtons per metre
inch-pounds per inch U.UU8222 newton-metres per metre
inch-kips per inch k.hkB222 kilonewton-metres per metre
I -
I
EFFECT OF BACKFILL COMPACTION ON DESIGN CRITERIA FOR
HARDENED FACILITIES; RESULTS OF SOIL-STRUCTURE INTERACTION
CALCULATIONS FOR DRY TYPES I AND II BACKFILL MATERIALS
PART I; INTRODUCTION
Background
1. Large amounts of backfill must be placed around and over
ground-based advanced Ballistic Missile Defense (BMD) facilities for
hardening against nuclear airblast and ground shock environments. Pres-
ent specifications require the highest density practicable in a given
situation to maximize the dynamic constrained modulus of the fill
medium. In addition, select borrow material is often specified for use
as backfill instead of the material excavated at the site. However,
currently proposed modular BMD facilities may have to be Installed
rapidly, perhaps under adverse working conditions. Overly severe back-
fill density specifications would result in considerable loss of time
and unnecessary additional costs; lax standards could result in intol-
erable hardness degradation and system failure.
2. Under Project AT60, Task 01, Work Unit 001,* the Soil Dynamics
Division of the U. S. Army Engineer Waterways Experiment Station (WES)
has conducted a combined experimental and analytical study designated
as "Effect of Backfill Compaction on Design Criteria for Advanced BMD
Facilities." The experimental portion of the stud/, which was completed
in December 1973,** consisted of determining dynamic constitutive prop-
erties for Types I and II backfill materials obtained from the Grand
Forks SAFEGUARD Missile Site Radar (MSR) site. The Type I material
was a gravelly sandy clay till; the Type II material was a fragmented
sandy clay shale. Each material was tested at four different compaction
* Formerly Project A880, Task Oil, Work Unit 001. ** WES(WESSD) letter to HQDA (DAEN-MCE-D) dated 7 December 1973, Sub-
ject: Project AÖ80, Task 11, Work Unit 001, Representative Consti- tutive Properties for Grand ForKs Backfill (Milestone k).
conditions, i.e., loose and dense, dry and wet. The analytical portion
of the study presented herein consisted of performing a series of two-
dimensional (2D), dynamic finite element, structure-medium interaction
(SMI) code calculations to investigate the effect of variations in
constitutive properties of surrounding backfill on the calculated dy-
namic response i~r a hypothetical thick-walled, shallow-buried, rectan-
gular protective structure. The backfill property variations investi-
gated were based on the test data summarized in the report referenced
above.*
3. The first 2D dynamic finite element code calculation parameter
study accomplished under this project has previously been outlined.**
Its objective was to determine the differences in the dynamic response
caused by changing the surrounding backfill from a dense, dry glacial
till (material Type I at 95 percent of CE 55 maximum dry unit weight)
to the same material, but placed in a loose condition (72 percent of
CE 55 maximum dry unit weight) of a plane-strain idealization of a
simple buried structure under local surface airblast loading. This
parameter study was completed and the results were reported in Refer-
ence 1. These calculations were conducted with the DUFE finite element
code using a variable moduli model and a grossly simplified structural
model. Significant improvements were made in the calculation scheme
(including changing the model routine to a cap model and employing an
improved model of the structure) after this initial parameter study.
h. The second parameter study under this project was then con-
ducted. This consisted of a similar parametric calculation program
with the exception that the backfill was varied from a dense, dry,
crushed shale (material Type II at 91 percent CE 55 maximum dry unit
weight) to the same material, but placed in a loose condition (75 per-
cent of CE 55 maximum dry unit weight). Since the improved calculational
scheme produced much more realistic structural response, the loose and
* WES (WESSD) letter to HQDA (DAEN-MCE-D), op. cit., page 5. ** WES (WESSD) letter to HQDA (DAEN-MCE-D) dated 18 Jan 197^, Project
A880, Task 11, Work Unit 001: Setup of First Structure-Medium Interaction Code Parameter Study (milestone 5).
.'
dense till calculations were rerun using the improved constitutive model
and structural idealization. This was the third parameter study.
Purpose and Scope
5. The purpose of this code calculation parameter study is to
determine the effects of changes in backfill constitutive properties on
the dynamic response of an idealized simple buried structure subject to
surface airblast loadings typical of BMD threats. These changes in
backfill constitutive properties are representative of changes in back-
fill compaction quality (i.e., from dense to loose). The objectives
of this report are to (a) outline the plan of analysis performed for
this SMI parameter study, (b) present the constitutive model fits to
the loose and dense Types I and II backfill properties, (c) describe
the five dynamic finite element code calculations performed, (d) present
the calculation results and comparative analyses, and (e) discuss the
analyses and the design implications of these results. The calculations
presented herein include only those conducted using the improved calcu-
."'.ational scheme employing a cap model, i.e., the second and third param-
eter studies. The results of the first parameter study conducted under
this project, as reported in Reference 1, now are known to be subject
to numerical problems and, therefore, are not included.
6. The calculations described herein were conducted with DUFE,
a 2D, nonlinear, small-strain, axisymmetric, dynamic finite element 2 computer code. DUFE is similar to NOFEAR with the exception that the
equations of motion are solved explicitly in DUFE while they are solved
implicitly in NOFEAR. The DUFE code has been used for soil structure-
interaction analyses of underground missile silos as described in
Reference 3. The material model in DUFE was changed from a variable
moduli model, which does not guarantee uniqueness in neutral loading,
to a soil cap model.* This cap model is the same is that being used
* WES (WESSD) letter to U. S. Army SAFEGUARD System Command dated 22 December 1973, Subject: Site Defense Ground Motion Criteria Studies; Supplementary Profile and Property Information for Site 1.
in the most advanced finite difference free-field ground shock calcula-
tion codes. In this new model, mathematical uniqueness and stability-
are unconditionally guaranteed for all possible stress paths.
?
PART II: PLAN OF STUDY
7. Figure 1 illustrates the geometry of the plane-strain problem
investigated and its finite element grid representation. The free-field
medium is postulated as a four-layered soil profile consisting of clayey
sand over clay shale (Material Nos. 1-U). The structure is a hypothet-
ical one and is assumed to be constructed of reinforced concrete (Mate-
rial No. 5) and laterally supported and covered by a bowl of backfill
(Material No. 6), whose constitutive properties are the only calculation
variables. As previously mentioned, in the second parameter study,
loose and dense shale (Type II backfill) properties were used and in
the third, loose and dense till (Type I backfill) properties were used.
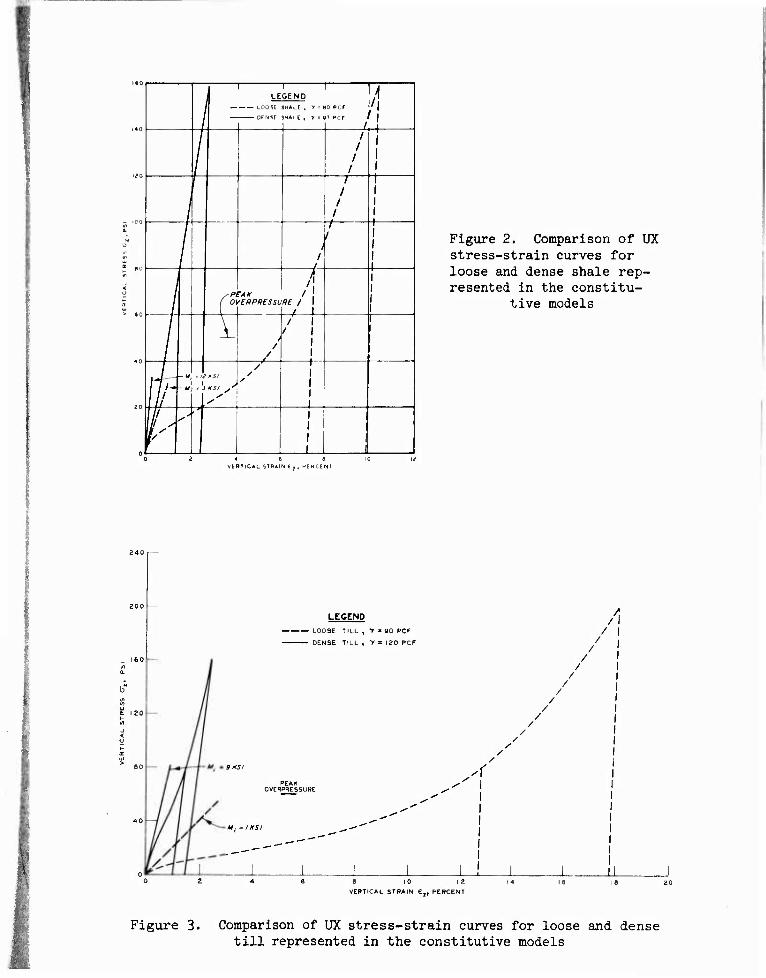
Stress-strain curves for the loose and dense shale backfill and loose
and dense till materials in a state of uniaxial strain (UX) are given
in Figures 2 and 3, respectively. As shown in the figures, the loose
backfill is much less stiff than the dense for both the till and shale.
The dense till backfill is slightly stiffer than the dense shale and
the loose shale is much stiffer than the loose till.
Finite Element Representation
8. The problem illustrated in Figure 1 was solved using different
backfill materials with the DUFE finite element code on the WES GE 635
computer. The finite element grid employed is shown in the figure and
consisted of 588 uniform strain rectangular elements. The elements
located in the structure ranged from 2 by 2-1/2 ft to 2 by 5 ft.* In
the backfill the elements were 2 by 2-1/2 ft, 2-1/2 by 1+ ft, 2-1/2 by
5 ft, and 5 by 5 ft. In the stiffer and deeper earth material, elements
were larger. The largest elements were in the corners of the grid and
were 20 by 20 ft. The grid was chosen as a compromise between (a) the
desire for fine resolution, and (b) the need to keep computer memory
* A table of factors for converting U, S. customary units of measure- ment to metric (Si) units is presented on page k.
and running time (and, hence, cost) requirements within reason for the
particular computer used. On a larger computer, a finer resolution of
the problem would have been economically feasible. The present calcu-
lations were planned to preserve frequencies up to at least 50 Hz in the
dense backfill calculation* ana to have a minimum of at least two ele-
ments across each structural section (in order to get at least a crude
approximation of bending phenomena). Obviously, doubling both of these
criteria would be highly desirable for future studies. Nevertheless,
the criteria used appear to have been adequate for problems involving
qualitative comparisons of the effects of the variable under study.
The Hypothetical Structure
9. The idealized structure is covered by 5 ft of backfill and is
supported on undisturbed shale at a depth of 30 ft; the structure has
outside dimensions of 1+0 by 25 ft. Its roof and floor are 5 ft thick.
Its sidewalls are k ft thick. Each member has two constant strain ele-
ments across the section. The element size in the structure varies from
2 by 2-1/2 ft to 2 by 5 ft. The exterior structure elements are treated
as fully bonded to those of the backfill and underlying shale, as no
slip element capability exists in the DUFE code. The structure is
treated as a linear elastic material with a bulk modulus K of 1330 ksi
and a shear modulus G of 800 ksi.** The structure is assumed to have
a unit weight of 1^5 pcf. The calculated fundamental frequency of the
roof of the structure, if assumed to be a one-way slab with simple sup-
ports, is 12.1+ Hz and 28.5 Hz if full fixity is assumed. The calcula-
tions to be presented show that the actual conditions are closer to
those of simple support.
* In the case of the loose till backfill, the valid frequency response of the grid shown in Figure 1 may be as low as 25 Hz. To obtain bet- ter frequency response, the use of a much finer grid would have been necessary due to the very low loading wave velocities of the backfills.
** These values are somewhat low for typical concretes. The choice was made in order to keep the time step necessary to satisfy the stabil- ity criterion within economically acceptable limits.
10
Constitutive Relations
10. All of the earth materials were represented in the calcula-
tions by nonlinear hysteretic soil cap models.* The constitutive prop-
erties and soil cap model fits for the in situ materials (Material
Nos. 1-1+) are those of the Site Defense Ground Shock Working Group's
idealized site No. 1.* The constitutive properties of the backfill
materials are those for the loose and dense shale and till backfill mate-
rials, which are both assumed to be at a water content dry of optimum.**
These constitutive properties are reproduced with their respective soil
cap model fits in Appendix A. The constitutive model constants for the
loose and dense shale and till cap model fits are also given in Appex-
dix A.
Surface Loading
11. The traveling surface airblast loading function employed in
the calculations is shown in Figure 1. The loading portion is defined
by a linear rise to peak pressure in a constant time of 10 msec; the
decay portion is that for a 1-Mt weapon detonated at a zero height of
burst and at a distance from ground zero which will cause a 50-psi
peak surface overpressure. Appending the artificial 10-msec rise time
to the 1-Mt overpressure pulse increases the impulse at the 50-psi level
by 11.5 percent. Based on criteria developed for ID elastic wave prop-
agation problems, even longer rise times should be employed if the lowest
moduli for the backfill materials are used to calculate the elastic wave
speeds and the finite element grid remains as defined in Figure 1. But
to append a longer rise time to the overpressure function would unreal-
istically distort the airblast impulse. It could be satisfied by in-
creasing the number of finite elements used to zone the problem; but
this would be cost-prohibitive. Thus, 10 msec is a compromise value
which may be artificially increased by the finite element grid after it
* Op. c it., page 7. ** Op. cit., page 5.
11
has propagated a short distance into the backfill media. The airblast
propagation velocity is 2200 ft/sec. The decay of the applied pressure
with time is rather slow and is typical of that for megaton range deto-
nations at this overpressure level. At 300 msec when the calculations
were terminated, the surface airblast is about one-half of the peak
overpressure.
Time Increment and Duration
12. Each calculation ran for a total of 1500 time steps of
0.2 msec each. This step was chosen to satisfy the Courant criteria*
and was controlled by the minimum finite element dimension and P-wave
velocity within the elastic structure. The lowest frequencies that
could be fully transmitted are given by the reciprocal of the calcula-
tion pulse duration, i.e., 1/300 msec or 3.33 Hz. The highest fre-
quencies that were fully transmitted eure given by the reciprocal of the
calculation rise time, i.e., 1/10 msec or 100 Hz. As a practical mat-
ter, however, credible frequencies will probably not exceed one-half
this value or 50 Hz. Since the running time of these 300-msec calcula-
tions on the GE 635 computer was about k-1/2 hr, it was impractical to
extend the calculations for the full positive phase duration or to
rezone the problems much finer to produce better frequency response in
the loose backfill calculations.
Output Data
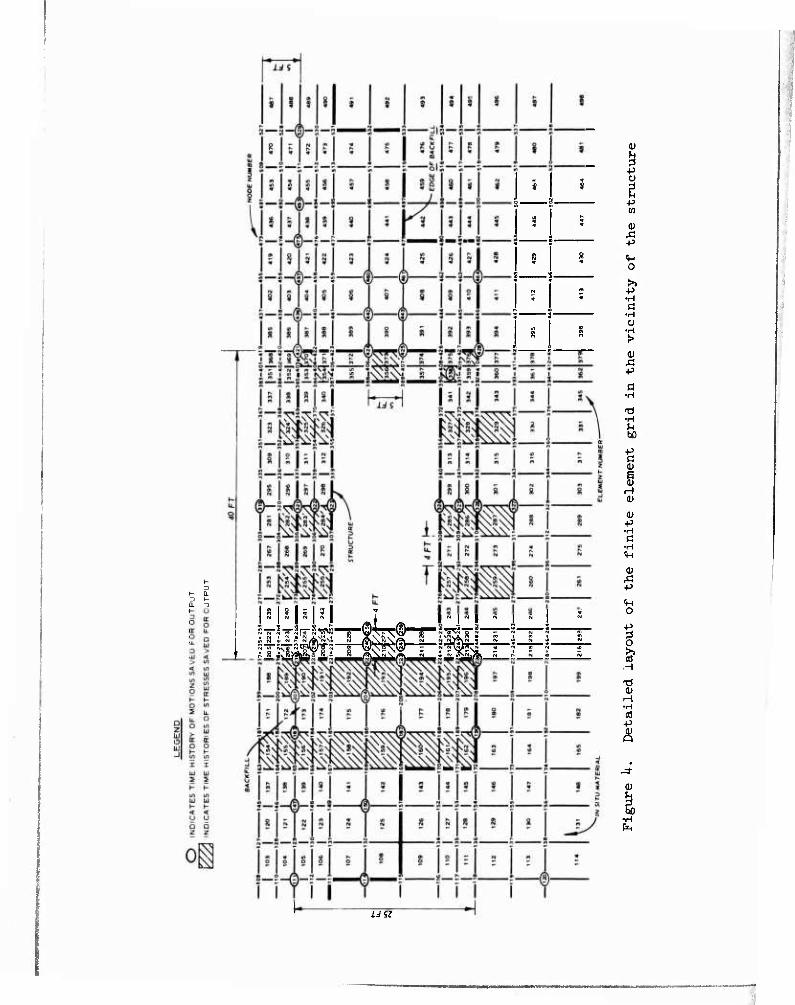
13. Time histories of stress and motion were saved from each cal-
culation at numerous locations in the structure and in the earth media.
These locations are shown in Figure k. This figure also shows some of the
details of the finite e'.ement grid in the vicinity of the idealized struc-
ture. Element and node numbers are identified in the figure. These num-
bers may prove useful to the reader, as the stress and motion time his-
tories presented later in the report are keyed to these numbers.
Ax M »J. nun - 2.0 ft . ,-. 00Q » At < — < 6 ns ~> , < 0.226 msec.
— CP — 8. To ft/msec — max
12
Artificial VlBCOslty
Ik. No problems were encountered in conducting the dense shale
and dense till calculations. However, when the loose shale calculation
was performed, using the same grid spacing used for the dense shale
calculation, large oscillations resulted in stress- and acceleration-
time output. This problem was traced to the exaggerated S-shaped nature
of the UX stress-strain curve (see Figure 2). The possible solution
for overcoming this problem was to reduce the grid spacing or to intro-
duce artificial viscosity. Although the best way to solve the problem
is to reduce the grid size, this alternative was determined to be im-
practical in terms of cost and computer time on the particular computer
employed in this study. Therefore, the artificial viscosity solution
was pursued. A series of ID calculations with loose shale backfill
properties and varying amounts of a linear, velocity dependent artifi-
cial viscosity were conducted. It was found that the material proper-
ties actually used during a calculation with artificial viscosity were
changed. These changes were investigated (see Appendix B) and a final
damping value was chosen for use in a 2D calculation for the loose shale
problem. An undamped loose shale 2D run was also conducted. The re-
sults of loose shale calculations with and without artificial viscosity
are compared in the subsequent analyses plots. These comparisons showed
very little difference in the results of the damped and undamped calcu-
lations except, of course, that the spurious banded oscillations were
reduced in the damped case. Therefore, for the loose till only one
calculation (without artificial viscosity) was conducted.
13
PART III: PRESENTATION AND ANALYSIS OF COMPUTATIONAL RESULTS
Stress and Displacement Patterns at Selected Times
Deflection across backfill sections
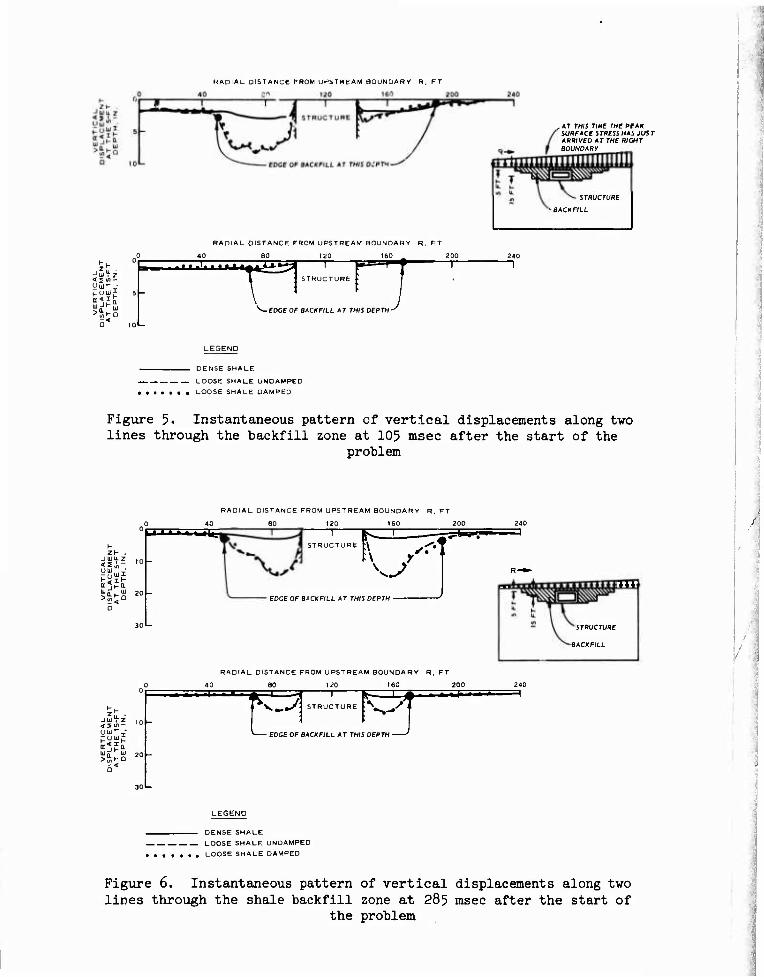
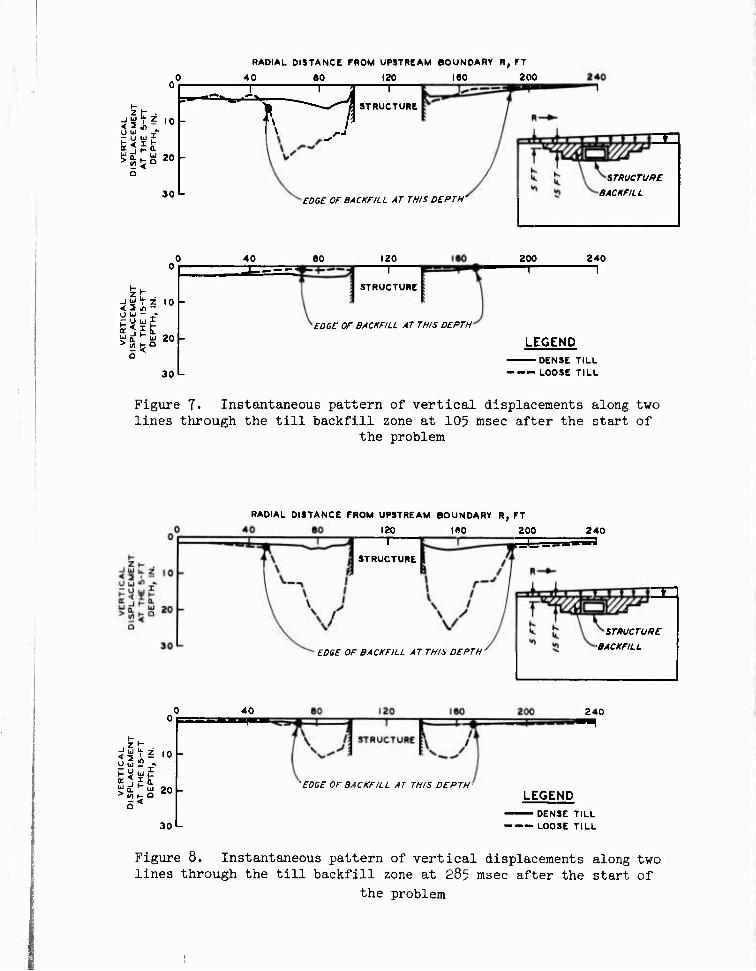
15. Calculated vertical displacement patterns for sections through
the loose and dense backfills at 105 and 205 msec after the start of the
calculations are shown in Figures 5 and 6, respectively, for the shale
backfill and in Figures 7 and 8 for the till backfill. As can be seen
in Figures 5 and 7> the vertical deflections in the loose shale and till
backfill, respectively, at the 5-ft depth are much larger at 105 msec
than those in the dense shale and till, respectively. This appears
reasonable in the light of the stress-strain relations for these ma-
terials. However, the displacements at the 15-ft depth for the dense
backfill cases at this time are larger than those for the loose backfill
because the higher wave velocities of the dense shale and till have al-
lowed the peak stresses to propagate to a greater depth. At 285 msec,
however, when wave propagation no longer plays a major role and the peak
free-field stress has occurred at all depths of interest, the vertical
displacements are everywhere larger in the loose shale and till calcu-
lations than they are in those for the dense materials, as shown in
Figures 6 and 8, respectively. At 285 msec, the vertical displacements
of the loose and dense shale backfill differ by nearly a factor of 5
near the structure, i.e., the maximum deflection for the dense shale
calculation is 3 in. and the maximum deflection for the loose shale
calculation is 15 in. At the same time, the maximum deflection for the
loose till is 25 in. and is greater by a factor of 8 than the 3-in.
deflection calculated for the dense till. The maximum deflections for
the two dense backfills are almost identical, while the deflections for
the loose till are almost a factor of 2 higher than those for the loose
shale. An examination of Figures 2 and 3 indicates that this trend is
reasonable, as shown below:
Ik
Axial Strain Max at 50-psi Deflection
Vertical Stress at 5-ft Depth in UX at 285 msec
Backfill % in.
Dense shale 0.91 3 Dense till 0.89 3 Loose shale 6.10 15 Loose till 9.90 25
16. The interface of the backfill and structure should have been
treated computationally by some type of slip element so that the rela-
tively compressible backfill could deflect vertically with respect to
the concrete structure which is founded on undisturbed clay shale. This
type of element was not available. Since the structure and backfill
were "welded" together, it is inevitable that very little deflection
would occur near the structure walls. Of course, this is not the case
in the real world. However, the backfill vertical deflections did max-
imize at a distance of approximately 15 ft from the structure (see Fig-
ures 5 through 8) for all cases. Deflections close to but perhaps less
than the maximum shown for the backfill (because of wall friction) should
be expected close to the structure. The deflections calculated in the
backfill from the locse till and shale calculations would be considered
very severe for cables or pipes which might be connected to the struc-
ture at some point along the sidewall. Therefore, these figures indi-
cated that the design of cable or pipe connections which permit as much
as 2 ft of relative vertical displacement at the soil-structure inter-
face must be considered if expedient backfill is used.
Stresses on the exterior surfaces of the structure
17. The instantaneous distribution of normal stress on the struc-
ture at 105 and 235 msec is shown in Figures 9 and 10, respectively,
for the shale backfill calculations. The normal stress on the structure
at 115 and 230 msec for the loose and dense till calculations are shown
in Figures 11 and 12, respectively. In actuality, these stresses are
the horizontal stresses in the middle of the soil "cells" adjacent to
the structure. The 105- and 115-nisec times represent the time at which
15
the maximum deflection at the center of the roof of the structure is
realized for the shale and till calculations, respectively. The 230-
and 235-msec times represent times at which the structure undergoes the
maximum clockwise (away from ground zero, GZ) rotation for the loose
till and shale calculations, respectively. The roof loads shown in
these figures are qualitatively similar. Although the loads are some-
what variable with position, they are fairly uniform, except in the
region immediately above the stiff sidewalls where "negative" arching
has caused the loading to be concentrated. The normal stresses on the
blastward sidewall from the dense shale and dense till calculations at
105 (Figure 9) and 115 msec (Figure 11), respectively, are higher than
those for the loose shale and till, respectively; the higher wave ve-
locity of the dense backfill materials has permitted significant stress
amplitude to propagate further down into the backfill.
18. At 230 and 235 msec for the shale and till backfill calcula-
tions, respectively, wave propagation no longer plays a major role in
the loading. The sidewall stresses near the top of the leeward side
of the structure, in the loose backfill calculations, are considerably
larger than those at the same location in the dense backfill calcula-
tions. On the blastward side, the stresses in the loose and dense back-
fill calculations are roughly comparable.
19. The normal load on the base of the structure for the loose
shale calculations at 105 msec, shown in Figure 9» and for the loose
till calculation at 115 msec, shown in Figure 11, is concentrated
under the sidewalls and is a minimum under the center of the structure.
However, the stresses under the blastward sidewall in the cases of
the loose backfill are approximately a factor of 2 higher than are the
comparable stresses for the dense backfill cases. At these times, for
the cases of both the loose and dense backfill, the normal stresses
under the blastward sidewall are higher than those under the leeward
sidewall. This indicates a possible counterclockwise rotation of the
structure. That is probably due to the fact that the loose backfill
cannot offer as much resistance to the rotation as does the dense
backfill. Therefore, the foundation is required to supply a larger
16
restoring moment In the loose till cases.
20. At 235 msec, as shown in Figure 10, the blastvard portion of
the base tends to pull away from the soil, causing a tension cutoff to
occur in the loose shale calculations. This, coupled with the buildup
in stress on the upper part of the leeward sidewall and on the base
under the leeward sidewall, indicates that the structure is tending to
rotate in a clockwise direction at 235 msec. These same trends are
noted at 230 msec in the loose till backfill calculation, as shown in
Figure 12. The data suggest that rotation is occurring to a much
greater extent for the loose backfill cases, and this appears reason-
able, since the loose backfills would offer less resistance to rota-
tion than would the dense backfills.
Deflections of the structure at selected times
21. The deflected shapes of the outside of the structure at 105
and 235 msec after the start of the calculations are shown in Figures 13
and lU, respectively, for the shale backfill.' The deflections of the
structure at 115 and 230 msec for the till backfill calculations are
shown in Figures 15 and 16, respectively. The deflection patterns from
all the calculations are similar. At 105 msec, as shown in Figure 13,
the downward deflections of the center of the roof and the outward de-
flections of the midpoints of the sidewalls are approximately 50 percent
larger in the case of the loose shale than are those for the dense shale.
The deflections of the structure floor are at maximum under the highly
stressed sidewalls and at minimum under the center. At 115 msec, as
shown in Figure 15, the downward deflections of the center of the roof
and the outward deflection of the sidewalls in the case of the loose
till are 50 percent higher than those for the dense till. As shown by
the sidewall deflections in Figures ih and l6 at 235 msec and 230 msec,
respectively, the structure has moved downrange slightly more in the
loose backfill than it did in the dense backfill.
Rotation of the structure
22. The maximum rotations of the chord formed by the two bottom
outside corners of the structure are shown in Table 1, for all
IT
calculations. As shown by the data, the structures undergo similar
initial counterclockwise rotations during all calculations. Later, the
structure, in both loose shale and loose till, undergoes a clockwise
rotation; the structure in the dense shale and till does not. These
rotations appear fully compatible with the structure loadings and do
not appear to threaten the structure's integrity; 0.001 radian, the
maximum rotation depicted during this series of calculations, repre-
sents only 1/2 in. of differential displacement over the length of the
structure.
Thrusts, shear forces, and bend- ing moments within the structure
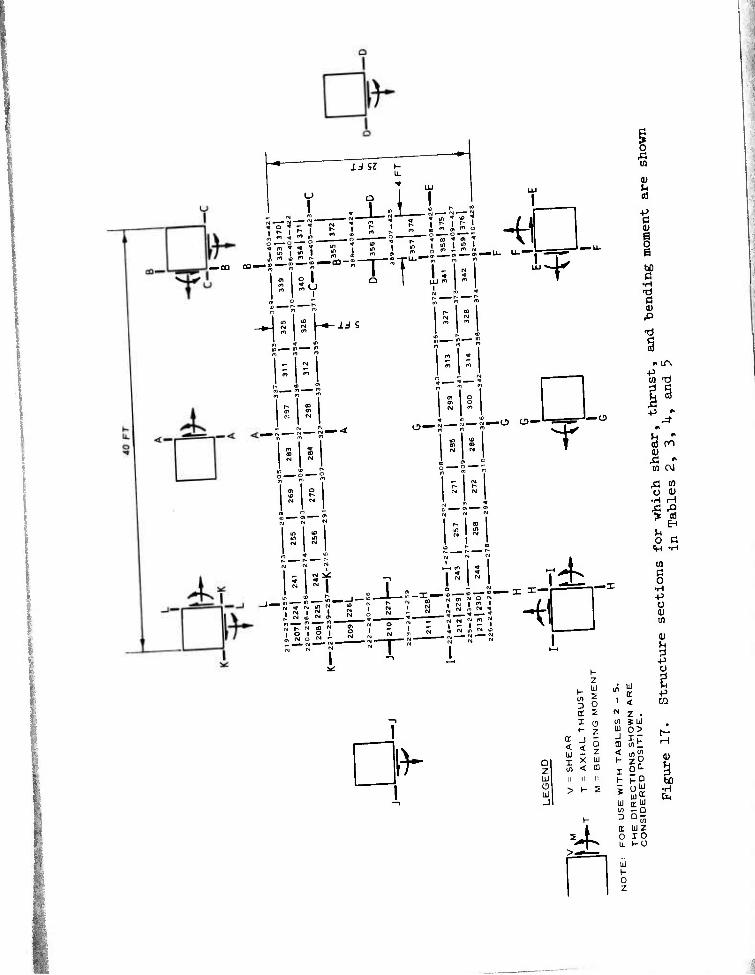
23. Axial thrust, shear force, and bending moment per unit width
of the structure were calculated from the output data for the 12 struc-
ture sections shown in Figure 17. These quantities, at 105 and 210 msec,
are shown in Tables 2 and 3, respectively, for the shale calculations.
Agreement of these values for the loose shale with and without artificial
viscosity was good. As can be seen by examining the tables, the shear
forces, axial thrusts, and bending moments for the loose backfill are
higher at most sections than are those for the dense backfill calcula-
tions. On the average, the shear forces for the loose shale calcula-
tions without artificial viscosity were approximately 2.8 and 3.5 times
the shear forces for the dense shale at 105 and 210 msec, respectively.
The shear forces for the loose till calculation averaged approximately
^.8 and 2.5 times those for the dense till at 105 and 210 msec, respec-
tively. Axial thrust for the undamped loose shale calculations averaged
1.5 times those for the dense shale at both times studied. Axial thrusts
for the loose till calculations averaged 3.5 and 2.0 times those for
the dense till at 10? and 210 msec, respectively. Bending moments for
the loose shale calculations averaged 1.8 and 1.3 times those for the
dense shale at 105 and 210 msec, respectively, and bending moments for
the loose till at 105 and 210 msec, respectively. These tables show
conclusively that the loose backfill tends to significantly increase
the thrust, shear, and bending moments at most sections within the
structure over those which are experienced with dense backfill.
18
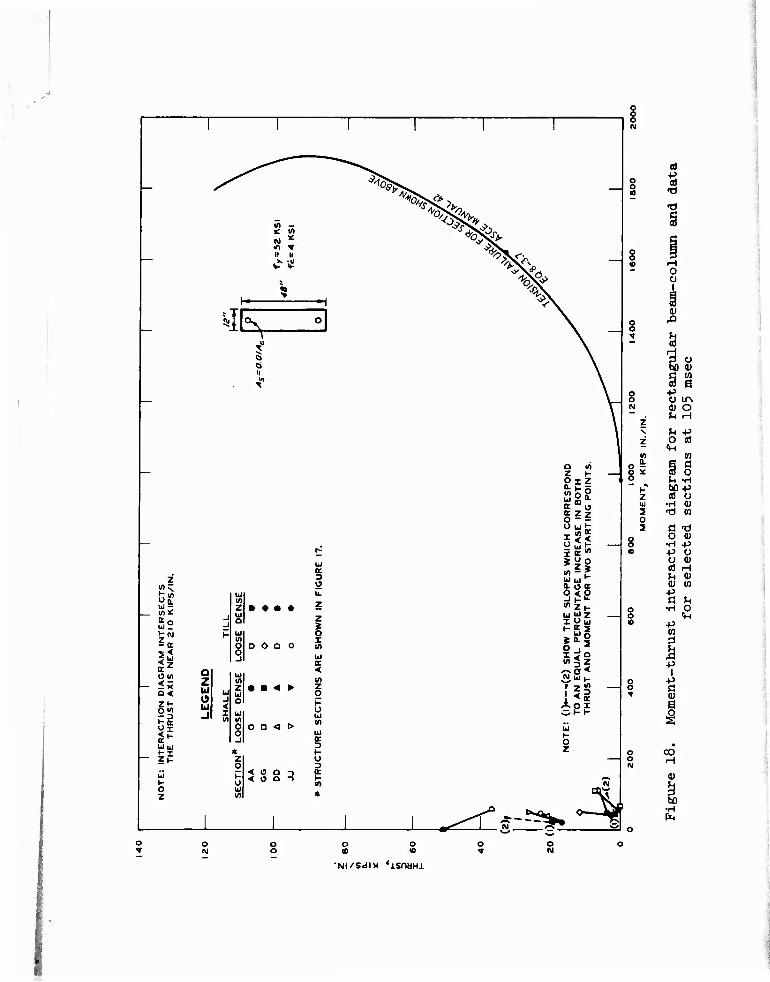
s 24. For the structure examined here (see Figure 17) it can be
shown that even the largest of these shears, thrusts, and moments do
not pose any real threat to structural integrity if one assumes rea-
sonable strength properties for the reinforced concrete* and determines
the available resistance of the sections according to the methods of
Section 8.3 of ASCE Manual 42. Figure 18 shows a thrust-moment inter-
action diagram for yielding a structural section that could be consid-
ered typical of those in the idealized structure. Also shown in the
figure are data from Table 2 which show the thrusts and moments on
sections AA, GG, DD, and JJ for the loose and dense shale calculations.
A change from dense to loose shale backfill caused both the thrust and
moments to increase. The same was true for the till backfill except at
section DD as indicated by the data in Table \ which have also been
plotted in the figure.
25. What do the increases in thrusts, moments, and shears, which
have been shown to occur as backfill quality decreases, mean in terms
of structural integrity, changes in strength design criteria, and re-
sulting costs? For the structure studied here there is no criterial
impact because it is clearly "overdesigned." However, if the structure
were assumed to be fabricated from lower strength materials and/or if
its section thicknesses had been reduced, it appears likely from the
trends in the data shown in Figure 19 that structural integrity would
have been threatened sby a decrease in backfill quality. Poorer quality
backfill material or reduced compaction effort may be considered in an
effort to reduce construction time or cost or as a rapid deployment
concept. This consideration, however, must be balanced against changes
in design loadings which would cause increased safe minimum section
thicknesses or increased strengths of construction materials (steel and
concrete). These design changes will, of course, have their own time
and cost penalties.
For example, 1 percent of intermediate grade reinforcing steel in each face and a 28-day concrete strength of 4000 psi.
19
Selected Time Histories
26. Figures 19-h2 present comparisons of selected stress or
motion time histories from the 2D calculations for the loose and dense
shale and till backfill cases. In each figure, the element and/or node
number locations are sketched. The sigr convention for these figures
is as follows: upward and outward movement and tensile stresses are
considered positive. Wave forms for the loose shale calculations, with
and without artificial viscosity, are shown in these figures along with
wave forms for the single dense shale calculation, which employed no
artificial viscosity. In the figures and in the subsequent text, the
loose shale calculation with artificial viscosity is referred to as
"damped" and that without the artificial viscosity as "undamped."
Generally, there were only small differences between the wave forms
for the two loose shale calculations. However, there were appreciable
differences between the wave forms from the loose backfill and the dense
backfill calculations. These differences will be discussed in the fol-
lowing paragraphs.
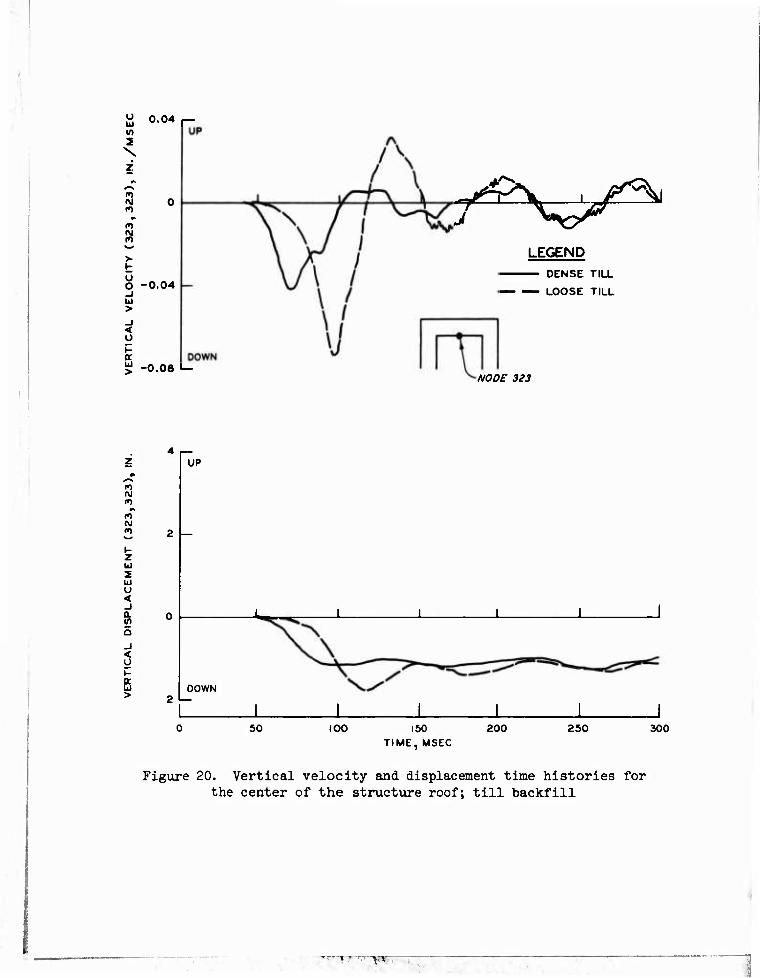
27. Figures 19 and 20 show the vertical velocity and displacement
time histories for the center of the roof span for the shale and till
calculations, respectively. Slightly larger maximum vertical displace-
ments and maximum downward velocities which were approximately a fac-
tor of 2 higher are shown to occur for the loose backfill cases. The
period of the oscillation in the motion at this point which occurs after
the first relative maximum displacement ranged from 67 to 89 msec. This
corresponds to a frequency range of 11 to 15 Hz. As indicated In para-
graph 9, a simply supported one-way slab with the same section as the
roof would have a fundamental frequency of 12.k Hz, while the same slab
with complete end fixity would have a natural frequency of 28.5 Hz. If
the mass of the 5 ft of earth cover is assumed to act with the slab,
each of these calculated numbers would be reduced to 70 to 80 percent
of the values cited above. The observed range of frequencies indicates
that the roof is behaving almost as if it were simply supported. This
is also substantiated by the data for sections BB and LL in Tables 2
20
-«"'Tp-ri-'^rf-
through 5 which Indicate moments that are only a few percent of the
values which would be expected for a fixed-ended slab under a 50-psi
uniform load (i.e., WL /12).
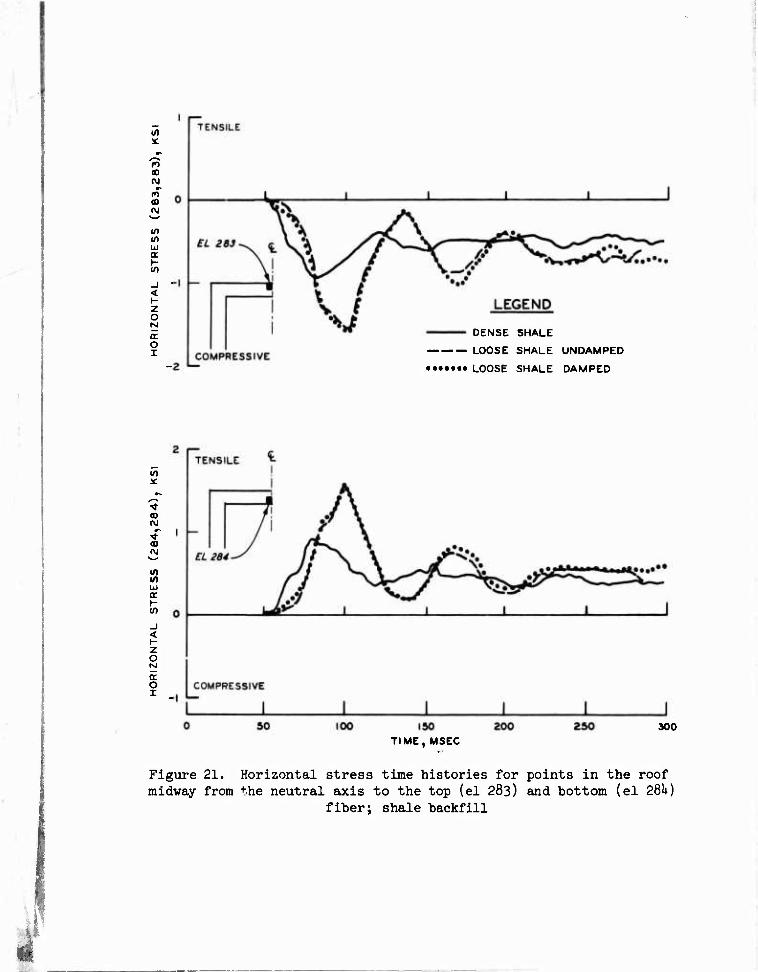
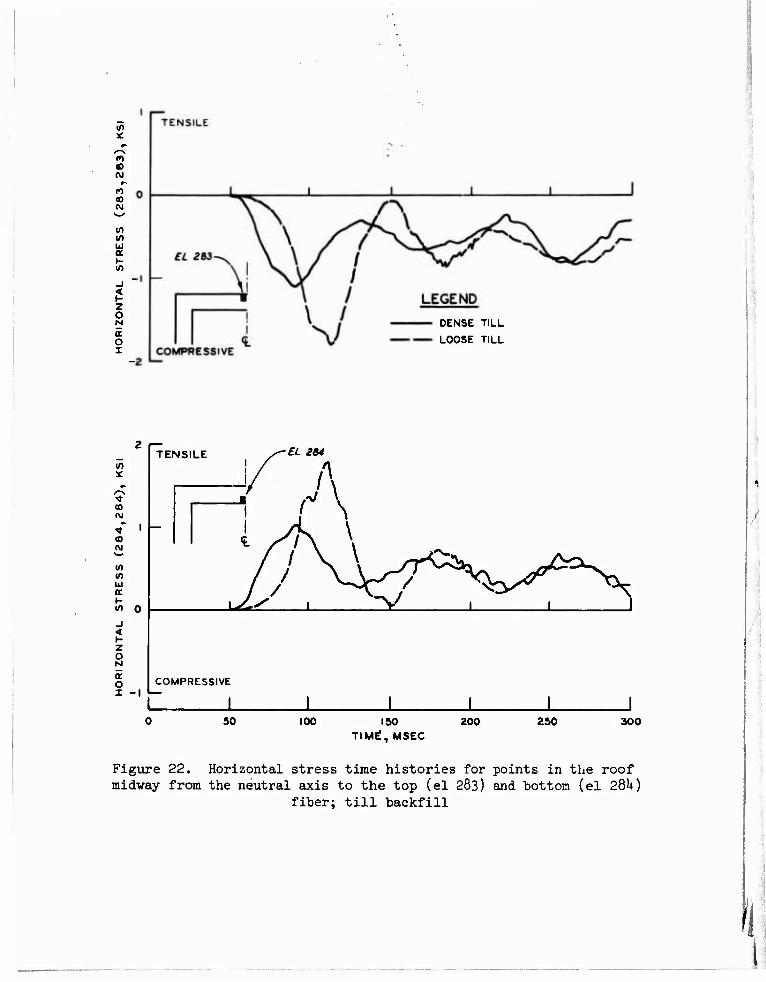
28. Figures 21 and 22 show the horizontal stresses at a point
midway from the neutral axis to the top and bottom fibers of the roof
for the shale and till backfill calculations, respectively. As can be
^een, the peak stresses above and below the axis are of opposite sign
and are notably higher for the loose backfill cases. The stresses
shown in Figures 21 and 22 are reasonable when compared with the de-
flections shown in Figures 15 and 16; the top fiber is in compression
and the bottom in tension.
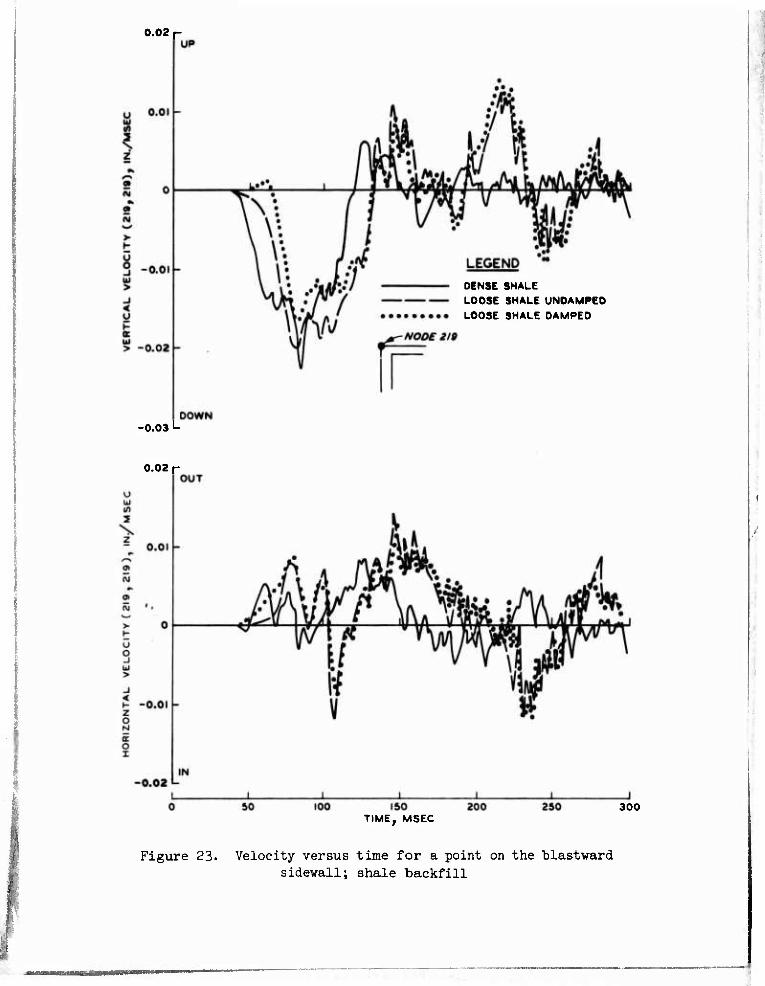
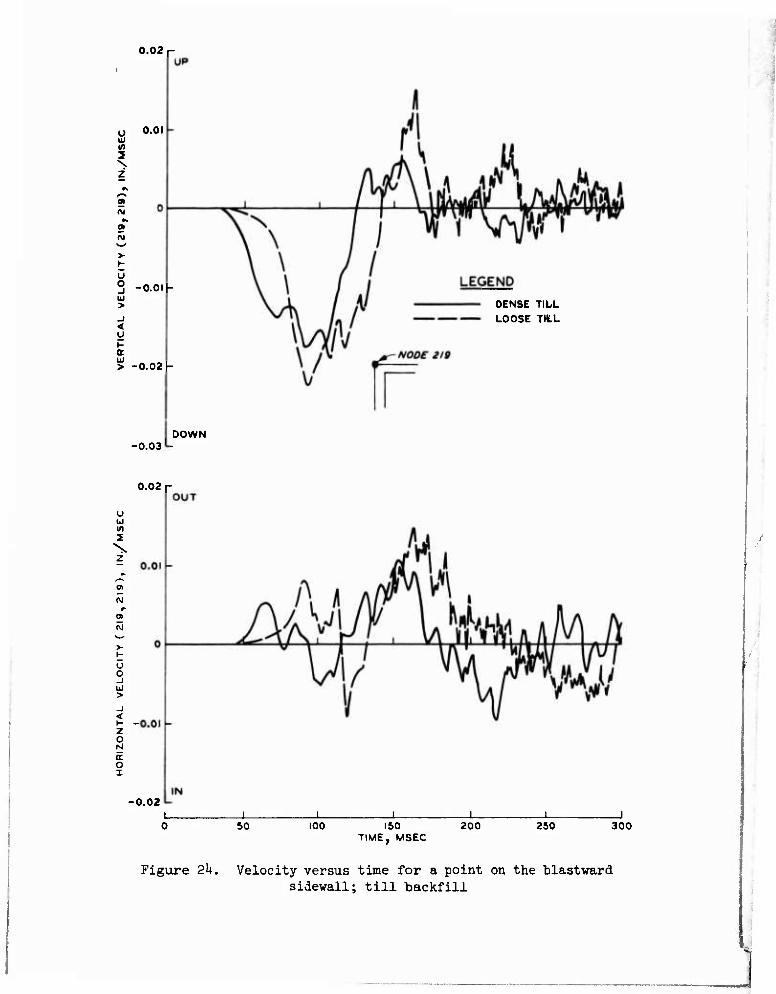
29. Figures 23 and 2k show the vertical and horizontal velocity
time histories for the upper blastward comer of the structure for the
shale and till calculations, respectively. The peak downward velocity
of this point is slightly greater for the dense shale than for the loose
shale and slightly higher for the loose till than for the dense till.
30. Significant upward and outward velocities occur at approxi-
mately l^tO to 150 msec for the loose backfill calculations. These
components are believed to be related to the tendency of the structure
to rotate in a clockwise direction at this time. These calculations
further support the trends in other calculation results presented ear-
lier in this report. The radial velocities for this point (node 219)
are higher for the loose shale and till calculations than for the dense
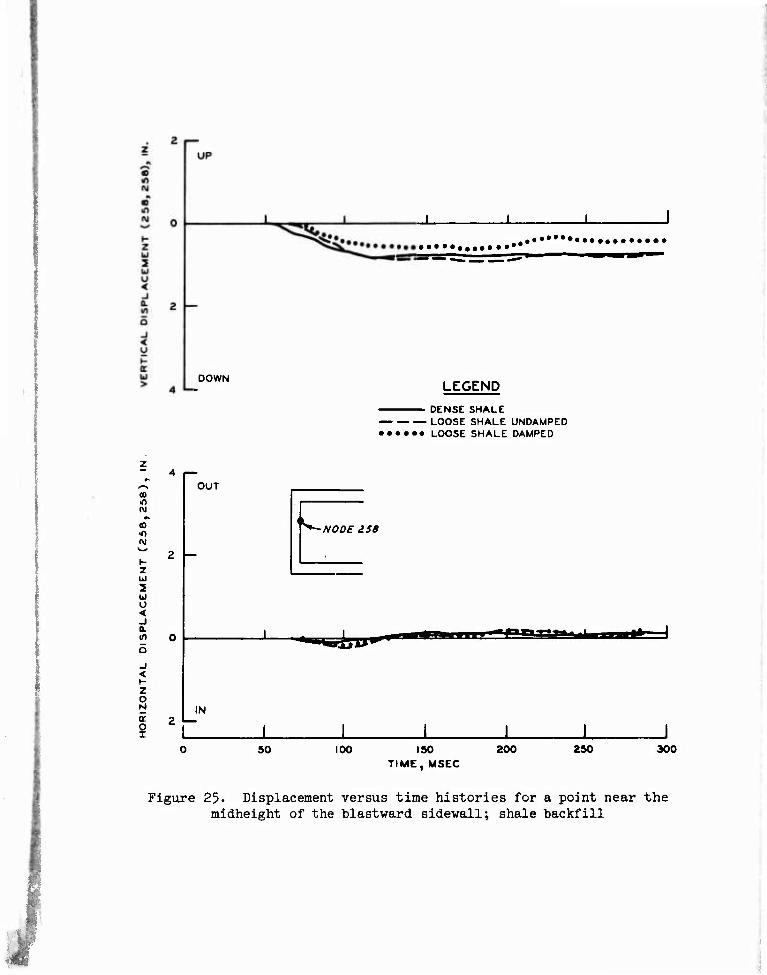
shale and till calculations, respectively. Vertical and radial dis-
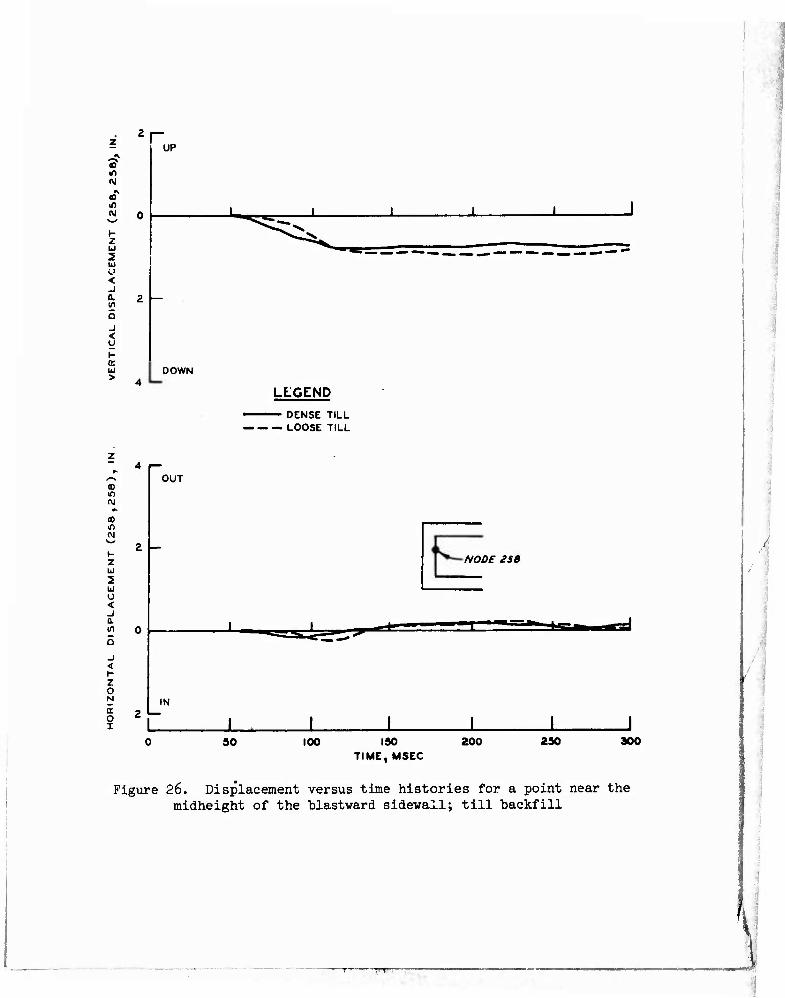
placement time histories for a point (node 258) near the midheight of
the blastward sidewall of the structure are shown in Figures 25 and 26
for the shale and till calculations, respectively. The deflections for
all the backfill cases are very similar. The maximum vertical deflec-
tions are on the order of 1 in. and the radial deflections are less
than 1/2 in. for all backfill cases.
31. Figures 27-30 compare vertical deflection time histories of
points on the blastward face of the structure with those for adjacent
points in the backfill. As can be seen, the maximum vertical deflec-
tions of points on the structure are similar (i.e., range from 0.7 to
21
/ / /
1.1 in.) for all backfill cases. The reason for this is that the ver-
tical deflection of the structure is mainly controlled by the relatively
incompressible clay shale material upon which it rests. The purpose of
these figures is to examine the vertical deflections of the backfill
with respect to the structure as a function of time. While the compari-
sons show that the relative displacements of the loose backfills are
much greater than for the dense backfills, the quantitative values of
deflections for the backfill materials are not believed to be correct.
The points in the backfill were only 10 ft from the structure and the
deflections indicated by these points are influenced by the welding of
the backfill elements to the structural elements at the soil-structure
interface (see discussion in paragraph l6).
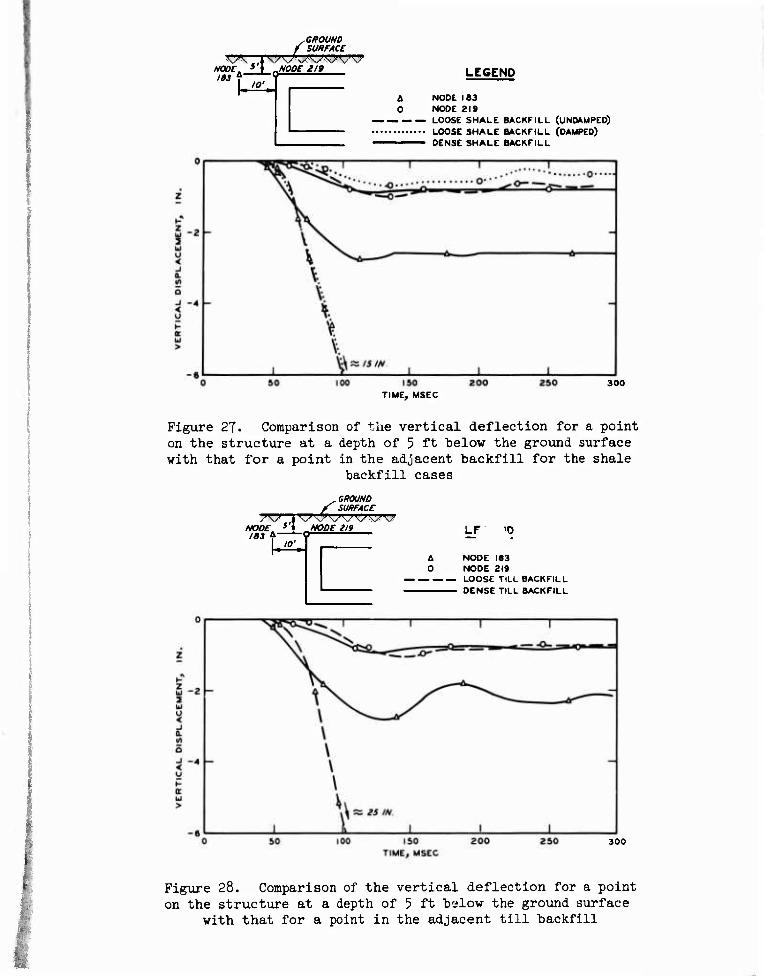
32. Figures 27 and 28 compare the vertical deflection for a point
(node 219) on the blastward sidewall of the structure at a depth of 5 ft
below the ground surface with that for a point (node 183) in the adja-
cent backfill (a distance of 10 ft horizontally from the structure) for
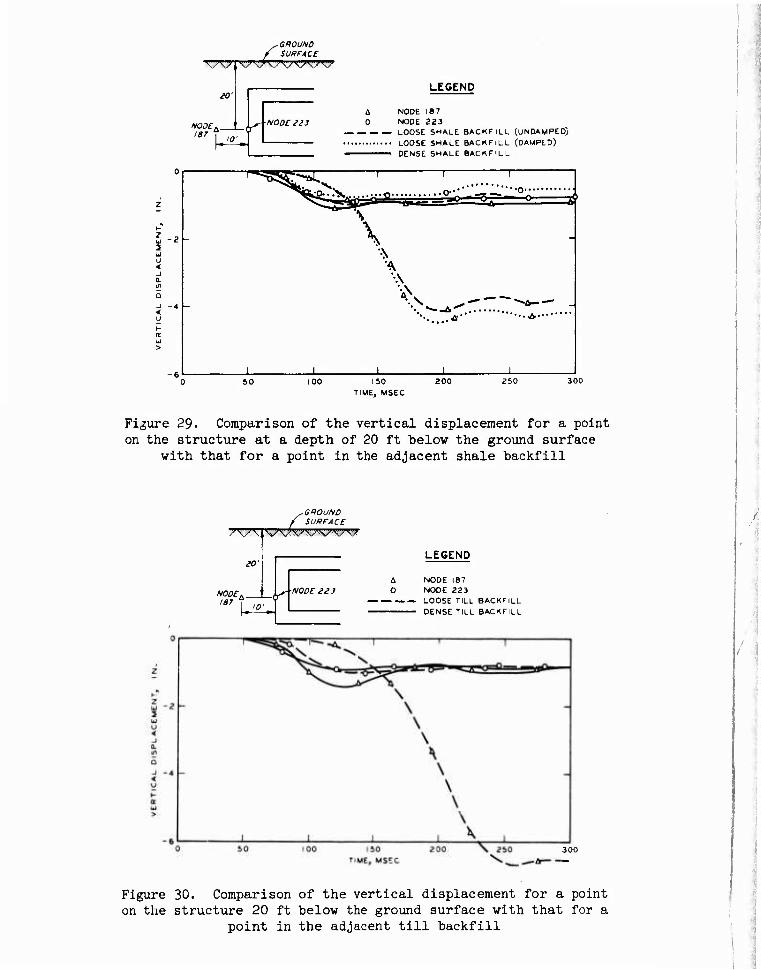
the shale and till backfill cases, respectively. Figures 29 and 30 com-
pare the vertical deflections for a point on the structure at a depth
of 20 ft (node 223) with those for a point in the backfill (node 187)
(10 ft horizontally from the structure) for the shale and till backfill
cases, respectively. As shown in Figures 27-30, the vertical deflec-
• tions of the backfill and structure are downward in all casts until the
maximum deflection is reached and then remain fairly constant. At the
5-ft depth, as shown in Figures 27 and 28, the vertical downward dis-
placement of the backfill for all cases is always greater than is the
downward displacement for the structure. However, for the 20-ft depth,
as shown in Figures 29 and 30, the structure moves down with respect to
the backfill at early times. This phenomenon occurs because at early
times a significant stress has not propagated to a depth of 20 ft
through the backfill materials while significant stress has been applied
to the roof of the structure, which is only 5 ft below the ground sur-
face. (See similar discussion in paragraph 15.) The maximum downward
displacements of the structure relative to the backfill for the 20-ft
depth and the times at which they occur are tabulated below:
22
Mux Downward Displacement Time at of Structure Which Max Relative to Occurs
Backfill Backfill,
0.25
in. msec
Dense shale 72 Loose shale (damped) 0.35 95 Loose shale (undamped) 0.50 100 Loose till 0.70 115 Dense till 0.10 70
As shown in Figures 29 and 30, the downward displacement of the dense
backfill for tht till and shale cases catches up with that for the struc-
ture at a .-- -= of 80 msec, while the loose backfill materials catch up
at a time of 150 to l60 msec. This results because the wave velocities
of the dense backfill materials are greater than those for the loose
backfills. After these times the total downward displacements of the
backfills are always greater than that for the structure. The maximum
downward displacements of the backfill relative to the structure for
the 20-ft depth are tabulated below:
Max Downward Displacement Time at of Backfill Which Max Relative to Occurs
Backfill Structure,
0.25
in. msec
Dense shale 115 Loose shale (damped) 3.9 195 Loose shale (undamped) 3.3 200 Loose till 6.0 260 Dense till 0.5 125
33. The fact that for certain cases the structure has been shown
to deflect downward with respect to the backfill at early times could
be a very significant consideration when designing cable or pipe con-
nections to protective structures. As shown in the first tabulation in
paragraph 32, the relative downward displacement of the st "ucture with
respect to that for the loose shale and till backfill is a factor of
2 to 7 higher than the relative downward displacement of the structure
with respect to that for the dense shale and till backfill, respectively.
The second tabulation in paragraph 32 shows that the relative downward
23
vertical displacements of the backfill with respect to the structure
(for the 20-ft depth) represent a worse environment for designing cable
or pipe connections to a structure. The expedient backfill case pre-
sents the most severe conditions, from a design standpoint, for relative
displacement of the structure-backfill system in either vertical
direction.
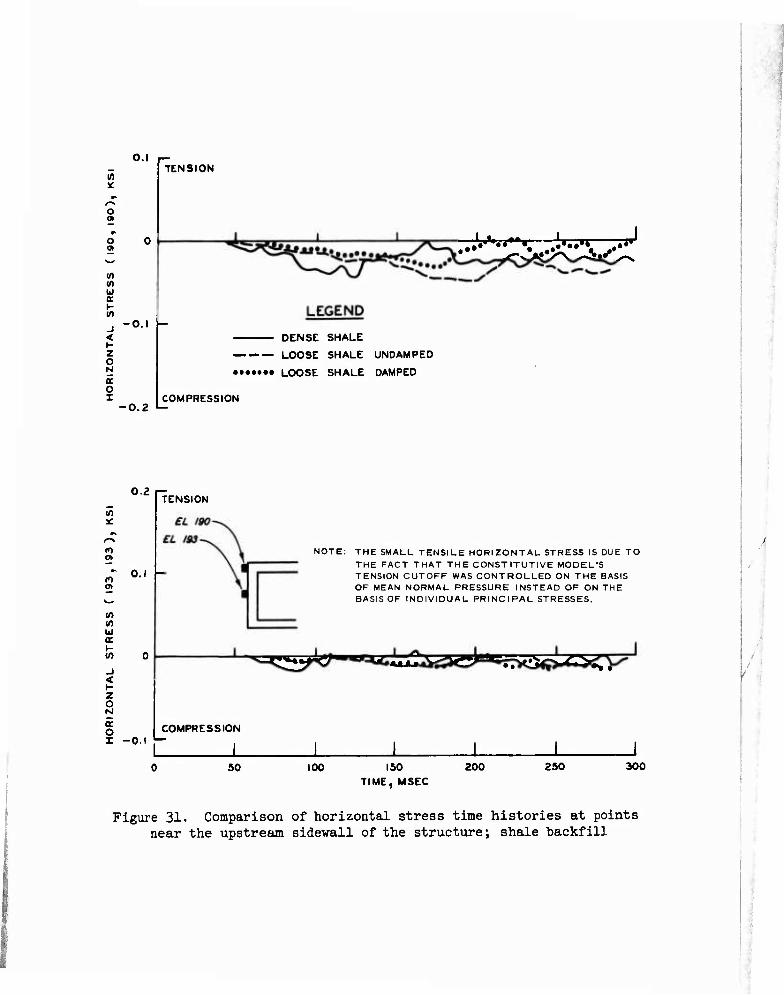
3^. Figures 31 and 32 show the time histories of horizontal
stress at two points on the blastward sidewall* for the shale and till
calculations, respectively. The horizontal stress arrives sooner in
the dense shale and till backfills than in the respective loose lack-
fills due to the higher wave speeds in the dense backfills. Figures 33-
35 present selected stress time histories of stress components in the
blastward sidewall for the shale calculations, and Figures 36-38 pre-
sent stress time histories for the same locations for the till calcula-
tions. In all cases, except for the horizontal stress at element 207,
the loose backfill represents the most severe condition. Figure 35
shows the vertical stress time histories from the shale calculations
in the blastward sidewall at the midheight (elements 210 and 227).
Initially, both elements experience compressive loadings for both the
loose and dense shale cases; however, as the blastward sidewall begins
to bow outward, the stress in element 210 for both cases becomes ten-
sile and element 227 remains in compression. The stress in element 227
is relieved for both loose and dense backfill cases and reaches a mini-
mum at approximately ikO to 150 msec in time. This relief of stress is
greater for the loose backfill case and probably is due to rotation of
the structure in a clockwise direction that is occurring at this time
(see Table 2). This same trend is also depicted in the results for the
till backfill calculations as shown in Figure 38.
35« Examination of the time histories of stress and motion shows
the presence of frequencies of up to 200 Hz in the wave forms for points
in the structure. The calculated cutoff frequency in the structure is
* Actually in the middle of a cell of backfill immediately adjacent to the structure.
2k
at least 300 Hz. However, the cutoff frequency of the backfill is much
lower. It is roughly 25 or 50 Hz depending on whether the backfill is
loose or dense. The rise time of stress on the surface was artificially
lengthened to 10 msec to minimize artificial lengthening of the rise
time due to the frequency transmission limitation of the backfill. In
view of these factors, it appears that, for points within the structure,
frequencies up to 50 Hz should be represented in a fairly faithful man-
ner for the idealized problem calculated and that some creditability can
be given to components as high as 100 Hz. Clearly, because the duration
of the calculation is only 300 msec, frequencies below 6 Hz are also
suspected and those below 3 Hz are, of course, absent. The results
presented appear to be a reasonable approximation of the effect of local
airslap on the structure-backfill system in the frequency range cited.
However, in the actual nuclear blast and shock environment at the 50-psi
overpressure level, considerable low-frequency ground roll, which is
not present in the calculated motion wave forms presented here, should
be expected.
Shock Spectra Analyses
36. The effects of backfill variations on the response of possi-
ble equipment mounting points on the roof, sidewalls, and on the floor
can be considered by examining the shock spectra for the motion wave
forms calculated for these locations. Figures ^3-50 present 2 percent
damped shock spectra calculated for the velocity wave forms in Fig-
ures 19 and 20 and 39-^2. The inside of the roof of the structure
(node 323) has the most severe calculated shock environment of those
points examined. As shown in Figure kk for the shale and in Figure hS
for the till, the loose backfill cases yield the higher shock spectra
for each of the locations examined through almost all of the credible
range of frequencies. The only exception to this statement is shown in
Figure 50 where, for a very limited frequency range, the dense backfill
case produced the more severe environment. The center of the floor of
the structure has the smallest shock environment, as shown in
25
Figures ^5 and h9. This is probably due to the fact that the floor
rests on the undisturbed stiff clay shale and is shielded from the
direct effects of airblast-induced ground shock.
26
PART IV: SUMMARY, DESIGN IMPLICATIONS, AND RECOMMENDATIONS
Generalized Results
37- The results of the calculations for loose and dense shale
and till backfill demonstrate that for megaton range detonations and
overpressures less than 100 psi, loose backfill tends to increase the
load on, the thrusts, shears, and bending moments within, and the de-
flection of the particular, rather stiff, rectangular, shallow-buried
structure considered. This indicates that a trade-off between expedient
backfill and structural loadings should be considered in design of
structures where rapid backfill with limited quality control appears to
be a desirable alternative. The nature of this trade-off may not always
be the one qualitatively illustrated here (namely, that decreased com-
paction results in increased loading) because the phenomena are highly
dependent on (a) the positive phase duration of the airblast, which in-
fluences stress attenuation, and (b) the degree of rigidity of the
structure. For very short duration airblast loadings or for more flex-
ible structures, the trend conceivably could be opposite to that shown.
The main point to be made from tna results of this study is that deci-
sions that influence backfill quality also have a significant effect on
the levels of dynamic load for which a structure should be designed.
For the case shown here, in many instances, a variation in loading of
a factor of two or more resulted from the variation from well compacted
to loose backfill.
The Specific Problem Considered
38. The calculated maximum deflections across the backfill sec-
tion at a depth of 5 ft below the ground surface were approximately
3 in. for the dense till and shale and 15 and 25 in. for the loose shale
and till, respectively. Deflections of 15 to 25 in. would represent very
severe conditions for cable or pipe connections to this structure unless
special connectors were used. Comparisons of displacement time histories
27
of points on the structure at a depth of 20 ft below the ground surface
with adjacent points in the backfill showed that at early times the
structure was moving down with respect to the backfill. The maximum
relative displacements of the structure, with respect to the dense shale
and till backfills, were 0.25 and 0.1 in. at 80 msec and, with respect
to the loose shale and till backfills, were 0.5 and 0.7 in. at 100 msec
and 115 msec, respectively. Relative downward displacements of the
structure of 0.5 and 0.7 in. with respect to the backfill could be an
important consideration in the design of cable and pipe connections to
protective structures.
39. The loads on the structure for the loose backfill calcula-
tions were generally higher than those for the dense backfill calcula-
tions. Stresses under the sidewalls were a factor of 2 higher for loose
backfill conditions at 105 msec. Several sections through the structure
were examined in detail. In these sections, at respective times of
105 and 210 msec for the undamped loose shale calculation, the shear in
the structure averaged 2.8 and 3.5, the axial thrust averaged 1.5 and
1.5, and the bending moment averaged 1.8 and 1.3 times the values for
the dense shale calculations. In the loose till calculations at these
same times, the average shears in the structure were ^.8 and 2.5, the
axial thrusts averaged 3.5 and 2.0, and the bending moment averaged 1.9
and 2.6 times the comparable values from the dense till calculations.
These data show that the shears, thrusts, and moments within the struc-
ture are considerably higher with loose backfill than with the dense
backfill. The expedient backfill cases appear to present the more
severe conditions from a structural design standpoint, although in all
of the cases considered here, the structure was nowhere near structural
failure under the dynamic loading.
k0. The rotation analysis showed that, for dense backfill, the
structure rotated in a counterclockwise direction at early times. As
the airblast passed to the leeward side at a time of 150 msec, the
structure rotated in a clockwise direction to its original position and
remained approximately in this position for the remainder of the calcu-
lation (i.e. 300 msec). For loose backfill, the structure also
28
underwent counterclockwise rotation at early times. However, at late
times the structure rotated in a clockwise position past its original
position. This is reasonable, "because the loose backfills offered less
resistance to rotation. The maximum rotations were small, representing
only l/2-in. relative displacement over the kO-ft width of th" struc-
ture, and presented no threat to the structure. However, this physi-
cally reasonable calculated behavior of the structure adds to the level
of confidence in the calculation results.
hi. Maximum deflections of the center of the roof and sidewalls
were 50 percent higher for the loose backfill cases than for the dense
backfill. Thus, the loose backfill cases presented the worst case as
far as the deflections are concerned.
U2. The results of the shock spectra analyses show that the shock
environments for the roof, sidewalls, and floor of the structure within
the credible frequency range are higher when expedient backfill is used.
The point at the center of the roof presented the highest shock spectra
for both of the loose backfill conditions; the point at the center of
the floor of the structure experienced the least severe shock environment.
Recommendat ions
h3. The capability of the DUFE computer code could be enhanced by
several modifications. The addition of a type of slip element that
could be used at interfaces of materials with greatly varying material
properties, such as structure-backfill interfaces, would improve the
calculation results in the areas of such interfaces. A method for ap-
plying initial gravity loading and correctly treating separations that
occur as a result of tension failures should be added. Finally, a
technique to drive the boundaries with motion time histories taken from
large free-field computer calculations should be added to DUFE so that
"soil-island" problems can be calculated.
kh. The combination of the S-shaped nature of the loose shale
UX stress-strain curves, a fairly coarse grid, and low moduli appears
to be responsible for large oscillations in stress and acceleration time
29
output during the loose shale calculation. As discussed in paragraph 15,
the best way, from a theoretical standpoint, to reduce the oscillations
to within acceptable bounds is to reduce the grid spacing within this
type of material. This was not done for the problems investigated here
because of the increased cost and computer time which would be required.
^5. However, if the code were put on a faster computer and if a
restart capability were added so that the problem could be solved in
segments, these problems could be reduced to the point where finer grid
calculations would be practical for a problem of this size. It is
recommended that these steps be taken. The introduction of artificial
viscosity or damping as was done in one of the calculations for loose
shale is not an entirely satisfactory way of handling this problem be-
cause the introduction of artificial viscosity has been shown ^o change
the properties of the material being modeled. The occurrence, in nature,
of materials with S-shaped UX stress-strain curves is very common and
presents a real problem in dynamic analyses of this type. A study
should be performed in which the grid size is varied within a material
of this type and the effect of varying the grid on the calculated dy-
namic response should be evaluated.
US. Additional parameter studies should be conducted for other
backfill and loading conditions. As discussed in paragraph 2, material
properties were determined for loose and dense Grand Forks shale and
till in wet conditions as well as for the dry conditions investigated
herein. More parameter studies coul^ be conducted for the "wet" case.
Additional studies should be conducted to determine the effect of weapon
yield and overpressure on the response of buried structures. The above-
mentioned parameter studies should also be conducted with the soil-
island technique, using input from large free-field computer calcula-
tions, and compared with calculations using boundary loadings and con-
ditions, as described in this report.
30
REFERENCES
1. Hadala, P. F. and Windham, J. E., "Effect of Backfill Compaction on Design Criteria for Advanced BMD Facilities: Preliminary Results from SMI Calculation Series for Dry Type I Backfill Material," Interim Report, Jun 197^, U. S. Army Engineer Waterways Experiment Station, CE, Vicksburg, Miss.
2. Farhoomand, I. and Wilson, E., "A Nonlinear Finite Element Code for Analyzing the Blast Response of Underground Structures," Contract Report N-70-1, Jan 1970, U. S. Army Engineer Waterways Experiment Station, CE, Vicksburg, Miss; prepared by Structural Engineering Laboratory, University of California, Berkeley, Calif., under Con- tract No. DACA 39-67-0020.
3. Pace, Carl E. and Walker, Robert E., "Investigation of Idealized Silo Motion," Technical Report N-71t-8, Dec 197^, U. S. Army Engi- neer Waterways Experiment Station, CE, Vicksburg, Miss.
k. Anderson, Ferd E., Jr., et al, "Design of Structures to Resist Nuclear Weapons," Manuals of Engineering Practice No. 1+2, 196l, Prepared by the Committee on Structural Dynamics of the Engineering Mechanics Division Through its Manual Subcommittee, Headquarters, American Society of Civil Engineers, New York.
31
W
<v
u cd ft OJ
■p
U O
^H
a ■H nd ctf O
<D O cd
w
s cd
o
-p 0) B o 0)
W) •H
I -
1 "7 LEGEND
LOOSE SHALE , T"
DENSE SHALE, t *
1
r ■
0 PCF
7 PCF i
/ '1
j / / /
1
j 1
1 1
1 1
J
t 1
j -AK 'ERPRCSSb
1
*7 V f / /
/ i / i
llr -f.
1 MS/
s
/ / s
\u A II ' V
SA
ll VERTICAL STRAIN t?, PEMCENI
LEGEND LOOSE TILL , T = 90 PCF
DENSE TILL , Ts 120 PCF
Figure 2. Comparison of UX stress-strain curves for loose and dense shale rep- resented in the constitu-
tive models
VERTICAL STRAIN €,, PERCENT
Figure 3. Comparison of UX stress-strain curves for loose and dense till represented in the constitutive models
i i -: i
• K
3 s ; s- - -;
1 S Si
•o 1 d.- - , j
! * I g
S a c
•p o e -p
0)
o >, p •H c
•H Ü
0) Ä ■p
Ö •H
-d •H
bO
(U
H OJ
(U P •H Ö •ri u 0)
p
o
$ o % H
T) 0) H •H C3
P>
-a- 0)
•rl
iJSZ
RADIAL DISTANCE FROM UPSTREAM BOUNDARY R. FT
40 8« 120 160 200
< 2 in - UUJ- • fUlilf
UJ u
RADIAL DISTANCE FROM UPSTREAM BOUNDARY R, FT
120 160 _ ZOO
-"-' 'mk^*^ r^— r^T— L j STRUCTURE f
^fOGE OF BACKFILL AT THIS DEPTH-^
,AI THIS n/HE THE PEAK SURFACE STRESS HAS JUST ARR/VED AT THE RIGHT BOUNDARy
240 -I
■ STRUCTURE
'BACKFILL
DENSE SHALE
LOOSE SHALE UNDAMPED
LOOSE SHALE DAMPED
Figure 5. Instantaneous pattern of vertical displacements along two lines through the backfill zone at 105 msec after the start of the
problem
RADIAL DISTANCE FROM UPSTREAM BOUNDARY R, FT
40 SO 120 160 200 bill! gggg
h Zh .
<Stn - nLJ T
it<fa
jyt-z
a5Jn. >S;hO
' K—L x^^? STRUCTURE \ ^^V l\ y *
^
EDGE OF BACKFILL AT THIS DEPTH ■
RADIAL DISTANCE FROM UPSTREAM BOUNDARY R, FT
40 80 120 ISO 200
^ - n -I - - ' - Jl I -II ~ I ft- ' M ' ' ""^ T V#„«^' STRUCTURE [^^^^^ 4
* EDGE OF BACKFILL AT THIS DEPTH '
na
STRUCTURE
BACKFILL
LEGEND
DENSE SHALE
LOOSE SHALE UNDAMPED
LOOSE SHALE DAMPED
Figure 6. Instantaneous pattern of vertical displacements along two lines through the shale backfill zone at 285 msec after the start of
the problem
RADIAL DISTANCE FROM UPSTREAM BOUNDARY R, FT
40 BO 120 ISO 200
< 2 .n
mi 30 -
STRUCTURE
^
EDGE OF BACKFILL AT THIS DEPTH'
STRUCTURE:
BACKFILL
0 40 " J 1
VE
RT
ICA
L
DIS
PL
AC
EM
EN
T
AT
TH
E 15-F
T
DE
PT
H,
IN.
o
o
o
-
ao 120
STRUCTURE
EDGE OF BACKFILL AT THIS DEPTH
200 240
LEGEND DENSE TILL ■— LOOSE TILL
Figure 7- Instantaneous pattern of vertical displacements along two lines through the till backfill zone at 105 msec after the start of
the problem
RADIAL DISTANCE FROM UPSTREAM BOUNDARY R, FT
120 —r-
160 200 240 l_\ j^ssa
STRUCTURE
EDGE OF BACKFILL AT THIS DEPTH'
STRUCTURE
BACKFILL
0 0P=
i^i io
l j J 0. £ ö! H u 20 ■• Crt K Q
30 >-
40
"EDGE OFBACKFILL AT THIS DEPTH
240
LEGEND ——DENSE TILL •— LOOSE TILL
Figure 8. Instantaneous pattern of vertical displacements along two lines through the till backfill zone at 285 msec after the start of
the problem
fi r »n
"■•. 8 i* 2 u IT a a o, OH _ >^
5^w ff cr a
^ Oh 'SS3tJiS IVWUOH 7 Oi o -': \ O 7 in nvWMON
O o o x'- ^ o o o o c rfl o in Hi o n O "1
o ^S^ '~''**l~l O N ftj
1 "-S
>
\ v \ \ 1 1— X .
JJ i»'^^'
■v.
T "I
T\V V \ \ > \ X^ \ : \
1 vx S v> \
fl • •I I ^ ^
/ -.1
1-.. Q Z
u u UJ
Hi Y^ V N •/•v*
/ :•
Ö II1
öl in w r>' \Q.N \ \ N :,' I' UJ UJ UJ u
i/) (0 1/) •i / \0N . v ^ 'A; u O O :l / >N \ " ■ S' '|.': Q -J -1
1 > :
l • 1 i : I , \
\ \ f 3-' ^ \x^5 V \>o AWWW
, ^ 1 \\\\\\\\\\\\N 1^1 1 I 1
D O o o »n
^•T. Jii*"" "%r o o in
o c o .n
o o n o <•' •-»•• o to - — ^ — - f\J N
I Sd -J .^ 0 0 -l,n" ISd 'sS3äiS «a." " «S- 'ssims "IVl^HON 5u in
o: ir a 5 UJ w an a TWl«lbON
°- § _ 8is
o in
. s
Crt (U
E^ 0 ■p Ü a Ü (U
3 w (H & s ü p>
c o n 0) H
•H Ä -p ■P -P 3 ai P Vi •H O H ^ H +J W -H W V <M •H ü M -0 cd o
Vi id tn h P ^ 3 0 w ai a) H
s ^ cd O Ä
■p ■r\ CO
<1> !>> ■p ■P rQ ca M a (U -d H ö-S
• o§ CT\ to o
ISd OES 01 0) U ■ISd 09» 01 (U
a) w •H ■P UK to
^
a
5 8 U ü +J 0}
•H U
Ü 0) tn e o m
tn
ISd 9 0ZS 01
1 ■P to OJ Ö Ä H -P
ß • O
CM
H •H
0)
q I . . ta
<D Ul U tn p v w u
•H +J [in W
^
O
a o •H tH ■P O
fi tn •H 0) u y p m W tH
to tn ? o D
O •H u
p p a D p m tu a A H P
•H P
0)
•H
II 1 i ♦ I
m :■:■ * ■:■■:*
«
Z o
-'S! UJ O
•O-i
*~ Q| z f)^ UJ <M- O
UJ — -| -Jl O-'
Q bJ Q. O
\t 6,1 z < DO
m uj uj
ill (A««« UJ bJ UJ
zoo uj O O O -I -I
2 0 hUJ UJ UJ< JU IL«) UJ Q
o z 111 CD UJ -I
§.W
%
fr. d
g o •H ■P CJ (Ü 4J H «fl <H V 10 T) O
O <H cd 0 <H
ß^H h W H 0) -H
■P h Vi Q +J o ^i UJ Q-
<
(fl -H Ü Q UJ Q-
ft ^ td
in 4J ^ >< 0)
G 5 O (U H Z < 0) d D D ö to Ä
UJ UJ UJ -P 0) J J < <
J < SO«
I I I ■P -P 0) V) (« (/) in o to
Ui LU UJ 5gS W U) m -p tA z o 0 in o UJ o O H D J J
Figure 13
along the
1 li
1
1 ill
1 ■:^: 1
1 L i i^^nr iiHi^l
Z . "O-i
z o ^- Q pw Z «n- Ul
<\j- O ^<n ÜÜ kJ — — -1 O
o-
c 0
•H ■p o <U p H ctf fH 01 (0
-Ö (Ü
^s 0 ^H H
_i -i _i -i g§S K 1-
+J 0 Uj Ul lii 0) -H P (/) W P« h Z O 0) H JJ o M +J H Q _1 0 X -H
1 i O flj -P IU
1 ö CO •" a - o 1 1 ■P IU V
s^g ■p -p moo ß p> m H h CM
■p 09
MD (U H Ä
P 0)
b0 O
s 'ä
■W—WBWIWWI
jjijlMilililllfl^^^:^.^[^^^ al ■*
Z
. <o-i z o *-| Q
pu Z ^^ l»J-i UJ
1<J (VI- O u.«« ^ Ul o
— "1 -i| o-*
-I -I _l -» H P UJ UJ (0 «0 z o UJ O O -I
§ •H -p o (U H tM 4) -O
<H o a u v p p <ä a
o «j §01 .»
- o p 0) 01
p p
a 3 H H (H H
P m
H
•H
01 Ä P
U) a o
__CD CD—",
" iS a 1J s
O—S s_j;—o o—
T l—O
3T :—5 — » —-—x x •^
^D
3^
i 6
•H
I
aj on (U Ä » tn CM
n w o <ü
go W
g •H ■P Ü 4) cn
(U
o
-p m
> i- s
« z •
ui o>
i 2°- i- Po
4- u K UJ ifl -Q
0 I o Ü. 1-0
Ui h o z
c— H
I •H
1 T
—
1 1 1
V) It in
m f
s
II li
\
*
^ o
^ i \ o \ Ö \ II V (a \
T
O iö
\
Ü ujfc
bl IT
iss z 3 i—
UJ UJ «"N
O Ä^K o^ VI
U.
^S Ä5 Z ■ # • • z «"ZH
u _ -1 g z u U 7
t- o: s —
►-M P •ti Q ^ ^o Z i/l I $0-5 -tt
It § D 0 Q o VI
UJ a: V)<z
1 C
TIO
N
DIA
GR
H
RU
ST A
XIS
1
Q z UJ in
< V) v1^
UJ
UJ -1
u _l < I
z UJ o UJ
• ■
O □ O >
z o 1- o Ul
» zS 1 <S Aoi o»-i-
Ü
t T
O -1
« UJ IT
1- 5 z
— ZJ: z O — o
< o o -) | u 1-
1- < 0 Q -> 1- VI M o UJ c a^«
z ifl * ^.i
1 L 1 1 ^^ -"%.*- V
I- z u 2 o 2
o o § O a
o 10
o o <\j
■Ni/Sdi* 'isnaHi

o Ul w 2
0.0*
a
UJ >
i
§
-0.04
-0.08
_ DENSE SHALE
_ LOOSE SHALE UNDAMPED
LOOSE SHALE DAMPED
NODE 323
(0
(M
Ul 2 ul
-I Q.
«2 o
300 150
TIME, MSEC
—'u. :Ä-r sÄ"r,-=.'är'"'"
•
UJ <n 2 N
0.04 ,_
n
>- ü O -0.04
5 p DC UJ > -0.08 I—
N O
\- z UJ 5 UJ u < -I
8s
< o t- a. UJ >
UP
DOWN 2 I—
7^\_^ LEGEND
— DENSE TILL
LOOSE TILL
NODE 323
50 IO0 150 TIME, MSEC
200 250 300
Figure 20. Vertical velocity and displacement time histories for the center of the structure roof; till backfill
—TT'-^-WT
in
<c N
oo ^.^
</) UJ
z o si a. O I
DENSE SHALE
LOOSE SHALE UNDAMPED
• • LOOSE SHALE DAMPED
00
^- 00 (M
in
a. t- in
z o N cc o I
300 TIME, MSEC
Figure 21. Horizontal stress time histories for points in the roof midway from the neutral axis to the top (el 283) and bottom (el Zftk)
fiber; shale backfill
«0
(VJ
in V) LJ
z o
o I
DENSE TILL
LOOSE TILL
2 i—
in
oo ry
"»" oo
I —
m UJ a t- m o _i < z o £ a i -i
TENSILE
^ A
<^
—
v ,v V
L / / ^A v^>
COMPRESSIVE
1 1 1 1 1 1 50 100 ISO
TIM£, MSEC 200 250 300
Figure 22. Horizontal stress time histories for points in the roof midway from the neutral axis to the top (el 283) and bottom (el 281+)
fiber; till backfill
0.02 r-
DENSE SHALE LOOSE SHALE UNDAMPED LOOSE SHALE DAMPED
-0.03 >-
0.02 r
300 TIME, MSEC
Figure 23. Velocity versus time for a point on the blastward sidewall; shale backfill
0.02 r
0
z
01
(V( •>. n (M
> h Ü O _l UJ > -l < o I- a UJ >
0.01
-0.03
-0.01 -
-0.02 -
DENSE TILL LOOSE THLL
DOWN
0.02 r
u u in 2
z
oi
O)
h o o -i Ld >
2 O N
X
-0.02
50 100 ISO TIME, MSEC
200 250 300
Figure 2k. Velocity versus time for a point on the blastward sidewall; till backfill
DOWN LEGEND
DENSE SHALE LOOSE SHALE UNDAMPED LOOSE SHALE DAMPED
00 t> N
(0 ■O N ^-■
(- Z Ul 3 ui U < -I Q. m
_i < r o N tr. O I
OUT
NODE tsa
IN
50 100 ISO TIME, MSEC
200 250 300
Figure 25. Displacement versus time histories for a point near the midheight of the blastward sidewall; shale backfill
(0
in
I- z u 2 UJ U < -I Q. IA
5 J 5 H K HI >
00 <n
(0
2 UJ
5 UJ o < Q. in
< h z o E o i
UP
N 0
DOWN 4 *—
LtGEND
— DENSE TILL — LOOSE TILL
OUT
HOD£ 258
IN
50 100 150
TIME, MSEC
200 250 300
Figure 26. Displacement versus time histories for a point near the midheight of the hlastward sidewall; till backfill
~n—
NODE. 5 ] IBi
10'.
GROUND SURFACE
.NODE 219 LEGEND
A NODt I S3 0 NODE 219
— — — — LOOSE SHALE BACKFILL (UNDAMPED) LOOSE SHALE BACKFILL (DAMPED) ——— DENSE SHALE BACKFILL
ISO TIME, MSEC
300
Figure 27. Comparison of the vertical deflection for a point on the structure at a depth of 5 ft below the ground surface with that for a point in the adjacent backfill for the shale
backfill cases
7^7-1 NODE. *_% IBS A
10'
,GROUND / SURFACE
V x'' V V \X \X V _NODE_m__ LF '0
o NODE 183 NODE 219 LOOSE TILL BACKFILL DENSE TILL BACKFILL
300
Figure 28. Comparison of the vertical deflection for a point on the structure at a depth of 5 ft below the ground surface
with that for a point in the adjacent till backfill
WWTW
to'
HODC.
GROUND SUPrACE
M-^ (r NODE 223
LEGEND
NODE 187 NODE 223 LOOSE SHALE BACKFILL (UNDAMPED) LOOSE SHALE BACKFILL (DAMPED) DENSE SHALE BACKFILL
1 r*~^-lsC"**'':^- 1 i j ^^^v. .......p ., ■ ■ • o^"'. ■ -g~-. ••o \
^^ \
zV- \ •N A
•X
1 1 1
..i
.1
■•■■&
1 50 ISO
TIME, MSEC 200 250
Figure 29» Comparison of the vertical displacement for a point on the structure at a depth of 20 ft below the ground surface
with that for a point in the adjacent shale backfill
^COUND f SURFACE
^\ W\2W'-W*v/>W'W
ao1
—1 NODE^ 187 1 ,0
<- NODE 223
1—-
LEGEND
b. NODE 187 O NODE 223
— — LOOSE TILL BACKFILL DENSE TILL BACKFILL
3 00
Figure 30. Comparison of the vertical displacement for a point on the structure 20 ft below the ground surface with that for a
point in the adjacent till backfill
O.I
in it
o 01
o 0)
in Ui a. i- m
< z s a o i
-0.1
-0.2 >—
TENSION
DENSE SHALE
— — —> LOOSE SHALE UNDAMPED
LOOSE SHALE DAMPED
COMPRESSION
0.2
(0
Ol
«n u a
4 K Z O
o I
0.1
-0.1
TENSION
NOTE: THE SMALL TENSILE HORIZONTAL STRESS IS DUE TO THE FACT THAT THE CONSTITUTIVE MODEL'S TENSION CUTOFF WAS CONTROLLED ON THE BASIS OF MEAN NORMAL PRESSURE INSTEAD OF ON THE BASIS OF INDIVIDUAL PRINCIPAL STRESSES.
v-^uy^f—nae
COMPRESSION
50 100 150 TIME, MSEC
200 250 300
Figure 31. Comparison of horizontal stress time histories at points near the upstream sidewall of the structure; shale backfill
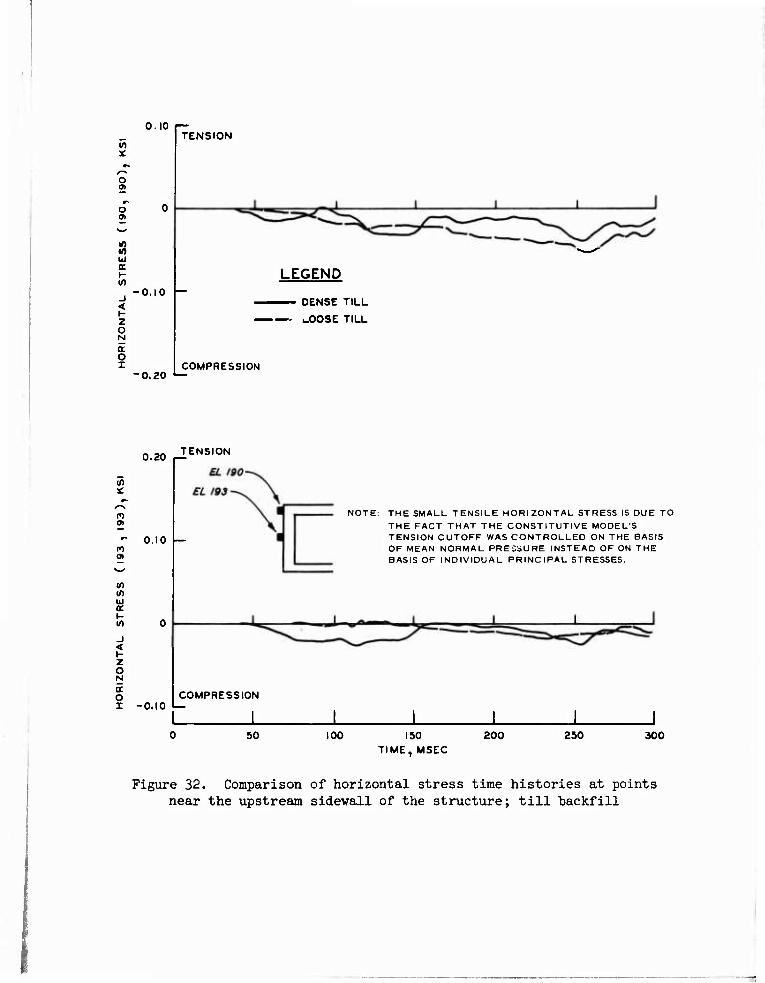
0.10
V)
o <J>
o
I-
< H Z O N o: O I
-0.10
■0,20 '—
TENSION
LEGEND
— DENSE TILL
U.00SE TILL
COMPRESSION
0.20 TENSION
I-
_i
? z O N a. o i
0.10
NOTE: THE SMALL TENSILE HORIZONTAL STRESS IS DUE TO THE FACT THAT THE CONSTITUTIVE MODEL'S TENSION CUTOFF WAS CONTROLLED ON THE BASIS OF MEAN NORMAL PRESSURE INSTEAD OF ON THE BASIS OF INDIVIDUAL PRINCIPAL STRESSES.
COMPRESSION -0.10 I—
50 100 ISO TIME, MSEC
200 250 300
Figure 32. Comparison of horizontal stress time histories at points near the upstream sidewall of the structure; till backfill
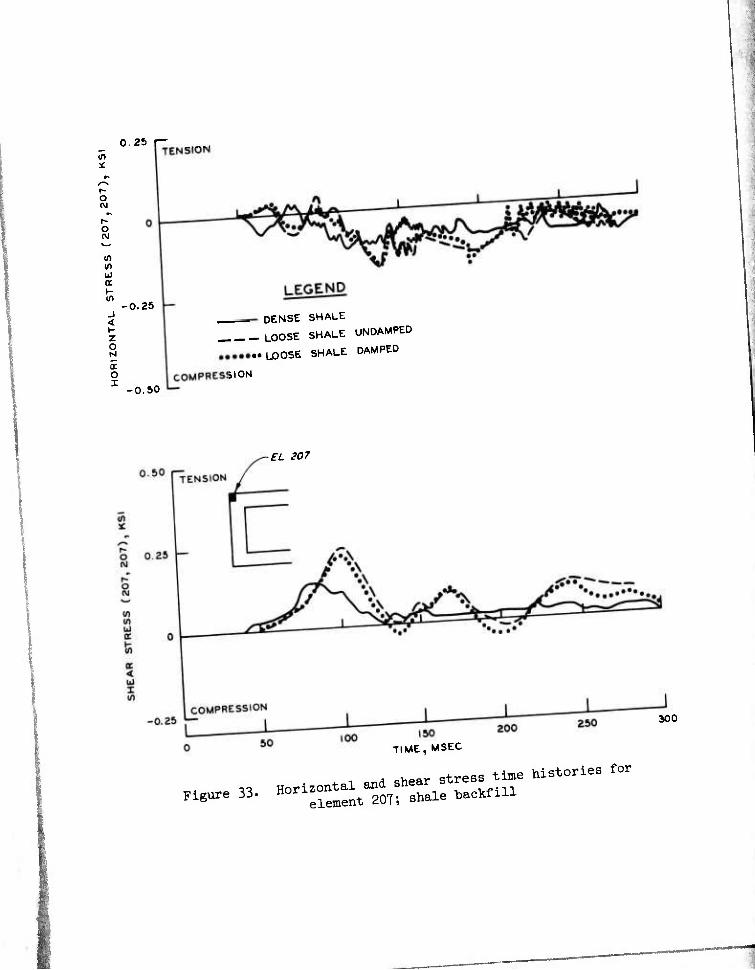
0.25 r— U1
o
o
tn m u a. i- m
-i < l- z s o I
-0.25
-0.50
DENSE SHALE
LOOSE SHALE UNDAMPED
«LOOSE SHALE DAMPED
ilON
■£L 207
300
TIME, MSEC
n^ 33. H^^-^Ä — ies for
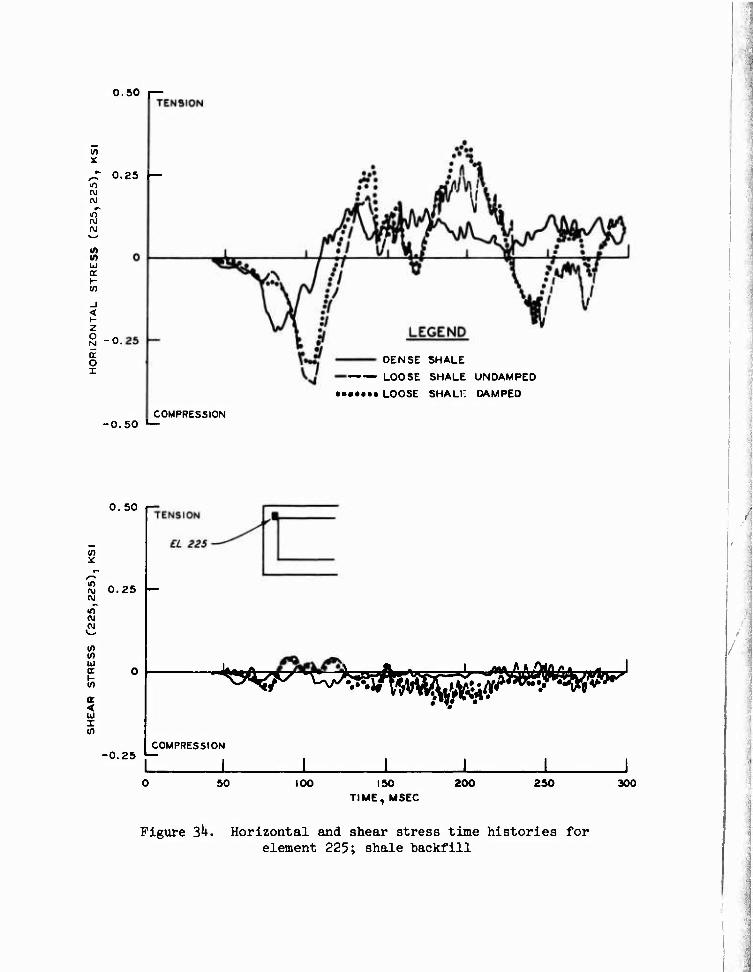
0.50 r—
(\J
id
u o: t- i/)
_i < Z o N a. O I
0.25 —
DENSE SHALE
LOOSE SHALE UNDAMPED
• ••• LOOSE SHALi: DAMPED
COMPRESSION ■0.50 *—
0. 50
a)
lO ry
Ä
m in UJ tr
< UJ I
0.25
^pm^1
COMPRESSION -0.25 l—
50 100 ISO TIME, MSEC
200 250 300
Figure 3^. Horizontal and shear stress time histories for element 225; shale backfill
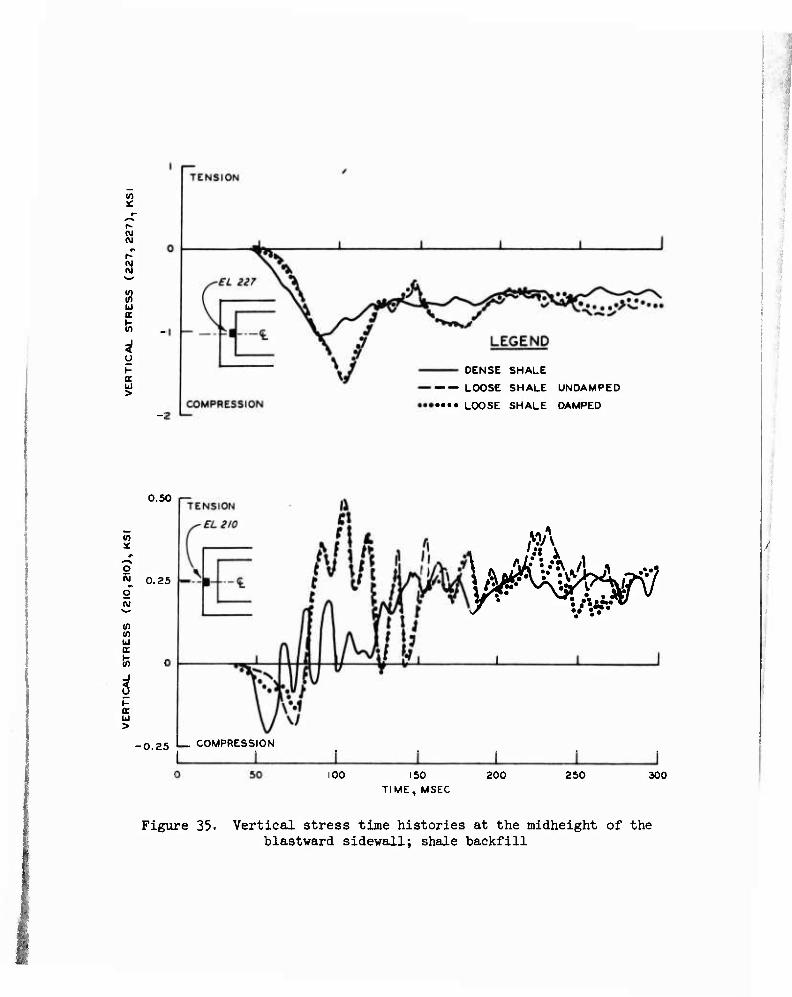
V)
Si
V)
UJ
In
u
a ui >
DENSE SHALE
LOOSE SHALE UNDAMPED
...» LOOSE SHALE DAMPED
0.50
5C
O
O
in in ui
i-
UJ >
0.25
ttA 'n A r^w
■0.25 L- COMPRESSION
100 150 TIME, MSEC
200 250 300
Figure 35« Vertical stress time histories at the midheight of the blastward sidewall; shale backfill
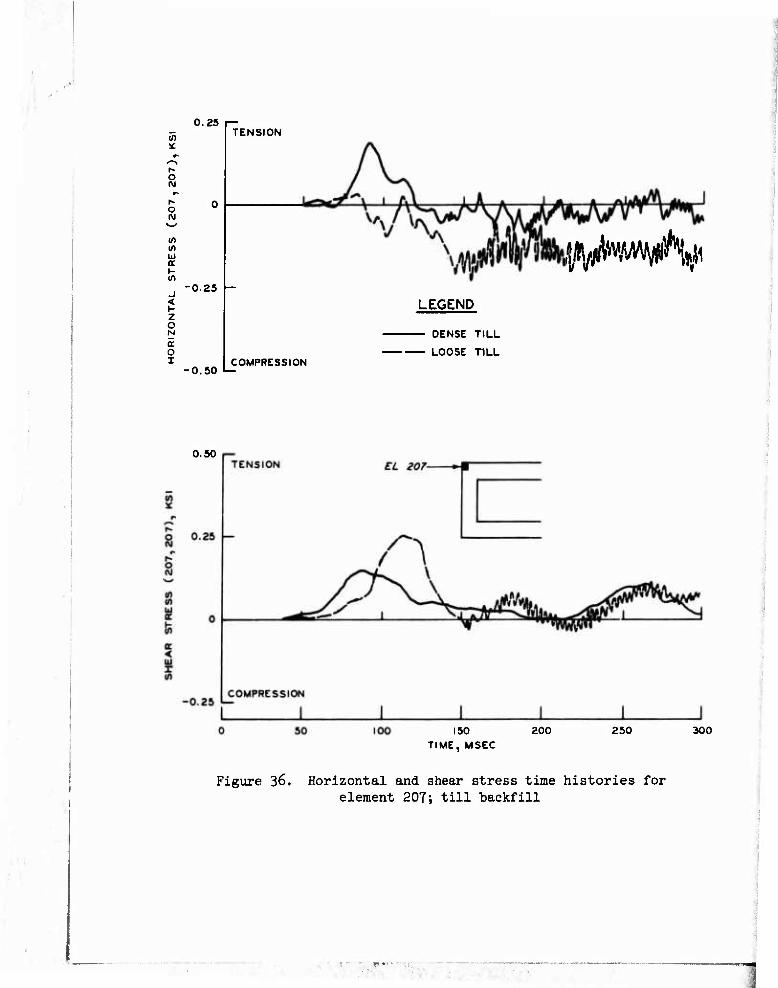
0.25
o pa r-
o
If) Ui a i-
< H Z O N a. o i
■025
•0.50 I—
TENSION
COMPRESSION
ip/mA^ LEGEND
DENSE TILL
LOOSE TILL
0.50
150 TIME, MSEC
300
I
Figure 36. Horizontal and shear stress time histories for element 207; till backfill
■
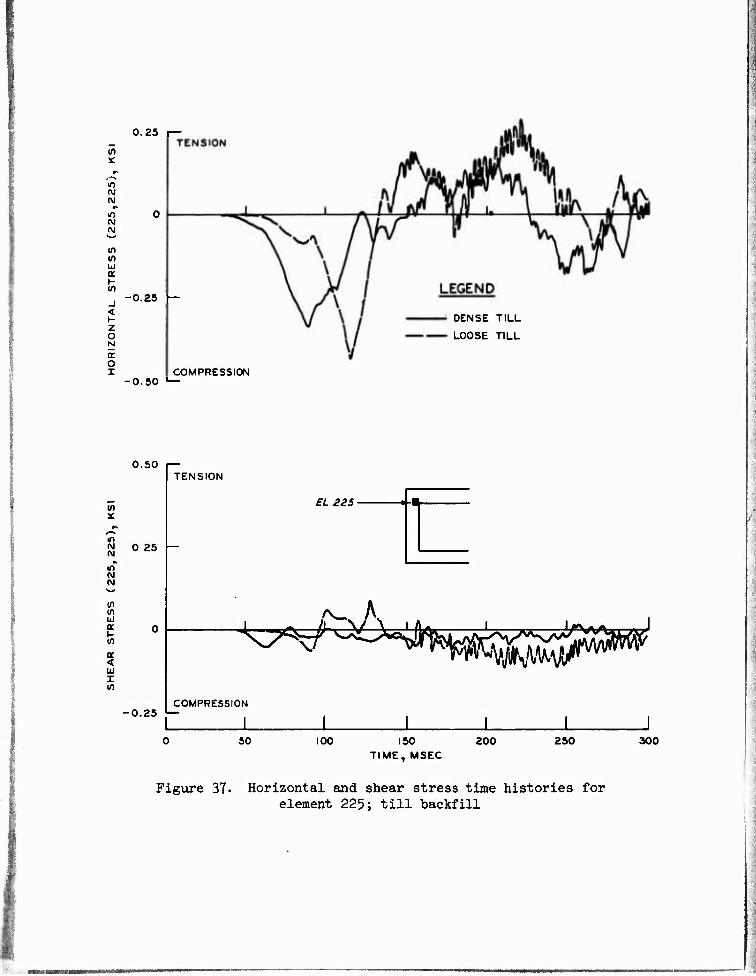
0.25 I—
in
N
to
UJ
z o y a. O i
-0.25 —
COMPRESSION -0.50 '—
DENSE TILL
LOOSE TILL
0.50
2C
in N o 25
m N
u a i- (0
< UJ I
TENSION
St £25 ■
te£
*-*
^w ^-^^^p^ COMPRESSION
-0.25 '—
50 100 150 200 250 300
Figure 37. Horizontal and shear stress time histories for element 225; till backfill
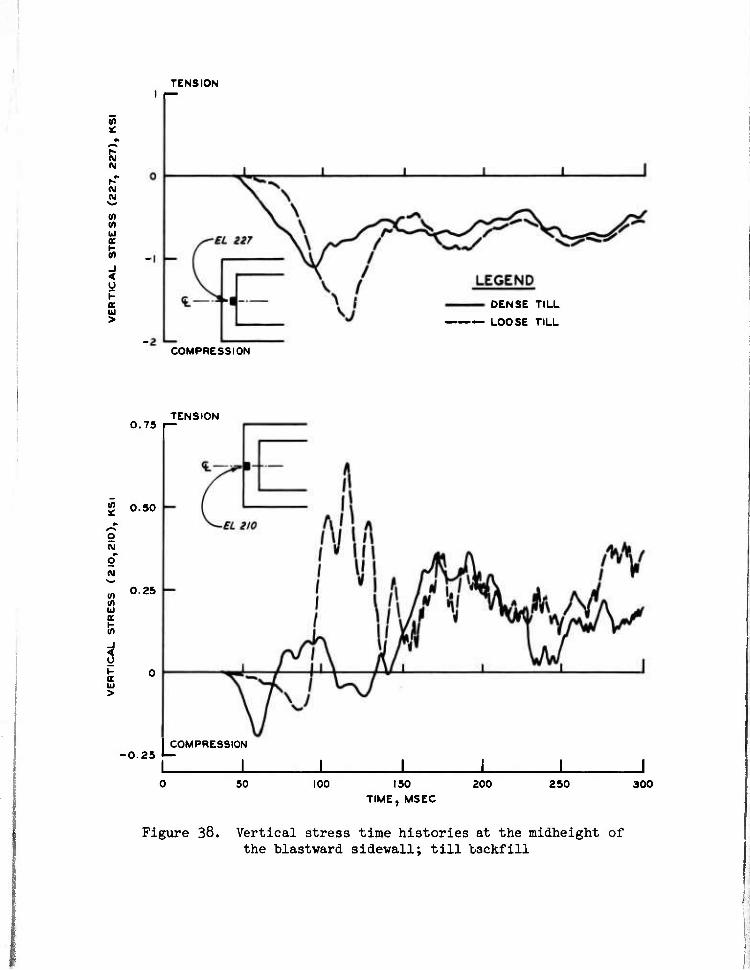
TENSION
r- N N \^
« u a
_i < y
DENSE TILL
— LOOSE TILL
COMPRESSION
O N O N *^* (ft 13
i UJ >
TENSION 0.75 p—
O.SO
0.25
COMPRESSION ■0.25 •—
50 100 150 TIME, MSEC
200 250 300
Figure 38. Vertical stress time histories at the midheight of the blastward sidewall; till backfill
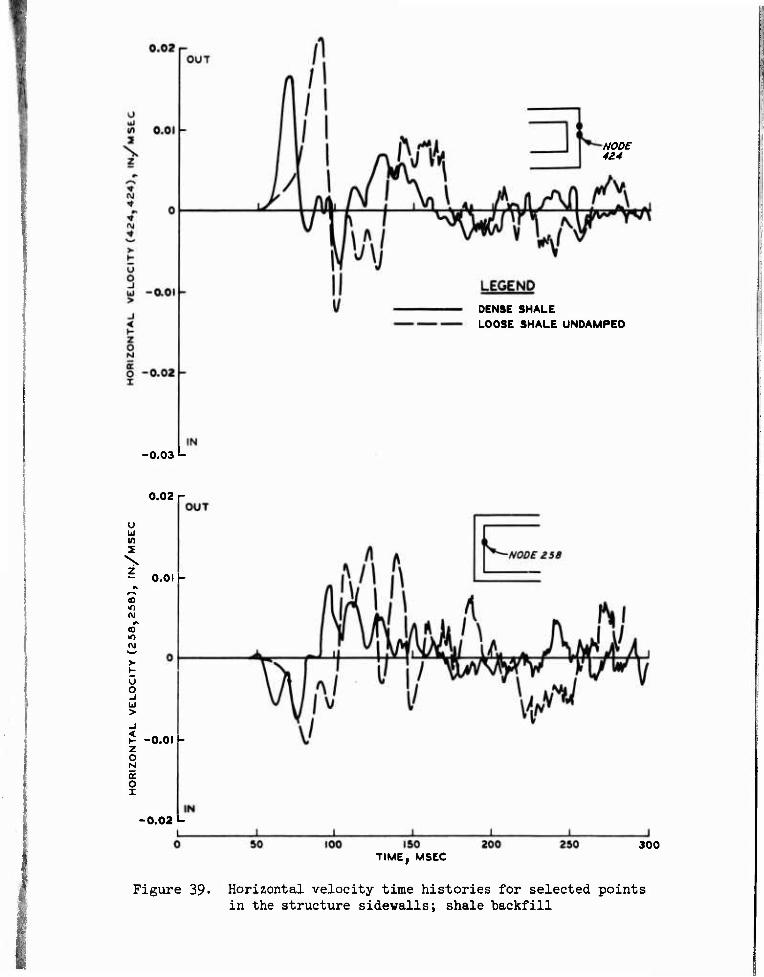
NODE 4Z4
DENSE SHALE LOOSE SHALE UNDAMPED
-0.03 l-
0.02 r
u w
z - 0.01 -
<o m w
00
(\J ^-^ V
u o _l UJ > _l < I- z o
a. o i
-0.01 -
-0.02 I-
300 TIME, MSEC
Figure 39- Horizontal velocity time histories for selected points in the structure sidewalls; shale backfill
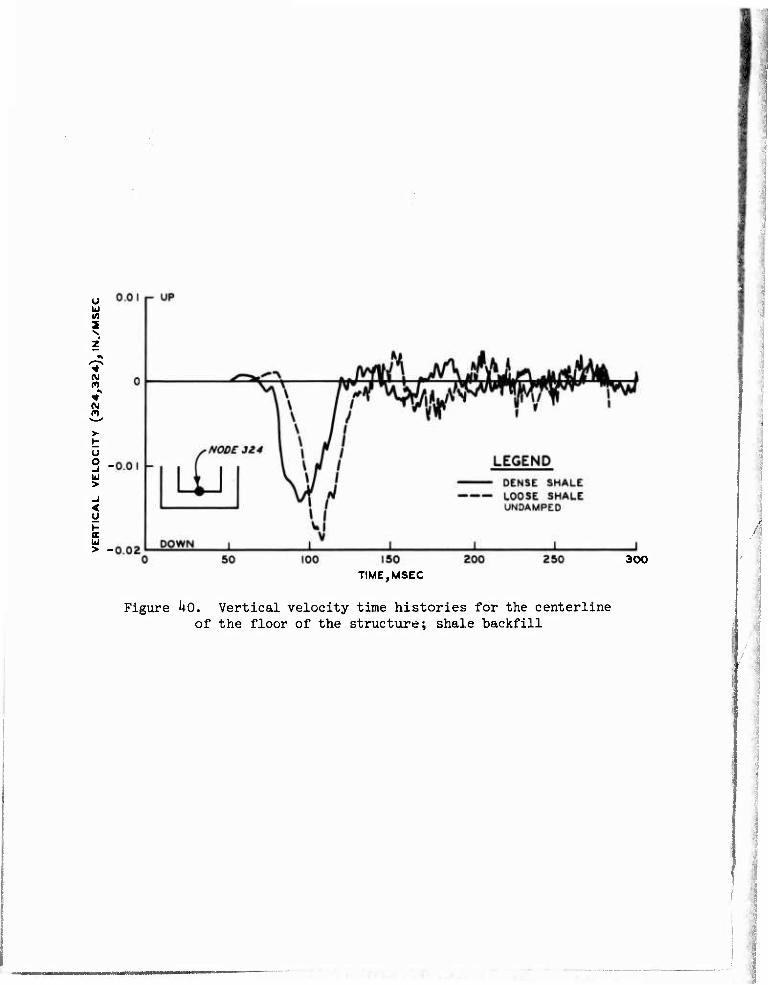
o Ui
N m
o 3 > -I < o E UJ >
300 TIME,MSEC
Figure ho. Vertical velocity time histories for the centerline of the floor of the structure; shale backfill
/ I
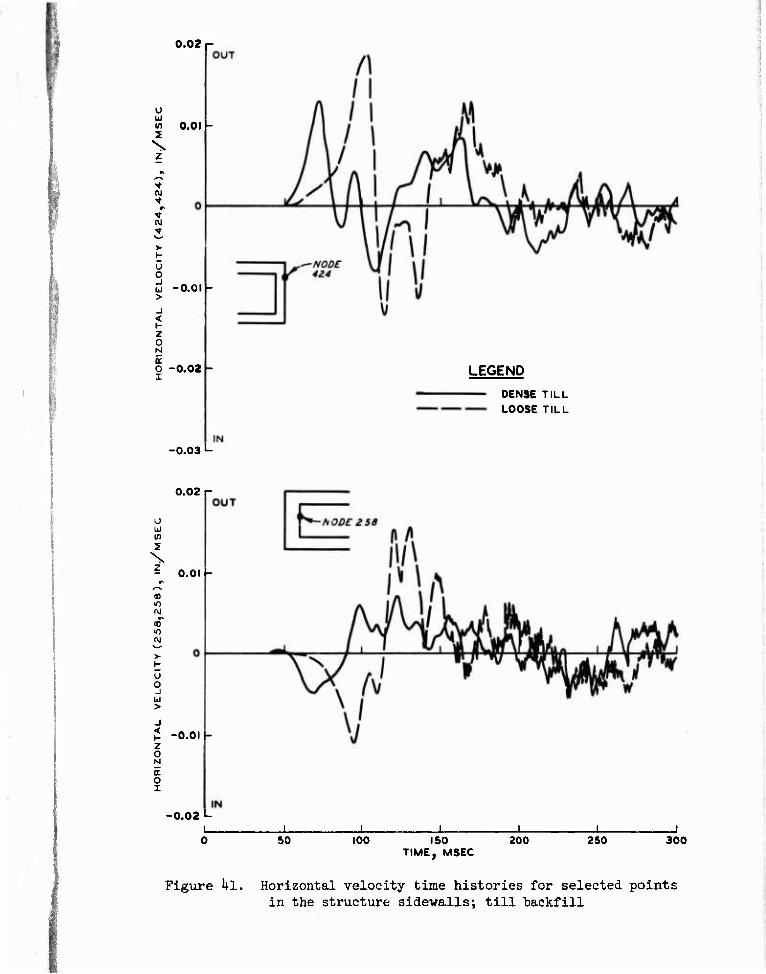
0.02 i-
o u in
N z
u o _l ui >
< I- z o
a. o i
0.01 -
-0.01 -
■0.02 -
-0.03 •-
DENSE TILL LOOSE TILL
0.02 r
o UJ
2
Z
in
CO
N
>
0 o j u > J < I- Z o
o I
0.01 -
-0.0! -
-0.02 L L. 0 50 100 ISO
TIME, MSEC 200 250 300
Figure hi. Horizontal velocity time histories for selected points in the structure sidewalls; till backfill
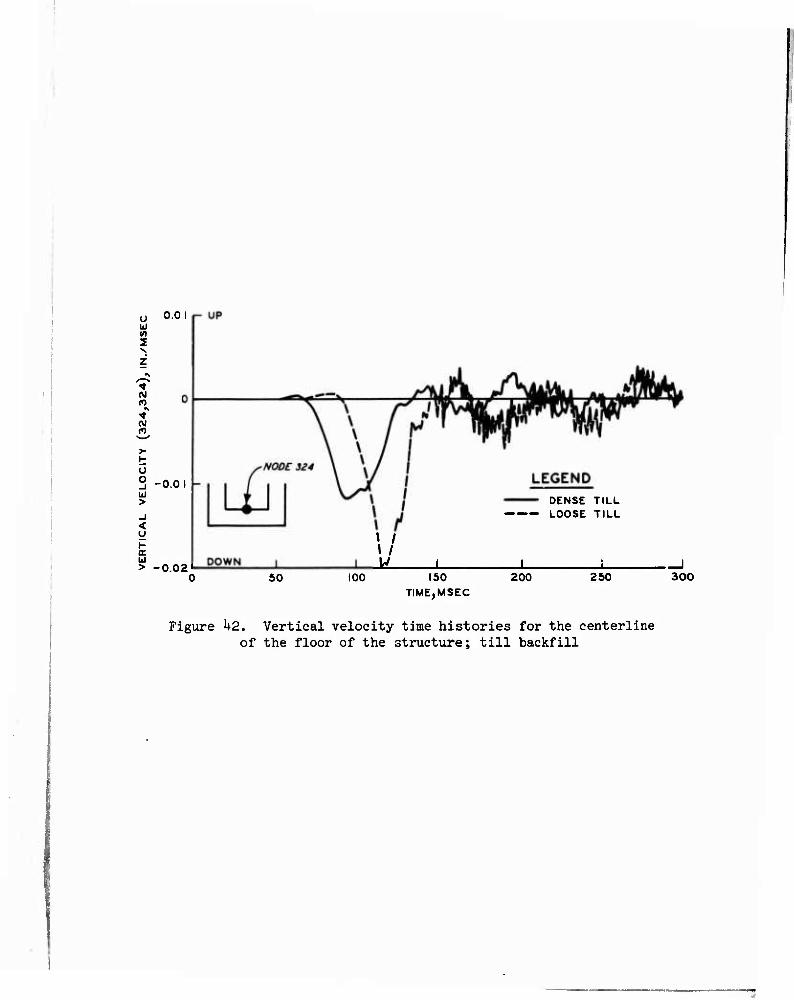
o Ml tf)
n •>
o
t o o J hi >
< y
>
0.0 1
-0.0 1
-0.02
DENSE TILL LOOSE TILL
W 50 100 ISO
TIME,MSEC 200 250 300
Figure U2. Vertical velocity time histories for the centerline of the floor of the structure; till backfill
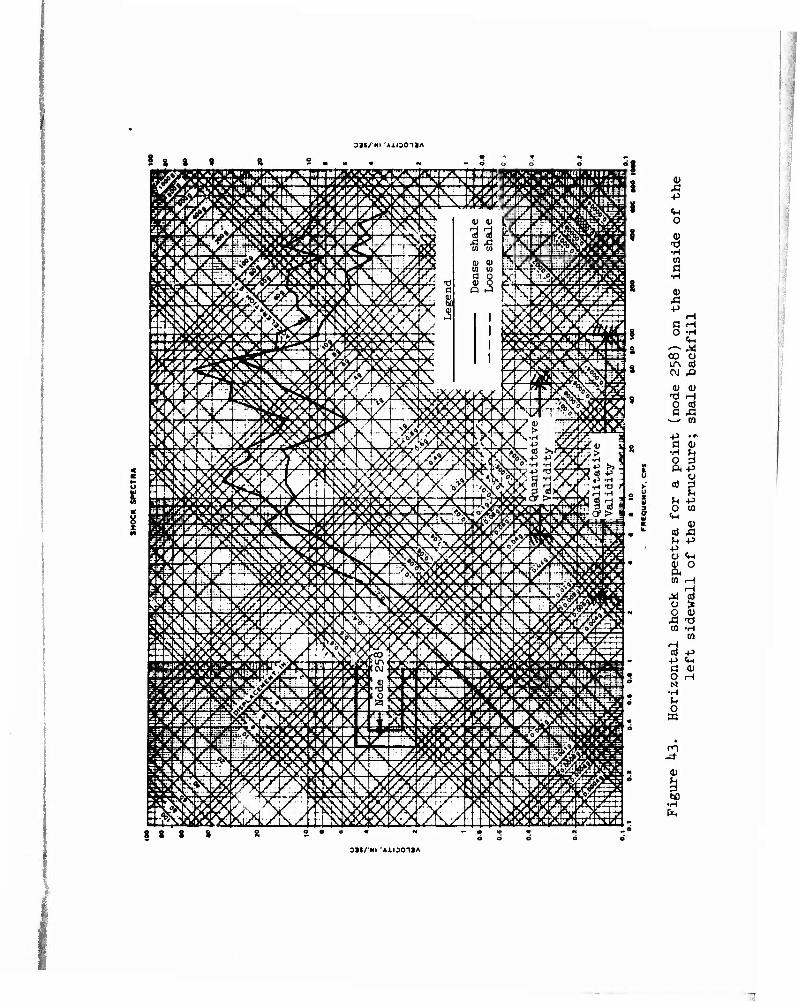
3»/ Nl AlljOllA
8 z
1 s a 9 « s . « 4 - o 0 3 Ö B fV^ rV L JfW ^V i .^^■ ■A 1 r.v *T^M^- «''V fX ■" r\ \ 1 i IJ'll'UV^V'HIi^lLilfliUMWin Ä1 i
pij w^ [THJ .^t [I ; i\iv N ftiw ̂ Oc^^^y v jt n\ MB^IillK(*»U.'<.«»:-».'ih,'f^»'<iiu»-«S*' K n> »■v;< KklrV. 'Ci'rkj /K 'vK^OvS J*C i^X L... ., '•tyM ,l/r Tv'Jt' ^i/TUITI
H EM •M BCV* rslfK. ^ r^XSiC^V fS \ MXA V icV"' ßfvHJvH H 39d?S£ a* xs^ ̂ TV? 4? fe^K iS ''V J^K^5
&> ^a 1 arniv / Sv r^v- sHÄ^
W> ̂ NT
p ivVJo V'
DO) l ■,
fitfh H m ̂ Ip J^^J 5^/_^
^ 5 5 in co
0) 01 M K^ m lÄ'XXX^
K i^ ̂
i ^ 'i^l
FS ^2> ̂ /JK^ S 8 > H* ̂ ^^^,
1 m glc 'rfrxk nivi s sM/^ '/. ö .3 K ̂ mjm
P B tlßm mm ̂ ^D 1 1 1 1 i
^MP^^ M ^ts&^mMttm i<M^ ^fo^<K?qifV rvl M s»-:-^ ̂ y'N NiX * >yy»tsX fvX\/ PTSK^X^JW M •1%^
WÄ Ä v N k?^ ̂ yi-^NXw^ ' ' l/l/^vb^N^' rl ^Tm« <?/vjys^\ M/Zffl>^ Ö
£VSS $&&m U<^ 7 ^k\ ̂ -Af^^r w /t^ 1 j/rKl/^ H: r^ ̂ »<ASS ̂ S - ^^'^^^XJ mm mi
t <
Sd in m 4^ M ^^mj «%/ \ V.^^M y'i/^ySfi L r ^ ^^^ V/fen g
i m M .Jv W^4^ H^5J 1 ^>^%v/\#l
»5«1 V 4^ ■u ^«^ TTV a) -P -1
kt VT^^^ v vlv ' *V 1 -j^V yWlV-i^^Vy^v >->. v^ n ISU
Ff CyjVx r\.^i^ . ^iteT^ \. yvy&?vc*\j*i ^V *m< - ^vlK SITTL ^H^N. /vySyStkKKSl^ ^ KVMWNX'^,. .1 5- ,A^vv 'CN ■ r^i.' vS /^rv^^YX^ 3ax.T>fkN^iTptt1 Er 1/F)c ̂ V k\\^?1 <'M/r,>8^<\^v^ ^KV*i\:'> |U9
B Wk L/l j >V^ kStä ^d^f y$
8!w vm* V _/f vi m\> ̂ 1 W -:-&*
^< s 4^^T± KX! m y 1^ - 1 k« Si
Pf ffep /h ,// K&W rvTs < x> x^^CT/^x^ i fe w Cl ^'«g i ||k dk ms^ sMN rfm f^^^H PL Du"
$/* n^ ̂ H^^^G^f n i MX
""'IM? itH Ä^S i TO^
M5 M
fe i • ^g^00?f^sJ Ü H. r IS 1 M -^fi
r "vVi XX1^ /VZ-T^IV.^ r /.L', k^i ' für -■54>J /TrVl V^W^7«l '3^^ ETK-ryVV Ni^i^anLTJPITTmiTTE Kl he.* '"<.;
^ ̂ ^ kilv rtKS ^ ».■ «k^'^k. ^itai».: ^i'.^^'-.it.'i'^m^ifä^'.ftss,-!
bi ^r; V «LN/^ 1 ^X^Sf V^K r wTrijij Bff VTK /TV iv\ f^« ̂R.J J^s. iy ^V ^KNj ^^ f W/ ?S Kx > frWFSia
K ^F ̂ z ̂ »s Ü Ss^ 38 <P W ̂ CK>\^ JKrk P 4^ ^WH Ssl\iä ll y ̂ ^Steffi, Ü 7^ ^4
Aä ^ >< ^vv «5^
.,«« nr X;i ^2r VVJvx. a. .«** ̂ SM^XJ K ^5^ .iülShJ I''"1 Vi x^ Si m ■ SilfS J^XJy'^v V ■^ ..^ y^y^o m i-i x irNX
SScf "^ i X 11 vb&SP' ^ /i\! ^ mm P ̂ % ^ its* -s. .§
—1 35, Rk s
^
/^>w! sM \ k^^^ yVS ̂ "H ki Ü» 0]3&\
ffi ̂ sfs i >C ^ '/^^ 1 0*0^ wm W i v 1 1 jips
1 I^SKW 1 ^ SC/ i | g mj TO It'-IS
4\
TS
. I
1)
■P
O
u •H tn a
a) +3
H Ö H O -H
Vi -^ ^! QO o IA 00
(i) a> T) H O C(3 C Xi
v^ W
4J ... a <u
•H ^ O 3 Pk -P
O
s cd
h -P o to
(1) oJ Ä
<u O
W H
M o O Ä tn
H d
4-> a o N
•H (H o W
on
0)
•H ft,
CO
8 S 8 33$/'NI 'AXIJ011A
3]t/'NI AXOO-llA
O
•H tn c
+^ a o
'— H
CVJ «H on
a; o
o cd
0) H a3
tn •H O PH 0)
cd
o <t-t
cd
-p o a; ft
3 •p o
0)
■p
Ü o tn
cd o •r\ P u >
-3-
•H
OJt/KI 'A.1ID01JA
I
DBS/ HI AiOO-llA
U 0 o H <H
i) A +J
c o
^^ -d- <M 00
0) ■Ö H 0 H £5 -H
-^ «H M
+J O C oJ •H fit 0 P« 0)
H 0) 0)
ft fii
U m 0 >• <H ••
« <u cd U
0 U H i ■P -P E o o
ft s to -p
CO M O 0) O Ä fii -p m
Vt
■a0 u
•H ■P h OJ >
• LA J-
•H
3»/'HI 'A1I30-IIA
DJt/Nl AXOOllA
A
o 0) -0 •H w
■p pi o ID A ■p
ß -H 8 0 «in S s <-<• O
j- «J 3 CM fi
0) (U H -d Rj 0 « a co
-P <u
O -P ft y
U CO o
CH 0)
p Co u p y 0) ftH
CH O
H a)
Ü3
H p Co 43
-a-
hD
8 8 ait/NI 'A1I3011A
03t/ M AiOO-llA
i) Xi -p
<i-l o 0) Ti •H w a
•H
a) ä +j
H c r-i o •H
<« ^--^ s a) O ITN cd CM ^ <u H -3 rH o •H Ö ■P
■—
-p <U a U
•H 2 ü ■P ft V
0 aJ u
4-> IH m o
«in fl) Ä
cri P> ^ P Vi O o 0) ftH UI
^ X > o 0) o T) Ä ■H tQ M
H +J ai <VH
■P 0 ö H o N
■H fn O W
• 1— J-
0)
•H fe
8 8 3 3»/'NI AXISOIIA
31i/'NI A1I0O13A
0)
O
•H M a
■p
on H Al •H on VH
^ a; U
-rt cd 0 ^3 c
H H
4J •H Ö -P •H O .»* PH ID
U cd 2
p ^ o o g
-p 01 w u +J IU o fl 0) +> ft m «M
o AJ o «^ o C) Ä o w u H crt o
•H +J fn ai >
• 00 -3-
fc
3It/'NI 'AXI3011A
311/ Nl 'A1I30-IIA
V
■p
o u o o
i)
ß o
OJ en 0 -d 0 H a H
a u •H cS 0 ^ Pi
H a) h O u
■p o 0) ft m
o o A w
o •H -P U
•H
8 S 3 3It/'NI AIISOIIA
8 3
31S/'NI AiooniA
o
•H CO
O
(U ■O ^> a o
H H
M j- Ü <M cd
(U H •Ö H 2 •H
■P (U
5 0 O -P
■P 05
P ü S PtH to H
cd
o
ü
en
H cd P C O
•rl
o «
-d •H
CO
P
bO •H fn
(U
P
O LA
•rl
8 8 3» 8 31(/'HI 'AilSOllA
/
(1) H ,Q 0)
0) (L'l
5 N ♦* >1 Ü ^
R Tl +* (1) CO
g (U 0 ^ Pm ■p
-d «H u o o Ö CO
0) <u Ö Ä ^ -p o u <M o m\
-ö fi •Hi o M
•H ■B
a) B\ ■P 0 m K 0
•^ Ö ■^ 3 o
•H m
u ol 1 3
•rl M EH a
0) Ü
Si
o
ITS o o o
o ON
o o o
o o o
o ITS
o o o o
o o
o o o o
o o o o
o o on I o
rH
o o o o
en CM
o o
0) y o ITN m .s <u OS O 00 m H OJ
H Ö
O O O
e •H
3 £3
(U 1 w
•H o •a ^ 0) 1 o N 6 o H O 4) O ■P m u •H 0)
-P
s § o
o o 0) H u « O
to Ö o
•H p
o H H •H «H a o
CQ
H H •H EH
0) " e 0) •H Ul tH 0
0) o S <u\ •H U] EH öl
O o
UN o ro t— u\ I
H o
o o o
O O O
O O o o
o ir\ O H H H
O o o o
o o o o
o on OJ
O o o
O K O
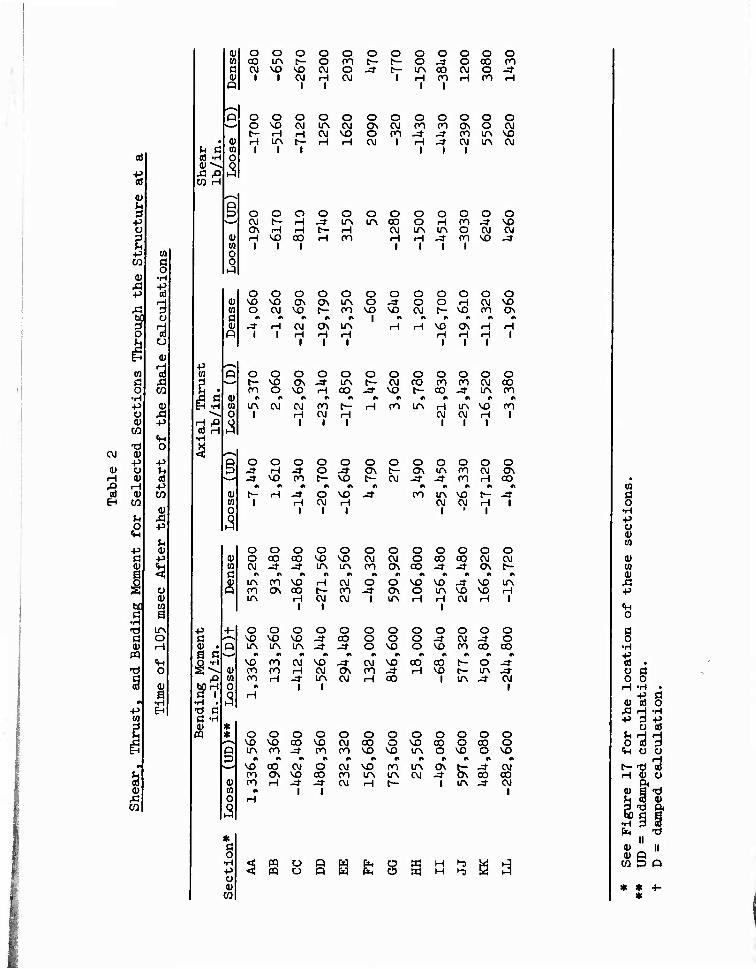
C\J
■s E-i
ä
§
h a a) -H
CQ H
0) O O o O o O o o O o o O M oo IA t- o oo t- c- o -* o 00 oo ß W VO M3 OJ o -^• E- LPv oo CVJ o -3- (U Q
1 ' OJ 1
H 1
CVJ i H 1 i
H ro H
"p o O O o o o o o o o o O o MD CM IA OJ 0\ CVJ m PO Ov o CVJ h- H H CVJ VD o m j- -* oo lA VO
(1> H LA t- H H OJ I H ~3 OJ IA CVJ w 1 1 1 1 1 1
■p a
8,S
•H . -d ö Ö -H 0) m
o o O O O O o o O O o o CVJ t- H -* LTV IA oo o H (O J- \o ON H H t- H CVJ IA IA o CVJ CVJ H
1 VO 00
1 H oo H
1 H
1 -3-
1 00
1 vo J3
o o o VD VO Ov O CVJ vo
o o o o Ov LA O J- t— 00 VO V£)
I
o o r- vo 00 o
IA W I
CVJ H
I
ON IA H H
I
o o CVJ
o o o o O H CVJ VO ^ VD OO Ov
H H VO 0\ H H H H H I
I I I
o o o OV J- IA
VO H 0O ft «« M
cvj oo r— H CVJ H
i I I
o CVJ VO
o oo
00 IA
o o o o (O OO CVJ OO 00 -3- IA 00
«« A «I fl
H IA VO 00 CVJ CVJ H I
I I I
o -3- VD
O
OO
o o O J- t- VO
o o t— CVJ
o o o o o OV IA 00 CVJ OV -a- -a- oo H oo
t- H I
J- o H CVJ H
I I I
VO -=f OO LA VD CVJ CVJ
I H I
I
o o o o o O 0O 00 VO VO CVJ -d- J- LA IA
LA 00 IA
00 VO OV 00
cvj I
CVJ 00 CVJ
o o o o o VO vo VO j- 00 IA LA IA J- _*
VO 00 oo oo OO H
CVJ
I
VO -3- CVJ OV IA CVJ
I
o CVJ 00
o -^■
I
o o o CVJ oo
o o o o o CVI O 00 CO CVJ Ov OO J- -3" OV
«t » A rt n O VO VD -* VO OS O IA VD VO IA H H CVJ H
I
o o VO
o o o j- O VD
VO 00
00
co VD
I
o CVJ
o o 0O
O -3- IA J- J- CVJ
I
o o CVJ j- 00 CO
o o o o o o o VD VO 00 VO CVI CO o IA 00 J- 00 oo VO vo
VD 00 CVJ CO o\ VO 00 H J-
« I H
o 00 -a-
I
CVJ oo CVJ
VO 00 IA LA
o O o O o VO 00 o 00 o LA o VD o VO * •» #* fl #« LA OV t«- J- CVJ CVI Jt Ov oo co
1 LA J* CVJ 1
rf m o p w fe e ^ pq o Q w E o H ^ ^ d
CO
§ •H ■P O 0) (0
0) Xi ■p
o a o
•H
s . ü a o o H -H •
■p a <ü 5 5 Ä H -H p P p o at
«MOO
H 4) O Q> a) a -o
u <a t)
111 II
«> II OJ Q to 5 o
* * «
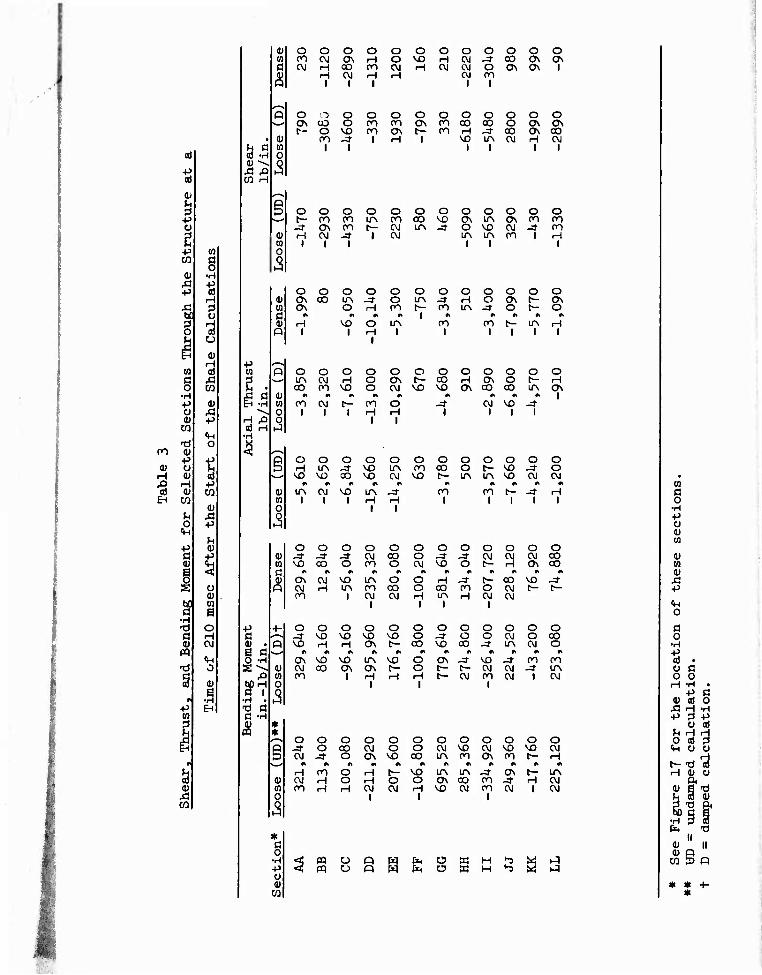
on
EH
M a o
•H
1d H Ü
cd
to
0)
+J
O
a) -p w aj
■p
0)
s o a> w S
w
. .s
3 -H
CO H
EH -H
H ^l a) H •H
0 a i
« Ö o •H ■P Ü <u
CO
o o o o o o o o O o o O 00 C\J ON H o MD H C\J -d- CO ON ON C\J H CO 00 CVJ H <M CÜ o ON ON 1
H 1 1
H 1
H OJ 1
00 1
o a o O O O O o o o o o 0\ CJO o co oo ON 00 CD 00 o ON ON t~ o MD 00 ON t— 00 H -^• 00 ON 00
oo 1
I H 1 1 1
0J H 1
CM 1
o O O o o o o o o o o o r- OO 00 l^ OO 0O VD ON IA ON oo 00 -t ON OO t— CNJ l/N ^t O NO CNJ -4- 00 H
1 CM
1 1 1 CO LA
1 ITN
1 00 1 H
1
O o o o O O o o O o o o ON oo IA -sr O IA J- H O ON t- ON ON o H oo t— 00 IA -3- O t- O
fl •> m #» 1 A A •» #1 #> H
1 NO o
H 1
IA 1
no I
oo I 1
LA 1
H 1
O o o o o O o O o o o O IA 0J H o ON C— 0O H ON o t- H 00 oo NO o CNJ NO NO ON CO co LA ON * « •t A « A »« ft * 1 oo 0J
1 t—
1 oo H
o H 1
OJ NO 1 1
o o o H LA J-
NO NO CO «k #t «I
LA 0J NO I I I
o NO NO
*» LA H
I
O LA OJ
H I
O O OO 00
o o
o o t- NO
O o o
NO t— LA IA NO OJ OJ
OO I
oo r i
o o NO 00
A «I
ON CVJ OJ H OO
o J- o
A NO LA
I
o o o o o OJ CO o J- -a- 00 O OJ NO o
o o O O OJ OJ 0J CO c- H ON OO
LA O O OO OO O CNJ 0J H
I I
H -* t- CO NO -d- oo oo o cvj t- ^- LA H OJ CVJ
i i
o o NO NO
o NO
ON VO NO OJ 0O ON 00 |
o o o o NO NO O -^■ ON [— oo NO
o o o o o O O OJ O OO 00 -3- LA 0J O
LA NO O ON t— O H H H
I I
ON -4- NO -3- 00 OO t- [— CVJ 0J -* IA t- CVJ 00 OJ I 0J
I
o o O o O O o O o o o o -3- O CO OJ o O OJ NO CVJ NO NO OJ CVJ -* O ON NO 0O LA OO ON 00 t- H
#t «1 #» ft * •» #i #» •» #> «t #» H oo o H tr- NO LA LA Jf ON t- LA OJ H o H O o ON CO 00 •J- H OJ OO H H CVJ
1 CNJ H
1 NO OJ oo
i OJ 1 CVJ
^ pq u pq u
Q w (x, cs w Q S fe ü tc
H 5 ^1
W C O
•H P Ü 0) w
<ü to V A p
O
a o
•H p a) o o
p <u a)
ü U H O (0
•«H O
a o •H p a)
o
H OJ U ft
(ÜBT) h 3 a> 2,'S &
•H 3 3 II
(U II
co § o
* * *
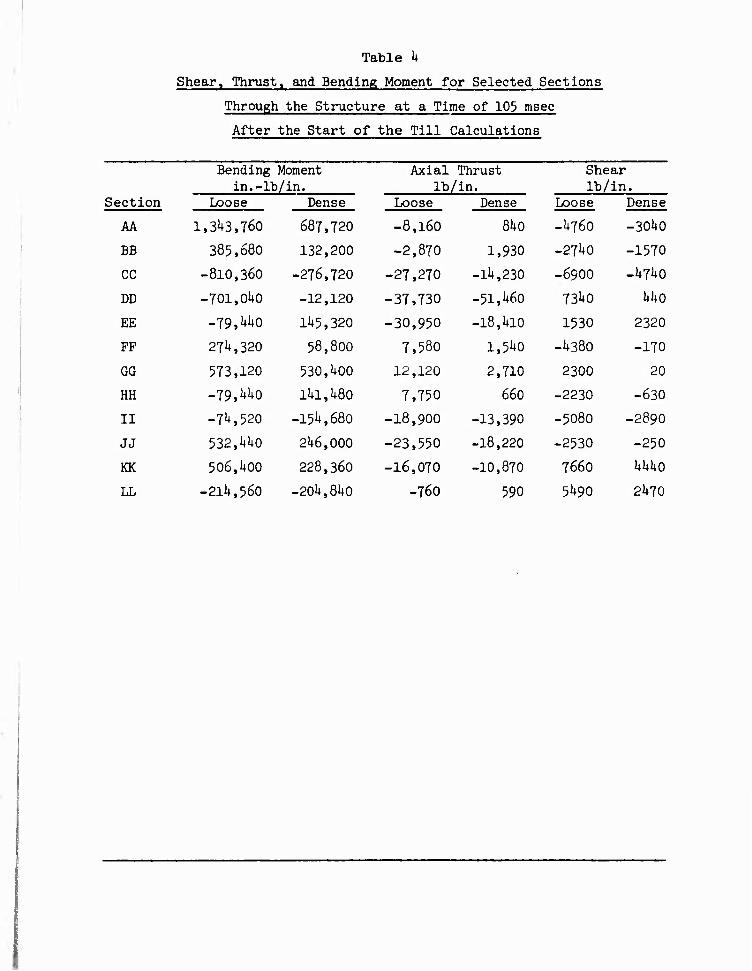
Table h
Shear, Thrust, and Bending Moment for Selected Sections
Through the Structure at a Time of 105 msec
After the Start of the Till Calculations
Bending Moment in.-lb/in.
Axial lb/
Thrust 'in.
Shear Ib/ir 1.
Section Loose Dense
687,720
Loose
-8,l60
Dense
81+0
Loose
-I+760
Dense
AA 1,31+3,760 -30I+O
BB 385,680 132,200 -2,870 1,930 -27I+O -1570
CC -810,360 -276,720 -27,270 -ll+,230 -69OO -I+7I+O
DD -701,01+0 -12,120 -37,730 -51,1+60 731+0 1+1+0
EE -79,^0 11+5,320 -30,950 -18,1+10 1530 2320
FF 27l+,320 58,800 7,580 1,51+0 -I+38O -170
GG 573,120 530,1+00 12,120 2,710 2300 20
HH -79,WO 11+1,1+80 7,750 660 -2230 -630
II -7l+,520 -15l+,680 -18,900 -13,390 -5080 -289O
JJ 532,1+1+0 21+6,000 -23,550 -18,220 -2530 -250
KK 506,1+00 228,360 -16,070 -10,870 7660 1+1+1+0
LL -2ll+,560 -20l+,81+0 -76O 590 51+90 21+70
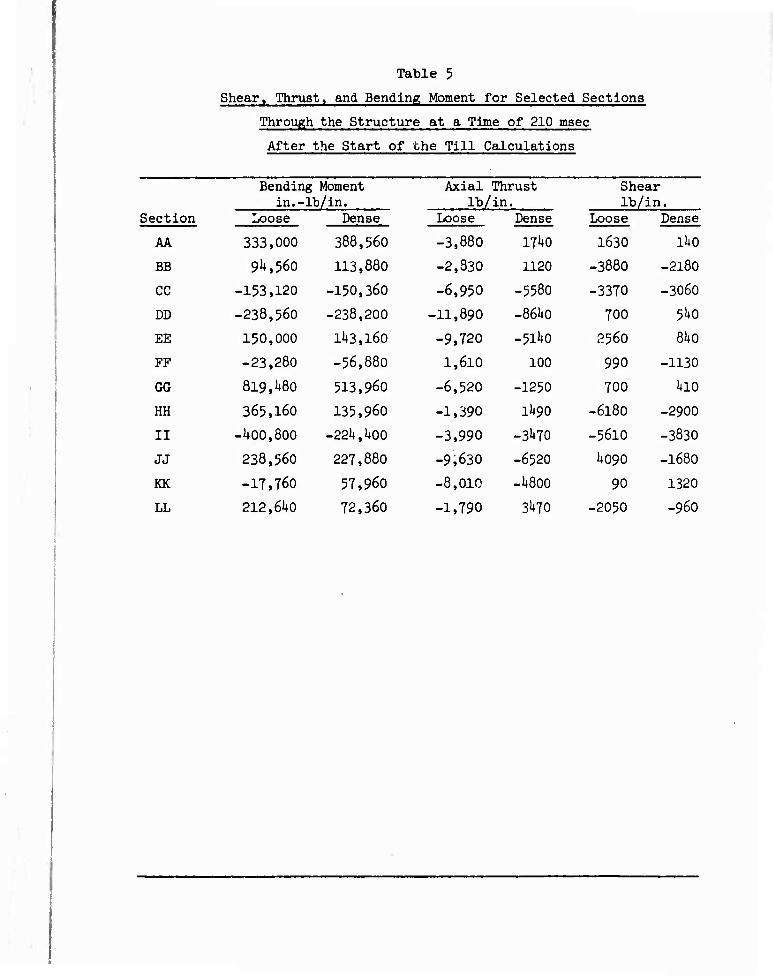
Table 5
Shear, Thrust, and Bending Moment for Selected Sections
Through the Structure at a Time of 210 msec
After the Start of the Till Calculations
Bending Moment in.-lb/in.
Axial Thrust lb/in.
Shear lb/in.
Section Loose
333,000
Dense Loose
-3,880
Dense Loose
1630
Dense
AA 388,560 ll+0
BB 9H,560 113,880 -2,830 1120 -3880 -218O
CC -153,120 -150,360 -6,950 -558O -3370 -306O
DD -238,560 -238,200 -11,890 -861*0 700 5l+0
EE 150,000 lH3,l60 -9,720 -511t0 2560 81+0
FF -23,280 -56,880 1,610 100 990 -1130
GG 819, Wo 513,960 -6,520 -1250 700 1+10
HH 365,160 135,960 -1,390 1H9O -6180 -2900
II -i+00,800 -22htk00 -3,990 -3H7O -56IO -3830
JJ 238,560 227,880 -9,630 -6520 1+090 -I68O
KK -17,760 57,960 -8,010 -1+800 90 1320
LL 212,61+0 72,360 -1,790 31+70 -2050 -96O
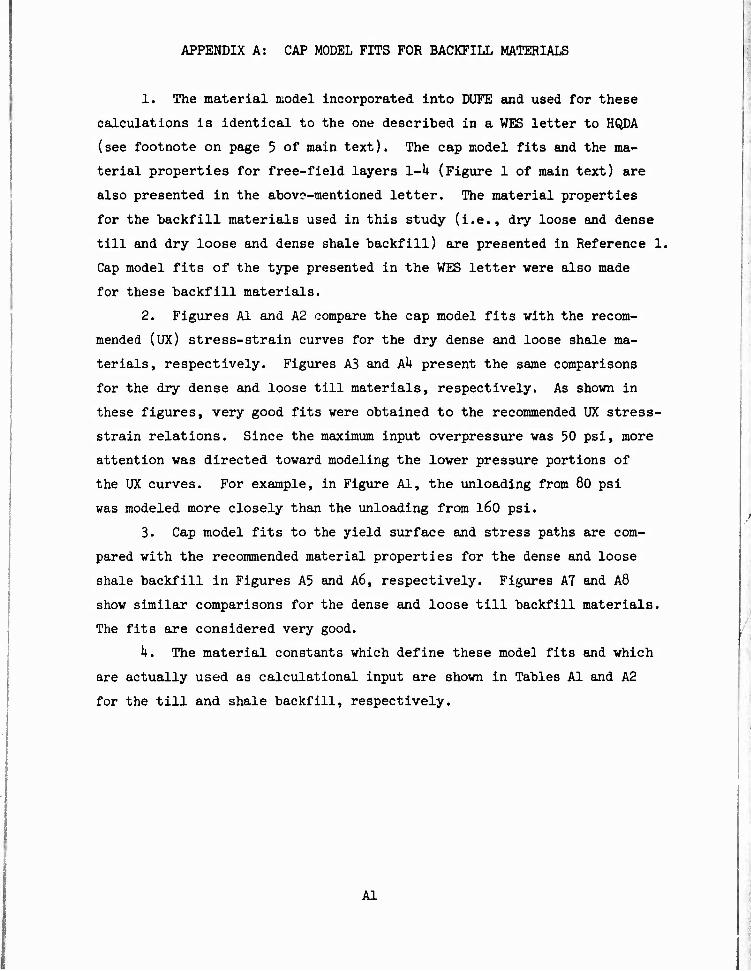
APPENDIX A: CAP MODEL FITS FOR BACKFILL MATERIALS
1. The material model incorporated into DUFE and used for these
calculations is identical to the one described in a WES letter to HQDA
(see footnote on page 5 of main text). The cap model fits and the ma-
terial properties for free-field layers 1-k (Figure 1 of main text) are
also presented in the abovo-mentioned letter. The material properties
for the backfill materials used in this study (i.e., dry loose and dense
till and dry loose and dense shale backfill) are presented in Reference 1.
Cap model fits of the type presented in the WES letter were also made
for these backfill materials.
2. Figures Al and A2 compare the cap model fits with the recom-
mended (UX) stress-strain curves for the dry dense and loose shale ma-
terials, respectively. Figures A3 and Ah present the same comparisons
for the dry dense and loose till materials, respectively. As shown in
these figures, very good fits were obtained to the recommended UX stress-
strain relations. Since the maximum input overpressure was 50 psi, more
attention was directed toward modeling the lower pressure portions of
the UX curves. For example, in Figure Al, the unloading from 80 psi
was modeled more closely than the unloading from l60 psi.
3. Cap model fits to the yield surface and stress paths are com-
pared with the recommended material properties for the dense and loose
shale backfill in Figures A5 and A6, respectively. Figures A7 and A8
show similar comparisons for the dense and loose till backfill materials.
The fits are considered very good.
h. The material constants which define these model fits and which
are actually used as calculational input are shown in Tables Al and A2
for the till and shale backfill, respectively.
Al
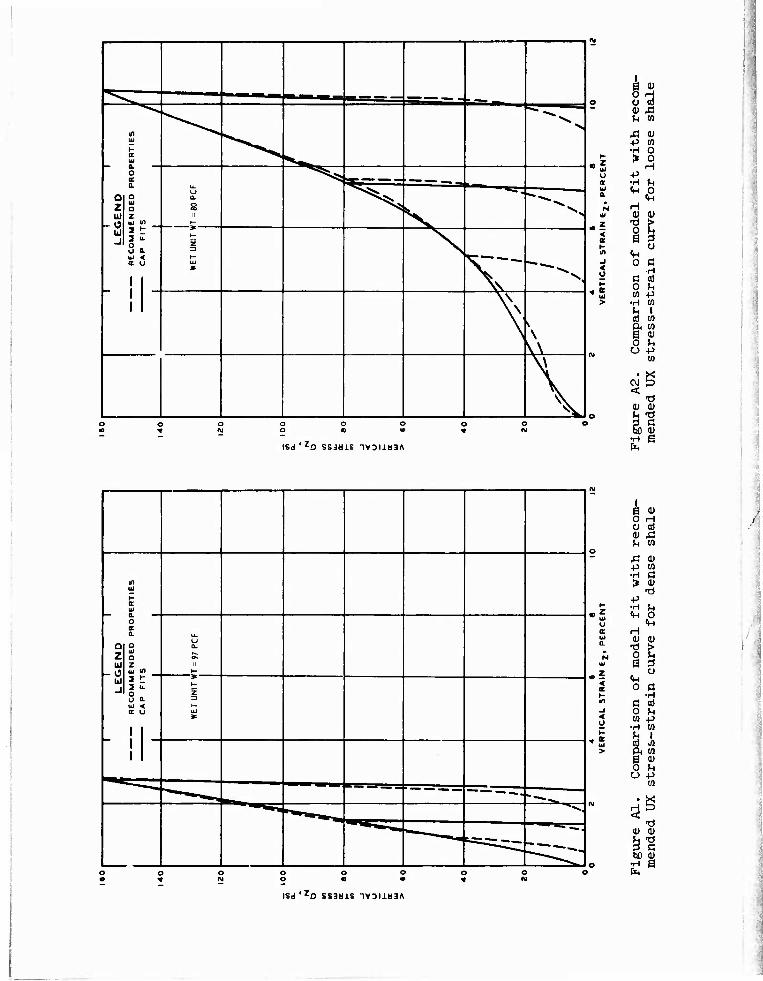
^••s^ 1
—
•EH
TIE
S ""^^
O K
u. a. 8 ^^
1 — —— —rt
o z ut
-0 u j
a in a z at in _ X, ^"^^ 2 : 2 i Sr a. K
l
L 1 J
z
UJ
\
\s "^^v 1 1
\ V \
\
isd'zo ssjMis nyDiibiA
B (1>
CJ a <U J3 h u
Ä (U ■P m ■H o
z > o H
LI •P It •H U UJ «H O
<«H H (1) 0)
z T) > < a ^ I- Ü m <tH .1 0 ß < •H
ß a) o u to +J > •H M U 1 «J W A M 0 (U o ^ O -P
CO
oj S < -d
0) (1> H -d
•H a ^
<A UJ t- K UJ
O E 0. u_
u Ü a a.
Z a o^ Ul z II
-0 UJ J
UJ I n _ 1-
L
0 a. 3
j UI < It o UJ
1 - 1
1
—«=
" —■
"*^.
^^^^r^. .^ -~^^
^^;
<
■^^B,
o
B (D () H u crt d) a U to
A (1) P to •H Ö !» 0)
Tl p •H ^1 tH o
<tH H 0) (1)
0 g 0 3
o Vi 0 B
•H c 01 0 U to P
•H to u i crt j) P< to 0 0) o h o P
to
• S rrt
li) d)
§ % bii i)
•H 0 te
isd'zo ss3äis nyoiiusA
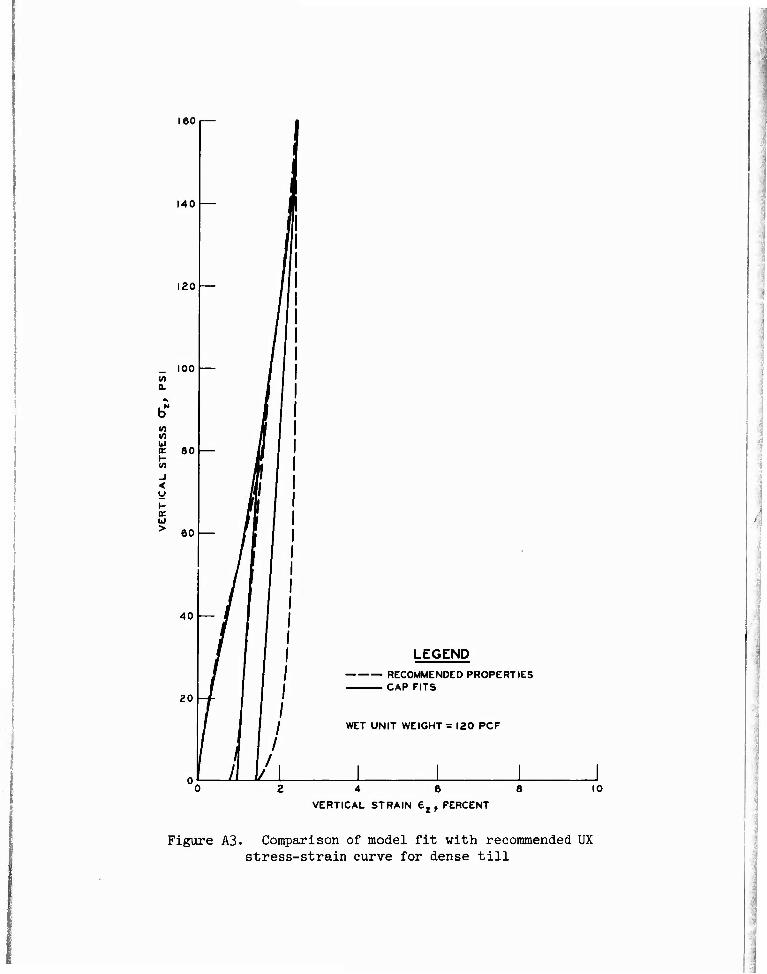
leo
140 —
120 —
60
40
20
LEGEND RECOMMENDtD PROPERTIES CAP FITS
WET UNIT WEIGHT = 120 PCF
10
VERTICAL STRAIN ez, PERCENT
Figure A3. Comparison of model fit with recommended UX stress-strain curve for dense till
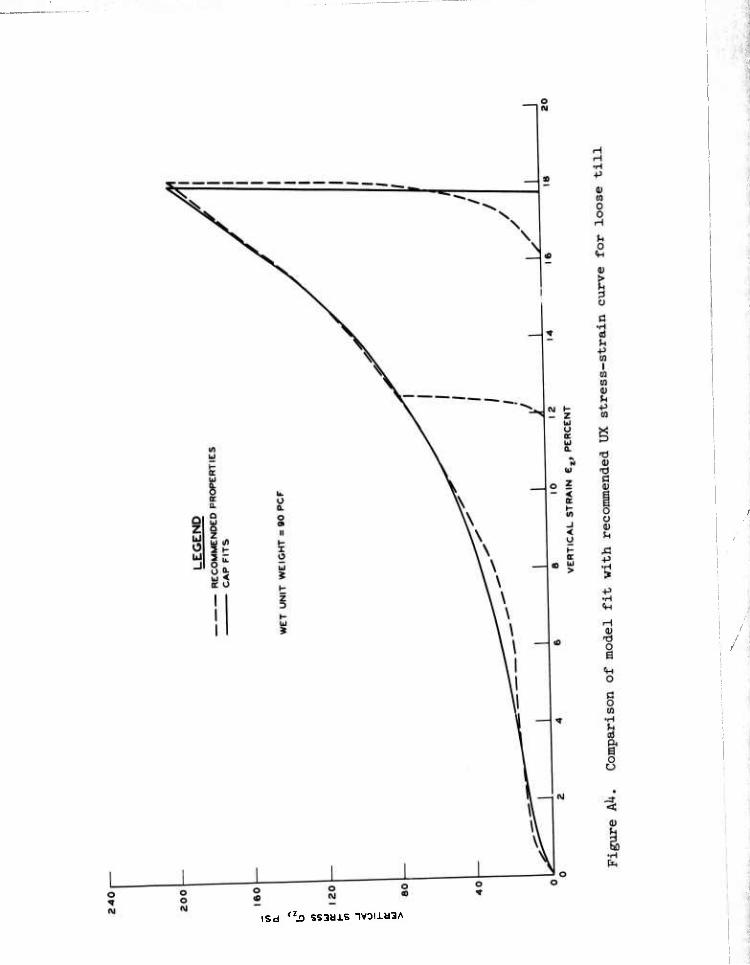
/
ISd <2J3 SS3U1S ^DlidSA
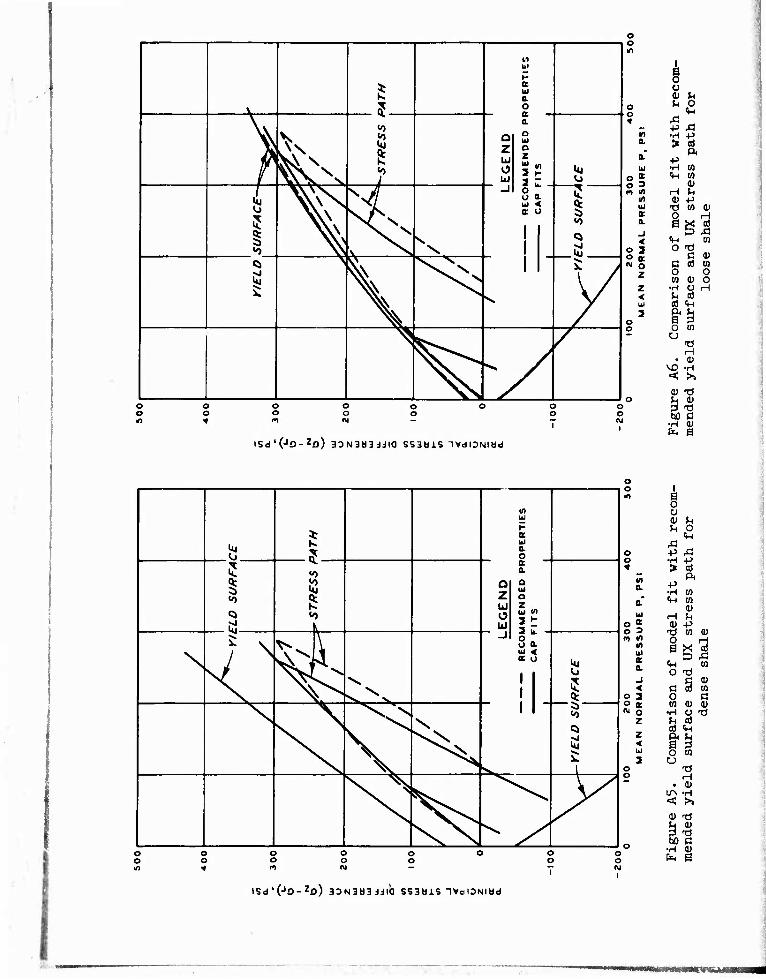
in m t-
36 UJ k a.
\ 5 o
V «0 a.
V. V i? o a iti
^ ̂ ^ t Z a z
V \v\. \ <0 O 3 K itj 1 VL cs. V ; UJ «j
i V\ s^
_J 5 et
1 ^ s \
1 1
> s «0
Q Si
^ ^ v 1 > Q
i \
1 1
y N k V
/
o o «1
o o
o o
o o
o o
o o
ISd'(JD-zfl) 3DN3H3dJia SS3biS IVdlDNIbd
k O V i) U
o u <s
4 Ä ■P J3
in •H +J D. > a ^ Pi +> UJ •H M
O * 4H CO O 3 (1) in in H (H
in (U -P UJ •d to 4; B a. §s1 < <H tO
o a o -o o K C 0) «J o C a) to
2 o o to 0) o
z •H O H < U aJ UJ CO <JH
2 o ^^ o o to
o T) H
• <U MD -H < S (U -0
o 3 -d bD Ö
•H Q) to 0
V) UJ
1- ^ K
kj K. UJ
0. o
^ 5 «0 S a.
U: P Q a 5> t z Ul
a z
«0 K
o UJ 2 •"
3 Ü - \ ■ _I
\ / ^ ̂ ̂
o a Ü < at o
kj V / vv. ' \ u NC V>^ \ 1 ^ \, \V ^^^ 1 k
* \ \ V^N 1
«0 X w \ \ \ Q >. v sssV^ >l ^v x ^V^v *J
>N^ < V ^^ V 1 k \ ^ ^ /
y o o
o o
o o
o o l\J
o o
o o
o o 1 «n s
O o <u ^ Jn O
«in -C
o ■P Ä o •H P * > cd
in P. P •H to
a <H tO (U
UJ H U 0 5 0) P 0 ? -d to (u ro m O H
UJ it a.
eg. S-i M o d
J <
Ö 0) ß cd to
o 3 O Ö o a; tO 0) OJ N o •H o d
z Jn as cd <H z
< ^^ UJ o to 2 o
o -d o H
• (U UA -H «a; s a» d
13 00 c
■H (Ü PTH a
ISd'(J0-zo) 3DN3H3iJia SS3 «iS ltd lONIdd
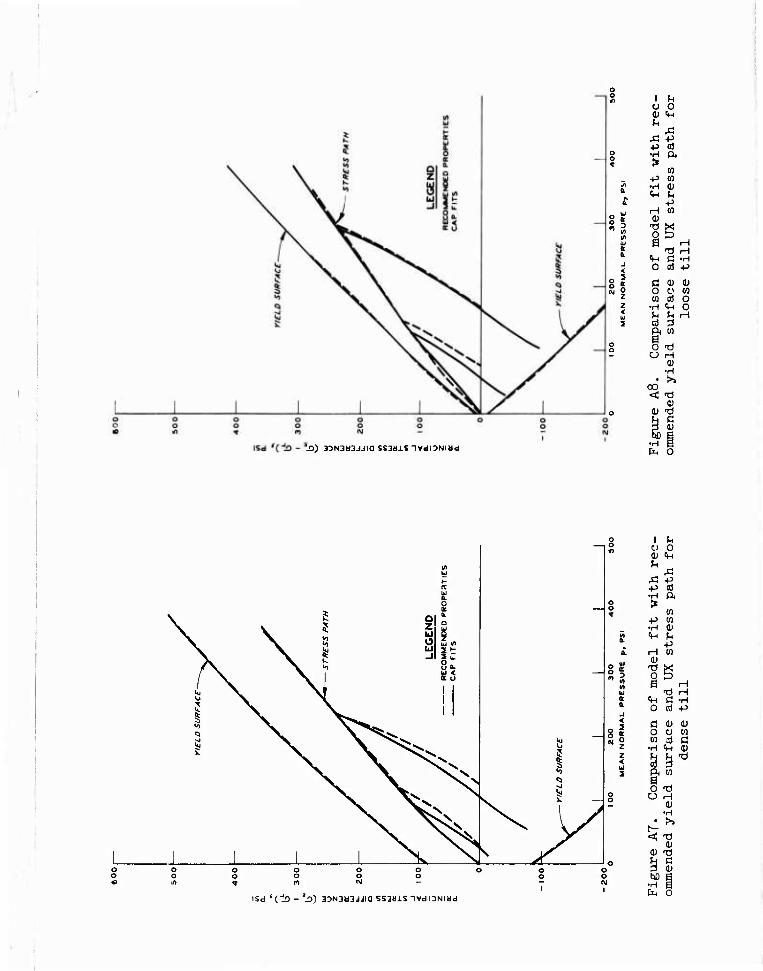
'.O) 33N3M3JJia SS3M1S IVdlDNIdd
s 1 U Ü O <U (M h
A A -P ■P a)
o •H A o > to
-p w 5! •H (U a.
<H |H £ •p
H W §5 0)
^g Ü a H a. ■OH
Vl Ö -H J < O nj +J
il Ö <U (U S 9 O C M z M 0} O z •H tH O < ^ ^ H
3 cd 0 P< tn a o o 5 T) U H
0) •H
• >J oo •< -d
(1J o (U T)
9 oi bO E
•H £ fc 0
t/) UJ H K U 0. 0 s
J o 0.
z IÜ o
Q
UJ 1/) x Q bl 3 •- X * _l 2 LZ
\ 1 go —
lu X. xT l ^ ^ x x. ■ •^ X. i \ ■ s ^ io ^v \ ̂ ^^^^ Q
1 \ X5^
N^ ̂ >>
/
o o
I C)
-p
•5!
(M
u o
A $ ft m w 4) fn -P M
tJ H c "♦H fi ir-i
O cd P < 5 C (U 0) K o ü m 0 w aJ ß z •H <H (U z < S^10 2 ft m a
O -d o H
0) •H
• S t^ <aj -d
0) (U Tf b a 3 OJ bD
ISd 'Clo - '^3) 3DN3a3JJia SS3diS TVdlDNIdd
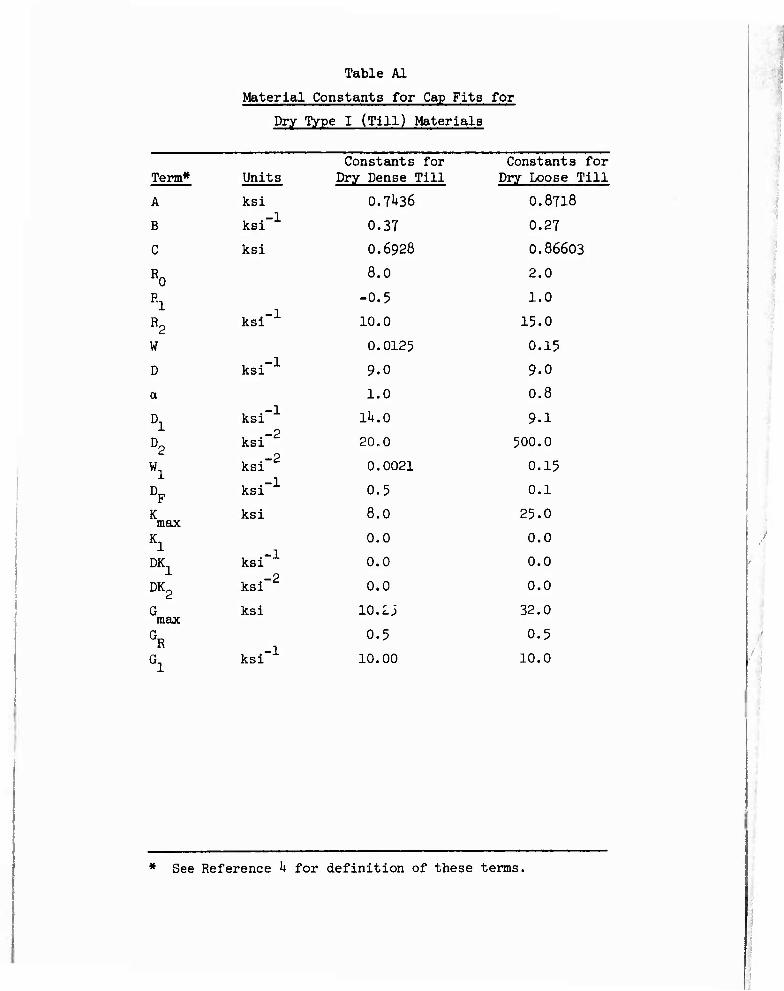
Tatle Al
Material Constants for Cap Fits for
Dry Type I (Till) Materials
Constants for Constants for Term* Units Dry Dense Till Dry Loose Till
A ksi 0.lh36 0.8T18
B ksi"1 0.3T 0.2T
C ksi 0.6928 0.86603
R0 8.0 2.0
Rl R2 ksi"1
-0.5
10.0
1.0
15.0
W 0.0125 0.15
D ksi"1 9.0 9.0
a 1.0 0.8
Dl D2 Wl DF
ksi
ksi"2
ksi"2
ksi
lk.0
20.0
0.0021
0.5
9.1
500.0
0.15
0.1
K max ksi 8.0 25.0
Kl DK1 DK2
ksi"1
ksi"2
0.0
0.0
0.0
0.0
0.0
0.0
G max
ksi 10.1; 32.0
GR Gl
ksi'1 0.5
10.00
0.5
10.0
* See Reference k for definition of these terms.
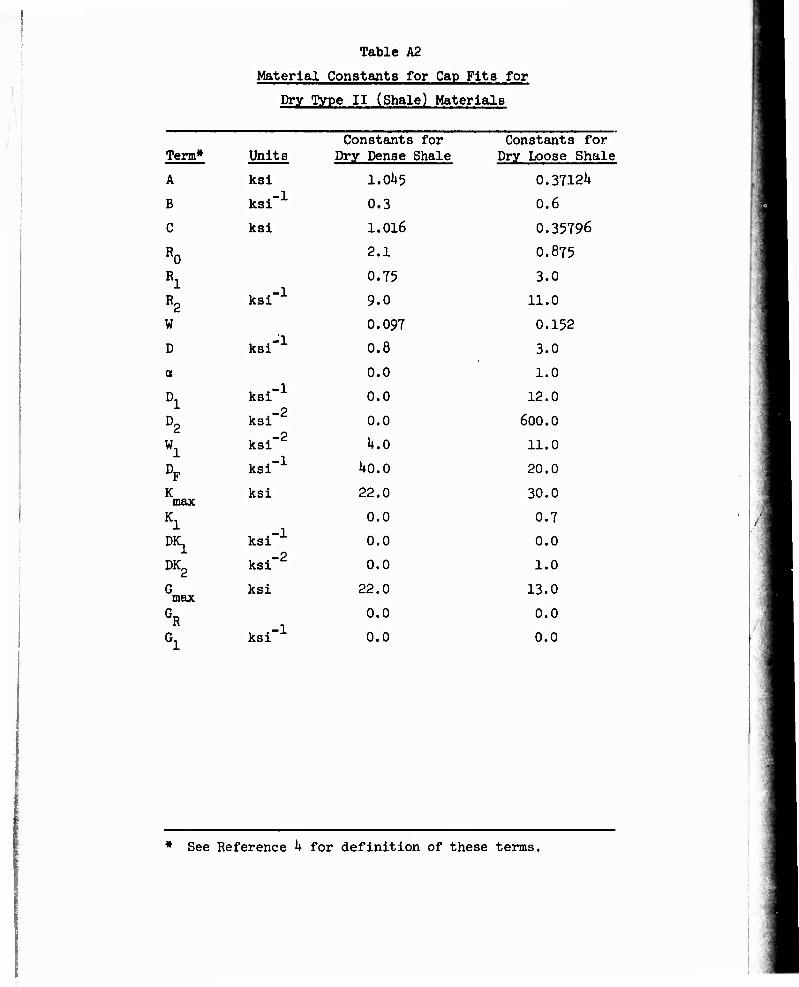
Table A2
Material Constants for Cap Fits for
Dry Type II (Shale) Materials
Constants for Constants for Term* Units Dry Dense Shale Dry Loose Shale
A ksi I.0U5 0.3712U
B ksi'1 0.3 0.6
C ksi 1.016 0.35796
Ro 2.1 0.875
Rl R2
ksi"1 0.75
9.0
3.0
11.0
W 0.097 0.152
D ksi'1 0.8 3.0
a 0.0 1.0
Dl D2 Wl
ksi"1
ksi"2
ksi"2
ksi"1
0.0
0.0
k.O
12.0
600.0
11.0
DF ho.O 20.0
K max
ksi 22.0 30.0
Kl 0.0 0.7
DK1 ksi"1 0.0 0.0
DK2 ksi"2 0.0 1.0
G max
ksi 22.0 13.0
GR G, ksi"1
0.0
0.0
0.0
0.0
* See Reference k for definition of these terms.
APPENDIX B: PROBLEMS ENCOUNTERED WITH LOOSE
BACKFILL CALCULATIONS
1. No problems were encountered in conducting the dense till and
shale calculations. However, when the loose shale calculation was per-
formed using the same grid spacing as was used for the dense shale cal-
culation, large oscillations resulted in some of the stress and
acceleration time history output. This was traced to the combination
of the exaggerated "S" shaped nature of the UX stress-strain curve (see
Figure 2 of the main text of this report) and the coarse grid in the
backfill and the low loading moduli inherent in parts of the "S" shaped
curve. The possibilities for overcoming this problem are to reduce the
grid spacing or to introduce artificial viscosity. Although the best
way to solve the problem is to reduce the grid size, this alternative
was determined to be too costly in terms of money and computer time for
the present investigation. Therefore, the artificial viscosity route
was pursued.
2. Various methods of achieving damping by introducing artifi-
cial viscosity and various percentages of damping were used in ID
wave propagation calculations for the loose shale material. The artifi-
cial viscosity used with this program was operated by adding increments
of stress to the existing o.. . The stress increments were computed
as follows:
aij = "T^ + Vij for i = J (Ba)
o.j = 0 for i 9« J (B2)
where
a. = components of the total stress increment tensor due to ij -, .
damping
Cp = damping coefficient
e., = sum of the incremental normal strains = incremental change in volumetric strain
Bl
e = components of the deviatoric strain increment tensor
i = index*
J = index
For the plane strain problem solved the new radial a , vertical a rr zz and tangential o.. stresses after adding the increment of stresses
calculated by Equation Bl become:
a =o ,, + o (B3) rr new rr old rr
a = a n, + a (EM zz new zz old zz
0ee new = "ee old + °ee (B5)
These new stress components are used to compute a new internal force
vector for the ne:;t time step and, thus, an artificial viscosity effect
is introduced. The final value of C- used with the loose shale cal-
culations was 10,000 psi.
3. The basic problem encountered with the use of artificial
viscosity to damp out oscillations was that the material properties
were, in effect, changed by the introduction of the additional terms
to the equations of motion. The UX stress-strain curve for the loose
shale backfill became less compressible and the stress path was altered
so that, for the same value of mean normal pressure, a larger stress
difference was obtained for the stress path for damped conditions than
was obtained for undamped conditions. After a great many trials, an
optimum amount of damping was determined which would alter the material
properties the least possible amount and would also cut the stress os-
cillations to a tolerable level. An additional loose shale 2D calcula-
tion was then conducted which was identical to the undamped calculation
except for the added artificial viscosity.
k. In Figure Bl, the output vertical stress time histories at
* Indices take on the value of 1, 2, or 3. A repeated index is to be summed out over its range.
B2
the 1.25-ft depth from ID loose shale calculations with and without
artificial viscosity are compared to a vertical stress time history
for the same depth obtained by the method of characteristics (i.e., by
assuming that the material had a linear stress-strain relation and that
its constrained modulus was equal to the actual secant loading modulus
to peak stress). As can be seen in Figure Bl, in the stress time
history for the undamped calculation, the maximum and minimum stresses
were 80 and -3 psi, respectively, while the maximum and minimum stresses
in the damped stress time history were TO and ih psi, respectively.
It can also be seen that the oscillations appear to be decaying at a
more rapid rate in the damped stress time history and is closer to the
relation obtained by the method of characteristics.
5. The apparent variations in material properties caused by the
artificial viscosity are depicted in Figures B2 and B3. In Figure B2
the cap fit to the UX vertical stress o versus vertical strain e z z curve is compared with the a versus e relations derived from z» z output from the loose shale ID wave propagation calculations with and
without artificial viscosity. The a versus e relation from the J z z undamped calculation was identical to the cap fit, but as can be seen,
the loading a versus e relation from the damped calculation is z z less compressible than the o versus e fit.* The cap model fit
z z to the loose shale stress path is compared with the output stress paths
from the same calculations in Figure B3. The stress path from the
undamped calculation is identical to the cap fit. However, the loading
stress path from the damped calculation depicts larger stress differ-
ences than does the cap fit for the same values of mean normal pressure.
The unloading stress paths are identical for all cases (see the footnote
at the bottom of the page).
6. Comparison of the structure response in the damped and un-
damped loose shale 2D calculations showed only small differences between
* Artificial viscosity was only applied during loading and reloading phases; therefore, the unloading curves are identical in all cases. The same was true in the case of the large 2D calculation in loose shale.
B3
the two ^ets of results as has been illustrated in many of the figures
accompanying the main text. Therefore, only an undamped 2D calculation
was conducted for the loose till case.
Bk
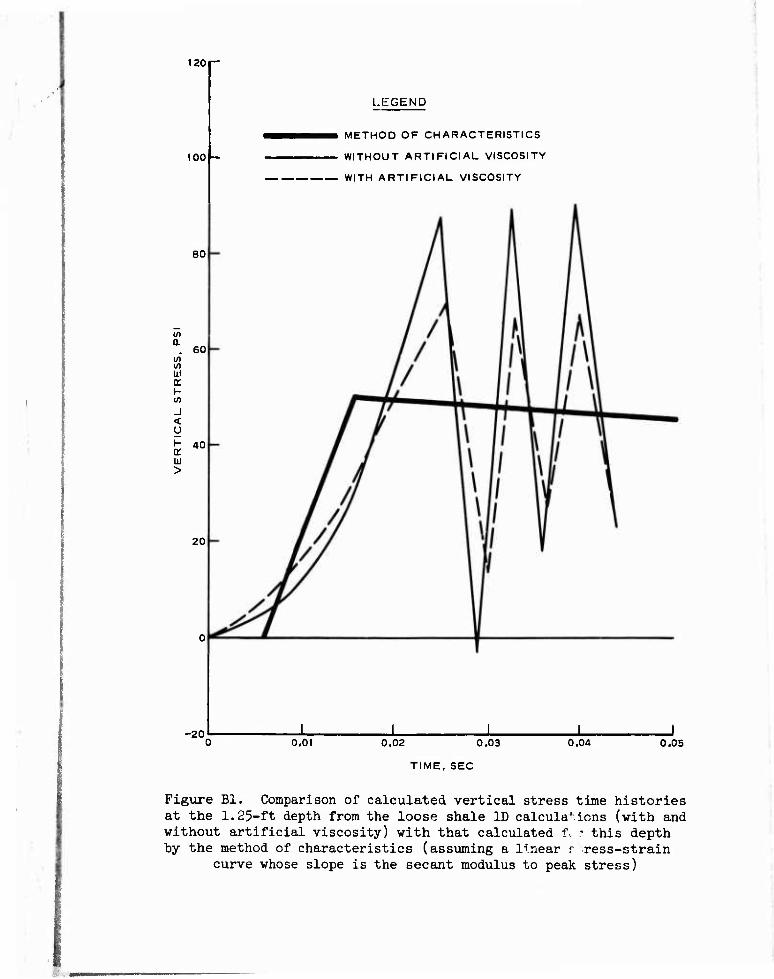
120
100
a. ui in U.I a. H
J < U h a: LJ >
80
60
40
20
-20
LEGEND
METHOD OF CHARACTERISTICS
WITHOUT ARTIFICIAL VISCOSITY
WITH ARTIFICIAL VISCOSITY
0.01 0.02 0.03 0.04 0.05
TIME, SEC
Figure Bl. Comparison of calculated vertical stress time histories at the 1.25-ft depth from the loose shale ID calculations (with and without artificial viscosity) with that calculated f. * this depth by the method of characteristics (assuming a linear r ress-strain
curve whose slope is the secant modulus to peak stress)
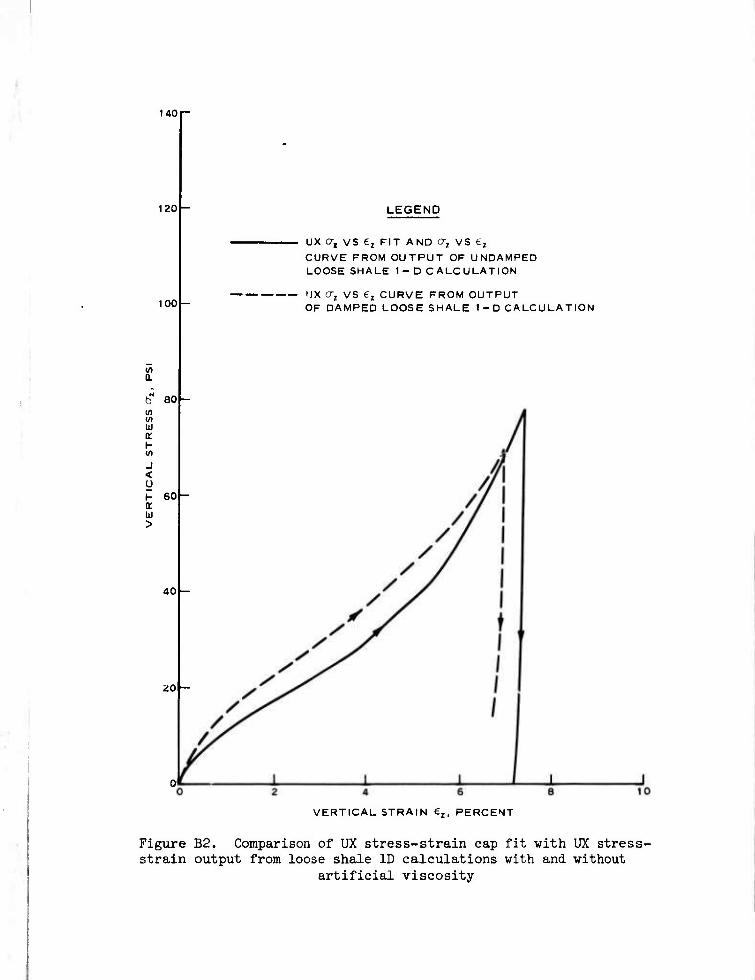
1401-
120
100
in a
b 80
m \xi a. 10 J < u
60
40
20 —
LEGEND
UX CT, VS e2 FIT AND crz VS ez
CURVE FROM OUTPUT OF UNDAMPED LOOSE SHALE 1 - D C ALC ULATION
ux at vs ez CURVE FROM OUTPUT OF DAMPED LOOSE SHALE 1-D CALCULATION
4 6
VERTICAL STRAIN €1, PERCENT
Figure B2. Comparison of UX stress-strain cap fit with UX stress- strain output from loose shale ID calculations with and without
artificial viscosity

70 r-
60
« 50
U! U 2 UJ a UJ u. u.
V) W) UJ ir h w J < Q.
U Z
(£ Q.
LEGEND
STRESS PATH FROM FIT AND UNDAMPED LOOSE SHALE 1 -D CALCULATION
STRESS PATH FROM DAMPED LOOSE SHALE 1- D CALCULATION
Oa + za, MEAN NORMAL STRESS p = , PSI
Figure B3. Comparison of UX stress-path cap fit with stress- path output from loose shale ID calculations with and without
artificial viscosity
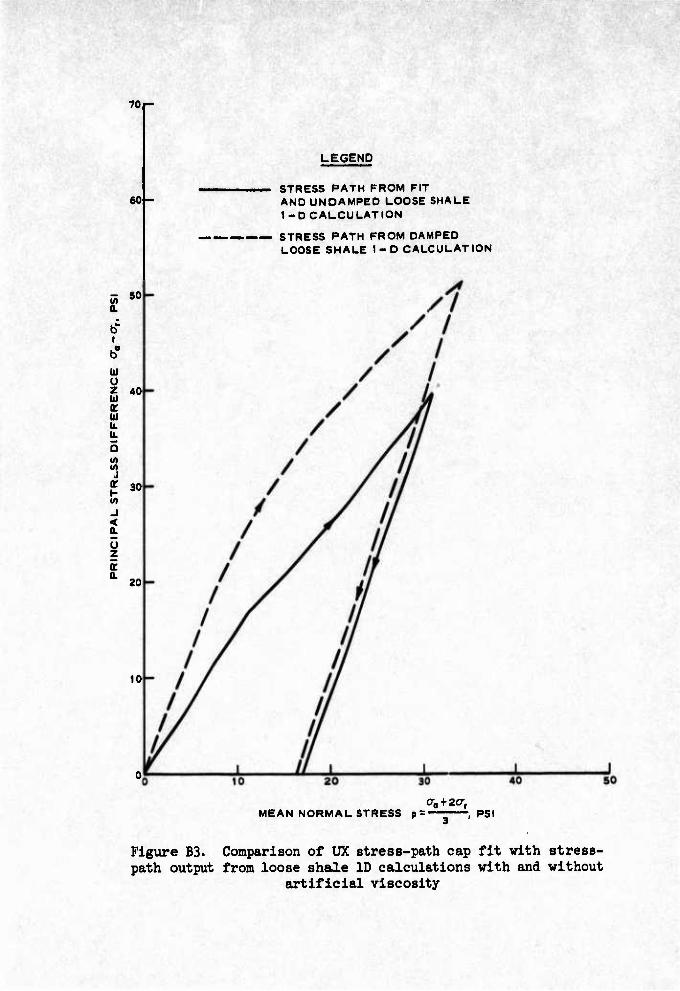
70|-
60-
- SO
I
111 U Z 40 bi E uu Ü. It,
in in i
a m
30
J < 0. Ü z E a.
20
10
LEGEND
STRESS PATH FROM FIT AND UNDAMPED LOOSE SHALE 1-D CALCULATION
STRESS PATH FROM DAMPED LOOSE SHALE 1-D CALCULATION
MEAN NORMAL STRESS p: (ra + 2af
- PSI
Figure B3. Comparison of UX stress-path cap fit with stress- path output from loose shale ID calculations with and without
artificial viscosity
S Llbr«y of Congreee fonnat U reproduced below.
Wlndham, Jon EnriqiK' Effect of backfll] compaction on Jesign criteria for
hardened facilities: results of soil-structure inter- action calculations for dry types I and H liackfili ma- terials, by Jon E. Wlndham. Vicksburg, 0. S. Army Engineer Waterways Experiment Si at ion, 1976.
1 v. (various paglngs) illus. 27 cm. (II. S. Water- ways Experiment Station. Technical report S-76-A)
Prepared for Office, Chief of Engineers, U. K. Army. Project AT60, Task 01, Work Unil: 001. Includes bibliography.
1. Backfill». 2. Compaction (Soils). 3. Constitutive properties. 4. Dynamic loads. 5. Finite element method. 6. Protective structures. 7. Soil-structure interaction. 8. Underground structures. I. I!. S. Array. Corps of Engineers (Series: U. S. Waterways Experiment Sta- tion, Vicksburg, Miss. Technical report S-76-A) TA7.W34 no.S-76~4