Embed Size (px)
Citation preview
Assessment of the oxygen consumption in the backfill
Geochemical modelling in a saturated backfill
Fidel Grandia, Cristina Domènech,
David Arcos, Lara Duro
Enviros, Spain
November 2006
R-06-106
Svensk Kärnbränslehantering ABSwedish Nuclear Fueland Waste Management CoBox 5864SE-102 40 Stockholm Sweden Tel 08-459 84 00 +46 8 459 84 00Fax 08-661 57 19 +46 8 661 57 19
CM
Gru
ppen
AB
, Bro
mm
a, 2
006
Assessment of the oxygen consumption in the backfill
Geochemical modelling in a saturated backfill
Fidel Grandia, Cristina Domènech,
David Arcos, Lara Duro
Enviros, Spain
November 2006
ISSN 1402-3091
SKB Rapport R-06-106
This report concerns a study which was conducted for SKB. The conclusions and viewpoints presented in the report are those of the authors and do not necessarily coincide with those of the client.
A pdf version of this document can be downloaded from www.skb.se
�
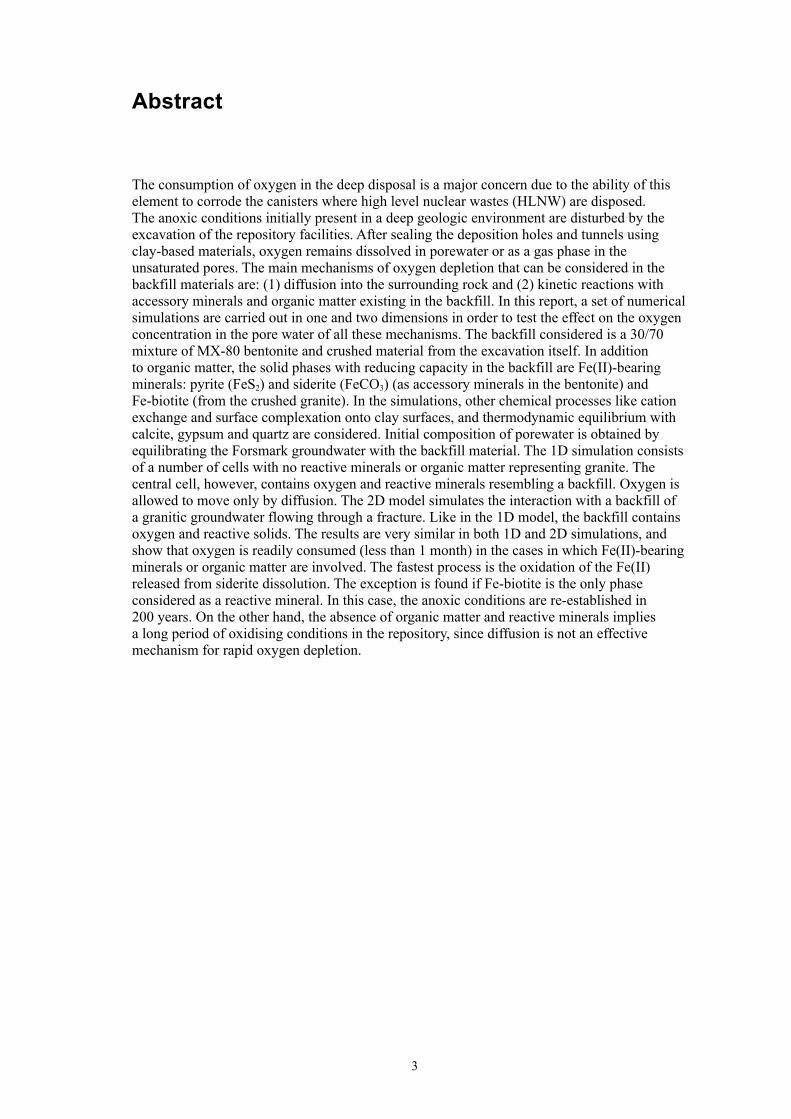
Abstract
The consumption of oxygen in the deep disposal is a major concern due to the ability of this element to corrode the canisters where high level nuclear wastes (HLNW) are disposed. The anoxic conditions initially present in a deep geologic environment are disturbed by the excavation of the repository facilities. After sealing the deposition holes and tunnels using clay-based materials, oxygen remains dissolved in porewater or as a gas phase in the unsaturated pores. The main mechanisms of oxygen depletion that can be considered in the backfill materials are: (1) diffusion into the surrounding rock and (2) kinetic reactions with accessory minerals and organic matter existing in the backfill. In this report, a set of numerical simulations are carried out in one and two dimensions in order to test the effect on the oxygen concentration in the pore water of all these mechanisms. The backfill considered is a �0/70 mixture of MX-80 bentonite and crushed material from the excavation itself. In addition to organic matter, the solid phases with reducing capacity in the backfill are Fe(II)-bearing minerals: pyrite (FeS2) and siderite (FeCO�) (as accessory minerals in the bentonite) and Fe-biotite (from the crushed granite). In the simulations, other chemical processes like cation exchange and surface complexation onto clay surfaces, and thermodynamic equilibrium with calcite, gypsum and quartz are considered. Initial composition of porewater is obtained by equilibrating the Forsmark groundwater with the backfill material. The 1D simulation consists of a number of cells with no reactive minerals or organic matter representing granite. The central cell, however, contains oxygen and reactive minerals resembling a backfill. Oxygen is allowed to move only by diffusion. The 2D model simulates the interaction with a backfill of a granitic groundwater flowing through a fracture. Like in the 1D model, the backfill contains oxygen and reactive solids. The results are very similar in both 1D and 2D simulations, and show that oxygen is readily consumed (less than 1 month) in the cases in which Fe(II)-bearing minerals or organic matter are involved. The fastest process is the oxidation of the Fe(II) released from siderite dissolution. The exception is found if Fe-biotite is the only phase considered as a reactive mineral. In this case, the anoxic conditions are re-established in 200 years. On the other hand, the absence of organic matter and reactive minerals implies a long period of oxidising conditions in the repository, since diffusion is not an effective mechanism for rapid oxygen depletion.
�
Contents
1 Backgroundandobjectives 7
2 ConceptualmodelofO2consumptioninthebackfill 92.1 Introduction 92.2 Processes of oxygen consumption 9
2.2.1 Pyrite dissolution 102.2.2 Siderite dissolution 112.2.� Oxygen consumption by microbial activity 122.2.4 Relative relevance of the processes of oxygen consumption
in the backfill 12
3 Numericalmodelling 1��.1 Introduction 1��.2 1-D model 1�
�.2.1 Code capabilities 16�.2.2 Grid and time discretisation 16�.2.� Hydrodynamic properties 17�.2.4 Chemical properties 17�.2.� Boundary and initial conditions 19�.2.6 Cases studied and sensitivity analysis 19�.2.7 Results and discussion 20
�.� 2-D Model 2��.�.1 Code capabilities 24�.�.2 Grid and time discretisation 24�.�.� Hydrodynamic properties 2��.�.4 Chemical properties 26�.�.� Boundary and initial conditions 27�.�.6 Sensitivity analysis 27�.�.7 Results and discussion 28
4 Finalremarksandconclusions ��
5 References ��
AppendixA Database for minerals and exchange reactions �7
7
1 Backgroundandobjectives
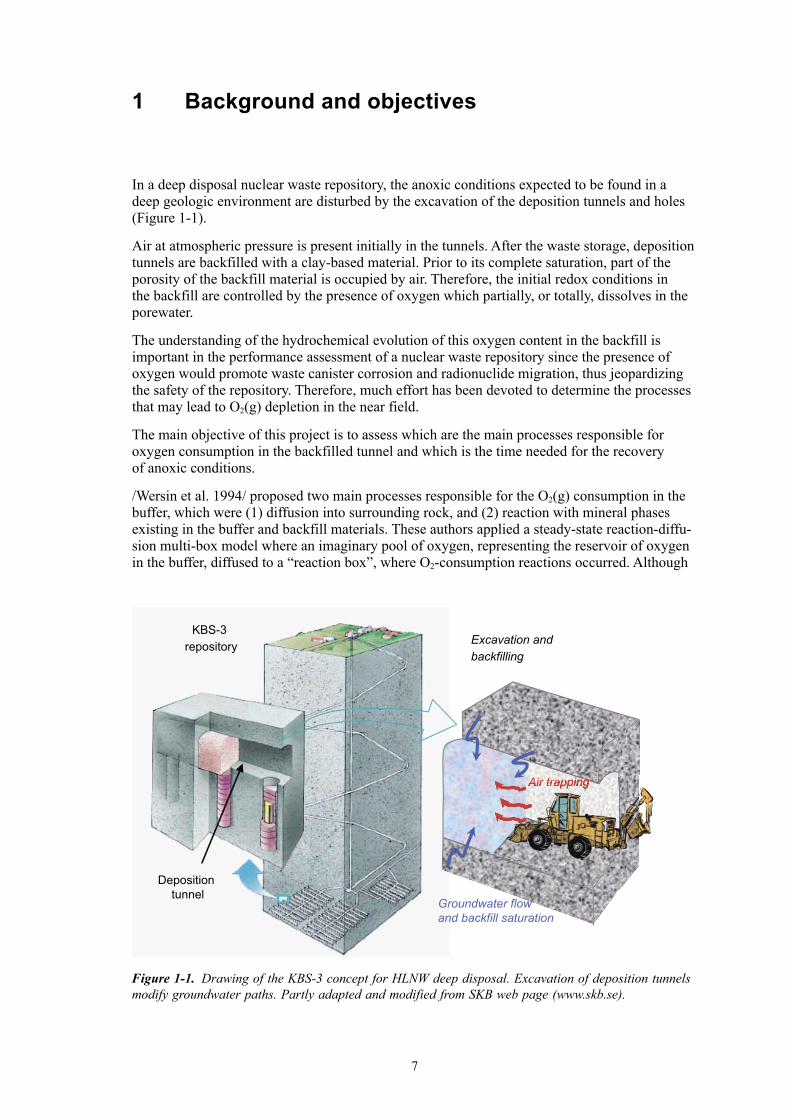
In a deep disposal nuclear waste repository, the anoxic conditions expected to be found in a deep geologic environment are disturbed by the excavation of the deposition tunnels and holes (Figure 1-1).
Air at atmospheric pressure is present initially in the tunnels. After the waste storage, deposition tunnels are backfilled with a clay-based material. Prior to its complete saturation, part of the porosity of the backfill material is occupied by air. Therefore, the initial redox conditions in the backfill are controlled by the presence of oxygen which partially, or totally, dissolves in the porewater.
The understanding of the hydrochemical evolution of this oxygen content in the backfill is important in the performance assessment of a nuclear waste repository since the presence of oxygen would promote waste canister corrosion and radionuclide migration, thus jeopardizing the safety of the repository. Therefore, much effort has been devoted to determine the processes that may lead to O2(g) depletion in the near field.
The main objective of this project is to assess which are the main processes responsible for oxygen consumption in the backfilled tunnel and which is the time needed for the recovery of anoxic conditions.
/Wersin et al. 1994/ proposed two main processes responsible for the O2(g) consumption in the buffer, which were (1) diffusion into surrounding rock, and (2) reaction with mineral phases existing in the buffer and backfill materials. These authors applied a steady-state reaction-diffu-sion multi-box model where an imaginary pool of oxygen, representing the reservoir of oxygen in the buffer, diffused to a “reaction box”, where O2-consumption reactions occurred. Although
Figure 1-1. Drawing of the KBS-3 concept for HLNW deep disposal. Excavation of deposition tunnels modify groundwater paths. Partly adapted and modified from SKB web page (www.skb.se).
KBS-3 repository Excavation and
backfilling
Air trapping
Groundwater flow and backfill saturation
Deposition tunnel
8
they acknowledged that the main oxygen depletion reactions were i) pyrite oxidation, ii) oxida-tion of other Fe(II) materials, iii) oxidation of Cu from the canister and iv) oxidation of organic matter, due to the uncertainties in most of the parameters involved, Wersin et al. assumed that only pyrite was involved in the process of oxygen consumption. The results of their calculations indicated that more than a 90% of the oxygen disappearance from the buffer was due to pyrite oxidation, while diffusion processes accounted only for a maximum of the 10% of the oxygen efflux. They predicted that anoxic conditions would be re-established in the buffer after a period ranging between 7 and 290 years, depending on the value taken for the most uncertain parameter: the pyrite reactive surface area.
/Malmström et al. 199�/ extended the analysis of oxygen consumption by evaluating the ReDucing Capacity (RDC) of granitic rocks hosting the repository. They studied the kinetics of dissolution of Fe(II)-bearing silicate minerals (biotite and chlorite), and presented a simple calculation of the time needed for oxygen consumption in fractured granite due to the oxidation of the Fe(II) contained in the silicates. The results indicated O2 consumption times in the range from �0 to �00 years, depending on the mineral and on whether oxygen was considered to the depleted by direct consumption on the mineral surface or by oxidation of the Fe(II) previously released from the mineral.
More recently, in the frame of the Microbe-REX experiment, /Kotelnikova and Pedersen 1998, 2000/ tried to quantify the effect of microorganisms in the oxygen consumption by means of experimental and numerical approaches. They found that these organisms greatly contributed to oxygen depletion, being the predicted times needed for the consumption of �00 µM of dissolved oxygen in the range from 9 days to 4 years.
Also in the REX project, the in situ experiment studied the oxygen consumption in a granite fracture that contained Fe(II)-bearing minerals (pyrite, chlorite and clays). The results indicated that the oxygen uptake was complete in a few days, and that microbial processes were a substantial contribution to oxygen depletion /Puigdomènech et al. 2001/.
The present study deals with a system slightly different from the ones presented above. We will focus our assessment on the consumption in the backfill, assuming that the backfill is a �0/70 mixture of bentonite with excavation material. /Wersin et al. 1994/ calculations considered the buffer, that is, bentonite, whereas /Malmström et al. 199�/ considered the fractured media.
In this work, thus, we will consider the mineralogy of the buffer plus the mineralogy of the crushed host-rock. We will also assume both, diffusion and advection occurring in the system, given that the porosity and the permeability of the bentonite-crushed granite backfill concept permit both types of processes.
The relevance of the processes of oxygen consumption above mentioned is evaluated from a conceptual perspective in Chapter 2. In Chapter �, the conceptual model is implemented in a reactive transport model, initially in one dimension (Section �.2), in order to obtain preliminary results aimed at developing a 2-D (Section �.�) more realistic numerical simulations. The implications for the Performance Assessment of the repository are discussed in Chapter 4.
9
2 ConceptualmodelofO2consumptioninthebackfill
2.1 IntroductionIn the KBS-� concept of storage of HLN waste, deposition tunnels are thought to be backfilled either by a mixture of 70% crushed rock derived from the excavation itself and �0% bentonite clay (Wyoming-type MX-80 or Milos-type Deponit CA-N) or by 100% of Friedland-type clay /SKB 2004/. Although it is not decided yet, it is likely that other cavities in the repository will also be backfilled with the same materials. After the closure of the deposition tunnels, the regional groundwater saturates the backfill and equilibrates with the remaining air trapped in the pores of the backfill material. In the �0/70 bentonite-crushed rock mixture, air occupies a 42% of the porosity before saturation /Börgesson et al. 2006/, and a 27% in the case of Friedland clay /SKB 2004/. This air is progressively dissolved into the groundwater as the saturation proceeds. The time for complete water saturation would range from 100–1�0 days in the case of the �0/70 mixture, to 1,000–1,700 days in the case of the Friedland clay /Börgesson et al. 2006/.
Due to the very slow advective flow in the backfill, the migration of dissolved oxygen through the backfill occurs predominantly by diffusion. The relatively low diffusion coefficient of dissolved O2 in bentonite porewater, from 1·10 –10 to 1·10–12 m2·s –1 for dry densities from 1,000 to 2,000 kg·m –� /Manaka et al. 2000/, makes the depletion of dissolved oxygen in the backfill to be very slow, leading to a long term prevalence of oxidant conditions. On the other hand bentonite clay typically contains impurities that may act as reducing agents (electron donors), consuming the dissolved oxygen and lowering significantly the Eh of the porewater. Assuming that the redox state of the system will be mainly controlled by the Fe(II)/Fe(III) pair, the impurities potentially affecting the oxidation state of the system are iron sulphides (i.e. pyrite) and iron carbonates (i.e., siderite), which are typically found in concentrations lower than 1 wt%. Other Fe(II)-bearing minerals that may play a significant role, especially in absence of sulphides and carbonates, are silicates such as chlorite or biotite.
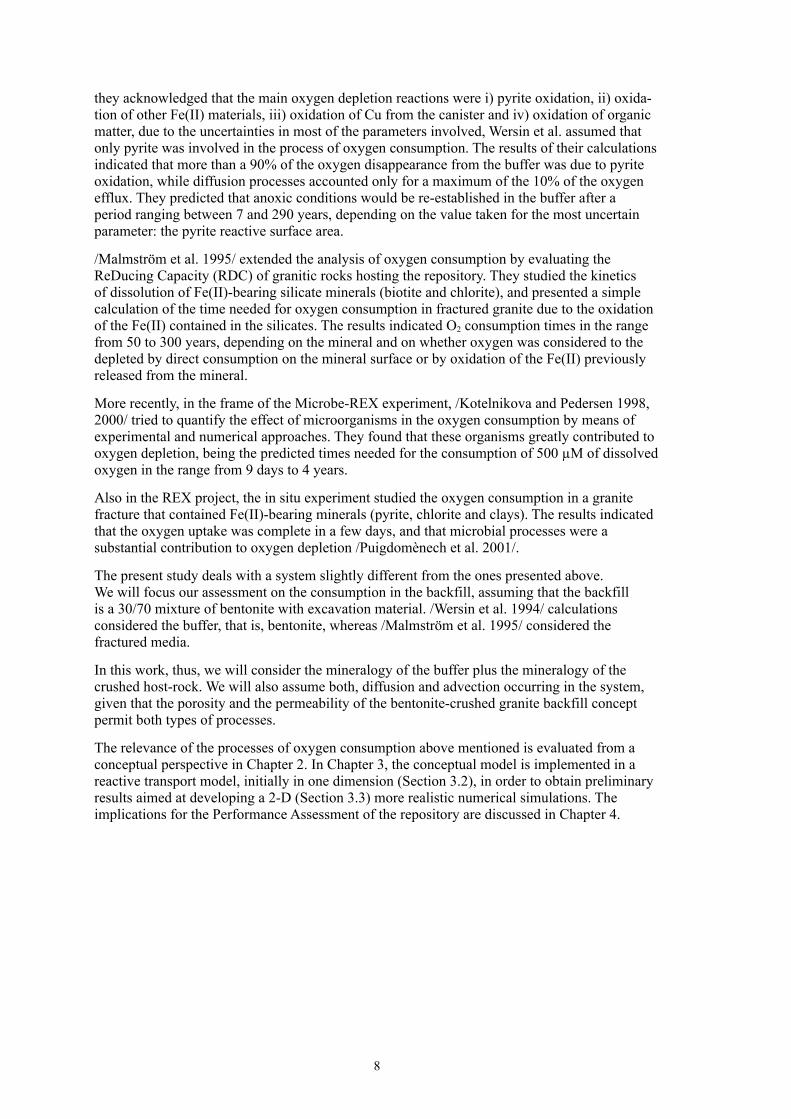
Besides redox reactions, other geochemical processes are expected to occur in the backfill system, such as calcite and gypsum equilibria, and cationic exchange and protonation/deprotonation reactions onto montmorillonite surfaces. Figure 2-1 shows schematically the main chemical processes expected to occur in the backfill system.
2.2 ProcessesofoxygenconsumptionRedox processes, as expected from heterogeneous electron transfer reactions, are not instantane-ous and are described by kinetic equations. The following processes can be considered as main contributors to the ReDucing Capacity (RDC) of our system:
1/ Pyrite dissolution
2/ Siderite dissolution
�/ Microbial activity
The kinetic constraints of the former processes are briefly discussed below.
10
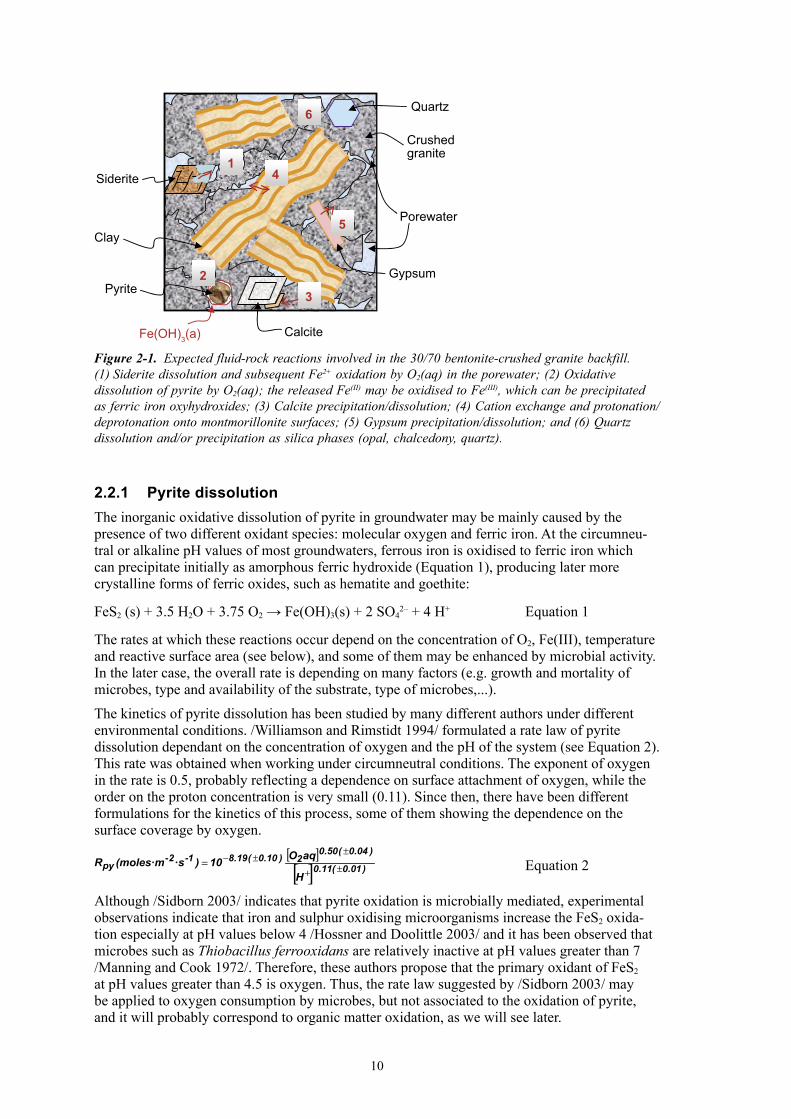
2.2.1 PyritedissolutionThe inorganic oxidative dissolution of pyrite in groundwater may be mainly caused by the presence of two different oxidant species: molecular oxygen and ferric iron. At the circumneu-tral or alkaline pH values of most groundwaters, ferrous iron is oxidised to ferric iron which can precipitate initially as amorphous ferric hydroxide (Equation 1), producing later more crystalline forms of ferric oxides, such as hematite and goethite:
FeS2 (s) + �.� H2O + �.7� O2 → Fe(OH)�(s) + 2 SO42– + 4 H+ Equation 1
The rates at which these reactions occur depend on the concentration of O2, Fe(III), temperature and reactive surface area (see below), and some of them may be enhanced by microbial activity. In the later case, the overall rate is depending on many factors (e.g. growth and mortality of microbes, type and availability of the substrate, type of microbes,...).
The kinetics of pyrite dissolution has been studied by many different authors under different environmental conditions. /Williamson and Rimstidt 1994/ formulated a rate law of pyrite dissolution dependant on the concentration of oxygen and the pH of the system (see Equation 2). This rate was obtained when working under circumneutral conditions. The exponent of oxygen in the rate is 0.�, probably reflecting a dependence on surface attachment of oxygen, while the order on the proton concentration is very small (0.11). Since then, there have been different formulations for the kinetics of this process, some of them showing the dependence on the surface coverage by oxygen.
[ ][ ] ±+
±±−= Equation 2
Although /Sidborn 200�/ indicates that pyrite oxidation is microbially mediated, experimental observations indicate that iron and sulphur oxidising microorganisms increase the FeS2 oxida-tion especially at pH values below 4 /Hossner and Doolittle 200�/ and it has been observed that microbes such as Thiobacillus ferrooxidans are relatively inactive at pH values greater than 7 /Manning and Cook 1972/. Therefore, these authors propose that the primary oxidant of FeS2 at pH values greater than 4.� is oxygen. Thus, the rate law suggested by /Sidborn 200�/ may be applied to oxygen consumption by microbes, but not associated to the oxidation of pyrite, and it will probably correspond to organic matter oxidation, as we will see later.
Figure 2-1. Expected fluid-rock reactions involved in the 30/70 bentonite-crushed granite backfill. (1) Siderite dissolution and subsequent Fe2+ oxidation by O2(aq) in the porewater; (2) Oxidative dissolution of pyrite by O2(aq); the released Fe(II) may be oxidised to Fe(III), which can be precipitated as ferric iron oxyhydroxides; (3) Calcite precipitation/dissolution; (4) Cation exchange and protonation/ deprotonation onto montmorillonite surfaces; (5) Gypsum precipitation/dissolution; and (6) Quartz dissolution and/or precipitation as silica phases (opal, chalcedony, quartz).
Siderite
Calcite
Clay
Pyrite
Quartz
Gypsum
Porewater
14
5
6
23
Fe(OH)3(a)
Crushed granite
11
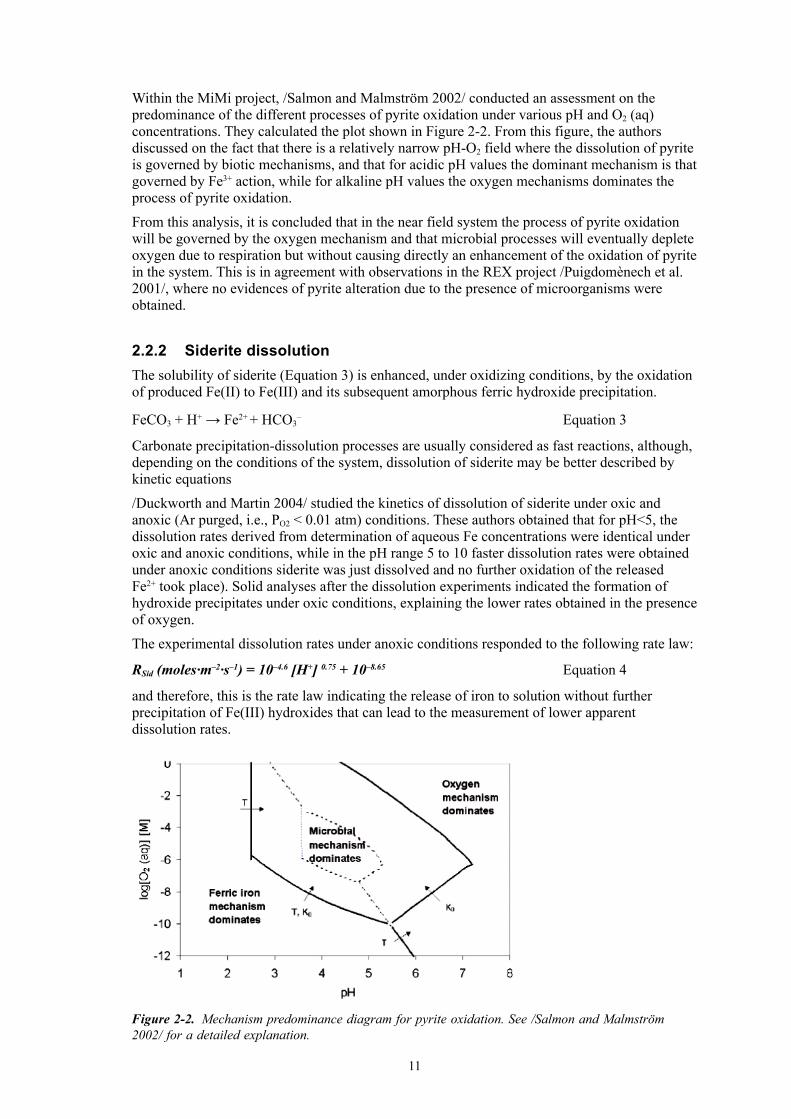
Within the MiMi project, /Salmon and Malmström 2002/ conducted an assessment on the predominance of the different processes of pyrite oxidation under various pH and O2 (aq) concentrations. They calculated the plot shown in Figure 2-2. From this figure, the authors discussed on the fact that there is a relatively narrow pH-O2 field where the dissolution of pyrite is governed by biotic mechanisms, and that for acidic pH values the dominant mechanism is that governed by Fe�+ action, while for alkaline pH values the oxygen mechanisms dominates the process of pyrite oxidation.
From this analysis, it is concluded that in the near field system the process of pyrite oxidation will be governed by the oxygen mechanism and that microbial processes will eventually deplete oxygen due to respiration but without causing directly an enhancement of the oxidation of pyrite in the system. This is in agreement with observations in the REX project /Puigdomènech et al. 2001/, where no evidences of pyrite alteration due to the presence of microorganisms were obtained.
2.2.2 SideritedissolutionThe solubility of siderite (Equation �) is enhanced, under oxidizing conditions, by the oxidation of produced Fe(II) to Fe(III) and its subsequent amorphous ferric hydroxide precipitation.
FeCO� + H+ → Fe2+ + HCO�– Equation �
Carbonate precipitation-dissolution processes are usually considered as fast reactions, although, depending on the conditions of the system, dissolution of siderite may be better described by kinetic equations
/Duckworth and Martin 2004/ studied the kinetics of dissolution of siderite under oxic and anoxic (Ar purged, i.e., PO2 < 0.01 atm) conditions. These authors obtained that for pH<�, the dissolution rates derived from determination of aqueous Fe concentrations were identical under oxic and anoxic conditions, while in the pH range � to 10 faster dissolution rates were obtained under anoxic conditions siderite was just dissolved and no further oxidation of the released Fe2+ took place). Solid analyses after the dissolution experiments indicated the formation of hydroxide precipitates under oxic conditions, explaining the lower rates obtained in the presence of oxygen.
The experimental dissolution rates under anoxic conditions responded to the following rate law:
RSid (moles·m–2·s–1) = 10–4.6 [H+] 0.75 + 10–8.65 Equation 4
and therefore, this is the rate law indicating the release of iron to solution without further precipitation of Fe(III) hydroxides that can lead to the measurement of lower apparent dissolution rates.
Figure 2-2. Mechanism predominance diagram for pyrite oxidation. See /Salmon and Malmström 2002/ for a detailed explanation.
12
In the system here studied, it will be considered that homogeneous oxidation of Fe(II) to Fe(III) is a fast process, considered to be at equilibrium and, therefore, we will implement Equation 4 in the system as the rate at which Fe2+ is dissolved from siderite. The associated oxygen consumption will, thus, occur at the same rate as the release of Fe2+. For a complete presentation of the results underlying this reasoning, the reader is referred to the original work of /Duckworth and Martin 2004/.
2.2.3 OxygenconsumptionbymicrobialactivityMicrobial respiration involves the oxidation of organic matter by different oxidants, process by which microbes obtain energy for survival. In the present system, we are mainly interested in aerobic microbial respiration, where the electron acceptor responsible for the oxidation of organic matter is oxygen.
From the studies conducted in the deep groundwaters at Äspö, it seems that the major reductants that microbes may use to consume oxygen are CH4 and organic carbon. From the REX experi-ment, it was observed that the rate of dissolved O2 consumption in the presence of microbes followed a typical Monod expression (see Equation �)
2O2O
OOCHm
1-3-O CKc
CS·V)ddm(molesR 2
22 +=⋅ Equation �
where Vm·SCH2O stands for the maximum rate at a given biomass concentration and KCO2 is the half saturation constant for oxygen.
Values reported within the REX project /Puigdomènech et al. 2001/ for these parameters are Vm·SCH2O = � to 90 µM/day and KCO2 = 200 to �00 µM. These values were obtained for a surface to volume ratio of 0.6 m2·dm –� in the REX experiment. If we consider that the more active microbes are those attached to surfaces, this would imply that the rate of oxygen consumption in units of moles·m –2·day–1 would be:
2O6
O2
3
36-1-2-
OC10)·300 to 200(
C
m 0.6dm 1
·daydmmoles90)·10 to 5()·dm(molesR 2
2 +=⋅ − Equation 6
which, in order to be applied to a different system, needs to be corrected with the assumed coverage of surface area by microbes, if it is considered that only microbes attached to surfaces are active.
Given the lack of information on the amount of methanotrophs, hydrogen consuming bacteria and other microbes contributing to aerobic respiration, it is assumed that the rate of oxygen depletion in the system responds to a steady state in terms of growth and mortality and we will integrate everything in a dump CH2O as generic organic matter to oxidize. We will assume that microbial aerobic respiration is not limited by the concentration of organic matter, and that the reaction for oxygen consumption is:
CH2O + O2 = HCO�– + H+ Equation 7
2.2.4 Relativerelevanceoftheprocessesofoxygenconsumptioninthebackfill
In order to assess the relative relevance of the different processes of oxygen consumption presented above, we can solve analytically the three equations Equation 6, Equation 4 and Equation 2 for the evolution of the concentration of oxygen in the system, by considering that in the case of the oxygen consumption by microbial respiration, the stoichiometry of the process is 1, in the case of siderite dissolution, 1 mole of siderite dissolved would consume 0.2� moles of oxygen for the precipitation of Fe(OH)�(s) from Fe2+ and in the case of pyrite oxidation, 1 mole of pyrite dissolved would consume 1�/4 of oxygen for the oxidation of sulphide to sulphate and of Fe2+ to Fe(OH)�(s).
The solution will be only valid for a closed system, with neither diffusion nor advection, and a fixed initial oxygen concentration. No growth or mortality of bacteria will be considered.
1�
The equations to solve will then be:
[ ] [ ][ ] V
SA
HO
415
dtOd pyrite0.10)8.19(2
)01.0(11.0
)04.0(50.02
oxidation pyriteby ±+
±±−−= 10 Equation 8
[ ] [ ] [ ]( )−+ += Equation 9
[ ] [ ][ ]+
= − Equation 10
between the limits t = 0 and t = t ; and [O2] = 10–�M (initial concentration of oxygen left in the backfill, as it is discussed later) and [O2] = [O2]t (as the anoxic boundary for oxygen concentra-tion).
The terms SA/V are different for each one of the equations. Although in laboratory experiments the determination of the specific surface area of a solid sample is rather straightforward, the assessment of the value of this parameter in field experiments or in predictions of the behaviour of real systems is fraught with difficulties. In the present model we have estimated the geo-metrical surface area as /Nicholson 1994/:
SA = 6/ρ·d
where SA is the surface area (in m2·g –1), ρ is the density of the mineral (in g·m–�) and d is the particle size (in m). Reactive surface area can be � times higher than the geometric area, although in this work we will consider the geometric surface area for our calculations.
According to the information available in the literature on pyrite samples from Forsmark, the pyrite particles average sizes in the order of 100 to �00 µm /Petersson et al. 2004/ in the fracture. In the backfill, the grain size is expected to be smaller, and we have assumed a value of 1µm. The density of pyrite is of �,010 kg/m�.
By applying the former data, we obtain the following values for the specific surface area of pyrite in the �0/70 backfill:
• SA of Pyrite in backfill: 1.2 m2·g pyrite –1 and taking into account the pyrite content in the
backfill (0.07 wt%) we obtain a value of 1.2 m2 pyrite·Lwater –1
In the case of siderite, by following the same approach, taking 1 µm for the siderite particle size and a density of �,9�6 kg/m�, we obtain:
• SA of Siderite in backfill: 1.� m2·gsiderite –1 and taking into account a 1% of siderite in the
backfill we obtain a value of 1�.� m2siderite·Lwater
–1.
To estimate the surface area coated by microbes, we can assume that total surface area to volume in the backfill is on the order of 100 m2·Lwater
–1 and, by assuming that only a 10% of the total surface is coated by microbes we take a value of 10 m2·Lwater
–1. SA coated by microbes in backfill: 10 m2·Lwater
–1.
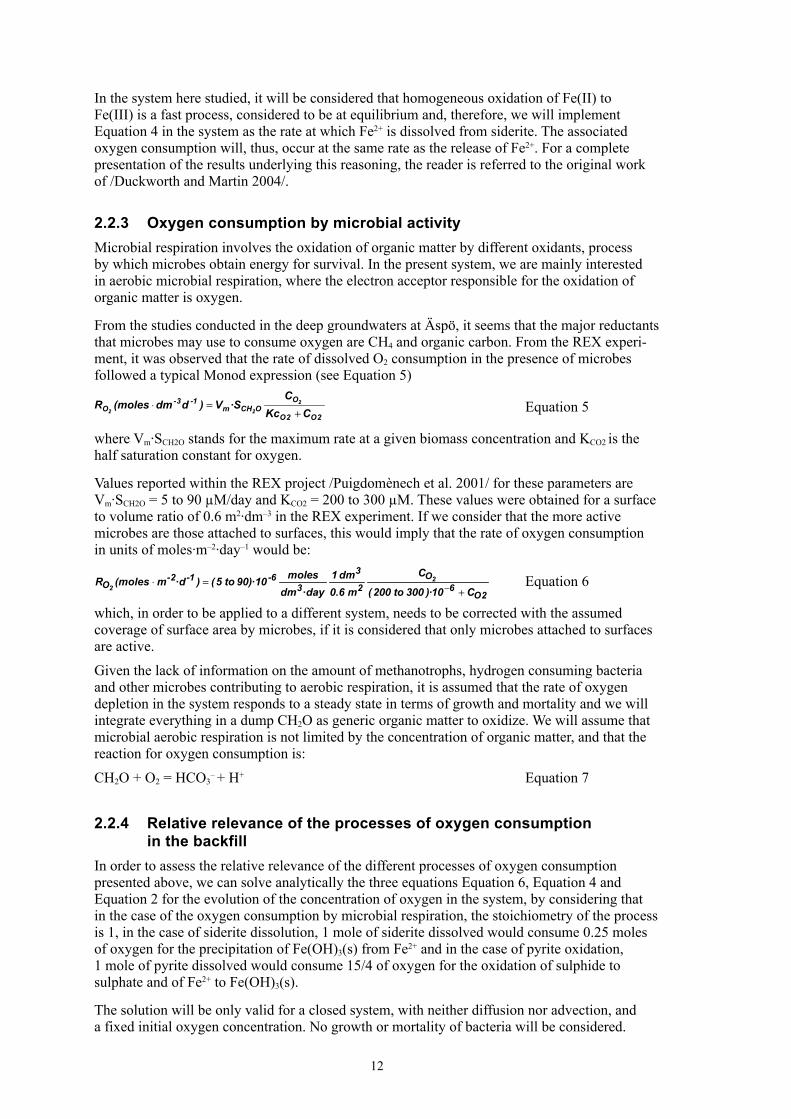
The comparison among the three rates of oxygen consumption in terms of the evolution of the concentration of oxygen in the backfill with time is shown in Figure 2-�.
From the previous plot we can see that the fastest oxygen depletion in the system is that produced by siderite dissolution. The different times needed for the system to reach anoxic conditions (defined as [O2]aq < 10 –6M) are:
Consumption by pyrite oxidation: �.7 days
Consumption by oxidation of Fe2+ from siderite dissolution: 1.2 days
Consumption by aerobic respiration: 1.7 days
14
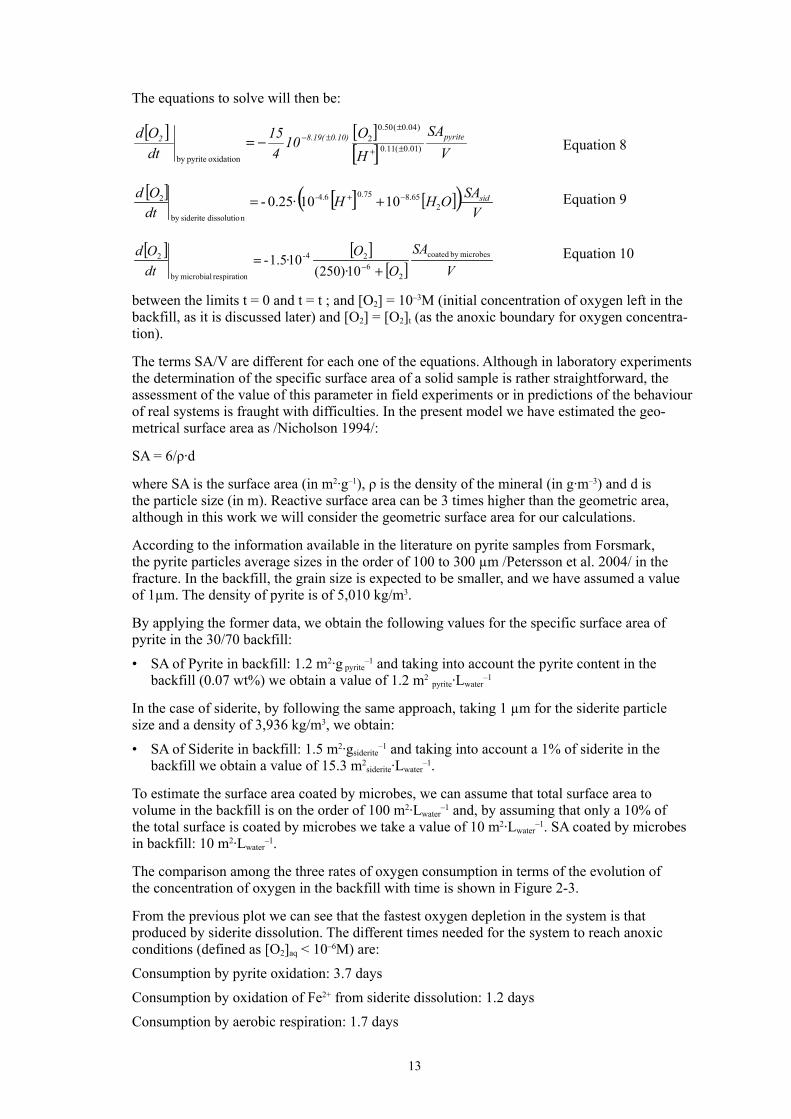
The amount of siderite present in the backfill is very uncertain. If no siderite is considered, the two processes responsible for oxygen consumption are pyrite oxidation and microbial activity. One of the main uncertainties of these calculations is the concentration of microbes in the system. In the results presented in Figure 2-�, the microbes are assumed to cover a surface area of 10 m2·Lwater
–1, what means a concentration of 10–11 moles of microbes Lwater –1.
Under these conditions, the consumption of oxygen due to aerobic respiration is faster than that due to pyrite oxidation. Nevertheless, an increase in the surface area coated by microbes will decrease the time needed for oxygen depletion. Aerobic respiration will be negligible in front of pyrite oxidation for surface area coated by microbes below � m2 Lwater
–1, that is for microbe concentration below 6.7·10–12 mol·Lwater
–1, if the parameters used in Equation 10 from the REX experiment are valid. The influence of the surface area covered by microbes on the oxygen depletion due to microbial activity is shown in Figure 2-4.
Figure 2-3. Evolution of the concentration of oxygen with time obtained by the different mechanisms of oxygen consumption in the system. For aerobic respiration, a surface of 10m2 Lwater
–1 coated by microbes has been used.
Figure 2-4. Evolution of the aqueous oxygen concentration affected by aerobic respiration. Labels indicate the surface area coated by microbes (m2·Lwater
–1).
0.0E+00
2.0E-04
4.0E-04
6.0E-04
8.0E-04
1.0E-03
0 1 2 3 4 5
time (days)
[O2(a
q)] (
M)
pyrite_oxidation
siderite_dissolution
aerobic_respiration;SA = 10m2/L
0.E+00
2.E-04
4.E-04
6.E-04
8.E-04
1.E-03
0 1 2 3 4
time (days)
[O2(a
q)] (
M)
4m2 /dm3
10m2/dm3
100m2 /dm3
Oxygen depletion by aerobic respiration
1�
3 Numericalmodelling
3.1 IntroductionThe consumption of the trapped oxygen immediately after the closure of the deposition tunnel takes place simultaneously with the backfill saturation by regional groundwater. Consequently, numerical models should take into account a multiphase reactive transport of solutes in the porewater as the saturation of the pore occurs. This implies a high degree of complexity and requires specific numerical codes to deal with such complex systems. However, it is possible to estimate the chemical evolution of the backfill system by means of simpler approaches that provide insights about the key factors controlling it. In the present study, geochemical reactions have been treated separately from the saturation process.
In the report presented here, the geochemical evolution has been studied first in a 1-dimension model with the PHREEQC code /Parkhurst and Appelo 1999/ and, subsequently, in a two-dimension domain by using the code PHAST /Parkhurst et al. 2004/. In both cases the system is assumed to be water saturated.
3.2 1-DmodelTo gain insight on which are the main processes acting in the oxygen consumption in the backfill and the most affecting parameters, in the first stages of the project a set of 1-D simulations have been undertaken.
Important simplifications, mainly related to the hydrodynamics, are needed to implement the complex conceptual model of the backfill into a 1-D domain, although the geochemical system implemented here for the backfill can be the same as in the more realistic 2-D simulations.
The simulations (see Table �-�) presented here aim at assessing the time needed for the complete oxygen depletion in the backfill. In principle, the influence of the host-rock or fractures surrounding the tunnel have been disregarded, and all the analyses presented in this sub-section deals with the effect of the backfill itself.
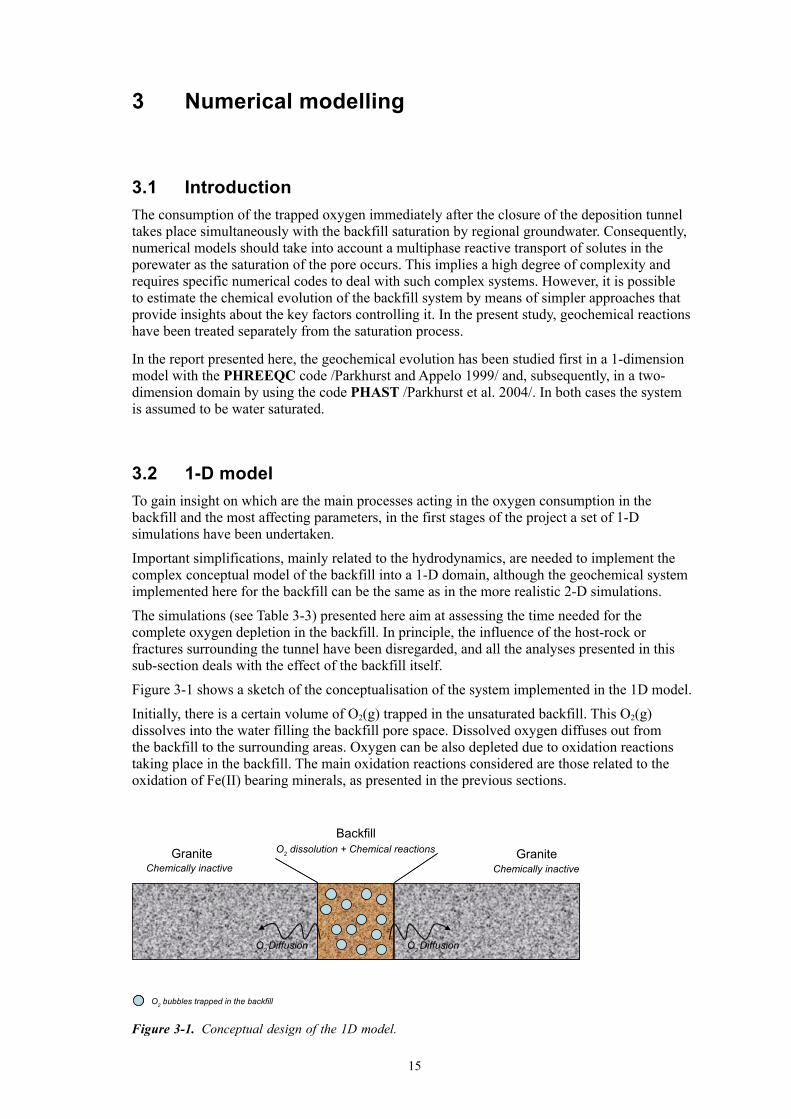
Figure �-1 shows a sketch of the conceptualisation of the system implemented in the 1D model.
Initially, there is a certain volume of O2(g) trapped in the unsaturated backfill. This O2(g) dissolves into the water filling the backfill pore space. Dissolved oxygen diffuses out from the backfill to the surrounding areas. Oxygen can be also depleted due to oxidation reactions taking place in the backfill. The main oxidation reactions considered are those related to the oxidation of Fe(II) bearing minerals, as presented in the previous sections.
Figure 3-1. Conceptual design of the 1D model.
Granite
O2 Diffusion
Backfill
O2 Diffusion
Granite
O2 bubbles trapped in the backfill
Chemically inactive
O2 dissolution + Chemical reactions
Chemically inactive
O2 Diffusion O2 Diffusion
16
In this model the backfill follows the �0/70 mixture concept where MX-80 bentonite is mixed with Forsmark granite and is equilibrated with the Forsmark groundwater.
Simulations using other backfill types, such as the Friedland Clay, have not been considered in the present study due to the lack of reliable values in fundamental parameters such as effective diffusion coefficients, selectivity coefficients for cation exchange, and surface protonation/deprotonation constants.
Granite is, as presented above, considered as a non-reactive medium given the objective of this 1-D model, but it is necessary to include it in the system to properly simulate the diffusion process of oxygen out of the backfill.
3.2.1 CodecapabilitiesAs explained in the introduction, the PHREEQC code has been chosen to perfom the calcula-tions of the 1-D model.
PHREEQCcode/Parkhurst and Appelo 1999/ is a computer code for simulating chemical reactions and transport processes in natural or polluted groundwaters that is based on equilibrium chemistry of aqueous solutions interacting with minerals, gases, solid solutions, exchangers and sorption surfaces. It also includes the capability to model kinetic reactions with rate equations specified by the users. Moreover, it includes an explicit finite difference algorithm for calculations of 1-D advective-dispersive transport and optionally diffusion in stagnant zones.
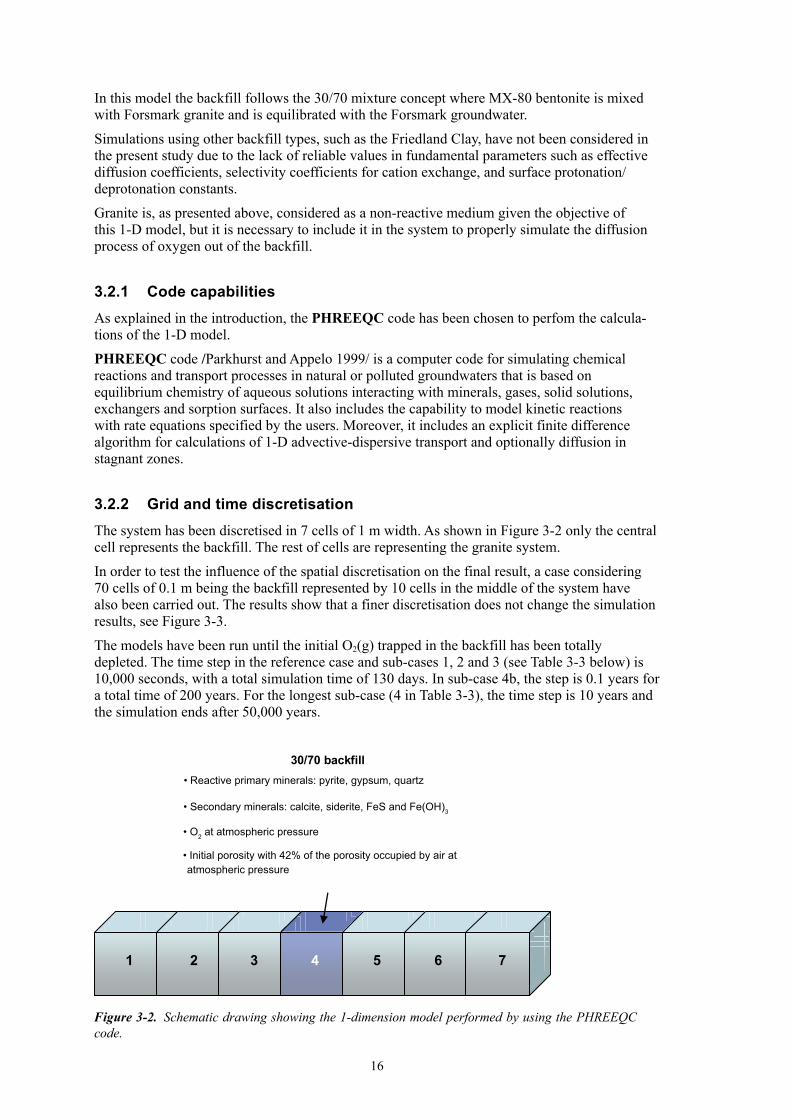
3.2.2 GridandtimediscretisationThe system has been discretised in 7 cells of 1 m width. As shown in Figure �-2 only the central cell represents the backfill. The rest of cells are representing the granite system.
In order to test the influence of the spatial discretisation on the final result, a case considering 70 cells of 0.1 m being the backfill represented by 10 cells in the middle of the system have also been carried out. The results show that a finer discretisation does not change the simulation results, see Figure �-�.
The models have been run until the initial O2(g) trapped in the backfill has been totally depleted. The time step in the reference case and sub-cases 1, 2 and � (see Table �-� below) is 10,000 seconds, with a total simulation time of 1�0 days. In sub-case 4b, the step is 0.1 years for a total time of 200 years. For the longest sub-case (4 in Table �-�), the time step is 10 years and the simulation ends after �0,000 years.
Figure 3-2. Schematic drawing showing the 1-dimension model performed by using the PHREEQC code.
30/70 backfill• Reactive primary minerals: pyrite, gypsum, quartz
• Initial porosity with 42% of the porosity occupied by air at atmospheric pressure
1 2 3 4 5 6 7
• Secondary minerals: calcite, siderite, FeS and Fe(OH)3
• O2 at atmospheric pressure
17
3.2.3 HydrodynamicpropertiesAs advection is not considered in the model, no values for hydraulic conductivities have been selected.
Effective diffusion coefficient for all solutes has been assumed to be 10–10m2·s–1 /Ochs and Talerico 2004/. Some variations on this number have been used for the sake of assessing the sensitivity of the model to the diffusivity of oxygen in the media (see Section �.2.6).
The porosity of the mixture is �6.�% /SKB 2004/, out of which a 42% is occupied by air.
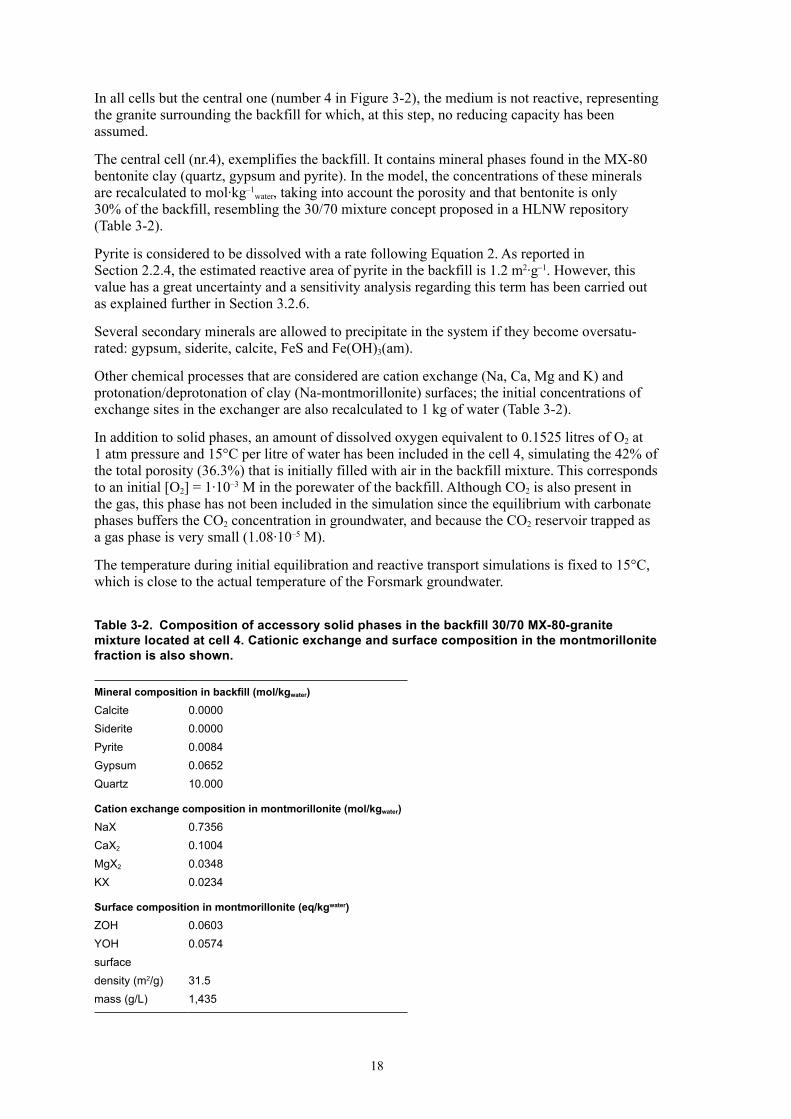
3.2.4 ChemicalpropertiesGroundwater considered in the system is Forsmark groundwater (Table �-1, SICADA database). This water is of NaCl-type with ionic strength of 0.19 M, and of reducing character (O2 partial pressure much below 10–20 bar).
Table3-1. ChemistryoftheForsmarkgroundwaterfromtheKFM02Aborehole.ExceptforredoxpotentialandpHallconcentrationsaregiveninmole·Lwater
–1.
pH 7.2pe –2.42
Eh (mV) –138T(°C) 15Cl 1.53·10–1
Na 8.90·10–2
HCO3– 2.20·10–3
Ca 2.30·10–2
Mg 9.30·10–3
K 9.00·10–4
SO4–2 5.20·10–3
Si 1.85·10–4
Fe 3.30·10–6
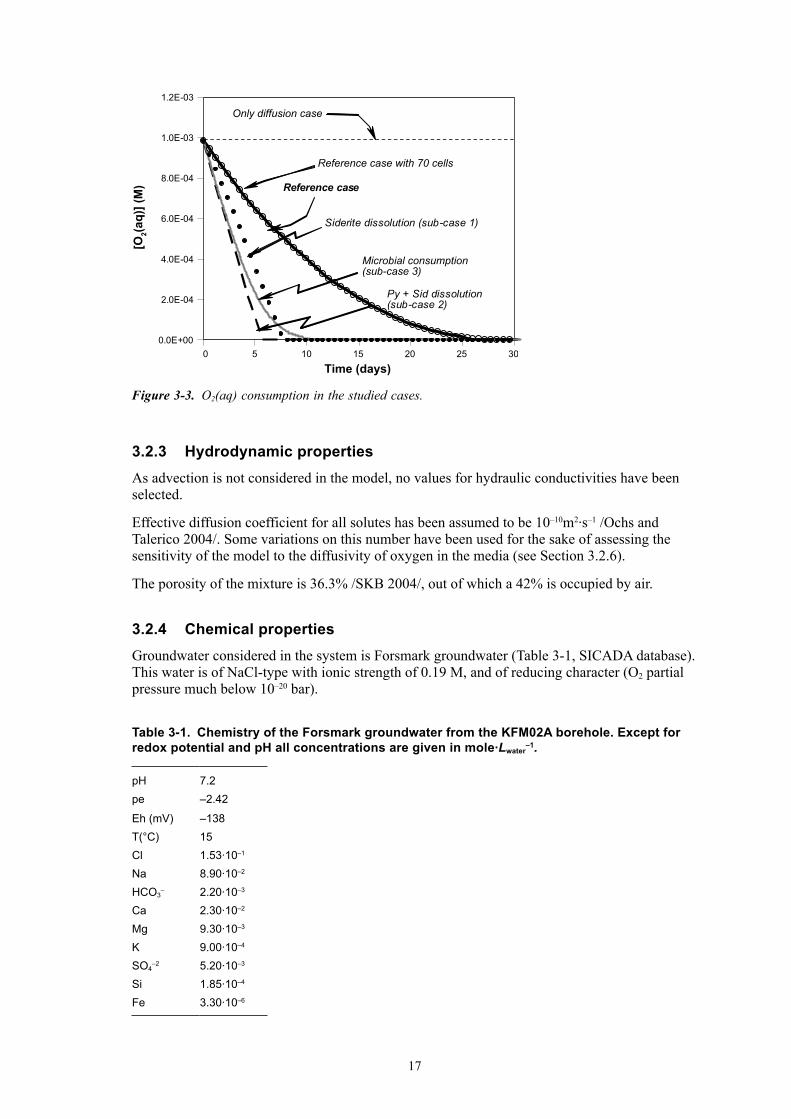
Figure 3-3. O2(aq) consumption in the studied cases.
0.0E+00
2.0E-04
4.0E-04
6.0E-04
8.0E-04
1.0E-03
1.2E-03
0 5 10 15 20 25 30
Time (days)
Siderite dissolution (sub-case 1)
Reference case
Reference case with 70 cells
Only diffusion case
Microbial consumption (sub-case 3)
Py + Sid dissolution (sub-case 2)
[O2(a
q)] (
M)
18
In all cells but the central one (number 4 in Figure �-2), the medium is not reactive, representing the granite surrounding the backfill for which, at this step, no reducing capacity has been assumed.
The central cell (nr.4), exemplifies the backfill. It contains mineral phases found in the MX-80 bentonite clay (quartz, gypsum and pyrite). In the model, the concentrations of these minerals are recalculated to mol·kg –1
water, taking into account the porosity and that bentonite is only �0% of the backfill, resembling the �0/70 mixture concept proposed in a HLNW repository (Table �-2).
Pyrite is considered to be dissolved with a rate following Equation 2. As reported in Section 2.2.4, the estimated reactive area of pyrite in the backfill is 1.2 m2·g –1. However, this value has a great uncertainty and a sensitivity analysis regarding this term has been carried out as explained further in Section �.2.6.
Several secondary minerals are allowed to precipitate in the system if they become oversatu-rated: gypsum, siderite, calcite, FeS and Fe(OH)�(am).
Other chemical processes that are considered are cation exchange (Na, Ca, Mg and K) and protonation/deprotonation of clay (Na-montmorillonite) surfaces; the initial concentrations of exchange sites in the exchanger are also recalculated to 1 kg of water (Table �-2).
In addition to solid phases, an amount of dissolved oxygen equivalent to 0.1�2� litres of O2 at 1 atm pressure and 1�°C per litre of water has been included in the cell 4, simulating the 42% of the total porosity (�6.�%) that is initially filled with air in the backfill mixture. This corresponds to an initial [O2] = 1·10–� M in the porewater of the backfill. Although CO2 is also present in the gas, this phase has not been included in the simulation since the equilibrium with carbonate phases buffers the CO2 concentration in groundwater, and because the CO2 reservoir trapped as a gas phase is very small (1.08·10–� M).
The temperature during initial equilibration and reactive transport simulations is fixed to 1�°C, which is close to the actual temperature of the Forsmark groundwater.
Table3-2. Compositionofaccessorysolidphasesinthebackfill30/70MX-80-granitemixturelocatedatcell4.Cationicexchangeandsurfacecompositioninthemontmorillonitefractionisalsoshown.
Mineralcompositioninbackfill(mol/kgwater)Calcite 0.0000Siderite 0.0000Pyrite 0.0084Gypsum 0.0652Quartz 10.000
Cationexchangecompositioninmontmorillonite(mol/kgwater)NaX 0.7356CaX2 0.1004MgX2 0.0348KX 0.0234
Surfacecompositioninmontmorillonite(eq/kgwater)ZOH 0.0603YOH 0.0574surface density (m2/g) 31.5mass (g/L) 1,435
19
3.2.5 BoundaryandinitialconditionsThe initial groundwater and mineral composition of the backfill are listed in Table �-1 and Table �-2.
Only diffusion is considered and no advection flow is allowed. The solution composition is allowed to change as a consequence of the chemical reactions considered in the backfill area.
3.2.6 CasesstudiedandsensitivityanalysisThe sensitivity analysis is based on assessing the impact that the main uncertainties can have in the results. The uncertainties in the model relate to the following parameters:
i) Effective surface area of the main oxygen consuming minerals
ii) Carbonate content
iii) Biomass concentration in the system
iv) Role of oxygen consuming minerals
A more detailed description of the former uncertainties follows.
i) Effective surface area. The value of the effective surface area of the oxygen consuming minerals will directly affect to the rate of oxygen consumption. This value is rather uncertain, given that it depends not only on the particle size and internal porosity of the mineral grains, but also on the availability of the surface to water. In the reference model, the oxygen consumption has been evaluated by considering four different reactive surfaces for pyrite (0.012, 0.12, 1.2 and 12 m2·g –1).
ii) Carbonate content. As mentioned in Chapter 2, carbonate minerals present in the backfill (calcite and siderite) play an essential role in the control of pH and redox potential. According to /SKB 2004/, MX-80 bentonite contains 0±1wt% of calcite and siderite. The role of carbonate minerals have been tested in sub-cases 1 and 2 (Table �-�).
iii) Biomass concentration in the system. Both, biomass concentration (SCH2O) and maximum oxidation rate of oxygen per mole of biomass (Vm), show variations in nature. In our case, we have selected a value of 90 µM·day –1 for the product of both parameters (see Section 2.1.� for details). The impact of the presence of biomass has been tested in sub-case � (Table �-�).
iv) Role of oxygen consuming minerals. In order to assess the contribution that oxygen consuming minerals have in the oxygen depletion, we have defined a sub-case 4 where no RDC phases are present in the backfill (Table �-�). The central diffusion coefficient used in the simulation is 10–10 m2·s –1, although some variations on this number have been used for the sake of assessing the sensitivity of the model to the diffusivity of oxygen in the media.
A scenario completely free of oxygen consumers is, however, unlikely. Even considering a backfill without pyrite, siderite and/or microbial activity, other minerals may play a role as oxygen consumers although their reducing capacity is much less effective.
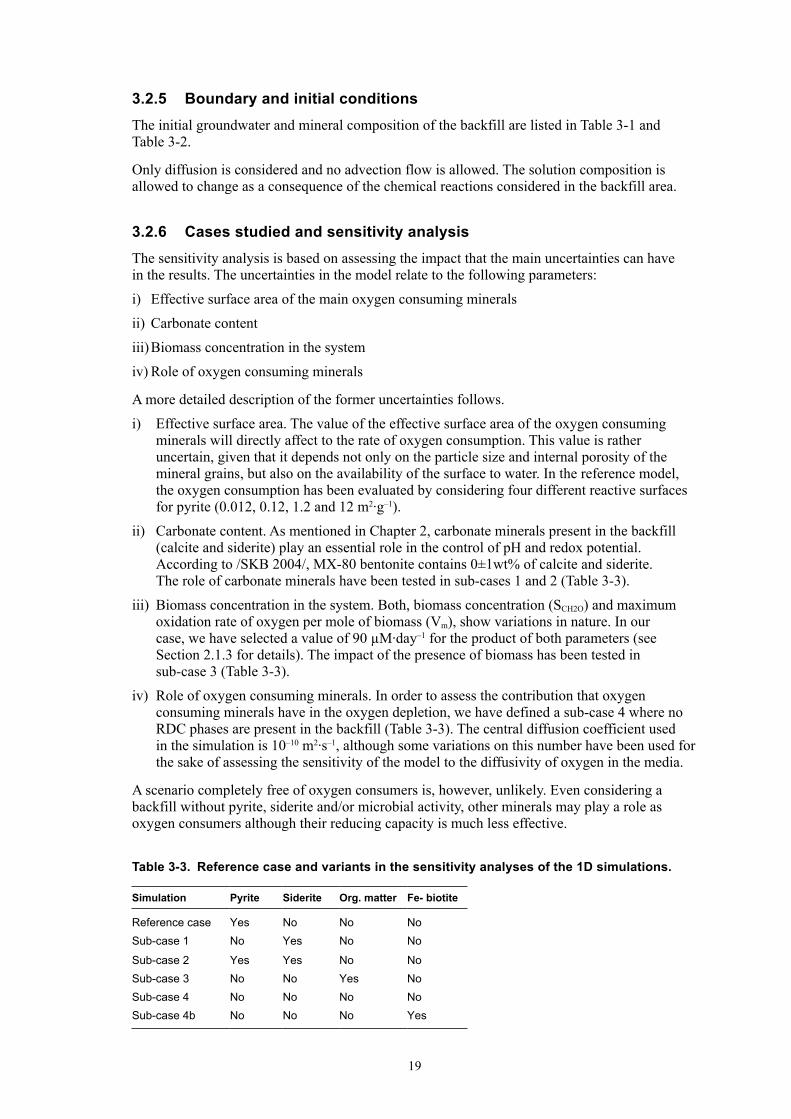
Table3-3. Referencecaseandvariantsinthesensitivityanalysesofthe1Dsimulations.
Simulation Pyrite Siderite Org.matter Fe-biotite
Reference case Yes No No NoSub-case 1 No Yes No No
Sub-case 2 Yes Yes No NoSub-case 3 No No Yes NoSub-case 4 No No No NoSub-case 4b No No No Yes
20
One of these compounds is the iron-rich biotite (annite), that can be abundant in the granite host-rock and, thus, in the granitic component of the backfill mixture. According to /Petersson et al. 2004/, granitic rocks in the Forsmark area contain between 0.6 and 10 wt% of biotite. Biotite is a phyllosilicate (mica group) of variable compositions between two end members:
A Mg-rich end member: Phlogopite: KMg�AlSi�O10(OH)2
A Fe-rich end member: Annite, KFeII�AlSi�O10(OH)2
The kinetics of dissolution of biotite has been studied by /Malmström et al. 199�/. If only the iron-rich term (annite) is considered, the dissolution process can be expressed by the following reaction (Equation 11):
KFe�AlSi�O10(OH)2 +10 H2O = K+ +�Fe2+ +Al(OH)4– +�H4SiO4+ 6OH– Equation 11
The rate of biotite dissolution is pH dependent, with a minimum at neutral pH values. The rate of Fe release from biotite has been expressed by the quoted authors as Equation 12):
RFe (mol·m–2·y–1) = 6.96.10–2[H+]0.�1 +�.28.10–11[H+]–0.6� Equation 12
where the negative exponent on [H+] expresses the effect of [OH−] on the kinetics of biotite dissolution. The amount of annite in the backfill is highly variable, but in any case, it can be always assumed in excess for the oxygen consumption. In the present simulation, a concentration of 1 wt% of annite in the backfill has been considered. The rate of dissolution of annite will be sensitive to its reactive area, which is depending on the grain size. For particle sizes between 75 and 125μm, the reactive area is 1.8 m2·g –1 /Malmström et al. 199�/. For a concentration of 1 wt% (0.09� mol/Lwater for a backfill porosity of 0.�6�), the reactive area is 87.� m2·L –1. Because of the uncertainty of this parameter, a simulation with a reactive area 10 times smaller has been also studied.
In summary, the following cases have been calculated to account for all these uncertainties (Table �-�):
Reference case: with pyrite and without calcite and siderite. Different reactive areas for pyrite have been tested.
Sub-cases:(1) without pyrite but including siderite (0.7 wt% in bentonite, 0.0867 moles·kgwater
–1),
(2) with pyrite and siderite,
(�) without siderite and pyrite but with organic matter, and
(4) without siderite, pyrite or organic matter. In this case, a sub-variant has been studied including the effect of Fe-rich biotite (annite) in the granite fraction of the backfill mixture as a O2 consumer.
3.2.7 ResultsanddiscussionThe results obtained in the reference case indicate that oxygen is consumed in 28 days ([O2 aq]< 10 –�2 M) (see Figure �-�). Rates of pyrite dissolution range from 1.4·10 –9 moles·m–2·s–1 at the initial stages to 4.2·10 –11 moles·m–2·s–1 just before the total oxygen consump-tion ([O2 aq]< 10 –�2M).
Note that the curve of consumption of oxygen with time has the same shape as Figure 2-�, although the rate of decrease of O2 is slower (time scales of tens of days instead of only 4–� days in Figure 2-�). This is because the calculations performed when studying the relative relevance of the processes of oxygen consumption (Section 2.2.4) consider a “batch” system, where all moles of oxygen are immediately available to be oxidised by the reducing agent. In the 1-D approach, the oxygen reservoir is considered to be in a gas form that equilibrates with the water so that the amount of oxygen dissolved, which is that potentially consumed, is smaller, and therefore, the rate of pyrite dissolution is also slower.
21
In Figure �-�, the curve of consumption of oxygen when considering a discretisation of the system into 70 cells instead of into 7 is also shown. This variant has been tested to ensure that spatial discretisation was not too broad as to affect the numerical results. As seen in the plot, both curves overlap.
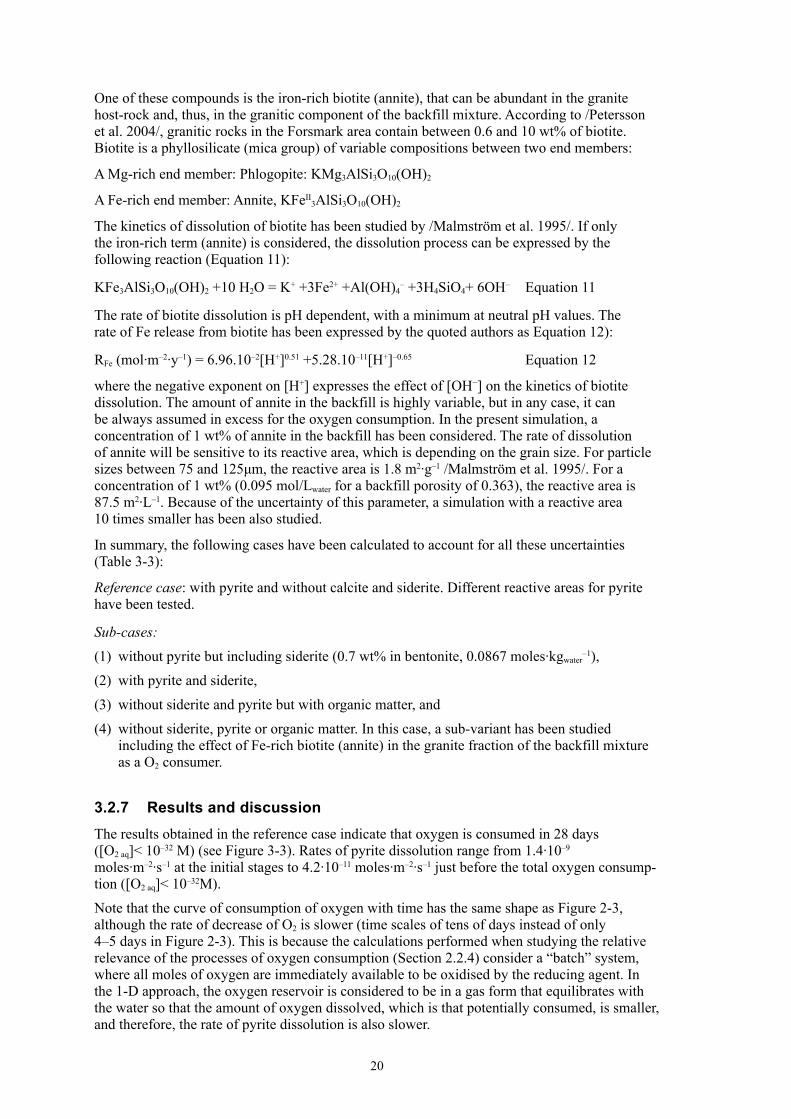
The time needed to reduce oxygen concentrations to negligible levels ([O2(aq)]<10 –6 moles/dm�) in the central cell of the backfill for each one of the simulated cases is shown in Figure �-4.
The results in Figure �-4 show the importance of siderite as oxidant sink in the system. In addition the results indicate that oxic conditions will not prevail for periods longer than 1 month after the saturation of the tunnel backfill. In the case of bacterial activity catalizing the process of oxidation of organic matter oxygen would disappear already after half a month.
If the only mineral providing RDC to the system is Fe(II)-biotite, i.e. if pyrite is inactive or inaccessible, oxic conditions will last for around 200 years, due to the slow dissolution of Fe(II) from the ferrous silicate.
In the reference case, a pyrite reactive surface of 1.2 m2·Lwater –1 has been considered, in
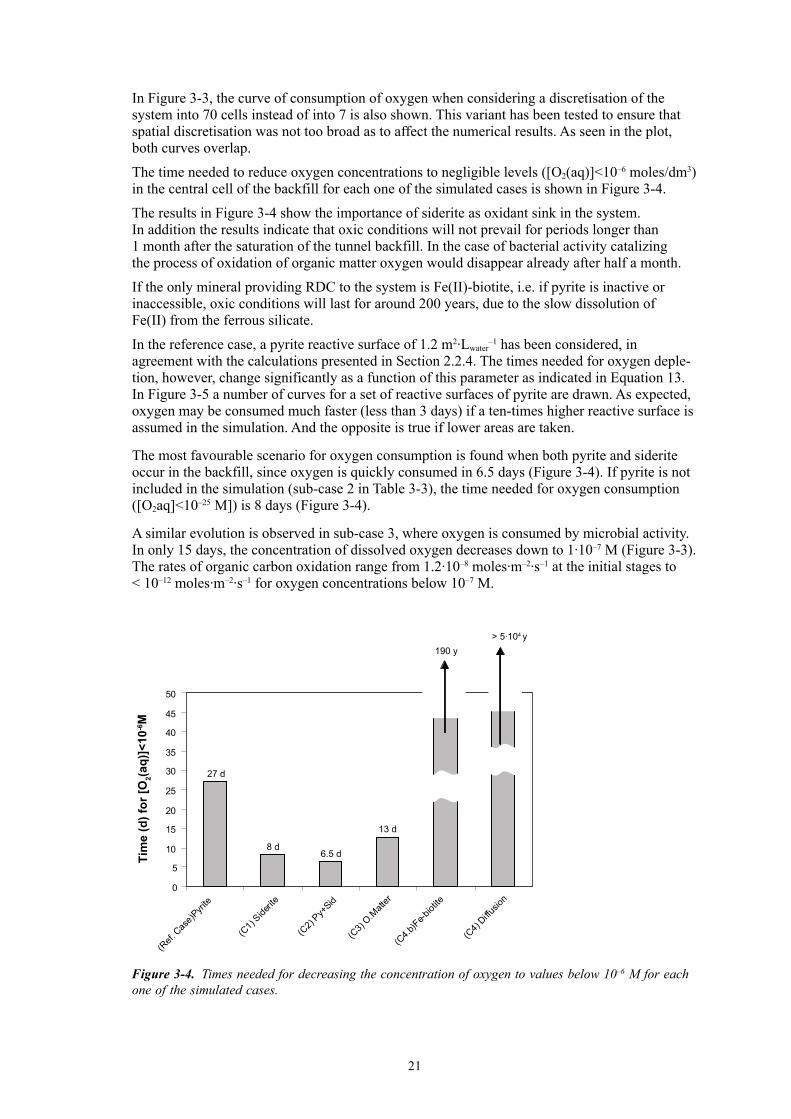
agreement with the calculations presented in Section 2.2.4. The times needed for oxygen deple-tion, however, change significantly as a function of this parameter as indicated in Equation 1�. In Figure �-� a number of curves for a set of reactive surfaces of pyrite are drawn. As expected, oxygen may be consumed much faster (less than � days) if a ten-times higher reactive surface is assumed in the simulation. And the opposite is true if lower areas are taken.
The most favourable scenario for oxygen consumption is found when both pyrite and siderite occur in the backfill, since oxygen is quickly consumed in 6.� days (Figure �-4). If pyrite is not included in the simulation (sub-case 2 in Table �-�), the time needed for oxygen consumption ([O2aq]<10 –2� M]) is 8 days (Figure �-4).
A similar evolution is observed in sub-case �, where oxygen is consumed by microbial activity. In only 1� days, the concentration of dissolved oxygen decreases down to 1·10 –7 M (Figure �-�). The rates of organic carbon oxidation range from 1.2·10 –8 moles·m–2·s–1 at the initial stages to < 10 –12 moles·m –2·s–1 for oxygen concentrations below 10 –7 M.
Figure 3-4. Times needed for decreasing the concentration of oxygen to values below 10–6 M for each one of the simulated cases.
13 d
6.5 d8 d
27 d
0
5
10
15
20
25
30
35
40
45
50
(Ref.
Cas
e)Pyri
te
(C1)
Siderite
(C2)
Py+Sid
(C3)
O.Matt
er
(C4.b
)Fe-b
iotite
(C4)
Diffusio
n
190 y> 5·104 y
Tim
e (d
) for
[O2(a
q)]<
10-6M
22
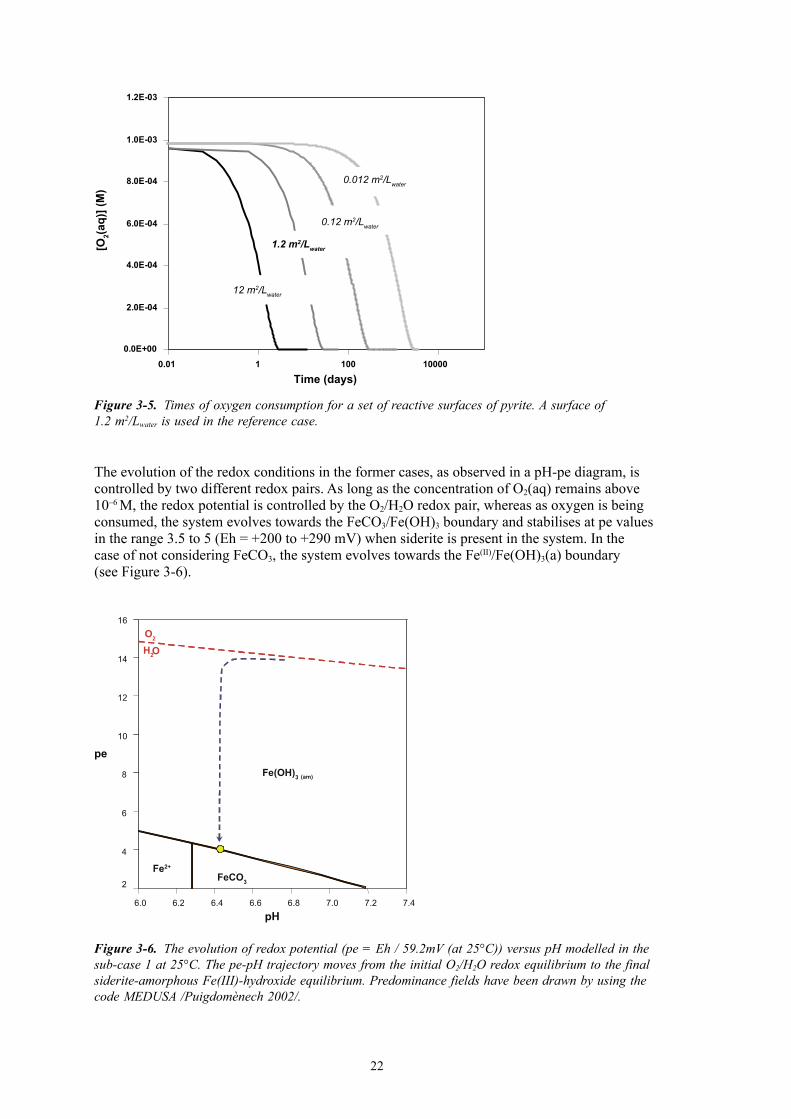
The evolution of the redox conditions in the former cases, as observed in a pH-pe diagram, is controlled by two different redox pairs. As long as the concentration of O2(aq) remains above 10 –6 M, the redox potential is controlled by the O2/H2O redox pair, whereas as oxygen is being consumed, the system evolves towards the FeCO�/Fe(OH)� boundary and stabilises at pe values in the range �.� to � (Eh = +200 to +290 mV) when siderite is present in the system. In the case of not considering FeCO�, the system evolves towards the Fe(II)/Fe(OH)�(a) boundary (see Figure �-6).
Figure 3-5. Times of oxygen consumption for a set of reactive surfaces of pyrite. A surface of 1.2 m2/Lwater is used in the reference case.
0.0E+00
2.0E-04
4.0E-04
6.0E-04
8.0E-04
1.0E-03
1.2E-03
0.01 1 100 10000
Time (days)
[O2(a
q)] (
M)
0.012 m2/Lwater
0.12 m2/Lwater
1.2 m2/Lwater
12 m2/Lwater
Figure 3-6. The evolution of redox potential (pe = Eh / 59.2mV (at 25°C)) versus pH modelled in the sub-case 1 at 25°C. The pe-pH trajectory moves from the initial O2/H2O redox equilibrium to the final siderite-amorphous Fe(III)-hydroxide equilibrium. Predominance fields have been drawn by using the code MEDUSA /Puigdomènech 2002/.
6.0 6.2 6.4 6.6 6.8 7.0 7.2 7.4
O2
O
2
4
6
8
10
12
14
16
pe
pH
Fe(OH)3 (am)
H2
FeCO3
Fe2+
2�
The results obtained from the 1-D approach highlight the importance of accessory minerals in the backfill, given the relatively fast oxygen consumption (less than �0 days) calculated in those cases where these minerals existed, in comparison with the case in which neither siderite nor pyrite are included in the backfill composition, and oxygen can only be depleted by diffusion (Figure �-�).
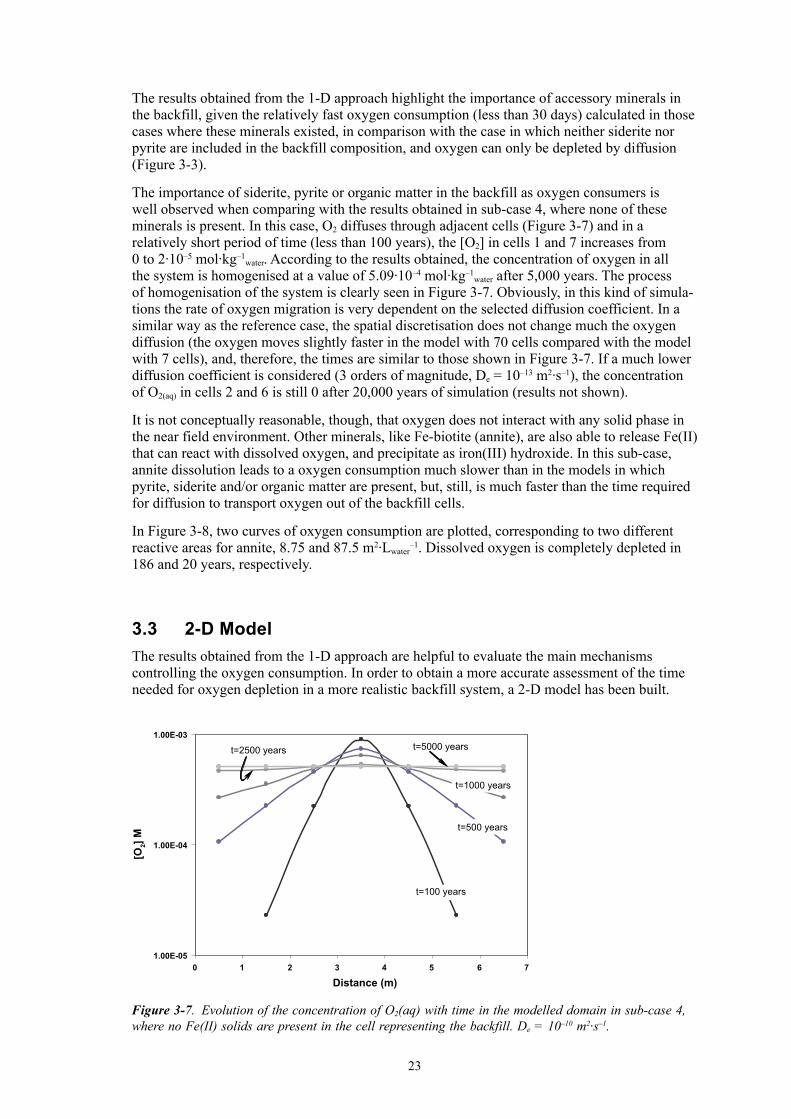
The importance of siderite, pyrite or organic matter in the backfill as oxygen consumers is well observed when comparing with the results obtained in sub-case 4, where none of these minerals is present. In this case, O2 diffuses through adjacent cells (Figure �-7) and in a relatively short period of time (less than 100 years), the [O2] in cells 1 and 7 increases from 0 to 2·10 –� mol·kg –1
water. According to the results obtained, the concentration of oxygen in all the system is homogenised at a value of �.09·10 –4 mol·kg –1
water after �,000 years. The process of homogenisation of the system is clearly seen in Figure �-7. Obviously, in this kind of simula-tions the rate of oxygen migration is very dependent on the selected diffusion coefficient. In a similar way as the reference case, the spatial discretisation does not change much the oxygen diffusion (the oxygen moves slightly faster in the model with 70 cells compared with the model with 7 cells), and, therefore, the times are similar to those shown in Figure �-7. If a much lower diffusion coefficient is considered (� orders of magnitude, De = 10 –1� m2·s –1), the concentration of O2(aq) in cells 2 and 6 is still 0 after 20,000 years of simulation (results not shown).
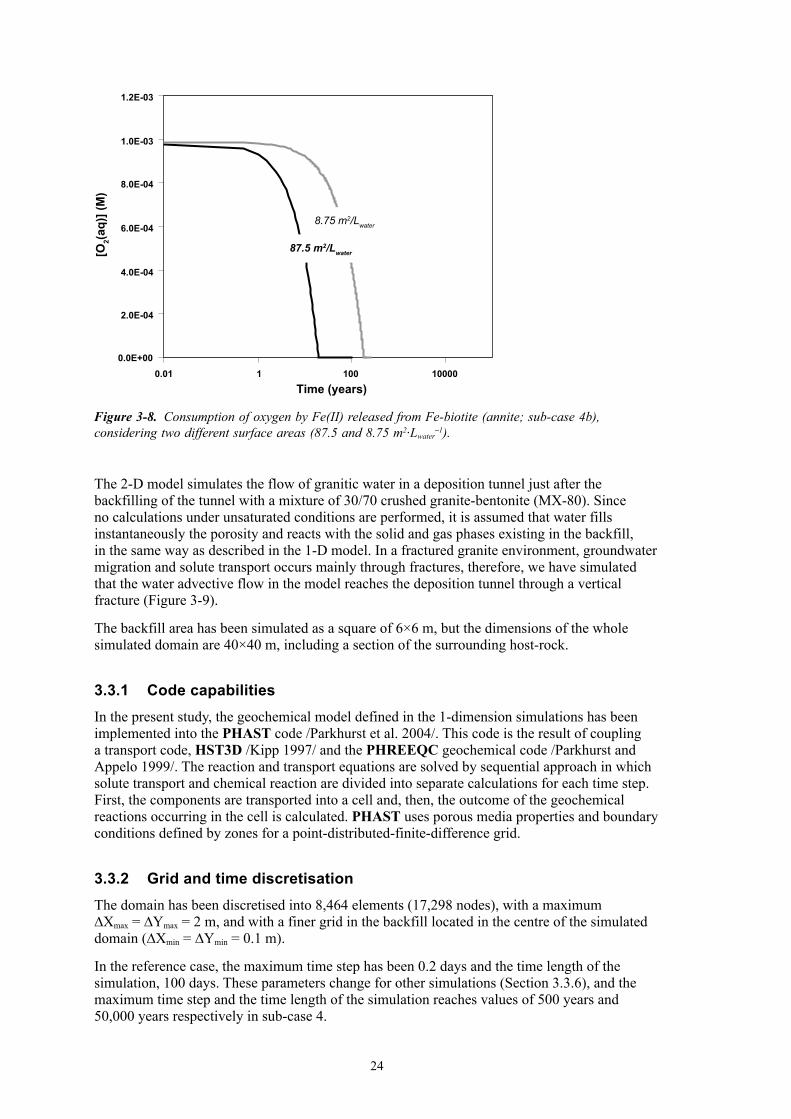
It is not conceptually reasonable, though, that oxygen does not interact with any solid phase in the near field environment. Other minerals, like Fe-biotite (annite), are also able to release Fe(II) that can react with dissolved oxygen, and precipitate as iron(III) hydroxide. In this sub-case, annite dissolution leads to a oxygen consumption much slower than in the models in which pyrite, siderite and/or organic matter are present, but, still, is much faster than the time required for diffusion to transport oxygen out of the backfill cells.
In Figure �-8, two curves of oxygen consumption are plotted, corresponding to two different reactive areas for annite, 8.7� and 87.� m2·Lwater
–1. Dissolved oxygen is completely depleted in 186 and 20 years, respectively.
3.3 2-DModelThe results obtained from the 1-D approach are helpful to evaluate the main mechanisms controlling the oxygen consumption. In order to obtain a more accurate assessment of the time needed for oxygen depletion in a more realistic backfill system, a 2-D model has been built.
Figure 3-7. Evolution of the concentration of O2(aq) with time in the modelled domain in sub-case 4, where no Fe(II) solids are present in the cell representing the backfill. De = 10 –10 m2·s –1.
1.00E-05
1.00E-04
1.00E-03
0 1 2 3 4 5 6 7
Distance (m)
t=100 years
t=500 years
t=1000 years
t=2500 years t=5000 years
[O2]
M
24
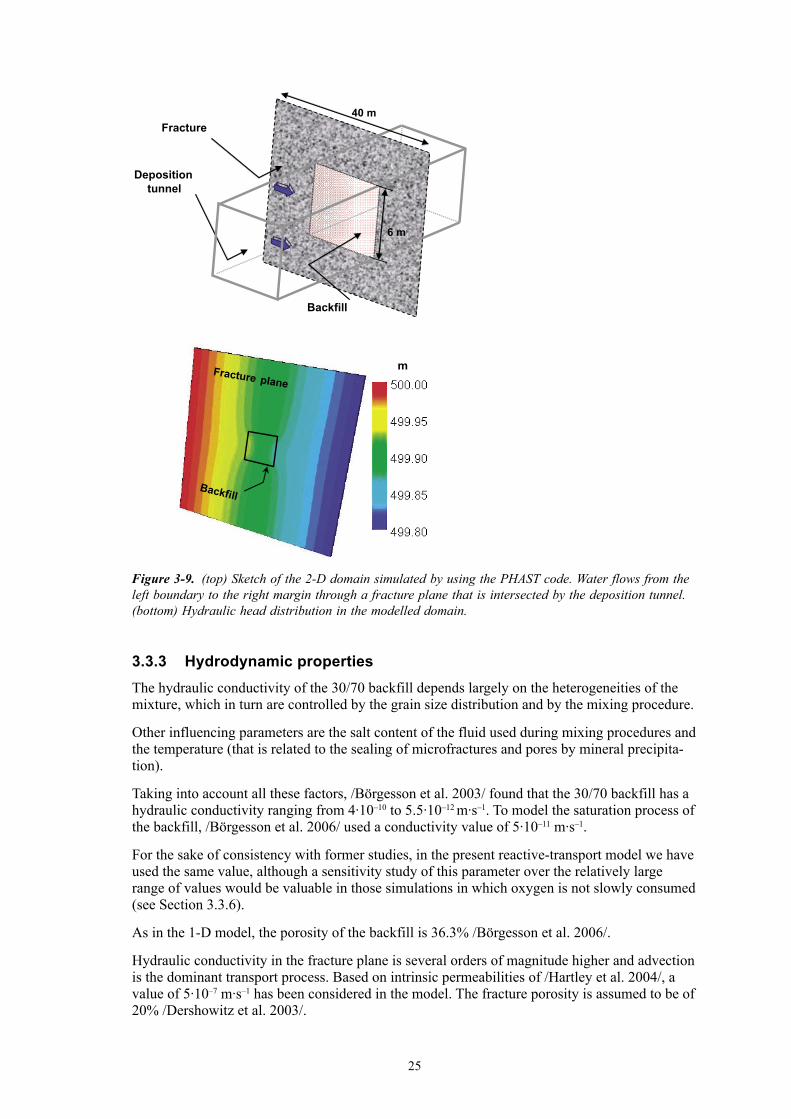
The 2-D model simulates the flow of granitic water in a deposition tunnel just after the backfilling of the tunnel with a mixture of �0/70 crushed granite-bentonite (MX-80). Since no calculations under unsaturated conditions are performed, it is assumed that water fills instantaneously the porosity and reacts with the solid and gas phases existing in the backfill, in the same way as described in the 1-D model. In a fractured granite environment, groundwater migration and solute transport occurs mainly through fractures, therefore, we have simulated that the water advective flow in the model reaches the deposition tunnel through a vertical fracture (Figure �-9).
The backfill area has been simulated as a square of 6×6 m, but the dimensions of the whole simulated domain are 40×40 m, including a section of the surrounding host-rock.
3.3.1 CodecapabilitiesIn the present study, the geochemical model defined in the 1-dimension simulations has been implemented into the PHAST code /Parkhurst et al. 2004/. This code is the result of coupling a transport code, HST3D /Kipp 1997/ and the PHREEQC geochemical code /Parkhurst and Appelo 1999/. The reaction and transport equations are solved by sequential approach in which solute transport and chemical reaction are divided into separate calculations for each time step. First, the components are transported into a cell and, then, the outcome of the geochemical reactions occurring in the cell is calculated. PHAST uses porous media properties and boundary conditions defined by zones for a point-distributed-finite-difference grid.
3.3.2 GridandtimediscretisationThe domain has been discretised into 8,464 elements (17,298 nodes), with a maximum ∆Xmax = ∆Ymax = 2 m, and with a finer grid in the backfill located in the centre of the simulated domain (∆Xmin = ∆Ymin = 0.1 m).
In the reference case, the maximum time step has been 0.2 days and the time length of the simulation, 100 days. These parameters change for other simulations (Section �.�.6), and the maximum time step and the time length of the simulation reaches values of �00 years and �0,000 years respectively in sub-case 4.
Figure 3-8. Consumption of oxygen by Fe(II) released from Fe-biotite (annite; sub-case 4b), considering two different surface areas (87.5 and 8.75 m2·Lwater
–1).
0.0E+00
2.0E-04
4.0E-04
6.0E-04
8.0E-04
1.0E-03
1.2E-03
0.01 1 100 10000Time (years)
8.75 m2/Lwater
87.5 m2/Lwater[O2(a
q)] (
M)
2�
3.3.3 HydrodynamicpropertiesThe hydraulic conductivity of the �0/70 backfill depends largely on the heterogeneities of the mixture, which in turn are controlled by the grain size distribution and by the mixing procedure.
Other influencing parameters are the salt content of the fluid used during mixing procedures and the temperature (that is related to the sealing of microfractures and pores by mineral precipita-tion).
Taking into account all these factors, /Börgesson et al. 200�/ found that the �0/70 backfill has a hydraulic conductivity ranging from 4·10 –10 to �.�·10 –12 m·s–1. To model the saturation process of the backfill, /Börgesson et al. 2006/ used a conductivity value of �·10 –11 m·s–1.
For the sake of consistency with former studies, in the present reactive-transport model we have used the same value, although a sensitivity study of this parameter over the relatively large range of values would be valuable in those simulations in which oxygen is not slowly consumed (see Section �.�.6).
As in the 1-D model, the porosity of the backfill is �6.�% /Börgesson et al. 2006/.
Hydraulic conductivity in the fracture plane is several orders of magnitude higher and advection is the dominant transport process. Based on intrinsic permeabilities of /Hartley et al. 2004/, a value of �·10 –7 m·s –1 has been considered in the model. The fracture porosity is assumed to be of 20% /Dershowitz et al. 200�/.
Figure 3-9. (top) Sketch of the 2-D domain simulated by using the PHAST code. Water flows from the left boundary to the right margin through a fracture plane that is intersected by the deposition tunnel. (bottom) Hydraulic head distribution in the modelled domain.
Backfill
Fracture 40 m
6 m
Deposition
tunnel
Backfill
Fracture planem
Backfill
Fracture plane
Backfill
Fracture plane
26
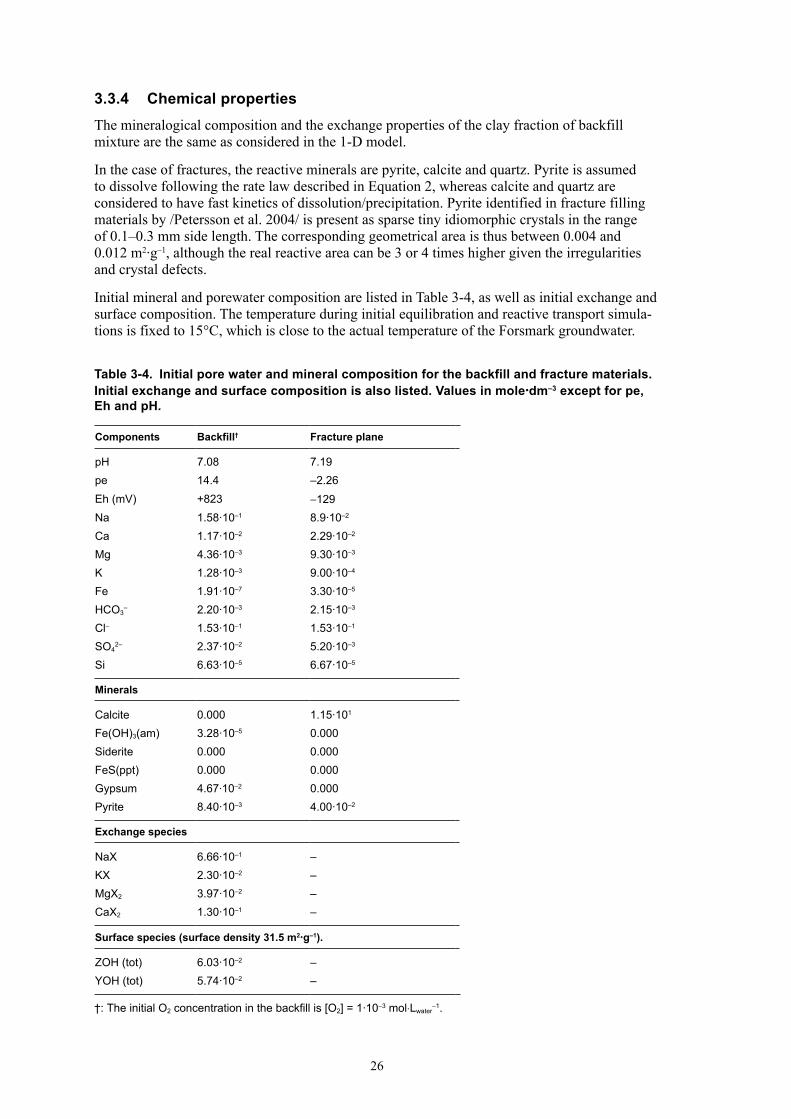
3.3.4 ChemicalpropertiesThe mineralogical composition and the exchange properties of the clay fraction of backfill mixture are the same as considered in the 1-D model.
In the case of fractures, the reactive minerals are pyrite, calcite and quartz. Pyrite is assumed to dissolve following the rate law described in Equation 2, whereas calcite and quartz are considered to have fast kinetics of dissolution/precipitation. Pyrite identified in fracture filling materials by /Petersson et al. 2004/ is present as sparse tiny idiomorphic crystals in the range of 0.1–0.� mm side length. The corresponding geometrical area is thus between 0.004 and 0.012 m2·g –1, although the real reactive area can be � or 4 times higher given the irregularities and crystal defects.
Initial mineral and porewater composition are listed in Table �-4, as well as initial exchange and surface composition. The temperature during initial equilibration and reactive transport simula-tions is fixed to 1�°C, which is close to the actual temperature of the Forsmark groundwater.
Table3-4. Initialporewaterandmineralcompositionforthebackfillandfracturematerials.Initialexchangeandsurfacecompositionisalsolisted.Valuesinmole·dm–3exceptforpe,EhandpH.
Components Backfill† Fractureplane
pH 7.08 7.19pe 14.4 –2.26Eh (mV) +823 −129Na 1.58·10–1 8.9·10–2
Ca 1.17·10–2 2.29·10–2
Mg 4.36·10–3 9.30·10–3
K 1.28·10–3 9.00·10–4
Fe 1.91·10–7 3.30·10–5
HCO3– 2.20·10–3 2.15·10–3
Cl– 1.53·10–1 1.53·10–1
SO42– 2.37·10–2 5.20·10–3
Si 6.63·10–5 6.67·10–5
Minerals
Calcite 0.000 1.15·101
Fe(OH)3(am) 3.28·10–5 0.000Siderite 0.000 0.000FeS(ppt) 0.000 0.000Gypsum 4.67·10–2 0.000Pyrite 8.40·10–3 4.00·10–2
Exchangespecies
NaX 6.66·10–1 –KX 2.30·10–2 –MgX2 3.97·10–2 –CaX2 1.30·10–1 –
Surfacespecies(surfacedensity31.5m2·g–1).
ZOH (tot) 6.03·10–2 –YOH (tot) 5.74·10–2 –
†: The initial O2 concentration in the backfill is [O2] = 1·10 –3 mol⋅Lwater –1.
27
3.3.5 BoundaryandinitialconditionsThe model assumes that groundwater flows through the fracture plane from the left boundary to the right boundary. A prescribed hydraulic gradient of 0.00� (metre of water head for each metre in distance) has been considered between both boundaries (Figure �-9). Boundary condition for solute transport at the left boundary is a fixed solution composition, whereas at the right bound-ary, the solution composition is allowed to change as a consequence of the chemical reactions considered. Upper and lower boundaries of the domain are no flow boundaries.
Initial pore water and mineral composition have been previously presented in Table �-4.
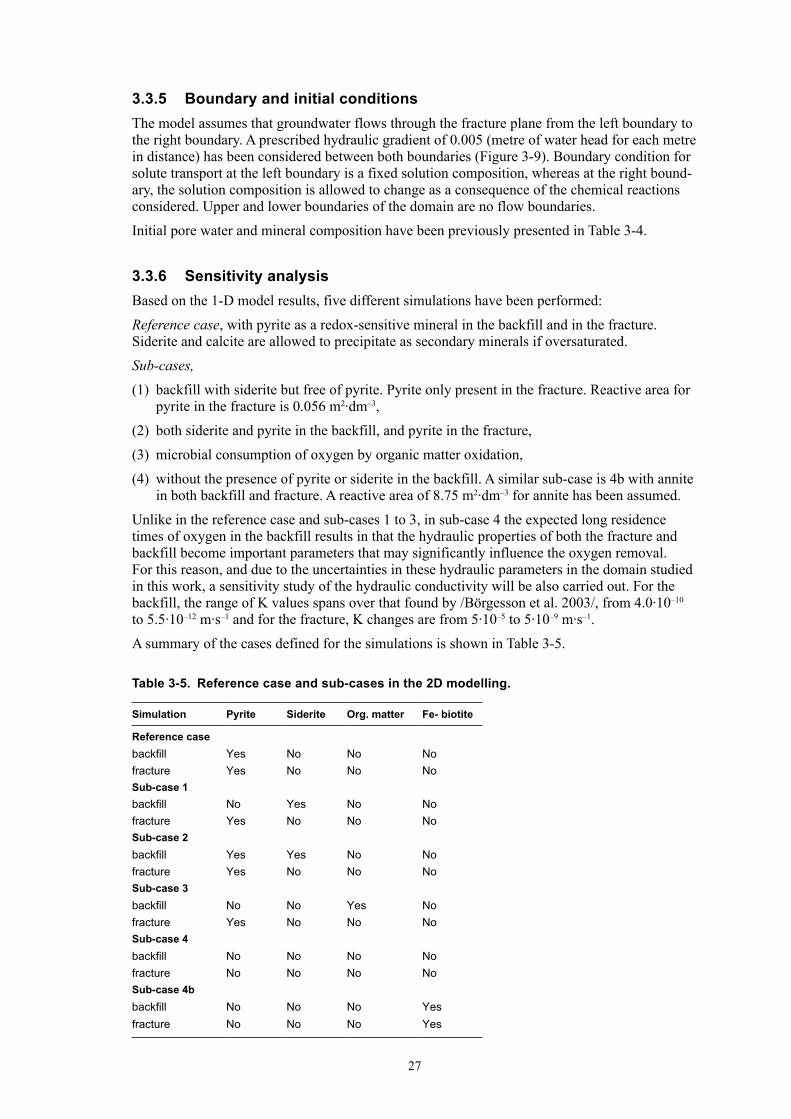
3.3.6 SensitivityanalysisBased on the 1-D model results, five different simulations have been performed:
Reference case, with pyrite as a redox-sensitive mineral in the backfill and in the fracture. Siderite and calcite are allowed to precipitate as secondary minerals if oversaturated.
Sub-cases,(1) backfill with siderite but free of pyrite. Pyrite only present in the fracture. Reactive area for
pyrite in the fracture is 0.0�6 m2·dm –�,
(2) both siderite and pyrite in the backfill, and pyrite in the fracture,
(�) microbial consumption of oxygen by organic matter oxidation,
(4) without the presence of pyrite or siderite in the backfill. A similar sub-case is 4b with annite in both backfill and fracture. A reactive area of 8.7� m2·dm –� for annite has been assumed.
Unlike in the reference case and sub-cases 1 to �, in sub-case 4 the expected long residence times of oxygen in the backfill results in that the hydraulic properties of both the fracture and backfill become important parameters that may significantly influence the oxygen removal. For this reason, and due to the uncertainties in these hydraulic parameters in the domain studied in this work, a sensitivity study of the hydraulic conductivity will be also carried out. For the backfill, the range of K values spans over that found by /Börgesson et al. 200�/, from 4.0·10 –10 to �.�·10 –12 m·s –1 and for the fracture, K changes are from �·10 –� to �·10–9 m·s –1.
A summary of the cases defined for the simulations is shown in Table �-�.
Table3-5. Referencecaseandsub-casesinthe2Dmodelling.
Simulation Pyrite Siderite Org.matter Fe-biotite
Referencecasebackfill Yes No No Nofracture Yes No No NoSub-case1backfill No Yes No Nofracture Yes No No NoSub-case2backfill Yes Yes No Nofracture Yes No No NoSub-case3backfill No No Yes Nofracture Yes No No NoSub-case4backfill No No No Nofracture No No No NoSub-case4bbackfill No No No Yesfracture No No No Yes
28
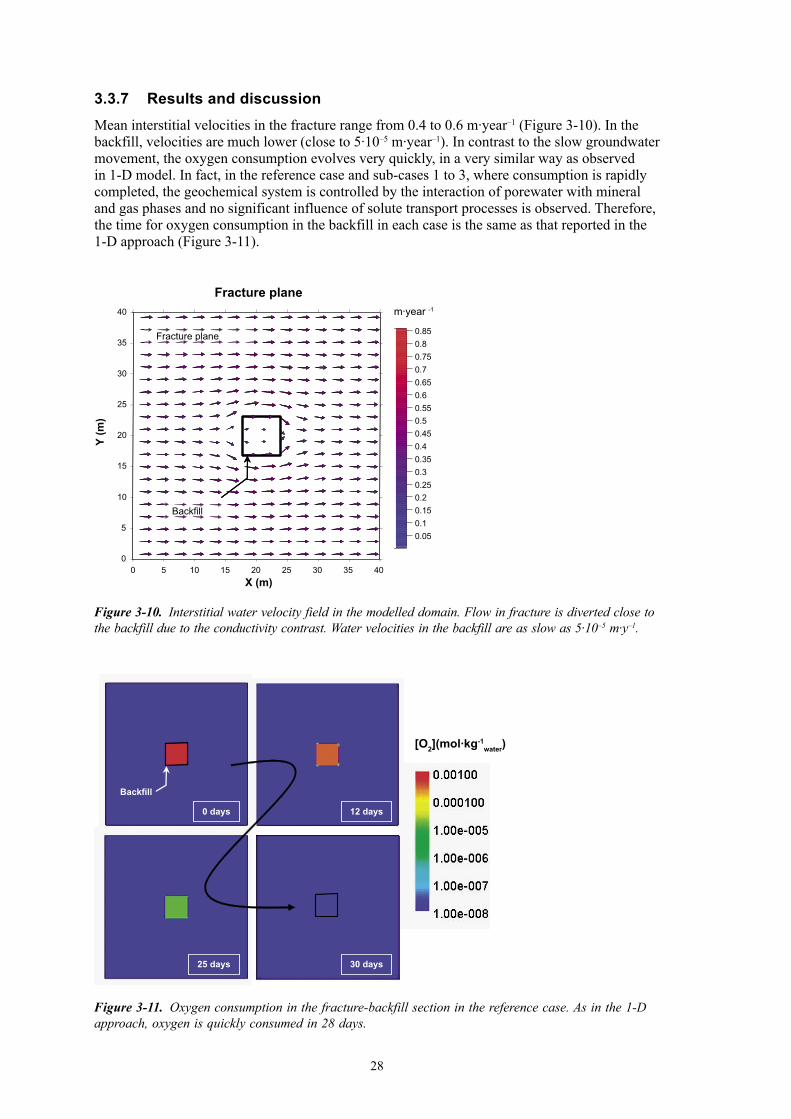
3.3.7 ResultsanddiscussionMean interstitial velocities in the fracture range from 0.4 to 0.6 m·year –1 (Figure �-10). In the backfill, velocities are much lower (close to �·10–� m·year –1). In contrast to the slow groundwater movement, the oxygen consumption evolves very quickly, in a very similar way as observed in 1-D model. In fact, in the reference case and sub-cases 1 to �, where consumption is rapidly completed, the geochemical system is controlled by the interaction of porewater with mineral and gas phases and no significant influence of solute transport processes is observed. Therefore, the time for oxygen consumption in the backfill in each case is the same as that reported in the 1-D approach (Figure �-11).
Figure 3-10. Interstitial water velocity field in the modelled domain. Flow in fracture is diverted close to the backfill due to the conductivity contrast. Water velocities in the backfill are as slow as 5·10 –5 m·y–1.
Figure 3-11. Oxygen consumption in the fracture-backfill section in the reference case. As in the 1-D approach, oxygen is quickly consumed in 28 days.
0.050.10.150.20.250.30.350.40.450.50.550.60.650.70.750.80.85Fracture plane
Backfill
0 5 10 15 20 25 30 35 40X (m)
0
5
10
15
20
25
30
35
40
Y (m
)
m·year -1
Fracture plane
Backfill
Fracture plane
Backfill
Fracture plane
30 days 25 days
12 days
Backfill
0 days
[O2](mol·kg-1water)
29
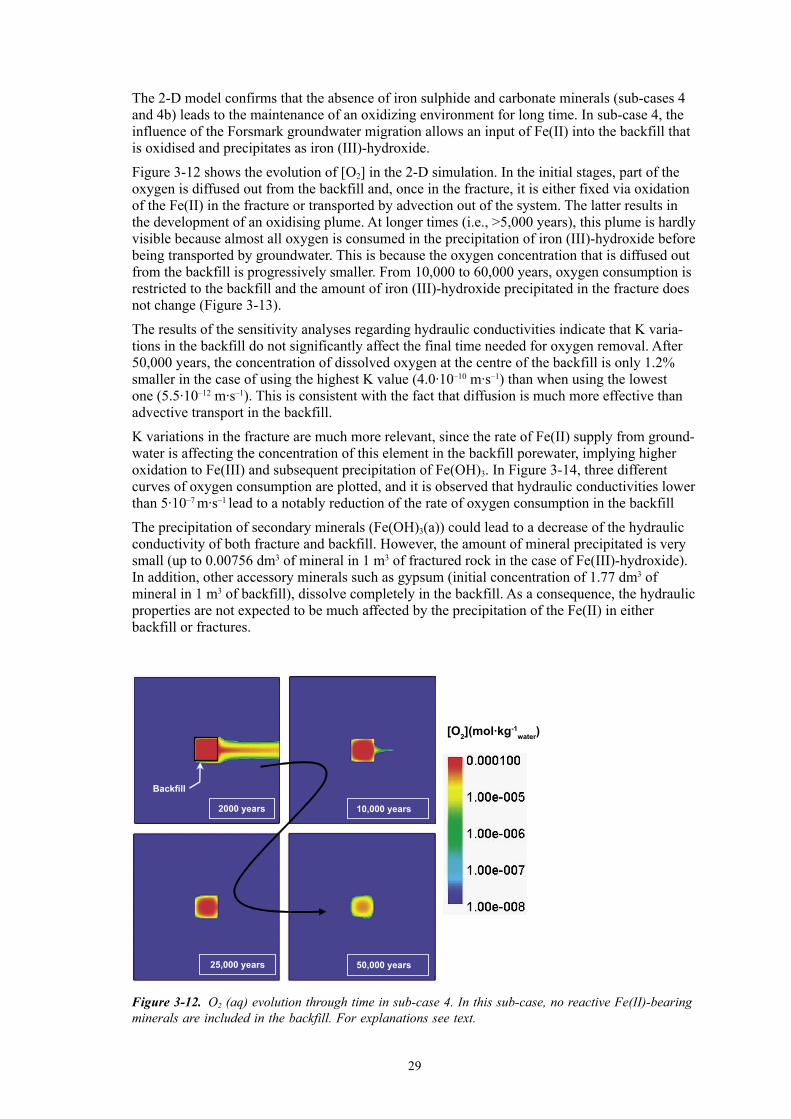
The 2-D model confirms that the absence of iron sulphide and carbonate minerals (sub-cases 4 and 4b) leads to the maintenance of an oxidizing environment for long time. In sub-case 4, the influence of the Forsmark groundwater migration allows an input of Fe(II) into the backfill that is oxidised and precipitates as iron (III)-hydroxide.
Figure �-12 shows the evolution of [O2] in the 2-D simulation. In the initial stages, part of the oxygen is diffused out from the backfill and, once in the fracture, it is either fixed via oxidation of the Fe(II) in the fracture or transported by advection out of the system. The latter results in the development of an oxidising plume. At longer times (i.e., >�,000 years), this plume is hardly visible because almost all oxygen is consumed in the precipitation of iron (III)-hydroxide before being transported by groundwater. This is because the oxygen concentration that is diffused out from the backfill is progressively smaller. From 10,000 to 60,000 years, oxygen consumption is restricted to the backfill and the amount of iron (III)-hydroxide precipitated in the fracture does not change (Figure �-1�).
The results of the sensitivity analyses regarding hydraulic conductivities indicate that K varia-tions in the backfill do not significantly affect the final time needed for oxygen removal. After �0,000 years, the concentration of dissolved oxygen at the centre of the backfill is only 1.2% smaller in the case of using the highest K value (4.0·10 –10 m·s –1) than when using the lowest one (�.�·10 –12 m·s –1). This is consistent with the fact that diffusion is much more effective than advective transport in the backfill.
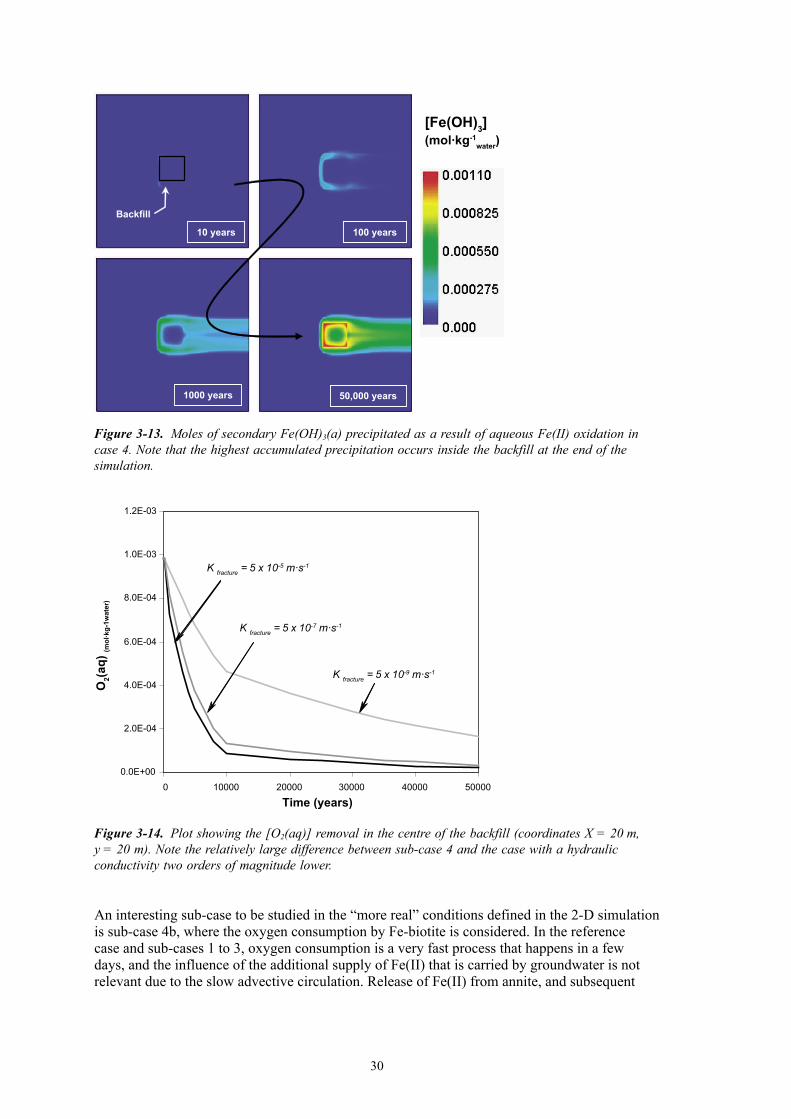
K variations in the fracture are much more relevant, since the rate of Fe(II) supply from ground-water is affecting the concentration of this element in the backfill porewater, implying higher oxidation to Fe(III) and subsequent precipitation of Fe(OH)�. In Figure �-14, three different curves of oxygen consumption are plotted, and it is observed that hydraulic conductivities lower than �·10 –7 m·s–1 lead to a notably reduction of the rate of oxygen consumption in the backfill
The precipitation of secondary minerals (Fe(OH)�(a)) could lead to a decrease of the hydraulic conductivity of both fracture and backfill. However, the amount of mineral precipitated is very small (up to 0.007�6 dm� of mineral in 1 m� of fractured rock in the case of Fe(III)-hydroxide). In addition, other accessory minerals such as gypsum (initial concentration of 1.77 dm� of mineral in 1 m� of backfill), dissolve completely in the backfill. As a consequence, the hydraulic properties are not expected to be much affected by the precipitation of the Fe(II) in either backfill or fractures.
Figure 3-12. O2 (aq) evolution through time in sub-case 4. In this sub-case, no reactive Fe(II)-bearing minerals are included in the backfill. For explanations see text.
[O2](mol·kg-1water)
Backfill
2000 years 10,000 years
25,000 years 50,000 years
�0
An interesting sub-case to be studied in the “more real” conditions defined in the 2-D simulation is sub-case 4b, where the oxygen consumption by Fe-biotite is considered. In the reference case and sub-cases 1 to �, oxygen consumption is a very fast process that happens in a few days, and the influence of the additional supply of Fe(II) that is carried by groundwater is not relevant due to the slow advective circulation. Release of Fe(II) from annite, and subsequent
Figure 3-13. Moles of secondary Fe(OH)3(a) precipitated as a result of aqueous Fe(II) oxidation in case 4. Note that the highest accumulated precipitation occurs inside the backfill at the end of the simulation.
10 years 100 years
1000 years 50,000 years
Backfill
[Fe(OH)3](mol·kg-1
water)
Figure 3-14. Plot showing the [O2(aq)] removal in the centre of the backfill (coordinates X = 20 m, y = 20 m). Note the relatively large difference between sub-case 4 and the case with a hydraulic conductivity two orders of magnitude lower.
0.0E+00
2.0E-04
4.0E-04
6.0E-04
8.0E-04
1.0E-03
1.2E-03
0 10000 20000 30000 40000 50000
Time (years)
O2(a
q) (m
ol·k
g-1w
ater
)
K fracture = 5 x 10⁻⁵ m·s-1
K fracture = 5 x 10⁻⁷ m·s-1
K fracture = 5 x 10⁻⁹ m·s-1
�1
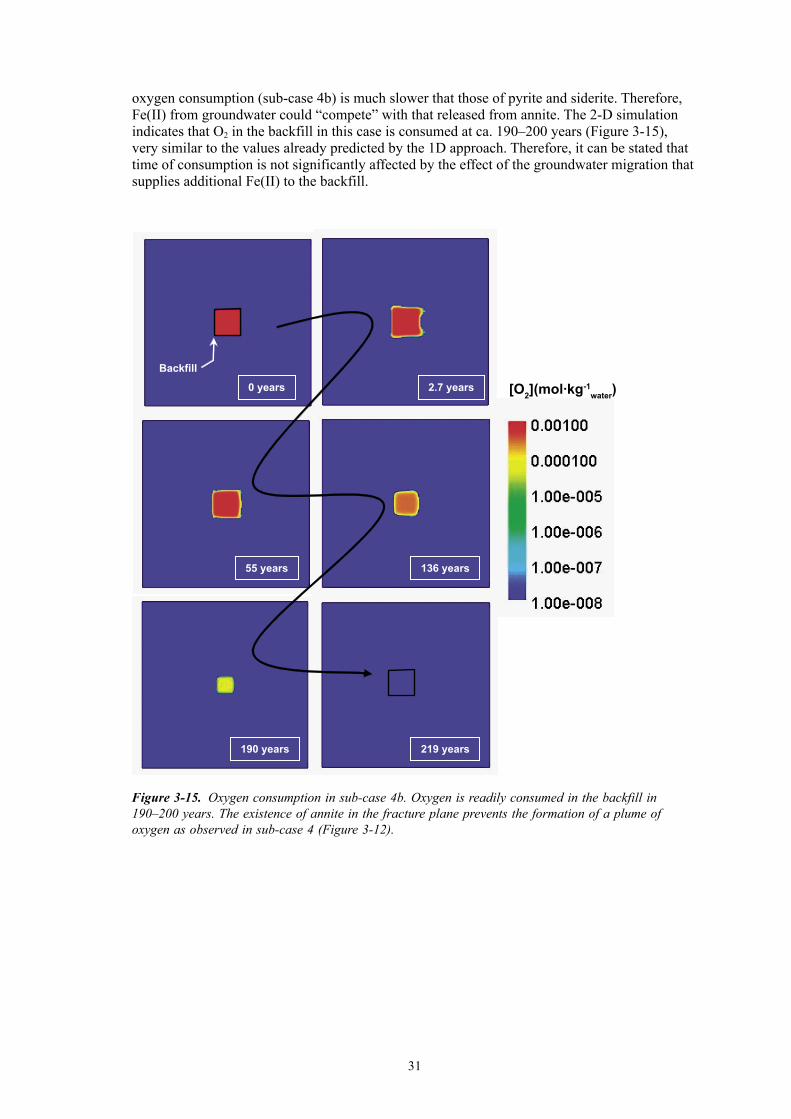
oxygen consumption (sub-case 4b) is much slower that those of pyrite and siderite. Therefore, Fe(II) from groundwater could “compete” with that released from annite. The 2-D simulation indicates that O2 in the backfill in this case is consumed at ca. 190–200 years (Figure �-1�), very similar to the values already predicted by the 1D approach. Therefore, it can be stated that time of consumption is not significantly affected by the effect of the groundwater migration that supplies additional Fe(II) to the backfill.
Figure 3-15. Oxygen consumption in sub-case 4b. Oxygen is readily consumed in the backfill in 190–200 years. The existence of annite in the fracture plane prevents the formation of a plume of oxygen as observed in sub-case 4 (Figure 3-12).
0 years
Backfill
2.7 years
55 years 136 years
190 years 219 years
[O2](mol·kg-1water)
��
4 Finalremarksandconclusions
The results of the present study indicate that oxidising conditions in the backfill in the absence of any mineral able to consume oxygen would prevail for long time periods.
Different processes of oxygen consumption account for the depletion of oxidants in the backfill:
i) oxidation of pyrite,
ii) oxidation of siderite,
iii) oxidation of organic matter,
iv) oxidation of Fe(II)-bearing silicates.
The fastest process is the oxidation of the Fe(II) released from siderite dissolution. However, the amount of siderite in the backfill is still questioned and, therefore, the central hypothesis cannot be based on the presence of Fe(II)-carbonate in the system
The presence of pyrite as an accessory mineral in the bentonite that conforms the backfill consti-tutes an important sink for the oxygen initially present in the unsaturated system. According to the reference case, anoxic conditions will be re-established in the system after 1 month.
The consumption of oxygen due to the release of Fe(II) from ferrous silicates is much slower than that associated with pyrite or siderite oxidation. In the case of assuming that the only geochemical process for oxygen consumption is the oxidation of annite, the time needed for the recovery of anoxic conditions is on the order of 200 years.
The numerical approaches in the present study, show that both Fe(II)-bearing minerals and microbiological activity prevented the formation of oxidant environments for long periods of time in the backfill materials. The time of oxygen consumption in the backfill of a HLNW repository is expected to be very short if compared with other hydrologic and geochemical processes of interest in a performance assessment of the near field, which have time lengths of thousands of years. According to the results here presented, the consumption of oxygen due to geochemical processes governs the time needed for the system to recover anoxic conditions. Other processes, such as diffusion, play a minor role.
From this work, however, it is also observed that oxygen consumption via mineral reaction is dependent on many parameters that may change significantly the absolute time length of such consumption. Most of these parameters appear in the kinetic rate laws of the minerals and, therefore, their uncertainties affect proportionally the number of moles that are oxidised and, consequently, to the moles of oxygen consumed.
One of the most influencing factors is the reactive surface area of the mineral, which depends on the grain density and particle diameter. Lower values will result in a slower dissolution and, consequently, an increase of the time needed for oxygen consumption. The opposite is true when increasing the value, i.e., faster oxygen consumption.
A similar discussion can be developed dealing with the uncertainties related to organic matter oxidation via microbial activity. In this case, parameters such as the maximum oxidation rate for oxygen per mole of biomass (Vm), and the concentration of biomass available (SCH2O) play the same role as the surface area in the abiotic oxidation in terms of pyrite dissolution. The validity of the numerical modelling will then be intimately linked to an accurate selection of these parameters.
The results presented above indicate that oxidising conditions will disappear before one month in the case of geochemical processes occurring in the system but they will remain for more than �,000 years if no geochemical reactions are involved in the consumption of oxygen.
Thus, given the presence of minerals with reductive capacity in the system, it is not foreseen that the presence of oxygen trapped in the backfill material after tunnel closure jeopardizes the geochemical stability of the repository in the long-term.
��
5 References
AllisonJD,BrownDS,Novo-GradacKJ,1991. MINTEQA2/PRODEF2, A Geochemical Assessment Model for Environmental Systems: Version �.0 User’s Manual. EPA/600/�-91/021 Athens, GA, �060�: EPA (USA).
BradburyMH,BaeyensB,2002. Porewater chemistry in compacted re-saturated MX-Bentonite. Physico-chemical characterisation and geochemical modelling. PSI Bericht, Nr.02-10. Waste Management Laboratory Report. Paul Scherrer Institut, Villigen, Switzerland
BörgessonL,JohannessonL-E,GunnarssonD,2003.Influence of soil structure heterogenei-ties on the behaviour of backfill materials based on mixtures of bentonite and crushed rock. Applied Clay Science, 2�, 121–1�1.
BörgessonL,FälthB,HernelindJ,2006. Water saturation phase of the buffer and backfill in the KBS-�V concept. Special emphasis given to the influence of the backfill on the wetting of the buffer. SKB TR-06-14, Svensk Kärnbränslehantering AB.
DershowitzW,WinbergA,HermanssonJ,ByegardJ,TullborgE-L,AnderssonP,MazurekM,2003. Äspö Hard Rock Laboratory. Äspö Task Force on modelling of groundwater flow and transport of solutes. Task 6C. A semi-synthetic model of block scale conductive structures at the Äspö HRL. SKB International progress report; IPR-0�-1�.
DuckworthOW,MartinST,2004. Role of molecular oxygen in the dissolution of siderite and rhodochrosite. Geochimica et Cosmochimica Acta, 68, 607–621.
FalckWE,ReadD,ThomasJB,1996. CHEMVAL2: Themodynamic Database – Final Report. CEC Rep. EUR 16897EN: 164 p.
HartleyL,CoxI,HoltonD,HunterF,JoyceS,GyllingB,LindgrenM,2004. Groundwater flow and radionuclide transport modelling using CONNECTFLOW in support of the SR Can assessment. SKB R-04-61, Svensk Kärnbränslehantering AB.
HossnerLR,DoolittleJJ,2003. Iron sulfide oxidation as influenced by calcium carbonate application. Journal of Environmental Quality, �2, 77�–780.
LangmuirD,1969. The Gibbs free energies of substances in the system Fe-O2 -H2 O-CO2 at 2�°C: U.S. Geological Survey Professional Paper 6�0-B, p. B180–184.
KippKL,1997. Guide to the revised heat and solute transport simulator, HST�D-version 2. U.S. Geological Survey Water Resources Investigations report 97-41�7, 149 pp.
KotelnikovaS,PedersenK,1998. The Microbe REX project: Microbial O2 consumption in the Äspö Tunnel. SKB TR-99-17, Svensk Kärnbränslehantering AB.
KotelnikovaS,PedersenK,2000. Microbial O2 reduction during the REX field experiment. SKB technical report IPR-00-19, Svensk Kärnbränslehantering AB.
ManakaM,KawasakiM,HondaA,2000. Measurements of the effective diffusion coefficient of dissolved oxygen and oxidation rate of pyrite by dissolved oxygen in compacted sodium bentonite. Nuclear Technology, 1�0, 206–217.
MalmströmM,BanwartS,DuroL,WersinP,BrunoJ,1995. Biotite and chlorite weathering at 2� degrees C. The dependence of pH and (bi)carbonate on weathering kinetics, dissolution stoichiometry, and solubility; and the relation to redox conditions in granitic aquifers. SKB TR-9�-01, Svensk Kärnbränslehantering AB.
�6
ManningHL,CookTM,1972. Physiology of acidophilic bacteria of acid mine water. Tch. Rep. 8. Water Res. Center, Univ. of Maryland, College Park. Cited by Hossner and Doolittle (200�).
NicholsonRV,1994. Iron-sulfide oxidation mechanisms: Laboratory studies. In: J.L. Jambor & D.W. Blowes (Eds.) Short Course Handbook on Environmental Geochemistry of Sulfide Mine Wastes, Waterloo, Ontario. Mineralogical Association of Canada, 16�–18�.
OchsM,TalericoC,2004. Sr-Can. Data Uncertainty assessment. Migration parameters for the bentonite buffer in the KBS-� concept. SKB TR-04-18, Svensk Kärnbränslehantering AB.
ParkhurstDL,AppeloCAJ,1999. User’s guide to PHREEQC (version 2) – A computer program for speciation, batch-reaction, one-dimensional transport and inverse geochemical calculations. U.S. Geological Survey Water Resources investigations report 99-42�9.
ParkhurstDL,KippKL,EngesgaardP,CharltonSR,2004. PHAST. A program for simulating ground-water flow, solute transport, and multicomponent geochemical reactions. U.S. Geological Survey Techniques and Methods 6-A8, 1�4 pp.
PeterssonJ,BerglundJ,DanielssonP,WängnerudA,TullborgEL,MattssonH,ThunehedH,IsakssonH,LindroosH,2004. Forsmark site investigation. Petrography, geochemistry, petrophysics and fracture mineralogy of boreholes KFM01A, KFM02A and KFM0�A+B. SKB P-04-10�, Svensk Kärnbränslehantering AB.
PuigdomènechI,AmbrosiJP,EisenlohrL,LartigueJE,BanwartSA,BatemanK,MilodowskiAE,WestJM,GriffaultL,GustafssonE,HamaK,YoshidaH,KotelnikovaS,PedersenK,MichaudV,TrotignonL,RivasPerezJ,TullborgEL,2001. O2 depletion in a granitic media. The REX project. SKB TR-01-0�, Svensk Kärnbränslehantering AB.
PuigdomènechI,2002. MEDUSA: Make Equilibrium Diagrams Using Sophisticated Algorithms. Software based on: Puigdomenech, I (198�). INPUT, SED and PREDOM: computer programs drawing equilibrium diagrams. Report TRITA-OOK-�010, Dept. Inorg. Chem., Royal Institute of Technology, Stockholm.
SalmonSU,MalmstromME,2002. MiMi – Steady state, geochemical box model of a tailings impoundment: Application to Impoundment 1, Kristineberg, Sweden, and prediction of effect of remediation. Report of The MISTRA-programme MiMi Mitigation of the environmental impact from mining waste. ISSN 140�-9478 ISBN 91-89��0-22-7 MiMi Print, Stockholm.
SidbornM,2003. Modelling some biochemically mediated processes in rocks. Licentiate Thesis, Department of Chemical Engineering and Technology, Royal Institute of Technology (KTH).
SKB,2004. Interim initial state report for the safety assessment SR-Can. SKB R-04-��, Svensk Kärnbränslehantering AB.
WersinP,SpahiuK,BrunoJ,1994. Time evolution of dissolved oxygen and redox conditions in a HLW repository. SKB TR-94-02, Svensk Kärnbränslehantering AB.
WilliamsonMA,RimstidtJD,1994. The kinetics and electrochemical rate-determining step of aqueous pyrite oxidation. Geochimica et Cosmochimica Acta, �8, �44�–�4�4.
�7
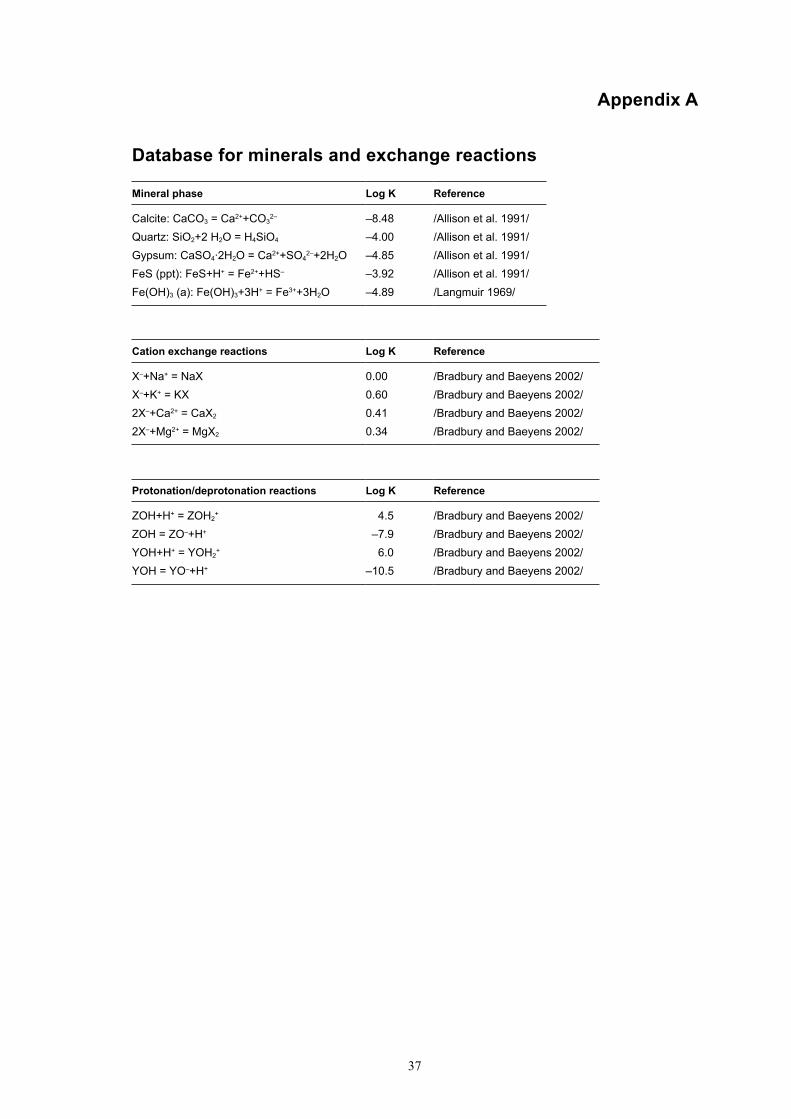
AppendixA
Databaseformineralsandexchangereactions
Mineralphase LogK Reference
Calcite: CaCO3 = Ca2++CO32– –8.48 /Allison et al. 1991/
Quartz: SiO2+2 H2O = H4SiO4 –4.00 /Allison et al. 1991/Gypsum: CaSO4·2H2O = Ca2++SO4
2–+2H2O –4.85 /Allison et al. 1991/FeS (ppt): FeS+H+ = Fe2++HS– –3.92 /Allison et al. 1991/Fe(OH)3 (a): Fe(OH)3+3H+ = Fe3++3H2O –4.89 /Langmuir 1969/
Cationexchangereactions LogK Reference
X–+Na+ = NaX 0.00 /Bradbury and Baeyens 2002/X–+K+ = KX 0.60 /Bradbury and Baeyens 2002/2X–+Ca2+ = CaX2 0.41 /Bradbury and Baeyens 2002/2X–+Mg2+ = MgX2 0.34 /Bradbury and Baeyens 2002/
Protonation/deprotonationreactions LogK Reference
ZOH+H+ = ZOH2+ 4.5 /Bradbury and Baeyens 2002/
ZOH = ZO–+H+ –7.9 /Bradbury and Baeyens 2002/YOH+H+ = YOH2
+ 6.0 /Bradbury and Baeyens 2002/YOH = YO–+H+ –10.5 /Bradbury and Baeyens 2002/