Embed Size (px)
Citation preview
Technical Report Documentation Page 1. Report No.
FHWA/TX06/0-5106-1
2. Government Accession No.
3. Recipient’s Catalog No.
5. Report Date September 2005, Rev. Dec 2005, Second Rev. Feb 2006
4. Title and Subtitle Literature Review of Curing in Portland Cement Concrete Pavement 6. Performing Organization Code
7. Author(s)
Dan Ye, Dan Zollinger, Seongcheol Choi, Moon Won
8. Performing Organization Report No. 0-5106-1
10. Work Unit No. (TRAIS) 9. Performing Organization Name and Address Center for Transportation Research The University of Texas at Austin 3208 Red River, Suite 200 Austin, TX 78705-2650
11. Contract or Grant No. 0-5106
13. Type of Report and Period Covered Technical Report 9/1/04-2/28/05
12. Sponsoring Agency Name and Address Texas Department of Transportation Research and Technology Implementation Office P. O. Box 5080 Austin, TX 78763-5080
14. Sponsoring Agency Code
15. Supplementary Notes Project conducted in cooperation with the Federal Highway Administration, and the Texas Department of Transportation. Project Title: Evaluation of Curing Membrane Effectiveness to Reduce Evaporation.
16. Abstract Curing of concrete has an effect on hardened concrete properties and overall long-term performance of portland cement concrete (PCC) pavement. A significant amount of research has been conducted to evaluate curing effectiveness and its effect on concrete properties. This report synthesizes the findings from the literature review, including the relative humidity measuring techniques. The most frequently measured concrete properties are strength and permeability. They are important properties; however, in portland cement concrete pavement, volume change potential affected by curing effectiveness is as important for its performance. Not much information has been found in this regard. It appears that the curing effect is confined to the surface of the pavement, which is called curing-affected zone (CAZ). The extent of this zone varies, depending on the concrete properties and curing effectiveness, with average values varying from ¼ in. to ½ in. CAZ has a significant effect on the performance of PCC pavement. Further evaluation is needed to investigate the effect of curing on CAZ and overall pavement performance. Other state departments of transportation (DOTs) specifications for curing concrete pavement were investigated and all are nearly identical. They are prescriptive and method-type specifications and no compliance testing is required.
17. Key Words curing, portland cement concrete pavement, pavement performance
18. Distribution Statement No restrictions. This document is available to the public through the National Technical Information Service, Springfield, Virginia 22161. www.ntis.gov
19. Security Classif. (of report) Unclassified
20. Security Classif. (of this page) Unclassified
21. No. of pages 80
22. Price
Form DOT F 1700.7 (8-72) Reproduction of completed page authorized


iii
Literature Review of Curing in Portland Cement Concrete Pavement Dan Ye, Dan Zollinger, Seongcheol Choi, Moon Won CTR Research Report: 0-5106-1 Report Date: September 2005, Rev. December 2005, Second Rev. February 2006. Research Project: 0-5106 Research Project Title: Evaluation of Curing Membranes Effectiveness to Reduce Evaporation Sponsoring Agency: Texas Department of Transportation Performing Agency: Center for Transportation Research at The University of Texas at Austin Project performed in cooperation with the Texas Department of Transportation and the Federal Highway Administration.

- iv-
Center for Transportation Research
The University of Texas at Austin
3208 Red River
Austin, TX 78705
www.utexas.edu/research/ctr
Copyright © 2006
Center for Transportation Research
The University of Texas at Austin
All rights reserved
Printed in the United States of America

- v-
Disclaimers
Authors’ Disclaimer: The contents of this report reflect the views of the authors, who are
responsible for the facts and the accuracy of the data presented herein. The contents do not
necessarily reflect the official view or policies of the Federal Highway Administration or the
Texas Department of Transportation (TxDOT). This report does not constitute a standard,
specification, or regulation.
Patent Disclaimer: There was no invention or discovery conceived or first actually
reduced to practice in the course of or under this contract, including any art, method, process,
machine manufacture, design or composition of matter, or any new useful improvement thereof,
or any variety of plant, which is or may be patentable under the patent laws of the United States
of America or any foreign country.
Engineering Disclaimer
NOT INTENDED FOR CONSTRUCTION, BIDDING, OR PERMIT PURPOSES.
Project Engineer: Moon Won
Professional Engineer License State and Number: Texas No. 76918
P. E. Designation: Research Supervisor

- vi-
Acknowledgments
The authors would thank TxDOT for its financial support for the project.
Products
This report contains Products 1 and 2. Product 1 can be found in Section 3.6 titled Synthesis of
Curing Membrane Effectiveness. Product 2 can be found in Chapter 5 titled Short-Term Curing
Recommendations.

- vii-
Table of Contents
CHAPTER 1 INTRODUCTION ...................................................................................................1
1.1 RESEARCH SIGNIFICANCE............................................................................................ 1 1.2 OBJECTIVE OF THE RESEARCH ................................................................................... 3 1.3 RESEARCH PLAN ............................................................................................................. 3 1.4 REPORT ORGANIZATION............................................................................................... 4
CHAPTER 2 LITERATURE REVIEW ON CURING EFFECTS ...............................................5 2.1 INTRODUCTION ............................................................................................................... 5 2.2 RELATIVE HUMDITY MEASURING DEVICES ........................................................... 8
2.2.1 Humidity Basics............................................................................................................ 8 2.2.2 Principles of Humidity Sensor Operations ................................................................... 9 2.2.3 Errors in Capacitive Humidity Sensors....................................................................... 12 2.2.4 Concrete Relative Humidity Measurement Systems .................................................. 14
2.3 EFFECT OF CURING ON CONCRETE MATERIAL PROPERTIES ........................... 20 2.3.1 Strength ....................................................................................................................... 21 2.3.2 Permeability ................................................................................................................ 24 2.3.3 Weight Loss of Water in Fresh Concrete.................................................................... 25 2.3.4 Abrasion Resistance.................................................................................................... 26
2.4 TWO ISSUES REGARDING CURING APPLICATION IN PORTLAND CEMENT CONCRETE PAVEMENT....................................................................................................... 27 2.5 SUMMARY....................................................................................................................... 30
CHAPTER 3 MOISTURE TRANSPORT IN CURING CONCRETE.......................................31 3.1 INTRODUCTION ............................................................................................................. 31 3.2 THE NATURE OF MOISTURE MOVEMENT............................................................... 31 3.3 HEAT TRANSFER ........................................................................................................... 36
3.3.1 Conduction.................................................................................................................. 39 3.3.2 Convection .................................................................................................................. 40 3.3.3 Irradiation.................................................................................................................... 40 3.3.4 Solar Radiation............................................................................................................ 41 3.3.5 Heat Flux due to Evaporation ..................................................................................... 42
3.4 EVAPORATION ............................................................................................................... 42 3.5 THEORETICAL APPROACH DEVELOPED IN RESEARCH PROJECT 1700 ........... 45 3.6 SYNTHESIS OF CURING MEMBRANE EFFECTIVENESS........................................ 51
CHAPTER 4 SUMMARY...........................................................................................................59 4.1 CONCRETE MATERIAL PROPERTIES AFFECTED BY CURING ............................ 59 4.2 RELATIVE HUMIDITY MEASUREMENT ................................................................... 59 4.3 OTHER STATES’ DEPARTMENTS OF TRANSPORTATION SPECIFICATIONS ON CURING ................................................................................................................................... 60

- viii-
4.4 EFFECTIVENESS OF VARIOUS CURING MEMBRANES OR METHODS .............. 60
CHAPTER 5 SHORT-TERM CURING RECOMMENDATIONS............................................63
REFERENCES ..............................................................................................................................65

ix
List of Figures
Figure 2.1 Influence of water/cement ratio and degree of hydration on strength and permeability (Powers, 1968)....................................................................................6
Figure 2.2 Types of water associated with the calcium-silicate-hydrate (Mehta and Monteiro, 1993) .......................................................................................................7
Figure 2.3 (a) Loss of water as a function of the relative humidity; (b) shrinkage of a cement mortar as a function of the water loss (Mehta and Monteiro, 1993) ........................................................................................................................8
Figure 2.4 Configurations of chilled mirror sensor ......................................................................10
Figure 2.5 Electronic configuration of capacitive humidity sensor (Roveti 2001).......................11
Figure 2.6 Near-linear response of capacitance to applied humidity (Roveti 2001) ....................12
Figure 2.7 A-TEK ACMM system ...............................................................................................15
Figure 2.8 Dallas Semiconductor Hygrochron .............................................................................16
Figure 2.9 Sensirion SHT75 .........................................................................................................17
Figure 2.10 Vaisala HM44............................................................................................................17
Figure 2.11 Test setup for the air RH measurements....................................................................19
Figure 2.12 Results of the lab test.................................................................................................19
Figure 2.13 Comparison of chilled mirror with capacitive type sensors ......................................20
Figure 2.14 Compressive strength of cylinder as a function of age for a variety of curing conditions (Kosmatka and Panarese, 1988)................................................22
Figure 2.15 Application rate versus tensile strength normalized as a percentage of the tensile strength of the control specimens (Pechlivanidis et. al., 1988) ..................23
Figure 2.16 Application rate versus flexural strength normalized as a percentage of the flexural strength of the control specimens (Pechlivanidis et. al., 1988) ......................................................................................................................23
Figure 2.17 Effects of delaying curing on abrasion resistance (Sawyer, 1957) ...........................26
Figure 2.18 Combined influence of bleeding characteristics and evaporation in determining the time at which the surface of concrete begins to dry (ACI 308R-01) .......................................................................................................28

- x-
Figure 3. 1 Desorption-isotherms (Bazant 1970)..........................................................................33
Figure 3. 2 Weight Loss versus Relative Humidity of Drying Concrete at Various ....................34
Figure 3. 3 Thermal Conduction through an Infinitesimal Small Control Volume (Incropera and DeWitt 1996) .................................................................................37
Figure 3. 4 Heat Transfer Mechanisms between Pavement and Its Surroundings (Ruiz et al. 2001)....................................................................................................40
Figure 3. 5 ACI Evaporation Nomograph (ACI 1996) .................................................................44
Figure 3. 6 Trends of Surface Moisture Emissivity:.....................................................................48
Figure 3. 7 Validation of New Evaporation Model at Field: (a) Solar Radiation and Wind Speed Measured by Weather Station; (b) Comparison of Rate of Evaporation among Measurement, New Model, and ACI Nomograph.................49
Figure 3. 8 Lab Tests ....................................................................................................................50

- xi-
List of Tables
Table 3-1 Comparison of curing efficiency results......................................................................52
Table 3-2 Typical properties of curing compounds......................................................................54

- xii-

- 1-
CHAPTER 1 INTRODUCTION
Hydraulic cement requires water and adequate temperature to develop cementing properties that bind fine and coarse aggregates in concrete. The chemical reaction between hydraulic cement and water is called hydration. With insufficient water, the hydration will not proceed and the resulting concrete may not possess the desirable properties such as strength and durability. It is important to keep sufficient moisture in the concrete while the cement is actively hydrating, especially at early ages. This is particularly true for paving concrete. TxDOT research study 0-1700 identified loss of moisture from concrete as one of the primary causes of severe spalling problems and TxDOT initiated this study. Providing adequate moisture and temperature to facilitate the hydration of cement is called curing. This report addresses the moisture aspect of curing. 1.1 RESEARCH SIGNIFICANCE
Cather (1994) eloquently described the issues facing engineers in dealing with concrete curing as follows:
Curing can be shown to have a marked effect on the hydration of cements. The transfer of this benefit to the performance of concrete structures is more difficult and variable. The particular performance requirements to resist different aggressive situations need to be considered carefully in the light of the potential benefits of curing. It is clear from the available evidence that compressive strength development in structures is one of the properties least sensitive to curing. The specification of curing is currently based on vague scientific evidence, and is much influenced by preconception of the requirements and what appears to have been satisfactory previously. The final application of curing measures to real concretes is not taken sufficiently seriously by specifiers or contractors. Part of this problem may be due to a lack of any compliance testing and to contract documentation that makes no provision for penalties in the event of curing not being carried out. The Texas Department of Transportation (TxDOT) curing specifications and
operations are not exceptions to the above description, especially “the specification of curing is currently based on vague scientific evidence,” and “Part of this problem may be due to a lack of any compliance testing.” This does not mean the specifications need to be more complicated than they are, considering the fact that at TxDOT more work is done with fewer inspectors in the field. What needs to be done is to develop simple and straightforward specifications, based on solid engineering evidence, with simple testing procedures conducted during concrete placement that evaluate the compliance with the specification requirements.

- 2-
In portland cement concrete (PCC) pavement, the concrete near the surface is subject to the most-severe stresses due to environmental and wheel loadings. To provide long-term (more than 30 years) satisfactory performance of PCC pavement with minimal maintenance required, it is vital to provide conditions to sufficiently hydrate concrete near the top surface. TxDOT has recognized the importance of curing in PCC pavement construction and has developed new requirements in 2004 Specification Item 360. The changes for membrane curing from 1993 Specifications are as follows:
• 1993 Specification Item 360: After final finish and immediately after the free surface moisture has disappeared, the concrete surface shall be sprayed uniformly with a curing compound at a rate of coverage recommended by the manufacturer and directed by the Engineer, but not less than one gallon per 180 square feet of surface area.
• 2004 Specification Item 360: After texturing and immediately after the free
surface moisture has disappeared, spray the concrete surface uniformly with 2 coats of membrane curing compound at an individual application rate of not more than 180 sq. ft. per gallon. Apply the first coat within 10 min. after completing texturing operations. Apply the second coat within 30 min. after completing texturing operations.
The primary differences between the two specifications include the application time
limits and the application rate. The application time limits of 10 min. and 30 min. appear to be selected based on engineering judgment, rather than sufficient technical data. Even though double applications might provide a more efficient curing system, the effectiveness doesn’t appear to be evaluated.
Another item of practical significance is when to start applying curing membrane. Item 360 for both 1993 and 2004 specifies the timing of curing initiation as “….after the free surface moisture has disappeared.” It’s easy to specify this requirement; however, this requirement is difficult to enforce because it is not measurable. Normally, the timing of curing membrane application is determined by the construction crew based on their experience
Normally, in TxDOT PCC paving projects, membrane curing is applied right after
texturing (tining) operations are completed. Therefore, for all practical purposes, the start of the curing membrane application depends on texturing operations. The potential problem with this type of operation is that the curing membrane application will depend on the setting characteristics of concrete. If the setting is delayed owing to the use of supplementary cementing materials (SCM), such as fly ash or ground-granulated blast furnace slag or other incompatibilities of the materials in concrete, texturing operations and the start of curing could be delayed. Meanwhile, the pozzolanic reaction between SCM and cement hydration by-product (calcium hydroxide) requires higher relative humidity (RH) than that required for hydration of cement. The evaporation rate and setting characteristics are quite independent, and it doesn’t seem to make sense that, in

- 3-
the current construction practices, the start of curing depends primarily on the setting characteristics.
The significance of this research study is to evaluate the effectiveness of current TxDOT curing specifications and practices and to make recommendations for potential improvements to both. 1.2 OBJECTIVE OF THE RESEARCH
As described above, the current TxDOT specifications on curing in Item 360 are based on vague scientific evidence and there is no compliance testing included in the specifications. In other words, the quality of the curing operation is not quantitatively measured. In this sense, curing in Item 360 is purely a method-type specification. As better information becomes available on the relation between construction quality and the performance of PCC pavement, performance-related specifications (PRS) will be in wider use. In some ways, TxDOT is already headed in that direction. It is time to quantify the effectiveness of curing on the long-term performance of PCC pavement and develop compliance testing procedures.
The primary objective of this research is to properly evaluate the current TxDOT curing practices, including curing materials; identify areas of improvements needed; quantify the effectiveness of curing on long-term PCC pavement performance; and finally develop recommendations for simple and easy-to-use compliance testing procedures for curing effectiveness. 1.3 RESEARCH PLAN
First, a literature review has been conducted to gather information on curing-related activities. This report summarizes the findings. Extensive laboratory evaluation of various curing materials will be conducted to understand whether there are any differences in the curing effectiveness among commercially available curing compound materials.
Field evaluations of TxDOT’s curing practices will be conducted. Because the start of the curing operations is significantly affected by the texturing operations, the timing of which is normally related to setting characteristics, the correlation between the setting and curing will be evaluated.
The effectiveness of curing operations will also be evaluated in terms of RH of the concrete, the quality of the concrete materials, and volume change potential of the concrete.
Once these tasks are completed, recommendations will be made to improve TxDOT’s curing practices.

- 4-
1.4 REPORT ORGANIZATION
This chapter was prepared by the Center for Transportation Research (CTR).
Chapter 2 summarizes the findings of the literature review on curing, including RH measurement principles and devices, which were performed by CTR.
Chapter 3 describes an in-depth review of moisture transport in curing concrete, including a literature review on curing materials and methods. This was prepared by the Texas Transport Institute (TTI).
Chapter 4 presents the summary of the literature review presented in Chapters 2 and 3 and was prepared by CTR.
Chapter 5 presents interim recommendations on curing, which were prepared by TTI.

- 5-
CHAPTER 2 LITERATURE REVIEW ON CURING EFFECTS
Because of the significant effect curing has on the quality of concrete and long-term performance of concrete structures, a number of research studies have been conducted on this issue. This chapter summarizes the findings of the previous studies, including relative humidity (RH) measurement principles and devices. 2.1 INTRODUCTION
Concrete is a heterogeneous material, composed of aggregates, cement, water and
voids. In general, the quality of the concrete depends on the amount of voids in concrete, called capillary voids. There is a strong correlation between the amount of voids in concrete and strength/permeability as shown in Figure 2.1. It shows that, as the ratio of solid to void increases, strength increases and permeability improves. The voids in concrete, except for entrained and entrapped air, are created as the volume initially occupied by water is vacated as the water is consumed during the hydration process. Voids initially occupied by water in concrete are filled with hydration products as hydration progresses. As long as these voids are sufficiently filled with hydration products, the quality of concrete will be maintained at a satisfactory level. In order to produce concrete with fewer capillary voids, two things can be tried. One is to reduce the amount of water in the fresh concrete. This is one of the reasons why concrete with low water/cement (w/c) ratio provides better quality concrete. The other is to promote the hydration of cement as much as possible so that the hydration products will fill the voids. From this logic, not all mixtures need to reach their full hydration potential to perform satisfactorily, especially when low w/c ratio is used.
Because the hydration of cement is required, it is the availability of moisture in the concrete pores that determines the rate of hydration.

- 6-
Figure 2.1 Influence of water/cement ratio and degree of hydration
on strength and permeability (Powers, 1968)
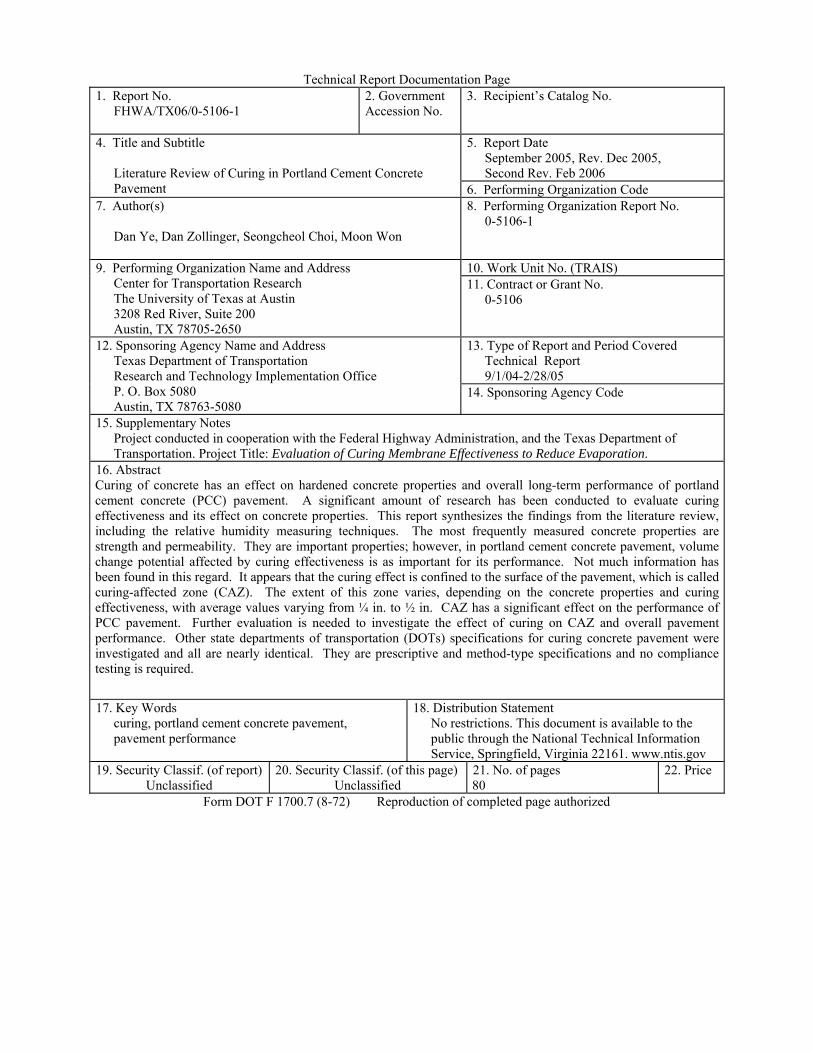
The water incorporated in concrete mixing will eventually exist in hardened concrete in four forms, as shown in Figure 2.2: (1) chemically bound water or hydrate water, (2) interlayer water, (3) adsorbed water, and (4) capillary water or free water. Chemically bound water is the water consumed for hydration and needed for the formation of hydration products, including calcium-silicate-hydrate (C-S-H). In order to hydrate a unit mass of cement, an average value of approximately 0.25 of a mass fraction of water is needed. Interlayer water is the water molecules existing between the layers of C-S-H, and is strongly held by a hydrogen bond. This interlayer water is lost only on strong drying; in PCC pavement, this water is rarely lost. Adsorbed water molecules are physically adsorbed onto the surface of the hydrated solids. A major portion of the adsorbed water can be lost by drying to 30 percent RH. The loss of adsorbed water is mainly responsible for the shrinkage of the concrete on drying (Mehta 1993). Capillary water is present in voids of concrete larger than about 50A. This water is free from the influence of the attractive forces exerted by the solid surface. It bonds the least to the hydrated solid particles compared with the other water types in concrete and its removal does not result in significant shrinkage of the concrete. The relationship between the loss of various water in concrete described above and the changes in RH are shown in Figure

- 7-
2.3 (a), along with the resulting shrinkage in Figure 2.3 (b). The figures illustrate that the loss of capillary water does not result in significant loss of RH or shrinkage. However, they show that it is the loss of adsorbed water that is mainly responsible for the drying shrinkage.
Figure 2.2 Types of water associated with the calcium-silicate-hydrate (Mehta and
Monteiro, 1993)
Figure 2.3 (a) also shows that the combined water (chemically bound water and interlayer water) is not lost even at low RH. From these discussions, it is clear that the purpose of curing is to keep enough moisture in the concrete to promote continued hydration, thus continuously filling the voids with hydration products, which will increase the strength and improve permeability and durability of the concrete. Another purpose is to keep the adsorbed water from loss so that the drying shrinkage is minimized. In PCC pavement, controlling volume changes at the early ages is critical for ensuring long-term performance because, at the early age, the concrete is still weak and thus prone to microscopic damage due to volume changes. These microscopic damages that occur at the early ages might result in surface distress in PCC pavement at later ages.
- 8-
Figure 2.3 (a) Loss of water as a function of the relative humidity; (b) shrinkage of a
cement mortar as a function of the water loss (Mehta and Monteiro, 1993)
Curing of concrete has an effect on the properties of hardened concrete such as strength, permeability, abrasion resistance, volume stability and resistance to freezing and thawing. In structural concrete, strength, permeability and resistance to freezing and thawing are important and, consequently, the majority of the research studies concentrated on those properties. However, in PCC pavement, strength affected by curing is not the major concern; rather, abrasion resistance, volume stability and resistance to freezing and thawing are more important. The sections below describe the findings of the literature review on curing of concrete, including RH measuring principles and devices and concrete properties affected by curing. 2.2 RELATIVE HUMDITY MEASURING DEVICES
In PCC, it is reported that cement in equilibrium with air at 80 percent RH hydrated at only 10 percent the rate as companion specimens in a 100 percent RH curing environment. On the other hand, it is quoted that at 80 percent RH, the hydration rate drops to about 32 percent. Even though different hydration rates are reported at 80 percent RH, it is generally accepted that 80 percent RH is the minimum value required for hydration to continue to proceed. The availability of moisture in the concrete is represented by RH in the pores. Relative humidity is the ratio of the water vapor density (or pressure) to the saturation water vapor density (or pressure). 2.2.1 Humidity Basics 2.2.1.1 Humidity
Humidity refers to the water vapor content in air or other gases. Humidity measurements can be stated in a variety of terms and units. The three commonly used terms are absolute humidity, dew point and RH.

- 9-
2.2.1.2 Absolute Humidity
Absolute humidity is the ratio of the mass of water vapor to the volume of air or gas. It is commonly expressed in grams per cubic meter or grains per cubic foot (1grain = 1/7000 lb.). It can be calculated from known RH, dry bulb temperature, or wet bulb temperature, or it can be measured directly. 2.2.1.3 Dew Point
Dew point, expressed in ˚C or ˚F, is the temperature at which a gas begins to condense into a liquid under constant barometric pressure. The higher the humidity in the air, the higher the dew point. Accurately measuring dew point allows the estimation of RH. Chilled mirror hygrometers have made dew point measurements possible since the early 1960s, but the development of stable thin film capacitive sensors in the 1980s allows the measurement of dew point at a fraction of the chilled mirror cost. Calibration data for each specific sensor are stored in nonvolatile memory for improved accuracy. In contrast, chilled mirrors measure dew point in real time and do not require stored data for measurements. 2.2.1.4 Relative Humidity
Relative humidity refers to the ratio (stated as a percent) of the moisture content (or vapor pressure) of air compared to the saturated moisture level (or vapor pressure) at the same temperature and pressure. There are several ways to measure RH. One is the use of dew point measurement. Chilled mirrors measure dew point directly and convert to RH in concrete. Lately, specialized polymer-based resistive and laser-trimmed capacitive sensors with monolithic signal conditioners have been introduced to estimate the RH in concrete. These devices provide means to evaluate RH quite accurately in concrete at low cost. 2.2.2 Principles of Humidity Sensor Operations 2.2.2.1 Dew Point Humidity Sensor (Chilled Mirror Sensor)
Chilled mirrors measure the dew or frost point temperature directly by controlling a reflective surface to an equilibrium temperature between dew/frost formation and evaporation.
Chilled mirror sensors consist of a small polished hexagonal rhodium or platinum mirror attached to thermoelectric cooling module (TEC). The monitor’s servo controller applies current to the TEC, which causes the mirror to cool (see Figure 2.4). The mirror is illuminated with a regulated gas emitter, which transmits light in the infrared spectrum. The light reflected by the mirror is received by a photo-detector. When water vapor condenses on the mirror as water or frost (ice crystals), the light reflected by the photo-detector is reduced due to scattering (Mastangbrook and Dinger 1960). This makes the

- 10-
servo controller reduce the power, causing the mirror temperature to go up slightly. The control system will modulate the amount of current flowing through the TEC to maintain a temperature where the rate of condensation and evaporation of water molecules and the mass of water on the mirror is constant. The resulting temperature of the mirror is then, by definition, the dew or frost point temperature. A precision four-wire platinum RTD (Resistance Temperature Detector) imbedded in the mirror measures the temperature.
Figure 2.4 Configurations of chilled mirror sensor
Dry bulb temperature is measured with a precision four-wire platinum RTD and
pressure is measured with a piezo-resistive silicon pressure transducer. The dew/frost point and dry bulb RTD resistance signals are conditioned and amplified by the monitor to display and transmit dew/frost point and temperature. The cardinal measurements of dew point ( dpT ), and dry bulb temperature (T ) are used to calculate RH values using the following psychometric equation.
⎥⎥⎦
⎤
⎢⎢⎣
⎡⎟⎠⎞
⎜⎝⎛
+−⎟
⎟⎠
⎞⎜⎜⎝
⎛
+=
TT
TT
Hdp
dp
0.2415.17
0.2415.17
exp (2-1)
2.2.2.2 Capacitive Humidity Sensor
The capacitive humidity sensor consists of a hygroscopic dielectric material placed between a pair of electrodes, which forms a small capacitor. Most capacitive sensors use plastic or polymer as the dielectric material, with a typical dielectric constant ranging from two to fifteen. When no moisture is present in the sensor, both this constant and the sensor geometry determine the value of capacitance (Roveti 2001).
At normal room temperature, the dielectric constant of water vapor has a value of about eighty, much higher than the constant of the sensor dielectric material. Therefore,

- 11-
absorption of water vapor by the sensor results in an increase in sensor capacitance. At equilibrium conditions, the amount of moisture present in a hygroscopic material depends on both the ambient temperature and the ambient water vapor pressure. This is true also for the hygroscopic dielectric material used on the sensor.
By definition, RH is a function of both ambient temperature and water vapor pressure. Therefore, RH, the amount of moisture present in the sensor, and sensor capacitance are related and this relationship forms the base of a capacitive humidity instrument’s operation.
Electronic configuration of the capacitive humidity sensor is shown in Figure 2.5. A polymer layer is placed between a metal electrode and a coated glass substrate. The dielectric permittivity of the polymer depends on its water content. The electronics of the instrument measure the capacitance of the sensor and convert it into a humidity reading.
Figure 2.5 Electronic configuration of capacitive humidity sensor (Roveti 2001)
The capacitance of the sensor C is as follows
d
AHRC HR ⋅⋅= 0...).( εε (2-2)
Where C (RH) is a sensor capacitance at a given relative humidity; ..HRε is
relative dielectric permittivity that depends on humidity; 0ε is permittivity of vacuum; A is the area of the electrode; and d is the distance between the electrodes.
Each capacitive sensor is individually calibrated in a precision humidity chamber with a chilled mirror hygrometer as reference. Thin film capacitive sensors may include monolithic signal conditioning circuitry integrated onto the substrate. The most widely used signal conditioner incorporates a CMOS timer to pulse the sensor and to produce a near-linear voltage output (see Figure 2.6).

- 12-
Figure 2.6 Near-linear response of capacitance to applied humidity (Roveti 2001)
2.2.3 Errors in Capacitive Humidity Sensors
For the purpose of analysis, errors of measurement can be divided into two broad categories: systematic and random errors. Systematic errors are predictable and repeatable, both in magnitude and sign. Errors resulting from a nonlinearity of the instrument or from temperature effects fall into this profile. Random errors, however, are not fully predictable because they essentially depend on factors external to the instrument. Errors resulting from sensor hysteresis, as well as those resulting from the calibration procedure are random errors. Normally, random errors are estimated on the basis of statistical data, experience and judgment. 2.2.3.1 Linearity Error
The typical response of a RH sensor (between 0 and 100 percent RH) is nonlinear. Depending on the effectiveness of the correction made by the electronics circuits, the instrument may have a linearity error.
Generally, the values recommended by the instrument manufacturer for calibration are determined so as to minimize the linearity error. Improper selection of the calibration values can result in a different distribution of the linearity error and can be detrimental to instrument accuracy. 2.2.3.2 Temperature Error
Sensor hygroscopic properties vary with temperature. An assumption made in this type of RH measurement devices is that the relationship between the amount of moisture present in the sensor hygroscopic material and the RH is constant for all temperature ranges. However, in most hygroscopic materials, this relationship varies with temperature. In addition, the dielectric properties of the water molecule are affected by temperature. At 20˚C, the dielectric of water has a value of about 80. This constant increases by more that 8 percent at 0˚C and decreases by 30 percent at 100˚C.

- 13-
Sensor dielectric properties also vary with temperature. The dielectric constant of most dielectric materials decreases as temperature increases. Any length of cable connecting the sensor to the electronic circuits has its own capacitance and resistance. The electronic circuits cannot discriminate between the sensor and its connecting cable. Therefore, because the capacitance of the sensor and the cable can vary with temperature, the humidity values reported by the electronics must compensate for the effects of temperature. 2.2.3.3 Hysteresis
Hysteresis is the maximum difference that can be measured between corresponding pairs of data, obtained by running an ascending and a descending sequence of humidity conditions. Hysteresis determines the repeatability of a humidity instrument.
For any given instrument, the value of hysteresis depends on a number of things: the total span of the humidity cycle used to measure hysteresis; exposure time of the sensor to each humidity condition; temperature during the measurements; criteria used to determine sensor equilibrium; and previous sensor history. Usually, sensor hysteresis increases as the sensor is exposed to high humidity and high temperature over longer periods of time.
Because of these unique properties, it is not meaningful to state a sensor’s hysteresis values without providing details on how the tests were performed. In actual measurement practice, conditions are extremely diverse and hysteresis may or may not reach its maximum value. When the accuracy of an instrument is specified, half the maximum value of hysteresis should be equally distributed as a positive and a negative error. 2.2.3.4 Calibration Error
Calibration consists of adjusting the instrument output to the values provided by two or more reference humidity conditions. The accuracy of these conditions is critical. The reference instruments used to provide known humidity and temperature values for calibration have their own accuracy in repeatability and hysteresis values that must be taken into consideration when specifying final instrument accuracy. 2.2.3.5 Long-Term Stability
As important as instrument accuracy, if not more so, is the instrument’s ability to return the same values for RH for a given humidity condition over a long period of time. Usually termed repeatability, this measures an instrument’s ability to maintain its calibration in spite of shifting characteristics of the sensor and its associated electronics over long periods of time. Generally, the problem of repeatability can be divided into two areas: the ability of the sensor to maintain its response to a given humidity condition at a given temperature and the stability of the electronics over time.

- 14-
Long-term stability plays a critical role in the frequency of calibration required for a humidity instrument. In addition, the stability of the instrument also significantly affects the value of the measurement data received from the instrument between calibration cycles. Both of these points should help when evaluating various instruments in order to determine the most optimum system. 2.2.3.6 Response Time
Humidity sensors require a given time for reaching stable humidity and temperature equilibrium. The humidity is a function of temperature and decreases with increasing temperature; any differences between sensor and ambient temperatures at a given time lead to measurement errors. Thus, the response time has a significant effect on the RH measurement accuracy. 2.2.4 Concrete Relative Humidity Measurement Systems
As discussed above, RH measuring devices can be classified into two general categories: dew point type and capacitive type. Four available devices for RH measurements in concrete are described below: one is a dew point type and the other three are capacitive type. 2.2.4.1 Advanced Concrete Moisture Monitoring System
This system is a dew point type RH measurement system. The advanced concrete moisture monitoring (ACMM) system shown in Figure 2.7 includes a chilled mirror type dew point and temperature probe. The ACMM sensor is inserted in freshly poured concrete or in a hole drilled in hardened concrete. There are four holes in the probe to allow the vapor pressure of the concrete to equilibrate with that of the probe inside. As the moisture inside the testing hole is equalized with that in the concrete pores surrounding the testing hole, the moisture sensor detects the RH value and continues this process at a given time frequency.
The ACMM system provides the most accurate measurement of RH in fresh concrete and can be used as the reference values in comparative testing of various RH sensors.

- 15-
Figure 2.7 A-TEK ACMM system
2.2.4.2 Hygrochron (DS1923)
Hygrochron (DS1923) is a rugged, self-sufficient system that measures temperature and humidity, and records the results in a protected memory section. Hygrochron adds an embedded humidity sensor to the temperature-logging capability of the high-capacity Thermochron to create a data logger that records both temperature and humidity (Figure 2.8). With these two pieces of data, RH can be logged as a function of time. The tiny opening in the lid of the Hygrochron iButton employs a special filter that allows water vapor to pass through and reach the internal humidity sensor, but repels liquid-phase water.
The Hygrochron has been used extensively in test specimens and in the field by researchers during TxDOT Project 0-1700. The RH measurement accuracy is reported to be ±5.0 percent. For use in concrete, a containment device that protects the Hygrochron from water in wet concrete while allowing the passage of vapor has been developed and implemented in the field measurements.

- 16-
Figure 2.8 Dallas Semiconductor Hygrochron
2.2.4.3 SHT75 The SHT75 is a high-precision RH and temperature sensor. Figure 2.9 shows the
probe and the data processing unit. The sensor, approximately 20 mm in length, is packaged in a small plastic tube with one end sealed and the opposite end covered with Gore-Tex. The Gore-Tex allows water vapor to pass through while blocking any liquid water from entering the tube. This allows the sensor to be cast directly into fresh concrete. Internal RH measurement can begin immediately and the accuracy of RH measurement is reported to be in the range of ±3.5 percent. The condensation problem can occur when SHT75 is installed into the fresh concrete. This device does not have memory in the system and, to record the RH for a period of time, this device should be connected to the computer to download and save the data. Therefore, SHT75 can be used effectively in a laboratory testing environment, but not in the actual paving projects. This device has been used extensively to measure RH in concrete for research.

- 17-
Figure 2.9 Sensirion SHT75
2.2.4.4 HM44
In this system, a hole is bored in the concrete at the required depth, cleaned out, and a plastic sleeve inserted. At this point, the probe can be pushed into the sleeve and sealed. The material at the bottom of the hole releases humidity onto the space around the probe until equilibrium is reached. The HM44 meter can then be connected to the probe cable and a reading can be taken. The accuracy of RH measurement is in the range of ±3.0 percent. As with SHT75, HM44 is more suitable for laboratory experiments than for field applications due to the lack of memory in the system.
Figure 2.10 Vaisala HM44

- 18-
2.2.4.5 Comparison of Various Sensors
To compare the RH values from various RH gages, three RH measurement devices were used: Vaisala HM44, Sensirion SHT75, and Dallas Semiconductor Hygrochron. The purpose was to evaluate their accuracy and applicability in the field. One Vaisala HM44 kit (Figure 2.10) and several Sensirion SHT75 sets (Figure 2.9) and Hygrochrons (Figure 2.8) were used. A laboratory test was conducted to investigate RH readings in the air using the three different devices. One Vaisala HM44, two Hygrochrons, and six Sensirion SHT-75s were used in this test. Figure 2.11 shows the test setup, using a small room as a test chamber.
After the devices had been stabilized to the existing ambient humidity and temperature, boiling water was used to gradually increase the room temperature and the water vapor pressure. After about one hour, no additional water was boiled and the room was left closed for new temperature and moisture conditions. Then the door was opened to allow the temperature and humidity to return to normal indoor levels. Thus, the room was cycled from relatively low humidity, to near saturation conditions, and back to low humidity environment. The results of this experiment are shown in Figure 2.12.
The general patterns of all the readings are very similar. The readings from the six SHT75s are basically the same, which suggests that differences between SHT75 units will be negligible. The readings from the two Hygrochrons show some differences, but the differences are less than 2 percent. Accuracy of these types of devices is generally specified to be less than 5 percent, which implies that all three devices tested in this experiment can be used effectively to measure the RH up to near saturation conditions (approximately 95 percent RH). In this figure, it is also noted that SHT75 has the least response time (most quick to respond).

- 19-
Figure 2.11 Test setup for the air RH measurements
0
10
20
30
40
50
60
70
80
90
100
0 10 20 30 40 50 60 70 80 90 100
Elapsed Time (min.)
Rel
ativ
e H
umid
ity (%
)
Vaisala(HM44)Hygrobutton 1Hygrobutton 2SHT-75-1SHT-75-2SHT-75-3SHT-75-4SHT-75-5SHT-75-6
Figure 2.12 Results of the lab test
The indoor test was conducted to compare chilled mirror sensors with capacitive
and resistive type humidity sensors. The humidity sensors used in the test were chilled mirror, Hygrochron, and HM44. Figure 2.13 shows the test results, which indicates that

- 20-
measured RH from chilled mirror showed lower values than those of other sensors, with the difference being about 5 percent. However, the variations of RH over time are consistent, implying that any device can be effectively used to compare curing effectiveness with that under the known curing condition.
40
50
60
70
0 1 2 3 4Time (days)
Rel
ativ
e hu
mid
ity (%
)
Hygrochron
Chilled mirror
HM44
Figure 2.13 Comparison of chilled mirror with capacitive type sensors
2.3 EFFECT OF CURING ON CONCRETE MATERIAL PROPERTIES
As described earlier, in other than water-saturated curing, the water loss will be most rapid at the outer surface and lowest at some point remote from the surface. Cather (1994) termed the depth between the surface and the point internally where the external environment is having virtually no effect on the local humidity regime the curing-affected zone (CAZ). CAZ will vary depending on a number of variables such as w/c ratio, environmental conditions during curing, and the use of supplementary cementing materials (SCMs). This zone extends from the surface to a depth varying from approximately ¼ to ¾ inches. Concrete properties in CAZ will be strongly influenced by curing effectiveness, while properties farther from the surface will be less susceptible to moisture loss. Thus, it is likely that load-carrying capacity of the structure is the least sensitive property to curing. Conversely, the properties that depend on the outmost skin (0.04 in. – 0.08 in.) of concrete, such as weathering or abrasion resistance, will be greatly influenced by the efficiency of the curing. Between these two extremes lies the zone that governs most of the durability aspects of concrete that cause concern (Cather 1994).
Because of this particular aspect of CAZ, there are concrete properties that are sensitive to curing; however, there are concrete properties that are not sensitive to curing.

- 21-
It is important to select the right concrete properties when evaluating curing effectiveness. Otherwise, the evaluation methodologies might not be valid and erroneous conclusions can be made.
Because of CAZ, such concrete properties as strength and modulus of elasticity may not be sensitive to curing effectiveness. On the other hand, surface hardness, abrasion resistance, scaling resistance, surface permeability and absorption, flexural tension strength, surface cracking, surface strain capacity, and similar surface-type properties are strongly influenced by curing (ACI 308). This section describes the results of a literature search on the curing effectiveness on the various concrete properties.
The effect of curing on strength, permeability, and water weight loss is described in this chapter. The effect of curing on other properties is included in the next chapter. 2.3.1 Strength
The ACI 308 Committee Report states the effect of curing on compressive strength as follows:
Conventional compression tests of cores, cylinders, or cubes are useful as indicators of concrete strength within the bulk of the specimen, but are not necessarily representative of the surface properties. While the tests of compressive strength have traditionally been used to demonstrate the effects of curing, such tests are actually not as representative of curing effectiveness as the tests of the surface properties. This is because the curing affected zone (CAZ) is not critical with regard to compressive strength of cylinders or core, which fail away from their ends. In addition to the CAZ issue, the strength testing has rather large variability,
especially in flexural and tensile testing, which makes strength testing not ideal for the evaluation of curing effectiveness. However, there are a couple of papers that deserve discussion.
Kosmatka and Panarese (1988) cured 6 by 12 inch concrete cylinders at various conditions and evaluated the curing effects by compressive strength. Four curing regimes were used: (1) curing in the air the entire time; (2) moisture curing for 3 days and air curing afterwards; (3) moisture curing for 7 days and air curing afterwards; and (4) moisture curing the entire time. Figure 2.14 shows the marked effects curing has on compressive strength. The strength of cylinders at 180 days—cured in the air the entire time—achieved less than half of the strength of cylinders cured in the moisture the entire time. This graph also shows that once the concrete is exposed to dry air after the water curing, the hydration slows down and the “continued pore filling” almost stops, thus decreasing pore volumes and increasing strength. However, this graph is somewhat contradictory to the statements made in the ACI 308 Committee Report described above, or the curing effects appear to be greater than expected.

- 22-
Figure 2.14 Compressive strength of cylinder as a function of age for a
variety of curing conditions (Kosmatka and Panarese, 1988)
TxDOT sponsored a research project in the late 1980s to investigate the effectiveness of membrane curing compounds. Four different application rates of curing compound—150, 180, 200 sq. ft. per gallon, and none—were applied and strength values were evaluated. Both indirect tensile and flexural strengths were used as an evaluation tool. Figure 2.15 shows there was practically no difference in tensile strength values among cylinders treated with different curing regimes. Even though the strength with no curing (“DRY”) provided practically the same strength as those with various curing compound applications, it is not unexpected considering the insensitivity of the strength to curing. Figure 2.16 presents the relative flexural strength values of beams with prescribed curing regimes. As in the tensile strength, curing doesn’t have an effect on flexural strength. It is considered that flexural strength is more sensitive to curing than other strength types. It is because the concrete quality at the bottom few inches of the beam during testing will have a substantial effect on the strength values. Because poor curing of the beams will result in poor quality in CAZ, it is expected that lower strength will result from poor curing. However, this figure does not show the effect of CAZ on flexural strength.
These two studies described so far indicate that strength testing may not be a reasonable indicator for the effectiveness of curing, with the primary reasons being a relatively small effect of CAZ on strength and the variability of the strength testing. What these two studies imply is that, if strength is used for the evaluation of curing effectiveness, erroneous findings could result. Caution must be exercised when interpreting strength data to evaluate curing effectiveness.

- 23-
Figure 2.15 Application rate versus tensile strength normalized as a percentage of the tensile strength of the control specimens (Pechlivanidis et. al., 1988)
Figure 2.16 Application rate versus flexural strength normalized as a percentage of the
flexural strength of the control specimens (Pechlivanidis et. al., 1988)

- 24-
2.3.2 Permeability
Permeability is important in concrete because most of the durability problems in the concrete surface stem from its higher permeability. In structural concrete, primary distresses are related to permeability of concrete, such as steel corrosion, carbonation, and external sulfate attack. However, in PCC pavement research, permeability hasn’t attracted the attention it deserves partly because the effect permeability has on PCC pavement performance is not visibly evident. However, in PCC pavement, permeability plays an important role in volume change potential in concrete surface. Most of the surface defects in PCC pavement have to do with the volume changes near the surface of the concrete layer. TxDOT Research Study 0-1700 established the fact that the temperature and moisture changes are the largest near the concrete slab surface. The temperature variations near the concrete surface largely depend on the ambient temperature variations, which cannot be controlled. The thermal volume changes in concrete, however, not only depend on temperature variations but on the thermal coefficient of concrete, which can be controlled. By the same token, the volume change potential of concrete near the surface due to moisture variations can be controlled by improving permeability of concrete. The more permeable the concrete, the more variations in moisture content in concrete near the surface due to the changes in ambient conditions, resulting in more volume changes and higher potential for surface distresses.
Permeability of concrete is determined by the amount of capillary pores in concrete and whether or not the capillary pores are continuous. Because the hydration products fill the pores previously occupied by mixing water, continued hydration will reduce the amount of pores as well as make the pores discontinuous. Consequently, continued hydration promoted by better curing will reduce permeability and volume change potential of concrete near the surface.
Dhir et al. (1989) measured the water vapor permeability of specimens covered with curing membrane using a single-cell transmission test method. Six curing membranes were tested under the standard test conditions (24 ˚C, 100 percent RH); four were solvent-based and two were water-based. They showed that solvent-based curing membranes exhibited lower vapor permeability than water-based curing membranes. As a comparison, the solvent-based curing membranes had vapor permeability slightly higher than that with curing using flexible PVC sheeting, while the water-based curing membranes were on average ten times more permeable.
Cable et al. (2003) conducted the permeability tests employing three different curing conditions (water-based curing compound, wet curing, and no curing). The cores were cut into three pieces—top, middle, and bottom. The evaluation showed that there was no difference in permeability between middle and bottom portions of cores for varying curing conditions, as expected because they are out of CAZ. For the top portion of the concrete core, the concrete without curing had higher permeability. The concrete cured with water-based curing compound and wet curing had almost the same values of permeability.

- 25-
Gowriplan et al. (1990) demonstrated a relationship between curing and oxygen
permeability at various depths from the surface. This work included comparisons of various methods for curing (no curing, solvent borne resin membrane, wax emulsion membrane, and 3 days water curing by ponding). Significant increase of oxygen permeability occurred in concrete with no curing applied. Wax emulsion membrane showed better performance than solvent borne resin membrane. 2.3.3 Weight Loss of Water in Fresh Concrete Weight loss of water could be another way of evaluating curing effectiveness. Fattuhi (1986) calculated the efficiency of different curing compounds in terms of weight loss of water in fresh concrete during curing. The curing compounds used in the tests were inert resins in a solution of quick drying solvent; water based wax-dispersion; resin composed of cycloolefins; hydrocarbon 20 percent and white spirit 80 percent; hydrocarbon resin, solvent, an emulsifying system and water; resin-based white compound; and petroleum distillate-based blue compound. He found that curing compound (composed of hydrocarbon resin 20 percent and white spirit 80 percent) was the most efficient and its efficiency increased with an increase in the rate of application. The efficiencies of that curing compound were 79 percent and 89 percent at application rates of 0.65 and 0.95 to manufacturer’s recommendation, respectively. Despite the low rate of application of curing compound (based on a hydrocarbon resin, solvent, an emulsifying system, and water), this compound also appeared to be fairly efficient when compared to others.
Whiting and Snyder (2003) evaluated the effect of curing method (solvent-based, high-volatile organic compound (VOC), water-based low organic compound, water curing, plastic sheeting, and no curing) on the moisture loss of concrete. They showed that all curing compounds decreased the moisture loss when compared to no curing, but none of the compounds retained the same or more moisture than plastic sheeting. All high VOCs retained moisture better than low VOCs. Furthermore, larger amounts of curing compound application or uniform application resulted in less weight loss of water.
Wang et al. (1994) conducted experimental studies on the moisture loss of fresh concrete using different curing membranes. Resin solvent-based curing compounds with different curing efficiencies, defined as the loss of volatile component in the curing compound, were used in their studies. The curing compounds were applied immediately after the surface of concrete specimen was finished. They found that the rate of moisture loss from the concrete was reduced immediately after the application of curing compounds, and this reduction amounted to as much as 70 percent compared with air-cured specimens. Wang et al. (2002) evaluated moisture content of mortar specimen made with three different curing materials (water-based compound with water retention index of

- 26-
95.9 percent and 89.0 percent; and resin-based compound with water retention index of 98.1 percent). All specimens cured with curing compounds had a moisture content of 7.5 percent ~ 8.0 percent, which is between no curing (6.3 percent) and moisture curing (8.3 percent). This indicates the curing compounds used in this experiment reduced the water loss compared with no curing. However, there was little difference in one-day moisture content between different curing compounds, possibly owing to the limited amount of moisture loss in that short time period. Under hot weather conditions (simulated in oven-curing conditions), the effect of curing compound application on moisture retention became much clearer. The difference in moisture contents between various curing conditions (with or without curing compound) was much more pronounced. This may be due to the high evaporation rate at high temperatures. 2.3.4 Abrasion Resistance
Abrasion resistance is an indication of the quality of the concrete near the surface. Because CAZ is relatively shallow compared with the slab thickness, abrasion resistance might be an indicator of curing effectiveness. Sawyer (1957) demonstrated the effect of curing on the abrasion resistance of concrete as shown in Figure 2.17. In his experiment, he compared concrete that received immediate curing with the concrete with 24-hour delayed curing. At five cycles, the difference of about 67 percent is noted. This difference is quite large and shows potential of abrasion resistance testing for curing effectiveness evaluation. However, a 24-hour delay is quite excessive, and it is not known at this point whether this testing will be able to detect the difference in concrete quality in CAZ owing to good and poor curing applications.
Figure 2.17 Effects of delaying curing on abrasion resistance (Sawyer, 1957)
- 27-
2.4 TWO ISSUES REGARDING CURING APPLICATION IN PORTLAND
CEMENT CONCRETE PAVEMENT
The two most significant issues on curing operations of PCC pavement are (1) when to apply curing membranes, and (2) how much curing compound should be used per unit area. Theoretically, the time at which drying and the need for curing begins depends not only on the environment and the resulting rate of evaporation, but also on the bleeding characteristics of concrete as shown schematically in Figure 2.18 (ACI 308). The figure implies that the curing should be applied when the cumulative evaporation exceeds the cumulative bleeding of concrete so that the surface should not be left dry. If the curing is not applied early enough, the surface will be left drying, losing moisture that is needed for the hydration of cement and the development of a durable surface of concrete pavement. However, if the curing is applied too early, while the bleeding water is still coming up, there is a consequence of nondurable concrete surface as described later in this section. However, in paving projects, it is almost impossible to identify this optimum point. Part of the reason for the difficulty is that even though the sheen just disappeared from the concrete surface, the bleeding might be still in progress within the body of the concrete slab. As a part of this research study, bleeding rates were evaluated in accordance with American Society for Testing and Materials (ASTM) C232 for TxDOT’s Class P concrete in two projects. The bleeding rate was almost none or extremely small. For this type of concrete, any measurable evaporation rates will make the surface sheen disappear, even though bleeding is still in progress inside of the slab. In other words, the disappearance of the sheen does not necessarily mean that the bleeding ceased. The current TxDOT Specification Item 360 requires the curing application when the sheen disappears. Does this mean there is a danger of applying curing too early before the bleeding ceases? If that is the case, what are the consequences of applying curing compounds before bleeding is completed? ACI 308 states:
Surface finishing (beyond bull-floating) should not be initiated before initial set nor before bleed water has disappeared from the concrete surface…..Furthermore, bleeding of concrete also controls the timing of finishing operations…Bleed water rises to the surface of freshly cast concrete because of the settling of the denser solid particles in response to gravity and accumulates on the surface until it evaporates or is removed by the contractor....Finishing the concrete surface before settlement and bleeding has ended can trap the residual bleed water below a densified surface layer, resulting in a weakened zone just below the surface. Finishing before the bleed water fully disappears remixes accumulated bleed water back into the concrete surface, thus increasing the w/c ratio and decreasing strength and durability in this critical near-surface region…. Therefore, there are consequences for both too early application and too late
application of curing. With the reduction in maximum w/c ratio from 0.5 in. 1993 specifications to 0.45 in. 2004 specifications along with the use of SCMs, it is expected that the bleeding rate will be reduced as well. Identifying the optimum timing for the initiation of curing in an easy and practical way during the construction is one of the

- 28-
objectives of this research. No published papers have been identified that address this issue for paving concrete. This issue will be investigated for the remainder of this study. The issue of the optimum application rate of curing compounds is discussed in Chapter 3.
Figure 2.18 Combined influence of bleeding characteristics and evaporation in determining the time at which the surface of concrete begins to dry (ACI 308R-01)
Regarding the application time and rate of curing compound, other state
departments of transportation (DOTs) specifications were evaluated. The table below summarizes the current requirements for curing from twelve states including Texas. It is noted that even though there is a slight difference in verbiage, the requirements for timing for curing compound application are almost identical. As for the application rate, most states require a minimum rate of 1 gallon of curing compound per 150 sq. ft. Illinois and Michigan DOTs, along with TxDOT, require two applications.
State Timing for Curing Compound Application Application Rate California As soon as the finishing process has been
completed
Colorado Immediately after the finishing operations have been completed
Not less than 1 gallon per 150 sq. ft.
Georgia Immediately after finishing the concrete At a minimum rate of 1 gal per 150 sq. ft.
Illinois After the concrete has been finished and immediately after the water sheen has disappeared
Two applications at least one minute apart; each at the rate of not less than 1 gal per 250 sq. ft.
Iowa After finishing operations have been completed, and as soon as free water has appreciably
1 gal per 135 sq. ft.

- 29-
disappeared, but not later than 30 min. after finishing
Minnesota Immediately after the last texturing operations 150 sq. ft per gallon Michigan Do not delay curing to accomplish texturing.
After texturing operations have been completed and after the free water has left the surface
One coat on non-grooved, two coats on grooved. Second coat: after the first coat has dried sufficiently but do not exceed two hours between coats. Each application rate of 225 sq. ft. per gallon
New York Cure the entire pavement immediately after texturing
150 sq. ft. per gallon
Texas (93) After final finish and immediately after the free surface moisture disappeared
Not less than 1 gal per 180 sq. ft.
Texas (04) After texturing and immediately after the free surface moisture has disappeared
2 applications: 180 sq. ft. per gallon. Each within 10 and 30 min. after texturing.
Virginia Immediately following the texturing operations 100 to 150 sq. ft. per gallon. On textured surfaces, the rate shall be as close to 100 sq. ft. as possible.
Washington Immediately after the concrete has been finished and after any bleed water that has collected on the surface has disappeared, or at a time designated by the engineer
150 sq. ft. per gallon
Wisconsin Immediately after the finishing of the surface and before the set of the concrete has taken place
150 sq. ft. per gallon
As can be seen in the table, the specifications do not require compliance testing.
Rather, the specifications take a prescriptive and method-spec approach. One of the primary reasons for the lack of compliance testing in the current specifications is that there are no well-accepted testing procedures that can properly evaluate the curing efficiency. There is a need for developing a compliance testing for curing if performance-related specifications are to be developed for PCC pavement construction. The potential candidates for compliance testing include: (1) abrasion resistance, (2) permeability, (3) absorption, or (4) RH.

- 30-
Compliance testing should have adequate accuracy while being easy and simple to implement in the project during construction. The aspect of “easy and simple to use in the field” is becoming more important considering the ever-increasing workload of DOT inspectors. A number of research studies in curing of concrete have been conducted and, yet, no proper compliance testing has been identified or developed. It may be that developing a good compliance test is quite difficult. The identification or development of proper compliance testing for curing is out of the scope of this study, however, efforts will be made to that end. 2.5 SUMMARY
Cement needs a certain level of RH to continue to hydrate. Even though different RH values are reported for the cement hydration to continue, 80 percent is the widely accepted RH value. If the RH in concrete pores falls below this value, the hydration of cement virtually stops and further improvement of concrete properties owing to continued cement hydration and pore filling by hydration products is not achieved. There are several types of RH measuring devices. The most widely used types are dew point type and capacitive type. The comparison of several devices indicates excellent correlation. They have advantages and disadvantages. The advantages of dew point type include the accuracy of the testing results while the disadvantages are high initial cost and effort involved in the testing. The advantages of capacitive type devices are low initial cost, decent accuracy of the testing results, and much less effort for installation and data gathering. Disadvantages include that the accuracy is not as good as that of the dew point type device. Recently, however, substantial and continued improvements have been made in electronics technology and the accuracy of the capacitive type devices is expected to continue to improve.
CAZ is relatively shallow compared with the slab thickness of the PCC pavement. The reported values of CAZ vary from ¼ inch to about ½ inch depending on the curing effectiveness and the concrete mix characteristics (Hover 1984; Cather 1992). Because of this shallow CAZ, strength is not a good indicator for curing effectiveness. Rather, testing procedures that could evaluate the shallow surface, such as abrasion resistance, permeability, absorption, or RH measurements in the CAZ, will have a potential for candidates for compliance testing. Review of other state DOTs’ specifications for curing illustrates that they are all method-type specifications and no compliance testing is required. Part of the reason is—at least at this point—that there is no universally accepted compliance testing that is accurate enough, while simple and easy enough, to implement during concrete placement. Until a reasonable compliance testing is identified, it is expected that prescriptive and method-type specifications will continue and types of performance-related specifications cannot be developed for curing.

- 31-
CHAPTER 3 MOISTURE TRANSPORT IN CURING CONCRETE
3.1 INTRODUCTION
The nature of the moisture profile in hardening concrete particularly near the evaporative surface is subject of great interest relative to its effect on pavement performance and the role of curing quality. Previous research has focused on improving the understanding of the distribution and history of moisture at an early age and its importance relative to the quality of curing. Its understanding is key for a realistic estimation of drying shrinkage, thermal expansion, strength, maturity and curing efficiency.
Aspects of the effect of curing on moisture in concrete pavement can be reflected in concrete strength, drying shrinkage and creep development in the early stages of hydration. These behavioral characteristics are of concern with respect to early age concrete slab movements which subsequently affect the formation of early aged cracking and delamination shear stress. Material-related moisture properties (permeability, diffusivity, slope of the moisture isotherm, etc.) of concrete play a key role in the mathematical modeling and representation of stress and strain due to drying shrinkage and creep under varying humidity conditions. Material tests are necessary to determine these pertinent material properties. Moisture flow models that represent the variation of moisture with time use these properties. In terms of curing effectiveness, prediction of humidity and moisture diffusion is very important in consideration of strength, spalling, warping and other moisture related stresses, strains, and deformations induced in concrete pavements.
Mathematical models have been developed for the calculation of moisture and temperature profiles to help understand the effect of different combinations of curing, climatic, construction and materials on the development of the moisture and temperature profiles and their subsequent effects on early strength, shrinkage, cracking and delamination. These models appear as nonlinear, time-dependent partial differential equations and are solved by finite element and other similar numerical methods that involve both backward and forward calculation. Measured test data can be used to back-calculate moisture diffusivity and thermal conductivity to facilitate calibration for curing concrete.
3.2 THE NATURE OF MOISTURE MOVEMENT
Drying shrinkage and creep strains are related to the amount of movement and
distribution of moisture in a concrete slab. These strains are primary contributors to the warping inducted deformation of a concrete slab and formation of early aged cracks or shallow delaminations immediately below the pavement surface. In the past, a method used to determine the moisture in concrete was by actual measurement of weight loss of small laboratory samples. Recently, quantities of moisture have been indirectly measured using moisture sensors with the recent development of instrument and measurement

- 32-
techniques. Moisture flow and diffusion in concrete have been a significant topic in the research of concrete pavement materials (Bazant and Najjar 1972; Parrott 1988; Parrott 1991; Xin et al. 1995; Buch and Zollinger 1993).
In freshly placed concrete, moisture movements are typically characterized by
high rates of diffusion followed by gradually lower and lower rates 10 to 12 hours after placement. This drying characteristic is inherently related to a material property referred to as the moisture diffusivity (D) which has been generally accepted to be dependent upon the pore water content within the cement paste. It has been observed that moisture diffusivity may change significantly with variations in the moisture content or the relative humidity (from 100 to 70 percent) of the concrete (Pihlajavaara 1964; Kasi and Pihlajavaara 1969; Bazant 1970; Bazant and Najjar 1972). At constant water content (w), moisture diffusivity changes little with time in mature concrete in contrast with the dramatic changes fresh concrete undergoes during the first 24 hours after placement. In this regard, diffusivity in early-aged concrete is not only a function of humidity but also of concrete age and porosity. The moisture diffusivity is important in modeling moisture flow in hardening concrete.
The rate of moisture flow through concrete can be expressed by the velocity of
flow (J) representing the mass of evaporable water passing through a unit area perpendicular to the direction of flow per unit time. The velocity of flow by Darcy’s law is derived from energy gradients (Bazant and Najjar 1972):
J C grad μ= − ⋅ (3-1) where μ is Gibb’s free energy (GFE) per unit mass of evaporable water and the coefficient C characterizes the permeability of the porous of concrete. Equation (3-1) is restricted to small energy gradients and laminar flow conditions. Assuming water vapor behaves as an ideal gas, Gibb’s free energy is (Bazant and Najjar 1972):
)(ln THMVRT
satw
μμ +⋅⎟⎠⎞
⎜⎝⎛= (3-2)
where R = universal gas constant (8.3143 J/mol/oK) T = absolute temperature (oK) M = molecular weight of water (18.015 g/mol) Vw = specific volume of water (1 cm3/g)
H = humidity of concrete ⎟⎠⎞
⎜⎝⎛=
100RH
RH = relative humidity of concrete (%) Equation (3-1) can be rewritten in terms of temperature (T) and humidity (H) of concrete as (Bazant and Najjar 1972):
J c grad H= − ⋅ (3-3) where the coefficient c is permeability as a function of temperature and humidity of concrete as below (Bazant and Najjar 1972).
⎟⎠⎞
⎜⎝⎛×⎟
⎠⎞
⎜⎝⎛=
HC
MVRTc
w (3-4)

- 33-
The relationship between humidity and water content within concrete at a constant temperature and the degree of hydration is described by desorption or sorption isotherms (Bazant and Najjar 1972). It is evident that the relationship between the moisture and the measured humidity of concrete will vary as a function of the age.
0.00
0.05
0.10
0.15
0.20
0.25
0.30
0.35
0.40
0.0 0.2 0.4 0.6 0.8 1.0
Humidity
W g
per
g o
f Cem
ent
7 days28 days365 days Sorption365 days Desorption
Figure 3. 1 Desorption-isotherms (Bazant 1970)
The dependence of the evaporable water content on humidity (as a function of
temperature) is a function of the porosity of the pore structure within the cement paste and is represented empirically in the form of desorption or sorption isotherms that are illustrated in Figure 3.1. It should be noted that the isotherm for sorption is different from the isotherm for desorption. This characteristic may be due to the various states of equilibrium of the pore water. An investigation by Parrott (1988) implied the significance of porosity with respect to the position of the desorption or sorption isotherm within concrete. The results indicated that a greater amount of moisture loss in drying concrete would occur in regions nearest to exposed drying surfaces which may also be regions of greater porosity. This observation was proven in the relationship between weight loss and relative humidity of concrete indicated in Figure 3.2. Therefore, it can be explained that there is a greater volume of coarse pores at positions nearer to an exposed concrete surface and consequently the relationship between weight loss and relative humidity of concrete will vary with distance from the exposed surface. In this respect, the performance and behavior of a concrete pavement may be affected by the porosity of the surface. It should also be noted that the resulting desorption isotherm at any time during hydration of hardening slab concrete must be interpreted not only as a function of the degree of hydration, but also as a function of porosity. At a given porosity, the desorption isotherm may be expressed in the differential form as (Bazant and Najjar 1972):

- 34-
kdwdH = (3-5)
wwHk ⎟⎠⎞
⎜⎝⎛∂∂
= (3-6)
0
2
4
6
8
10
12
14
16
18
70 75 80 85 90 95 100
Relative Humidity (%)
Wei
ght l
oss
(%) 53.5 mm
33.5 mm23.5 mm15.5 mm 11.5 mm7.5 mm
Figure 3. 2 Weight Loss versus Relative Humidity of Drying Concrete at Various
Vertical Distances from the Exposed Surface (Parrott 1988)
where the parameter k represents the slope of the moisture isotherm where the mass of water (w) is described as a function of humidity (H). Moisture movements in an unsaturated porous medium is effected by temperature profiles of the medium (Huang 1979; Suh et al. 1988; Somasundaram et al. 1989). Thus, the calculation of humidity in hydrating concrete requires additional terms under variable temperature conditions as (Bazant and Najjar 1972):
sdHKdTkdwdH ++= (3-7)
where K = hygrothermic coefficient ( wTH⎟⎠⎞
⎜⎝⎛∂∂
= )
dHs = change in humidity (H) due to hydration at a constant water content (w) and time (t)
The hygrothermic coefficient represents the change in humidity due to one degree of change in temperature at a constant water content and a given level of hydration. It should be noted that the pore water content (w) includes both the evaporable or capillary water (wc) and the non-evaporable water (wn) per unit volume of materials.
The rate of moisture flow in unit volume of concrete is determined from (Bazant and Najjar 1972):

- 35-
divJtw
−=∂∂ (3-8)
Substituting equation (3-3) into equation (3-8) and subsequently substituting equation (3-8) into equation (3-7) leads to (Bazant and Najjar 1972):
tTK
tHgradHcdivk
tH s
∂∂
∂∂
∂∂
++⋅⋅= )( (3-9)
which is the diffusion equation for the drying concrete under variable temperature conditions. Equation (3-9) is further developed to be equation (3-10).
tTK
tH
xH
xck
xHkc
tH s
∂∂
∂∂
∂∂
∂∂
∂∂
∂∂
+++= 2
2
(3-10)
Permeability (c) is also a function of the porosity and indirectly a function of position x. Because permeability change with position x is assumed to be very small, the second term in the equation (3-10) is considered to be negligible and is consequently dropped from the diffusion equation as:
tTK
tH
xHD
tH s
∂∂
∂∂
∂∂
∂∂
++= 2
2
(3-11)
where D (= k⋅c) is moisture diffusivity (L2/t). Parrot [6] studied the factors for RH in concrete by evaluating the effects of w/c ratio, cement type, moist curing time, and exposure condition on time-dependent relative humidity in drying concrete. The specimens used for the study were made using various cement types and w/c ratio and sealed to ensure uniaxial exposure. The 100mm cubes are used to measure the relative humidity (RH) and cured for 1, 3, 28 days before exposure. The RH is measured through the cavities located at various distances from the exposed faces of the cube. The specimens are exposed in the lab where RH is 58% and temperature is 20ºC, the outdoor where RH is 58-90%, temperature 6-21ºC and rainfall 40-70mm/month or sheltered from rainfall, and the indoor where RH is not controlled and temperature is 15-25ºC.
The effects of w/c ratio and curing time are small for the time-dependent RH of
the concrete. The cement type and exposure condition have significant effects. The concretes made with cement binder materials, such as pulverized fuel ash (PFA) and ground granulated blastfurnace slag (ggbs), are dried faster than the one made with only Portland cement (OPC). However, the RH in concretes with 5% filler drops more slowly than that in concrete with OPC. From the result of the tests, the RH results for lab can be represented by a set of equations. Normalized RH f(r) = (r – ra)/(100 – ra) = e-kT (3-12) where r = relative humidity
ra = ambient relative humidity k = 0.8 – 0.14T + 0.01T2 T = Normalized drying time, t/t1/2 t = drying time t1/2 = the time to reach 79% RH (to reach half of the potential RH change)
The t1/2 is changed by the cement binder materials and represents the following: t1/2 = 10jd for t1/2 < 414 days (3-13a)

- 36-
t1/2 = 3jd + 290 for t1/2 ≥ 414 days (3-13b) where j = 1.00 for OPC, 0.56 for PFA, and 0.53 for ggbs
At given combinations of depth and drying time, the relative humidity can be
calculated using equations 3-12 and 3-13. The tests at the indoor and outdoor exposure show different results with that at the lab. The RH of concretes exposed in the outdoor is not significantly affected by the depth from the exposed surface; however, at the indoor, the drying is slower at greater depth. Especially, the RHs of concrete sheltered from rain are low but those of concrete exposed outdoors are higher. 3.3 HEAT TRANSFER
From the above discussion, temperature plays a clear role in the movement of moisture in concrete. Consequently, it is useful to document the nature and theory of heat transfer relative to its effect on temperature of hydrating concrete. The control volume in heat transfer theory is a region of space bounded by a control surface through which energy and matter may pass. If the inflow and generation of energy exceeds the outflow, there will be an increase in the amount of energy stored in the control volume, whereas there will be a decrease in energy stored in the case that the outflow of energy exceeds the inflow and generation of energy. If the inflow and generation of energy equal the out flow, a steady-state condition must prevail in which there will be no change in the amount of energy stored in the control volume.
At any point in time, the energy terms include the rate at which thermal and
mechanical energy enters and leave through the control surface, in and out. Also, thermal energy is created within the control volume due to conversion from other sources of energy. This process is referred to as energy generation, and the rate at which it occurs is designated as g. The rate of change in energy stored within the control volume is designated as st. A general form of energy conservation is expressed on a rate basis (Incropera and DeWitt 1996).
stst
outgin Edt
dEEEE &&&& ==−+ (3-14)
Equation (3-14) may be applied at any instant of time. The alternative form for a time interval Δt is obtained by integrating equation (3-14) over time (Incropera and DeWitt 1996):
stoutgin EEEE Δ=−+ (3-15) Equation (3-14) and (3-15) imply that the amounts of energy inflow and generation act to increase the amount of energy stored within the control volume, whereas outflow acts to decrease the stored energy.
The inflow and outflow of energy that occurs at the control surface is proportional
to the surface area. Additionally, heat transfer that occurs due to conduction, convection, and radiation is involved in the energy inflow and outflow at the control surface. The energy generation term is associated with conversion from other forms of energy such as

- 37-
the concrete heat of hydration. As concrete hydrates, a chemical reaction takes place generating thermal energy which is dependent upon the amount and fineness of the cement used in the concrete.
Energy storage changes within the control volume due to changes in the internal,
kinetic and potential energies. Hence, for a time interval, Δt, the energy storage term of equation (3-5), ΔEst, can be equated to ΔU + ΔKE + ΔPE where kinetic and potential energy effects are neglected in heat transfer analysis. The internal energy, ΔU, consists of a sensible or thermal component, which accounts for the translational, rotational, and/or vibrational motion of the atoms/molecules comprising the matter in the control volume; a latent component, which relates to intermolecular forces influencing phase change between solid, liquid, and vapor states; a chemical component, which accounts for energy stored in the chemical bonds between atoms; and a nuclear component, which accounts for binding forces in the nucleus. Accordingly, the rate of change in energy storage in equation (3-14) due to the temperature change in the control volume can be expressed as (Incropera and DeWitt 1996):
( )TVcdtd
dtdU
E pt
st ρ==& (3-16)
Figure 3. 3 Thermal Conduction through an Infinitesimal Small Control Volume
(Incropera and DeWitt 1996)
where ρ = density of mass within control volume (kg/m3) V = control volume (m3) cp = specific heat (W·hr/kg/oK) An infinitesimally control volume, dxdydz, is defined and shown in Figure 3.3. If
there are temperature gradients in concrete, conduction heat will occur across each of the control surfaces. The conduction heat rates perpendicular to each control surface at the x,

- 38-
y, and z coordinate locations are indicated by the terms qx, qy, and qz, respectively. The conduction heat rates at the opposite surfaces can be expressed as a Taylor series expansion by neglecting higher order terms.
dxx
qqq x
xdxx ∂∂
+=+ (3-17)
dyy
qqq y
ydyy ∂
∂+=+ (3-18)
dzz
qqq zzdzz ∂
∂+=+ (3-19)
Within the hydrating concrete, there should be an energy source term associated with the rate of thermal energy generation.
dxdydzqEg && = (3-20) where q& is the rate at which energy is generated per unit volume of the concrete (W/m3). In addition, there may be changes in the amount of the internal thermal energy stored in the control volume of concrete. The energy storage term may be expressed as:
dxdydztTcE pst ∂∂
ρ=& (3-21)
Equation (3-14) is transformed into equation (3-22) by applying the methodology of conservation of energy and by referring equation (3-17) to (3-21) and Figure 3.3 (Klemens 1969; Siegel and Howell 1981).
dxdydzqdzz
qqqdy
yq
qqdxx
qqq z
zzy
yyx
xx &+⎟⎠⎞
⎜⎝⎛
∂∂
+−+⎟⎟⎠
⎞⎜⎜⎝
⎛∂
∂+−+⎟
⎠⎞
⎜⎝⎛
∂∂
+−
dxdydztTc p ∂∂
ρ= (3-22)
Where q& = rate of energy generation per unit volume (W/m3)
tTc p ∂∂
ρ = rate of change of the thermal energy per unit volume (W/m3)
The conduction heat inflow at the control surface shown in Figure 3.3 can be further expressed by Fourier’s law as:
xTkdydzqx ∂∂
−= (3-23)
yTkdxdzqy ∂∂
−= (3-24)
zTkdxdyqz ∂∂
−= (3-25)
where k is the thermal conductivity (W/m/oK). Equations (3-23) to (3-25) are substituted into equation (3-22) and dividing out the dimensions of the control volume (dxdydz) to obtain equation (3-26) (Klemens 1969; Siegel and Howell 1981).
tTcq
zk
zyk
yxk
x p ∂∂
ρ=+⎟⎠⎞
⎜⎝⎛
∂∂
∂∂
+⎟⎟⎠
⎞⎜⎜⎝
⎛∂∂
∂∂
+⎟⎠⎞
⎜⎝⎛
∂∂
∂∂
& (3-26)

- 39-
Conduction is a mode of heat transfer in which heat is transferred by random molecular motion in a concrete slab while convection represents a mode of heat transfer in which heat is transported through mixing of hot and cold fluid particles between the slab surface and a moving fluid (i.e. wind). Heat transfer by radiation represents the transmission of energy by electromagnetic waves. For concrete pavement, radiation and convection play a dominant role in transferring heat between the slab surface and the surrounding air, while conduction plays a separate role in transferring heat within the slab as shown in Figure 3.4. 3.3.1 Conduction
Heat conduction is explained as heat transfer from points of higher temperature to points of lower temperature in a concrete slab. Heat energy is transferred within the slab due to interaction between the particles of different temperatures. Molecules at a high temperature are said to have high energy, which makes the molecules themselves randomly translate, and internally rotate and vibrate. Heat energy transferred by these random molecular motions is called energy diffusion. Conduction can also be expressed by using Fourier’s law in the form of a rate equation. Conduction for a temperature distribution T in one dimension can be expressed as a function of direction x as (Klemens 1969; ASHRAE 1972):
dxdTkqcond −=" (3-27)
where the conductive heat flux, q"cond (W/m2), is the heat transfer rate in the x direction
per unit area perpendicular to the direction of transfer. The thermal conductivity k is an important material property related to heat transfer characteristics of the concrete. The process of conduction is spontaneous and irreversible, and is related to the entropy of the concrete. The second law of thermodynamics, the governing principle behind the distribution of entropy, is used to derive the heat conduction equation. This approach has been used to estimate the temperature distribution and the associated frost action in multi-layer pavement systems (Dempsey et al. 1986).

- 40-
Figure 3. 4 Heat Transfer Mechanisms between Pavement and Its Surroundings
(Ruiz et al. 2001) 3.3.2 Convection
Heat energy is transferred from a slab surface to the surrounding environment by currents of fluid particles. In addition, this heat transfer is facilitated by random molecular motion in the fluid. In other words, convection heat transfer occurs between a flow of wind and a surface of a concrete slab when they are at different temperatures. If the temperatures between a slab surface and a wind flow differ, temperature in the fluid flow above the slab will vary from Ts at the slab surface to Ta in the flow far above the slab surface. Convection heat transfer is expressed as (Says and Crawford 1980; Kaviany 1994):
( )ascconv TThq −=" (3-28) where q"
conv (W/m2) is the convective heat flux and hc (W/m2/oK) is the convective heat transfer coefficient. The convective heat transfer coefficient is difficult to determine because of the many variables that affect it. An empirical formula was suggested to relate convection heat transfer coefficient to wind velocity and roughness of slab surface (Branco et al. 1992).
vhc 7.36 += (3-29) where 6 W/m2/oK represents an average slab surface roughness without wind effects. And the heat transfer coefficient increases with the increase of wind speed proportionally.
3.3.3 Irradiation
Irradiation transfers heat energy by electromagnetic waves while conduction and convection requires a material medium. Emissive power E (W/m2) indicates the rate of

- 41-
heat energy release from a surface of a concrete slab with unit area by irradiation. The upper limit of emissive power is shown as (Incropera and DeWitt 1996):
4sTE εσ= (3-30)
where, Ts (oK) is the absolute temperature at the surface of a concrete slab and σ (=5.67×10⁻⁸ W/m2/oK4) is the Stafan-Boltzmann constant. The term ε is the emissivity, which ranges from 0 to 1, is a radiative property of a slab surface and provides a measure of how efficiently the surface emits energy relative to a blackbody.
Irradiation for a concrete pavement is determined on the basis that a slab surface at temperature Ts is radiating to a much larger surface at temperature Ta surrounding the slab surface. Irradiation heat transfer can be expressed as (Siegel and Howell 1981; Meinel and Meinel 1976):
( )44"asr TTq −εσ= (3-31)
Equation (3-20) is assumed to yield a reasonable estimate of heat exchange between a slab surface and the surrounding environment under cloudy weather conditions (Williamson 1967; Thepchatri et al. 1977). 3.3.4 Solar Radiation
Solar radiation ( "sq ) absorbed directly into a concrete slab surface causes the
surface of the slab to be heated more rapidly than the interior region. This effect contributes to a temperature gradient through the depth of the slab (Branco et al. 1992; Hsieh et al. 1989). There are several factors which influence the solar radiation absorption into a given slab surface. These include the time of the day or year, the latitude, and cloudiness, and so on (Chapman 1982; Taljaston 1987; Branco et al. 1992). The solar radiation consists of direct and indirect components. The direct component is the solar radiation that is directly incident on the surface while the indirect radiation refers to the solar radiation resulting from multiple scattering by the environment. Accordingly, the total solar radiation that reaches the surface of a concrete slab is the sum of direct and indirect contributions (Branco et al. 1992):
⎥⎦
⎤⎢⎣
⎡⎟⎠⎞
⎜⎝⎛ +
+=2cos1sin" γθα ids IIq (3-32)
where "sq = solar radiation (W/m2)
α = surface heat absorptivity of concrete (= 0.6) (Chapman 1982) Id = direct solar radiation (W/m2) Ii = indirect solar radiation (W/m2) θ = incidence angle of solar radiation against the slab surface (degree) γ = inclination angle of slab surface (degree) The amount of solar radiation received by the slab surface depends on the
incidence angle of solar radiation against the slab surface and the inclination angle of slab surface. The incident angle of solar radiation can be determined by a method presented by Hsieh et al. (1989). The indirect solar radiation may range from 10% of the total solar

- 42-
radiation on a cloudy day to nearly 100% on a totally sunny day. No solar radiation absorption occurs at night since the sun’s rays are no longer prevalent.
3.3.5 Heat Flux due to Evaporation
Including heat flux due to evaporation in the boundary condition of heat transfer at the slab top surface is important to accurately account for moisture effects on the temperature conditions at the surface of a concrete pavement. Few temperature prediction models consider the evaporation effects in their boundary conditions (Kapila et al, 1997). There have been many efforts to develop concrete temperature prediction models which can be easily used although they ignore the effect of heat flux due to evaporation in their boundary conditions (Yang, 1996 Ruiz et al, 2001). Heat flux due to evaporation can be calculated by:
ve EHq =" (3-33) where
E = rate of evaporation (kg/m2/hr or W/m3) Hv = heat of vaporization of water
= sT564.03.597 − (cal/g) (Linsley et al, 1975) = ( )sT564.03.597427 − (m)
3.4 EVAPORATION
Available moisture in hardening concrete evolves into two types of water - one referred to as evaporable water held in both capillary and gel pores including interlayer pores and the other as non-evaporable water combined structurally in the hydration products (Neville 1997, Mindess and Young 1981). The sum of these portions equals the total water content in the paste. Water available in the capillary pores evaporates at the surface of concrete when it is exposed to ambient weather conditions causing a decrease in vapor pressure above the concrete surface. Because the predominance of moisture movement associated with evaporation occurs near the surface of the concrete, moisture variations within the cross-section of the concrete are found mostly near the surface.
Evaporation at the surface of a concrete slab can be defined as the net rate of vapor transport to the surrounding atmosphere (Linsley 1975). This change in state requires an exchange of approximately 600 calories for each gram of water evaporated. Vaporization removes heat from bleed water near the surface of the concrete slab. Therefore, evaporation is another important factor to be considered in the analysis of thermally induced effects on a concrete slab in addition to conduction, convection, and radiation (Kapila et al 1997).
Evaporation is controlled by use of the appropriate curing method to minimize potential for undesirable cracking and deformation at early ages. The presence of water serves to enhance both hydration and strength development. As hydration advances and fills the space available in the capillary pores, capillary porosity continues to decrease

- 43-
and the amount of the gel pores increase. Gel pores tend to limit the movement of moisture through the capillary pores. Thus, the increase of hydrated products and reduced capillary porosity reduces the rate of evaporation. Drying shrinkage, due to evaporation, which leads to cracking or warping is also controlled by minimization of water loss from capillary pores (Mindess and Young 1981, Neville 1996). Strength of concrete is affected not only by the total moisture content but also by the moisture variations in the concrete. For an example, test data have indicated that even a short period of drying causes a recognizable decrease in the magnitude of tensile strength of the concrete due to the moisture variation at the concrete surface (Walker and Bloem 1957).
Numerous efforts have been made to develop empirical models to express evaporation as a function of atmospheric factors (Penman 1948, Thornthwaite 1948, Menzel 1954, Wilson 1990, Wilson 1994, Veihmeyer 1964). Most of the models are of the Dalton type and have been presented in the form of (Dalton 1802):
)()( vfeeE ds −= (3-34)
where E = rate of evaporation (ML-2T-1) es = saturation vapor pressure of water surface (ML-2)
ed = vapor pressure of air above water surface (ML-2)
f(v) = wind function v = wind speed (LT-1) M = mass L = length T = time The ACI nomograph (1996) shown in Figure 3.5 was based on the Menzel’s
model (1954) derived from the Dalton’s model (1802) and the Lake Hefner test results conducted between 1950 and 1952 (Kohler et al 1955). The Menzel’s model, equation (3-35), has been accepted as one of the best methods for predicting evaporation of bleed water while it is exposed on the surface of the concrete (which inherently excludes the consideration of curing media).
)096.0253.0)((44.0 veeE ds +−= (3-35)

- 44-
However, since the quantified net radiation was not measured during the Lake Hefner tests, this model fails to consider the effects of radiation on evaporation. Another shortcoming is related to vapor pressure effects, which can be overcome by considering the many equations that have been suggested to express vapor pressure as a function of temperature (Tetens 1930, Murray 1967, Dilley 1968). Another widely used method for evaporation prediction is Penman’s model (Penman 1948). Penman’s model, shown in equation (3-36), is also a Dalton’s type model but resolves the difficulties associated with them relative to wind and surface vapor pressure effects. This model predicts evaporation by considering both net radiation and aerodynamic effects.
γγ
+Δ
+Δ= aq EE
E (3-36)
Figure 3. 5 ACI Evaporation Nomograph (ACI 1996)
where Δ= slope of the saturation vapor pressure versus temperature curve (ML-2)
=as
as
TTee
−−
ea = saturation vapor pressure of air (ML-2) Ts = surface temperature Ta = air temperature Eq = rate of evaporation due to net radiation (ML-2T-1) γ = psychrometric constant (ML-2) Ea = rate of evaporation due to aerodynamic effects (ML-2T-1)
Both the ACI nomograph and Penman’s model are based on evaporation from a water surface but fail to consider the effects of changes of moisture within the concrete with time, and consequently cannot accurately predict evaporation from concrete (particularly, beyond the cessation of bleeding). Therefore, development of a theoretical model for prediction of evaporation from
concrete both before and after bleeding is necessary. Another model by Incropera and Dewitt (1996) suggests that the rate of
evaporation is governed by the difference between vapor pressure at the surface of

- 45-
concrete and the vapor pressure of the ambient air. This boundary effect is represented mathematically as:
⎥⎦
⎤⎢⎣
⎡−=
∞
∞
Tp
Tp
LecRhM
E .A
s
s,A3/2
p
A
ρ (3-37)
where, E = evaporation rate (kg/m2/hr), MA = molecular weight of water (= 18 kg/kmol), h = convection coefficient (W/m2/oK, kg/m/hr/oK), R = gas constant (= 8.315 kJ/kmol/oK), ρ = density of air (kg/m3), cp = specific heat of air (1.005 kJ/kg/oK), Le = Lewis number, the ratio of the thermal and mass diffusivities, pA,s = vapor pressure at the surface of concrete (kJ/m3), pA,∞ = vapor pressure of ambient air (kJ/m3), Ts = concrete temperature at the surface of concrete (oK), T∞ = concrete temperature of ambient air (oK), qe
” = heat flux due to evaporation (W/m2), and hfg = heat of vaporization of water (cal/g, kJ/kg, m).
In the moisture evaporation process, it can be demonstrated that radiation is by far the most important factor. Theory and wind tunnel experiments have shown that the evaporation from water of a specified temperature is proportional to wind speed and is highly dependent on the vapor pressure of the overlying air. The temperature of freshly placed concrete is not independent of wind speed and vapor pressure. If the wind speed were suddenly increased, the evaporation rate would increase momentarily. This increased rate of evaporation would immediately begin to extract heat from the concrete surface at a more rapid rate than it could be replaced by radiation and conduction. The temperature of concrete surface would approach a new, low equilibrium value, and evaporation would diminish accordingly. All of the meteorological factors mentioned above should be contained in a model for evaporation. 3.5 THEORETICAL APPROACH DEVELOPED IN RESEARCH PROJECT 1700
To this end, a new evaporation model, shown below, was developed from Research Project 1700: The new evaporation model is based upon the Penman’s model previously. Both net radiation and aerodynamic effects are considered in the new model in the same way as in the original Penman’s model. As further described below, many constituents in the original model are replaced with other expressions and concrete properties with respect to moisture loss; each are considered and included to formulate the new model to provide a more accurate and simpler to understand prediction.
JHQ
Ev
s += δ (3-38)

- 46-
where E = rate of evaporation from concrete due to both net radiation and
aerodynamic effects (kg/m2/hr) δ = calibration factor for moisture condition of concrete surface Qs = solar radiation absorption through electromagnetic waves (kg/m/hr)
= ⎥⎦
⎤⎢⎣
⎡⎟⎠⎞
⎜⎝⎛ +
+2cos1sin γθα id II (Branco, 1992)
α = surface heat absorptivity of concrete (= 0.6) (Chapman, 1982) Id = direct solar radiation (kg/m/hr) Ii = indirect solar radiation (kg/m/hr) θ = incidence angle of solar radiation against the slab surface (degree) γ = inclination angle of slab surface (degree) Hv = heat of vaporization (heat removed from water on the surface of
concrete slab being vaporized) = sT564.03.597 − (cal/g) (Linsley, 1973) = ( )sT564.03.597427 − (m) J = rate of evaporation from concrete due to convective heat transfer,
irradiation, and aerodynamic effects (kg/m2/hr) Key parameters of the modified model are described and further elaborated
below. The rate of evaporation (E) consists of two components, one due to aerodynamic effects (Ea) explained as the rate of evaporation of a saturated vapor immediately above the water surface (Penman 1948) and the other due to energy effects (Eq). The net radiation (Qn), which represents the energy exchange at concrete surface, consists of the elements such as solar radiation, convective heat transfer, and irradiation as:
rcsn QQQQ −−= (3-39) where
Qn = net radiation at concrete surface (kg/m/hr) Qs = solar radiation absorption (kg/m/hr) Qc = heat flux due to convection (kg/m/hr) = )( asc TTh − (Branco, 1992) hc = convective heat transfer coefficient
= v7.36 + (W/m2/oC) (Branco, 1992) = ( )v7.36367 + (kg/m/hr/oC)
Qr = heat energy from high to low temperature body (kg/m/hr) = ( )44
as TT −εσ (Incropera and DeWitt, 1996) = ( )[ ]( )asa TTT −−+ 5075.08.4ε (Branco, 1992)
ε = surface heat emissivity of concrete (= 0.88) (Chapman, 1982)
σ = Stefan-Boltzmann constant (= 5.67 × 10⁻⁸ W/m2/oK4 = 2.08 × 10⁻⁵ kg/m/hr/oK4) (Chapman 1982)
Although several parameters are involved, under laboratory conditions, only convective heat transfer and irradiation is considered to have an effect on evaporation.

- 47-
During bleeding, a concrete surface is covered with a continuous layer of water that is perhaps maintained for a period of time depending on the water content in the mix and the rate of evaporation. However, as evaporation continues the water layer on the concrete surface becomes less continuous and isolated until it completely vanishes from the concrete surface. Beyond this point evaporation continues under dry surface conditions. In light of this phenomenon, it is clear that evaporation modeling for hydrating concrete needs to be sensitive to evaporation under both wet and dry surface conditions. In either case, the rate of evaporation at a concrete surface under laboratory curing conditions (i.e. non solar effects) in terms of the variation in moisture movement from the concrete to the atmosphere is represented by the parameter J (Bazant and Najjar 1972) which is included in Equation 3-38.
a
s
HH
BJ ln= (3-40)
Where B is surface moisture emissivity and has been found to be a function of the effective curing thickness and wind speed and is closely related to the given curing conditions. Characterization of surface moisture emissivity is very useful since it provides the means to include the moisture characteristics of the concrete as a function of curing time to be incorporated into Penman’s model. Additionally, if there is no solar radiation (Qs), such as under laboratory conditions, the evaporation rate of concrete (E) can be assumed to be equal to the evaporation rate of concrete due to convective heat transfer, irradiation, and aerodynamic effects (J). Thus, surface moisture emissivity (B) can be characterized by a series of laboratory tests in absence of solar radiation.
a
s
a
s
HHE
HHJB
lnln== (3-41)
Test results for evaporation and curing thickness imply that the characterization of surface moisture emissivity needs to be carried out in two categories: one during bleeding and the other after bleeding. Plots of surface moisture emissivity versus effective curing thickness (Figure 3.6) showed that the data should be divided into the two categories and then analyzed separately. Effective curing thickness increases while surface moisture emissivity decreases with curing time during bleeding. Conversely, effective curing thickness decreases while surface moisture emissivity increase with curing time after bleeding. This relation between effective curing thickness and surface moisture emissivity was expected by Bazant and Najjar (1972) even though the two categories by bleeding were not considered. Consequently, the surface moisture emissivity (B) can be formulized as functions of effective curing thickness (ECT) and wind speed (v) during and after bleeding, respectively. During bleeding (R2 = 0.994):
2exp( )B a b ECT cv= + − + (3-42) After bleeding (R2 = 0.999):
2.5lne ECTB d fvECT
= + + (3-43)

- 48-
0 2.5 5 7.5 10
Effective Thickness (cm)012345Windspeed (m/s)
00
11
22
33
4 4
5 5
6 6
7 7
B-F
acto
r (kg
/m^2
/hr)
B-F
acto
r (kg
/m^2
/hr)
Where the unit of surface moisture emissivity is kg/m2/hr, effective curing thickness is cm, and wind speed is m/s. The standard errors of coefficients were ranged from 1.9 to 21.9 %.
As previously mentioned, another source of evaporation is due to solar radiation at the concrete surface (Penman 1948). Specifically, the rate of evaporation by solar
(a) During Bleeding (b) After Bleeding
Figure 3. 6 Trends of Surface Moisture Emissivity:
radiation is calculated from the solar radiation divided by heat of vaporization (Hv) at the slab surface (Linsley 1975). In this regard, moisture conditions at the concrete surface with time also should be considered since during the bleeding stage, the solar radiation will cause the higher rate of evaporation. However, the evaporation by solar radiation will decrease as the concrete surface dries after bleeding. The present form of Penman’s model does not consider the drying effects of concrete surface on evaporation due to solar radiation. Thus, a calibration factor considering drying effects of concrete on the evaporation by solar radiation was included in Equation (3-38) using the effective curing thickness concept to represent the moisture condition at the concrete surface.
ECTC
δ = when C ECT≥ (3-44)
1=δ when C ECT< (3-45) Where δ is the calibration factor included in Equation (3-38) and C is the ideal
effective curing thickness (= 7.6 cm) determined by experimental experience of authors.
A field test was conducted in the Riverside Campus of the Texas A&M University in Bryan, Texas to demonstrate the validity of new evaporation model (Equation 3-38) illustrated in Figure 3.7. This field test consisted of placing the concrete at 8:23 am in the morning and the test was finished at 2:30 pm in the afternoon when the relative humidity at concrete surface had equilibrated with the ambient relative humidity. Solar radiation and wind speed were measured by a weather station placed near the concrete specimen. Ambient temperature and relative humidity, the temperature and relative humidity at the concrete surface and inside the concrete were also measured by the ATEK curing
0 2.5 5 7.5 10
Effective Thickness (cm)012345Windspeed (m/s)
00
55
1010
15 15
20 20
25 25
30 30
B-F
acto
r (kg
/m^2
/hr)
B-F
acto
r (kg
/m^2
/hr)

- 49-
monitoring system. The rate of evaporation calculated by the new evaporation model (Equation 3-38) agrees with the measured one well, while the rate of evaporation from ACI Nomograph is underestimated during bleeding (in the morning) and overestimated after bleeding (in the afternoon). The advantages of the new evaporation model are improved prediction and sensitivity to the factors that control the amount of evaporation from hardening concrete for different curing methods.
0.0
0.2
0.4
0.6
0.8
1.0
8:00 9:00 10:00 11:00 12:00 13:00 14:00 15:00
Curing Time (hours)
Sola
r Rad
iatio
n (k
W/m
2 )
0.0
0.5
1.0
1.5
2.0
2.5
Win
d Sp
eed
(m/s
)
Solar Radiation Wind Speed
Cloudy
(a)
0.0
0.10.2
0.3
0.40.5
0.6
0.7
0.80.9
1.0
8:00 9:00 10:00 11:00 12:00 13:00 14:00 15:00
Curing Time (hours)
Rat
e of
Eva
pora
tion
(kg/
m2 /h
r)
Measurement New Model ACI Nomograph
(b)
Figure 3. 7 Validation of New Evaporation Model at Field: (a) Solar Radiation and Wind Speed Measured by Weather Station; (b) Comparison of Rate of Evaporation
among Measurement, New Model, and ACI Nomograph.

- 50-
Effective Curing Thickness (ECT) is a measure of the curing compound capability to resist moisture lost. ECT stems from boundary condition of moisture transport, which is given by Equation (3-40). With one dimensional simplification, J is given by the following equation.
0=
=xdx
dHCJ (3-46)
where C is permeability, kg/ (m·sec).
Rearrange Equation (3-40).
dxdH
HH
BCa
sln/ = (3-47)
Since B has the dimension of kg/ (m2·sec), the left side, which is defined as ECT, of the equation comes out with the dimension of length. The higher the ECT, the better the curing membrane to resist moisture loss.
Lab tests were carried out to investigate how ECT changes with time. The data is informative. Under high wind speed condition, the period of ECT is shortest and the total moisture loss is highest.
Figure 3. 8 Lab Tests
ECT under Different Wind Conditions
0
0.5
1
1.5
2
2.5
0.00 2.00 4.00 6.00 8.00
Age, Hrs
EC
T, in
ches
Low Low LowMid Mid High
0
0.2
0.4
0.60.8
1
1.2
1.4
1.6
0.00 2.00 4.00 6.00 8.00
Age, Hrs
Evap
orat
ion
Rat
e (k
g/m
2 /hr)
Low Low Low
Mid Mid High
Evaporation Rate under Different Wind Conditions
(a) ECT vs time (b) Evaporation rate vs time
Weight Loss under Different Wind Conditions
0.0
50.0
100.0
150.0
200.0
250.0
300.0
0.00 2.00 4.00 6.00 8.00 10.00
Age, Hrs
Wei
ght L
oss,
gra
ms
Low Low LowMid Mid High
0
10
20
30
40
50
60
70
0 5 10 15
Curing Time (hours)
Surf
ace
RH (%
)
No Wind
v=2.08m/s
v=2.83m/s
v=5.33m/s
After BleedingBleeding (c) Weight loss vs time (d) Surface humidity vs time

- 51-
3.6 SYNTHESIS OF CURING MEMBRANE EFFECTIVENESS
One objective of research project 5106 is to evaluate the effectiveness of curing membranes in controlling evaporation under field conditions. Some investigations into the effectiveness of curing membranes have tended to measure special concrete properties (i.e. oxygen permeability, electrical conductivity, porosity, etc.) that caused by or related to the availability of hydration of water and comparing those parameters to evaluate the effectiveness of curing compound. Although these parameters do have some utility in this regard, their use in curing specifications has some practical limitations since it is difficult to evaluate the curing membrane effectiveness in this manner under field conditions. Some researchers have concluded that maturity is not a good indicator of curing effectiveness. However, this is because only temperature-based maturity was considered. Research under project 0-1700 found that moisture-based maturity was very effective in this manner. The following provides a review of current literature on evaluating curing membranes effectiveness and briefly summarizes the work done in Research Project 1700 regarding assessment of curing effectiveness.
Carrier and Cady (1970) evaluated the effects of various application rates of
membrane-curing compounds on concrete using a laboratory test in which slab specimens were cured with rates from zero to 100ft2/gal. To evaluate the effectiveness of application rate, the moisture changes we characterized in terms of changes in relative humidity (RH) and changes in relative surface strengths using the Schmidt hammer. The test specimens were made with five application rates of curing compound: 0, 50, 100, 150, and 200 % of the standard coverage (200ft2/gal) with a white-pigmented type commonly used in Pennsylvania. The RH measuring points were positioned at depths ranging from 0.25 to 2 in. below the concrete surface. The field environment simulated in the lab was that of a hot summer day where the air temperature was cycled daily (4 hrs at 110 ± 2 °F - heating phase - and 20 hrs at 75 ± 2°F) and the wind speed was held constant at 4 ± 1 mph during the heating phase and the RH is maintained at 20 ± 5 %. The RH of the specimen was measured at 1, 2, 3, 5, 7, 9, 11, and 14-days of age, while the strengths of cured specimen surface were measured with the Schmidt hammer after 14 days of age. Petrographic examination of the surface concrete determined the differences in the extent of hydration.
The following conclusions were reached: 1. In the measurement of RH, while the zero coverage specimens dried quickly,
the specimen sprayed with 200% application (100 ft2/gal) loses as much moisture as those sprayed with 50% (400 ft2/gal).
2. Hydration virtually ceases when concrete dries below RH of about 80% at which the water-filled capillaries begin to empty. Therefore, the effective curing time is the period that the RH in concrete maintains above 80%.
3. The effective curing time increases with increasing application rates; that is, the zero application curing period is very short, while the others increase progressively with increasing application rates.
4. The result of the strength test appears to be similar to that of the RH test. The result indicates that while the 0% coverage surfaces are much weaker than
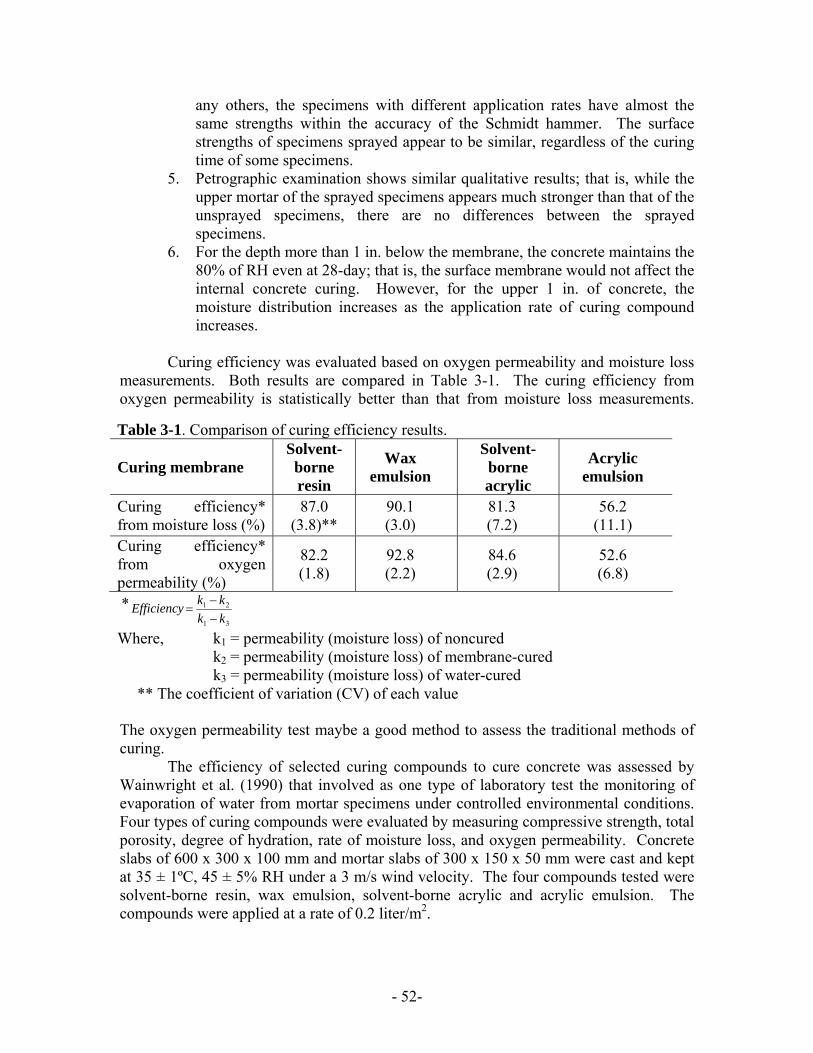
- 52-
any others, the specimens with different application rates have almost the same strengths within the accuracy of the Schmidt hammer. The surface strengths of specimens sprayed appear to be similar, regardless of the curing time of some specimens.
5. Petrographic examination shows similar qualitative results; that is, while the upper mortar of the sprayed specimens appears much stronger than that of the unsprayed specimens, there are no differences between the sprayed specimens.
6. For the depth more than 1 in. below the membrane, the concrete maintains the 80% of RH even at 28-day; that is, the surface membrane would not affect the internal concrete curing. However, for the upper 1 in. of concrete, the moisture distribution increases as the application rate of curing compound increases.
Curing efficiency was evaluated based on oxygen permeability and moisture loss
measurements. Both results are compared in Table 3-1. The curing efficiency from oxygen permeability is statistically better than that from moisture loss measurements.
The oxygen permeability test maybe a good method to assess the traditional methods of curing.
The efficiency of selected curing compounds to cure concrete was assessed by Wainwright et al. (1990) that involved as one type of laboratory test the monitoring of evaporation of water from mortar specimens under controlled environmental conditions. Four types of curing compounds were evaluated by measuring compressive strength, total porosity, degree of hydration, rate of moisture loss, and oxygen permeability. Concrete slabs of 600 x 300 x 100 mm and mortar slabs of 300 x 150 x 50 mm were cast and kept at 35 ± 1ºC, 45 ± 5% RH under a 3 m/s wind velocity. The four compounds tested were solvent-borne resin, wax emulsion, solvent-borne acrylic and acrylic emulsion. The compounds were applied at a rate of 0.2 liter/m2.
Table 3-1. Comparison of curing efficiency results.
Curing membrane Solvent-borne resin
Wax emulsion
Solvent-borne acrylic
Acrylic emulsion
Curing efficiency* from moisture loss (%)
87.0 (3.8)**
90.1 (3.0)
81.3 (7.2)
56.2 (11.1)
Curing efficiency* from oxygen permeability (%)
82.2 (1.8)
92.8 (2.2)
84.6 (2.9)
52.6 (6.8)
*31
21
kkkkEfficiency
−−
=
Where, k1 = permeability (moisture loss) of noncured k2 = permeability (moisture loss) of membrane-cured k3 = permeability (moisture loss) of water-cured
** The coefficient of variation (CV) of each value

- 53-
Compressive strength was measured at 3, 7, and 28 days using 100 mm cubes. The 28 day strength of non-cured specimens was about 22% and 19% lower than those water-cured for 3 days and those cured with a wax emulsion membrane, respectively. Moisture loss was measured by monitoring the weight change with time. The water loss trends were similar to those of compressive strength but the difference between curing types was greater. However, all curing methods produced significant reduction in moisture loss. The wax emulsion compound performed the best and was almost three times less than that of non-cured concrete.
Porosity was measured at various depths beneath the surface of the concrete slabs.
The trends were similar to the test results noted above. The difference between curing methods decreased as the depth below the surface increased. However, since the concrete more than 50 mm below the surface is rarely affected by curing conditions at the surface, the differences between curing methods become insignificant at depths more than 50 mm. The measurement of the pore size distribution was conducted using samples taken within 12 mm from the surface for both cured and non-cured mortar slabs. The results show that the volume of the capillary pores greater than 0.01µm is significantly reduced for the cured specimens.
Oxygen permeability was measured with samples taken at various depths beneath
the surface of the concrete slabs. The results were similar to those of the porosity test. Near the surface, the non-cured concrete was 8-10 times more permeable than cured concretes. Similar to the measured porosities, the difference is insignificant at depths more than 50 mm below the surface.
The study shows that although all test results present a similar trend, the oxygen
permeability test is most sensitive and the wax emulsion is the most effective curing membrane. The concrete more than 50 mm depth is affected little by curing condition. The permeability test was recommended for assessment of potential durability and the curing efficiency since the permeability reflects potential durability of concrete and is mainly affected by curing methods.
Cable, Wang, and Ge (2003) carried out a research project sponsored by the Iowa
DOT to evaluate curing compound materials, application methods and effects of curing on concrete properties. The research consisted of laboratory testing and field evaluation of identified products and application rates. The research showed that curing materials and application methods have a critical effect on the properties of the near-surface concrete particularly in hot weather conditions. Concrete cured with curing compounds that were indexed with a high curing efficiency had lower sorptivity, higher conductivity, higher degree of hydration, and higher compressive strength. Among these tests, the sorptivity test is the most sensitive indicator for quality whereas the compressive and flexural strengths were not. The sorptivity showed a close relationship to moisture content and degree of hydration while the conductivity showed a strong correlation to moisture content of the concrete.

- 54-
Curing compound materials and related application methods were evaluated in the field relative to the properties of field concrete pavement. The curing compounds tested are listed in Table 3-2 according to Iowa DOT designations and their rated qualities. The 1600-white series (1645 white and 1600 white) are wax-based, white-pigmented concrete curing compounds with selected white pigments. The difference between 1645 and 1600 is the solid content that 1645 has 29.2% and 1600 has 17.1%. The 2200- white series concrete curing compounds are high solids, white pigmented, polyalphamethylstryene-based (resin-based).
The compounds and two application rates were compared to no curing and wet
curing by testing the conductivity, permeability, and maturity of the surface concrete. The conductivity is a measure of water retentivity of a curing compound; the maturity should be an indication of the degree of hydration, and the permeability an indication of durability of the near-surface concrete. The efficiency index is defined as:
wo
co
EEEE
Efficiency−−
=
where, Eo = moisture loss for omission of curing Ec = moisture loss for certain curing compound Ew = moisture loss for wet curing
Maturity testing conducted in the manner it was did not prove to be beneficial. The maturity could not sufficiently evaluate the effectiveness of curing and was not sensitive to environment effects such as the air temperature, humidity, wind, or rainfall on the degree of maturity of the concrete.
The permeability testing was conducted at the top, middle, and bottom of cores
taken from the pavement. The test data showed little difference in the middle and bottom permeabilities and there seemed to be no difference between different curing methods; the without curing however, yielded higher permeability at the top. The sections with curing compound and with wet curing had almost the same permeability. The permeability also decreases as the depth increases.
This research showed that electrical conductivity is statistically related to
moisture content of the concrete and that the method of curing affected the top of the pavement more than the area deeper, below the surface. Deep sections had higher conductivity than those at the top because of evaporation. Accordingly, the effectiveness of a curing method is ascertained by comparison between the initial and current conductivity values. The conductivity results shows the same trend with the efficiency
Table 3-2 Typical Properties of the Curing Compounds.
Curing Compounds Efficiency Index Estimated Cost
($/gal)
1645-White 95.9 2.0
1600-White 89.0 1.0
2255-White 98.1 6.5

- 55-
index of curing compounds listed in Table 3-1. No sorptivity test or moisture content results were given but the degree of absorption of water is thought to be closely related to the pore structure characteristics of concrete and should be a good test for the curing effectiveness. The moisture content readings with time showed a large variation due to several factors such as texture of the pavement, measuring position and environmental change.
This research concluded that only slight differences existed between wet curing,
compound curing and no curing; while the maturity test could not identify the difference between different curing compound materials. The permeability test showed that curing compounds provide the same quality as wet curing and that the compound materials tested were ranked as: wet curing, 2255 single layer, 1645 double layer, 1645 single layer, and 1600 double layer.
The Minnesota Department of Transportation (Mn/DOT) examined and evaluated
curing compounds used in the state projects relative to any needed changes in their curing specification (Vandenbossche 1999). Some of the work focused on the application of the compound to the pavement surface. The Mn/DOT requirement is 4 m2/gal (163 ft2/gal) regardless of the type of pavement surface such as tinning or texturing which increases the surface area. The application rate should be determined based on surface texture and application device in order to obtain uniform coverage. The five factors listed below affect the curing compound application.
1. Nozzle type: spray pattern, droplet size, pump pressure, spray angle, flow rate 2. Nozzle spacing and boom height: adjusting for 30% overlap of spray pattern edge 3. Nozzle orientation 4. Cart speed 5. Wind shield It was thought that non-uniform coverage is mainly caused by damage to the
nozzle or orifice. Nonetheless, Mn/DOT showed that the desired coverage can be achieved by the proper nozzle selection, cart speed, pump pressure, flow rate and so on. The study proposed the following recommendation for applying a curing compound:
1. The application of the curing compound should be calculated based on the type of surface texture maintaining a minimum of 4 m2/gal (163 ft2/gal). 2. 30 % of the spray overlap should be obtained. 3. The coverage should be controlled by not the pump speed but by the cart speed. 4. The cart speed should be calculated using the following equation.
wCFcoeffv
××
=.
where, v = cart speed (km/h, or miles/h) coeff. = 6 for SI units, or 0.13636 F = flow rate (L/min, or gall./ min) per nozzle C = desired coverage (L/m2, or gall/ft2) w = Nozzle spacing (cm, of inches)

- 56-
5. Nozzle tips should be clean without damaging or wearing. In another Mn/DOT related study, Whiting (2003) evaluated the effectiveness of
high and low volatile organic compound (VOC) curing compounds by examining the moisture-retention capacity of them. A modification of ASTM 156-98, Standard Test Method for Water Retention by Concrete Curing Materials, was used for this evaluation. In addition, compressive strength, permeability, and capillary porosity of hardened mortar samples were also determined. Three different curing methods, ponded water (Treatment W), no curing (Treatment N), and polyvinyl sheeting (Treatment P), are also examined for reference. The curing compounds used for test are low VOC (L-1, 2, 3) and three of high VOC (H-1, 2, 3). Infrared fingerprinting, characteristic of surface coverage, and percentage of solids are examined to understand this aspect of each curing compound tested.
The moisture retention was measured by monitoring the mass loss of each mortar
specimen. The curing compound was applied as soon as the bleed water has disappeared and the application rates were based on the minimum rate recommended by the manufacturers. The specimens were cured in the test chamber at a specific temperature, RH, and evaporation rate.
As expected, the result of the moisture retention test showed that Treatment P was
the most effective. However, generally speaking, the high VOC compounds showed a lower rate of moisture loss than the low VOC compounds but moisture loss was high within the first 24 hrs and then the gradually stabilized. Although ASTM requires the moisture loss after 72 hrs to be less than 0.55kg/m2, only Treatment P met that requirement. Moisture retention capacity of the curing compounds was evaluated relative to the moisture loss for the Treatment N:
)100(%Mn
MsMnssEffectiven −=
where Mn= average moisture loss of specimens from Treatment N and Ms = average moisture loss of specimens from treatment being considered.
The percent effectiveness decreases with time for all treatments where Treatment P had the highest percent effectiveness. In terms of compressive strength, mortar specimens cured with high VOC compounds gained strength more quickly than those cured with low VOC compounds. The 28 day strength of Treatment N cured mortar was about 54% of that of Treatment W. The 28 days strength of specimens with curing compounds ranged from 55% to 75% of the strength of Treatment W. The result showed that curing method has a greater impact on long term strength development than early age strength. A high correlation existed between the average moisture loss and the compressive strength. There was also a strong correlation between the percentage of solids and compressive strength. However, the percentage of solids is only a good indicator if the compounds are chemically similar.

- 57-
The relative permeability of the specimens was also estimated using the RCP test at 3, 10, and 28 days. After 3 and 10 days of curing, the estimated permeability of all specimens was high, exceeding 4,000 coulombs. After 28 days of curing, all test results range from moderate to high permeability. The low VOC samples had the highest permeability value and Treatment W and Treatment P had the lowest value. In conclusion of the study, the specimens with high VOC compounds show less moisture loss, higher strength, and lower permeability than those with low VOC compounds. The specimens cured with plastic sheeting show better moisture retaining ability, long term strength, and lower permeability than any other curing compounds. However, early strength is higher in some specimens with a high VOC compound than in those with plastic sheeting. Thus, the VOC content does not appear to be the best indicator of how a curing compound will perform.

- 58-
- 59-
CHAPTER 4 SUMMARY
This chapter summarizes the findings of the literature review on curing of concrete. Concrete material properties affected by curing are summarized, relative humidity (RH) measuring principles and devices are described, evaluation of other states’ departments of transportation (DOTs) practices on curing are summarized, and research findings on curing materials and methods are provided. 4.1 CONCRETE MATERIAL PROPERTIES AFFECTED BY CURING
Cement needs a certain level of RH to continue to hydrate. Even though different RH values are reported for the cement hydration to continue, 80 percent is the widely accepted RH value. If the RH in concrete pores falls below this value, the hydration of cement virtually stops and further improvement of concrete properties due to continued cement hydration and pore filling by hydration products is not achieved. The zone near the concrete surface that is most prone to moisture loss is the curing affected zone (CAZ). CAZ is relatively shallow compared with the slab thickness of portland cement concrete pavement. The reported values of CAZ vary from ¼ inch to about ½ inch depending on the curing effectiveness and the concrete mix characteristics. Because of this shallow CAZ, certain hardened concrete properties are more affected by curing than others. Abrasion resistance, permeability, and absorption are the properties most influenced by curing effectiveness. On the other hand, strength is not as sensitive to curing effectiveness as the three properties described above. 4.2 RELATIVE HUMIDITY MEASUREMENT
Relative humidity refers to the ratio, stated as a percent, of the moisture content of air compared to the saturated moisture level at the same temperature and pressure. There are several types of RH measuring devices. Relative humidity is important in concrete as cement can hydrate only when the RH in the concrete pores is maintained at a certain level, reportedly 80 percent or higher. There are several types of devices to measure RH in concrete. The most widely used types are dew point type and capacitive type. The comparison of several devices indicates excellent correlation. They have both advantages and disadvantages. The advantages of dew point type include the accuracy of the testing results, while the disadvantages are high initial cost and effort involved in the testing. The advantages of capacitive type devices are low initial cost, decent accuracy of the testing results, and much less effort required for installation and data gathering. Disadvantages include that the accuracy is not as good as that of dew point type device. However, in recent years there have been substantial and continued improvements in electronics technology and the accuracy of the capacitive type devices is expected to continue to improve.
- 60-
4.3 OTHER STATES’ DEPARTMENTS OF TRANSPORTATION SPECIFICATIONS ON CURING
Review of other state departments of transportation specifications for curing
illustrates that they are all method-type specifications for when to initiate curing operations and how much curing compound needs to be applied. Also, there is no compliance testing required and curing is an incidental to major pay items. This type of specification requirement quite often results in the curing operation not receiving the adequate attention it deserves. Part of the reason is that, at least at this point, there is no universally accepted compliance testing that is accurate enough, while simple and easy, to implement during concrete placement. Until a reasonable compliance testing is identified, it is expected that the use of prescriptive and method-type specifications will continue and types of performance-related specifications cannot be developed for curing. 4.4 EFFECTIVENESS OF VARIOUS CURING MEMBRANES OR METHODS
The findings described below present the various application rates of membrane-curing compounds:
1. In the measurement of RH, while the zero coverage specimens dried quickly, the specimen sprayed with 200 percent application (100 ft2/gal) loses as much moisture as those sprayed with 50 percent (400 ft2/gal).
2. Hydration virtually ceases when concrete dries below an RH of about 80 percent at which the water-filled capillaries begin to empty. Therefore, the effective curing time is the period that the RH in concrete maintains above 80 percent.
3. The effective curing time increases with increasing application rates; that is, the zero application curing period is very short, while the others increase progressively with increasing application rates.
4. The result of the strength test appears to be similar to that of the RH test. The result indicates that while the 0 percent coverage surfaces are much weaker than any others, the specimens with different application rates have almost the same strengths within the accuracy of the Schmidt hammer. The surface strengths of specimens sprayed appear to be similar regardless of the curing time of some specimens.
5. Petrographic examination shows similar qualitative results; that is, while the upper mortar of the sprayed specimens appears much stronger than that of the unsprayed specimens, there are no differences between the sprayed specimens.
6. For the depth of more than 1 in. below the membrane, the concrete maintains the 80 percent of RH even at 28 days; that is, the surface membrane would not affect the internal concrete curing. However, for the upper 1 in. of concrete, the moisture distribution increases as the application rate of curing compound increases.
The evaluation of the efficiency of selected curing compounds resulted in the following:

- 61-
1. Four curing compounds were evaluated; solvent-borne resin, wax emulsion, solvent-born acrylic and acrylic emulsion.
2. As for the moisture loss, wax emulsion compound performed the best and was almost three times less than that of noncured concrete.
3. Oxygen permeability testing showed that near the surface, the noncured concrete was 8–10 times more permeable than cured concrete. The difference was insignificant at depths more than 50 mm below the surface.
4. Among the tests performed, the oxygen permeability test is most sensitive and the wax emulsion is the most effective curing membrane.
Research to evaluate curing compound materials, application methods, and the effect
of curing on concrete properties showed the following:
1. The sorptivity test is the most sensitive indicator for quality whereas the compressive and flexural strengths were not.
2. Maturity testing could not sufficiently evaluate the effectiveness of curing and was not sensitive to environmental effects such as the air temperature, humidity, wind, or rainfall on the degree of maturity of the concrete.
3. Only slight differences existed between wet curing, compound curing, and no curing, while the maturity test could not identify the difference between different curing compound materials.
A study of the effectiveness of high and low volatile organic compound curing
compounds showed the following:
1. The high-volatile organic compounds (VOCs) showed a lower rate of moisture loss than the low VOCs.
2. Curing method has a greater impact on long-term strength development than early age strength. A high correlation existed between the average moisture loss and the compressive strength.
3. The specimens with high VOCs show less moisture loss, higher strength, and lower permeability than those with low VOCs. The specimens cured with plastic sheeting show better moisture-retaining ability, long-term strength, and lower permeability than any other curing compounds. However, early strength is higher in some specimens with a high VOC than in those with plastic sheeting. Thus, the VOC content does not appear to be the best indicator of how a curing compound will perform.

- 62-

- 63-
CHAPTER 5 SHORT-TERM CURING RECOMMENDATIONS
Recommendations for immediate improvement of the concrete pavement curing during the hardening stages can be a function of one or a combination of the following recommended measures:
1. Apply delayed applications of curing membrane.
Laboratory evidence of the longevity of quality curing has thus far shown to vary from 6 to 12 hours depending on the wind conditions over the curing period. It appears that the application of an additional coat of curing compound 10 to 15 hours after the initial placement of the concrete at the end of the bleeding period would be an ideal time to enhance the curing quality of the concrete. Laboratory testing has suggested that the bleeding period apparently extends beyond the time when visual evidence has long evaporated and during this time water vapor continues to escape through the membrane creating permanent holes in the membrane for water vapor to escape. A delay application would perhaps block the passage ways through the original membrane thus improving the curing protection against additional evaporation.
2. Adoption of Mn/DOT application recommendations. Follow up on the Mn/DOT study and consider modification of the minimum spraying coverage rate (TxDOT minimum is 180 ft2/gal) to take into account the surface tinning and texturing which affects the coverage surface area and other factors that Mn/DOT listed in their study that affected the curing compound application.
i. Nozzle type: spray pattern, droplet size, pump pressure, spray angle, flow rate
ii. Nozzle spacing and boom height: adjusting for 30% overlap of spray pattern edge
iii. Nozzle orientation iv. Cart speed v. Wind shield
It was thought that non-uniform coverage is mainly caused by damage to the nozzle or orifice. Nonetheless, Mn/DOT showed that the desired coverage can be achieved by the proper nozzle selection, cart speed, pump pressure, flow rate and so on. Based on this study, the following for applying a curing compound can be recommended:
i. The application of the curing compound should be calculated based on the type of surface texture and maintaining a minimum coverage to be determined or verified.
ii. 30 % of the spray overlap should be obtained. iii. The coverage should be controlled by not the pump speed but by the cart
speed. iv. The cart speed should be calculated using the following equation.
wCFcoeffv
××
=.

- 64-
where, v = cart speed (km/h, or miles/h) coeff. = 6 for SI units, or 0.13636
F = flow rate (L/min, or gal/ min) per nozzle C = desired coverage (L/m2, or gal/ft2) w = Nozzle spacing (cm, or inches)
Nozzle tips should be clean and without damage or signs of wear.
3. Use of a curing monitoring system. Conduct monitoring of the curing system during the concrete hardening as part of the standard inspections procedures carried out during QC/QA. This would involve using the curing monitoring system first developed under Project 0-1700 that is currently being used in the laboratory testing program in this study. The curing monitor provides data at a selected point on the rate of evaporation and the effective thickness of the curing membrane and measures of curing quality. The monitor also provides data on the maturity of the concrete at the pavement surface as a function of the degree of moisture available for strength development. The results from the monitor are instantaneous, transmitted wirelessly, and would need interpretation over a broad area of paving much like the curing cards.
4. Change the method of curing. Use of plastic sheeting, mat curing and possibly sheltered curing has been proven to be extremely effective in resisting moisture evaporation during the concrete hardening stages. This type of curing would be most effective if used up to the time the bleeding period effectiveness ceases which is approximately 15 hours after placement. From that point, the use of a standard curing compound or membrane may be very effective in maintaining the moisture level in the concrete surface.
5. Use curing-density cards for different curing compounds. Each curing compound may have different coverage requirements from a visual standpoint that can be differentiated on a card and when compared to curing applied on a pavement surface. Upon application of the curing compound, the inspector could lay the card on the cured pavement surface and make a judgment as to the adequacy of the curing membrane over a relatively broad area. The quality may however be a function of the wind speed and the ambient relative humidity.
6. Change the proportion/type of the curing compound. A variety of resin and waxed based compounds are available and changing the type of the curing compound may be a method of curing improvement. This would require further laboratory testing and working with the compound manufacturers to work out the type of improvements that may be possible. These improvements should lead to changes in the current standards for curing compound efficiency.
- 65-
REFERENCES ACI 305R-96, Hot Weather Concreting, Manual of Concrete Practice, Part 2, Farmington
Hills, American Concrete Institute, 1996. ACI 308R-01, Guide to Curing Concrete, Manual of Concrete Practice, Part 2
Farmington Hills, American Concrete Institute, 2001. ASHRAE, Handbook of Fundamentals. American Society of Heating Refrigeration and
Air Conditioning Engineers, New York, NY, 1972. Bazant, Z. P., “Constitutive equation for concrete creep and shrinkage based on
thermodynamics of multiphase systems.” Materials and Structures, 3(13), 3–36. 1970.
Bazant, Z. P. and L. J. Najjar. Nonlinear Water Diffusion in Nonsaturated Concrete. Materials and Structures (RILEM), Vol. 5, No. 25, 1972.
Branco, F. A., Mendes, R. A., and Mirabell, E. Heat of Hydration Effects in Concrete Structures. ACI Materials Journal, Vol. 89, No. 2, pp. 139–145, 1992.
Buch, N. and Zollinger, D. G., “Preliminary Investigation on Effects of Moisture on Concrete Pavement Strength and Behavior.” Transp. Res. Rec. 1382, Transportation Research Board, National Research Council, Washington, DC, 26–31, 1993.
Cable, J. C., Wang, K., and Ge, Z., “Investigation onto Improved Pavement Curing Materials and Techniques: Part 2 (Phase 3,)”, Iowa DOT TR-479, Iowa Department of Transportation, 2003.
Carrier, R. E., and Cady, P. D., “Evaluating Effectiveness of Concrete Curing Compound,s” Journal of Materials, JMLSA, Vol.5, No.2, 1970.
Cather, R., “How to Get Better Curing,” Concrete, The Journal of the Concrete Society, London, V. 26, No. 5, Sept.-Oct., pp. 22–25, 1994.
Chapman, A. J., Fundamentals of Heat Transfer. Macmillan Inc., New York, NY, 1982. Dalton, J. Experimental Essays on Evaporation. Manchester Lit. Phil. Soc. Mem. Proc.,
Vol. 5, pp. 536–602, 1802. Dempsey, B. J., Herlache, W. A., and Patel, A. J., “Climatic-Materials-Structural
Pavement Analysis Program.” Transp. Res. Rec. 1095, Transportation Research Board, National Research Council, Washington, DC, 111–123, 1986.
Dhir, R. K., Levitt, M., and Wang, J., “Membrane Curing of Concrete: Water Vapour Permeability of Curing Membrane,” Magazine of Concrete Research, V. 41, No. 149, pp. 221–228, 1989.
Dilley, A. C., “On the Computer Calculation of Vapor Pressure and Specific Humidity Gradients from Psychometric Data,” Journal of Applied Meteorology, Vol. 7, Aug. 1968.
Fattuhi, N. I., “Curing Compounds for Fresh or Hardened Concrete,” Building and Environment, V. 21, No. 2, pp. 119–125, 1986.
Gowriplan, N., Cabrera, J. G., Cusens, A. R., and Wainwright, P. J., “Effect of Curing on Durability,” Concrete International, V. 12, No. 2, Feb., pp. 47–54.
Hsieh, C. K., Qin, C., and Ryder, E. E., “Development of Computer Modeling for Prediction of Temperature Distribution inside Concrete Pavements.” Rep. No. FL/DOT/SO/90-374, Department of Mechanical Engineering, University of Florida, Gainesville, FL, 1989.

- 66-
Incropera, F. P. and DeWitt, D. P. Fundamentals of Heat and Mass Transfer. 4th edition, John Wiley & Sons, New York, 1996.
Kapila, D., Falkowsky, J. and Plawsky, J. L., “Thermal Effects During the Curing of Concrete Pavements,” ACI Materials Journal, Vol. 94, No. 2, Mar.-Apr. 1997.
Kasi, S. S. H. and Pihlajavaara, S. E., “An Approximate Solution of a Quasi-Linear Diffusion.” Publication No. 153, The Station Institute for Technical Research, Helsinki, Finland, 1969.
Kaviany, M., Principles of Convective Heat Transfer. Springer-Verlag, New York, NY, 1994.
Klemens, P. G., Theory of the Thermal Conductivity of Solids, Academic Press, London, England, 1969.
Kohler, M. A., Nordenson, T. J., and Fox, W. E., Evaporation from Pans and Lakes, Research Paper, No. 38, U.S. Department of Commerce, Washington, May 1955.
Kosmatka, S. H., and Panarese, W. C., Design & Control of Concrete Mixtures, Portland Cement Association, Skokie. IL., 1988.
Linsley, R. K., Kohler, M.A., and Paulhus, J. L., Hydrology for Engineers, 2nd edition, McGraw-Hill, New York, 1975.
Mastangbrook, H. J., and Dinger, J. E., The Measurement of Water Vapor Distribution in the Stratosphere, Naval Research Tech., Rep. NRL. 5551, Washington, DC, 35 pp., 1960.
Mehta, P. K., and Moneiro, P. J. M, “Concrete Structure, Properties, and Material,” Prentice-Hall, 1993.
Meinel, A. B., and Meinel, M. P., Applied Solar Energy: An Introduction, Addison-Wesley, Reading, MA, 1976.
Menzel, C. A., Causes and Prevention of Crack Development in Plastic Concrete, Portland Cement Association Annual Meeting, pp. 130–136, 1954.
Mindess, S. and J.F. Young, J. F., Concrete. Prentice-Hall, Inc., Englewood Cliffs, New Jersey, 1981.
Murray, F. W., “On the Computation of Saturation Vapor Pressure,” Journal of Applied Meteorology, Vol. 6, Feb., 1967.
Neville, A. M., Properties of Concrete, 4th ed., John Wiley and Sons, New York, 1996. Parrot, L. J., Killoh, D. C., and Patel, R. G., “Cement Hydration under Partially Saturated
Conditions,” Proceeding, 8th Congress on Chemistry of Cement, Rio de Jeneiro, V. 3, pp. 46–50, 1986.
Parrott, L. J., “Moisture Profiles in Drying Concrete.” Advances in Cement Res., 1(3), 164–170, 1988.
Parrott, L. J., “Factors Influencing Relative Humidity in Concrete,” Magazine of Concrete Research, 43, No. 154, 1991.
Pechlivanidis, C., Papaleontiou, C. G., Meyer, A. H., and Fowler, D. W., “The Effectiveness of Membrane Curing Compounds for Portland Cement Concrete Pavements,” Research Report 1118-1F, Center for Transportation Research, 59 pp., 1988.
Penman, H. L., “Natural Evapotranspiration from Open Water,” Bare Soil, and Grass, Proceedings of the Royal Society of London, Series A, Vol. 193, pp. 120–146, 1948.

- 67-
Pihlajavaara, S. E., Introductory Bibliography for Research on Drying of Concrete. The State Institute for Technical Research, Helsinki, Finland, 1964.
Powers, T. C., “A Discussion of Cement Hydration in Relation to the Curing of Concrete,” Proc. of the Highway Res. Board, 27, Washington, DC, 178–188, 1947.
Powers, T. C., Properties of Fresh Concrete, John Wiley and Sons, Inc., 1968 Roveti, D. K., “Humidity Sensor: A Review of Three Technologies,” Sensors Magazine,
V. 18, No. 7, 10 pp., 2001. Ruiz, J. M., Schindler, A. K., Rasmussen, R. O., Nelson, P. K., and Chang, G. K.,
“Concrete Temperature Modeling and Strength Prediction Using Maturity Concepts in the FHWA HIPERPAV Software.” Proc., 7th Int. Conf. on Concrete Pavements, Vol. 1, Orlando, FL, 97–111, 2001.
Sawyer, J. L., “Wear Test on Concrete Using the German Standard Method of Test Machine,” Proceedings, ASTM, V. 57, July, pp. 1145–1153, 1957.
Says, W. M., and Crawford M. E., Convective Heat and Mass Transfer, McGraw-Hill, New York, NY, 1980.
Siegel, R. and Howell, J. R., Thermal Radiation Heat Transfer, 2nd Edition, McGraw-Hill, New York, NY, 1981.
Taljaston, B., Temperature Development and Maturity Growth for Ordinary Swedish Portland Cement Type II, Diploma Work 1987:035, Technical University of Lulea, Stockholm, Sweden, 1987.
Tetens, O., Uber Einige Meteorologische Begriffe Z. Geophys, Vol. 6, pp. 297–309, 1930.
Thepchatri, T., Johnson, C. P., and Matlock, H. “Prediction of Temperature and Stresses in Highway Bridges by a Numerical Procedure Using Daily Weather Reports.” Rep. No. 23-1, Center for Transportation Research, The University of Texas at Austin, 1977.
Thornthwaite, C. W., “An Approach toward a Rational Classification of Climate,” Geographical Review, Vol. 38, pp. 55–94, 1948.
Vandenbossche, J. M., “A Review of the Curing Compounds and Application Techniques Used by the Minnesota Department of Transportation for Concrete Pavements,” Minnesota DOT Final Report 2001-06, Minnesota Department of Transportation, 1999.
Veihmeyer, F. J., Evapotranspiration, Handbook of Applied Hydrology, Ven Te Chow, editor, McGraw-Hill, New York, 1964.
Wainwright, P. J., and Cabrera, J. G., Assessment of the efficiency of chemical membranes to cure concrete. Proceedings of an International Conference on The Protection of Concrete, Dundee, Scotland. September 1990, pp 907–920.
Wang, J., Dhir, R. K., and Levitt, M., “Membrane Curing of Concrete: Moisture Loss,” Cement and Concrete Research, V. 24, No. 8, pp. 1463–1474, 1994.
Wang, K., Cable, J. K., Zhi G., “Investigation onto Improved Pavement Curing Materials and Techniques: Part1 (Phase I and II),” Iowa DOT TR-451, CTRE 00-77, Center for Transportation Research and Education, Iowa State Univ., 46 pp., 2002.
Whiting, N. M., and Snyder M. B., “Effectiveness of Portland Cement Concrete Curing Compound,” Transportation Research Record, No. 1834, pp. 59–68, 2003.

- 68-
Whiting, N. M., “Effectiveness of Portland Cement Concrete Curing Compounds,”Transportation Research Board, No. 1834, 2003.
Wilson, G. W., Soil Evaporative Fluxes for Geotechnical Engineering Problems, Ph.D. Thesis, University of Saskatchewan, Saskatoon, SK, Canada, 1990.
Wilson, G. W., Fredlund, D. G., and Barbour, S. L., Coupled Soil-Atmosphere Modeling for Soil Evaporation,” Canadian Geotechnical Journal, Vol. 31, pp. 151–161, 1994.
Xin, D., Zollinger, D. G., and Allen, G. D. (1995). “An Approach to Determine Diffusivity in Hardening Concrete Based on Measured Humidity Profiles.” Advanced Cement Based Materials, 2, 138–144.
Yang, S. A Temperature Prediction Model in New Concrete Pavement and New Test Method for Concrete Fracture Parameters. Ph. D. Dissertation, Texas A&M University, College Station, 1996.