Embed Size (px)
Citation preview
TECHNICAL REPORT AND MINERAL RESOURCE ESTIMATE FOR THE PISKANJA BORATE PROJECT, SERBIA
Report Prepared ForErin Ventures Inc
645 Fort Street, Suite 203
Victoria BC V8W 1G2
Canada
Report Prepared by
SRK Exploration Services Ltd
ES7542
29 November 2013
Piskanja Technical Report– Details
SRKES7542 Piskanja NI43-101 Technical Report_2013 (2).docx November 2013
COPYRIGHT AND DISCLAIMER
Copyright (and any other applicable intellectual property rights) in this document and any
accompanying data or models is reserved by SRK Exploration Services Limited ("SRK ES") and
is protected by international copyright and other laws. The use of this document is strictly subject
to terms licensed by SRK ES to its client as the recipient of this Proposal and unless otherwise
agreed by SRK ES, this does not grant rights to any third party. This document may not be
reproduced or circulated in the public domain (in whole or in part) or in any edited, abridged or
otherwise amended form unless expressly agreed by SRK ES. This document may not be
utilised or relied upon for any purpose other than that for which it is stated within and SRK ES
shall not be liable for any loss or damage caused by such use or reliance.
SRK ES respects the general confidentiality of its clients’ confidential information whether formally
agreed with clients or not. See the attached Terms and Conditions as included in the
Commercial Appendices contain mutual confidentiality obligations upon SRK ES and the Client.
The contents of this Proposal should be treated as confidential by the Client. The Client may not
release the technical and pricing information contained in this Proposal or any other documents
submitted by SRK ES to the Client, or otherwise make it available to any third party without the
express written consent of SRK ES.
Client Feedback
We merit all comments received from our clients, take pride in providing an excellent service and place value on our ability to correct error. Should you wish to comment on any aspect of the service that an individual staff member has provided, or else the company as a whole, please feedback a reply to the email address [email protected], or if appropriate else write in confidence to our Managing Director at the address above.
© SRK Exploration Services Ltd 2013
SRK ES Legal Entity: SRK Exploration Services Ltd
SRK ES Address: 12 St Andrew’s CrescentCardiff
CF10 3DD
UK
Date: 29/11/2013
Project Number: ES7542
SRK ES Project Manager: Daniel Marsh Exploration Geophysicist
Client Legal Entity:
Tim Daniels President
Client Address:
Erin Ventures Inc 645 Fort Street, Suite 203
Victoria BC V8W 1G2Canada
V i 24/01/2012 13 25

SRK Exploration Services Limited Piskanja Technical Report –Executive Summary
SRKES7542 Piskanja NI43-101 Technical Report_2013 (2).docx November 2013 Page iii of xi
TECHNICAL REPORT AND MINERAL RESOURCE ESTIMATE FOR THE PISKANJA BORATE PROJECT, SERBIA – EXECUTIVE
SUMMARY
1 EXECUTIVE SUMMARY
Introduction 1.1SRK Exploration Limited (“SRK ES”) was commissioned by Erin Ventures Inc (“Erin” or the
“Company”) to produce a Technical Review for Balkan Gold’s Piskanja Project (the “Project”)
located in Serbia. Erin owns 100% of an exclusive exploration licence covering the Piskanja
Project through its wholly owned subsidiary Balkan Gold doo (“Balkan Gold”).
The Piskanja Project is a borate exploration project, located in the Jarandol basin of southern
Serbia. The project covers an area of 305.7 hectares and is located some 160 km south of the
Serbian capital Belgrade. The approximate centre of the project area in standard degrees,
minutes, seconds format is 43º 22’ 43”N and 20º 38’ 50”E.
Erin first obtained the Piskanja Project in 1997 as part of a 50% joint venture with
Elektroprivreda doo (Serbia). Following the resolution of international conflicts and a change
of the national governing party in 2006, Rio Tinto acquired the Piskanja Project as part of their
regional review of borate potential in Tertiary basins across the Balkan region. Rio Tinto
returned the licence to the Serbian Ministry of Mining and Energy in 2009. In 2010, Erin
acquired the exploration licence through its wholly owned subsidiary Balkan Gold
Exploration undertaken by Erin since 2010 has included the collection and analysis of all
historical data available relating to the Jarandol Basin including lithology, tectonic structures
and mineralisation, mapping and drilling. Erin commenced HQ diameter (64mm) diamond
core drilling of the Piskanja Project in July 2011. A programme of 38 drill holes was
completed by December 2012, totalling 13,478m. Samples were assayed by SGS Lakefield,
Canada and at SGS Bor, Serbia. The geological modelling was completed using 53 drill
holes, totalling 19,554 metres, which contained analytical sample data with B2O3 analysis
results for 1,473 samples, totalling 6,211.68 metres.
Geology 1.2The Piskanja borate deposit is of continental lacustrine type and formed within a closed basin
with abnormally high salinity. This is similar to many of the borate deposits in western Turkey
which are currently in production, such as Kirka, Bigadiç and Kestelec, all owned by Eti
Maden. The boron is likely to have been sourced from local volcanic rocks, from which it has
been leached and redeposited as numerous boron-bearing minerals in sedimentary
successions controlled by evaporation and chemical precipitation.
Based on correlation of lithology between boreholes, at least ten levels of continuous borate
mineralisation are recognised to date in the Piskanja Project, including three major horizons
(Zones 1-3) and seven minor horizons (Zones 4-10). The mineralised bodies are continuous
stratiform and semi-parallel layers of irregular shape which are slightly folded and dip at
approximately 18° to the southwest. The lateral extent of the mineralised bodies varies from
approximately 50 m x 360 m (Zone 9) to 415m x 950m (Zone 2), with longest dimensions
orientated approximately north-south.

SRK Exploration Services Limited Piskanja Technical Report –Executive Summary
SRKES7542 Piskanja NI43-101 Technical Report_2013 (2).docx November 2013 Page iv of xi
There are a variety of minerals which are found in borate deposits, although grade is always
quoted as a percentage of boric oxide (B2O3). According to mineralogical studies conducted
by Erin the boron bearing minerals found at Piskanja include major colemanite and howlite
with minor ulexite, hydroboracite, probertite, pandermite, nobleite, meyerhofferite, inyoite,
studenicite, rashite, jarandolite and tincalconite.
Mineral Resource 1.3SRK has considered geological continuity, grade continuity, quality of the digitised database,
sampling density, distance of block estimates from samples and estimation quality in order to
classify the deposit in accordance with National Instrument 43-101. Data quality, drill hole
spacing and the interpreted continuity of grades controlled by the mineralised horizons has
allowed SRK to classify the mineralisation under the Indicated and Inferred Mineral Resource
categories. Table 1.1 presents the NI43-101 compliant Mineral Resource Statement for the
Piskanja Project as at 22 October 2013, as signed off by Dr Mikhail Tsypukov of SRK
Exploration Services who has reviewed the Geology, mineralisation and Data quality who
takes responsibility for the geological models and data used for the Mineral Resource
estimate and Mr. Campodonic of SRK UK Ltd. who has reviewed and approved the technical
information presented in the Mineral Resource Statement.both Qualified Person(s) as defined
by National Instrument 43-101.
Mineral Resources are not Mineral Reserves as they have no demonstrated economic
viability. SRK and Erin are not aware of any factors (environmental, permitting, legal, title,
taxation, socio-economic, marketing, political, or other relevant factors) that have materially
affected the Mineral Resource Estimate. The Piskanja Project is considered to be an
exploration project and qualifies as an “Exploration Property” as defined by NI 43-101 and is
not affected by any mining, metallurgical or infrastructure factors.
The Mineral Resource Statement generated by SRK has been restricted to all classified
material above a marginal cut-off grade of 12% B2O3 and above a minimum mining height of
1 m. This cut-off grade assumes the following criteria:
The mineralisation will be exploited by underground mining methods;
the final product will be boric acid;
a boric acid price of USD1,005 per tonne;
a processing cost of USD 53 per tonne;
General and Administrative (G & A) costs of USD 14 per tonne; and
Royalty of 3%.
Table 1.1 Mineral Resource statement for the Piskanja Project October 2013.
Mineral Resource
Category Tonnage, Mt
B₂O₃ Grade,
%
Contained
B2O3, Mt
Indicated 5.6 30.8 1.73
Inferred 6.2 28.8 1.80
Reported at a cut‐off grade of 12 percent B2O3, above a minimum mining thickness of 1 m, considering reasonable underground mining, processing and selling technical parameters and costs benchmark against similar borate projects and a selling price of US$1005/tonne (boric acid). All figures are rounded to reflect the relative accuracy of the estimates. Mineral Resources are not Mineral Reserves and do not have a demonstrated economic viability. The contained B2O3 represents estimated contained metal in the ground and has not been adjusted for metallurgical recovery, and may have discrepancies due to rounding.

SRK Exploration Services Limited Piskanja Technical Report –Executive Summary
SRKES7542 Piskanja NI43-101 Technical Report_2013 (2).docx November 2013 Page v of xi
Key Conclusions 1.4Overall, the work completed by Erin to date demonstrates that the Piskanja Project and the
western part of Jarandol Basin have significant potential to host multiple horizons of high-
grade boron mineralisation. SRK considers the Piskanja Project to be an exploration project
of merit and that there is potential to increase the current Mineral Resources with further
targeted exploration programmes.
SRK has created a geological database based on the information provided by Erin Ventures
in July 2013. SRK has excluded the sampling data from holes drilled before the year 2000,
because of inappropriate analytical data quality, unreliable sampling system and poor
comparison with mineralised intersection in twin holes drilled after 2000, which provided more
reliable and quality data.
SRK estimated the natural boron mineralisation cut-off at 5% B2O3 and used this value to
delineate the mineralised zones. After building the wireframes of mineralised zones, SRK
performed statistical analysis of boron grade distribution within the zones. The analysis has
shown bimodal grade distribution in the set of samples. SRK analysed the spatial distribution
of these clusters and found that it is impossible to delineate them into separate estimation
domain wireframes due to the grade continuity evident. SRK is of the opinion that a low-grade
domain can be associated with a near-contact, vein-impregnated mineralisation type. The
current drilling spacing of approximately 100 x 100 m does not allow delineation of these
zones into separate mineralised bodies. SRK considers that the areas with high and low
grades need to be separated into separate wireframes in future updates to the MRE
presented in this report.
The MRE presented here has been undertaken using Ordinary Kriging (OK) based on the
omnidirectional variogram calculated from the whole sample database. Quantitative Kriging
Neighbourhood Analysis (QKNA) has been undertaken to assist in the selection of
appropriate interpolation parameters.
SRK has estimated the Mineral Resource for the Piskanja deposit in accordance with CIM
Code (2005) requirements. The MRE presented herein is effective as of 22 October. SRK has
accepted a cut-off at 12% B2O3 based on the price of USD 1,005 per tonne of boric acid to
estimate the portion of the Mineral Resource that has reasonable potential to be economically
mined.
The current MRE sits completely within the Piskanja Licence #1934. Erin has recently
obtained an Exploration Licence for boron mineralisation immediately adjacent to the Piskanja
Licence. This will permit Erin to expand drilling activities to the north, east and west to
determine whether mineralisation extends in any of these directions beyond existing drilling.
SRK are not aware of any significant risks or uncertainties that could reasonably be expected
to affect the reliability or confidence in the exploration information, MRE, or projected
economic outcomes.
Mineralogical studies have been completed by the Faculty of Mining and Geology at the
University of Belgrade on behalf of Erin and also at SGS Mineral Services UK. SRK are of the
opinion that more metallurgical testing is needed to determine the specific processing steps
required to produce borate products from the Piskanja deposit.

SRK Exploration Services Limited Piskanja Technical Report –Executive Summary
SRKES7542 Piskanja NI43-101 Technical Report_2013 (2).docx November 2013 Page vi of xi
Key Recommendations 1.5Based on the work undertaken as part of this Technical Study, SRK recommends the
following:
SRK recommend that Erin proceed to infill drilling at the Piskanja deposit to a 50x50 m grid.
SRK consider that at this grid spacing it will be possible to interpret the high-grade and low-
grade portions of mineralisation with a higher degree of confidence.
In order to evaluate the importance of tectonic structures some inclined drilling is
recommended. The first holes should be planned in the area where the development of the
main tectonic zone is interpreted from regional maps and geophysical data. More quantitative
structural data collected routinely during logging of drill core should be aimed at
understanding the influence of syn-sedimentary slumping, sub-vertical faulting and shallow
shearing on distribution of mineralisation.
The core sampling procedures used by Erin should always include sampling into the hanging-
wall and footwall contacts of the mineralisation, together with sampling of lower-grade internal
diluting material in higher-grade horizons. Further information on the host rocks will increase
the robustness of interpretation and quality of the estimate for higher confidence levels to be
considered during Mineral Resource classification.
Further modification and refinement of the sampling and QAQC procedures are
recommended to make them more robust, including; use of multi-element sodium peroxide
fusion ICP AES as the only analysis method as this will also accurately analyse for high-grade
boron as well as other elements, thus removing the need for both volumetric titration and
aqua regia ICP-MS analysis; submission of QAQC samples to primary and secondary
laboratories for the same analysis as core samples; and identification of a blank QAQC
material with a lower boron grade than the marble currently in use.
In addition to the above SRK note that there has only been a limited amount of metallurgical
and recovery testwork completed to date. Although the borate mineralisation at Piskanja is
high-grade and may require only limited beneficiation to create marketable products,
dedicated studies are required to determine such processes and associated costs.
Stakeholder engagement with local communities should be continued and incorporated into
an Environmental and Social Impact Assessment (ESIA), which will also include the results
from the on-going water monitoring already implemented by Erin.

Piskanja Technical Report – Table of Contents
SRKES7542 Piskanja NI43-101 Technical Report_2013 (2).docx November 2013 Page vii of xi
Table of Contents 1 EXECUTIVE SUMMARY ...................................................................................... III
Introduction ........................................................................................................................... iii 1.1
Geology ................................................................................................................................. iii 1.2
Mineral Resource .................................................................................................................. iv 1.3
Key Conclusions ................................................................................................................... v 1.4
Key Recommendations ......................................................................................................... vi 1.5
2 INTRODUCTION ................................................................................................... 1
Background ........................................................................................................................... 1 2.1
Terms of Reference ............................................................................................................... 1 2.2
Scope of Work ....................................................................................................................... 2 2.3
Qualifications of Consultants ................................................................................................. 3 2.4
Site Visits .............................................................................................................................. 4 2.5
Declaration ............................................................................................................................ 5 2.6
3 RELIANCE ON OTHER EXPERTS ...................................................................... 6
4 PROPERTY DESCRIPTION AND LOCATION .................................................... 7
Mineral Licence Tenure ......................................................................................................... 7 4.1
Mining Rights in Serbia ....................................................................................................... 10 4.2
Surface Rights ..................................................................................................................... 11 4.3
Permits and Authorisation ................................................................................................... 12 4.4
Environmental Considerations ............................................................................................. 12 4.5
Agreements and Royalties .................................................................................................. 12 4.6
5 ACCESSIBILITY, CLIMATE, LOCAL RESOURCES, INFRASTRUCTURE AND PHYSIOGRAPHY ................................................................................................ 14
Accessibility ......................................................................................................................... 14 5.1
Local Resources and Infrastructure ..................................................................................... 14 5.2
Climate ................................................................................................................................ 14 5.3
Physiography ...................................................................................................................... 15 5.4
6 HISTORY ............................................................................................................. 16
Historical Mineral Resource ................................................................................................. 17 6.1
7 GEOLOGICAL SETTING AND MINERALISATION ........................................... 18
Regional Geology ................................................................................................................ 18 7.1
Local Geology ..................................................................................................................... 20 7.2
Licence Geology ................................................................................................................. 22 7.3
7.3.1 Structure ................................................................................................................... 25
Mineralisation ...................................................................................................................... 26 7.4
8 DEPOSIT TYPES ................................................................................................ 30
9 EXPLORATION ................................................................................................... 32

Piskanja Technical Report – Table of Contents
SRKES7542 Piskanja NI43-101 Technical Report_2013 (2).docx November 2013 Page viii of xi
10 DRILLING ............................................................................................................ 34
Specific Gravity Data ........................................................................................................... 38 10.1
11 SAMPLE PREPARATION, ANALYSIS AND SECURITY .................................. 39
Sampling of Diamond Core ................................................................................................. 39 11.1
Sample Preparation ............................................................................................................. 41 11.2
Sample Analysis .................................................................................................................. 42 11.3
11.3.1 Initial Analysis Programme (Stage 1) ........................................................................ 47
11.3.2 Amended Analysis Programme (Stage 2) ................................................................. 48
QAQC Procedures and Results ........................................................................................... 48 11.4
11.4.1 Certified Reference Material ...................................................................................... 48
11.4.2 Blank Samples .......................................................................................................... 54
11.4.3 Duplicate Samples .................................................................................................... 55
11.4.4 Umpire Laboratory .................................................................................................... 56
SRK Comments on Adequacy of Procedures ...................................................................... 56 11.5
12 DATA VERIFICATION ........................................................................................ 58
Introduction ......................................................................................................................... 58 12.1
Comparison of Historical Drilling Data with Recent Drilling Data ......................................... 58 12.2
Sampling and Assay ............................................................................................................ 61 12.3
12.3.1 QAQC ....................................................................................................................... 61
Database ............................................................................................................................. 61 12.4
13 MINERAL PROCESSING AND METALLURGICAL TESTING ......................... 63
Magnetic and Electrostatic Separation ................................................................................ 63 13.1
Boric Acid Circuit Testing .................................................................................................... 64 13.2
SRK Recommendations ...................................................................................................... 64 13.3
14 MINERAL RESOURCE ESTIMATES ................................................................. 65
Introduction ......................................................................................................................... 65 14.1
Deposit modelling ................................................................................................................ 65 14.2
14.2.1 Available Data ........................................................................................................... 65
14.2.2 Data included in the Model ........................................................................................ 66
14.2.3 Mineralisation Zone Modelling ................................................................................... 69
14.2.4 Tectonic model .......................................................................................................... 71
Compositing ........................................................................................................................ 72 14.3
14.3.1 Composite Length Analysis ....................................................................................... 72
14.3.2 Composite Domain Statistics..................................................................................... 73
14.3.3 Evaluation for Outliers ............................................................................................... 76
14.3.4 Density Analysis ........................................................................................................ 76
14.3.5 Core Recovery .......................................................................................................... 76
Geostatistical Study ............................................................................................................. 77 14.4
14.4.1 Introduction ............................................................................................................... 77
Piskanja Technical Report – Table of Contents
SRKES7542 Piskanja NI43-101 Technical Report_2013 (2).docx November 2013 Page ix of xi
14.4.2 Quantitative Kriging Neighbourhood Analysis (QKNA) .............................................. 79
Mineral Resource Estimation ............................................................................................... 82 14.5
14.5.1 Interpolation .............................................................................................................. 82
14.5.2 Search Ellipse Parameters and Dynamic Anisotropy ................................................ 82
14.5.3 Grade distribution ...................................................................................................... 84
14.5.4 Block Model Validation .............................................................................................. 84
Mineral Resource Classification .......................................................................................... 88 14.6
14.6.1 CIM Definitions .......................................................................................................... 88
14.6.2 Piskanja Project MRE Classification .......................................................................... 89
14.6.3 Classification ............................................................................................................. 91
Mineral Resource Statement ............................................................................................... 92 14.7
Grade Tonnage Data ........................................................................................................... 93 14.8
Comparison to Previous Mineral Resource Estimates ......................................................... 95 14.9
15 MINERAL RESERVE ESTIMATES .................................................................... 96
16 MINING METHODS ............................................................................................. 96
17 RECOVERY METHODS ...................................................................................... 96
18 PROJECT INFRASTRUCTURE .......................................................................... 96
19 MARKET STUDIES AND CONTRACTS ............................................................ 96
20 ENVIRONMENTAL STUDIES, PERMITTING AND SOCIAL OR COMMUNITY IMPACT ............................................................................................................... 96
21 CAPITAL AND OPERATIONAL COSTS ............................................................ 96
22 ECONOMIC ANALYSIS ...................................................................................... 96
23 ADJACENT PROPERTIES ................................................................................. 97
24 OTHER RELEVANT DATA AND INFORMATION ........................................... 100
25 INTERPRETATION AND CONCLUSIONS ....................................................... 101
26 RECOMMENDATIONS ..................................................................................... 104
27 REFERENCES .................................................................................................. 106
List of Tables Table 1.1 Mineral Resource statement for the Piskanja Project October 2013. .................................. iv Table 2.1 SRK personnel involved in the Piskanja Project Technical Report and MRE ....................... 4 Table 4.1 Licence boundary coordinates for the Piskanja Project, licence #1934, given in UTM
WGS84 zone 34N datum and projection. .................................................................... 8 Table 4.2 The history of the validity of the Tenement covering the Piskanja Project area. ................... 8 Table 4.3 Royalties due on various extracted minerals (from Law on Mining and Geological
Researches, 2012) .................................................................................................... 13 Table 7.1 Composition of the main borate minerals found at Piskanja in order of decreasing
abundance, (www.webmineral.com and www.mindat.org) ........................................ 27 Table 10.1 Summary of Erin's 2011/2012 Piskanja Project diamond drilling programme ................... 35 Table 10.2 Location of Erin Ventures diamond holes drilled in 2011/2012 for the Piskanja Project,
Serbia. Coordinates are stated in UTM WGS84 ........................................................ 37 Table 10.3 Summary of unit weight test results for core samples of different lithologies within the
Piskanja deposit. Figures in brackets are number of individual samples tested ........ 38

Piskanja Technical Report – Table of Contents
SRKES7542 Piskanja NI43-101 Technical Report_2013 (2).docx November 2013 Page x of xi
Table 11.1 Summary of Piskanja Project sample analyses carried out at primary and secondary laboratories (including QAQC samples) .................................................................... 43
Table 11.2 Shea Clark Smith Certified Reference Materials used during the analysis of the first 240 samples for the resource drilling at Pisknja in 2011/2012 .......................................... 48
Table 11.3 Accreditation of laboratories used in the round robin analysis used to determine certified reference materials for the Piskanja Project .............................................................. 50
Table 11.4 Summary results for determination of reference material grades ...................................... 51 Table 14.1 Summary of Drilling Phases.............................................................................................. 66 Table 14.2 Drill holes removed from the database ............................................................................. 67 Table 14.3 Summary of mineralised zone properties .......................................................................... 71 Table 14.4 Summary statistics of raw samples versus composite samples ........................................ 73 Table 14.5 Summary Statistics per mineralisation zone (1m composites) .......................................... 74 Table 14.6 B2O3 range by Zone with the two thirds Rule Applied ....................................................... 79 Table 14.7 Post QKNA Interpolation Parameters ............................................................................... 80 Table 14.8 Block model framework .................................................................................................... 82 Table 14.9 Blocks filled in each estimation run ................................................................................... 84 Table 14-10 Comparison of block and sample mean grades .............................................................. 85 Table 14-11 Comparison of Block OK and Block IDW Grades ........................................................... 87 Table 14.12 Mineral Resource statement for the Piskanja Project ..................................................... 93 Table 14-13 Block Model Quantities and Grade Estimates* constrained with economic underground
reporting parameters ................................................................................................. 94 Table 23.1 Mineral exploration and exploitation licences proximal to the Piskanja licence ................. 98
List of Figures Figure 4-1 Location of the Piskanja licence area .................................................................................. 7 Figure 4-2 Geographical map of the Piskanja Exploration Licence #1934 (red line). ............................ 9 Figure 5-1 Examples of the terrain and agricultural land use typical of the licence area. Top - Before
drilling hole EVP2011-103 (left) and after drilling and remediation (right). Bottom - before drilling hole EVP2011-105 (left) and after drilling and remediation. All photos are taken facing approximately north. ....................................................................... 15
Figure 7-1 Simplified geological map of Serbia (Republic of Serbia, Ministry of Mining and Energy) Location of Piskanja Project in red ............................................................................ 19
Figure 7-2 Geological map of the Jarandol Basin and location of the Erin exploration licence (blue square). Black line indicates location of cross section in Figure 7-3 (Edited from the Federal Geological Institute, Belgrade, 1970) ........................................................... 21
Figure 7-3 Schematic cross section of the Jarandol Basin (Erin, 2013). See Figure 7-2 and Figure 7-4 for section location. ................................................................................................... 23
Figure 7-4 1:5000 Geological Map of the Piskanja Project, (Erin Ventures 2013) ............................. 24 Figure 7-5 Hydrothermally altered Oligocene andesite of the Piskanja basin. Clay alteration is
developed along the fault zones, road #22 north (left) and south (right) of the village of Baljevac. (photos provided by Erin). .......................................................................... 25
Figure 7-6 Steep angled laminations related to slumping in boreholes EVP-2011-109 and EVP-2011-110 ............................................................................................................................ 26
Figure 7-7 Example of syndepositional extension and stress in sandstone and mudstone within core from the Piskanja Project .......................................................................................... 26
Figure 7-8 Massive borate mineralisation in hole EVP2012-111 from 310.30 m to 313.20 m. Mineralisation comprises colemanite and ulexite (grey) and howlite (white) at the contact between shale and dolomite units, (Technical Report, 2012) ........................ 29
Figure 7-9 Interbedding of borate mineralisation (grey and white) with laminated dolomitic and shale lithologies. Hole EVP2012-106 from 291.90 m to 294.90 m depth, (Technical Report, 2012) ......................................................................................................................... 29
Figure 10-1 Location of drill collars for the Piskanaja Project overlaid on topography. Red dots = Erin 2011/2012 holes; Yellow = Rio Tinto 2006/2007 holes; Orange = Ibarmines pre-1997 holes. ........................................................................................................................ 36
Figure 11-1 Erin’s Baljevac core logging (above) and storage facility (below) including Erin’s 2011/2012 diamond core (lower, left) and historic Ibar Mines core (lower, right). ...... 40
Figure 11-2 Aqua regia ICP-MS versus titration grade for B2O3 obtained during Erin exploration campaign .................................................................................................................. 45

Piskanja Technical Report – Table of Contents
SRKES7542 Piskanja NI43-101 Technical Report_2013 (2).docx November 2013 Page xi of xi
Figure 11-3 Correlation of results for samples analysed by both volumetric titration and KOH fusion ICP-AES during Phase 1 ........................................................................................... 46
Figure 11-4 Correlation of results for samples analysed by both Na2O2 fusion ICP-AES and KOH fusion ICP-AES during Phase 1 ................................................................................ 47
Figure 11-5 Round Robin results for Erin's "Low Grade" standard 1X B ............................................. 51 Figure 11-6 Round Robin results for Erin's "Medium Grade" standard 2X B ...................................... 52 Figure 11-7 Round Robin results for Erin's "High Grade" standard 3X B ............................................ 52 Figure 11-8 Plot of reference material 1X B grade by sodium peroxide fusion ICP-AES analysis
method for ALS Romania (secondary laboratory) ...................................................... 53 Figure 11-9 Plot of reference material 2X B grade by sodium peroxide fusion ICP-AES analysis
method for ALS Romania (secondary laboratory) ...................................................... 53 Figure 11-10 Plot of reference material 3X B grade by sodium peroxide fusion ICP-AES analysis
method for ALS Romania (secondary laboratory) ...................................................... 54 Figure 11-11 Scatter plot of blank marble samples submitted to SGS Bor ......................................... 55 Figure 11-12 Scatter plot of B2O3 grade for 8 field coarse duplicates vs. original samples using
volumetric titration ..................................................................................................... 56 Figure 12.1 Comparison of the results for twin drilling between Ibar Mines and Rio Tinto campaigns 59 Figure 12.2 Comparison of downhole grade between Ibar Mines and Erin campaigns....................... 60 Figure 14-1Histogram of raw Assays .................................................................................................. 68 Figure 14-2 Probability plot of raw Assays .......................................................................................... 68 Figure 14-3 3D view of Geological Cross-sections and along strike Cross-sections (Leapfrog, view
along the azimuth 149) .............................................................................................. 69 Figure 14-4 Shells that correspond to 5% B2O3 grade cut-off (blue) and 10% B2O3 grade cut-off
(green) (Leapfrog, view along the azimuth 159) ........................................................ 70 Figure 14-5 General view of the mineralisation zones of Piskanja (Leapfrog, view along the azimuth
143, dip 31) ............................................................................................................... 70 Figure 14-6 Ordinary sample length distribution histogram................................................................. 72 Figure 14-7 Normal (left side) and log-normal (right side) B2O3 histograms for major mineralised zones
.................................................................................................................................. 76 Figure 14-8 Piskanja B2O3 downhole Semi-variogram ........................................................................ 78 Figure 14-9 Piskanja B2O3 Omni directional Semi-variogram ............................................................. 78 Figure 14-10 Probability Plot of Slope of Regression Values .............................................................. 81 Figure 14-11 Slope of Regression Distribution around Well Informed Blocks at Piskaja, Looking North;
Pink > 0.95, Red 0.5 to 0.95, Orange 0.2 to 0.5, Green < 0.2 (SRK, 2013) ............... 81 Figure 14-12 Visual Validation of search ellipses through the application of dynamic anisotropy, Zone
1,Looking NW (SRK, 2013) ....................................................................................... 83 Figure 14-13 Cross section showing visual validation of block grades and sample grades – looking
West (SRK, 2013) ..................................................................................................... 85 Figure 14-14 B2O3 sectional comparison in the X direction ................................................................ 86 Figure 14-15 B2O3 sectional comparison in the Y direction ................................................................ 86 Figure 14-16 B2O3 sectional comparison in the Z direction ................................................................. 87 Figure 14-17 Wireframe of the Indicated Mineral Resource (in dark green) for the Piskanja Project .. 92 Figure 14-18 Mineral Resource Classification for the Piskanja Project ............................................... 93 Figure 14-19 Total Grade – Tonnage curves for all mineralised zones ............................................... 94 Figure 23-1 Exploration and mining licences immediately adjacent to the Piskanja Borate Project,
(Erin press release, 8 January 2013) ........................................................................ 99
List of Technical Appendices TECHNICAL APPENDIX 1 ...................................................................................... A-1

SRK Exploration Services Ltd12 St Andrew’s Crescent Cardiff CF10 3DD Tel : +44 29 20 23 32 33 Fax : +44 29 20 23 3211 [email protected] www.srkexploration.com
Registered Address: 21 Gold Tops, City and County of Newport, NP20 4PG,
Wales, United Kingdom. SRK Exploration Services Ltd Reg No 04929472 (England and Wales)
Group Offices: AfricaAsia
AustraliaEurope
North AmericaSouth America
TECHNICAL REPORT AND MINERAL RESOURCE ESTIMATE FOR THE PISKANJA BORATE PROJECT, SERBIA
FILE REF: SRKES7542 Piskanja NI43-101 Technical Report_2013.docx
2 INTRODUCTION
Background 2.1SRK Exploration Services Limited (“SRK ES”) is an associate company of the international
group holding company, SRK Consulting (Global) Limited (the “SRK Group”). SRK ES has
been commissioned by Erin Ventures Inc (“Erin”, hereinafter also referred to as the
“Company” or the “Client”) to undertake a Technical Report including a Mineral Resource
Estimate (MRE) for the Balkan Gold Piskanja Boron Project (the “Project”) located in Serbia.
Balkan Gold is a wholly owned subsidiary of Erin. Erin is currently listed on the Toronto Stock
Exchange Venture Exchange (TSX-V) using the code EV.
This technical report is an update of the “Technical Report on the Piskanja Project, Serbia”
dated 16 July 2012, authored by SRK ES and filed by Erin on 23 July 2012 (herein referred to
as Technical Report, 2012)., The previous technical report, filed in July 2012 did not include a
MRE due to the unavailability of sufficient data and understanding at the time. The effective
date of this Technical Report is 29 November 2013. The MRE is effective as of 22 October
2013 and includes all the drilling data available to date completed by Erin and previous
licence holders. This technical report and MRE has been prepared under the guidelines of
National Instrument 43-101 and accompanying documents 43-101F1 and 43-101.CP (“NI43-
101”). The Mineral Resource statement reported herein was prepared in conformity with the
Canadian Institute of Mining (CIM) “Estimation of Mineral Resources and Mineral Reserves
Best Practice Guidelines”. As part of this commission SRK ES has enlisted SRK Consulting
(UK) Ltd (SRK UK) and SRK Consulting (Russia) to assist by undertaking the MRE for this
project. SRK ES, SRK UK and SRK Russia are referred to collectively as SRK for the
remainder of this document unless it is deemed necessary to refer to the specific consulting
practice.
The Piskanja Project is considered to be an exploration project and qualifies as an
“Exploration Property” as defined by NI 43-101. The Project is located in southern Serbia,
10 km north of the town of Raška and 160 km south of the capital, Belgrade.
Terms of Reference 2.2The Terms of Reference, as defined in a letter of engagement executed on 24 April 2013
between Erin and SRK includes the assessment of the borate mineralisation delineated by
drilling on the Piskanja Project, the review of exploration methodologies and protocols
employed by Erin on the Project, the completion of a MRE and the preparation of an
independent technical report both in compliance with National Instrument 43-101 and Form
43-101F1 guidelines.

Piskanja Technical Report – Main Report
SRKES7542 Piskanja NI43-101 Technical Report_2013 (2).docx November 2013 Page 2 of 112
Scope of Work 2.3The scope of work for the Technical Review includes a MRE model for the borate
mineralisation delineated by drilling on the Piskanja Project. In undertaking this commission
SRK has:
Verified all available exploration and drilling data acquired by Erin for the Piskanja
Project;
Undertaken site visits to the Project area. Dr Mikhail Tsypukov, and Ms Liubov
Egorova visited the Project site between 12 June 2013 and 14 June 2013 and
observed the deposit geology from drill core and held discussions with Erin staff on
the drilling, logging and sampling processes implemented following Dr Tsypukov’s
first visit to the project from 12 June 2012 to 15 June 2012;
Updated the understanding of deposit geology, structure, mineralisation and the
genetic model based upon drilling data and mineralogical studies completed by Erin;
Evaluated the initial metallurgical test work completed by Erin;
Imported the geological information into 3D Modelling Software Leapfrog and
Datamine) and validated the information;
Modelled a mineralisation envelope for the Piskanja deposit using the Borate assay
grades;
Conducted classical statistical analyses on the data;
Completed geostatistical analyses on the data in Isatis software;
Conducted quantitative kriging neighbourhood analysis (QKNA);
Estimated the tonnage and grade of the deposit;
Undertaken an analysis of the appropriate cut-off grade for reporting the Mineral
Resource;
Reviewed the Quality Assurance and Quality Control (“QAQC”) measures put in place
by Erin, and;
Reported a NI43-101 Compliant Mineral Resource Estimate for the Piskanja Project.
The information reviewed in preparing this report has largely been provided directly by Erin.
SRK’s opinions and recommendations expressed in this report are effective as of 29
November 2013 and are based on information provided to SRK by Erin received and
reviewed in both 2012 and 2013. The following information and information sources were
provided to SRK by Erin to assist with this commission;
Data gathered from personal communications between discussions with Erin
personnel and SRK relating to the geology and the exploration work undertaken to
date;
Digital databases of drilling data from Erin’s 2011-2012 programme, as well as partial
databases for a number of historic holes,
All assay results for the sampling of core from Erin’s 2011-2012 drilling programme
Mineralogical, petrological, metallurgical and hydrogeological reports produced for
Erin by third party organisations;
Geological maps produced by Erin at 1:5,000 scale;

Piskanja Technical Report – Main Report
SRKES7542 Piskanja NI43-101 Technical Report_2013 (2).docx November 2013 Page 3 of 112
Schematic cross sections of the deposit created by Erin, and;
In addition SRK also used information from public domain sources. SRK has referenced the
source of material where relevant. A full reference list can be found in Section 27 of this
report.
Qualifications of Consultants 2.4SRK ES is part of the larger SRK Group, which includes some 1600 professional staff
providing expertise in a wide range of exploration, mining and engineering disciplines. The
SRK Group also includes SRK Consulting (UK) Ltd (SRK UK) and SRK Consulting (Russia)
(SRK Russia) who, as previously mentioned have been involved in the Mineral Resource
Estimate (MRE) for this Project. SRK ES, SRK UK and SRK Russia are referred to collectively
as SRK for the remainder of this document unless it is deemed necessary by the authors to
refer to the specific consulting practice. The SRK Group’s independence is ensured by the
fact that it holds no equity in any project and that its ownership rests solely with its staff. The
SRK Group has a demonstrated track record in undertaking independent assessments of
mineral resources and ore reserves, project evaluations and audits, competent person’s
reports and independent feasibility evaluations on behalf of exploration and mining companies
and financial institutions world-wide.
The SRK Group consultants include specialists in the fields of exploration, geology, Mineral
Resource / Ore Reserve estimation and classification, open-pit and underground mining,
geotechnical engineering, metallurgical processing, hydrogeology and hydrology, tailings
management, infrastructure, environmental management and mining economics.
SRK has extensive experience in reviewing, auditing and evaluating exploration programmes
at all stages of development. Much of this work is conducted as a part of stock exchange
documentation, due diligence studies and project audits, as well as for internal review
purposes. SRK has extensive experience in the mining and exploration industry and employs
experienced geologists, engineers and scientists who are members in good standing of
appropriate professional institutions.
Neither SRK (SRK ES, SRK UK, SRK Russia), the SRK Group, nor any of their employees
employed in the preparation of this report has any beneficial interest in the assets of Erin.
SRK will be paid a fee for this work in accordance with normal professional consulting
practice.
The Qualified Person (as such term is defined in National Instrument 43-101) and principal
author of this technical report is Dr Mikhail Tsypukov. Dr Mikhail Tsypukov is a Fellow of the
Institute of Materials, Minerals and Mining (FIMMM, membership number 459707) and by
virtue of his education, membership of a recognised professional association and relevant
work experience Dr. Tsypukov is an independent Qualified Person as defined by National
Instrument 43-101. Dr. Tsypukov is a full time employee of SRK ES, with over 27 years’
experience in the mining industry.
The MRE work for this technical report was completed by Ms Liubov Egorova (MAusIMM,
membership number 310178), a Senior Consultant (Resource Geology) at SRK Consulting
(Russia) under the supervision of Mr Mark Campodonic (MSc. FAusIMM, membership
number 225925), who has reviewed the relevant sections relating to the MRE.

Piskanja Technical Report – Main Report
SRKES7542 Piskanja NI43-101 Technical Report_2013 (2).docx November 2013 Page 4 of 112
Both Ms Liubov Egorova and Mark Campodonic, by virtue of their education, membership to a
recognised professional association and relevant work experience are independent Qualified
Persons as this term is defined by National Instrument 43-101. Mark Campodonic is a full time
employee of SRK Consulting (UK) Ltd, a position held since 2003. Mark Campodonic has
over 13 years of experience and is currently a Principal Geologist with SRK Consulting (UK)
Ltd and Head of the SRK Consulting (UK) Ltd Geology Department. Mark Campodonic did not
visit the Project.
Sections of the report have been reviewed by Tracey Laight C.Geol. Tracey Laight is a full
time employee of SRK ES and has over 12 years of experience. Tracey Laight has reviewed
drafts of this technical report prior to their delivery to Erin as per SRK’s internal quality
management procedures. Ms Tracey Laight did not visit the project.
The Individuals from SRK who have provided input into the Piskanja Technical Report and
MRE have extensive experience in the mining industry and are members of good standing of
appropriate professional institutions, a summary of these persons and their roles are
presented in Table 2.1 below.
Table 2.1 SRK personnel involved in the Piskanja Project Technical Report and MRE
Role Person Site Visit
Geology and Principal
Author and QP
Dr Mikhail Tsypukov, Ph.D., FIMMM Yes
Mineral Resource Estimate Ms Liubov Egorova, MAusIMM (Membership
Number 310178)
Yes
Mineral Resource Estimate Mr Mark Campodonic, MSc. FAusIMM,
(Membership Number 225925)
No
Mineral Resource Estimate Mr Alexander Batalov No
Project Manager Mr Daniel Marsh, MGeophys, FGS No
Report Review Ms Tracey Laight, MSc. CGeol, FGS No
Site Visits 2.5In accordance with NI 43-101 guidelines, Dr Mikhail Tsypukov visited the Project between 12
June 2013 and 14 June 2013. Previously, Dr. Mikhail Tsypukov had visited the Project from
10 June 2012 to 15 June 2012. During the most recent visit in 2013, Dr. Tsypukov was
accompanied by Ms Liubov Egorova, and Balkan Gold personnel including Mr. Nenad P.
Rakic, Exploration Manager, Milena Janic, Chief Geologist and Toljic Marinko, Structural
Geologist.
The site visit included inspection of drill core, discussion with Erin personnel and assessment
of Erin’s technical protocols and methodologies that were modified following SRK’s
previoustechnical report, (Technical Report, 2012). During the site visit discussions were held
with the project personnel and the relevant information was collected for the preparation of
this technical report and the MRE. SRK was given full access to relevant data and discussed
with the Erin personnel any changes in the geological and structural understanding of the
deposit, the drill core logging and core sampling procedures and submission of these samples

Piskanja Technical Report – Main Report
SRKES7542 Piskanja NI43-101 Technical Report_2013 (2).docx November 2013 Page 5 of 112
for geochemical assay, and the management and interpretation of assay results returned from
laboratories.
During the site visit Erin also provided SRK with complete databases of drilling, sampling and
assay results for the resource drilling campaign that was completed in December 2012, as
well as documents detailing core sampling and geochemical assay procedures that were
implemented and amended following SRK’s site visit in June 2012.
SRK did not visit any of the sample preparation and assay laboratories involved in this Project
as part of this commission.
Declaration 2.6SRK’s opinion contained herein and effective 29 November 2013, is based on information
collected by SRK throughout the course of its investigations, which in turn reflect various
technical and economic conditions at the time of writing. Given the nature of the mining
business, these conditions can change significantly over relatively short periods of time.
Consequently, actual results may be significantly more or less favourable.
SRK has confirmed that the MRE reported herein is within the licence boundaries given
below. SRK has not, however, conducted any legal due diligence on the ownership of the
licences themselves.
SRK has not undertaken any detailed investigations into the legal status of the Project nor any
potential environmental issues and liabilities the Project may have at this stage.. SRK has
undertaken a limited amount of independent check sampling of material from the Project
during the course of the current investigation.
SRK is not aware of any other information that would materially impact on the findings and
conclusions of the report. SRK was informed by Erin that there are no known litigations
potentially affecting the Piskanja Project.
This report may include technical information that requires subsequent calculations to derive
sub-totals, totals and weighted averages. Such calculations inherently involve a degree of
rounding and consequently introduce a margin of error. Where these occur, SRK does not
consider them to be material.
SRK is not an insider, associate or an affiliate of Erin, and neither SRK nor any affiliate has
acted as advisor to Erin, its subsidiaries or its affiliates in connection with this Project. The
results of the technical review by SRK are not dependent on any prior agreements concerning
the conclusions to be reached, nor are there any undisclosed understandings concerning any
future business dealings.
SRK cannot accept any liability, either direct or consequential for the validity of information
that has been accepted in good faith.

Piskanja Technical Report – Main Report
SRKES7542 Piskanja NI43-101 Technical Report_2013 (2).docx November 2013 Page 6 of 112
3 RELIANCE ON OTHER EXPERTS The information reviewed in preparing this report has been provided directly by Erin and a
compilation of proprietary and publicly available information. SRK has referenced information
and data sourced from reports and documents where applicable. SRK has used information
from the previous Erin NI 43-101 compliant “Technical Report on the Piskanja Project, Serbia”
with the effective date of 16 July 2012 authored by Dr Mikhail Tsypukov and Mr Gareth
O’Donovan (Technical Report, 2012).
Some of the reports used by SRK in the creation of this technical report are authored by
persons who are not recognised as independent Qualified Persons as this term is defined by
National Instrument 43-101. In this case SRK has relied upon the professional measures used
by the companies who completed the work. The information in those reports is assumed to be
accurate based on the data review conducted by the author, but is not NI43-101 compliant.
These reports are as follows:
2006, Geosystem srl, Magnetotelluric Survey, Jarandol Basin, Serbia;
2012, University of Belgrade, Faculty of Mining and Geology, Testing of samples from
the Piskanja borate deposit (translation from Serbian);
2012, University of Belgrade, Faculty of Mining and Geology, Petrological
characteristics of holes 104, 105, 106, 107, IBM-4 and IBM-6 – Piskanja (in Serbian);
2012, SGS Minerals Services), Report on magnetic and HTE testing of borate
samples from Serbia;
2013, University of Belgrade, Faculty of Mining and Geology, Study of engineering
properties rock masses and terrains of the Piskanja borate deposit (translation of
concluding remarks from Serbian), and;
2013, MWH UK Ltd, Interim Hydrogeological Report (Phase II), Piskanja boron, near
Baljevac, Raška, Serbia

Piskanja Technical Report – Main Report
SRKES7542 Piskanja NI43-101 Technical Report_2013 (2).docx November 2013 Page 7 of 112
4 PROPERTY DESCRIPTION AND LOCATION This section (Section 4) of the report has largely been taken from the previous technical
report, (Technical Report 2012).
The Piskanja Project area covers 305.7 hectares with the approximate centre of the project
area as 43º 22’ 43”N and 20º 38’ 50”E in standard degrees, minutes, seconds format. The
Project is located in southeast Serbia, some 160 km south of the Serbian capital Belgrade.
Nearby towns include: Kraljevo,40 km to the north; Novi Pazar, 28 km to the south, and;
Raška,11 km to the south, (Figure 4-1).
Figure 4-1 Location of the Piskanja licence area
Mineral Licence Tenure 4.1The Ministry of Mining and Environmental and Spatial Planning of the Republic of Serbia (the
“Ministry”) granted Balkan Gold doo, Exploration Licence #1934 on 23 August 2010 under the
1995 Law on Mining published in Official Gazette of RS, no. 44/95. Balkan Gold doo is a
wholly owned subsidiary of Erin Ventures Inc. The Piskanja Exploration Licence was initially
granted for a period of one year. An extension of Exploration Licence #1934 was granted in
August 2011 for an additional year until 23 August 2012.

Piskanja Technical Report – Main Report
SRKES7542 Piskanja NI43-101 Technical Report_2013 (2).docx November 2013 Page 8 of 112
In July 2012, Erin applied for and was granted a new three year Exploration Licence under the
new Law on Mining and Geological Researches, published in Official Gazette no. 88/2011
which entered into force in January 2012. The renewed Exploration Licence #1934, was
granted on 05 November 2012 and is valid until 05 November 2015. The licensed area is the
same as under the previous title (3.075 km2) and is defined by the coordinates in Table 4.1
and Figure 4-2. The licence covers the Piskanja mineral deposit in its entirety and there are
no other known mineral deposits within the licence area.
On 10 December 2012, through Erin’s 100% owned subsidiary Balkan Gold doo, Erin were
granted Exploration Licence #2065 which covers an area of 35.22km2 in the Jarandol Basin.
This Exploration Licence (#2065) is adjacent to the eastern boundary of the existing Piskanja
#1934 Exploration Licence. Exploration Licence #2065 is valid until 10 December 2015 and
allows Erin to continue exploration in the Jarandol Basin for boron mineralisation and
associated elements (Li, Na, Sr and K), with a view to expand the Piskanja Project to the east.
Further details on this new Exploration Licence (#2065) area are given in Section 23. This
Technical Report and MRE is only concerned with Exploration Licence #1934 as no
exploration work has been undertaken by the Company on Exploration Licence (#2065) since
it was granted.
Table 4.1 Licence boundary coordinates for the Piskanja Project, licence #1934, given in UTM WGS84 zone 34N datum and projection.
Point Easting (X), m Northing, (Y), m
1 470,574.94 4,803,821.38
2 472,324.40 4,803,821.38
3 472,324.40 4,802,071.91
4 470,574.94 4,802,071.91
Table 4.2 The history of the validity of the Tenement covering the Piskanja Project area.
Licence
Number.
Tenement Name Date Valid
from
Date of Expiry Licence Area
1934 Piskanja 08/12/2010 08/23/2012 (extended
from 08/23/2011)
307.5 ha
1934 Piskanja 05/11/2012 05/11/2015 307.5 ha

Piskanja Technical Report – Main Report
SRKES7542 Piskanja NI43-101 Technical Report_2013 (2).docx November 2013 Page 9 of 112
Figure 4-2 Geographical map of the Piskanja Exploration Licence #1934 (red line).
Erin’s main responsibilities as licence holder are described in the “Decision of the Ministry of
Natural Resources, Mining and Spatial Planning” dated 05 November 2012. It is understood
by SRK that this decree states that Erin, through their 100% owned subsidiary Balkan Gold, is
committed to performing exploration activities initially for three years in accordance with the
Exploration Programme submitted by Erin to the Ministry at the time of licence application.
Erin contracted Ibarski Rudnici Coal Company, which is a subsidiary of the State-owned JP
PEU Resavica, to design their current (2012-2015) Exploration Programme. In accordance
with the 2012 Law on Mining and Geological Researches of Serbia, this Exploration
Programme was approved by the Institute for Nature Conservation of Serbia and the Institute
for Cultural Heritage and Preservation, Kraljevo, prior to it being submitted to the Ministry.
Previously, Erin’s 2010 Exploration Programme was designed and submitted by private
exploration consultancy, Jantar Group, Belgrade.
SRK understands that the obligations of the 2012-2015 Exploration Programme which Erin
must fulfil according to the Law on Mining and Geological Researches of Serbia, include
completion of the following:

Piskanja Technical Report – Main Report
SRKES7542 Piskanja NI43-101 Technical Report_2013 (2).docx November 2013 Page 10 of 112
Drill 7 holes to validate the pre-1997 exploration (completed by November 2013);
Perform hydrogeological and hydrological researches (on-going);
Mineralogical and petrological studies including SEM-EDS and XRD(completed by
November 2013);
Geotechnical study of the core (completed by November 2013);
Preliminary metallurgical testing using SGS and SCL laboratories (2 x25 kg)
(completed by November 2013);
Analytical tests (ICP, titration and XRF) on all new core samples (completed on all
holes drilled in 2011/2012);
Maintenance of GIS model and data base (on-going);
Preparation of mineral resource/ore reserve estimate report (Serbian report
completed), and;
Drill 14 holes using a 50m x 50m grid of drill collars (planned for 2014/2015);
Topographic survey at 1:1000 scale over the exploitation area (150-200 ha) (planned
for 2014/2015);
Preparation of annual reports and a final report on geological exploration for the
validity of the licence period (on-going).
Any changes in the Exploration Programme should be discussed with the Ministry before their
fulfilment.
SRK understand that it is required by Serbian Law on Mining and Geological Researches that
exploration activities and annual reports submitted to the Ministry must be monitored by a
third party company. The following organisations have been responsible for such monitoring
of Erin’s Exploration Programme, although it should be noted that SRK has not verified the
listed reports or third party companies involved:
Monitoring of the technical programme in 2010 was conducted by Geoprofesional Ltd,
based in Belgrade;
Technical monitoring of the programme and the annual report in 2011 were
completed and submitted by Silur doo, based in Kraljevo, and;
Technical monitoring of the programme and the annual report in 2012 were
completed and submitted by South Danube Metals (a wholly-owned subsidiary of
Euromax Resources Ltd), based in Belgrade.
Mining Rights in Serbia 4.2The Mining Rights in Serbia are described in the document titled “Law on Mining and
Geological Researches” which is published in “Official Gazette of RS” #88/2011. This
document states that an Exploration Licence may be granted for an initial period of three
years, and then be extended twice more for a further two years on each renewal. Each
extension should be accompanied by a 25% size reduction of the previously granted licence
area. Therefore, by the end of the seventh year of ownership, the licence area would cover no
more than 56.25% of the originally licenced area. Under Serbian Law, the Exploration
Company must submit annual reports of the work completed which evidence that not less
than 75% of the planned work has been completed.

Piskanja Technical Report – Main Report
SRKES7542 Piskanja NI43-101 Technical Report_2013 (2).docx November 2013 Page 11 of 112
In accordance with agreed exploration programme for the Piskanja Project Erin completed a
mineral resource estimate using the guidelines as stated by the Serbian Mining Law in July
2013. This mineral resource estimate is currently (at the time of writing) in the process of
being verified by the Ministry and a certificate from the Commission for Investigation and
Verification of Mineral Resources is expected in December 2013. This mineral resource
estimate has not been verified by SRK and although it is compliant with Serbian resource and
reserve classifications, SRK do not consider that it is compliant with the CIM code. According
to Serbian Law, it is necessary to undertake a feasibility study prior to applying for a Mining
Licence. Erin plan to complete all necessary steps in order to apply for a Mining Licence as
soon as possible following approval by the Ministry of the Serbian mineral resource estimate.
Article 57 of the Serbian Law on Mining and Geological Researches defines the items that
must be addressed and attached to a Mining Licence application as:
1. Proof of paid administrative fee;
2. Situational map in the scale of 1:25,000 or in the appropriate scale with marked
borders of the exploitation field, public roads and other facilities located in that area
and marked cadastral parcels in the written and/or digital form;
3. Certificate on resources and reserves of mineral raw materials or on geothermal
resources, issued based on the performed researches in accordance with the existing
regulations on classification of resources and reserves;
4. Feasibility study of exploitation of deposits of mineral raw materials or geothermal
resources;
5. Act of the municipal authority in charge of urbanism with regard to harmonization of
exploitation with appropriate spatial, i.e. urban plans;
6. Act of the Ministry in charge of environmental protection and the act of the institution
in charge of cultural heritage protection;
7. Act of the Ministry in charge of water management, in the event exploitation has
effects on the water regime, and;
8. Proof of the ownership or user right, i.e. easement for the terrains designated for
surface exploitation of reserves of mineral raw materials. In the event of underground
exploitation of reserves of mineral raw materials, when the proof of the ownership or
use right, or easement shall be submitted only for the land designated for construction
of mining facilities, plants and equipment, and in case of exploitation of resources of
mineral raw materials and geothermal resources of importance for the Republic of
Serbia, a specific Government act on the establishment of public interest for five-year
exploitation period shall be submitted”
Surface Rights 4.3The Surface Rights over the Piskanja mineral deposit are held by private individuals and by
local/state governments. Land access has to therefore be negotiated with the individual
landowners, for which they are reimbursed according to a payment scheme approved by the
State.
At the effective date of this report, Erin does not hold any surface rights in the Project area.
Erin staff have informed SRK ES that some drill hole collar locations have had to be moved

Piskanja Technical Report – Main Report
SRKES7542 Piskanja NI43-101 Technical Report_2013 (2).docx November 2013 Page 12 of 112
due to private land owners refusing access. Although this has not affected the exploration
programme to date, the progression to a tighter 50 m drill spacing will likely result in further
issues with landowners.
It is understood by SRK that many local residents are uneducated about the type of minerals
being explored for and have concerns regarding the pollution of water supplies.
SRK understand that Erin, intend to acquire the surface rights for a piece of industrial land
currently owned by the State-owned Ibarski Rudnici Coal Company. Erin, intend to use this
ground for mining operations and construction.
Permits and Authorisation 4.4Under the Serbian Law, a permit must be obtained from the relevant government department
to ensure that known heritage sites are not impacted upon by exploration or mining activities.
To satisfy this regulation an assessment was made by the Institute for Cultural Monument
Protection, Kraljevo on 04 June 2010 and a permit subsequently granted. The permit is valid
until 05 November 2015.
Further permits may be required as the project develops and prior to commencing any mining
operations.
Environmental Considerations 4.5Prior to Erin commencing exploration, site conditions were assessed by the Institute for
Environmental Protection of Serbia on 08 June 2010 and an Environmental Permit granted as
a result. The current Exploration Programme approved by the Ministry on 05 November 2012
was also approved by the Institute for Nature Conservation of Serbia and the Institute for
Cultural Heritage and Preservation, Kraljevo. No site inspection was required by either
institution to approve the Exploration Programme as the licence area had not been altered. A
renewal of approval is required each year by the Institute for Nature Conservation of Serbia
and will therefore be required in late 2013. A renewal of approval is required every two years
by the Institute for Cultural Heritage and Preservation, Kraljevo and is therefore not needed
until 2014.
Agreements and Royalties 4.6Article 136 of the Law on Mining and Geological Researches states that entities undertaking
mining activities shall pay a fee for the use of the mineral deposit. The Law states that “this
revenue shall be the amount gained by the exploiting entity from used or natural mineral raw
materials, determined on the basis of income gained from sale of non-refined mineral raw
material, or income gained from the sale of technologically refined mineral raw material”. The
fee will be split between the Republic of Serbia, the local government and the Ministry of
Natural Resources, Mining and Spatial Planning
As the law does not stipulate the commodities classified under metallic and non-metallic
minerals, it is not known whether the Ministry will impose a royalty on borates similar to that of
other evaporite minerals such as gypsum (salt), or select to impose a levy specific to borates.
Erin expects confirmation of the royalty status of borates towards the end of 2013. Table 4.3
shows some of the Royalties due on certain commodities under Serbian Law.

Piskanja Technical Report – Main Report
SRKES7542 Piskanja NI43-101 Technical Report_2013 (2).docx November 2013 Page 13 of 112
Table 4.3 Royalties due on various extracted minerals (from Law on Mining and Geological Researches, 2012)
Commodity Fee/Royalty
All types of coal and oil shale 3% of income
All metallic raw materials 5% of smelting plant net income
Technogenic raw materials resulting from
exploitation and refining of mineral raw
materials
1% of income
Non-metallic raw materials 5% of income
All types of salts and salty solutions 1% of income

Piskanja Technical Report – Main Report
SRKES7542 Piskanja NI43-101 Technical Report_2013 (2).docx November 2013 Page 14 of 112
5 ACCESSIBILITY, CLIMATE, LOCAL RESOURCES, INFRASTRUCTURE AND PHYSIOGRAPHY This section (Section 5) of the report has largely been taken from the previous SRK technical
report on the Piskanja Project, (Technical Report, 2012).
Accessibility 5.1The Piskanja Project is located in Jarandol Basin in the Raška region of south central Serbia
approximately 160 km south of the Serbian capital Belgrade, and approximately 17 km north
of the Kosovo border. The nearest settlement is the town of Baljevac na Ibru (literally
“Baljevac on the Ibar River”) which is some1.7 km northwest from the centre of the
Exploration Licence #1934. Baljevac na Ibru (Baljevac) has a population of 1482 (2011
census), (refer back to Figure 4-2 for location). The regional capital, Raška, lies 10 km to the
south of the Project area and has a population of 6500 (2011 census).
Access to the Piskanja Project is by paved road from Belgrade, a journey that takes
approximately 4 hours and passes through the towns of Kragujevac and Kraljevo. Access
around site is by vehicle/foot as the terrain is not steep and the land cleared for agriculture.
A standard gauge railway accommodating passenger and freight rolling stock passes through
the western part of the licence area and runs from Belgrade, through the towns of Kraljevo
and Raška to Poije in Kosovo.
Local Resources and Infrastructure 5.2Erin has an office in the town of Baljevac, located at the Ibarski Rudnici coal mine, a small-
scale operation exploited only for local coal supply. Facilities here also include core logging
and sampling areas, and core and sample storage.
Water for exploration needs is sourced from streams that flow into the Ibar River and the
water table is encountered in drillholes at shallow depths, for example at 23m below suface in
hole EVP2012-100. It is reported that the stream water is used by the local people for drinking
water. A 35 kV electricity lines run across the licence and supply power to Baljevac.
There is good mobile phone reception throughout the Jarandol Basin and the Piskanja Project
area.
Climate 5.3The climate in the Project area is typical of Eastern Europe with four seasons of
approximately equal length; spring, summer, autumn and winter. According to Foreca (an
international company providing digital weather forecast data), the temperatures range from
between 11 ºC and 28 ºC during the summer months of June to September, to between -3 ºC
and 5 ºC during the middle winter months, December and January. Rainfall is highest in the
months of May to September with the monthly average around 49-62 mm. The months of
January and February have the minimum amount of precipitation (about 30 mm), falling
mostly as snow. Exploration activities can continue throughout the year with minimal
inconvenience during the winter months.

Piskanja Technical Report – Main Report
SRKES7542 Piskanja NI43-101 Technical Report_2013 (2).docx November 2013 Page 15 of 112
Physiography 5.4The Jarandol Basin lies at an elevation of approximately 375-400 m above mean sea level
(amsl), is elongated in an east-northeast - west-southwest direction and drains towards the
north via the Ibar River which lies just outside the western boundary of the licence area.
Mountains rise to approximately 750 m amsl to the west of the valley, outside of the
Exploration Licence area, and to over 1200 m immediately east of the Project area.
The flood plains in the central part of the basin and the low angled valley sides are cultivated
for crops and fruit, with the steeper terrain above 500 m amsl generally covered by sparse
deciduous woodland, (Figure 5-1).
Access to the Project through Surface Rights is covered in Section 4.3. The Surface Rights
over the Piskanja mineral deposit are held by private individuals and or local/state
governments. Land access is has to therefore be negotiated with the individual landowners,
for which they are reimbursed according to a payment scheme approved by the State. As
stated in Section 4.3, Erin does not currently have any Surface Rights in the Project area and
some private land owners have refused Erin access for drilling. This has not affected the
exploration programme to date although further infill drilling programmes will require access to
land where the owners have previously refused Erin access. SRK understand that Erin intend
to acquire the surface rights for a piece of industrial land currently owned by the State-owned
Ibarski Rudnici Coal Company. Erin, intend to use this ground for mining operations and
construction in the future.
Figure 5-1 Examples of the terrain and agricultural land use typical of the licence area. Top - Before drilling hole EVP2011-103 (left) and after drilling and remediation (right). Bottom - before drilling hole EVP2011-105 (left) and after drilling and remediation. All photos are taken facing approximately north.

Piskanja Technical Report – Main Report
SRKES7542 Piskanja NI43-101 Technical Report_2013 (2).docx November 2013 Page 16 of 112
6 HISTORY This section (Section 6) of the report has largely been taken from the previous SRK technical
report on the Piskanja Project, (Technical Report, 2012).
Serbia’s mining history dates back to the Middle Ages with the extraction of gold, silver and
lead. The mining industry in Serbia represents the country’s industrial base as well as the
foundation for its entire economy. At present there are many mineral deposits and major
occurrences distributed throughout the country, with copper, lead, zinc and bauxite
contributing to the majority of metallic minerals currently being mined. Serbia also has a rich
history of coal mining, with lignite coal fed power stations currently providing 62% of the
country’s electrical requirements.
The first record of boron mineralisation in the Jarandol Basin is from a hand-sized sample
containing howlite found in a tributary of the Ibar river in 1967 during State-organised
geological prospecting, (Stojanovich, 1967). Following this, geological mapping at a scale of
1:10,000 was performed and the Pobrdje occurrence was identified some 2.6 km northwest of
the present Erin licence.
The geochemical investigation of boron in the Jarandol Basin began in 1979 with the first
identification of colemanite in a structural borehole (no. 127) occurring later in 1987. Between
1987 and 1992, the Yugoslavian state-owned company Ibar Mines completed a number of
soil and stream sediment sampling programmes, followed by 21 diamond core holes totalling
6508 m of drilling to an average hole depth of 300 m. Total core recovery was reportedly very
good (90-100%) in shale, marl, sandstone and tuff horizons, but less so (60-75%) in volcanic
breccia, breccia-conglomerate, conglomerate and borate mineralisation. A total of 89 core
samples averaging 1 m in length were collected from 11 boreholes which intersected
mineralisation and were analysed for boron. The core is not available to date, however pulp
rejects, assay results and some lithological columns are available (Ilic and Eric, 2009,
Podunavac and Vukicevic, 2011). Mineralisation was identified in two horizons with an
average thickness of 4.5 m for the upper bed and 3.5 m for the lower bed, lying between 50 m
and 260 m depth.
Erin Ventures first obtained the Piskanja Project in 1997 as part of a 50% Joint venture with
Elektroprevreda doo (Serbia). The JV company, known as Ras Borati doo, completed 10
reverse circulation (RC) holes, totalling 2304 m. These holes were drilled by subcontractor
Midnight Sun Drilling Co. Ltd, Canada, using a T685H Schramm drilling rig. A total of 206 chip
samples were collected from 8 RC holes. The samples were prepared and analysed at the
Geozavod-Nemetali laboratory in Belgrade using wet chemistry analysis.
Following the resolution of international conflicts and a change of the governing party in 2006,
Rio Tinto acquired the Piskanja Project as part of their regional investigation of borate
potential in Tertiary basins across the Balkan region. An initial phase of diamond core drilling
in 2006 to twin existing holes was followed by the completion of further diamond holes on a
wide spacing aimed at targeting a mineralised body of world-class size. A total of 6074 m of
drilling were completed by Rio Tinto and 817 samples prepared at the ITMNS laboratory in
Belgrade and assayed by SGS in Lakefield, Canada using potassium fusion ICP-AES as the
primary method for determination of boron content.

Piskanja Technical Report – Main Report
SRKES7542 Piskanja NI43-101 Technical Report_2013 (2).docx November 2013 Page 17 of 112
Mineralogical investigations included 69 X-ray Diffraction (XRD) tests, petrographic
determinations and a number of Scanning Electron Microprobe (SEM) analyses were
conducted by SGS, the Department of Mineralogy and Petrology, University of Belgrade
(Serbia) and Spectrum Petrographics Inc of Vancouver, Canada. The main boron-bearing
minerals in the Piskanja Project were identified as colemanite (CaB3O4(OH)3•(H2O)) and
howlite (Ca2B5SiO9(OH)5) with minor ulexite (NaCaB5O6(OH)6•5(H2O)) and probertite
(NaCaB5O9.5H2O).
Rio Tinto also completed a magnetotelluric (MT) survey to assess the conductivity variation
within the Jarandol Basin and to map the extent and thickness of the fine-grained sedimentary
sequence. A low resistivity zone representing hydrous mineralisation was expected to be
encountered. The results of this survey, completed by Geosystem srl in 2006, however were
inconclusive with respect to identifying conductivity variation in the shallow (<500m) below
surface that might be related to borate mineralisation within the Jarandol Basin sediments. No
known historical resource estimates were completed by Rio Tinto before the licence was
returned to the Serbian Ministry of Mining and Energy in 2009.
Erin reacquired the exploration licence for the Piskanja Project in August 2010 through its
wholly owned subsidiary company, Balkan Gold d.o.o. This new licence covered an area of
historic exploration southeast of Baljevac where historic drilling had identified borate
mineralisation. This licence has been renewed and extended twice, as detailed in Section 4.1.
All exploration activities undertaken by Erin since 2010 are detailed in Section 9 onwards.
Historical Mineral Resource 6.1According to information in a report by Podunavac and Vukicevic (2011) the Mining Institute of
Belgrade prepared a mineral resource estimation report for the Piskanja Project in 1992. This
appears to have been an unofficial resource estimate as defined by Serbian law, created
using interpolation of cross sections between 200x300 m spaced and 100x100 m spaced drill
holes. It does not appear to have been included in the State mineral balance. The mineral
resource was said to be approximately 6.5 Mt of boric oxide (B2O3) in the C1+C2 categories as
defined by Serbian mining regulations, though no grades have been located. SRK has not
verified these numbers and does not know what data have been used to arrive at this
estimate.
In the technical documentation related to the Public Tender of the Piskanja Project (Public
Tender, 2005) the Ministry of Mining and Energy of the Government of the Republic of Serbia
stated that “potential reserves of boron ore in Piskanja deposit are estimated to be 7,500,000
tons with an average grade of 36.39% B2O3".
Although this figure may be compliant with Serbian resource and reserve classifications, it
bears no relation to the Canadian Institute of Mining (CIM) code and has been calculated
using basic cross sectional triangulation methods. No economic parameters were used in this
calculation. The author does not consider this estimate as compliant with the CIM code and is
of the opinion that insufficient data is available to classify this historical estimate as a current
mineral resource or mineral reserve.
SRK understand that there has been no production of borates from the property in the past.

Piskanja Technical Report – Main Report
SRKES7542 Piskanja NI43-101 Technical Report_2013 (2).docx November 2013 Page 18 of 112
7 GEOLOGICAL SETTING AND MINERALISATION Parts of this section (Section 7) of the report have largely been taken from the previous SRK
technical report on the Piskanja Project, (Technical Report, 2012).
Regional Geology 7.1The geology of Serbia is controlled by a complex tectonic history represented principally in the
South Eastern European and Alpine Orogenic Belts that can be divided into five geotectonic
units as seen in Figure 7-1 and summarised below;.
1. The Pannonian Basin – this basin occupies the northern portion of Serbia and
extends across much of Central Europe. It is understood to be the largest extensional
basin in the Central Alps that formed in a back arc setting during the Cenozoic era (66
Ma-present). The typical sedimentary succession of the southern Pannonian Basin
consists of continental, alluvial and laustrine sediments which unconformably overlie a
strongly tectonised basement.
During the Neogene period (23 Ma to 2.5 Ma) of the Cenozoic era, numerous intra-
mountain basins developed within the Balkan peninsular. As a result northeast to east
striking grabens formed from back arc extension of the European plate creating the
Pannonian Basin (Tolijic et al., 2012, and Marović et al., 2002). It was in this later
tectonic extensional period that the Jarandol Basin which hosts Erin’s Piskanja
Project was formed.
2. The Dinaric Alps – the Dinaric Alps occupy the western part of Central Serbia,
trending almost northwest-southeast. They are composed of Mesozoic (some 230 Ma
to 66 Ma) sediments, the most significant of which are thick deposits of karstic
Triassic (about 250 Ma to 200 Ma) limestones and dolomites together with Jurassic
(approximately 200 Ma to 145 Ma) ophiolitic melange and Cretaceous (some 145 Ma
to 66 Ma) flysch deposits (sequences of shales rhythmically interbedded with fine
sandstones deposited in deep marine environments).
3. The Vardar Zone - this zone lies east of the Dinaric Alps, continuing into central
Macedonia. It consists of three ultrabasic blocks separated by fractured ophiolites that
characterise Early Mesozoic (Triassic-Jurassic) ophiolitic paleo-rifts. The Western
Vardar ophiolitic unit represents a suture zone between the continental Adriatic plate
(Dinarides of the Western Serbia) and the European plate (Carpatho-Balkanides and
Macedonian Massif of Eastern Serbia).
The Jarandol Basin (Piskanja Project) is found within an Upper Jurassic ophiolite
formation in the Vardar Zone. The ophiolite formation is composed of ultra-mafic
rocks which include serpentinites, serpentinised dunites, harzburgites and Iherzoilite
as well as minor fragments of layered gabbro-peridotite complexes. Also included in
the assemblage is a mélange formation composed of an upper ophiolite unit with
some sedimentary chert, carbonate and sandstone units.
4. The Serbo-Macedonian Massif – this massif trends north-south and generally
comprises Tertiary (approximately 66 Ma to 2.5 Ma) volcano-plutonic complexes.

Piskanja Technical Report – Main Report
SRKES7542 Piskanja NI43-101 Technical Report_2013 (2).docx November 2013 Page 19 of 112
5. The Carpatho-Balkan Arc - covering Eastern Serbia is an extension of the Carpathian
Range that joins the western parts of the Balkan Mountains. The Carpatho-
Balkanides were formed in the Mesozoic as a carbonate platform and separated from
the Dinaric Alps by the Serbo-Macedonian Massif.
Figure 7-1 Simplified geological map of Serbia (Republic of Serbia, Ministry of Mining and Energy) Location of Piskanja Project in red

Piskanja Technical Report – Main Report
SRKES7542 Piskanja NI43-101 Technical Report_2013 (2).docx November 2013 Page 20 of 112
Local Geology 7.2The Piskanja Project is situated within the Vardar Zone and is associated with the Miocene
(23Ma to 5 Ma) Jarandol Basin which formed the eastern part of the larger Gradac-Baljevac
graben, (G-B basin). The G-B basin was formed during rifting in the Miocene of the Upper
Jurassic aged ophiolite basement (Figure 7-2). Prior to the formation of the Jarandol Basin
intense magmatism in the Oligocene (between 34 Ma and 23 Ma) affected the area and
included andesitic, dacitic volcanic and pyroclastic flows whichextended over the Ibar and
Raška River valleys for some 40 km. A number of granite stocks were also intruded some 5-
10 km west of the licence area during this period.
Following the development, ofthe Miocene basins in the Vardar Zone were filled by sediments
associated with various facies typical of continental basins including alluvial, lacustrine and
swamp settings and the transitional environments associated with them. Fluctuations in water
level and sediment input gave rise to alternating units of mudstone, shale, sandstone and
lignite seams, tuffaceous material was also deposited related to on-going volcanism related to
extension. This rift-related volcanism was accompanied by hydrothermal activity beneath the
basins, circulating fluids through the basement and sediments. It was this high thermal and
tectonic activity that led to borate mobilisation and deposition within the Jarandol Basin
sediments. The age of sediments within the Jarandol Basin has been determined based on
sparse fossils as Lower and Middle Miocene, however Upper Miocene sedimentation is also
possible (Urošević et al., 1970).
The Jarandol Basin extends for some 25 km in an east-west direction with a width of up to
12.5 km, covering an area more than 200 km2. Its size was originally much larger, but has
since been reduced due to uplift and erosion of sediments shortly after deposition in the
northern and southern parts of the basin.

Piskanja Technical Report – Main Report
SRKES7542 Piskanja NI43-101 Technical Report_2013 (2).docx November 2013 Page 21 of 112
Figure 7-2 Geological map of the Jarandol Basin and location of the Erin exploration licence (blue square). Black line indicates location of cross section in Figure 7-3 (Edited from the Federal Geological Institute, Belgrade, 1970)
B
A
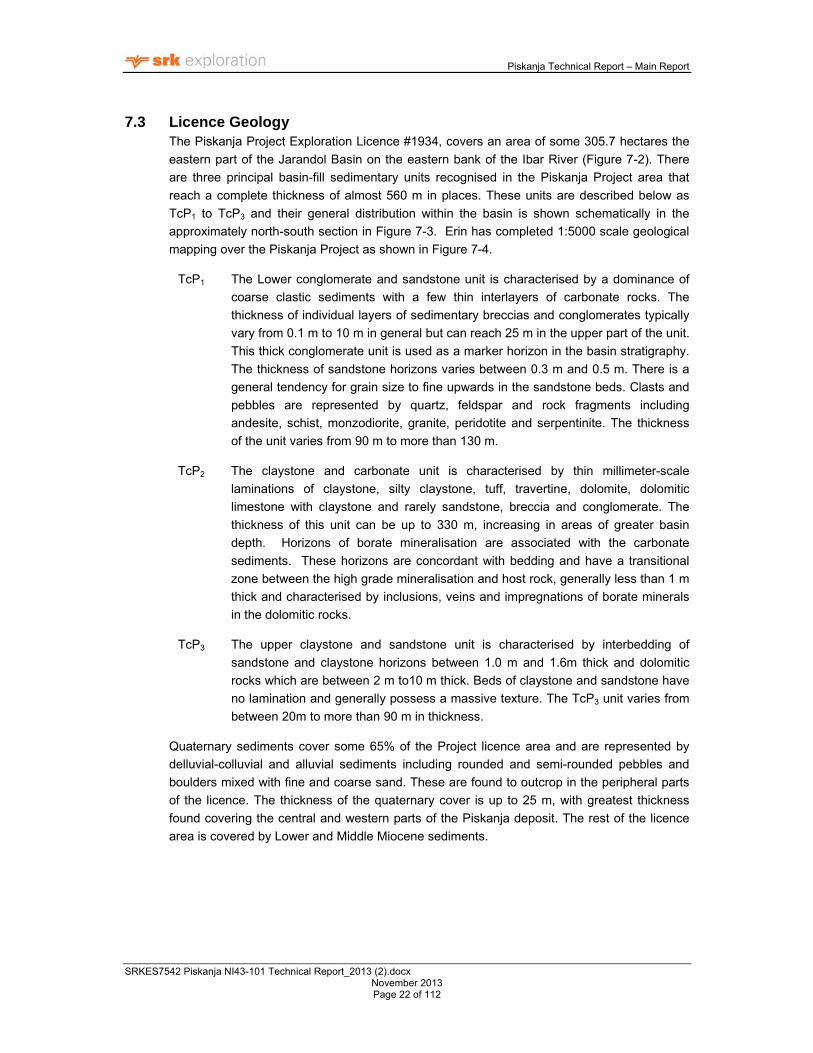
Piskanja Technical Report – Main Report
SRKES7542 Piskanja NI43-101 Technical Report_2013 (2).docx November 2013 Page 22 of 112
Licence Geology 7.3The Piskanja Project Exploration Licence #1934, covers an area of some 305.7 hectares the
eastern part of the Jarandol Basin on the eastern bank of the Ibar River (Figure 7-2). There
are three principal basin-fill sedimentary units recognised in the Piskanja Project area that
reach a complete thickness of almost 560 m in places. These units are described below as
TcP1 to TcP3 and their general distribution within the basin is shown schematically in the
approximately north-south section in Figure 7-3. Erin has completed 1:5000 scale geological
mapping over the Piskanja Project as shown in Figure 7-4.
TcP1 The Lower conglomerate and sandstone unit is characterised by a dominance of
coarse clastic sediments with a few thin interlayers of carbonate rocks. The
thickness of individual layers of sedimentary breccias and conglomerates typically
vary from 0.1 m to 10 m in general but can reach 25 m in the upper part of the unit.
This thick conglomerate unit is used as a marker horizon in the basin stratigraphy.
The thickness of sandstone horizons varies between 0.3 m and 0.5 m. There is a
general tendency for grain size to fine upwards in the sandstone beds. Clasts and
pebbles are represented by quartz, feldspar and rock fragments including
andesite, schist, monzodiorite, granite, peridotite and serpentinite. The thickness
of the unit varies from 90 m to more than 130 m.
TcP2 The claystone and carbonate unit is characterised by thin millimeter-scale
laminations of claystone, silty claystone, tuff, travertine, dolomite, dolomitic
limestone with claystone and rarely sandstone, breccia and conglomerate. The
thickness of this unit can be up to 330 m, increasing in areas of greater basin
depth. Horizons of borate mineralisation are associated with the carbonate
sediments. These horizons are concordant with bedding and have a transitional
zone between the high grade mineralisation and host rock, generally less than 1 m
thick and characterised by inclusions, veins and impregnations of borate minerals
in the dolomitic rocks.
TcP3 The upper claystone and sandstone unit is characterised by interbedding of
sandstone and claystone horizons between 1.0 m and 1.6m thick and dolomitic
rocks which are between 2 m to10 m thick. Beds of claystone and sandstone have
no lamination and generally possess a massive texture. The TcP3 unit varies from
between 20m to more than 90 m in thickness.
Quaternary sediments cover some 65% of the Project licence area and are represented by
delluvial-colluvial and alluvial sediments including rounded and semi-rounded pebbles and
boulders mixed with fine and coarse sand. These are found to outcrop in the peripheral parts
of the licence. The thickness of the quaternary cover is up to 25 m, with greatest thickness
found covering the central and western parts of the Piskanja deposit. The rest of the licence
area is covered by Lower and Middle Miocene sediments.
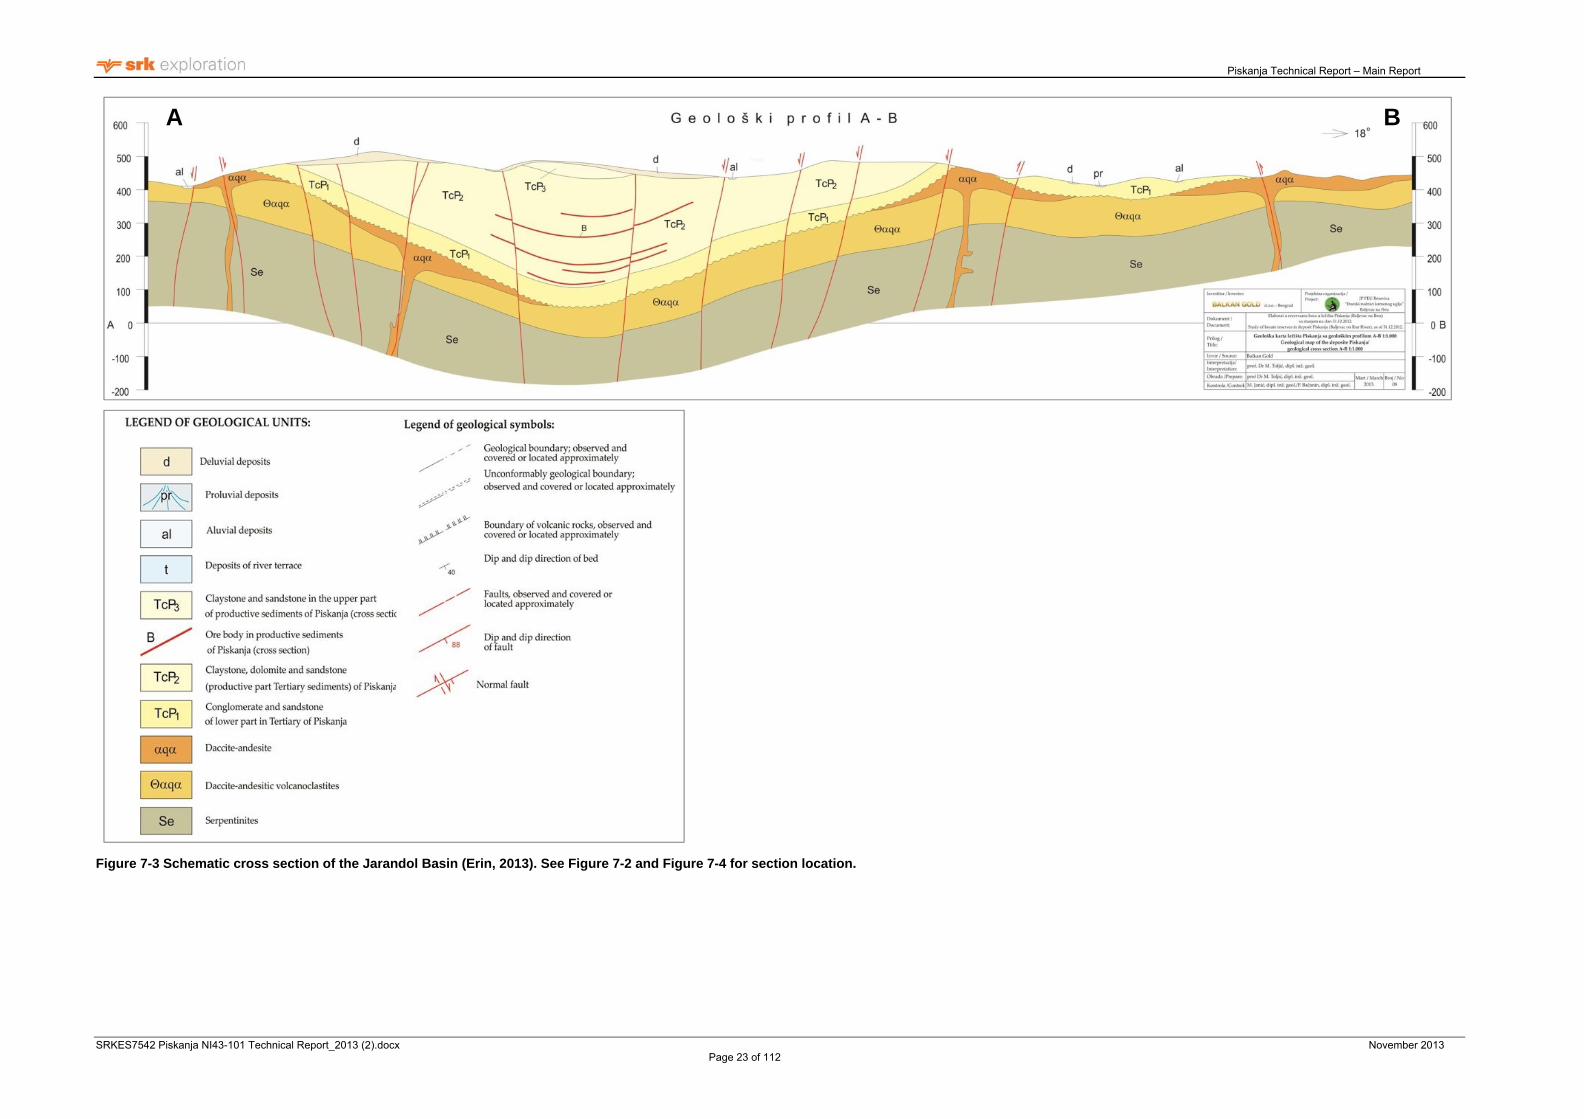
Piskanja Technical Report – Main Report
SRKES7542 Piskanja NI43-101 Technical Report_2013 (2).docx November 2013 Page 23 of 112
Figure 7-3 Schematic cross section of the Jarandol Basin (Erin, 2013). See Figure 7-2 and Figure 7-4 for section location.
A B

Piskanja Technical Report – Main Report
SRKES7542 Piskanja NI43-101 Technical Report_2013 (2).docx November 2013 Page 24 of 112
Figure 7-4 1:5000 Geological Map of the Piskanja Project, (Erin Ventures 2013)

Piskanja Technical Report – Main Report
SRKES7542 Piskanja NI43-101 Technical Report_2013 (2).docx November 2013 Page 25 of 112
7.3.1 Structure A series of northwest-southeast and north-south striking local and regional faults as well as
intrabasinal syndepositional microfaults are clearly visible in outcrops on the slopes of the Ibar
valley and in drill core (Figure 7-5 and Figure 7-6). The faults are accompanied by breccia and
clay shear zones, steep to vertical bedding of the host sediments, microfolds and slumping.
Numerous hand-scale local tectonic structures including; convolute bedding (slumping),
broken layers, clastic dykes, higher content of coarse sediments above the syndepositional
faults, tiny veins of re-deposited borate mineralisation are seen in the core resulting from
syndepositional tectonics (Figure 7-7) due to stress or extension conditions and solution
metamorphism.
Erin’s structural analysis of the core and field observations demonstrate that a number of
regional and local-scale faults which cross the basin have been interpreted by their geologists
to have only a limited amplitude of vertical movement. Variation between levels of
mineralisation between the holes may be explained mainly by synclinal folding and a
southward dip of the beds in the basin. Photos in Figure 7-5 demostrate faults which are
traced along the basin by drilling and are clearly visible in andesite outcrops due to intense
shearing and clay alteration.
Figure 7-5 Hydrothermally altered Oligocene andesite of the Piskanja basin. Clay alteration is developed along the fault zones, road #22 north (left) and south (right) of the village of Baljevac. (photos provided by Erin).

Piskanja Technical Report – Main Report
SRKES7542 Piskanja NI43-101 Technical Report_2013 (2).docx November 2013 Page 26 of 112
Figure 7-6 Steep angled laminations related to slumping in boreholes EVP-2011-109 and EVP-2011-110
Mineralisation 7.4There are over 100 different known borate minerals that contain a borate anion group. Many
of these minerals are salts that are highly soluble and found in evaporite contexts. Borate
minerals are quantified by their content of boron trioxide (B2O3), which is the most common
oxide of boron. Borate deposits are often quantified by the percentage B2O3 within
mineralised horizons.
There are a variety of minerals which are found in borate deposits, although grade is always
quoted as a percentage of B2O3, (Table 7.1). According to mineralogical studies conducted by
Erin the boron bearing minerals found at Piskanja include major colemanite and howlite with
minor ulexite, hydroboracite, probertite, pandermite, nobleite, meyerhofferite, inyoite,
studenicite, rashite, jarandolite and tincalconite. Most minerals are considered as syn-
sedimentary primary minerals. It is thought that howlite, a boron-silicate may occur as
primary and diagenetic mineralisation and hydroboracite is considered to be derived by
diagenesis.
Figure 7-7 Example of syndepositional extension and stress in sandstone and mudstone within core from the Piskanja Project

Piskanja Technical Report – Main Report
SRKES7542 Piskanja NI43-101 Technical Report_2013 (2).docx November 2013 Page 27 of 112
Table 7.1 Composition of the main borate minerals found at Piskanja in order of decreasing abundance, (www.webmineral.com and www.mindat.org)
Mineral Formula B2O3 content, % Density, g/cm3
Colemanite Ca2B6O11·5H2O 50.8 2.42
Ulexite NaCaB5O9·8H2O 43.0 1.95
Hydroboracite CaMgB6O11·11H2O 52.5 2.00
Probertite NaCaB5O9·5H2O 49.6 2.14
Jarandolite CaB3O4(OH)3 55.6 2.54
Studenitsite NaCa2[B9O14(OH)4]·2H2O. 59.3 2.31
Howlite Ca4Si2B10O23·5H2O 44.5 2.58
Veatchite Sr2B11O16(OH)5·H2O 58.6 2.62
Based on correlation of lithology between boreholes, at least ten levels of continuous borate
mineralisation are recognised to date, including three major horizons (Zones 1-3) and seven
minor horizons (Zones 4-10). The mineralised bodies are continuous stratiform and semi-
parallel layers of irregular shape which are slightly folded and dip at approximately 18° to the
southwest. The lateral extent of the mineralised bodies varies from approximately 50 m x 360
m (Zone 9) to 415m x 950m (Zone 2), with longest dimensions orientated approximately
north-south. Variations of the thickness of averaged grades of B2O3 are presented in Table
7-2.
The depth of mineralisation at Piskanja varies significantly depending on the stratigraphic
position of the mineralised horizon and location within the basin. The shallowest
mineralisation was intersected in the northeast part of the basin, whereas the deepest
horizons are intersected in the southwest part of the basin. Zone 1 mineralisation, for
example, varies in depth from 234 m to 447 m over a lateral distance of some 880m moving
from northeast to southwest.
Table 7-2 Thickness and weighted average intercept B2O3 grades of the mineralised bodies found within the Piskanja deposit, as defined in the drilling database (from top to bottom).
ZONE Thickness, m Grade B2O3, %
Min Max Average Min Max Average
1 0.5 9.3 4.8 15 50.2 32.9
2 1 15.0 3.4 2.8 55.1 31.4
3 0.4 22.3 5.1 0.8 48.1 32.4
4 0.5 15.1 4.3 31 50.4 38.5
5 0.3 1.8 1.0 6.4 41.5 28.3
6 0.4 15.6 2.5 5.7 45.1 16.1
7 1.1 8.7 3.7 7.3 28.8 18.6
8 0.6 2.3 1.6 9.8 32.1 18.4
9 0.6 2.7 1.6 17.7 53.1 32
10 0.5 3.0 1.6 10.7 23.9 16.4
TOTAL 0.3 22.3 2.9 0.8 55.1 30.4 *- Including up to 1.5m thick intercalations of less mineralised rocks

Piskanja Technical Report – Main Report
SRKES7542 Piskanja NI43-101 Technical Report_2013 (2).docx November 2013 Page 28 of 112
The borate mineralisation forms clearly visible white-cream colour horizons which contrast the
hangingwall and footwall laminated claystone and carbonate lithologies of formation TcP2.
Moving away from the mineralised borate horizons, the amount of dolomitic rock usually
decreases and claystone increases. The following succession is common to the drill core
seen at Piskanja whereby following a seam of borate mineralisation, dolomitic rock, dolomite
with thin intercollations of claystone, claystone with thin dolomite laminas and finally claystone
are observed. Contacts between the borate mineralisation and claystone are rarely observed.
Carbonate rocks below and above the borate seams may also contain thin impregnation,
lenses, spherical nodules or aggregates of borate mineralisation which don’t have economic
importance (usually <1% B2O3 over 1 m interval).
Borate mineralisation in the central part of the deposit is seen to be massive and homogenous
with gradually increasing numbers of intercalations and interlayers of claystone and dolomitic
rocks towards the periphery of the mineralised area. Figure 7-8 and Figure 7-9 show
examples of the types of mineralisation found in the Piskanja mineral deposit.
The presence of laminated dolomitic rocks and claystone in association with borate
mineralisation indicates its formation in the deeper part of a lacustrine environment. The main
borate horizons and surrounding sediments contain digenetic howlite and hydroboracite,
cavities and veins of borate mineralisation indicating solution metamorphism, however is it
considered that dissolution or digenetic re-distribution of mineralisation did not play significant
role.
According to multielement geochemical assay results from the Erin exploration programme,
borate mineralisation contains elevated strontium (up to 1.0% Sr), which may be due to the
presence of veatchite or celestine, or incorporation of Sr into other borate minerals such as
colemanite, which can contain 0.36-1.51% Sr (Garrett, 1998).

Piskanja Technical Report – Main Report
SRKES7542 Piskanja NI43-101 Technical Report_2013 (2).docx November 2013 Page 29 of 112
Figure 7-8 Massive borate mineralisation in hole EVP2012-111 from 310.30 m to 313.20 m. Mineralisation comprises colemanite and ulexite (grey) and howlite (white) at the contact between shale and dolomite units, (Technical Report, 2012)
Figure 7-9 Interbedding of borate mineralisation (grey and white) with laminated dolomitic and shale lithologies. Hole EVP2012-106 from 291.90 m to 294.90 m depth, (Technical Report, 2012)

Piskanja Technical Report – Main Report
SRKES7542 Piskanja NI43-101 Technical Report_2013 (2).docx November 2013 Page 30 of 112
8 DEPOSIT TYPES Most of this section (Section 8) of the report has been taken from the previous SRK technical
report on the Piskanja Project, (Technical Report, 2012).
The borate deposit at the Piskanja Project is of continental lacustrine type, typical of many
global boron deposits, formed within a closed basin with abnormally high salinity. The boron
mineralisation is most likely to have been sourced from local volcanic rocks, from which it has
been leached by hydrothermal fluids. Boron minerals were deposited in sedimentary
successions in lacustrine conditions through the processes of evaporation and chemical
precipitation. The presence of laminated dolomitic rocks and claystone in association with
borate mineralisation indicates sedimentation in the deeper parts of a lake.
Most borate minerals are highly soluble in water which restricts the areas in which they form,
and more importantly, are preserved. The majority of known global borate deposits have
formed in lacustrine or playa lake environments in closed basins that opened up in active
extensional setting near subductive plate boundaries. Rock types associated with the
deposits generally include calc-alkaline extrusive rocks, tuff, limestone, marl, claystone,
gypsum, continental silts and sands. The source of boron is not always the same, though
may be derived from leached marine sediments, magmatic fluids from subducted crust or
from volcanic material (tuff).
The boron deposits in the USA and Turkey (who together control some 80% of world
production), are associated with continental sediments and show a continuum between
hydrothermal spring, playa lake and lake deposits. Borate minerals precipitate once they
become saturated in the fluids circulating these basins, either through evaporation of the
basinal waters or addition of borate rich fluids from hydrothermal springs and circulating
meteoric waters. Borate mineralisation is dependent on the pH of the fluids in the basin, with
different borate minerals forming at different levels of acidity; for example, borax (sodium
borate) precipitates at a higher pH than ulexite, and in comparison colemanite forms at a
lower pH and in warmer fluids. Due to cycles of basin refill and sediment input, there may be
numerous layers of borate mineralisation interbedded with barren sedimentary horizons.
Borate deposits, due to their process of formation, are generally found as stratiform layers
within basins, typically of Tertiary (Neogene) age and proximal to areas of volcanic activity of
a similar age. Deposits showing these characteristics have already been identified and
exploited in western Turkey at Kirka, Bigadiç and Kestelek among others. The origin of the
borates within these deposits is related to mixing of borate-rich solutions within lacustrine
basins controlled by evaporation (Helvaci and Alonso, 2000).
The Turkish deposits of Kirka, Bigadiç and Kestelek are owned and operated by Eti Maden.
According to Eti Maden’s website, (http://en.etimaden.gov.tr/) the Kirka deposit reportedly
produces some 2.,5 million tons of sodium borate ore each year at a grade of 26% B2O3. The
Bigadiç deposit is reported to produce some 800,000 tons/year of ulexite and colemanite ore
at between 29% and 31% B2O3. The Kestelek deposit produces some 200,000 tons/year of
colemanite ore with a grade of 29% B2O3 from an open pit.
The Rio Tinto owned Jadar project in northwest Serbia is a unique lithium borate deposit at a
prefeasibility stage with an Inferred Mineral Resource of 118Mt containing 1.8% LiO2 and

Piskanja Technical Report – Main Report
SRKES7542 Piskanja NI43-101 Technical Report_2013 (2).docx November 2013 Page 31 of 112
16.2Mt B2O3 in the lower of three mineralised zones, (Rio Tinto 2012 Annual Report). Pan
Global Resources has a number of joint venture properties in central Serbia at an early stage
of exploration which it is are exploring for deposits analogous to the Jadar deposit.).
To assist with further exploration Erin is using the deposit model of syn and post depositional
borate mineralisation in discrete horizons within well stratified lacustrine sediments to
investigate the Piskanja Project, which SRK considers appropriate.

Piskanja Technical Report – Main Report
SRKES7542 Piskanja NI43-101 Technical Report_2013 (2).docx November 2013 Page 32 of 112
9 EXPLORATION Parts of this section (Section 9) of the report has largely been taken from the previous SRK
technical report, on the Piskanja Project, (Technical Report, 2012), with updates from
additional work undertaken by the Client over the past 12 months.
Apart from drilling, exploration undertaken by Erin since 2010 has amounted to the collection
and analysis of all historical data available relating to the Jarandol Basin and its lithologies,
tectonic structures and mineralisation. An assessment of the quality of this data and its
reliability was also completed internally to access the suitability of the data to be used in
further studies and an MRE. This included the review of the results from historical drilling and
geophysical investigations conducted by Rio Tinto and mentioned previously in Section 6.
From this work it was determined that by the geophysical contractor, Geosystem Srl, that the
magnetotelluric geophysical data was not of sufficient detail or resolution at depths of <500m
to provide insight on borate mineralisation or sedimentary sequences..
Publically available documents have also been considered by Erin, including scientific
publications regarding the regional geological setting and evolution of the Miocene Jarandol
Basin and the analysis of aerial photographs.
All available historical drill core has been re-logged by Erin, with particular focus on lithologies
that might be identified as “marker horizons” that could be used to correlate the position of
mineralisation across holes. This included the creation of historical drilling database
containing all available data from multiple historic drilling programmes.
The Piskanja Exploration Licence and surrounding area was geologically mapped at a scale
of 1:5000 by Erin in 2012 (Figure 7-4). This has highlighted a number of identified and
interpreted normal faults which bound the Piskanja deposit and are likely to affect continuity of
mineralisation. Due to the limited outcrop across the licence area, the collection of structural
measurements of fault orientations across the Piskanja deposit has not been possible at this
stage.
Due to the limited outcrop and depth of the deposit no surface (soil or rock chip) sampling,
surface trenching or pitting has been undertaken within the licence by Erin.
Through the Faculty of Mining and Geology at the University of Belgrade, Erin has conducted
mineralogical studies on 47 singular and composite mineralised samples taken from a
selection of their drill core, (December 2012). The length of the tested intervals ranges from
0.45 m to 8.40 m and were selected by visual estimation of samples containing either massive
borate mineralisation or disseminated borate mineralisation in laminated claystone, dolomite
and intercalated calcite. The studies involved petrographic, x-ray diffraction (XRD) and
scanning electron microscope with energy dispersive x-ray spectroscopy (SEM-EDS) analysis
of the main mineral phases and are summarised in the report titled “Testing samples from the
Piskanja borate deposit, Baljevac na Ibru – Drillholes 101,103, 104, 106, 107, 111, 120, 121
and 126”.
SRK have reviewed the report which summarises that boron mineralisation is generally found
within mixture of varying proportions of colemanite, ulexite, probertite howlite, magnesite,
jarandolite, calcite, dolomite and clay with the presence of nobleite, veatchite, hydroboracite,
strontioginorite. The borate minerals are dominated by colemanite, ulexite and less

Piskanja Technical Report – Main Report
SRKES7542 Piskanja NI43-101 Technical Report_2013 (2).docx November 2013 Page 33 of 112
commonly hydroboracite or jarandolite.
In spring 2012 Erin contracted MWH UK LTD, a UK based water management, engineering
and monitoring company, to undertake an ongoing hydrogeological study of the Piskanja
Project. This work has included a review of pre-existing hydrological, meteorological and
hydrogeological studies covering the Jarandol Basin (reported in an MWH Technical Memo
dated June 2012), hydrogeological mapping, an initial survey of domestic wells and water
supply, geophysical logging of Erin’s drill holes, and design of a preliminary hydrogeological
conceptual model. As of the Effective Date of this NI43-101 report, MWH UK LTD have
completed the installation of seven piezometers and undertaken testing of hydraulic
conductivity around individual wells. Ground water and stream flow monitoring is also
ongoing. SRK ES has reviewed this information, as stated in MWH’s “Interim Hydrogeological
Report (Phase II)”, dated March 2013 and agree that such studies are warranted and
appropriate for this stage of exploration project.
At present there are no quantitative results from the hydrogeological investigations available
for SRK to comment on.
Erin has an agreement with Ibarski Rudnici, the operators of the coal mine in the Jarandol
Basin, for the provision of geological services and exploration support to the Piskanja Project.
As part of the contract between the two companies Ibarski Rudnici prepared and submitted
the 2013 mineral resource report to the Ministry of Mining and Environmental and Spatial
Planning on behalf of Erin. SRK understand that this report has been reported within Serbian
Guidelines but is has not been reported in conformity with generally accepted Canadian
Institute of Mining (CIM) “Estimation of Mineral Resources and Mineral Reserves Best
Practice Guidelines” and is therefore not discussed as part of this Technical Report.
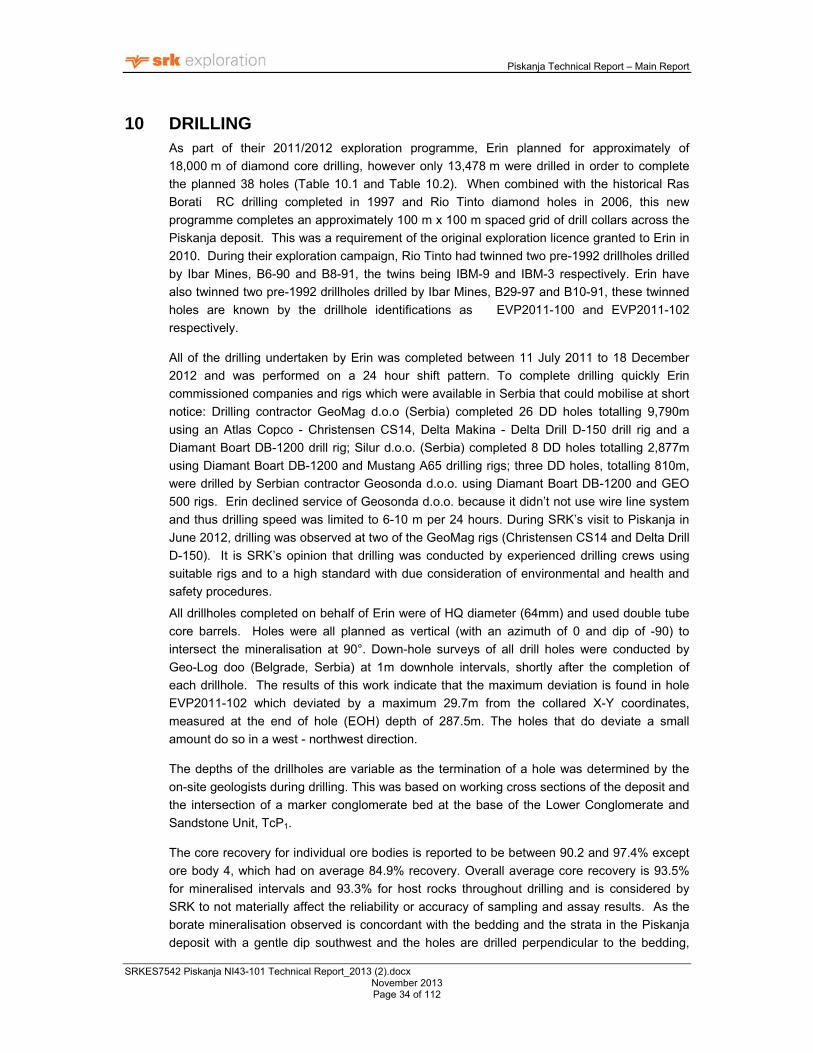
Piskanja Technical Report – Main Report
SRKES7542 Piskanja NI43-101 Technical Report_2013 (2).docx November 2013 Page 34 of 112
10 DRILLING As part of their 2011/2012 exploration programme, Erin planned for approximately of
18,000 m of diamond core drilling, however only 13,478 m were drilled in order to complete
the planned 38 holes (Table 10.1 and Table 10.2). When combined with the historical Ras
Borati RC drilling completed in 1997 and Rio Tinto diamond holes in 2006, this new
programme completes an approximately 100 m x 100 m spaced grid of drill collars across the
Piskanja deposit. This was a requirement of the original exploration licence granted to Erin in
2010. During their exploration campaign, Rio Tinto had twinned two pre-1992 drillholes drilled
by Ibar Mines, B6-90 and B8-91, the twins being IBM-9 and IBM-3 respectively. Erin have
also twinned two pre-1992 drillholes drilled by Ibar Mines, B29-97 and B10-91, these twinned
holes are known by the drillhole identifications as EVP2011-100 and EVP2011-102
respectively.
All of the drilling undertaken by Erin was completed between 11 July 2011 to 18 December
2012 and was performed on a 24 hour shift pattern. To complete drilling quickly Erin
commissioned companies and rigs which were available in Serbia that could mobilise at short
notice: Drilling contractor GeoMag d.o.o (Serbia) completed 26 DD holes totalling 9,790m
using an Atlas Copco - Christensen CS14, Delta Makina - Delta Drill D-150 drill rig and a
Diamant Boart DB-1200 drill rig; Silur d.o.o. (Serbia) completed 8 DD holes totalling 2,877m
using Diamant Boart DB-1200 and Mustang A65 drilling rigs; three DD holes, totalling 810m,
were drilled by Serbian contractor Geosonda d.o.o. using Diamant Boart DB-1200 and GEO
500 rigs. Erin declined service of Geosonda d.o.o. because it didn’t not use wire line system
and thus drilling speed was limited to 6-10 m per 24 hours. During SRK’s visit to Piskanja in
June 2012, drilling was observed at two of the GeoMag rigs (Christensen CS14 and Delta Drill
D-150). It is SRK’s opinion that drilling was conducted by experienced drilling crews using
suitable rigs and to a high standard with due consideration of environmental and health and
safety procedures.
All drillholes completed on behalf of Erin were of HQ diameter (64mm) and used double tube
core barrels. Holes were all planned as vertical (with an azimuth of 0 and dip of -90) to
intersect the mineralisation at 90°. Down-hole surveys of all drill holes were conducted by
Geo-Log doo (Belgrade, Serbia) at 1m downhole intervals, shortly after the completion of
each drillhole. The results of this work indicate that the maximum deviation is found in hole
EVP2011-102 which deviated by a maximum 29.7m from the collared X-Y coordinates,
measured at the end of hole (EOH) depth of 287.5m. The holes that do deviate a small
amount do so in a west - northwest direction.
The depths of the drillholes are variable as the termination of a hole was determined by the
on-site geologists during drilling. This was based on working cross sections of the deposit and
the intersection of a marker conglomerate bed at the base of the Lower Conglomerate and
Sandstone Unit, TcP1.
The core recovery for individual ore bodies is reported to be between 90.2 and 97.4% except
ore body 4, which had on average 84.9% recovery. Overall average core recovery is 93.5%
for mineralised intervals and 93.3% for host rocks throughout drilling and is considered by
SRK to not materially affect the reliability or accuracy of sampling and assay results. As the
borate mineralisation observed is concordant with the bedding and the strata in the Piskanja
deposit with a gentle dip southwest and the holes are drilled perpendicular to the bedding,

Piskanja Technical Report – Main Report
SRKES7542 Piskanja NI43-101 Technical Report_2013 (2).docx November 2013 Page 35 of 112
SRK is satisfied that the difference between the drilled sample length and true thickness of
mineralisation is not an issue and that true thickness is observed in the drill core.
Table 10.1 summarises the details of the 38 Erin holes completed and Table 10-2 details
these 38 holes. Figure 10-1 shows those holes drilled by Erin as well as the location of
historical drill holes. All of the collars indicated in this diagram fall within the Piskanja
Exploration Licence. A list of all borate mineralised intercepts from the 2011/2012 Erin
diamond drill holes is presented in Appendix A. Drillhole EVP2012-127 was terminated at 91
m depth due methane gas release from a fault zone at 90.1m. Drillhole EVP2012-127A was
therefore re-drilled 8.5 m to the southwest of the terminated hole to maintain the required
drillhole spacing. Methane gas has not been noted in any other holes.
Table 10.1 Summary of Erin's 2011/2012 Piskanja Project diamond drilling programme
Programme state date 11 July 2011
Programme completion date 18 December 2012
Number of diamond core holes
completed 38
Total meters drilled 13,569m
Minimum hole depth 91m (EVP2012-127)
Maximum hole depth 485.6m (EVP2012-132)
Mean average hole depth 357.1m

Piskanja Technical Report – Main Report
SRKES7542 Piskanja NI43-101 Technical Report_2013 (2).docx November 2013 Page 36 of 112
Figure 10-1 Location of drill collars for the Piskanaja Project overlaid on topography. Red dots = Erin 2011/2012 holes; Yellow = Rio Tinto 2006/2007 holes; Orange = Ibarmines pre-1997 holes.

Piskanja Technical Report – Main Report
SRKES7542 Piskanja NI43-101 Technical Report_2013 (2).docx November 2013
Page 37 of 112
Table 10.2 Location of Erin Ventures diamond holes drilled in 2011/2012 for the Piskanja Project, Serbia. Coordinates are stated in UTM WGS84
BHID Start date Finish date
Eas
tin
g,
m
No
rth
ing
, m
Ele
va
tio
n,
m
Dip
Azi
mu
th
Final Depth,
m
Drilling Company
EVP-2011-100 11/07/2011 14/08/2011 471545 4803342 420.15 -90 0 223.5 Geosonda
EVP-2011-101 10/08/2011 22/09/2011 471610 4803272 425.83 -90 0 407.0 Silur
EVP-2011-102 22/08/2012 08/10/2012 471660 4803359 426.12 -90 0 287.5 Geosonda
EVP-2011-103 07/10/2011 24/10/2011 471598 4803381 421.50 -90 0 309.3 Silur
EVP-2011-104 13/10/2011 07/12/2011 471700 4803182 440.40 -90 0 299.5 Geosonda
EVP-2011-105 01/11/2011 29/11/2011 471659 4803312 426.96 -90 0 270.8 Silur
EVP-2011-106 03/11/2011 29/11/2011 471608 4803153 433.97 -90 0 321.0 GeoMag
EVP-2011-107 02/12/2011 24/12/2011 471480 4803044 430.05 -90 0 373.3 GeoMag
EVP-2011-108 12/12/2011 21/12/2011 471583 4803054 439.80 -90 0 356.6 GeoMag
EVP-2011-109 27/12/2011 09/03/2012 471803 4803073 470.32 -90 0 362.0 Silur
EVP-2012-110 24/01/2012 12/03/2012 471535 4802831 437.19 -90 0 364.1 GeoMag
EVP-2012-111 23/02/2012 13/03/2012 471418 4803144 418.94 -90 0 380.4 GeoMag
EVP-2012-112 26/02/2012 19/03/2012 471905 4803168 468.26 -90 0 302.6 GeoMag
EVP-2012-113 16/03/2012 01/04/2012 471507 4803097 428.35 -90 0 389.1 GeoMag
EVP-2012-114 19/03/2012 10/04/2012 471424 4803194 417.57 -90 0 346.2 Silur
EVP-2012-115 20/03/2012 10/04/2012 471973 4802975 498.69 -90 0 340.3 GeoMag
EVP-2012-116 02/04/2012 21/04/2012 471607 4803104 437.46 -90 0 350.5 GeoMag
EVP-2012-117 17/04/2012 26/04/2012 471870 4802962 500.60 -90 0 371.6 GeoMag
EVP-2012-118 23/04/2012 06/05/2012 471576 4802959 449.53 -90 0 377.4 GeoMag
EVP-2012-119 28/04/2012 19/05/2012 471776 4802962 490.13 -90 0 386.5 GeoMag
EVP-2012-120 08/05/2012 07/06/2012 471533 4803160 426.22 -90 0 347.2 Silur
EVP-2012-121 09/05/2012 30/05/2012 471468 4802946 435.77 -90 0 403.8 GeoMag
EVP-2012-122 22/05/2012 02/06/2012 471671 4802956 468.02 -90 0 389.6 GeoMag
EVP-2012-123 01/06/2012 28/06/2012 471364 4802940 425.22 -90 0 424.2 GeoMag
EVP-2012-124 06/06/2012 16/06/2012 471862 4802857 481.81 -90 0 395.6 GeoMag
EVP-2012-125 18/06/2012 03/07/2012 471745 4802862 464.95 -90 0 348.9 GeoMag
EVP-2012-126 28/06/2012 08/08/2012 471234 4803132 410.57 -90 0 414.6 Silur
EVP-2012-127 472025 4803174 476.15 -90 0 91.0 GeoMag
EVP-2012-127A
05/09/2012 07/12/2012 472019 4803168 475.89 -90 0 320.2 GeoMag
EVP-2012-128 05/07/2012 20/07/2012 471946 4802871 505.09 -90 0 422.0 GeoMag
EVP-2012-129 08/07/2012 02/09/2012 471755 4803256 439.96 -90 0 281.6 GeoMag
EVP-2012-130 22/07/2012 03/08/2012 471389 4803042 422.16 -90 0 410.3 GeoMag
EVP-2012-131 27/07/2012 10/08/2012 471290 4803044 416.36 -90 0 430.6 GeoMag
EVP-2012-132 05/08/2012 26/08/2012 471188 4803032 411.75 -90 0 485.6 GeoMag
EVP-2012-133 18/08/2012 06/09/2012 471266 4802937 417.73 -90 0 451.7 GeoMag
EVP-2012-134 21/08/2012 10/12/2012 471314 4803137 413.18 -90 0 420.1 Silur
EVP-2012-135 28/11/2012 09/12/2012 471635 4802861 451.10 -90 0 368.2 GeoMag
EVP-2012-136 09/12/2012 18/12/2012 471995 4803059 485.75 -90 0 344.6 GeoMag

Piskanja Technical Report – Main Report
SRKES7542 Piskanja NI43-101 Technical Report_2013 (2).docx November 2013
Page 38 of 112
Specific Gravity Data 10.1Erin has undertaken a geotechnical study on samples from mineralised intervals and host
rocks in accordance with the requirements of the Mineral Resource Code of Serbia. A total of
101 samples, each 9 to 25 cm in length totalling 15.64 m of core, were collected from the core
stored in Erin’s Baljevac storage facility. Samples taken from host rock lithologies were all
whole core samples, whereas samples from the mineralised intervals were ¼ (quarter) core
samples. The samples were sent to the Faculty of Ore Geology, Department of
Geomechanics at the University of Belgrade for analysis.
The analysis included determination of unit weight (UW) using core and specific density (SD)
using rock powder. Table 10.3 shows the results of this determination for the main lithologies
found in the Piskanja deposit.
Table 10.3 Summary of unit weight test results for core samples of different lithologies within the Piskanja deposit. Figures in brackets are number of individual samples tested
Rock type Specific Density
(kN/m3)
Unit Weight
(kN/m3)
Unit Weight
(t/m3)
Siltstone 25.76 25.12
Borate
mineralisation
24.57 (8) 22.53 (36) 2.287 (36)
Breccia 26.70 25.31
Claystone 25.59 (17) 24.52 (21) 2.48 (4)
Conglomerate 27.57 (1) 25.6 (1)
Dolomite 24.12 (3) 23.32 (3)
Sandstone 23.79 (3) 22.78 (3)
*-Unit Weight (t/m3) was calculated from kN/m3 by dividing by 9.81
Numbers in brackets are the number of samples tested from each lithology
SRK has not visited this facility to observe any of the analyses, however review of the reports
written by the University indicate the methods used were as follows.
Unit weight (also known as specific weight) was determined using the water immersion
method where natural state (non-dried) samples were weighted in air, coated in paraffin and
weighed in water. Specific density (also known as specific gravity) measurements were
conducted on powdered, dried samples using a pycnometer.
There is significant variation in unit weight measurements for natural state (undried) borate
mineralisation samples, between 1.914 t/m3 and 2.537 t/m3. This is most likely caused by
variation in the dominant borate minerals in each sample,( colemanite has an SG of 2.42 t/m3,
whereas ulexite has an SG of 1.95 t/m3) but may also be due to intercalations of clay and
dolomitic rock, if mineralised samples selected were not all composed solely borate minerals.
It is also likely that variable water content and presence of cavities in the natural state
samples also add to the inconsistencies in SG.
SRK advises that in future all SG measurements are undertaken on dried core samples using
the water immersion method.

Piskanja Technical Report – Main Report
SRKES7542 Piskanja NI43-101 Technical Report_2013 (2).docx November 2013
Page 39 of 112
11 SAMPLE PREPARATION, ANALYSIS AND SECURITY
Sampling of Diamond Core 11.1During their site visit in June 2012, SRK observed Erin’s geologists undertaking logging and
sampling procedures at the drill rig site and at Erin’s office area in Baljevac. The geological
team employed by Erin to carry out the sample procedures were in SRK’s opinion following
company procedures although these were not documented and so it was not clear if the same
procedure was always being executed.
Sampling procedures were understood and carried out well by Erin staff, but were not
documented as written protocols. As such SRK recommended in their Technical Report
(2012) that protocols should be created for the team to follow, SRK suggested that the
protocols should include instructions on the following:,
Sample half core instead of quarter core;
Sample intercalations of mineralised and host lithologies and sample the host rocks
located in hanging and foot walls, and;
Record logging and sampling procedures and protocols in written form.
During the June 2013 visit Erin provided SRK with the document; “Abstract of Exploration
Methodology (Sampling and QA/QC Procedures)”, relating to core logging, sampling, sample
security and database management. These procedures have been in use since July 2012 for
the sampling of holes EVP-2012-119 to EVP2012-136, equating to 61% of the total samples
collected (including QAQC samples). Due to the timing of SRK’s second site visit in June
2013 after the completion of drilling, these procedures were not observed in action by SRK.
The procedure for logging and sampling includes the following;
Core is packed into plastic core trays at the drill site, each tray containing up to a
maximum of 3m of core (five sections of 60cm length). After the core has been
washed Erin’s geologist draws a down-hole direction line, marks the core box with
information about the borehole and prepares a quick geological log. After each drilling
shift the core boxes are transported to the Erin office in Baljevac;
The core is geologically logged and basic geotechnical information (core recovery
and RQD) recorded directly in to digital databases by Erin’s geologist;
Digital photographs are taken of both dry and wet core;
Mineralised zones are defined visually. High grade, white-cream coloured borate
mineralisation usually has clear and sharp lithological contacts and is marked for
sampling at 0.3-1.0 m (maximum 1.45 m) intervals. Depending on the presence of
disseminated mineralisation, up to two samples of host rocks from both above and
below the mineralised borate horizons are sampled at intervals of 1 m to 3 m in
thickness (minimal thickness is 0.45m). Thus each hole may have a number of
mineralised sections sampled, each possibly including massive borate mineralisation,
intercalated or disseminated mineralisation and barren rock from the hanging and foot
walls. The core between horizons of massive mineralisation with no visually identified
borate minerals is not sampled for assay.
Marked core is cut lengthways using a diamond saw. Half core from the marked
sample intervals is then selected, placed in cloth sample bags and numbered with the
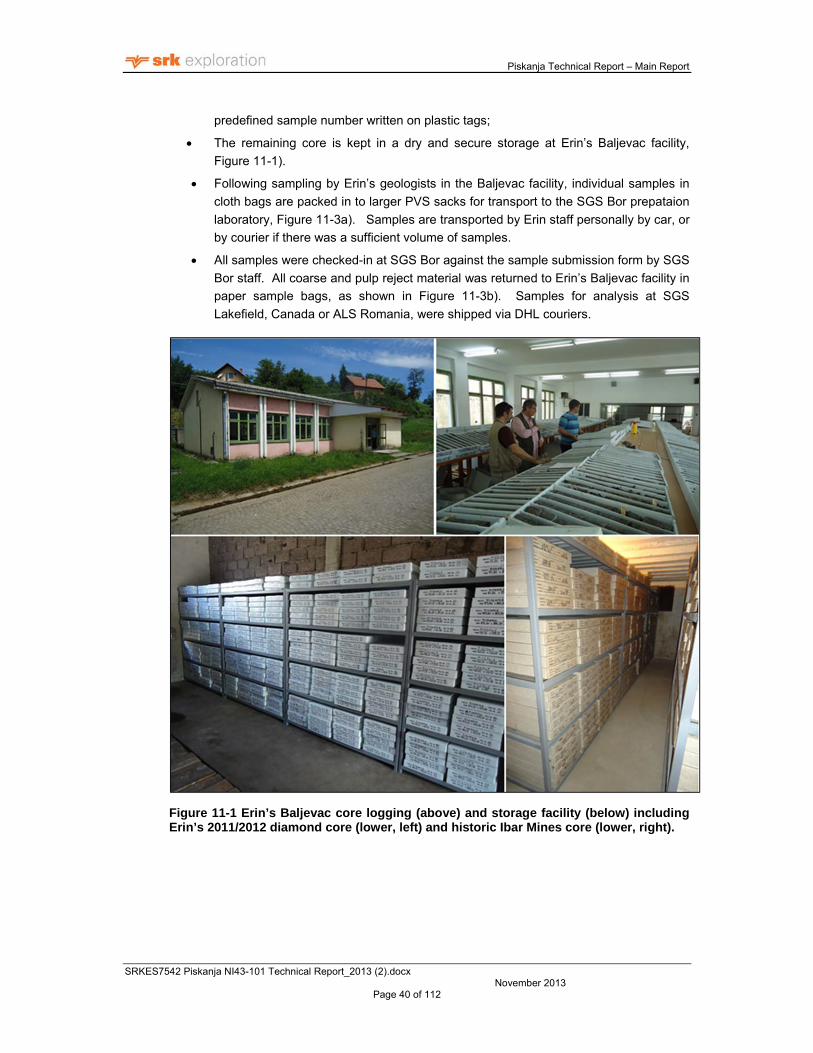
Piskanja Technical Report – Main Report
SRKES7542 Piskanja NI43-101 Technical Report_2013 (2).docx November 2013
Page 40 of 112
predefined sample number written on plastic tags;
The remaining core is kept in a dry and secure storage at Erin’s Baljevac facility,
Figure 11-1).
Following sampling by Erin’s geologists in the Baljevac facility, individual samples in
cloth bags are packed in to larger PVS sacks for transport to the SGS Bor prepataion
laboratory, Figure 11-3a). Samples are transported by Erin staff personally by car, or
by courier if there was a sufficient volume of samples.
All samples were checked-in at SGS Bor against the sample submission form by SGS
Bor staff. All coarse and pulp reject material was returned to Erin’s Baljevac facility in
paper sample bags, as shown in Figure 11-3b). Samples for analysis at SGS
Lakefield, Canada or ALS Romania, were shipped via DHL couriers.
Figure 11-1 Erin’s Baljevac core logging (above) and storage facility (below) including Erin’s 2011/2012 diamond core (lower, left) and historic Ibar Mines core (lower, right).
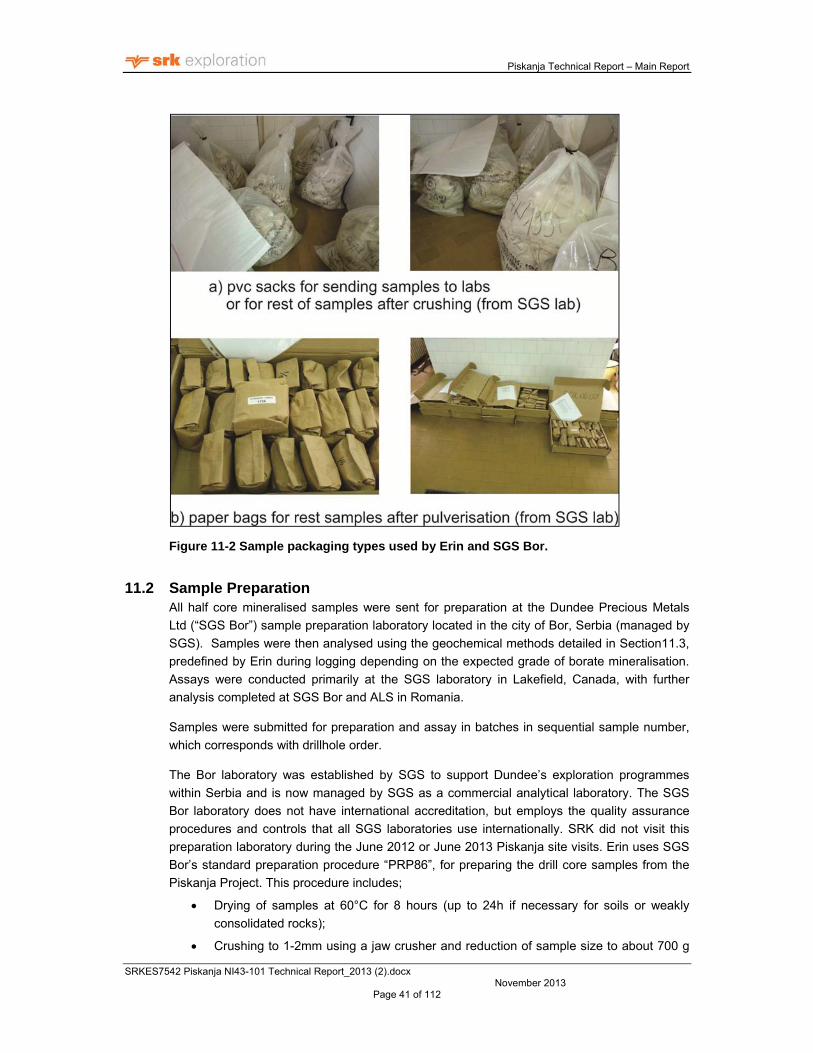
Piskanja Technical Report – Main Report
SRKES7542 Piskanja NI43-101 Technical Report_2013 (2).docx November 2013
Page 41 of 112
Figure 11-2 Sample packaging types used by Erin and SGS Bor.
Sample Preparation 11.2All half core mineralised samples were sent for preparation at the Dundee Precious Metals
Ltd (“SGS Bor”) sample preparation laboratory located in the city of Bor, Serbia (managed by
SGS). Samples were then analysed using the geochemical methods detailed in Section11.3,
predefined by Erin during logging depending on the expected grade of borate mineralisation.
Assays were conducted primarily at the SGS laboratory in Lakefield, Canada, with further
analysis completed at SGS Bor and ALS in Romania.
Samples were submitted for preparation and assay in batches in sequential sample number,
which corresponds with drillhole order.
The Bor laboratory was established by SGS to support Dundee’s exploration programmes
within Serbia and is now managed by SGS as a commercial analytical laboratory. The SGS
Bor laboratory does not have international accreditation, but employs the quality assurance
procedures and controls that all SGS laboratories use internationally. SRK did not visit this
preparation laboratory during the June 2012 or June 2013 Piskanja site visits. Erin uses SGS
Bor’s standard preparation procedure “PRP86”, for preparing the drill core samples from the
Piskanja Project. This procedure includes;
Drying of samples at 60°C for 8 hours (up to 24h if necessary for soils or weakly
consolidated rocks);
Crushing to 1-2mm using a jaw crusher and reduction of sample size to about 700 g

Piskanja Technical Report – Main Report
SRKES7542 Piskanja NI43-101 Technical Report_2013 (2).docx November 2013
Page 42 of 112
using a Jones riffle splitter;
Pulverisation to 75µm using a Labtech Essa LM5 mill
The drying procedure had initially been completed at a temperature of 105°C for the 240
samples prepared prior to July 2012. The remaining 61% of samples prepared following this
date were dried at 60°C. Erin’s justification for reduction of this temperature was to prevent
possible dehydration/decomposition of boron mineralisation and phase transition (Yilmaz et
al., 2013). It is SRK’s opinion however that the main minerals found in the Piskanja Deposit
will be stable during the “normal” drying procedure (105°C) and that the amendments to
drying temperature will not affect the estimation of boron grade in the samples.
Once prepared, approximately 250g of each pulped sample were sent by SGS Bor from
Serbia to SGS Lakefield in Ontario, Canada for analysis. The remaining coarse and pulp
rejects were returned to the Erin office in Baljevac for storage.
Sample Analysis 11.3Several analytical methods have been used to assay samples from the 2011/2012 resource
drilling of the Piskanja deposit. Methods were assigned to samples based on the expected
boron content estimated by Erin geologists during core logging. The number of analytical
methods used were reduced in July 2012, mid-way through the drilling programme, as
summarised in Table 11.1.
For clarity, all drilling, sampling and geochemical analysis conducted prior to Jul;y 2012 shall
herein be termed Stage 1. The remaining drilling, sampling, analysis and amended protocols
used after July 2012 shall be referred to as Stage 2. Stage 1 analyses applied to the 259
samples collected from holes EVP2011-100 to EVP2012-118 (sample ID 1065 to 1849) and
Stage 2 applied to 401 samples collected from holes EVP2012-119 to EVP2012-136 (sample
ID 1850 to 2251).

Piskanja Technical Report – Main Report
SRKES7542 Piskanja NI43-101 Technical Report_2013 (2).docx November 2013
Page 43 of 112
Table 11.1 Summary of Piskanja Project sample analyses carried out at primary and secondary laboratories (including QAQC samples)
Element
analysed
Analytical
Method Laboratory
Laboratory
Method
Code
Stage 1
(Jul 2011
– Jun
2012)
Stage 2
(Jul
2012 –
Jan
2013)
Total
PRIMARY LABORATORIES
Total samples analysed 259 401 660
Boron
Volumetric
Titration
SGS
Lakefield GC-CLA68V 223 198 418
KOH-ICP-
AES
SGS
Lakefield GC-ICP94V 143 1 144
B, As, Li, Sr Aqua regia
ICP-AES
SGS
Lakefield GC_ICP14C 61 0 61
Major oxides XRF SGS
Lakefield XRF76C 259 144 403
Sulphur Combustion
IR
SGS
Lakefield
GC/GU/GP
CS A06V 218 0 218
Multielement
analysis
Aqua regia
ICP-MS SGS Bor IMS14B 0 401 401
SECONDARY “UMPIRE” LABORATORY
Total samples analysed 0 30 30
Boron
Na2O2
fusion ICP-
AES
ALS
Romania ME-ICP41a 0 11 11
Major oxides XRF ALS
Romania ME-XRF26 0 11 11
Multielement
analysis
Aqua regia
ICP-AES
ALS
Romania B-ICP82a 0 30 30
The following methods were used to determine the boron and B2O3 content of samples;
Volumetric Titration
The sample is digested in an acidic solution and then filtered. Iron in the sample is oxidised
by the addition of bromine water. Barium carbonate is added to react with the boric acid,
forming soluble barium borate and precipitating hydroxides of interfering metals. The solution
is filtered and complexed with sorbitol. It is then titrated with NaOH to determine the B2O3
content.
The titration method is good at producing repeatable results to a high level of accuracy for the
total content of acid soluble B2O3. The method is designed for samples containing a high
percentage of B2O3 and has a measurement uncertainty of 0.3 in the 10-50% B2O3 range.

Piskanja Technical Report – Main Report
SRKES7542 Piskanja NI43-101 Technical Report_2013 (2).docx November 2013
Page 44 of 112
Alkali fusion ICP-AES
Samples are fused at high temperature with an alkali flux, commonly potassium hydroxide
(KOH) or sodium peroxide (Na2O2). Total boron (B) is determined by induction coupled
plasma atomic emission spectroscopy (ICP-AES) and reported in ppm. This method is
recognised as being suitable for ore-grade samples containing high percentages of boron.
Conversion to equivalent B2O3 (%) requires multiplication of the ppm B grade by 3.2199x10⁻⁴.
Aqua Regia ICP-AES or ICP-MS
Aqua Regia (AR) is the name given to a highly corrosive mixture of nitric acid and
hydrochloric acid, optimally, but not always in the ratio of 1:3. Samples are dissolved by this
acid at 90°C before determination of multiple elements is completed using induction coupled
plasma atomic emission spectroscopy (ICP-AES) or induction coupled plasma mass
spectrometry (ICP-MS) equipment.
Boron is easily volatilized from acid solutions, such as that used in aqua regia digestion,
causing loss of boron during sample digestion, (Ryan and Langmuir, 1993, Nagaishi and
Ishikawa, 2009). The inconsistent liberation of boron in acid digestion and low upper limit of
detection used in aqua regia ICP-MS (~1% B) makes this method unsuitable for quantitative
boron analysis. SRK is satisfied that the alkali fusion ICP-AES methods and volumetric
titration produce sufficiently similar results for boron content of samples, as seen in Figure
11-3 and Figure 11-4.
SRK assessed the results of analysis obtained by different analytical methods. As a result a
discrepancy has been revealed between the aqua regia ICP-MS and volumetric titration
method for the detection of the boron grade. Originally, the aqua regia ICP-MS method was
used due to its relatively low cost compared with the other methods. This method was used to
identify samples which exceeded 15% B2O3 grade, with those samples above this grade sent
for titration analysis. Figure 11-2 below shows the poor correlation of aqua regia ICP-MS
results with the titration grades for the same samples, confirming aqua regia ICP-MS as an
inadequate method for high grade B2O3 analysis.

Piskanja Technical Report – Main Report
SRKES7542 Piskanja NI43-101 Technical Report_2013 (2).docx November 2013
Page 45 of 112
Figure 11-2 Aqua regia ICP-MS versus titration grade for B2O3 obtained during Erin exploration campaign

Piskanja Technical Report – Main Report
SRKES7542 Piskanja NI43-101 Technical Report_2013 (2).docx November 2013
Page 46 of 112
Figure 11-3 Correlation of results for samples analysed by both volumetric titration and KOH fusion ICP-AES during Phase 1

Piskanja Technical Report – Main Report
SRKES7542 Piskanja NI43-101 Technical Report_2013 (2).docx November 2013
Page 47 of 112
Figure 11-4 Correlation of results for samples analysed by both Na2O2 fusion ICP-AES and KOH fusion ICP-AES during Phase 1
11.3.1 Initial Analysis Programme (Stage 1) Erin separated their samples during Stage 1 and conducted different analysis on them
depending on whether the sample was deemed high grade or lower grade. Erin determined
this from observation of borate mineralisation in the core. In total 259 samples were collected
during Stage 1, taken from holes EVP2011-100 to EVP2012-118, Erin selected 233 samples
which they deemed to be “high-grade” and sent them for volumetric titration to determine the
B2O3 content. A total of 143 samples of the 259 samples which were a combination of
massive and disseminated/intercalated samples, were analysed for total boron by KOH fusion
ICP-AES..A total of 107 of these samples had also previously been analysed using volumetric
titration (Figure 11-3). A further 61 samples which were observed by Erin to contain
intercalations or disseminations of borate minerals or samples which were deemed as
“waste” material which were immediately adjacent to mineralised intervals in the core, were
assayed for soluble boron by aqua regia ICP-AES. This final method also analysed for
arsenic, lithium and strontium as these elements are known to be pathfinders for borate
mineralisation in other deposits.
All 259 samples were analysed for whole rock oxide content with a metaborate fusion XRF
method (x-ray fluorescence) and 218 samples were also assayed for sulphur by combustion

Piskanja Technical Report – Main Report
SRKES7542 Piskanja NI43-101 Technical Report_2013 (2).docx November 2013
Page 48 of 112
infrared detection. All of the above analyses were completed by ISO 17025 accredited SGS
Lakefield, Ontario, Canada. SRK has not visited this laboratory as part of this commission.
Stage 1 accounts for 39% of the total sampling programme resulting from the 2011/2012
drilling campaign (including QAQC materials). Stage 1 included very limited use of QAQC
materials as detailed later in Section 11.4. This was highlighted in the previous SRK technical
report, (Technical Report, 2012). Modifications made to the selection of analysis methods
and use of QAQC materials as a result of that report, resulted in the remaining 61% of
samples following a simpler analysis and QAQC procedure.
11.3.2 Amended Analysis Programme (Stage 2) Following amendment and simplification of the sample analysis and QAQC procedures in July
2012, the remaining high grade samples (198 of 401 Phase 2 samples) collected from drill
core (holes EVP2012-119 to EVP2012-136), were all analysed for B2O3 by volumetric titration
at SGS Lakefield. 144 samples were analysed for whole rock oxide by XRF, also at SGS
Lakefield. In addition, all 401 samples were analysed by aqua regia ICP-MS for 53 elements
at SGS Bor.
QAQC samples (duplicate, blanks and reference materials) were used routinely, as detailed
later in Section 11.4.1 and Section 11.4.2.
QAQC Procedures and Results 11.4Erin did not utilise any blanks or duplicates during Stage 1 of the resource drilling and
submitted only five lithium certified reference material (CRM) samples for analysis. The CRMs
were only introduced at the end of Stage 1, in the final batch of 41 samples. The CRMs
were sourced from independent preparation laboratory; Shea Clark Smith, Mineral Exploration
& Environmental Geochemistry, Reno, USA. Shea Clark Smith was established in 1984 and
although they do not have any international accreditations it is understood that they work
closely with several analytical laboratories (http://sheaclarksmith.com/). The CRMs from
Shea Clark Smith were lithium standards with very low boron content; therefore they do not
match well with the characteristics of mineralisation found at Piskanja, (Table 11.2). It is
SRK’s opinion that these CRMs were not appropriate for use in the Piskanja project.
Table 11.2 Shea Clark Smith Certified Reference Materials used during the analysis of the first 240 samples for the resource drilling at Pisknja in 2011/2012
CRM Name B content (%) Li content (ppm)
MEG-LI.10.14 0.2 807
MEG-Li.10.15 1.8 1611
As part of their internal QAQC procedures the SGS Lakefield laboratory inserted CRMs and
blank samples into the sample batches No results from these internal assays have been
provided to Erin.
11.4.1 Certified Reference Material This section of the report (Section 11.4.1 to Section 11.4.4) details the QAQC measures that
were implemented in July 2012 and used during the analysis of the remaining 61% of
samples which were collected during Stage 2 of the programme.

Piskanja Technical Report – Main Report
SRKES7542 Piskanja NI43-101 Technical Report_2013 (2).docx November 2013
Page 49 of 112
Erin selected material in order to create thier own internal CRM . SRK understand that Erin
collected some 200 kg of borate mineralisation sourced from the JP PEU Resavica Pobrdje
borate mine located some 2.6 km northwest of the Piskanja Project. Material was classified
into three bulk samples; high, medium and low grade by Erin and sent to the independent
preparation laboratory; Shea Clark Smith, Mineral Exploration & Environmental Geochemistry,
Reno, USA, who prepared CRMs with three different borate grades.
SRK understand that the material was; dried in thermostatically controlled electric ovens;
crushed in series through corrugated, flat plate and roll crushers; and milled to 95% passing a
150 mesh sieve (0.105mm). Initially the material was split in half for the milling, the milling
was completed in a ceramic lined ball mill for 5 days (one half), 5 days (second half) and for a
final 5 days with the halves combined. The sieved material was then packaged into 50g
samples in envelopes. One in every 100 samples created was set aside for the round
robin/homogeneity testing, the remaining 99% of envelopes were returned to Erin as
reference materials. Low grade reference material is identified at “1X B”, medium grade
material as “2X B” and high grade material as “3X B”.
In total, five samples of each CRM were sent to 8 geochemical laboratories (Table 11.3) for a
round robin analysis to determine a grade for each standard. Samples were submitted with a
randomised numbering system assigned by Shea Clark Smith and the labs were encouraged
to analyse the submittals as a normal daily production run and as such, certain samples were
repeated as part of the laboratories QAQC systems. The 8 laboratories analysed the samples
using Na2O2 fusion preparation and either an ICP AES or ICP-MS finish.
SRK has not visited the laboratories which took part in the round robin process during the
review of the Piskanja Project.

Piskanja Technical Report – Main Report
SRKES7542 Piskanja NI43-101 Technical Report_2013 (2).docx November 2013
Page 50 of 112
Table 11.3 Accreditation of laboratories used in the round robin analysis used to determine certified reference materials for the Piskanja Project
Laboratory
Name Location Accreditation
Analytical Method
used
American Assay Sparks, Nevada,
USA ISO/IEC 17025:2005 Na2O2-fusion ICP-AES
ACME Analytical
Laboratories Vancouver, Canada ISO/IEC 17025:2005 Na2O2-fusion ICP-AES
Activation
Laboratories Ontario, Canada
ISO/IEC 17025 and
CAN-P-1579 Na2O2-fusion ICP
ALS Chemex Vancouver, Canada ISO/IEC 17025:2005 Na2O2-fusion ICP-AES
Florin Analytical
Services Reno, Nevada, USA
Application pending
(ISO/IEC 17025) Na2O2-fusion ICP
Genalysis/Intertek Perth, Australia ISO/IEC 17025 Na2O2-fusion ICP-AES
Kalassay Perth, Australia
Application pending
(ISO/IEC 17025)
Accredited by the
National Association of
Testing Authorities,
Australia
Na2O2-fusion ICP-AES
Alex Stewart Mendoza, Argentina
ISO 9001:2008
ISO 14001:2004
ISO 17025:2005 (only
for Au by fire assay and
Li and K liquid brine
analysis)
Na2O2-fusion -fusion
ICP
SGS Bor
(Preparation lab
and primary
multielement
analysis)
Bor, Serbia
No
national/international
accreditation.
Utilises standard SGS
internal QAQC
procedures
AR ICP-MS
SGS Lakefield
(Primary
laboratory)
Lakefield, Canada ISO/IEC 17025:
Volumetric Titration
KOH-fusion ICP-AES
AR ICP-AES
XRF
Combustion IR
ALS Romania
(Umpire
laboratory)
Rosia Montana,
Romania ISO/IEC 17025:2005
Na2O2-fusion ICP-AES
XRF
AR ICP-MS

Piskanja Technical Report – Main Report
SRKES7542 Piskanja NI43-101 Technical Report_2013 (2).docx November 2013
Page 51 of 112
Table 11.4 and Figure 11-5 to Figure 11-7 show the results of the round robin for the three
reference materials, 1X B, 2X B 3X B. Although the individual laboratories generally have
good precession of results showing a close clustering of repeat measurements, there is not
such a good correlation between laboratories. All low grade analyses fall within the 2SD
envelope, but results for standards tested at ACME Analytical Laboratories and Alex Stewart
report higher and lower than the 2SD envelope respectively for both medium and high grade
materials.
The summary results of these round robin assays are presented in Table 11.4. The mean
grades from the round robin and shown here are used as CRM grades in Erin’s QAQC
programme.
SRK suggest that such variation may be due to minor differences in procedures for the fusion
of samples and Na2O2 during preparation or due to inconsistencies in the calibration of ICP
analysis equipment. SRK suggest that further investigation of sample fusion durations and
concentrations should be made to identify the cause of the inter-laboratory variation seen in
the round robin data to date.
Table 11.4 Summary results for determination of reference material grades
Reference Material Name 1X B 2X B 3X B
Total samples assayed 42 43 42
Minimum, (% B) 5.52 9.79 12.94
Maximum, (% B) 6.59 11.97 15.87
Number of outliers removed 0 13 2
Mean average, (% B) 6.10 11.19 14.35
Standard deviation, (% B) 0.30 0.33 0.60
Figure 11-5 Round Robin results for Erin's "Low Grade" standard 1X B

Piskanja Technical Report – Main Report
SRKES7542 Piskanja NI43-101 Technical Report_2013 (2).docx November 2013
Page 52 of 112
Figure 11-6 Round Robin results for Erin's "Medium Grade" standard 2X B
Figure 11-7 Round Robin results for Erin's "High Grade" standard 3X B
Results of Reference Material in the sample batches
As part of the analysis of the Stage 2 samples from the 2011/2012 Piskanja Project drilling,
CRMs were inserted at a frequency of every 20th sample, alternating between “high” (3X B),
“medium” (2X B) and “low” (1X B) grade standards.
A total of 19 CRMs were sent for analysis by volumetric titration (SGS Lakefield) and aqua-
regia ICP-MS (SGS Bor) along with the primary samples. CRMs analysed with aqua regia
ICP-MS have been excluded from this comparison due to the known inadequacy of this
method for determination of boron.
18 CRMs were also submitted to a secondary “umpire” laboratory ALS Romania (Rosia
Montana, Romania) where analysis was complete using the Na2O2 fusion ICP-AES method.
The results for all CRMs in the secondary lab fall well within the 2SD envelope for each
standard, though consistently slightly above the standards’ respective means, indicating that
the sodium fusion method is capable of providing repeatable boron analysis.

Piskanja Technical Report – Main Report
SRKES7542 Piskanja NI43-101 Technical Report_2013 (2).docx November 2013
Page 53 of 112
The results for the laboratory reference materials used as part of SGS’ internal QAQC
procedures have not routinely been reported. There is an inconsistency in reporting these
internal QAQC results on the certificates produced by the SGS and so SRK is unable to fully
evaluate the consistency and accuracy of the primary laboratory titration analysis results.
SRK recommend that more CRM analyses are required to reliably assess the repeatability of
the analysis method.
Figure 11-8 Plot of reference material 1X B grade by sodium peroxide fusion ICP-AES analysis method for ALS Romania (secondary laboratory)
Figure 11-9 Plot of reference material 2X B grade by sodium peroxide fusion ICP-AES analysis method for ALS Romania (secondary laboratory)

Piskanja Technical Report – Main Report
SRKES7542 Piskanja NI43-101 Technical Report_2013 (2).docx November 2013
Page 54 of 112
Figure 11-10 Plot of reference material 3X B grade by sodium peroxide fusion ICP-AES analysis method for ALS Romania (secondary laboratory)
11.4.2 Blank Samples Introduced in Stage 2 of the resource drilling programme, Erin sourced material for blank
QAQC samples from Vrh, near Studenica, approximately 40km by road northwest of the
Piskanja deposit. Samples of quartzite, dolomite and three different marbles were tested at
the SGS Bor laboratory by aqua regia ICP-MS. Erin selected one of the marbles to use as a
QAQC blank material in the Piskanja sampling programme, based on the results of these ICP
analyses.
Approximately 500kg of marble was collected, broken in to rock chips with hammers and
between 2.3kg and 2.5kg of rock chips were put into sample bags. A blank sample was
inserted into the sampling stream at the beginning of each new hole and following mineralised
intervals. None of the 58 blanks created were assayed by volumetric titration or Na2O2 fusion
ICP-AES, only by multielement aqua regia ICP-MS.
The average content of boron in different types of carbonate rocks in the Earth’s crust varies
within 20ppm to 55ppm B, while in clays the grades are higher, between 100ppm to 230ppm
(Parker, 1967). The marble used for blanks in this QAQC programme possesses a higher
boron content than expected for carbonate rocks (Figure 11-11). This elevated content of
boron in the marble may be caused by the presence of disseminated boron mineralisation and
contamination during the sample preparation and/or analysis.
SRK recommend that further investigation of this is carried out. SRK also suggests an
alternative blank material is sourced by Erin for future programmes with a lower boron content
than currently used.
As the blank material has only been analysed using the aqua regia ICP-MS process at SGS
Bor, the possibility of contamination of titration and alkali fusion ICP equipment in other
laboratories used by Erin cannot be evaluated at this stage.

Piskanja Technical Report – Main Report
SRKES7542 Piskanja NI43-101 Technical Report_2013 (2).docx November 2013
Page 55 of 112
SRK recommend that the blank samples are submitted in the sample batches to both primary
and secondary laboratories for analysis by the same methods as core samples and other
QAQC samples.
Figure 11-11 Scatter plot of blank marble samples submitted to SGS Bor
11.4.3 Duplicate Samples After every 20th sample a field duplicate was taken by preparing a quarter (¼) core sample
from the remaining half (½) core. The duplicate was assigned a sample number immediately
following its original. Duplicates were assayed by the method selected by Erin for the original
sample.
In total, 18 duplicates were created during Stage 2 and were analysed by aqua regia ICP-MS
at SGS Bor. Only 8 of 18 samples were analysed by volumetric titration at SGS Lakefield
(Figure 11-12). Aqua regia ICP-MS field duplicate results are not presented here due to the
method’s poor estimation of ore grade boron content. Volumetric titration field duplicate pairs
show a good correlation, with only two pairs falling outside the +/-10% relative difference
envelope. SRK therefore suggest that at least 30 duplicate pairs are needed to statistically
assess the repeatability of analysis by volumetric titration.
The variation seen in these duplicates can be explained by inhomogeneity in B2O3 grade or
presence of voids between the two core samples. For this reason, SRK recommend that pulp
duplicates should be taken in addition of course field duplicates and all should be tested using
the same analysis method.

Piskanja Technical Report – Main Report
SRKES7542 Piskanja NI43-101 Technical Report_2013 (2).docx November 2013
Page 56 of 112
Figure 11-12 Scatter plot of B2O3 grade for 8 field coarse duplicates vs. original samples using volumetric titration
11.4.4 Umpire Laboratory As of July 2012, Erin elected to use ALS Romania as an umpire laboratory for the remainder
of the drilling and sampling programme (Stage 2). Duplicate samples were created by taking
one pulp duplicate and one coarse duplicate from the reject material produced following
sample preparation at SGS Bor, after every 25th primary laboratory sample (equating to 4%
duplicates).
High, medium and low grade CRMs were added following each pair of duplicates.. This
system resulted in 30 duplicate samples being sent to the umpire laboratory (SGS Romania)
with 18 CRMs and one blank. 11 duplicates were assayed using Na2O2 fusion ICP-AES, all
samples were assayed by aqua regia ICP-AES for 34 elements plus boron and lithium and 11
samples were analysed for major oxides by lithium metaborate fusion XRF.
Erin use an insertion rate of 1 in 3 for CRMs, it is SRK’s opinion that this is unnecessarily
high and SRK recommend that a 1 in 20 frequency should be used for material sent to the
umpire laboratory. . Comparison of boron grades from aqua regia ICP-MS analysis are not
discussed here due to the poor assessment of boron content using this method.
SRK Comments on Adequacy of Procedures 11.5As already stated, the alkali fusion ICP methods (potassium hydroxide (KOH) or sodium
peroxide (Na2O2)) are most suitable for the determination of boron in “ore grade” samples.
Although volumetric titration uses an acid digest prior to titration, which may result in

Piskanja Technical Report – Main Report
SRKES7542 Piskanja NI43-101 Technical Report_2013 (2).docx November 2013
Page 57 of 112
volatilisation of boron during digestion, the comparison of KOH fusion ICP-AES results with
Na2O2 fusion ICP-AES and volumetric titration results indicates that there is a good correlation
and regression between the three methods.
Overall SRK is of the opinion that the sampling preparation, security and analytical
procedures used by Erin have been significantly improved since SRK’s initial site visit in June
2012. Adequate QAQC procedures have been undertaken to provide comfort that there is no
significant variation between volumetric titration and alkali fusion ICP results. To further
improve the analyses and QAQC procedures, SRK recommend the following;
SRK is of the opinion that sodium peroxide fusion (Na2O2) with ICP AES finish should
be used as the primary method for determination of all elements of interest (except
sulphur) including high grade boron. This may be achieved, for example, by using a
modification of SGS’ analytical package ICP-90, which is Na2O2 fusion ICP-AES
method designed for high grade samples.
All mineralised samples and those from the adjacent hangingwall/footwall should be
analysed with the same method. Sample preparation for volumetric titration uses an
acid digestion which may result in minor loss of boron as boron hydride and it
recovers only acid “soluble” boron. The Na2O2 fusion ICP-AES method provides
recovery of total boron, and is likely to be a much cheaper analysis method than
volumetric titration.
All QAQC samples (blanks, CRMs and duplicates) should be inserted at the same
frequency (1 in 20) into both initial and umpire laboratory sampling streams and
analysed with the same method as the primary core samples,
Pulp duplicates of primary samples should be used to verify the primary laboratory
analysis,
Duplicates sent to the umpire laboratory should be analysed with the same method as
the primary lab samples.
Variation in the certification of the CRM B2O3 grades should be investigated and
further round robin analysis undertaken to reduce the standard deviation error of the
certified grades for all three CRMs.
An alternative blank material should be sourced that contains negligible amounts of
boron as the current marble may not be sufficiently low grade to determine
contamination in sample preparation or analysis.

Piskanja Technical Report – Main Report
SRKES7542 Piskanja NI43-101 Technical Report_2013 (2).docx November 2013
Page 58 of 112
12 DATA VERIFICATION
Introduction 12.1The data for the Piskanja deposit has been validated for use in the MRE by SRK. SRK has
looked at the old drilling with more recent drilling to understand if it can be used in the MRE,
checked the sampling, QAQC sample results, and the Microsoft Access database provided by
the Client.
Comparison of Historical Drilling Data with Recent Drilling Data 12.2The drilling database supplied by the Client to SRK contained the data obtained during four
different drilling campaigns spanning from 1989 to 2012: in 1989, diamond drilling was
performed by Ibar Mines a government owned company; in 1997 RC drilling was performed
by Ras Borati; in 2006 to 2007 diamond drilling was performed by Rio Tinto; and more
recently in 2011 to 2012 drilling has been performed by Erin. Geological reports detailing the
drilling procedures used and information on the lithological logs is only available for the 2006
to 2007 period (Rio Tinto) and the 2011 to 2012 period (Erin). There is no available core or
report detailing the exploration data and quality of the data for the 1980s and 1990s
campaigns. There is also no QAQC data is available for the drilling and sampling completed
during this period. Erin is in possession of the core from the Rio Tinto holes and it is securely
stored on-site for re-examination and resampling is required.
An analysis by SRK of the of the data from the 1989 and 1997 drilling campaigns showed that
the assays might have been carried out only from intervals where mineralisation was visually
observed and samples in the hanging wall or footwall of the mineralised horizon were not
taken. It is possible that four sterilisation drillholes which were drilled by Ibar Mines and Ras
Borati were not assayed as no mineralisation was visible but with no records this is difficult to
determine.
During the Rio Tinto campaign from 2006 to 2007, a number of the Ibar Mines drillholes were
twinned. No twin drilling was performed between Rio Tinto and Ras Borati drillholes. SRK has
reviewed this work. Erin has not twinned any historical holes drilled by Ibar Mines and Ras
Borati; however SRK has compared the results for the Erin holes which were drilled
approximately 20m from historical collars. The results from the onmi-directional semi
variogram, discussed later in Section 14 which was created using the data from the Erin and
Rio Tinto drilling campaigns shows a range of100 m, and therefore it is SRK’s opinion that
comparing drillholes in a 20m range is appropriate.
SRK’s analysis of the results of the twin drilling where Rio Tinto’s IBM-9 drillhole is twinned
with Ibar Mines B-6/90 drillholes is illustrated in Figure 12.1. Figure 12.2 below compares Ibar
Mines drillhole B-4/90 with Erin’s drillhole EVP2013. SRK notice that while the grade
parameters from both holes are quite comparable the Ibar Mines holes show problems with
accurately identifying the depth of mineralisation. SRK has also identified that the error in
depth determination increases with depth and suggest this may be due to incorrect depth
measurements being recorded. The difference in the depth can yield up to 20 m for the
deeper mineralised horizons. It is also clear that Ibar Mines only samples certain intervals.

Piskanja Technical Report – Main Report
SRKES7542 Piskanja NI43-101 Technical Report_2013 (2).docx November 2013
Page 59 of 112
.
Figure 12.1 Comparison of the results for twin drilling between Ibar Mines and Rio Tinto campaigns
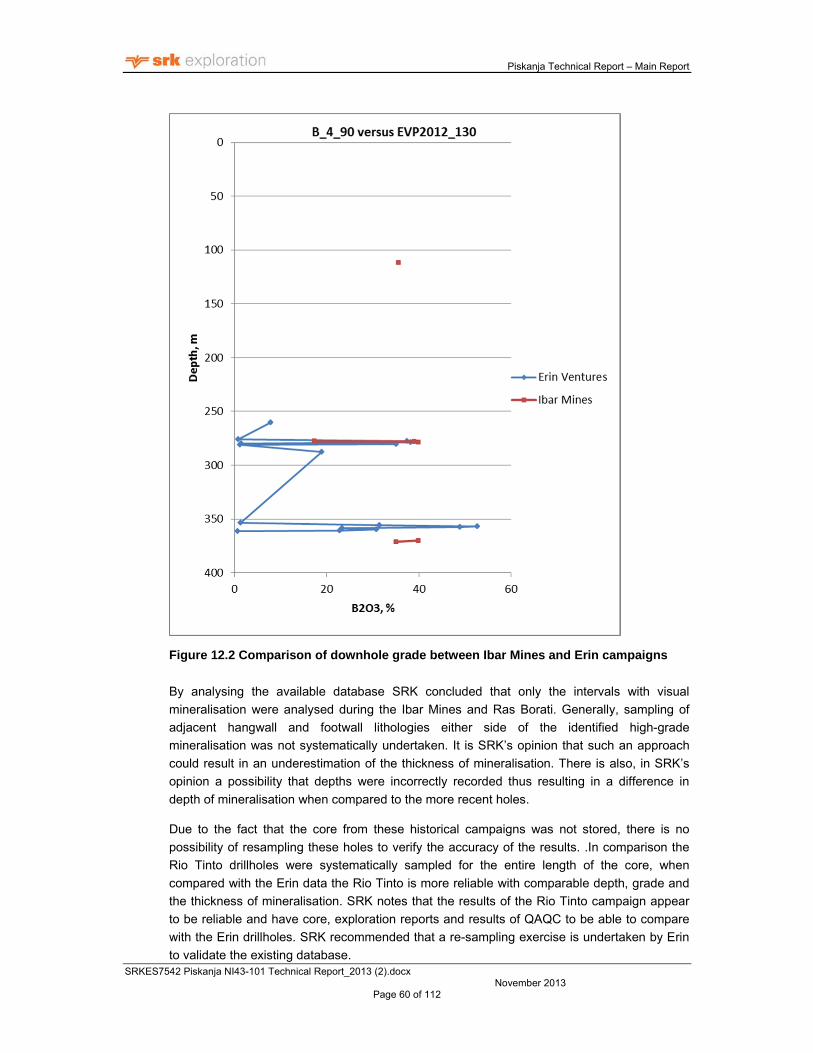
Piskanja Technical Report – Main Report
SRKES7542 Piskanja NI43-101 Technical Report_2013 (2).docx November 2013
Page 60 of 112
Figure 12.2 Comparison of downhole grade between Ibar Mines and Erin campaigns
By analysing the available database SRK concluded that only the intervals with visual
mineralisation were analysed during the Ibar Mines and Ras Borati. Generally, sampling of
adjacent hangwall and footwall lithologies either side of the identified high-grade
mineralisation was not systematically undertaken. It is SRK’s opinion that such an approach
could result in an underestimation of the thickness of mineralisation. There is also, in SRK’s
opinion a possibility that depths were incorrectly recorded thus resulting in a difference in
depth of mineralisation when compared to the more recent holes.
Due to the fact that the core from these historical campaigns was not stored, there is no
possibility of resampling these holes to verify the accuracy of the results. .In comparison the
Rio Tinto drillholes were systematically sampled for the entire length of the core, when
compared with the Erin data the Rio Tinto is more reliable with comparable depth, grade and
the thickness of mineralisation. SRK notes that the results of the Rio Tinto campaign appear
to be reliable and have core, exploration reports and results of QAQC to be able to compare
with the Erin drillholes. SRK recommended that a re-sampling exercise is undertaken by Erin
to validate the existing database.

Piskanja Technical Report – Main Report
SRKES7542 Piskanja NI43-101 Technical Report_2013 (2).docx November 2013
Page 61 of 112
From their work, SRK suggest that the comparison of the results of the 1988 and 1997 (Ibar
Mines and Ras Borati) drilling campaigns are not suitable for use in the construction of the
geological modelling and resulting MRE,, therefore all the drillholes from these stated
campaigns were excluded from the SRK MRE database.
Sampling and Assay 12.3During SRK’s observations from the data sent prior to the site visit and during the site visit it
became apparent that the Erin drillholes were not being systematically sampled. Sampling by
Erin was being carried out within the intervals where mineralisation was observed and logged.
SRK noted that sampling was not always conducted in the footwall and hanging wall of each
mineralised unit, nor were all dilutions and intercalations within mineralised horizons.
During the site visit SRK undertook visual verification of the geology and sampling logs.
Based on this analysis, SRK highlighted certain intervals to Erin and suggested that these
were essential for understanding the grade continuity better and for SRK to make a detailed
interpretation of the mineralisation; SRK recommended to Erin that further sampling and
analysis should be undertaken on the following intervals;
hangingwall and footwall host rock intervals adjacent to logged borate mineralisation,
internal dilution intervals,
low grade mineralisation intervals.
Upon SRK’s request, Erin sent 286 selected samples for sample preparation and analysis
using Erin’s approach; aqua regia ICP-MS for all samples and volumetric titration for
mineralised intervals. Of these 286 analysed with aqua regia ICP-MS, seven samples showed
a grade in excess of 5% B2O3. From this, SRK concludes that the Company’s selection of
mineralised samples is quite robust however; care should be paid to the intervals adjacent to
the mineralisation intersections.
The fact that the samples have been analysed using differing analytical analysis methods
over time did however show varying precision in detection of B2O3 grade. The proportion of
the samples which were used in the MRE and analysed by the less suitable aqua regia ICP-
MS method constitute only 10% of the MRE database and SRK are of the opinion that this
has minimum influence on the estimate overall.
12.3.1 QAQC As detailed in the previous section (Section 11), Erin has conducted QA/QC checks with a
regular system of CRM’s, duplicates and blanks being inserted into the sample stream. SRK’s
validation checks of this QAQC material suggest that the CRM’s are broadly within acceptable
reporting limits, the duplicate field samples show a strong correlation to the original sample,
and blank samples were reported as showing a low B2O3 content.
Database 12.4The database provided to SRK by the Client was in a Microsoft Access database format. The
database contained the information on collar coordinates, downhole deviation data and assay
data for 79 drillholes totalling 27,628 meters. Not all of the drillholes in the database contained
assay information; four drillholes drilled in the 1980’s and 1990’s by Ibar Mines and Ras Borati
were undertaken for sterilisation purposes at the flanks of the deposit and are missing assay

Piskanja Technical Report – Main Report
SRKES7542 Piskanja NI43-101 Technical Report_2013 (2).docx November 2013
Page 62 of 112
data. As SRK has decided not to use the drilling data from the the Ibar Mines and Ras Borati
campaigns this is not considered material. Based upon a detailed review of the core available
from Rio Tinto and existing analytical results SRK found that the data from the holes drilled by
Rio Tinto to be reliable and appropriate for the inclusion in geological modelling and the MRE.
The final MRE database included 53 drillholes, with a total length of 19,554.0 m, containing
full information on collar position, survey, samples data and lithological data. From these
holes, the assay information is available for 1,473 samples with a total sampled length of
6,211.68 m. The data includes all Erin assays, comprising 224 samples analysed by the
volumetric titration method, 544 samples analysed through the AR ICP-MS methodology and
includes 705 historical assays from the Rio Tinto drilling campaigns.
SRK has validated 10% of the data used in the MRE selecting 5 holes from the database at
random and checking their records against the original logs and assay results sent by the
laboratory. Of the 168 assays from these holes, 14% were found to have incorrect B2O3
grades, mostly resulting from a transcription error and lack of conversion from assayed
elemental B grade to equivalent B2O3 grade. These errors are predominantly in the low grade
samples assayed by AR ICP-MS. SRK does not consider these errors to be material to the
MRE, though recommends that full validation of the drilling database is conducted for future
MRE updates.
Geological reports detailing the drilling procedures employed and information on the
lithological logs is only available for the 2006 to 2007 period (Rio Tinto) and the 2011 to 2012
period (Erin).

Piskanja Technical Report – Main Report
SRKES7542 Piskanja NI43-101 Technical Report_2013 (2).docx November 2013
Page 63 of 112
13 MINERAL PROCESSING AND METALLURGICAL TESTING Colemanite, the principal borate mineral found in the Piskanja deposit, is not water soluble
like other borate minerals such as borax and kernite, but does readily dissolves in sulphuric
acid. To process borate mineralisation of this type will initially require ore to be crushed,
ground and dissolved in sufficient sulphuric acid. The insoluble clays, sands and other
impurities will then be removed from the aqueous stream using a series of rake classifiers,
settling tanks, thickeners and filtration. The solution is then crystallised to recover high grade
boric acid, (H3BO3).
Magnetic and Electrostatic Separation 13.1In December 2012, SGS Mineral Services UK Ltd laboratory (SGS UK) conducted magnetic
separation and High Tension Electrostatic (HTE) separation testing on composite samples
from the Piskanja Project to determine if the B2O3 head grade of this material could be
increased. SGS UK used material which was sent to them from SGS Beograd. SGS Beograd
provided a 25.25 kg bulk sample of material from the Piskanja borate mineralisation which
had been composited from 272 selected intervals across 16 of the first 18 holes drilled by Erin
in 2012. Erin selected intervals that ranged from 4cm to 35 cm and were taken only from
mineralised intersections. The bulk sample was crushed by SGS UK with 100% passing
1mm. A 5kg was split was taken for magnetic separation and a 3kg split for High Tension
Electrostatic (HTE) separation. The back calculated head grade of this sample was 9.22% B
(29.68% B2O3) and 0.42% Fe. The SGS UK test report does not state what analytical method
was used to determine B content of the samples.
The magnetic separation testing involved a full magnetic profile using an Eriez® LOG1.4 Disc
Magnet at increasing magnetic intensities. Results showed that there was no obvious
improvement in the separation of iron from the samples to produce an upgraded product. Only
23.12% of the contained iron was removed as the magnetic intensities increased, however
the concentrate produced still contained a grade of 0.32% Fe.
The HTE separation used an Eriez® Model ES-14-01S Laboratory Electrostatic Separator.
This method indicated a visual separation of darker conductive minerals and upgraded the
non-conductive portion and partially conductive fractions to ~10% B, though may have been
more successful if there had been further sizing of the feed.
In conjunction with the magnetic profile some of the remaining feed from the HTE separation
was screened at 150μm (SGS UK did not specify the quantity of material in their report). The
>150μm was then subjected to separation by dry high intensity magnetic separation (HIMS)
using a 300mm diameter Eriez® Rare Earth Permanent Magnetic Roll Separator with fixed
intensity (1.1 Tesla). This method allows the disc magnet to “lift” the magnetic particles away
from the non-magnetic particles in the feed, whilst the HIMS magnet uses both gravity and
magnetics to separate the minerals. .This was done to ascertain whether this technique could
be successfully applied to concentrate borates. The testwork showed that using the HIMS
method provided a much better separation of the material. Iron was separated out to the
magnetic fraction, tresulting in the iron grade in the non-magnetic fraction decreasing to
0.09% Fe, (compared to the head grade of 0.4% Fe). In contrast the boron grade increased
from 9.2% B to 10.2% B.

Piskanja Technical Report – Main Report
SRKES7542 Piskanja NI43-101 Technical Report_2013 (2).docx November 2013
Page 64 of 112
Although the magnetic separation and HTE testing indicated a small increase in borate grade
of the concentrate, SGS recommended that further testing should be carried out to investigate
the upgrading of the borate product using magnetic and electrostatic methods. This includes;
Testing of the rare earth magnet roll on a feed screened to 53 μm to maximise Fe
rejection to the magnetic fraction;
Investigation of the electrostatic separation at three of four size fractions to maximise
the effect, and;
Evaluate the use of both methods in combination to maximise overall recovery and
upgrading of the borate product.
Boric Acid Circuit Testing 13.2Some of Erin’s potential strategic partners have completed limited test work on the use of high
grade borate material from the Jarandol Basin in a boric acid leaching circuit. One potential
partner accepted a 200kg bulk sample of borate mineralisation from the Pobrdje mine, 2km
from the Piskanja deposit as they were satisfied of the similarity of ore type, and the other
~50kg from the Piskanja deposit. The results of these tests showed that high grade borate
mineralisation (~40% B2O3) from the Jarandol Basin could be successfully upgraded to a
boric acid product suitable for those potential partner’s needs.
SRK Recommendations 13.3Initial test work shows that the Piskanja borate mineralisation is amenable to production of
boric acid, however SRK recommends that further testing be conducted on Run of Mine
material that has a lower B2O3 grade. This will be needed to determine the specific crushing
size, acid dissolution and filtration parameters needed to produce boric acid and whether
addition steps are needed prior to acid dissolution to remove any deleterious elements.
Accurate definition of any heavy hydrocarbons in the material will require identification and
removal ahead of the acid reaction.
Piskanja Technical Report – Main Report
SRKES7542 Piskanja NI43-101 Technical Report_2013 (2).docx November 2013
Page 65 of 112
14 MINERAL RESOURCE ESTIMATES
Introduction 14.1The Mineral Resource Estimate (MRE) and resulting Mineral Resource Statement presented
herein covers the whole of the Piskanja Project under Exploration Licence #1934 and is
based on recent diamond drilling conducted by Erin and historical drilling.
The database used for the Piskanja MRE was audited by SRK who is of the opinion that the
drilling information provided by the Client is sufficiently reliable to interpret with confidence the
boundaries for boron mineralisation and that the assay data are sufficiently reliable to support
an MRE to be undertaken and reported in conformity within the generally accepted guidelines
of the Canadian Institute of Mining (CIM) “Estimation of Mineral Resources and Mineral
Reserves Best Practice Guidelines”. The abbreviation of MRE in this report is reserved only
for a Mineral Resource Estimate which is reported in conformity with generally accepted CIM
“Estimation of Mineral Resources and Mineral Reserves Best Practice Guidelines.
SRK are aware that the Client has undertaken their own mineral resource estimation in order
to meet with the rules of the Serbian Government and their licence agreement. This mineral
resource estimate was undertaken in 2013 and SRK understand that it has been reported
within Serbian Guidelines for reporting mineral resource estimates although it has not been
reported in conformity within the generally accepted guidelines of the Canadian Institute of
Mining (CIM) “Estimation of Mineral Resources and Mineral Reserves Best Practice
Guidelines”. SRK has not verified this work and it is therefore not discussed as part of this
report. Only the MRE undertaken by SRK has been reported herein.
This section of the report (Section 14) describes the MRE methodology and summarises the
key assumptions made by SRK.
Deposit modelling 14.2This section presents the results of the statistical studies undertaken on all the available
assay data to determine their suitability for the estimation process and to derive appropriate
estimation zones.
14.2.1 Available Data The drilling database supplied by the Client to SRK contained the data obtained during four
different drilling campaigns spanning from 1989 to 2012, see Table 14.1. As previously
mentioned in Section 12 of this report, the drilling database was supplied to SRK by the
Client. Geological reports detailing the drilling procedures used and information on the
lithological logs, assay and QAQC are only available for the 2006 to 2007 period (Rio Tinto)
and the 2011 to 2012 period (Erin). Erin is in possession of the Rio Tinto core which is
securely stored on- site. There is no available core or reports detailing the exploration data
and quality of the data for the 1980s and 1990s campaigns. There is also no QAQC data is
available for the drilling and sampling completed during this period.

Piskanja Technical Report – Main Report
SRKES7542 Piskanja NI43-101 Technical Report_2013 (2).docx November 2013
Page 66 of 112
Table 14.1 Summary of Drilling Phases.
Period of Drilling Exploration Company Type of drilling
1989 Ibar Mines Diamond
1997 Ras Borati RC
2006 to 2007 Rio Tinto Diamond
2011 to 2012 Erin. Diamond
The database was provided to SRK by the Client in a Microsoft Access database format. The
database contained the information on collar coordinates, downhole deviation data and assay
data for all the drillholes.
The database includes data for 79 drillholes totalling 27,628 meters. Not all of the historical
drillholes contained assay information; four drillholes drilled in the 1980’s and 1990’s were
undertaken for sterilisation purposes at the flanks of the deposit and are missing assay data.
A total of 660 samples with an average sample length 1.1 m for a total length of 694 m has
been collected from the holes drilled during Erin’s 2011-2012 campaign. During the Rio Tinto
campaign (2006- 2007) a total of 705 samples were collected from the total length of 5331 m
of core. Rio Tinto sampled the entire recovered core with the average sampling interval for
mineralised intersection of 2 m and 45 m for the barren hosting rock.
SRK’s analysis of drillhole data from the 1989 and 1997 campaigns suggest that the assays
might have been carried out only from intervals where mineralisation was visually observed
and samples in the hanging wall or footwall of the mineralised horizon were not taken.
14.2.2 Data included in the Model The data verification carried out by SRK and discussed in Section 12 shows that the results of
the 1988 and 1997 (Ibar Mines and Ras Borati) drilling campaigns are not suitable for use in
the construction of the geological modelling and resulting MRE,, therefore all the drillholes
from these stated campaigns were excluded from the SRK MRE database.
The list of the excluded drillholes is given in Table 14.2.
The final MRE database included 53 drillholes, with a total length of 19,554 m, containing full
information on collar position, survey, samples data and lithological data. From these holes,
the assay information is available for 1,473 samples with a total sampled length of
6,211.68 m. The data includes all Erin assays, comprising 224 samples analysed by the
volumetric titration method, 544 samples analysed through the AR ICP-MS methodology and
includes 705 historical assays from the Rio Tinto drilling campaigns.

Piskanja Technical Report – Main Report
SRKES7542 Piskanja NI43-101 Technical Report_2013 (2).docx November 2013
Page 67 of 112
Table 14.2 Drill holes removed from the database
HOLE-ID X Y Z Total
depth, m Drilling type
Company
Name
B_2_89 7471758.2 4804091.2 412.7 362.0 Diamond IbarMines
B_3_90 7471716.1 4803894.2 419.5 438.0 Diamond IbarMines
B_4_90 7471809.4 4803993.3 420.7 390.0 Diamond IbarMines
B_5_90 7471614.3 4803976.7 410.7 454.0 Diamond IbarMines
B_6_90 7471954.6 4804181.2 421.0 272.0 Diamond IbarMines
B_7_90 7472421.1 4804020.6 482.0 386.0 Diamond IbarMines
B_8_91 7472102.3 4803993.2 452.5 345.0 Diamond IbarMines
B_9_91 7472172.8 4804208.2 435.9 246.0 Diamond IbarMines
B_B_91 7472097.0 4804302.0 426.0 208.0 Diamond IbarMines
B_12_91 7472173.5 4804400.5 426.1 294.0 Diamond IbarMines
B_13_91 7471984.2 4804355.5 418.0 320.0 Diamond IbarMines
B_14_91 7472203.5 4804591.2 411.8 250.0 Diamond IbarMines
B_15_91 7472562.5 4804213.2 463.8 250.0 Diamond IbarMines
B_16_91 7472558.6 4804018.0 505.6 303.0 Diamond IbarMines
B_17_92 7471783.8 4804359.9 409.7 342.0 Diamond IbarMines
B_18_92 7472507.5 4804426.6 448.1 250.0 Diamond IbarMines
B_19_92 7472057.3 4803813.6 455.1 293.0 Diamond IbarMines
B_20_92 7472366.9 4803831.7 503.8 277.0 Diamond IbarMines
B_29_97 7471971.8 4804273.9 419.9 320.0 RC IbarMines
B_36_97 7472194.7 4804299.5 434.1 266.0 RC Ras Borati
B_40_97 7472283.4 4804304.1 436.0 293.0 RC Ras Borati
B_41_97 7472272.0 4804110.0 462.5 340.0 RC Ras Borati
B_8_97 7471870.5 4804177.5 416.4 323.0 RC Ras Borati
B_9_97 7472067.6 4804193.3 428.0 268.0 RC Ras Borati
B_10_97 7472261.6 4804213.8 445.6 286.0 RC Ras Borati
B_16_97 7472317.0 4804024.0 477.5 298.0 RC IbarMines
Figure 14-1 and Figure 14-2 show a histogram and probability plot of all raw B2O3 assays in
the assay database being utilised in the MRE (for all 53 drillholes). As shown, the main
population of data has an approximate mean grade of 42% B2O3 with the background
mineralisation break being at approximately 5% B2O3.

Piskanja Technical Report – Main Report
SRKES7542 Piskanja NI43-101 Technical Report_2013 (2).docx November 2013 Page 68 of 112
Figure 14-1Histogram of raw Assays Figure 14-2 Probability plot of raw Assays

Piskanja Technical Report – Main Report
SRKES7542 Piskanja NI43-101 Technical Report_2013 (2).docx November 2013
Page 69 of 112
14.2.3 Mineralisation Zone Modelling Initially, the drillhole data was used in combination with a series of existing georeferenced
geological plans and cross sections that were provided by Erin geologists and shown in
Figure 14-3. The final mineralised domain wireframes created by SRK were based on
lithology logs, assay results and knowledge of the relationship between adjacent mineralised
zones. This interpretation utilised both the modern drilling completed by Erin and some of the
historical drillholes completed by Rio Tinto.
From the statistical analysis undertaken on the raw data, SRK applied the following guidelines
to the mineralisation domaining:
All the B analysed by aqua regia ICP-MS was converted to B2O3 using the equation,
B2O3 (%) = B (%) * 3.2199;
Grade cut off of 5.0% B203;
A Minimum thickness of the mineralised interval of 0.5 m; and
A Maximum thickness of barren rock interburden of 1.0 m.
Figure 14-3 3D view of Geological Cross-sections and along strike Cross-sections (Leapfrog, view along the azimuth 149)
Grade distribution was assessed in Leapfrog software using a structural trend determined
from the cross sections and through a statistical analysis that showed that a cut off of 5%
B2O3 provided continuous zones of mineralisation. To maintain continuity to the
mineralisation, it was required on occasion to include non-mineralised intersections, up to a
maximum thickness of 1 m. Figure 14-4 shows leapfrog shells generated at 5% and 10%
B2O3, with greater continuity to the mineralised shell being clear when applying a cut off to 5%
B2O3. SRK does however acknowledge that lower grade intervals have been included with the
modelled zones to maintain continuity.

Piskanja Technical Report – Main Report
SRKES7542 Piskanja NI43-101 Technical Report_2013 (2).docx November 2013
Page 70 of 112
To create the final domain wireframes, shown in Figure 14-5, SRK combined the
mineralisation shell with the lithological hanging wall and footwall surfaces. The resulting 3D
mineralised zone wireframes were reviewed by SRK geological staff and subsequently
amended (where required) and approved as providing an appropriate representation of the
mineralisation.
Figure 14-4 Shells that correspond to 5% B2O3 grade cut-off (blue) and 10% B2O3 grade cut-off (green) (Leapfrog, view along the azimuth 159)
Figure 14-5 General view of the mineralisation zones of Piskanja (Leapfrog, view along the azimuth 143, dip 31)

Piskanja Technical Report – Main Report
SRKES7542 Piskanja NI43-101 Technical Report_2013 (2).docx November 2013
Page 71 of 112
In total, SRK modelled 10 mineralisation zones with Zone 1 being the basal zone and Zone 10
being the uppermost zone. The mineralised units dip to the southeast at an angle of
approximately 18º. Table 14.3 summarises the key parameters for the individual zones
including the average thickness, average B2O3 grade and volume.
The average thickness of the mineralised zones ranges from 0.3 to 22.3 m, with an overall
average thickness of 2.9 m. The average B2O3 grade is 30.4% for all the mineralised zones
with a total volume of 5.37 Mm3. As shown, 72% of the volume is located within Zones 1, 2
and 3.
Table 14.3 Summary of mineralised zone properties
ZONE Thickness, m Grade B2O3, % Volume, m³
Min Max Average Min Max Average
1 0.5 9.3 4.8 15 50.2 32.9 2 010 900
2 1 15.0 3.4 2.8 55.1 31.4 762 750
3 0.4 22.3 5.1 0.8 48.1 32.4 1 077 000
4 0.5 15.1 4.3 31 50.4 38.5 271 120
5 0.3 1.8 1.0 6.4 41.5 28.3 86 589
6 0.4 15.6 2.5 5.7 45.1 16.1 685 600
7 1.1 8.7 3.7 7.3 28.8 18.6 212 200
8 0.6 2.3 1.6 9.8 32.1 18.4 76 211
9 0.6 2.7 1.6 17.7 53.1 32 129 540
10 0.5 3.0 1.6 10.7 23.9 16.4 59 866
TOTAL 0.3 22.3 2.9 0.8 55.1 30.4 5 371 776
14.2.4 Tectonic model As part of the modelling process, SRK analysed the Piskanja tectonic model presented by
Erin’s geologists in the geological cross-sections and maps provided by the Company. The
3D analysis of the given interpretation of the fault network did reveal some inconsistency
between section of the fault position and orientation for several main structures. SRK found it
to be difficult to construct a 3D model based on the proposed interpretation.
Also in order to check the interpretation SRK carried out a visual check of all the core photos
obtained during the 2011-2012 drilling programme.
The results of analysis showed that the majority of the crushed zones observed in the core
(which may often be associated with the faults) are filled by sandy-clay material and are at a
70-80° angle to the core axis, exhibiting a shallow dip. Some subvertical crush zones were
observed in the core, but they are far less common and often presented by joints filled with
clayey material less than 5-10 mm thick. The abovementioned facts do not correspond to
either the amount of, or the occurrence of the tectonic elements shown in the cross-sections
and maps provided by the Company.
SRK assumes that certain tectonic movements could have occurred within the deposit
however, does not expect large amplitude movement along these faults. The existing drilling
grid is not sufficient for the purpose of constructing a robust tectonic model of the deposit.

Piskanja Technical Report – Main Report
SRKES7542 Piskanja NI43-101 Technical Report_2013 (2).docx November 2013
Page 72 of 112
Therefore at this stage of modelling it was decided not to use any tectonic model and to
interpret all the mineralised zones as consistent bodies with slightly varying dip.
Compositing 14.3Data compositing is undertaken to reduce the inherent variability that exists within the
population and to generate samples more appropriate to the scale of the mining operation
envisaged. It is also necessary for the estimation process, as all samples are assumed to be
of equal weighting, and should therefore be of equal length.
SRK analysed the average length of the drillhole samples in order to determine appropriate
composite length. The histogram presented in Figure 14-6 shows that the majority of assay
intervals are 1.0m.
Figure 14-6 Ordinary sample length distribution histogram
14.3.1 Composite Length Analysis The estimation process assumes an equivalent weighting per composite. It is therefore
necessary to discard or ignore remnant composites that are generated in the downhole
compositing process and to avoid a bias in the estimation.
SRK tested a minimum composite length of 0.5 m and a maximum composite length of 2 m.
Table 14.4 shows the summary statistics for the composite lengths evaluated. Given the
similarities observed in the mean grades of the various composite lengths tested, a 1 m
composite length was selected. Additionally, it was decided that all samples less than 0.5 m
should be discarded from the composite drillhole file and should not be used in the grade
interpolation, therefore the minimum sample length included in the estimate constitutes 50%
of the composite length.

Piskanja Technical Report – Main Report
SRKES7542 Piskanja NI43-101 Technical Report_2013 (2).docx November 2013
Page 73 of 112
Table 14.4 Summary statistics of raw samples versus composite samples
Variable B2O3, % Raw
Samples
COMPOSITE LENGTH
0.5 m 0.8 m 1.0 m 2.0 m
Number of samples 537 1153 743 606 519
Minimum value 0.1 0.1 0.1 0.1 0.1
Maximum value 67.3 65.4 64.2 65.4 64.0
Mean 29.5 28.9 28.7 28.7 28.7
Coefficient of variation 0.5 0.6 0.5 0.5 0.5
14.3.2 Composite Domain Statistics Table 14.5 summarises the 1 m composite domain statistics for B2O3 within the mineralised
zones. Figure 14-7shows the normal and log-normal histograms for the mineralised zones.
The summary statistics show that the coefficient of variation (CoV) for most of the zones is
generally low (i.e. <1.0), which indicates a reasonably low degree of variability within each
domain. However, it is clear that the mineralised zones show a scattered population, being
neither normal nor log-normal in distribution. This is in part due to the inclusion of low grade
intervals to improve the grade continuity and the cut off of 5% B2O3 being used. From a
geological perspective, the scattered populations could be explained by the existence of vein-
type and massive mineralisation.
SRK investigated the possibility of generating separate high grade domains but found this
problematic due to the erratic distribution.

Piskanja Technical Report – Main Report
SRKES7542 Piskanja NI43-101 Technical Report_2013 (2).docx November 2013 Page 74 of 112
Table 14.5 Summary Statistics per mineralisation zone (1m composites)
Mineralised Zone
Composites 1.0 m
1 2 3 4 5 6 7 8 9 10
Variable B2O3 % B2O3% B2O3, % B2O3, % B2O3, % B2O3, % B2O3, % B2O3, % B2O3, % B2O3, %
Number of drillholes
37 21 25 9 8 26 5 5 3 4
Number of samples
175 72 133 46 8 73 21 8 8 8
Minimum value 0.3 0.3 0.1 0.1 6.4 0.8 4.8 5.5 8.8 10.7
Maximum value 55.7 60.6 52.9 52.5 40.8 44.8 39.9 29.8 48.8 23.9
Mean 32.9 30.8 32.3 36.3 26.4 15.6 16.9 18.0 26.7 16.6
Median 35.8 36.8 39.9 40.3 27.3 11.6 10.3 12.8 25.5 14.3
Geometric Mean 27.7 23.9 26.1 29.5 21.5 12.1 13.4 15.8 21.7 16.0
Variance 195.1 227.4 209.4 190.9 168.9 136.8 135.7 69.2 235.7 21.0
Standard Deviation
14.0 15.1 14.5 13.8 13.0 11.7 11.6 8.3 15.4 4.6
Coefficient of variation
0.4 0.5 0.4 0.4 0.5 0.8 0.7 0.5 0.6 0.3
Skewness -0.6 -0.6 -0.7 -0.9 -0.6 1.4 0.8 0.1 0.2 0.1
Kurtosis -0.8 -1.0 -0.9 0.0 -1.3 0.7 -0.8 -1.4 -1.5 -1.4

Piskanja Technical Report – Main Report
SRKES7542 Piskanja NI43-101 Technical Report_2013 (2).docx November 2013
Page 75 of 112
Mineralisation Zone 1
Normal Distribution Lognormal Distribution
Mineralisation Zone 2
Normal Distribution Lognormal Distribution
Mineralisation Zone 3
Normal Distribution Lognormal Distribution
Mineralisation Zone 4
Normal Distribution Lognormal Distribution

Piskanja Technical Report – Main Report
SRKES7542 Piskanja NI43-101 Technical Report_2013 (2).docx November 2013
Page 76 of 112
Mineralisation Zone 6
Normal Distribution Lognormal Distribution
Figure 14-7 Normal (left side) and log-normal (right side) B2O3 histograms for major mineralised zones
14.3.3 Evaluation for Outliers No grade capping was applied to the drillhole database as it was not considered necessary
following the statistical study.
14.3.4 Density Analysis Based on the density data for the mineralised zones and host rocks obtained by Erin, SRK
assigned the value of 2.287 t/m3 to all the blocks inside the mineralised zones and 2.48 t/m3
to the host rocks in accordance with Table 10.3 given in Section 10.1of this report.
14.3.5 Core Recovery Section 10 states that the core recovery for the Erin campaign exceeded 90%. The
information on the core recovery for the Rio Tinto holes was not provided. However the visual
inspection of the cut core available on site did show that the core recovery was similar to the
Erin campaign and exceeded 90%.
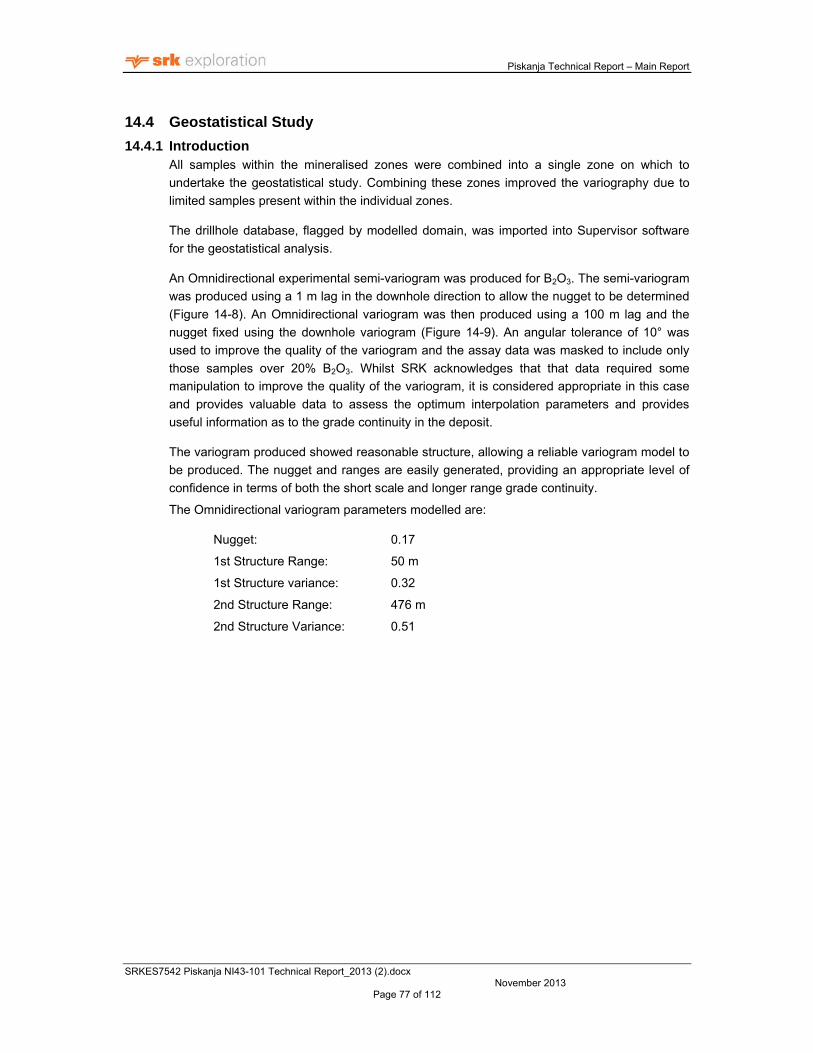
Piskanja Technical Report – Main Report
SRKES7542 Piskanja NI43-101 Technical Report_2013 (2).docx November 2013
Page 77 of 112
Geostatistical Study 14.4
14.4.1 Introduction All samples within the mineralised zones were combined into a single zone on which to
undertake the geostatistical study. Combining these zones improved the variography due to
limited samples present within the individual zones.
The drillhole database, flagged by modelled domain, was imported into Supervisor software
for the geostatistical analysis.
An Omnidirectional experimental semi-variogram was produced for B2O3. The semi-variogram
was produced using a 1 m lag in the downhole direction to allow the nugget to be determined
(Figure 14-8). An Omnidirectional variogram was then produced using a 100 m lag and the
nugget fixed using the downhole variogram (Figure 14-9). An angular tolerance of 10° was
used to improve the quality of the variogram and the assay data was masked to include only
those samples over 20% B2O3. Whilst SRK acknowledges that that data required some
manipulation to improve the quality of the variogram, it is considered appropriate in this case
and provides valuable data to assess the optimum interpolation parameters and provides
useful information as to the grade continuity in the deposit.
The variogram produced showed reasonable structure, allowing a reliable variogram model to
be produced. The nugget and ranges are easily generated, providing an appropriate level of
confidence in terms of both the short scale and longer range grade continuity.
The Omnidirectional variogram parameters modelled are:
Nugget: 0.17
1st Structure Range: 50 m
1st Structure variance: 0.32
2nd Structure Range: 476 m
2nd Structure Variance: 0.51

Piskanja Technical Report – Main Report
SRKES7542 Piskanja NI43-101 Technical Report_2013 (2).docx November 2013
Page 78 of 112
Figure 14-8 Piskanja B2O3 downhole Semi-variogram
Figure 14-9 Piskanja B2O3 Omni directional Semi-variogram
The results of the variography are used in the interpolation to assign the appropriate
weighting to the sample pairs utilised to calculate the block model grade.
The total ranges modelled are also incorporated to help define the optimum search
parameters and the search ellipse radii dimensions used in the interpolation. Ideally, sample

Piskanja Technical Report – Main Report
SRKES7542 Piskanja NI43-101 Technical Report_2013 (2).docx November 2013
Page 79 of 112
pairs that fall within the range of the variogram (where a strong covariance exists between the
sample pairs) should be utilised if the data allows.
SRK has applied a two thirds rule to the total range of the variogram for determining the
search ellipse radii dimensions thus forcing the interpolation to use samples where covariance
between samples exists. Table 14.6 shows the B2O3 range with a two thirds rule applied.
Table 14.6 B2O3 range by Zone with the two thirds Rule Applied
Zone 2/3rd of Total Range (m)
Y X Z
All 300 300 12
14.4.2 Quantitative Kriging Neighbourhood Analysis (QKNA) In addition to the above and to better define the ideal search parameters used in the
interpolation, Quantitative Kriging Neighbourhood Analysis (“QKNA”) was undertaken on the
data set.
QKNA, as presented by Vann et al (2003), is used to refine the search parameters in the
interpolation process to help ensure ‘conditional unbiasedness’ in the resulting estimates.
‘Conditional unbiasedness’ is defined by David (1977) as “…on average, all blocks Z which
are estimated to have a grade equal to Zo will have that grade”. The criteria considered when
evaluating a search area through QKNA, in order of priority, are (Vann et al 2003):
the slope of regression of the ‘true’ block grade on the ‘estimated’ block grade;
the weight of the mean for a simple kriging;
the distribution of kriging weights, and proportion of negative weights; and
the kriging variance.
Under the assumption that the variogram is valid, and the regression is linear, the regression
between the ‘true’ and ‘estimated’ blocks can be calculated. The actual scatter plot can never
be demonstrated, as the ‘true’ grades are never known, but the covariance between ‘true’ and
‘estimated’ blocks can be calculated. The slope of regression should be as close to one as
possible, implying conditional unbiasedness. If the slope of regression equals one, the
estimated block grade will approximately equate to the unknown ‘true’ block grades (Vann et
al 2003).
During Ordinary Kriging (“OK”), the sum of the kriging weights is equal to one. When Simple
Kriging (“SK”) is used, the sum of kriging weights is not constrained to add up to one, with the
remaining kriging weight being allocated to the mean grade of the input data. Therefore, not
only the data within the search area is used to krige the block grade, but the mean grade of
the input data also influences the final block grade. The kriging weight assigned to the input
data mean grade is termed “the weight of the mean”. The weight of the mean of a SK is a
good indication of the search area as it shows the influence of the Screen Effect. A sample is
‘screened’ if another sample lies between it and the point being estimated, causing the weight
of the screened sample to be reduced. The Screen Effect is stronger when there are high
levels of continuity denoted by the variogram. A high nugget effect (low continuity) will allow
weights to be spread far from a block in order to reduce bias (Vann et al 2003).

Piskanja Technical Report – Main Report
SRKES7542 Piskanja NI43-101 Technical Report_2013 (2).docx November 2013
Page 80 of 112
The weight of the mean for a SK demonstrates the strength of the Screen Effect the larger the
weight of the mean, the weaker the Screen Effect will be. The general rule is that the weight
of the mean should be as close to zero as possible. QKNA is a balancing act between
maximising the slope of regression, and minimising the weight of the mean for a SK (Vann et
al 2003). The margins of an optimised search will contain samples with very small or slightly
negative weights. Visual checks of the search area should be made in order to verify this.
The proportion of negative weights in the search area should be less than 5% (Vann et al
2003).
QKNA provides a useful technique that uses mathematically sound tools to optimise a search
area. It is an invaluable step in determining the correct search area for any estimation or
simulation exercise.
Interpolation Parameters
Multiple neighbourhood scenarios were run on the zones (search distances, number of
samples, etc) with the scenarios being tested by running the estimation in Datamine Studio 3
software on the specific zones modelled and by utilisation of the ‘KNA’ function in the
Supervisor geostatistical software package. All zones used a search ellipse generated from
the results of the variography. The number of blocks filled in the neighbourhood run was
checked to ensure that an adequate number of blocks were filled ensuring that meaningful
results were generated.
The QKNA process was run to generate the slope of regression results using the chosen
search parameters.
Table 14.7shows the final search ellipse dimensions and sample numbers used for the first
pass interpolation, that were selected based on the QKNA studies. Traditional dips and dip
directions of the ellipse are not shown due to the use of dynamic anisotropy in the
interpolation.
Table 14.7 Post QKNA Interpolation Parameters
Zone Ellipse Ranges Max Samples
per drillhole Min
Samples Max
Samples Y X Z
Mineralised bodies 300 300 12 4 8 20
Figure 14-10 shows the probability plot of the slope of regression results within the Piskanja
deposit model using the interpolation parameters selected. As shown, a proportion of the
estimated blocks show a slope of regression value in excess of approximately 0.95 with a
gradual decrease in slope. These areas above 0.95 represent areas of the estimated block
model where the data is of a sufficient spacing to provide a reasonable level of confidence in
the quality of the estimation results due to the blocks being relatively well informed with
available data.

Piskanja Technical Report – Main Report
SRKES7542 Piskanja NI43-101 Technical Report_2013 (2).docx November 2013
Page 81 of 112
Figure 14-10 Probability Plot of Slope of Regression Values
Figure 14-11 illustrates the slope of regression values for Zone 1 (for ease of viewing)
coloured by the splits identified in the probability plot in Figure 14-10 and in relation to the
Zone 1 drillholes, whereby high slope of regression values are evident in areas of well-
informed data. As the estimated blocks become more distant from the available sample data,
the slope of regression values are seen to decrease. This is due to the lack of sample
support available to the block.
Figure 14-11 Slope of Regression Distribution around Well Informed Blocks at Piskaja, Looking North; Pink > 0.95, Red 0.5 to 0.95, Orange 0.2 to 0.5, Green < 0.2 (SRK, 2013)

Piskanja Technical Report – Main Report
SRKES7542 Piskanja NI43-101 Technical Report_2013 (2).docx November 2013
Page 82 of 112
Mineral Resource Estimation 14.5
14.5.1 Interpolation A single, non-rotated block model was created using block sizes of 25 m (Y) by 25 m (X) by
2 m (Z). Given an average drill spacing of approximately 100 m and the low nugget displayed
in the geostatistical study, this block size was deemed appropriate. Table 14.8 summarises
the block model parameters.
Table 14.8 Block model framework
ORIGIN NUMBER OF BLOCKS BLOCK SIZE (m)
X 7471400 X 60 X 25
Y 4803700 Y 36 Y 25
Z -90 Z 245 Z 2
B2O3 grade was interpolated into the model using OK and the interpolation parameters as
given in Table 14.7 for all domains. Only samples that fall within the given mineralised zone
are used in the interpolation of that particular zone.
14.5.2 Search Ellipse Parameters and Dynamic Anisotropy The search ellipse parameters were determined through the QKNA tests undertaken. The dip
and rotation of the ellipse mirrors the overall dip and strike of the individual domains. That
said, in order to provide a continuous estimation and honour the geological structure and
gentle along strike changes in strike orientation observed, it was decided to use dynamic
anisotropy in the estimation process. Dynamic anisotropy uses angle data generated from the
mineralisation wireframe to assign dip and dip direction to every block in the model. The
search ellipse is rotated upon estimation of the block by honouring the associated dip and dip
direction of that block.
Three estimation runs have been undertaken. The first pass used the parameters determined
through the QKNA testwork. The second run doubled the search ellipse and decreased the
number of samples required for all domains. The final run multiplied the first pass search by
10 and reduced the minimum number of samples required. The final pass was designed to
estimate any blocks not estimated in the first two passes.
Prior to the interpolation, the ellipse was visualised in Datamine Studio 3 with the dip and dip
direction being controlled by the dynamic anisotropy process. The effect of using dynamic
anisotropy on the rotation of the search ellipse is shown in Figure 14-12.
Table 14 9 shows the number of blocks filled during each estimation pass for all mineralised
domains. As shown, a high percentage of blocks in all zones have been estimated in run one,
this being the estimate based on the most appropriate set of estimation parameters and in line
with the results of the geostatistical studies undertaken.
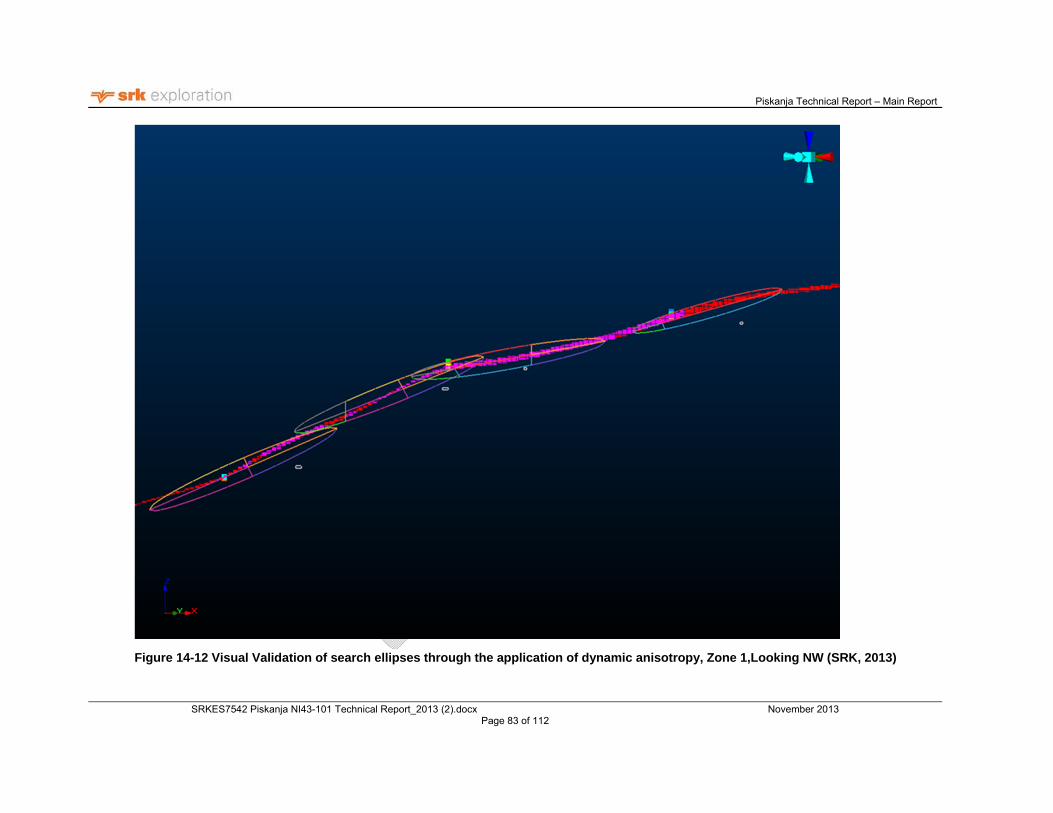
Piskanja Technical Report – Main Report
SRKES7542 Piskanja NI43-101 Technical Report_2013 (2).docx November 2013 Page 83 of 112
Figure 14-12 Visual Validation of search ellipses through the application of dynamic anisotropy, Zone 1,Looking NW (SRK, 2013)

Piskanja Technical Report – Main Report
SRKES7542 Piskanja NI43-101 Technical Report_2013 (2).docx November 2013
Page 84 of 112
Table 14.9 Blocks filled in each estimation run
ZONE Estimation Pass Number of Samples % Blocks Filled Total
1
1 18 96
100% 2 19 4
3 20 0
2
1 17 94
100% 2 16 6
3 20 0
3
1 19 95
100% 2 16 5
3 20 0
4 1 16 89
100% 2 19 11
5 2 7 100
100% 3 8 0
6 1 18 95
100% 2 19 5
7 1 11 99
100% 2 13 1
8 2 7 1 100%
9 2 8 97
100% 3 8 3
10
1 8 96
100% 2 8 3
3 8 1
14.5.3 Grade distribution The grade distribution obtained from the samples data within each mineralisation zone did
show the existence of two populations. This indicates that this population should be separated
by wireframes before modelling. However at this stage the geometrical delineation of the high
and low grades portions is not possible due to the sparse drilling grid.
The interpolation method chosen will smooth the result and will lead into merging of two
populations. This fact is unavoidable at this stage and is only caused by the wide spaced
drilling grid at this stage. This fact is considered during classification of this MRE.
14.5.4 Block Model Validation The block model has been validated using the following techniques:
visual inspection of block grades in plan and section and comparison with drillhole
grades;
comparison of global mean block grades and sample grades within mineralised
domains;
the generation of SWATH plots; and
using an Inverse Distance Weighting estimate to check the grades assigned to the
blocks and the resultant estimate

Piskanja Technical Report – Main Report
SRKES7542 Piskanja NI43-101 Technical Report_2013 (2).docx November 2013
Page 85 of 112
Figure 14-13 shows an example of the visual validation checks and highlights the
correspondence between the block B2O3 grades and the sample B2O3 grades. The image also
shows that dynamic anisotropy has worked effectively with the grade profile following the
general dip of the mineralised zones.
Figure 14-13 Cross section showing visual validation of block grades and sample grades – looking West (SRK, 2013)
Global mean grade comparison
For the interpolated domains, the global block means have been compared with the sample
means as shown in Table 14-10.
Overall, SRK is confident that the interpolated grades are a reasonable reflection of the
available sample data.
Table 14-10 Comparison of block and sample mean grades
Zone Field Composite Mean
Grade (%) Block Mean grade (%)
Difference (absolute)
1 B2O3 32.2 31.7 0.5
2 B2O3 30.8 30.3 0.5
3 B2O3 32.3 32.2 0.1
4 B2O3 36.3 37.3 ‐1.0
5 B2O3 26.4 30.2 ‐3.8
6 B2O3 15.5 18.4 ‐2.9
7 B2O3 16.9 15.4 1.5
8 B2O3 18.0 18.8 ‐0.8
9 B2O3 26.7 26.9 ‐0.2
10 B2O3 16.6 17.1 ‐0.5

Piskanja Technical Report – Main Report
SRKES7542 Piskanja NI43-101 Technical Report_2013 (2).docx November 2013
Page 86 of 112
SWATH Plots
This method comprised the comparison of the input composite samples with the block model
grades within a series of coordinates. The results were then displayed on graphs to check for
visual discrepancies between grades. Figure 14-14 to Figure 14-16 shows the results for the
boron grades interpolated using different methods of interpolation.
Figure 14-14 B2O3 sectional comparison in the X direction
Figure 14-15 B2O3 sectional comparison in the Y direction

Piskanja Technical Report – Main Report
SRKES7542 Piskanja NI43-101 Technical Report_2013 (2).docx November 2013
Page 87 of 112
Figure 14-16 B2O3 sectional comparison in the Z direction
The results of the analysis in general showed satisfactory correlation and acceptable levels of
smoothing using all methods of interpolation. Overall, SRK is satisfied that the current
estimates in this region are representative based on visual comparisons between the samples
and the block model.
IDW estimate
The comparison of the results of interpolation has been performed using different methods of
interpolation. The result is presented in Table 14-11 Comparison of Block OK and Block IDW
Grades
Table 14-11 Comparison of Block OK and Block IDW Grades
Zone Field Block Mean
OK Grade (%) Block Mean IDW
grade (%) Difference (absolute)
1 B2O3 31.7 31.8 -0.1
2 B2O3 30.3 30.4 -0.1
3 B2O3 32.2 32.3 -0.2
4 B2O3 37.3 36.7 0.6
5 B2O3 30.2 30.5 -0.3
6 B2O3 18.4 16.6 1.8
7 B2O3 15.4 16.4 -1.0
8 B2O3 18.8 17.5 1.3
9 B2O3 26.9 27.6 -0.6
10 B2O3 17.1 16.3 0.8

Piskanja Technical Report – Main Report
SRKES7542 Piskanja NI43-101 Technical Report_2013 (2).docx November 2013
Page 88 of 112
Mineral Resource Classification 14.6The definitions given in the following section are taken from the 2005 Canadian Institute of
Mining Standing Committee on Reserve Definitions’ guidelines on Mineral Resources and
Reserves, to comply with NI 43-101.
14.6.1 CIM Definitions
Mineral Resource
Mineral Resources are sub-divided, in order of increasing geological confidence, into Inferred,
Indicated and Measured categories. An Inferred Mineral Resource has a lower level of
confidence than that applied to an Indicated Mineral Resource. An Indicated Mineral
Resource has a higher level of confidence than an Inferred Mineral Resource but has a lower
level of confidence than a Measured Mineral Resource.
A Mineral Resource is a concentration or occurrence of diamonds, natural solid inorganic
material, or natural solid fossilized organic material including base and precious metals, coal,
and industrial minerals in or on the Earth’s crust in such form and quantity and of such a
grade or quality that it has reasonable prospects for economic extraction. The location,
quantity, grade, geological characteristics and continuity of a Mineral Resource are known,
estimated or interpreted from specific geological evidence and knowledge.
The term Mineral Resource covers mineralisation and natural material of intrinsic economic
interest which has been identified and estimated through exploration and sampling and within
which Mineral Reserves may subsequently be defined by the consideration and application of
technical, economic, legal, environmental, socio-economic and governmental factors.
The phrase ‘reasonable prospects for economic extraction’ implies a judgement by the
Qualified Person in respect of the technical and economic factors likely to influence the
prospect of economic extraction. A Mineral Resource is an inventory of mineralisation that
under realistically assumed and justifiable technical and economic conditions might become
economically extractable. These assumptions must be presented explicitly in both public and
technical reports.
Inferred Mineral Resource
An ‘Inferred Mineral Resource’ is that part of a Mineral Resource for which quantity and grade
or quality can be estimated on the basis of geological evidence and limited sampling and
reasonably assumed, but not verified, geological and grade continuity. The estimate is based
on limited information and sampling gathered through appropriate techniques from locations
such as outcrops, trenches, pits, workings and drill holes.
Due to the uncertainty that may be attached to Inferred Mineral Resources, it cannot be
assumed that all or any part of an Inferred Mineral Resource will be upgraded to an Indicated
or Measured Mineral Resource as a result of continued exploration. Confidence in the
estimate is insufficient to allow the meaningful application of technical and economic
parameters or to enable an evaluation of economic viability worthy of public disclosure.
Inferred Mineral Resources must be excluded from estimates forming the basis of feasibility or
other economic studies.

Piskanja Technical Report – Main Report
SRKES7542 Piskanja NI43-101 Technical Report_2013 (2).docx November 2013
Page 89 of 112
Indicated Mineral Resource
An ‘Indicated Mineral Resource’ is that part of a Mineral Resource for which quantity, grade or
quality, densities, shape and physical characteristics can be estimated with a level of
confidence sufficient to allow the appropriate application of technical and economic
parameters, to support mine planning and evaluation of the economic viability of the deposit.
The estimate is based on detailed and reliable exploration and testing information gathered
through appropriate techniques from locations such as outcrops, trenches, pits, workings and
drill holes that are spaced closely enough for geological and grade continuity to be reasonably
assumed.
Mineralisation may be classified as an Indicated Mineral Resource by the Qualified Person
when the nature, quality, quantity and distribution of data are such as to allow confident
interpretation of the geological framework and to reasonably assume the continuity of
mineralisation. The Qualified Person must recognise the importance of the Indicated Mineral
Resource category to the advancement of the feasibility of the project. An Indicated Mineral
Resource estimate is of sufficient quality to support a Preliminary Feasibility Study which can
serve as the basis for major development decisions.
Measured Mineral Resource
A ‘Measured Mineral Resource’ is that part of a Mineral Resource for which quantity, grade or
quality, densities, shape, and physical characteristics are so well established that they can be
estimated with confidence sufficient to allow the appropriate application of technical and
economic parameters, to support production planning and evaluation of the economic viability
of the deposit. The estimate is based on detailed and reliable exploration, sampling
and testing information gathered through appropriate techniques from locations such as
outcrops, trenches, pits, workings and drill holes that are spaced closely enough to confirm
both geological and grade continuity.
Mineralisation or other natural material of economic interest may be classified as a Measured
Mineral Resource by the Qualified Person when the nature, quality, quantity and distribution
of data are such that the tonnage and grade of the mineralisation can be estimated to within
close limits and that variation from the estimate would not significantly affect potential
economic viability. This category requires a high level of confidence in, and understanding of,
the geology and controls of the mineral deposit.
14.6.2 Piskanja Project MRE Classification
Introduction
To classify the Project, the following key indicators were used:
geological complexity;
quality of the data used in the estimation:
o QA/QC data;
o results of the geostatistical analysis, namely the variography and QKNA
results; and
quality of the estimated block model.

Piskanja Technical Report – Main Report
SRKES7542 Piskanja NI43-101 Technical Report_2013 (2).docx November 2013
Page 90 of 112
Geological Complexity
The Project is modelled as numerous bodies of borate mineralisation. In total 10 mineralised
bodies where delineated at different elevation levels. All of the ore bodies are slightly folded
in a similar manner. The ore bodies 1, 2, 3, 4 and 6 show higher continuity and confidence in
interpretation compared to the rest of the bodies in which interpretation is usually based on 4-
5 holes.
Tectonic interpretation has not been performed due to insufficient structural logging data and
the wide spaced drilling grid.
While the orebodies show good continuity at 5% cut-off grade, it should be noted that with an
increase in the cut-off grade the ore bodies become fragmented.
Overall, it appears that the zones identified are of a reasonably high geological complexity
due to the difference of separating the low and high grade populations. As such, and based
on the current level of data supporting the geological model, the associated risk relating to the
geological continuation is considered at a medium level.
It is also noted that the zones may be more affected by faulting than currently considered;
however, this can only be proven through further data collection and a detailed structural
interpretation that is beyond the scope of the current study.
Quality of the data used in the estimation
Erin has conducted what is considered to be industry best practice in relation to the QA/QC
checks with a regular system of standards, duplicates and blanks being inserted into the
sample stream.
Validation checks of standards are broadly within acceptable reporting limits and duplicate
field samples show a strong correlation to the original sample. Blank samples were reported
as showing a low B2O3 content.
Different sample analysis methods did however show varying precision in detection of B2O3
grade. The proportion of the samples which were used in the MRE and analysed by the less
suitable aqua regia ICP-MS method constitute only 10% of the MRE database and have a
minimum influence on the estimate.
Core recovery is good and exceeds 90%.
Results of the geostatistical analysis
The data used in the geostatistical analysis resulted in a suitably reliable downhole and omni
directional variogram using the combined data set and a lag spacing of 1 m and 100 m
respectively.
The variography allowed the determination of reasonable interpolation parameters to be
tested in a QKNA process. The QKNA was undertaken in Datamine and Supervisor software
with the slope of regression showing well supported blocks in areas drilled on the dominant
drill spacing. The slope of regression values are clearly seen tailing off towards the
extremities of the mineralised zones where sample support reduces.

Piskanja Technical Report – Main Report
SRKES7542 Piskanja NI43-101 Technical Report_2013 (2).docx November 2013
Page 91 of 112
At the same time, the existence of two grade populations in the raw data does decrease the
applicability of the OK method or other linear methods.
Quality of the estimated block model
The validation tools utilised for the Project show that the input data used to estimate the
model is replicated in the estimation. The block model grades are smoothed around the input
composites and the mean grades of the block model and composites are comparable for all
interpolated domains.
The grade distribution of the block model shows that the two grade populations could still be
distinguished, however the result is much smoothed compared to the raw data. The result
shows that extra wireframing detail with regards to data collection and modelling will be
needed in the future to be able separate the high and low grade populations. At this stage this
fact decreases the MRE classification for the Piskanja Project.
14.6.3 Classification The Project has been classified as containing Indicated and Inferred Mineral Resources.
SRK notes that the quality of the assays and overall data quality is sufficient for a higher level
of classification. It is the drillhole spacing and the interpreted continuity of grades controlled by
mineralisation wireframes that has resulted in the classification of the MRE in the Indicated
and Inferred Mineral Resource categories.
SRK used for Classification an Indicated Mineral Resources the Condition Bias Slope (CBS)
parameter which was calculated for every block of model by using Ordinary Kriging method.
In accordance with value of CBS>0.9 SRK created a wireframe for Indicated Mineral
Resources (Figure 14-17) and then Indicated category was assigned for all blocks inside the
Indicated wireframe.

Piskanja Technical Report – Main Report
SRKES7542 Piskanja NI43-101 Technical Report_2013 (2).docx November 2013
Page 92 of 112
Figure 14-17 Wireframe of the Indicated Mineral Resource (in dark green) for the Piskanja Project
Mineral Resource Statement 14.7The Mineral Resource Statement generated by SRK has been restricted to all classified
material above a marginal cut-off grade of 12% B2O3 and above a minimum mining height of 1
m. This cut-off grade assumes the following:
The mineralisation will be exploited by underground mining methods;
the final product will be boric acid;
a boric acid price of USD1,005 per tonne,
a processing cost of USD 53 per tonne
General and Administrative (G & A) costs of USD 14 per tonne
Royalty of 3%
This represents the material which SRK considers has reasonable prospect for eventual
economic extraction. Table 14.12 shows the resulting Mineral Resource Statement for
Piskanja. Figure 14-18 shows Mineral Resource Classification for the Piskanja Project.
The statement has been classified by a Qualified Person, Mark Campodonic (MSc. FAusIMM,
membership number 225925) in accordance with the Guidelines of NI 43-101 and
accompanying documents 43-101.F1 and 43-101.CP. It has an effective date of 22 October
2013. Mineral Resources are not Mineral Reserves as they have no demonstrated economic
viability. SRK and Erin are not aware of any factors (environmental, permitting, legal, title,
taxation, socio-economic, marketing, political, or other relevant factors) that have materially
affected the Mineral Resource Estimate. The Piskanja Project is considered to be an
exploration project and qualifies as an “Exploration Property” as defined by NI 43-101 and is
not affected by any mining, metallurgical or infrastructure factors.

Piskanja Technical Report – Main Report
SRKES7542 Piskanja NI43-101 Technical Report_2013 (2).docx November 2013
Page 93 of 112
The quantity and grade of reported Indicated and Inferred Mineral Resources in this
estimation are uncertain in nature and there has been insufficient exploration to define these
Mineral Resources as a Measured Mineral Resource; and it is uncertain if further exploration
will result in upgrading a part of Indicated Mineral Resource to a Measured Mineral Resource
category.
Table 14.12 Mineral Resource statement for the Piskanja Project
Mineral Resource
Category Tonnage, Mt
B₂O₃ Grade,
%
Contained
B2O3, Mt
Indicated 5.6 30.8 1.73
Inferred 6.2 28.8 1.80
Reported at a cut‐off grade of 12 percent B2O3, above a minimum mining thickness of 1 m, considering reasonable underground mining, processing and selling technical parameters and costs benchmark against similar borate projects and a selling price of US$1005/tonne (boric acid). All figures are rounded to reflect the relative accuracy of the estimates. Mineral Resources are not Mineral Reserves and do not have a demonstrated economic viability. The contained B2O3 represents estimated contained metal in the ground and has not been adjusted for metallurgical recovery, and may have discrepancies due to rounding.
Figure 14-18 Mineral Resource Classification for the Piskanja Project
Grade Tonnage Data 14.8The results of grade sensitivity analysis completed for all the zones and for both Indicated and
Inferred categories are tabulated in Table 14-13 and Figure 14-19.
This is to show the continuity of the resource at various cut‐off grades and the sensitivity of
the Mineral Resource to changes in cut-off. The tonnages and grades in these figures and
tables should not however be interpreted as Mineral Resources.

Piskanja Technical Report – Main Report
SRKES7542 Piskanja NI43-101 Technical Report_2013 (2).docx November 2013
Page 94 of 112
Table 14-13 Block Model Quantities and Grade Estimates* constrained with economic underground reporting parameters
Cut-off grade
(B₂O₃), %
Tonnage
calculated,
Mt
Average grade
(B₂O₃), %
Contained
B2O3, Mt
OK
7 12.3 29.0 3.57
8 12.3 29.1 3.57
9 12.2 29.2 3.56
10 12.1 29.3 3.55
11 12.0 29.5 3.54
12 11.8 29.8 3.52
13 11.7 29.9 3.51
14 11.6 30.1 3.49
15 11.4 30.4 3.46
16 11.2 30.6 3.43
17 11.0 30.9 3.40
18 10.8 31.2 3.36
19 10.6 31.4 3.33
20 10.4 29.0 3.28
Figure 14-19 Total Grade – Tonnage curves for all mineralised zones

Piskanja Technical Report – Main Report
SRKES7542 Piskanja NI43-101 Technical Report_2013 (2).docx November 2013
Page 95 of 112
The boron average grade and ore tonnage versus cut-off grade plots clearly demonstrate the
changes of the parameters of the system. The presented plots are quite consistent. As B2O3
cut-off grade increase, the average grade regularly increases and the calculated tonnage
gradually decreases.
Comparison to Previous Mineral Resource Estimates 14.9There are no known Mineral Resource Estimates reported to international standards for the
Piskanja mineral deposit.
The present «TECHNICAL REPORT AND MINERAL RESOURCE ESTIMATE FOR THE
PISKANJA BORATE PROJECT, SERBIA» is the report containing the Mineral Resource
Estimate that has been prepared for the first time for the Piskanja boron deposit under the
guidelines of National Instrument 43-101.

Piskanja Technical Report – Main Report
SRKES7542 Piskanja NI43-101 Technical Report_2013 (2).docx November 2013
Page 96 of 112
15 MINERAL RESERVE ESTIMATES The project is not at a stage whereby a Mineral Reserve Estimate can be delineated therefore
there are no Mineral Reserve Estimates to report on.
16 MINING METHODS There are no Mining Methods to report on.
17 RECOVERY METHODS There are no Recovery Methods to report on.
18 PROJECT INFRASTRUCTURE There is no Project Infrastructure to report on.
19 MARKET STUDIES AND CONTRACTS There has been no work on Market Studies and Contracts
20 ENVIRONMENTAL STUDIES, PERMITTING AND SOCIAL OR COMMUNITY IMPACT There have been no studies on Environmental Permitting and Social or Community Impact
21 CAPITAL AND OPERATIONAL COSTS There are no Capital and Operational Cost to report on.
22 ECONOMIC ANALYSIS There has been no Economic Analysis.

Piskanja Technical Report – Main Report
SRKES7542 Piskanja NI43-101 Technical Report_2013 (2).docx November 2013
Page 97 of 112
23 ADJACENT PROPERTIES On 10 December 2012, through Balkan Gold doo, Erin were granted exploration licence
#2065 which covers an area of 35.22km2 in the Jarandol Basin, adjacent to the eastern
boundary of the Piskanja #1934 licence. This larger licence is valid until 10 December 2015
and allows Erin to continue exploration for borates, lithium, sodium, strontium and potassium
in the region surrounding the Piskanja Project.
State-owned Ibarski Rudnici (JP PEU Resavica) has a boron mineral exploitation licence
(cadastral number 470) for the Pobrdje mineral deposit located 2.6 km northeast of the Erin
licence and on the western bank of the Ibar river. Erin staff have reported that material was
produced from this mineral deposit during 2011, but no official figures have been published.
According to information sourced from the Ministry of Mining and Energy of the Republic of
Serbia “ore reserves” of boron in categories A+B+C1 were estimated at 140,000 tons and the
“estimated resources” (P category) at 60,000 tons of B2O3. SRK does not consider these
figures to have been reported in compliance with NI 43-101 guidelines.
SRK visited the above ground buildings at the Pobrdje Mine on 14 June 2013 and verify that
the mine is in operation; however no details regarding its ownership or production are known
to SRK.
A number of other exploration and small scale exploitation licences have been issued in the
region, predominantly for coal, gold, lead zinc and asbestos as tabled below (Table 23.1
Mineral exploration and exploitation licences proximal to the Piskanja licence Figure 23-1
Exploration and mining licences immediately adjacent to the Piskanja Borate Project, (Erin
press release, 8 January 2013)shows the Piskanja, Jarandol and Pobrdje borate licences as
well as Ibar Mines’ coal mining licences.
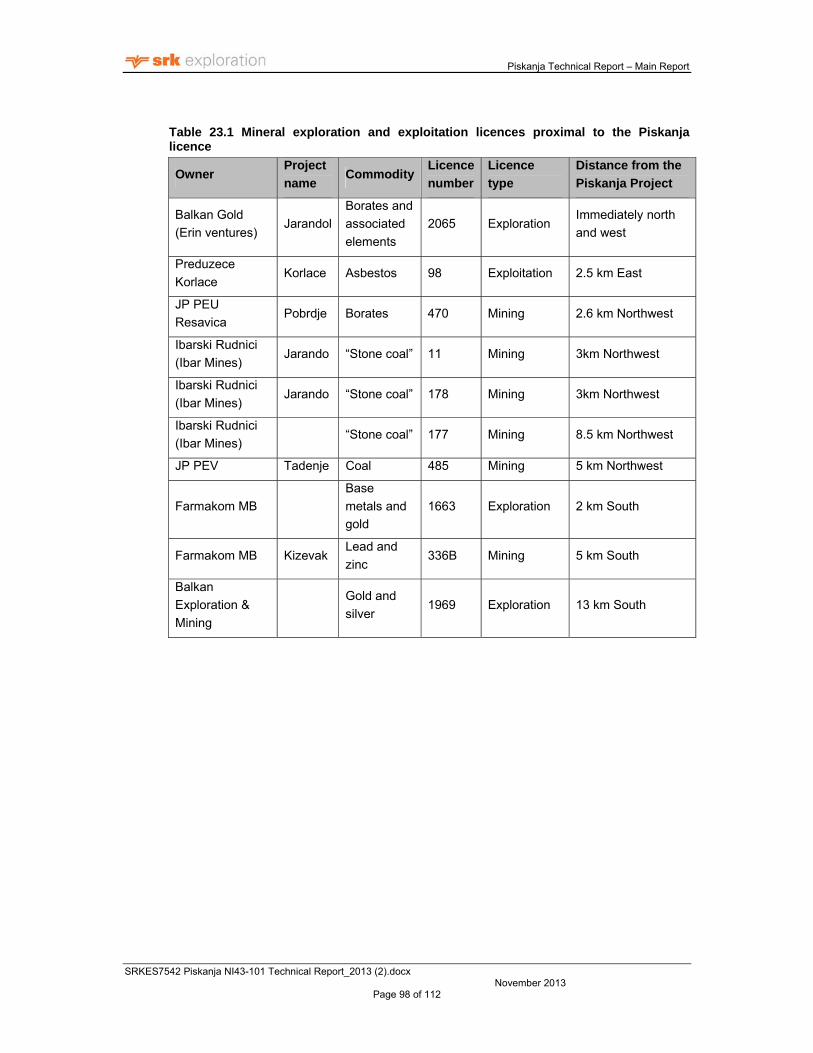
Piskanja Technical Report – Main Report
SRKES7542 Piskanja NI43-101 Technical Report_2013 (2).docx November 2013
Page 98 of 112
Table 23.1 Mineral exploration and exploitation licences proximal to the Piskanja licence
Owner Project
name Commodity
Licence
number
Licence
type
Distance from the
Piskanja Project
Balkan Gold
(Erin ventures) Jarandol
Borates and
associated
elements
2065 Exploration Immediately north
and west
Preduzece
Korlace Korlace Asbestos 98 Exploitation 2.5 km East
JP PEU
Resavica Pobrdje Borates 470 Mining 2.6 km Northwest
Ibarski Rudnici
(Ibar Mines) Jarando “Stone coal” 11 Mining 3km Northwest
Ibarski Rudnici
(Ibar Mines) Jarando “Stone coal” 178 Mining 3km Northwest
Ibarski Rudnici
(Ibar Mines) “Stone coal” 177 Mining 8.5 km Northwest
JP PEV Tadenje Coal 485 Mining 5 km Northwest
Farmakom MB
Base
metals and
gold
1663 Exploration 2 km South
Farmakom MB Kizevak Lead and
zinc 336B Mining 5 km South
Balkan
Exploration &
Mining
Gold and
silver 1969 Exploration 13 km South

Piskanja Technical Report – Main Report
SRKES7542 Piskanja NI43-101 Technical Report_2013 (2).docx November 2013
Page 99 of 112
Figure 23-1 Exploration and mining licences immediately adjacent to the Piskanja Borate Project, (Erin press release, 8 January 2013)

Piskanja Technical Report – Main Report
SRKES7542 Piskanja NI43-101 Technical Report_2013 (2).docx November 2013
Page 100 of 112
24 OTHER RELEVANT DATA AND INFORMATION There are no Other Relevant Data and Information to report on.

Piskanja Technical Report – Main Report
SRKES7542 Piskanja NI43-101 Technical Report_2013 (2).docx November 2013
Page 101 of 112
25 INTERPRETATION AND CONCLUSIONS Erin Ventures through its subsidiary Baklan Gold obtained the Piskanja Project in 2010 and
have since completed geological mapping and 13,478m of diamond drilling. In November
2012 Erin re-registered Exploration Licence #1934 as a new licence for an initial period of
three years, until November 2015, in accordance with the Mining Law of Serbia. A Mineral
Resource Estimate report has been completed by Erin in compliance with Serbian guidelines,
for which Erin expects to receive a Certificate of Mineral Resources in December 2013. This
will allow Erin to proceed further with pre-feasibility drilling, environmental studies and
preparation for obtaining a Mining Licence.
In June 2012, during the first part of resource drilling programme, SRK reviewed Erin’s
practices and exploration results and prepared the NI 43-101 compliant “Technical Report on
the Piskanja Project, Serbia” (Tsypukov et al., 2012). This presented recommendations
mainly on Erin’s QAQC and analytical programmes and how improvements could be made to
provide confidence in sample preparation and analysis.
The drilling programme undertaken by Erin involved 38 diamond core holes was completed in
December 2012. This complemented historical drilling to produce a drill hole spacing of
approximately 100x100m.
During the second half of drilling activities following SRK’s July 2012 Technical Report,
changes were made by Erin to improve upon QAQC deficiencies identified by SRK. As such
the sample analysis process was simplified; CRMs, blank and duplicate materials were
created and analysed regularly alongside core samples; and a secondary umpire laboratory
was used for check sample analysis. In SRK’s opinion, the sampling method and approach
used in the Piskanja Project meet general accepted industry standards. The observed QAQC
procedures are sufficient for the declaration of Mineral Resources, but SRK has made
recommendations for improvements to increase the confidence in sample preparation and
analysis.
Data verification completed by SRK determined inaccuracies in the data collection during the
drilling completed by Ibar Mines in the late 1980s and by Ras Borati in the late 1990s. For
this reason, the incomplete drilling and sampling data from these campaigns was excluded
from the geological modelling and Mineral Resource Estimation for the Piskanja Project.
Modelling and Mineral Resource Estimation
SRK has created a geological database based on the information provided by Erin Ventures
in July 2013. SRK has excluded the sampling data from holes drilled before the year 2000,
because of inappropriate analytical data quality, unreliable sampling system and poor
comparison with mineralised intersection in twin holes drilled after 2000, which provided more
reliable and quality data.
Geological modelling was completed using the 53 drill holes, totalling 19,554m, for which full
collar location, survey, lithological and sampling data were available. Analytical data of B2O3
content for 1,473 samples, totalling 6,211.68m from these holes composed the database from
which SRK conducted all modelling and Mineral Resource Estimation.
SRK estimated the natural boron mineralisation cut-off at 5% B2O3 and used this value to

Piskanja Technical Report – Main Report
SRKES7542 Piskanja NI43-101 Technical Report_2013 (2).docx November 2013
Page 102 of 112
delineate the mineralised zones. After building the wireframes of mineralised zones, SRK
performed statistical analysis of boron grade distribution within the zones. The analysis has
shown bimodal grade distribution in the set of samples. SRK analysed the spatial distribution
of these clusters and found that it is impossible to delineate them into separate wireframes
due to their chaotic spreading. SRK is of the opinion that a low grade domain can be
associated with a near-contact, vein-impregnated mineralisation type. The current drilling
spacing of approximately 100 m x 100 m does not allow delineation of these zones into
separate bodies. SRK considers that the areas with high and low grades need to be
separated into separate wireframes to complete future updates to the MRE presented here.
In total, 10 individual horizons have been modelled by SRK. The mineralised bodies are
continuous stratiform, slightly folded and dip at about 18° roughly to the southwest. Erin is
employing the deposit model of syndepositional borate mineralisation in discrete horizons
within well stratified lacustrine sediments, Some mineralisation was possibly re-distributed
due to solution metamorphism which SRK considers appropriate.
Structural analysis of the core and outcrops in deposit surroundings identified a number of
major and minor faults which do not appear to relate to significant displacement, however a
number of shallow dipping shear zones were identified in core. SRK conclude that the current
level of understanding relating to the structural controls on distribution of mineralisation in the
Piskanja deposit, is not sufficient to construct a robust tectonic model. Faulting may displace
mineralised horizons, and sedimentary slumping may also influence the thickness of
mineralisation, but without further study, the extent of this cannot be properly evaluated.
Samples were composited to 1m composite intervals following statistical composite length
analysis. SRK completed a statistical and geostatistical analysis on the 1 m composite data
using Datamine Studio 3 software to determine the appropriate estimation methods and
parameters. A single, non-rotated block model was created using block sizes of 25 m (Y) by
25 m (X) by 2 m (Z). The QKNA analysis has been used for the selection of interpolation
parameters.
Ordinary Kriging was used to interpolate B2O3 grade across the model using and the
interpolation parameters optimised by completing kriging sensitivity analysis (QKNA). The
block model was validated visually against drill hole grades, by comparison of global mean
block grades and sample grades within mineralised domains, the generation of SWATH plots
and running a check Inverse Distance Weighting estimate.
SRK has considered geological continuity, grade continuity, quality of the digitised database,
sampling density, distance of block estimates from samples and estimation quality in order to
classify the deposit in accordance with National Instrument 43-101. Data quality, drill hole
spacing and the interpreted continuity of grades controlled by the mineralised horizons has
allowed SRK to classify the mineralisation under the Indicated and Inferred Mineral Resource
categories. SRK and Erin are not aware of any factors (environmental, permitting, legal, title,
taxation, socio-economic, marketing, political, or other relevant factors) that have materially
affected the Mineral Resource Estimate. The Piskanja Project is considered to be an
exploration project and qualifies as an “Exploration Property” as defined by NI 43-101 and is
not affected by any mining, metallurgical or infrastructure factors.
The Mineral Resource Statement generated by SRK has been restricted to all classified
Piskanja Technical Report – Main Report
SRKES7542 Piskanja NI43-101 Technical Report_2013 (2).docx November 2013
Page 103 of 112
material above a marginal cut-off grade of 12% B2O3 and above a minimum mining height of 1
m. This cut-off grade assumes the following:
The mineralisation will be exploited by underground mining methods;
the final product will be boric acid;
a boric acid price of USD1,005 per tonne,
a processing cost of USD53 per tonne
General and Administrative (G & A) costs of USD14 per tonne
Royalty of 3%
Exploration Potential
SRK considers the Piskanja Project to be an exploration project of merit and that there is
potential to increase the current Mineral Resources with further targeted exploration
programmes. The main focus of any future drilling would be to increase the confidence within
the confines of the present mineralised bodies by infill drilling to 50m x50m between the
current collar locations. A secondary priority would be to delineate extensions to the existing
mineralisation model through drilling at the peripheries of the deposit.
Both programmes of work would increase confidence in the geological and structural
interpretations as well as add to the volume of mineralisation already defined. Greater
sampling of low grade intercalated, disseminated and wallrock borate mineralisation may also
add to the confidence of proceeding Mineral Resource Estimates.
Only a limited amount of metallurgical and recovery testwork has been completed to date.
Although the borate mineralisation at Piskanja is high grade and may require only limited
beneficiation to create marketable products, dedicated studies are required to determine such
processes and associated costs.
SRK are not aware of any significant risks or uncertainties that could reasonably be expected
to affect the reliability or confidence in the exploration information, mineral resource estimate,
or projected economic outcomes in the Piskanja project
SRK is of opinion that there is potential for the discovery of new borate mineralisation in the
western part of the Jarandol basin which is partly covered by Erin’s new exploration licence
#2065. This area reveals geological features similar to the eastern part where Piskanja boron
deposit is located.

Piskanja Technical Report – Main Report
SRKES7542 Piskanja NI43-101 Technical Report_2013 (2).docx November 2013
Page 104 of 112
26 RECOMMENDATIONS The work completed by Erin to date demonstrates that the Piskanja Project and the western
part of Jarandol Basin have significant potential to host multiple horizons of high grade boron
mineralisation. To further develop the Project towards higher levels of Mineral Resource
classification and delineate extensions to known mineralisation, SRK recommend that Erin
undertake the following;
Infill drilling of the currently defined Piskanja deposit using a 50x50 m grid. spacing.
SRK suppose that at this grid spacing it will be possible to interpret the high grade
and low grade portions of mineralisation. This will also satisfy the Exploration Licence
obligations Erin have under Serbian law and contribute to the requirements for
application for a Mining Licence.
Undertake further modification and refinement of the sampling and QAQC procedures
to make them more robust;
All intercalations or dilutions of lower grade material within high grade horizons should
be sampled, as too should all hangingwall and footwall contacts;
Carry out density measurements on dried core samples using the water immersion
method.
Whilst sodium peroxide fusion with ICP-AES finish and volumetric titration analysis
methods are considered robust and reliable methods for determination of high grades
of boron in geological samples, SRK recommend that sodium peroxide fusion ICP-
AES is cheaper than volumetric titration method and may be used as the only
analysis method needed in future sampling programmes. In this case, there would be
no further requirement for aqua regia ICP-MS analysis.
The core sampling procedures used by Erin should always include the sampling into
the hangingwall and footwall of the deposit, together with sampling of lower grade
internal diluting material in higher grade horizons. Further information on the hosting
rock will increase the robustness of interpretation and quality of the estimate for
higher levels of resource classification.
Make sure that the hangingwall, footwall and what appear to be barren intercalations
in mineralised intervals are sampled and analysed using by the same analytical
method as mineralised samples (sodium fusion ICP-AES) rather than aqua regia ICP-
MS. This approach will simplify the preparation and analytical part of the programme.
For QAQC samples selected for submission to the umpire laboratory should be not
less than 5% of the main sampling programme (primary laboratory) and include
coarse and pulp rejects. Blanks and CRMs should be inserted into sample batches for
the umpire laboratory in the same insertion ratio as for the primary laboratory.
Pulp duplicates should be submitted to the primary laboratory as well as coarse
duplicates from ¼ core.
The boron content in the marble which has been used by Erin as blank material
(average of 1500 ppm B) is significantly higher than in a typical sedimentary
carbonate rock (20-55 ppm B). Use of this material may mask the possible effects of
contamination during sample preparation or analysis. SRK recommends identifying
an alternative blank material for future exploration with a lower boron content. Blank
samples should be submitted to primary and umpire laboratory with every sample
batch.
Further investigation of the variability in CRM grades as reported by the round robin

Piskanja Technical Report – Main Report
SRKES7542 Piskanja NI43-101 Technical Report_2013 (2).docx November 2013
Page 105 of 112
process should be conducted.
Further structural interpretation, mapping and study of shear zones and faulting is
required. Erin should implement appropriate structural codes for use in the logging of
core that will allow modelling of structural data related to the intensity, orientation and
type of fissuring and faulting. This will lead to a better understanding of controls on
mineralisation and potential impacts on mining methods.
The current MRE sits completely within the Piskanja Licence #1934. Erin has
recently obtained an Exploration Licence for boron mineralisation immediately
adjacent to the Piskanja Licence. This will permit Erin to expand drilling activities to
the north, east and west to determine whether mineralisation extends in any of these
directions beyond existing drilling.
Stakeholder engagement with local communities should be continued and
incorporated into an Environmental and Social Impact Assessment (ESIA), which will
also include the results from the ongoing water monitoring already implemented by
Erin.
Geotechnical investigations should also be implemented that will provide robust data
for use in future Mineral Resource Updates and more advanced technical and
economic studies.
SRK note that there has only been a limited amount of metallurgical and recovery
testwork completed to date. And suggest more dedicated studies are required to
determine a processes and associated costs.

Piskanja Technical Report – Main Report
SRKES7542 Piskanja NI43-101 Technical Report_2013 (2).docx November 2013
Page 106 of 112
27 REFERENCES A Quantitative Determination of The Boron Content of Borate Samples from Ras Borati,
submitted by Erin Ventures Inc. Report issued on 7th April 1998 by Lakefield Research
limited, Lakefield, Ontario, Canada.
Byers, A.R. and Dahlstrom, C.D.A., 1954: Geology and mineral deposits of the Amisk –
Wildcat Lakes area, 63L-9, 63L-16, Saskatchewan; Saskatchewan Energy and Mines,
Geological Report No. 14, pp. 140-142
Federal Geological Institute, Belgrade , 1970, Geological Map of Vrjci, 1:100,000, Sheet K24-
18
Garrett, D.E. 1998, Borates: Handbook of deposits, processing, properties, and use.
Academic Press, San-Diego, 483 p.
Geosystem srl, Magnetotelluric Survey, Jarandol Basin, Serbia, 2006,
Ilic, M., Eric, V., 2009, Final Report on Exploration for period from 1st Sep 2006 to 21st July
2009, submitted on 27 July 2009 to Serbian Ministry for Environment, Mining and Spatial
Planning. GEOEXPLORER PROJECT DOO on behalf Rio Sava Exploration doo. Belgrade.
(in Serbian)
Maroviĉж, M., Djokoviĉж, I., Pešљiĉж, L., Radovanoviĉж, S., Toljiĉж, M., and Gerzina, N.,
2002, Neotectonics and seismicity of the southern margin of the Pannonian basin in Serbia,
EGU Stephen Mueller Sp. Pub. Series, European Geosciences Union, 3, 277-295
Mineral Deposits of Serbia. Ore deposit database. Republic of Serbia Ministry of Mining and
Energy. Report BRGM/RC-51448-FR.
(http://giseurope.brgm.fr/GIS_SERBIA/SerbiaOreDeposits.pdf)
Monthel, J., Vadala, P., Leistel, J.M., Cottard, F., 2002, Mineral deposits and mining districts
of Serbia. Compilation map and GIS database, BRGM/RC-51448-FR.
MWH UK Ltd, 2013, Interim Hydrogeological Report (Phase II), Piskanja boron, near
Baljevac, Raška, Serbia
Nagaishi, K., Ishikawa, T. 2009. A simple method for the precise determination of boron,
zirconium, niobium, hafnium and tantalum using ICP-MS and new results for rock reference
samples. Geochemical Journal, Vol. 43, pp. 133 to 141,
Podunavac, D., Vukicevic, B., 2011, Compilation report on historical geological exploration on
boron minerals in the deposit of “Piskanja” in Baljevac area on the Ibar river, conducted
before the end of 2010, Geological Institute of Serbia. Belgrade. (in Serbian).
Public tender for granting concession related to exploration and exploitation of boron deposit
in Jarandol Tertiary basin, territory of Baljevac. Technical part for Tender documentation.
Government of the Republic of Serbia, Ministry of Mining and Energy. Belgrade 2005.
SGS Minerals Services, 2012, Report on magnetic and HTE testing of borate samples from
Serbia,

Piskanja Technical Report – Main Report
SRKES7542 Piskanja NI43-101 Technical Report_2013 (2).docx November 2013
Page 107 of 112
Stojanovich, D., 1967, Howlite from Jarandol Tertiary basin, Proceedings from VI Congress of
Geology in Ohrid, Macedonia.
Tsypukov, M., and O’Donovan, G., 2012. Technical Report on the Piskanja Project, Serbia.
Prepared for Erin Ventures Inc., SRK ES.
University of Belgrade, Faculty of Mining and Geology, 2012, Testing of samples from the
Piskanja borate deposit (translation from Serbian)
University of Belgrade, Faculty of Mining and Geology, Petrological characteristics of holes
104, 105, 106, 107, IBM-4 and IBM-6 – Piskanja, 2012, (in Serbian)
University of Belgrade, Faculty of Mining and Geology, 2013, Study of engineering properties
rock masses and terrains of the Piskanja borate deposit (translation of concluding remarks
from Serbian)
Yilmaz, M.S., Figen, A.K., Piskin, S. 2013. Study on the dehydration kinetics of tunellite using
non-isothermal methods. Research on Chemical Intermediates. Springer

Piskanja Technical Report – Main Report
SRKES7542 Piskanja NI43-101 Technical Report_2013 (2).docx November 2013
Page 108 of 112
For and on behalf of SRK Exploration Services Ltd
Dr Mikhail Tsypukov, FIMMM
Principal Exploration Geologist
SRK Exploration Services Ltd
Date: 29/11/2013
Mark Campodonic, MSc., FAusIMM
Principal Mineral Resource Geologist
SRK UK Ltd
Date: 29/11/2013

Piskanja Technical Report – Main Report
SRKES7542 Piskanja NI43-101 Technical Report_2013 (2).docx November 2013
Page 109 of 112
CERTIFICATE OF AUTHOR To accompany the report entitled: Technical Report and Mineral Resource Estimate for the Piskanja Borate Project, Serbia, 29 November 2013. I, Dr. Mikhail Tsypukov, residing at apt.85, Volokolamskoe shosse 58, Building 1, Moscow, Russian Federation, do hereby certify that:
1) I am a Principal Exploration Geologist with the firm of SRK Exploration Services Ltd (“SRK ES”) with an office at 12
St Andrew’s Crescent, Cardiff, United Kingdom, CF10 3DD;
2) I am a graduate of the Irkutsk Polytechnic Institute, Russia in 1985. I obtained a Master of Science (Mineral Deposits and Applied Geochemistry) degree followed by a PhD in 1994 (Geochemistry and Economic Geology) from the A. P. Vinogradov Institute of Geochemistry, Russian Academy of Science, Irkutsk. I have practiced my profession continuously since 1985.
3) I am a Fellow of the Institute of Materials, Minerals and Mining (IMMM), membership number 459707;
4) I have personally inspected the subject project during the period 10 June 2012 to 15 June 2012 and again during the period 12 June 2013 and 14 June 2013;
5) I have read the definition of “qualified person” set out in National Instrument 43‐101 and certify that by virtue of my education, affiliation to a professional association and past relevant work experience, I fulfill the requirements to be a “qualified person” for the purposes of National Instrument 43‐101;
6) I am the co‐author of this report and accept professional responsibility for the geology, mineralisation and data quality aspects and sections of this technical report. I do not take responsibility for the Mineral Resource Estimate;
7) I, as a qualified person, I am independent of the issuer as defined in Section 1.5 of National Instrument 43‐101;
8) I have had previous involvement with the subject property as co‐author of the National Instrument 43‐101 technical report entitled Technical Report on the Piskanja Project, 16 July 2012;
9) I have read National Instrument 43‐101 and confirm that this technical report has been prepared in compliance therewith;
10) SRK Exploration Services Ltd was retained by Erin Ventures Inc to prepare a technical audit of the Piskanja Project.
11) I have not received, nor do I expect to receive, any interest, directly or indirectly, in the Piskanja Project or securities of Erin Ventures Inc;
12) That, as of the date of this technical report, to the best of my knowledge, information and belief, this technical report contains all scientific and technical information that is required to be disclosed to make the technical report not misleading;
13) I consent to the filing of the technical report with any stock exchange and other regulatory authority and any publication for regulatory purposes, including electronic publication in the public company files on their websites accessible to the public of extracts from the technical report; and
14) I confirm that I have read the news release dated 29 November 2012 being filed by Erin Ventures Inc and that it fairly and accurately represents the information in the sections of the Technical Report for which I am responsible.
____________________ Moscow, Russia 29 November 2013
[“signed and sealed”] Dr Mikhail Tsypukov, PhD., FIMMM Principal Exploration Geologist

Piskanja Technical Report – Main Report
SRKES7542 Piskanja NI43-101 Technical Report_2013 (2).docx November 2013
Page 110 of 112
CERTIFICATE OF AUTHOR To accompany the report entitled: Technical Report and Mineral Resource Estimate for the Piskanja Borate Project, Serbia, 29 November 2013. I, Mr Mark Campodonic, residing at 50 Llanfair Road, Cardiff do hereby certify that:
1) I am a Principal Resource Geologist with the firm of SRK Consulting (UK) Ltd (“SRK UK”) with an office at 5th Floor,
Churchill House, 17 Churchill Way, Cardiff, CF10 2HH, Wales, UK;
2) I am a graduate of Cardiff University, University of Wales, UK in 2000. I obtained a Bachelor of Science with First Class Honours degree (Exploration Geology) in 1999, followed by a Masters with Distinction (Mineral Resource Evaluation) in 2000, both from Cardiff University. I have practiced my profession continuously since 2000
3) I am a Chartered Professional member of the AusIMM, membership number CP # 225925;
4) I have not personally inspected the subject project;
5) I have read the definition of “qualified person” set out in National Instrument 43‐101 and certify that by virtue of my education, affiliation to a professional association and past relevant work experience, I fulfil the requirements to be a “qualified person” for the purposes of National Instrument 43‐101;
6) I am the co‐author of this report and accept professional responsibility for the Mineral Resource Estimation aspects and sections of this technical report. I do not take responsibility for the geology, mineralisation and data quality;
7) I, as a qualified person, I am independent of the issuer as defined in Section 1.5 of National Instrument 43‐101;
8) I have had no prior involvement with the subject property.
9) I have read National Instrument 43‐101 and confirm that this technical report has been prepared in compliance therewith;
10) SRK Exploration Services Ltd was retained by Erin Ventures Inc to prepare a technical audit of the Piskanja Project, and I was sub‐contracted to undertake the resource estimation aspects of the study.
11) I have not received, nor do I expect to receive, any interest, directly or indirectly, in the Piskanja Project or securities of Erin Ventures Inc;
12) That, as of the date of this technical report, to the best of my knowledge, information and belief, this technical report contains all scientific and technical information that is required to be disclosed to make the technical report not misleading;
13) I consent to the filing of the technical report with any stock exchange and other regulatory authority and any publication for regulatory purposes, including electronic publication in the public company files on their websites accessible to the public of extracts from the technical report; and
14) I confirm that I have read the news release dated 29 November 2013 being filed by Erin Ventures Inc and that it fairly and accurately represents the information in the sections of the Technical Report for which I am responsible.
____________________ Cardiff, UK 29 November 2013
[“signed and sealed”] Mr Mark Campodonic, BSc, MSc, FGS, MAusIMM(CP) Principal Resource Geologist

SRK Exploration Services Ltd
12 St Andrew’s Crescent,
Cardiff,
United Kingdom
CF10 3DD.
e-mail: [email protected]
URL: www.srkexploration.com
Tel: + 44 (0)29 20 233 233
Fax: + 44 (0)29 20 233 211
SRKES7542 Piskanja NI43-101 Technical Report_2013 (2).docx November 2013
Page 111 of 112
Project number: ES7542 Moscow, 29 November 2013 To: B. C. Securities Commission (BCSC) and Toronto Stock Exchange (TSX)
CONSENT OF AUTHOR I, Mikhail Tsypukov, do hereby consent to the public filing of the technical report entitled Technical Report and Mineral Resource Estimate for the Piskanja Borate Project, Serbia” (the “Technical Report”) and dated 29 November 2013 and any extracts from or a summary of the Technical Report under the National Instrument 43‐101 disclosure of Erin Ventures Inc and to the filing of the Technical Report with any securities regulatory authorities. I further consent to the company filing the Technical Report on SEDAR and consent to press releases made by the company with my prior approval. I confirm that I have read the news release dated 29 November 2013 being filed by Erin Ventures Inc and that it fairly and accurately represents the information in the sections of the Technical Report for which I am responsible. Dated this 29th day of November 2013
Dr Mikhail Tsypukov, PhD., FIMMM Principal Exploration Geologist

SRK Exploration Services Ltd
12 St Andrew’s Crescent,
Cardiff,
United Kingdom
CF10 3DD.
e-mail: [email protected]
URL: www.srkexploration.com
Tel: + 44 (0)29 20 233 233
Fax: + 44 (0)29 20 233 211
SRKES7542 Piskanja NI43-101 Technical Report_2013 (2).docx November 2013
Page 112 of 112
Project number: ES7542 SRK Consulting (UK) Ltd, Cardiff, UK, 29 November 2013 To: B. C. Securities Commission (BCSC) and Toronto Stock Exchange (TSX)
CONSENT OF AUTHOR I, Mark Campodonic, do hereby consent to the public filing of the technical report entitled Technical Report and Mineral Resource Estimate for the Piskanja Borate Project, Serbia” (the “Technical Report”) and dated 29 November 2013 and any extracts from or a summary of the Technical Report under the National Instrument 43‐101 disclosure of Erin Ventures Inc and to the filing of the Technical Report with any securities regulatory authorities. I further consent to the company filing the Technical Report on SEDAR and consent to press releases made by the company with my prior approval. I confirm that I have read the news release dated 29 November 2013 being filed by Erin Ventures Inc and that it fairly and accurately represents the information in the sections of the Technical Report for which I am responsible. Dated this 29th day of November 2013
Mr Mark Campodonic, BSc, MSc, FGS, MAusIMM(CP) Principal Resource Geologist

Piskanja Technical – Technical Appendix A
SRKES7542 Piskanja NI43-101 Technical Report_2013 (2).docx November 2013 Page A1 of A4
APPENDIX
TECHNICAL APPENDIX 1

Piskanja Technical – Technical Appendix A
SRKES7542 Piskanja NI43-101 Technical Report_2013 (2).docx November 2013 Page A2 of A4
List of mineralised intercepts in all 2011/2012 Erin diamond drill holes.
BHID From, (m) To, (m) Intercept Length, (m) B2O3 Grade (%) Mineralised zone
EVP2011_100 196.12 203.08 6.96 24.8 1
EVP2011_100 124.76 129.31 4.55 12.6 3
EVP2011_101 234.81 244.08 9.27 30.0 1
EVP2011_101 128.06 141.07 13.01 39.9 3
EVP2011_101 141.16 142.81 1.65 5.2 6
EVP2011_102 203.62 212.16 8.54 34.2 1
EVP2011_102 114.16 119.99 5.83 42.2 3
EVP2011_102 125.4 125.86 0.46 39.0 6
EVP2011_103 178.68 187.37 8.69 35.3 1
EVP2011_104 278.12 285.11 6.99 40.8 1
EVP2011_104 199.87 201.01 1.14 5.4 2
EVP2011_104 147.02 158.15 11.13 38.2 3
EVP2011_104 169.89 170.43 0.54 22.1 6
EVP2011_105 229.52 235.63 6.11 24.8 1
EVP2011_105 166.46 169.43 2.97 40.7 2
EVP2011_105 118.67 125.23 6.56 35.3 3
EVP2011_105 131.46 133.76 2.3 42.5 6
EVP2011_106 290.08 295.63 5.55 37.4 1
EVP2011_106 213.76 217.8 4.04 42.4 2
EVP2011_106 162.77 175.83 13.06 30.0 3
EVP2011_106 133.3 139.04 5.74 46.1 4
EVP2011_106 180.77 181.57 0.8 29.2 6
EVP2011_107 355.24 360.29 5.05 27.7 1
EVP2011_107 267.03 272.23 5.2 37.3 2
EVP2011_107 244.53 245.16 0.63 42.9 6
EVP2011_108 323.69 331.5 7.81 39.6 1
EVP2011_108 245.56 248.13 2.57 42.5 2
EVP2011_108 202.95 204.88 1.93 31.6 3
EVP2011_108 205.71 209.59 3.88 10.0 6
EVP2011_109 320.38 324.38 4 31.0 1
EVP2011_109 254.07 255.85 1.78 15.7 2
EVP2011_109 177.6 179.29 1.69 35.6 3
EVP2011_109 160.03 163.81 3.78 20.1 4
EVP2011_109 213.51 214.09 0.58 36.4 5
EVP2011_109 200.6 204.9 4.3 12.6 6
EVP2011_109 208.6 210.43 1.83 16.1 8
EVP2012_111 311.5 315.67 4.17 41.9 1
EVP2012_111 175.23 176.57 1.34 35.3 3
EVP2012_111 331.27 332.13 0.86 47.0 7
EVP2012_112 268.33 270.97 2.64 27.7 1
EVP2012_112 132.82 133.52 0.7 29.7 3
EVP2012_112 102.69 103.69 1 31.0 4

Piskanja Technical – Technical Appendix A
SRKES7542 Piskanja NI43-101 Technical Report_2013 (2).docx November 2013 Page A3 of A4
EVP2012_112 165.11 166.4 1.29 35.9 5
EVP2012_112 161.32 162.92 1.6 36.9 6
EVP2012_113 309.15 309.7 0.55 42.6 1
EVP2012_113 235.78 239.94 4.16 32.1 2
EVP2012_113 199.42 201.11 1.69 16.3 3
EVP2012_113 215.54 218.16 2.62 15.0 6
EVP2012_114 298.45 300.28 1.83 28.7 1
EVP2012_114 316.45 318.2 1.75 25.5 7
EVP2012_115 200.14 200.61 0.47 14.9 3
EVP2012_115 263.89 264.67 0.78 27.3 5
EVP2012_115 259.71 261.53 1.82 9.4 8
EVP2012_116 302.08 309.17 7.09 39.0 1
EVP2012_116 226.64 231.11 4.47 36.3 2
EVP2012_116 179.51 185.86 6.35 26.8 3
EVP2012_116 163.13 163.85 0.72 28.9 4
EVP2012_116 200.87 202.4 1.53 16.1 6
EVP2012_117 216.64 218.34 1.7 44.7 3
EVP2012_117 262.72 264.21 1.49 41.2 5
EVP2012_117 237.64 238.38 0.74 38.9 6
EVP2012_117 253.23 255.52 2.29 19.0 8
EVP2012_118 333.2 338.82 5.62 21.6 1
EVP2012_118 265.41 267.24 1.83 2.8 2
EVP2012_118 239.15 241.33 2.18 5.6 6
EVP2012_119 366.77 369.06 2.29 28.3 1
EVP2012_119 291.22 292.89 1.67 34.9 2
EVP2012_119 226.88 234.05 7.17 42.1 3
EVP2012_119 238.16 242.61 4.45 12.7 6
EVP2012_120 276.42 283.36 6.94 37.4 1
EVP2012_120 151.7 173.85 22.15 28.9 3
EVP2012_120 136 137.37 1.37 40.6 4
EVP2012_120 185.65 187.7 2.05 17.5 6
EVP2012_121 355.45 362.23 6.78 30.2 1
EVP2012_121 267.92 272.7 4.78 37.9 2
EVP2012_121 247.33 252.03 4.7 8.6 6
EVP2012_122 221.2 224.89 3.69 8.7 3
EVP2012_122 209.86 216.92 7.06 41.1 4
EVP2012_122 239.53 242.64 3.11 11.7 6
EVP2012_123 378.06 383.15 5.09 30.8 1
EVP2012_123 325.81 338.2 12.39 22.3 9
EVP2012_123 160.82 161.35 0.53 23.9 10
EVP2012_124 355.22 357.93 2.71 33.1 1
EVP2012_124 270.91 271.21 0.3 33.7 5
EVP2012_124 261.98 262.59 0.61 28.5 8
EVP2012_125 280.29 283.92 3.63 20.8 2

Piskanja Technical – Technical Appendix A
SRKES7542 Piskanja NI43-101 Technical Report_2013 (2).docx November 2013 Page A4 of A4
EVP2012_126 390.2 394.18 3.98 28.7 1
EVP2012_126 295.41 310.27 14.86 21.8 2
EVP2012_126 244.57 245.73 1.16 22.7 3
EVP2012_126 281.16 282.2 1.04 13.3 6
EVP2012_127A 278.77 281.93 3.16 25.7 1
EVP2012_127A 165.99 166.74 0.75 20.3 5
EVP2012_127A 160.96 163.83 2.87 20.9 6
EVP2012_128 399 400.66 1.66 47.2 1
EVP2012_128 240.35 245.15 4.8 22.2 3
EVP2012_129 233.2 240.78 7.58 24.6 1
EVP2012_129 166.38 167.33 0.95 33.1 2
EVP2012_129 119.82 122.41 2.59 36.9 3
EVP2012_129 142.47 144.23 1.76 6.4 5
EVP2012_129 137.65 140.43 2.78 36.2 6
EVP2012_130 355.75 361.66 5.91 34.9 1
EVP2012_130 277.9 280.82 2.92 31.0 2
EVP2012_130 260.16 262.85 2.69 7.8 6
EVP2012_130 287.47 288.71 1.24 18.9 9
EVP2012_131 398 400.53 2.53 26.3 1
EVP2012_131 308.09 311.21 3.12 41.9 2
EVP2012_131 313.63 318.29 4.66 8.8 9
EVP2012_131 169.07 169.75 0.68 21.2 10
EVP2012_132 427.05 428.16 1.11 27.4 1
EVP2012_132 358.92 360.71 1.79 8.6 2
EVP2012_132 449.86 450.86 1 10.1 7
EVP2012_132 200.08 203.64 3.56 17.5 10
EVP2012_133 418.79 421.29 2.5 15.0 1
EVP2012_133 369.59 373.55 3.96 7.2 9
EVP2012_134 365.14 367.48 2.34 38.1 1
EVP2012_134 275.7 278.74 3.04 31.7 2
EVP2012_134 211.01 211.93 0.92 14.4 3
EVP2012_134 252.67 255.26 2.59 11.1 6
EVP2012_134 387.7 390.37 2.67 16.0 7
EVP2012_135 231.96 240.44 8.48 30.3 3
EVP2012_136 317.22 318.51 1.29 38.6 1
EVP2012_136 205.97 207.05 1.08 34.5 5
EVP2012_136 189.71 190.86 1.15 15.3 6
EVP2012_136 203.58 204.51 0.93 29.8 8