Embed Size (px)
Citation preview

Nuclear Inst. and Methods in Physics Research, A 976 (2020) 164216
Contents lists available at ScienceDirect
Nuclear Inst. and Methods in Physics Research, A
journal homepage: www.elsevier.com/locate/nima
Technical Notes
Simulation study of energy resolution of the high-pressure xenon gamma-rayspectrometerJinchao Ma a, Pin Gong a,b, Xiaobin Tang a,b,∗, Peng Wang c, Wen Yan a, Dajian Liang d,Zeyu Wang d, Rui Zhang a, Xiaolei Shen a
a Department of Nuclear Science and Technology, Nanjing University of Aeronautics and Astronautics, Nanjing 210016, Chinab Key Laboratory of Nuclear Technology Application and Radiation Protection in Astronautics, Ministry of Industry and InformationTechnology, Nanjing, 211106, Chinac School of Environmental and Biological Engineering, Nanjing University of Science and Technology, Nanjing 210094, Chinad Joint Laboratory of Nuclear Technology and Artificial Intelligence, Nanjing University of Aeronautics and Astronautics, Nanjing 210016, China
A R T I C L E I N F O
Keywords:Energy resolutionHigh-pressure xenon detectorModelingGarfield++
A B S T R A C T
High-pressure xenon (HPXe) ionization chamber is a high-energy-resolution radiation detector for gammaspectrometry with excellent physical properties. It has a wide range of operation temperatures, excellentradiation resistance, and long-life performance. Energy resolution is an important parameter of an HPXegamma-ray spectrometer and has been investigated by scientists through experimental methods for years.However, in previous researches, there are few simulations on energy resolution of different ionization chamberstructures. In this paper, three simulation tools are used to simulate the energy resolution of the HPXespectrometer. Monte Carlo simulation software PHITS and finite element analysis software ANSYS are used toestablish the model of the HPXe ionization chamber with a shielding grid. Garfield++ is adopted to obtainthe output signal for analyzing the energy resolution. The energy resolution under different gas componentsand shielding grid structures are simulated. Results show that when the gamma-ray energy is 662 keV, thedeviation between the simulated energy resolution obtained in this paper and the expected theoretical value0.6% reported in the document Dmitrenko et al. (1986) is 13.05%. Besides, the experimental energy resolutionof the HPXe gamma-ray spectrometer made by MEPHI (Dmitrenko et al., 2008) is about 2% at 662keV.Therefore, the value of simulated result in this paper is between the experimental result of MEPHI and thetheoretical value, and closer to the theoretical value, which means that the simulation method proposed inthis paper has high credibility.
1. Introduction
High-pressure xenon (HPXe) gamma-ray spectrometer has beenused for gamma-ray detection for decades. This kind spectroscopicdetector has various advantages: (a) good energy resolution (∼2.0%at 662 keV) which is close to that of HPGe, but without cryogenicsystem, (b) applicability in harsh high-radiation environments, (c)broad operating temperature range (10–180 ◦C), and (d) high stabilityand capability for long term working [1]. Since the energy resolutionis the most critical performance parameter of HPXe gamma-ray spec-trometers, there are many researchers focusing on the improvementof this parameter for many years [2,3]. However, despite many yearsof research, the experimental energy resolution is still far from itsexpected theoretical limit of ∼0.6% at 662 keV [4]. Meanwhile, due tothe complex technology of manufacturing, and the limited experimentalresearch, the design and energy resolution of HPXe spectrometer has
∗ Corresponding author at: Department of Nuclear Science and Technology, Nanjing University of Aeronautics and Astronautics, Nanjing 210016, China.E-mail address: [email protected] (X. Tang).
not improved considerably since the 1990s. Conducting a study bysimulation is easier than by experiment. However, several parametersof the HPXe detector which have been proven to affect the energyresolution seriously, such as gas density, electric field distribution [5],and geometry of shielding grid [6], have not been fully studied inthe previous simulations. The development of a simulation method orprocess that can directly associate the design parameters and energyresolution performance of the HPXe gamma-ray spectrometer willprovide a further convenient way to design the HPXe spectrometer withexcellent performance.
In this paper, an approach of combining three simulation tools,named Garfield++, ANSYS, and PHITS, was proposed to establish therelationship between the design parameters and energy resolution ofthe HPXe detector. The effects of the different parameters on the energyresolution will be discussed later.
https://doi.org/10.1016/j.nima.2020.164216Received 21 October 2019; Received in revised form 31 May 2020; Accepted 1 June 2020Available online 3 June 20200168-9002/© 2020 Elsevier B.V. All rights reserved.

J. Ma, P. Gong, X. Tang et al. Nuclear Inst. and Methods in Physics Research, A 976 (2020) 164216
Fig. 1. Overview of the adopted tools and programs and their interplay.
2. Principle and method
2.1. Simulation method
Three simulation tools used in this paper have different functions.The Monte Carlo simulation software PHITS [7,8] is used to establishthe geometry of the detector. The finite element analysis programsANSYS [9] is used to calculate electric field distribution in the detec-tor. Garfield++ is an open-source toolkit developed by the EuropeanOrganization for Nuclear Research (CERN) for the detailed simulationof particle detectors that use a gas mixture or semiconductor mate-rial as a sensitive medium [10]. This toolkit has three subprograms,namely, ‘‘Magboltz’’, ‘‘Heed’’, and ‘‘Signals’’. ‘‘Magboltz’’ is a programfor calculating the transport properties of electrons in gas mixtures.‘‘Heed’’ is a program for simulating the ionization pattern producedalong the track of relativistic charged particles. In addition, ‘‘Heed’’is an implementation of the photo-absorption ionization (PAI) model,and it can only reflect the photoelectric effect (including escape peak).Other interactions of gamma quanta with matter (like Compton) cannotbe simulated in Garfield++. ‘‘Signal’’ is a program for calculating theinduced signals on the anode of the chamber on the basis of theShockley–Ramo theorem. The amplitudes of the signals obtained byGarfield++ are used to calculate energy resolution. The overview of thedifferent tools and programs used in the approach is shown in Fig. 1.
The simulation process can be divided into the following three parts:
(1) Preliminary establishing the geometrical structure by PHITS:First, the wall thickness of the detector was determined on thebasis of the minimum detectable gamma-ray energy. Then, thediameter of the detector was calculated on the basis of thegas pressure and the wall thickness. After the diameter of theionization chamber was determined, the spatial distribution ofthe energy deposition in the ionization chamber was analyzedby PHITS to obtain the shielding grid radius. The geometricparameters obtained by calculation and simulation were used tocalculate the electric field distribution in ANSYS.
(2) ANSYS modeling: The geometry, material properties, and ap-plied voltages should be defined in ANSYS. The geometric pa-rameters were obtained in the previous step. The dielectricconstant of the gas medium and metal material that determinesthe material properties were set according to the user guide ofANSYS modeling for Garfield++. After adjusting voltages on theelectrodes and the grid structure to a suitable value, the electricfield distribution file required by Garfield++ can be outputted.
(3) Energy resolution calculation: The electron drift velocity, dif-fusion coefficient, Townsend coefficient, and attachment coef-ficient, which are used to describe the drift characteristics ofthe electron, were calculated, and the results were exportedto a file under certain gas conditions by using the Magboltzprogram. Files exported by ANSYS and Magboltz were inputtedinto Garfield++. For each gamma-ray detection event, the pho-ton energy, interaction position, incident direction, and time ofgamma-rays were set by using the Heed. Then, the position andtime of gas ionization and the number of electron–ion pairs canbe recorded, and the drift process of electron–ion pairs in theelectric field can be simulated. The Signals program was used toset the recording time and time interval and recorded the currentsignal generated on the anode during the electronic drift. Aftersetting the time constant 𝜏 of preamplifier and transfer function,the output current signal can be converted into a voltage signal.Once the amplitude of each output voltage signal has beenrecorded, the energy resolution can be obtained.
2.2. Detector modeling
Fig. 2 shows the structure of the HPXe cylindrical ionization cham-ber with a shielding grid. RA, RG, and RC are the radii of the anode,grid, and cathode, respectively. LC is the chamber length. TC and TG arethe wall thickness and grid thickness, respectively. In the simulation ofenergy resolution, a point source is placed in the middle of the detectorlength, 5 mm away from the cathode in the chamber.
Among the parameters mentioned before, the setting of chamberlength LC, anode radius RA, cathode voltage, and grid voltage directlyrefer to [1], wall thickness TC, cathode radius RC, grid radius RG,grid thickness TG, and time constant 𝜏 are optimized in the followingsimulation.
2.2.1. Optimization of the wall thickness TCThe density of the gas is considerably lower than that of the scin-
tillator or semiconductor; thus, filling the chamber with high-pressuregas is necessary to improve the detection efficiency. The wall thick-ness should be increased when increasing the gas pressure inside thechamber. However, the higher the wall thickness the more gamma-rayenergy loss in the wall, which leads to a higher minimum detectablegamma energy [11]. The minimum detectable gamma energy men-tioned in [11] and [1] are 20 and 100 keV, respectively; thus, 50keV is selected in our simulations. Fig. 3 presents the percentage ofabsorbed gamma-rays in walls versus their energy for five values ofvessel thickness (1, 2, 3, 4, and 5 mm of 304 stainless steel) calculatedby PHITS.
2

J. Ma, P. Gong, X. Tang et al. Nuclear Inst. and Methods in Physics Research, A 976 (2020) 164216
Fig. 2. Sketch of the HPXe ionization chamber for gamma spectrometry with a shielding grid.
Fig. 3. Percentage of absorbed gamma rays in walls versus their energies calculatedby PHITS.
The results are shown in Fig. 3 indicate that when the thickness ofthe stainless-steel wall was 1, 2, and 3 mm, the detector can detect 50keV gamma-rays effectively. Structural strength needs to be consideredin the chamber design, and the 3 mm stainless steel is selected in thesimulations. Several researchers have studied the use of low-thicknessstainless steel covered with a composite material, such as Kevlar, toimprove the pressure resistance of the chamber [12]. This approach notonly ensures an increased detection efficiency but also reduces the lowenergy limit of the detector. However, the material of the wall makeslittle influence on the following simulation of energy resolution.
2.2.2. Calculation of the cathode radius RCAccording to Chinese safety requirements for high-pressure seals,
the pressure resistance of the detector shell must be greater than 1.5times the actual working gas pressure. According to reference [11],the gas pressure is set to 50 bar in our simulation. When the shellthickness and gas pressure are determined, the cathode radius RC canbe calculated by using the following formula [13]:
𝑅𝑐 =𝛿 × (2 × 𝜎 × 𝜑 − 𝑃 )
2 × 𝑃(1)
where P is the pressure on the thin wall, which is set to 7.5 MPa(1.5 times the 50 bar); R is the radius of the pressure vessel; 𝛿 is thethickness of the thin wall, which is set to 3 mm; 𝜎 is the allowabletensile stress of the material, which is set to 137 MPa; 𝜑 is the averageweld coefficient, which is set to 0.95. According to the formula, thecathode radius RC is 50.56 mm. Referring to the HPXe gamma-rayspectrometer developed by MEPhI [1], the chamber length LC is set to250 mm, and the anode radius Ra is 5 mm. The total ionization chambervolume is approximately 2 L.
Fig. 4. Effective detection efficiency of HPXe gamma-ray spectrometer versus itsshielding grid radius calculated by PHITS.
Fig. 5. Influence of the time constant on the output signal simulated by Garfield++.
2.2.3. Optimization of the grid radiusIn the gridded ionization chamber, only the energy deposition event
which happens in the cathode-grid space is effective [14]. To improvethe effective detection efficiency, the volume ratio of the cathode-gridspace in the chamber should be as large as possible. However, theanode–grid space cannot be excessively small due to a series of factors,such as processing difficulty and electric field uniformity. Fig. 4 showsthe relationship between the effective detection efficiency and gridradius RG under different gamma-ray energies calculated by PHITS.
As shown in Fig. 4, the effective detection efficiency decreases as thegrid radius RG increases. In addition, with the increase in gamma-rayenergy, the percentage of deposition energy spent in the cathode-grid
3
J. Ma, P. Gong, X. Tang et al. Nuclear Inst. and Methods in Physics Research, A 976 (2020) 164216
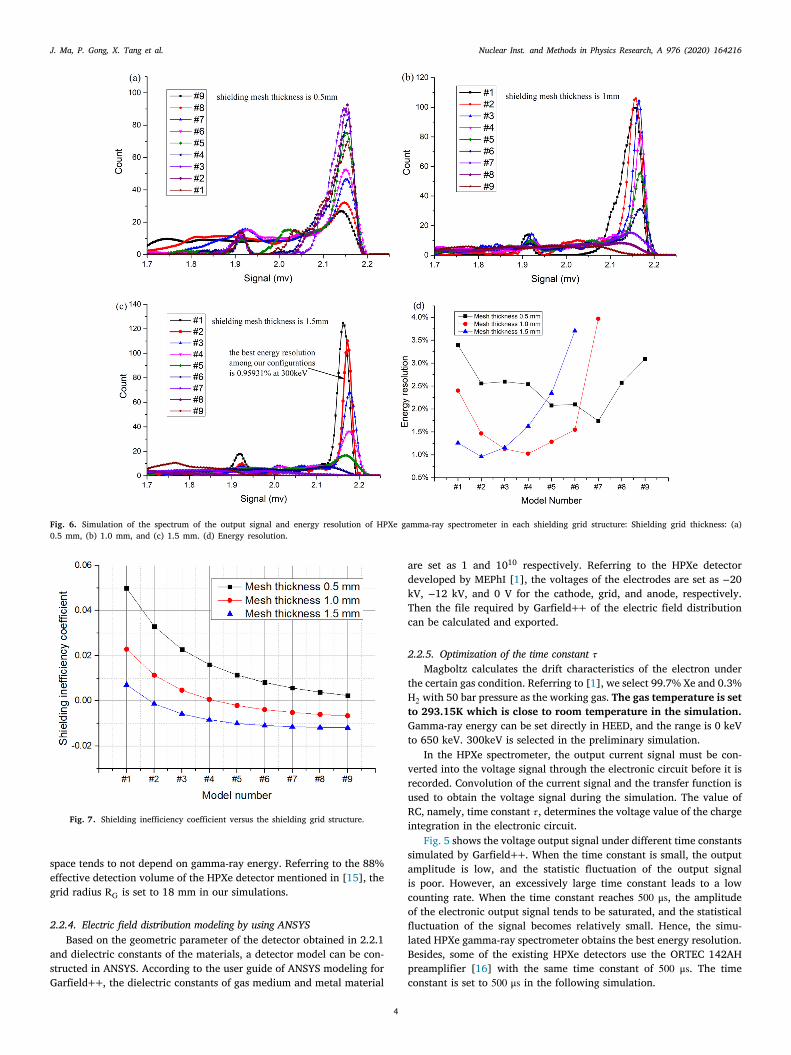
Fig. 6. Simulation of the spectrum of the output signal and energy resolution of HPXe gamma-ray spectrometer in each shielding grid structure: Shielding grid thickness: (a)0.5 mm, (b) 1.0 mm, and (c) 1.5 mm. (d) Energy resolution.
Fig. 7. Shielding inefficiency coefficient versus the shielding grid structure.
space tends to not depend on gamma-ray energy. Referring to the 88%effective detection volume of the HPXe detector mentioned in [15], thegrid radius RG is set to 18 mm in our simulations.
2.2.4. Electric field distribution modeling by using ANSYSBased on the geometric parameter of the detector obtained in 2.2.1
and dielectric constants of the materials, a detector model can be con-structed in ANSYS. According to the user guide of ANSYS modeling forGarfield++, the dielectric constants of gas medium and metal material
are set as 1 and 1010 respectively. Referring to the HPXe detectordeveloped by MEPhI [1], the voltages of the electrodes are set as −20kV, −12 kV, and 0 V for the cathode, grid, and anode, respectively.Then the file required by Garfield++ of the electric field distributioncan be calculated and exported.
2.2.5. Optimization of the time constant 𝜏Magboltz calculates the drift characteristics of the electron under
the certain gas condition. Referring to [1], we select 99.7% Xe and 0.3%H2 with 50 bar pressure as the working gas. The gas temperature is setto 293.15K which is close to room temperature in the simulation.Gamma-ray energy can be set directly in HEED, and the range is 0 keVto 650 keV. 300keV is selected in the preliminary simulation.
In the HPXe spectrometer, the output current signal must be con-verted into the voltage signal through the electronic circuit before it isrecorded. Convolution of the current signal and the transfer function isused to obtain the voltage signal during the simulation. The value ofRC, namely, time constant 𝜏, determines the voltage value of the chargeintegration in the electronic circuit.
Fig. 5 shows the voltage output signal under different time constantssimulated by Garfield++. When the time constant is small, the outputamplitude is low, and the statistic fluctuation of the output signalis poor. However, an excessively large time constant leads to a lowcounting rate. When the time constant reaches 500 μs, the amplitudeof the electronic output signal tends to be saturated, and the statisticalfluctuation of the signal becomes relatively small. Hence, the simu-lated HPXe gamma-ray spectrometer obtains the best energy resolution.Besides, some of the existing HPXe detectors use the ORTEC 142AHpreamplifier [16] with the same time constant of 500 μs. The timeconstant is set to 500 μs in the following simulation.
4
J. Ma, P. Gong, X. Tang et al. Nuclear Inst. and Methods in Physics Research, A 976 (2020) 164216
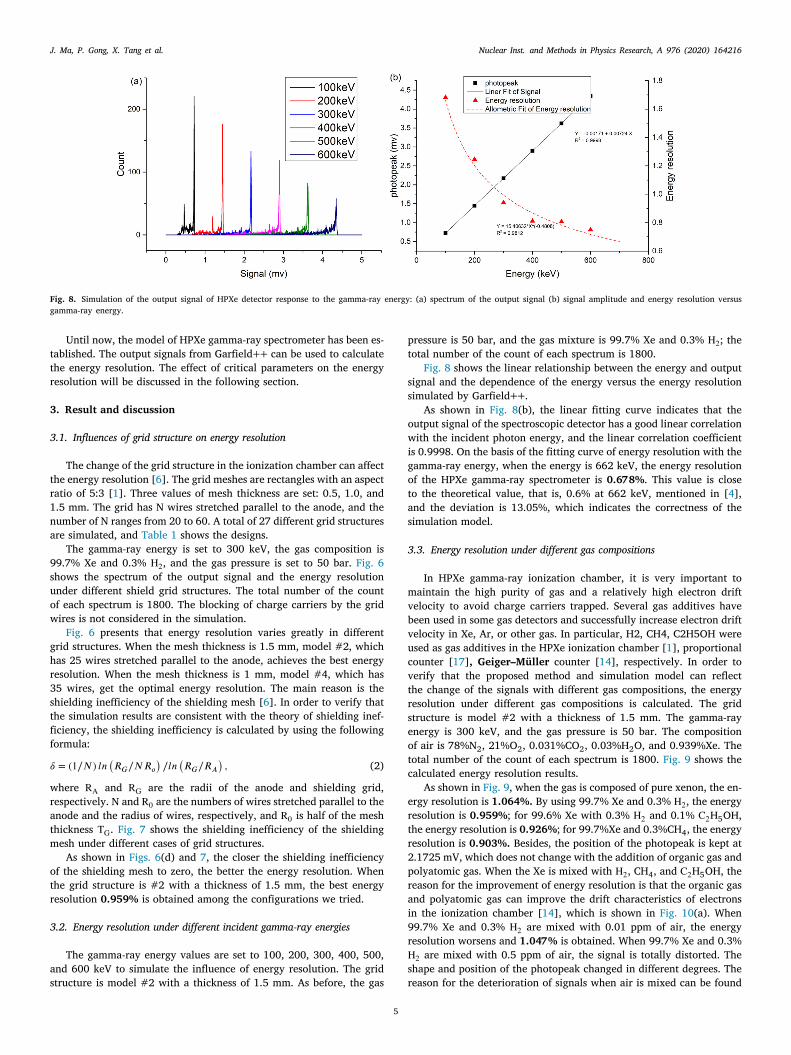
Fig. 8. Simulation of the output signal of HPXe detector response to the gamma-ray energy: (a) spectrum of the output signal (b) signal amplitude and energy resolution versusgamma-ray energy.
Until now, the model of HPXe gamma-ray spectrometer has been es-tablished. The output signals from Garfield++ can be used to calculatethe energy resolution. The effect of critical parameters on the energyresolution will be discussed in the following section.
3. Result and discussion
3.1. Influences of grid structure on energy resolution
The change of the grid structure in the ionization chamber can affectthe energy resolution [6]. The grid meshes are rectangles with an aspectratio of 5:3 [1]. Three values of mesh thickness are set: 0.5, 1.0, and1.5 mm. The grid has N wires stretched parallel to the anode, and thenumber of N ranges from 20 to 60. A total of 27 different grid structuresare simulated, and Table 1 shows the designs.
The gamma-ray energy is set to 300 keV, the gas composition is99.7% Xe and 0.3% H2, and the gas pressure is set to 50 bar. Fig. 6shows the spectrum of the output signal and the energy resolutionunder different shield grid structures. The total number of the countof each spectrum is 1800. The blocking of charge carriers by the gridwires is not considered in the simulation.
Fig. 6 presents that energy resolution varies greatly in differentgrid structures. When the mesh thickness is 1.5 mm, model #2, whichhas 25 wires stretched parallel to the anode, achieves the best energyresolution. When the mesh thickness is 1 mm, model #4, which has35 wires, get the optimal energy resolution. The main reason is theshielding inefficiency of the shielding mesh [6]. In order to verify thatthe simulation results are consistent with the theory of shielding inef-ficiency, the shielding inefficiency is calculated by using the followingformula:
𝛿 = (1∕𝑁) 𝑙𝑛(
𝑅𝐺∕𝑁𝑅𝑜)
∕𝑙𝑛(
𝑅𝐺∕𝑅𝐴)
, (2)
where RA and RG are the radii of the anode and shielding grid,respectively. N and R0 are the numbers of wires stretched parallel to theanode and the radius of wires, respectively, and R0 is half of the meshthickness TG. Fig. 7 shows the shielding inefficiency of the shieldingmesh under different cases of grid structures.
As shown in Figs. 6(d) and 7, the closer the shielding inefficiencyof the shielding mesh to zero, the better the energy resolution. Whenthe grid structure is #2 with a thickness of 1.5 mm, the best energyresolution 0.959% is obtained among the configurations we tried.
3.2. Energy resolution under different incident gamma-ray energies
The gamma-ray energy values are set to 100, 200, 300, 400, 500,and 600 keV to simulate the influence of energy resolution. The gridstructure is model #2 with a thickness of 1.5 mm. As before, the gas
pressure is 50 bar, and the gas mixture is 99.7% Xe and 0.3% H2; thetotal number of the count of each spectrum is 1800.
Fig. 8 shows the linear relationship between the energy and outputsignal and the dependence of the energy versus the energy resolutionsimulated by Garfield++.
As shown in Fig. 8(b), the linear fitting curve indicates that theoutput signal of the spectroscopic detector has a good linear correlationwith the incident photon energy, and the linear correlation coefficientis 0.9998. On the basis of the fitting curve of energy resolution with thegamma-ray energy, when the energy is 662 keV, the energy resolutionof the HPXe gamma-ray spectrometer is 0.678%. This value is closeto the theoretical value, that is, 0.6% at 662 keV, mentioned in [4],and the deviation is 13.05%, which indicates the correctness of thesimulation model.
3.3. Energy resolution under different gas compositions
In HPXe gamma-ray ionization chamber, it is very important tomaintain the high purity of gas and a relatively high electron driftvelocity to avoid charge carriers trapped. Several gas additives havebeen used in some gas detectors and successfully increase electron driftvelocity in Xe, Ar, or other gas. In particular, H2, CH4, C2H5OH wereused as gas additives in the HPXe ionization chamber [1], proportionalcounter [17], Geiger–Müller counter [14], respectively. In order toverify that the proposed method and simulation model can reflectthe change of the signals with different gas compositions, the energyresolution under different gas compositions is calculated. The gridstructure is model #2 with a thickness of 1.5 mm. The gamma-rayenergy is 300 keV, and the gas pressure is 50 bar. The compositionof air is 78%N2, 21%O2, 0.031%CO2, 0.03%H2O, and 0.939%Xe. Thetotal number of the count of each spectrum is 1800. Fig. 9 shows thecalculated energy resolution results.
As shown in Fig. 9, when the gas is composed of pure xenon, the en-ergy resolution is 1.064%. By using 99.7% Xe and 0.3% H2, the energyresolution is 0.959%; for 99.6% Xe with 0.3% H2 and 0.1% C2H5OH,the energy resolution is 0.926%; for 99.7%Xe and 0.3%CH4, the energyresolution is 0.903%. Besides, the position of the photopeak is kept at2.1725 mV, which does not change with the addition of organic gas andpolyatomic gas. When the Xe is mixed with H2, CH4, and C2H5OH, thereason for the improvement of energy resolution is that the organic gasand polyatomic gas can improve the drift characteristics of electronsin the ionization chamber [14], which is shown in Fig. 10(a). When99.7% Xe and 0.3% H2 are mixed with 0.01 ppm of air, the energyresolution worsens and 1.047% is obtained. When 99.7% Xe and 0.3%H2 are mixed with 0.5 ppm of air, the signal is totally distorted. Theshape and position of the photopeak changed in different degrees. Thereason for the deterioration of signals when air is mixed can be found
5

J. Ma, P. Gong, X. Tang et al. Nuclear Inst. and Methods in Physics Research, A 976 (2020) 164216
Fig. 9. Simulation of influence of gas composition on the energy resolution of HPXe gamma-ray detector.
Table 1Geometrical parameters of mesh on the shielding grid.
Mesh No. Number of wiresstretched parallel tothe anode
Mesh thickness(mm)
0.5 1.0 1.5
#1 20
Mesh size(mm)
7.80 × 5.20 7.05 × 4.70 6.30 × 4.20#2 25 6.09 × 4.06 5.34 × 3.56 4.59 × 3.06#3 30 4.95 × 3.30 4.20 × 2.80 3.45 × 2.30#4 35 4.14 × 2.76 3.39 × 2.26 2.64 × 1.76#5 40 3.53 × 2.35 2.78 × 1.85 2.03 × 1.35#6 45 3.05 × 2.03 2.30 × 1.53 1.55 × 1.03#7 50 2.67 × 1.78 1.92 × 1.28 1.17 × 0.78#8 55 2.36 × 1.57 1.61 × 1.07 0.86 × 0.57#9 60 2.10 × 1.40 1.35 × 0.90 0.60 × 0.40
in Fig. 10(b). The electronegative gas, such as oxygen, contained inthe air increases the attachment coefficient, which increases the chargecarrier trapping probability and affects signals collection. In Fig. 9(e),
on the one hand, due to the influence of electronegative gas, most ofthe amplitude of the signal of photopeak becomes smaller and formsthe main peak. On the other hand, because of the small content of
6

J. Ma, P. Gong, X. Tang et al. Nuclear Inst. and Methods in Physics Research, A 976 (2020) 164216
Fig. 10. Simulation of gas properties under different gas composition:(a) electron drift velocity versus electric field strength (b) attachment coefficient versus electric field strength.
electronegative gas, a small part of the signals does not get influencedand forms a small peak on the right of the main peak. In Fig. 9(f),because of the capture of most electrons in each signal, the photopeakamplitude gets reduced significantly and is close to the background. Itis meaningless to calculate the energy resolution in this case.
4. Conclusion
In this study, a method combining PHITS, ANSYS, and Garfield++was used to simulate the energy resolution of the HPXe gamma-raydetector. Geometric parameters were optimized by PHITS. ANSYS wasused to calculate the electric field distribution. Signals produced byGarfield++ were used to calculate the energy resolution. The influenceof critical parameters on energy resolution was discussed. The simu-lation results show that the variation of energy resolution with thegrid structure is consistent with the variation in shielding inefficiencyof the shielding grid. When the mesh thickness is 1.5 mm, and thenumber of wires stretched parallel to the anode is 25, the HPXe detectorobtains the best energy resolution among the configurations we tried.Under this grid structure, the output signal of the spectroscopic detectorhas a good linear correlation with the gamma-ray energy. Besides, thesimulation results show that the gas components have an influenceon the signal. The introduction of electronegative gas in the workinggas will cause signal distortion. Adding a little polyatomic gas canimprove the drift characteristics of electrons and obtain better energyresolution. The deviation of energy resolution at 662 keV between ourresult and the expected theoretical value is 13.05%. The results provethe accuracy and feasibility of the proposed simulation method.
There are some limitations of this simulation; for example, the upperlimit of the energy of gamma rays can only be set to 650 keV. Theseproblems are expected to be solved in the following study.
CRediT authorship contribution statement
Jinchao Ma: Methodology, Software, Investigation, Writing - orig-inal draft, Supervision, Data curation. Pin Gong: Conceptualization,Validation, Investigation, Funding acquisition, Formal analysis. Xi-aobin Tang: Project administration, Supervision, Writing - review &editing, Funding acquisition. Peng Wang: Writing - review & editing,Data curation. Wen Yan: Software, Investigation, Methodology, Writ-ing - review & editing. Dajian Liang: Supervision, Writing - review& editing. Zeyu Wang: Writing - review & editing, Investigation. RuiZhang: Supervision, Writing - review & editing, Methodology. XiaoleiShen: Writing - review & editing, Software.
Declaration of competing interest
The authors declare that they have no known competing finan-cial interests or personal relationships that could have appeared toinfluence the work reported in this paper.
Acknowledgments
This work was supported by the National Natural Science Foun-dation of China (Grant No. 11675078), the Fundamental ResearchFunds for the Central Universities (Grant No. NT2020017), the PrimaryResearch and Development Plan of Jiangsu Province, China (Grant No.BE2019727), the Funding of Jiangsu Innovation Program for GraduateEducation, China (Grant No. KYLX16_0353).
References
[1] V.V. Dmitrenko, S.E. Ulin, V.M. Grachev, K.F. Vlasik, Z.M. Uteshev, I.V.Chernysheva, K.V. Krivova, A.G. Dukhvalov, Perspectives of High PressureXenon Gamma-Ray Spectrometers to Detect and Identify Radioactive and FissileMaterials, in: NATO Sci. Peace Secur. Ser. B Phys. Biophys., 2008, pp. 155–172.
[2] V.V. Dmitrenko, Vibrostability of high pressure xenon gamma-ray detectors, IEEETrans. Nucl. Sci. 47 (2000) 939–943.
[3] L. Gao, X. Tang, P. Gong, W. Yan, M. Ye, P. Wang, J. Zhang, Baseline restorationmethod based on mathematical morphology for high-pressure xenon detectors,Nucl. Instrum. Methods A 904 (2018) 163–170.
[4] V.V. Dmitrenko, A.S. Romanyuk, S.I. Suchkov, Z.M. Uteshev, Compressed-XenonIonization Chamber for Gamma Spectrometry, Instruments Exp. Tech., New York,1986, pp. 20–23.
[5] A.E. Bolotnikov, V.V. Dmitrenko, I.V. Chernysheva, A.M. Galper, V.M. Gratchev,O.N. Kondakova, S.V. Krivov, S.I. Sutchkov, S.E. Ulin, Z.M. Uteshev, K.F. Vlasik,Y.T. Yurkin, Properties of compressed Xe gas as the detector medium for high-pressure Xe spectrometers, in: IEEE Nucl. Sci. Symp. Med. Imaging Conf. 1995,pp. 74–78.
[6] A. Bolotnikov, B. Ramsey, Improving the energy resolution of high-pressure Xecylindrical ionization chambers, IEEE Trans. Nucl. Sci. 44 (1997) 1006–1010.
[7] R. Zhang, P. Gong, X. Tang, P. Wang, C. Zhou, X. Zhu, L. Gao, D. Liang, Z.Wang, Reconstruction method for gamma-ray coded-aperture imaging based onconvolutional neural network, Nucl. Instrum. Methods A 934 (2019) 41–51.
[8] K. Niita, T. Sato, H. Iwase, H. Nose, H. Nakashima, L. Sihver, PHITS-A particleand heavy ion transport code system, Radiat. Meas. 41 (2006) 1080–1090.
[9] http://www.ansys.com/.[10] R. Veenhof, http://cern.ch/garfield/files.[11] A.S. Novikov, S.E. Ulin, I.V. Chernysheva, V.V. Dmitrenko, V.M. Grachev, D.V.
Petrenko, A.E. Shustov, Z.M. Uteshev, K.F. Vlasik, Xenon gamma-ray detector forecological applications, J. Appl. Remote Sens. 9 (2015).
[12] R.L. Conder, N.L. Newhouse, Cyclic pressure test of a filament-wound vesselcontaining liquid nitrogen, Cryogenics (Guildf) 20 (1980) 697–701.
[13] T. Tresca, H. Ze, Z. Jin, L.I.U. Peng, M. Cun, S.H.I. Jian, Discussion on thicknessformula of cylindrical shell under internal pressure, Press. Vessel Technol. (2012)18–21, (in Chinese).
[14] Glenn F. Knoll, Radiation Detection and Measurement, John Wiley & Sons, 2010.[15] S.N. P’ya, K.F. Vlasik, V.M. Grachev, V.V. Dmitrenko, A.S. Novikov, D.V.
Petrenko, A.E. Shustov, Z.M. Uteshev, S.E. Ulin, I.V. Chernysheva, Simulation ofthe xenon gamma spectrometer for analyzing radioactive materials, Bull. LebedevPhys. Inst. 41 (2014) 247–251.
[16] A.O. Pudov, A.S. Abyzov, S.A. Sokolov, L.N. Davydov, A.V. Rybka, V.E. Kutny,S.I. Melnikov, G.A. Kholomyeyev, S.A. Leonov, A.A. Turchin, Measurements andmodeling of charge carrier lifetime in compressed xenon, Nucl. Instrum. MethodsA 892 (2018) 98–105.
[17] H. Sakurai, B.D. Ramsey, Characteristics of a high-pressure gas proportionalcounter filled with xenon, Proc. SPIE 1549 (1991) 20–27.
7