Embed Size (px)
Citation preview
Appendix B - Cherwell Hydraulics Technical Note_D1.doc
Project: Oxford City SFRA Level 2 To: Mapping & Data Management Team, Red Kite House
Subject: Hydraulic Assessment of the River Cherwell
From: Esther Ainsworth
Date: 5th August 2011 cc: Richard Wyatt
1. Introduction
This brief technical note describes the hydraulics assessment of the River Cherwell, undertaken
as part of the Oxford City Council Strategic Flood Risk Assessment Level 2. The purpose of the
assessment was to assess the flood hazard associated with the allocation site of St. Cross
College Annex at NGR: 452120 206570 to assess whether the site would pass part c) of the
Exception Test. In order to generate estimates of flood hazard for the study site, a 2D model was
required to provide flood depths and velocities across the site. This 2D model was built using
TUFLOW, and connected to the existing ISIS model of the River Cherwell.
2. Existing Model
2.1.1. Overview
A hydraulic model covering Oxford had previously been constructed by the Environment Agency,
and was made available for this study. As well as the River Cherwell, the model also covers
Bulstake and Hinksey Streams, and the River Thames/Isis. The model has been constructed
using the 1D ISIS river modelling package, with one area covered by a 2D TUFLOW model that
has been linked to the ISIS model. This 2D TUFLOW model does not cover the River Cherwell.
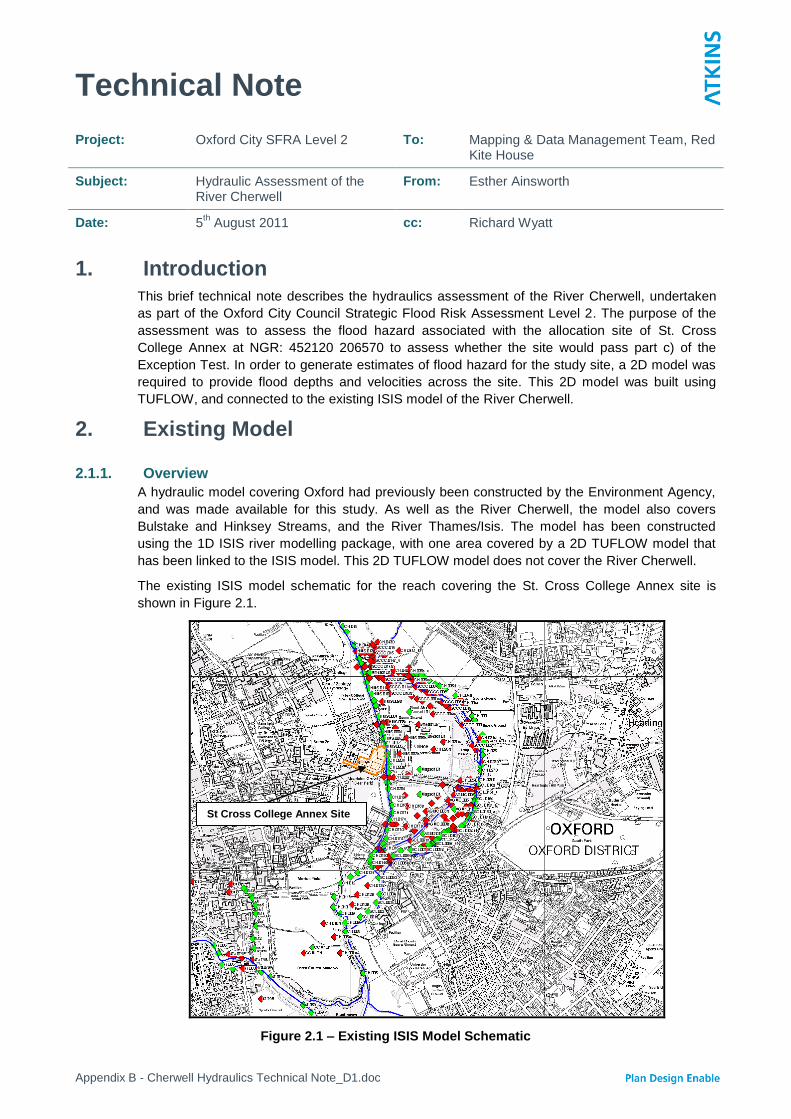
The existing ISIS model schematic for the reach covering the St. Cross College Annex site is
shown in Figure 2.1.
Figure 2.1 – Existing ISIS Model Schematic
Technical Note
St Cross College Annex Site
Appendix B - Cherwell Hydraulics Technical Note_D1.doc
2.2. Review The existing ISIS model of the River Cherwell was reviewed for the reach of the River Cherwell
relevant to this study and a number of limitations that are of concern have been identified, as
follows:
1) There are incorrect chainages between sections contained in the model, particularly around structures and river confluences. Over 200m of river length has been “lost” along the short study reach. This means that sections in the model are not where they should be, and therefore flood levels may be incorrect.
2) A number of structures are not present in the model. Whilst some of these are small footbridges, the roadbridge at St Catherine‟s College and the structure to the south east of the site that has been built over the river are not included within the model. No data is available from the survey for these structures, so it has not been possible to update the model to include them.
3) A structure is included adjacent to the study site but no commentary is present in the model, so it is not certain what this is supposed to represent. This structure has been left in the model to ensure consistency with the existing baseline dataset. The aforementioned chainage issue above also applies to this structure, meaning that its exact location in relation to the study site could not be determined.
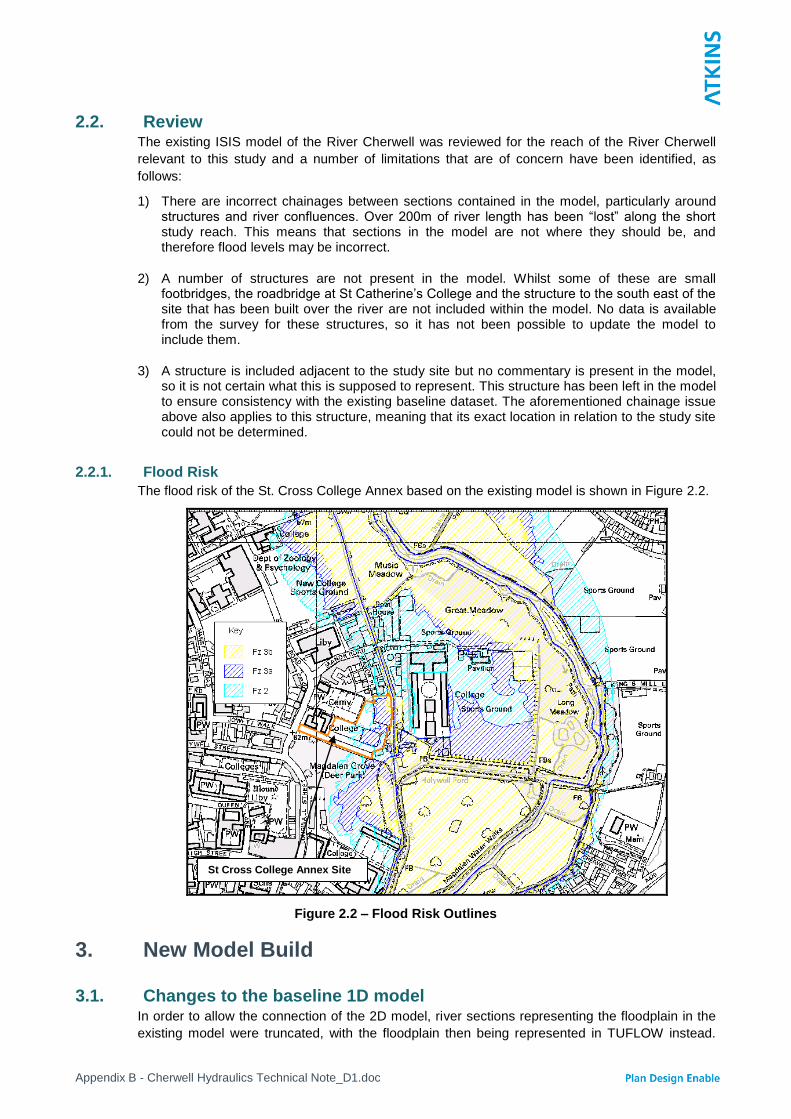
2.2.1. Flood Risk
The flood risk of the St. Cross College Annex based on the existing model is shown in Figure 2.2.
Figure 2.2 – Flood Risk Outlines
3. New Model Build
3.1. Changes to the baseline 1D model In order to allow the connection of the 2D model, river sections representing the floodplain in the
existing model were truncated, with the floodplain then being represented in TUFLOW instead.
St Cross College Annex Site
Appendix B - Cherwell Hydraulics Technical Note_D1.doc
Additionally, extra sections around bridges and confluences were added to account for the
missing chainage.
3.2. 2D model build Given the complex nature of the floodplain of the River Cherwell and the urban environment, a
TUFLOW 2D model was built to represent it. 2D modelling is more accurate than modelling with
extended sections in a 1D package such as ISIS, and allows for accurate representation of out of
bank flow paths.
3.2.1. Lidar
Lidar data was obtained from the Environment Agency to assign elevations in the TUFLOW model.
The 1m resolution LiDAR DSM was not altered, although areas with missing values were filled
where necessary.
3.2.2. Model Extent
The 2D model was built to include the floodplain on the right bank of the river between Marston
Ferry Road to the north, and the High Street (A420) to the south.
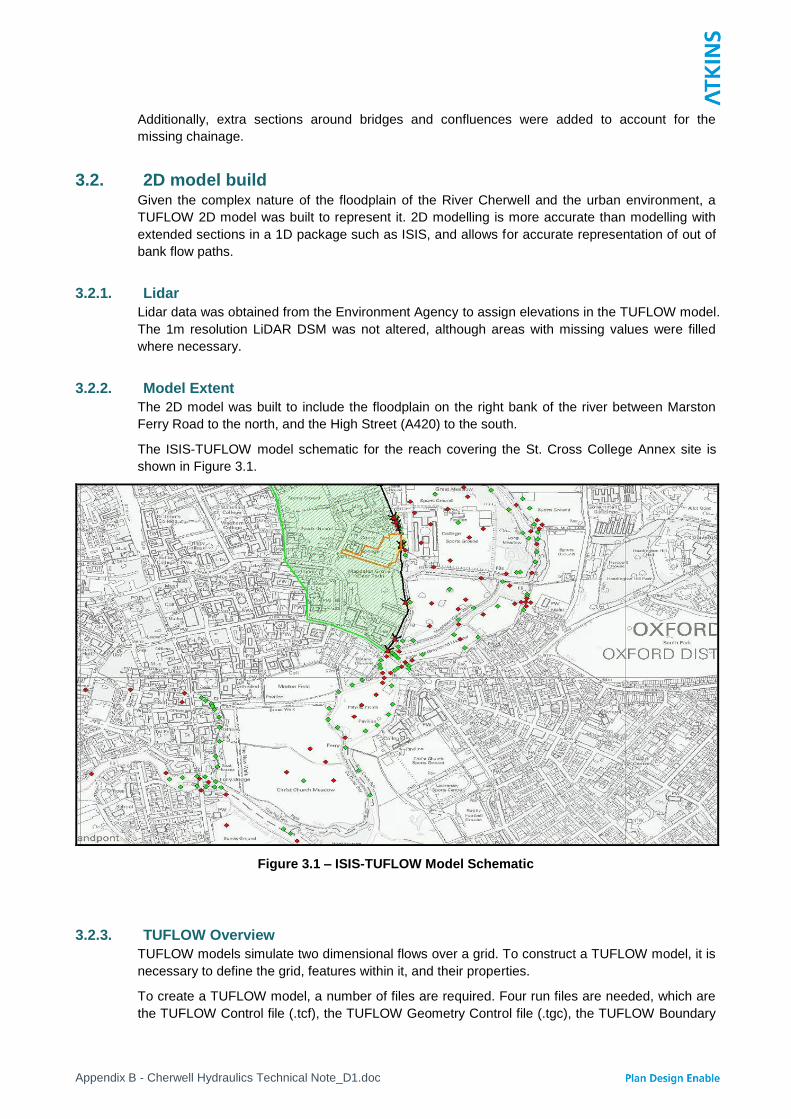
The ISIS-TUFLOW model schematic for the reach covering the St. Cross College Annex site is
shown in Figure 3.1.
Figure 3.1 – ISIS-TUFLOW Model Schematic
3.2.3. TUFLOW Overview
TUFLOW models simulate two dimensional flows over a grid. To construct a TUFLOW model, it is
necessary to define the grid, features within it, and their properties.
To create a TUFLOW model, a number of files are required. Four run files are needed, which are
the TUFLOW Control file (.tcf), the TUFLOW Geometry Control file (.tgc), the TUFLOW Boundary
Appendix B - Cherwell Hydraulics Technical Note_D1.doc
Conditions file (.tbc), and the TUFLOW Materials file (.tmf). The purpose of each of these files is
defined in Table 3.1 below.
Table 3.1 - TUFLOW Run Files
Run File Purpose
.tcf
sets the model projection
references the location of the three other run files
sets run parameters such as timestep, start and end time, and
initial water level
defines output type and location
.tgc
defines the grid location
sets grid size and cell size
references model boundaries and active areas (3.2.4) Z Points
(3.2.5) and materials roughness values (3.2.7)
.tbc references the model boundaries (3.2.6)
.tmf defines values of Mannings „n‟ for materials (Table 3.3)
Further to the run files, a number of GIS tables are required in the model. These are detailed in
Table 3.2 below.
Table 3.2 - TUFLOW GIS Tables
GIS Table Purpose
Location The location table is a line defining the orientation of the x-axis
of the grid, from its south west corner
Code The code table defines whether Z Points within the grid are
active within the model
Z Points The Z Point table defines the elevations at each point of the
grid
Z Lines
Z Lines can be used to define features such as embankments,
gullies and tunnels which would affect flow and flow paths, but
may not have been picked up by the LiDAR data
Boundary Conditions
The boundary conditions table defines the boundaries between
the 1D model and TUFLOW, inflows to the TUFLOW model,
and links to nodes within the 1D model
Materials The materials file delineates areas of similar materials, such as grass, buildings or roads, in order to assign values of roughness
3.2.4. Code
In order to define which areas are within the TUFLOW model, and which are not, a GIS table was
created. This table defines the outer limits of the TUFLOW model, which was delineated according
to the Flood Zone 2 outline from the updated Level 1 SFRA of Oxford City and LiDAR data.
Appendix B - Cherwell Hydraulics Technical Note_D1.doc
3.2.5. Z Points
A table of Z Points is created for the grid using the Location GIS table and the grid size required.
These Z Points are then assigned elevations based on the LiDAR data using Vertical Mapper
software to inspect each point.
For this study a grid size of 10m was chosen, as a larger grid size was deemed too inaccurate and
a smaller grid size would have resulted in excessive model run times. This grid size is deemed
acceptable for a strategic level study as part of the Level 2 SFRA for Oxford.
3.2.6. Boundary Conditions
The boundary between the 1D ISIS model and the 2D TUFLOW model is defined according to a
GIS table referenced in the TUFLOW Control File. This table defines the location of spills between
the models, and connections of these spills to the individual nodes within the 1D model. The
elevation of the spills is taken from the TUFLOW model, and so it is important to set Z Points
around the 1D-2D spills to levels matching those found in the 1D model. In order to achieve this, a
table was created to overwrite the elevations of the Z Points in the TUFLOW model, and the
elevations in this table were defined according to the bank levels given in the ISIS model.
3.2.7. Roughness Values
In order to assign roughness values in the TUFLOW model, in the absence of MasterMap data,
building areas were digitised from OS background mapping and assigned roughnesses of 0.1,
with all other areas being 0.05. The groups used, and the values of Manning‟s „n‟ assigned to
each, is given in Table 3.3 below. These roughness values are the same as those in the existing
Environment Agency TUFLOW model of the River Cherwell to ensure consistency.
Table 3.3 - Manning's 'n' Values Assigned In TUFLOW
Grouped Area Manning’s ‘n’ Assigned
Base model value 0.050
Natural Surface 0.050
Manmade Surface 0.040
Garden 0.045
Rough Vegetation 0.085
Buildings 0.100
Roads 0.035
Railway 0.045
Water 0.020
Unclassified 0.040
Banks 0.085
4. Model results
4.1. Flood Risk Under the existing outlines, the site is partially covered by Flood Zone 3b, 3a and 2 (yellow, dark
blue and light blue outlines in Figure 4.1). The revised model with 2D area, truncated 1D sections,
and additional sections around structures and confluences was run for the 20, 100 and 1000 year
(5%, 1% and 0.1% AEP) events to produce updated Flood Zones 3b, 3a and 2 (Flood Zone 3a
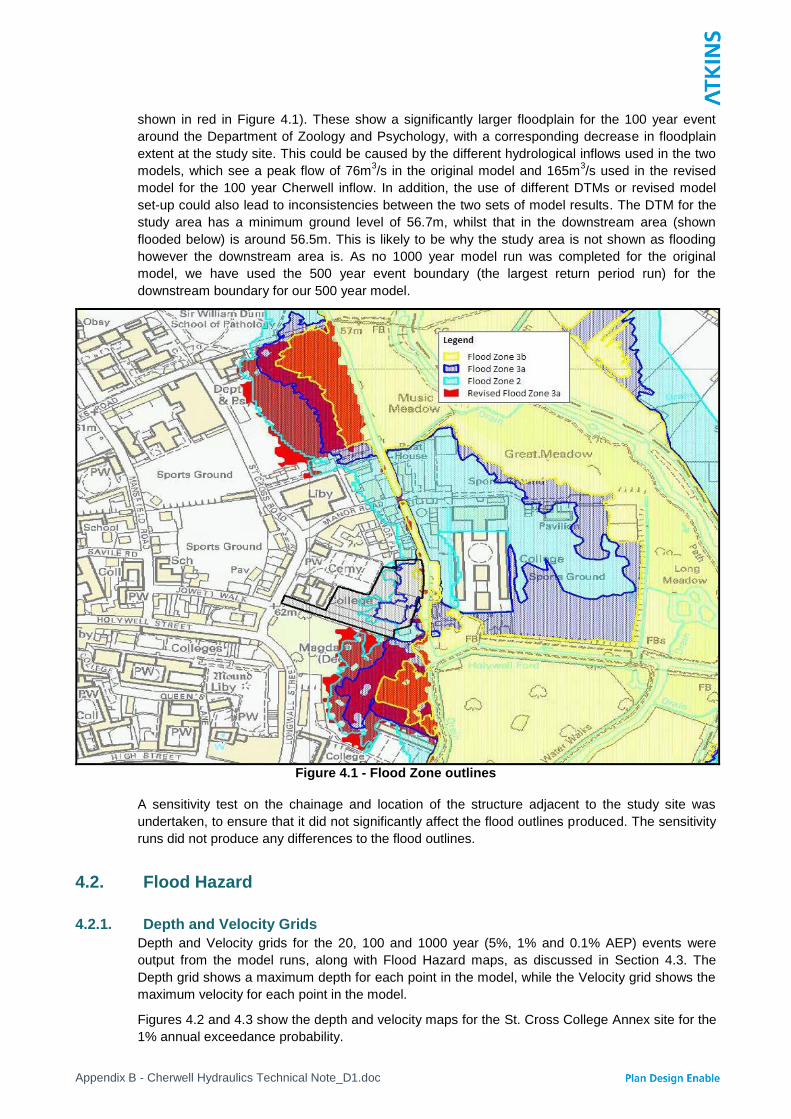
Appendix B - Cherwell Hydraulics Technical Note_D1.doc
shown in red in Figure 4.1). These show a significantly larger floodplain for the 100 year event
around the Department of Zoology and Psychology, with a corresponding decrease in floodplain
extent at the study site. This could be caused by the different hydrological inflows used in the two
models, which see a peak flow of 76m3/s in the original model and 165m
3/s used in the revised
model for the 100 year Cherwell inflow. In addition, the use of different DTMs or revised model
set-up could also lead to inconsistencies between the two sets of model results. The DTM for the
study area has a minimum ground level of 56.7m, whilst that in the downstream area (shown
flooded below) is around 56.5m. This is likely to be why the study area is not shown as flooding
however the downstream area is. As no 1000 year model run was completed for the original
model, we have used the 500 year event boundary (the largest return period run) for the
downstream boundary for our 500 year model.
Figure 4.1 - Flood Zone outlines
A sensitivity test on the chainage and location of the structure adjacent to the study site was
undertaken, to ensure that it did not significantly affect the flood outlines produced. The sensitivity
runs did not produce any differences to the flood outlines.
4.2. Flood Hazard
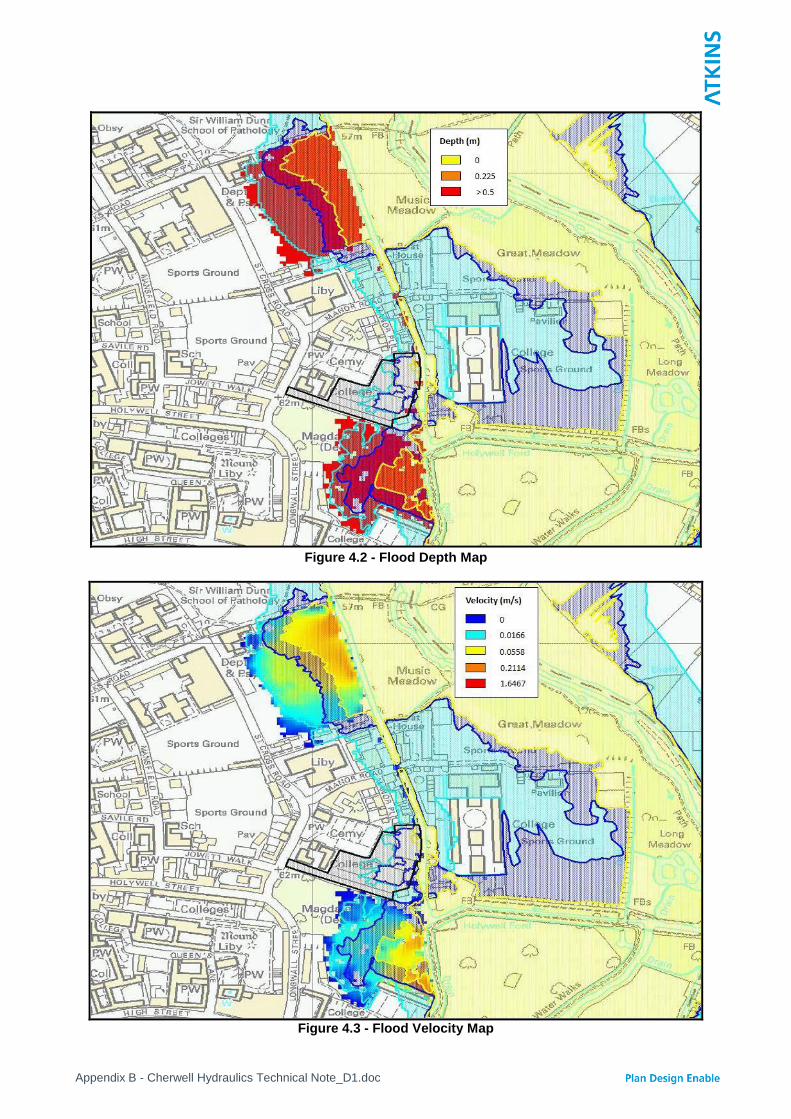
4.2.1. Depth and Velocity Grids
Depth and Velocity grids for the 20, 100 and 1000 year (5%, 1% and 0.1% AEP) events were
output from the model runs, along with Flood Hazard maps, as discussed in Section 4.3. The
Depth grid shows a maximum depth for each point in the model, while the Velocity grid shows the
maximum velocity for each point in the model.
Figures 4.2 and 4.3 show the depth and velocity maps for the St. Cross College Annex site for the
1% annual exceedance probability.
Appendix B - Cherwell Hydraulics Technical Note_D1.doc
Figure 4.2 - Flood Depth Map
Figure 4.3 - Flood Velocity Map
Appendix B - Cherwell Hydraulics Technical Note_D1.doc
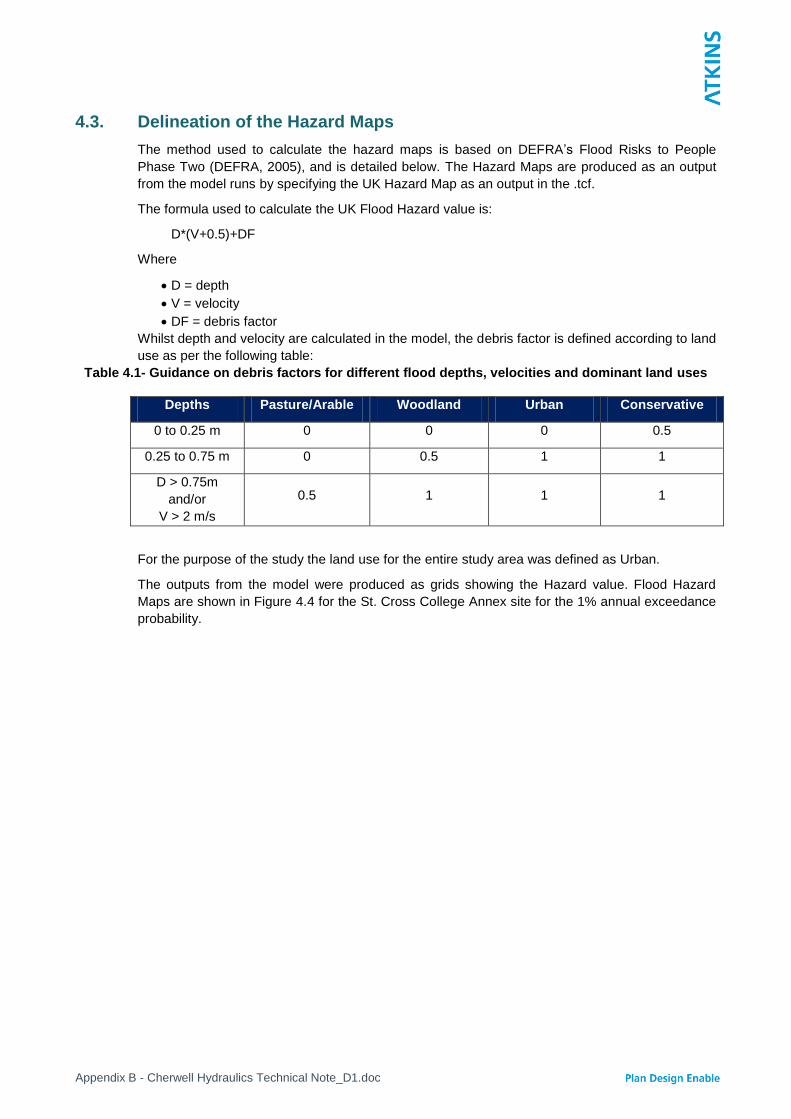
4.3. Delineation of the Hazard Maps
The method used to calculate the hazard maps is based on DEFRA‟s Flood Risks to People
Phase Two (DEFRA, 2005), and is detailed below. The Hazard Maps are produced as an output
from the model runs by specifying the UK Hazard Map as an output in the .tcf.
The formula used to calculate the UK Flood Hazard value is:
D*(V+0.5)+DF
Where
D = depth
V = velocity
DF = debris factor
Whilst depth and velocity are calculated in the model, the debris factor is defined according to land
use as per the following table:
Table 4.1- Guidance on debris factors for different flood depths, velocities and dominant land uses
Depths Pasture/Arable Woodland Urban Conservative
0 to 0.25 m 0 0 0 0.5
0.25 to 0.75 m 0 0.5 1 1
D > 0.75m
and/or
V > 2 m/s
0.5 1 1 1
For the purpose of the study the land use for the entire study area was defined as Urban.
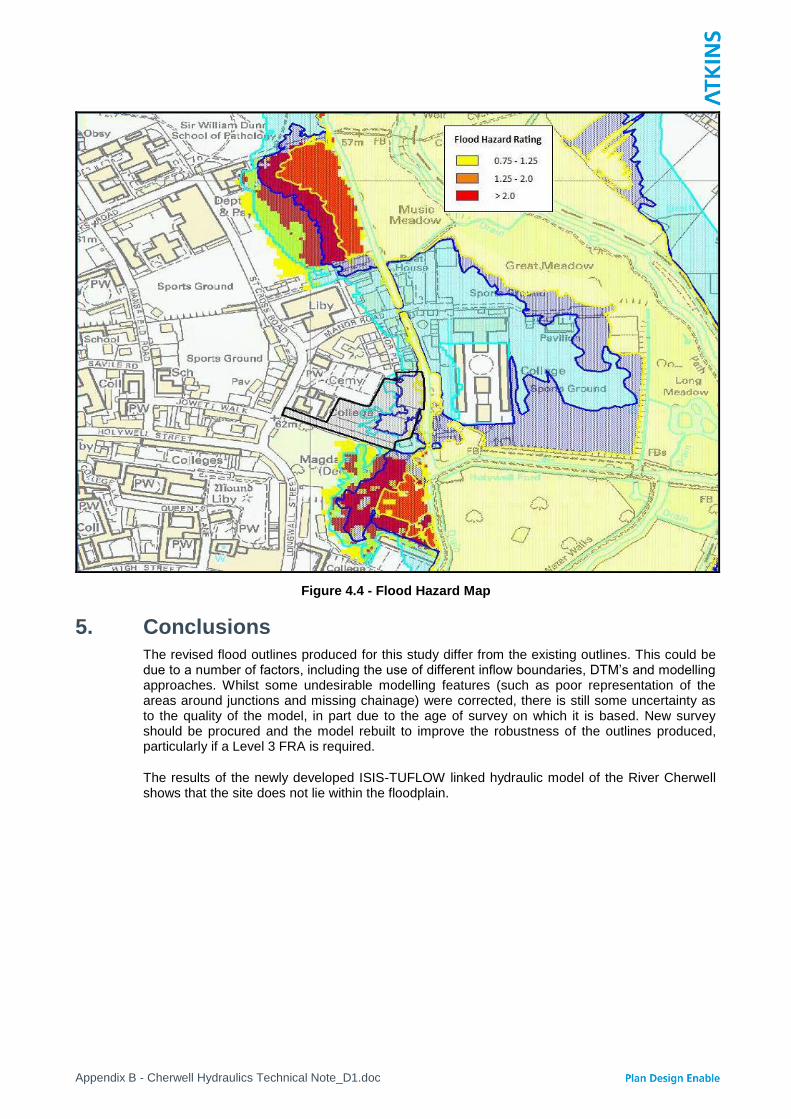
The outputs from the model were produced as grids showing the Hazard value. Flood Hazard
Maps are shown in Figure 4.4 for the St. Cross College Annex site for the 1% annual exceedance
probability.
Appendix B - Cherwell Hydraulics Technical Note_D1.doc
Figure 4.4 - Flood Hazard Map
5. Conclusions
The revised flood outlines produced for this study differ from the existing outlines. This could be due to a number of factors, including the use of different inflow boundaries, DTM‟s and modelling approaches. Whilst some undesirable modelling features (such as poor representation of the areas around junctions and missing chainage) were corrected, there is still some uncertainty as to the quality of the model, in part due to the age of survey on which it is based. New survey should be procured and the model rebuilt to improve the robustness of the outlines produced, particularly if a Level 3 FRA is required.
The results of the newly developed ISIS-TUFLOW linked hydraulic model of the River Cherwell shows that the site does not lie within the floodplain.