Embed Size (px)
Citation preview
g_7
Z
<
<Z
i!'
!_6Z71678NASA TN D-n04
//j, / -,:/
TECHNICALD-llOZ,.
NOTE
EXPERIMENTAL STUDY OF COMBINED FORGED AND FREE
LAMINAR CONVECTION IN A VERTICAL TUBE
By Theodore M. Hallman
Lewis Research Center
Cleveland, Ohio
NATIONAL AERONAUTICS AND SPACE ADMINISTRATION
WASHINGTON December 1961
https://ntrs.nasa.gov/search.jsp?R=19980235517 2018-05-14T04:03:30+00:00Z


IH
NATIONAL AERONAUTICS AND SPACE AD_L_NISTRATION
TECHNICAL NOTE D-If06
EXPERImeNTAL STUDY OF CO_%BINED FORCED A},_D_E_E
LAI_LINAR C0_TVECTION IN A VERTICAL TUBE I
By Theodore M. HalL_ko,n
SU}_JhRY
An apparatus was built to verify an analysis oL_ combined forced antifree convection in a vertical tube with uniform wall heat flu_< and to
determine tile limits of the analysis. The test section was electrically
heated by resistance heating of the tube wall and was instr_u_lented witk
thermocouples in such a way that detailed thermal entrance heat-t_:'ans±'e_•
coefficients could be obtained for both upl_low and downflow and any asy__-
metry in wall temperatu='e could be detected.
The experiments slowed that Yully developed heat-transfer results_
predicted by a previous analysis_ were confir-Lled over the _'ange of
Rayleigh numbers investigated. The concept of loca±ly i_ll]_ydevelopud
heat transfer _.,Jasestablished. This concept involves the assu_,_ption
that the fully developed heat-t_'ansfer analysis can be applied locally
even though the Rayleigh n_iber is varying along the tube because of
physical-property variations with temperature.
Thermal entrance region data we±'e obtained fo_r pure forced convec-
tion and for combined forced and free convection. The analysis of lam-
inar l_ire forced convection in the thermal entrance J'egion conducted by
Siegel_ Sparrow_ and Hal]man was e_,_peri_lental]y confir_ed. A t:'ansition
to an eddy motion_ indicated by a fluctuation in wall te_tperature_ was
found in many of the upflow runs. A stability correlation was fo,_tnd.
The fully developed Nusselt numbers i.n downflow were below those for
pure forced convection but fell about i0 percent above the analytical
curve. Quite large circu__iferential va_'iations in _,;alltemperature were
observed in downflow as compared with those encountered in upf]o_, and
the fully developed Nusselt numbers reported are based on average wail
temperatures determined by averaging the readings of two diametrical ly
opposite wall thermocouples at each axial position. With larger heating
rates in downflow the wall temperat<a'e distributions strongly suggested
a cell flow near the bottom. At still larger heating rates the wall tem-
peratures varied in a pe_'iodic way.
iThe information presented herein is an abbreviated i_o±'mof a thesis
entitled "Combined Fo_ced an<] Free Convection in a Vei_%ical _be" sub-
mitted in partial :'u_i'il]m___ntoi' [,',ei'e<f].l'ei:_<.n_ts['ol't]_e d.e£:.veeoJ
Doctor oi' P]_£1osophy at Pu_due Unive_s].ty, ]'!<_ .
_NTRODUCTION
Description of the Problem
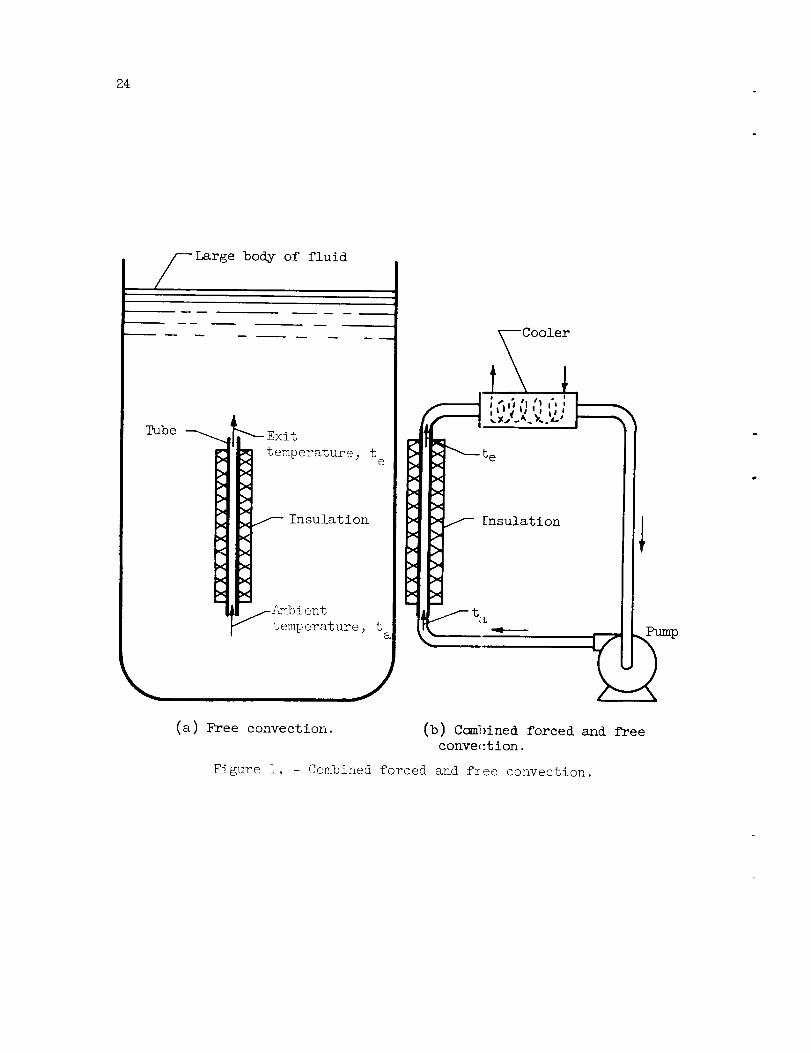
A description of the problem considered Ln this report is perhapsbest introduced by considering the simple physical system illustrated infigure l(a). This sketch illustrates a round tube of finite length im-mersed in a large body of fluid which is at sm_euniform temperature._e tube is positioned with its axis vertical, and the outer surface ofthe tube is perfectly insulated.
If there is no heat transfer to or work lone on the system_ thefluid remains at rest, the buoyant forces on _ach element of fluid beingexactly balanced by the hyd_'ostatic pressure. However; if the tube isheated in someway, the fluid within the tube changes temperature andits density decreases.Z _is reduced density causes an increase in thebuoyant force_ and the fluid te_ids to rise and pass out the top of thetube, where it mixes wi_h _he large massof ur_heatedsurrounding fluid.This action draws cold fluid into the bottom _f the tube_ and hence apumping action occurs. This type of flow and heat transfer is commonlycalled free convection.
If the surrounding fluid is replaced by _hecooler piping system andpumpshownin figure l(b) and _he cooling and pu_apingrates are con-trolled to _laintain the temperatua_es t a and t e unchanged, conditionsare unchanged inside the pipe. This situatio_l is comm_onlycalled com-bined forced and free convection.
There is one important distinction betwe,_nthe two situations justdescribed. In the first situation, for a giwm heating rate in the tube_there is a unique flow rate established, whicll is such that the pressured_'opthrough the tube is exactly balanced by _he net buoyant force. Inthe second situation_ on the other hand, ther_ is freedom to adjust thep_umpflow rate to any desired value. Of cour_e_ when the flow rate ischanged, the heat-transfer rate must be chang,,_din order to keep taand t e unchanged. The buoyant forces still exist_ regardless of theflow rate, but only one flow rate corresponds to the free-convectionsituation. _ere is no basic difference in t]_e case of "pure free con-vection"; it is merely a special case of the _o-called combinedforcedand free convection.
_len the flow rate is gradually increase_[ in the apparatus showninfig_re l(b), the buoyant force becomesless a_id less important in com-parison with the p_mlpingforce. The term "fo_ced convection" is used todescribe the li_.miting situation whenthe buoy_nt forces are negligible.Since all fluids change in density whenheate_l, pure forced convection
CMost fluids behave in this manner, alth_ugh there are exceptions.
3
is never exactly realized. Oneof the goals of the present study was toestablish when the buoyant, or free-convection effect, is negligible.
There are a great manypossible variations to the problem consid-ered. The tube walls maybe heated in different ways (two co_m_lonwaysare uniform wall temperature and uniform wall heat flux). In addition,internal heat sou_'ces, due to chemical or nuclear reactions, either uni-form or nonuniform, _y be present within the fluid inside the tube. Thetube dism_eterand length maybe varied, as well as the kind of fluid.Finally_ the cross-sectional shape maybe round, square, or someothershape.
Whenthe cool fluid enters the bottom of the tube, it is heated andrises. If the tube is long enough, and if the boundary conditions aresuitable, the radial velocity and temperature profiles beyond a certaininlet length are si_milar to the corresponding profiles at other crosssections farther up the tube. This region is knownas the region of"fully developed" flow and heat transfer. The length of the tube re-quired to establish si_milar profiles is called the "entrance length. "
The problem considered herein is one of co_ined forced and freelaminar convection in a vertical round tube. The boundary conditionsconsidered are uniform wall heat flux. No heating was present withinthe fluid.
The transfer of heat by coJ_ined forced and free convection in ver-tical channels (more generally, in channels in _ich the flow is parallelto the direction of the body force, i.e., gravity or centrifugal) is veryco_n, but only in recent years has muchattention been placed on deter-mining the characteristics of such systems. Possible uses in nuclearreactor or turbine blade cooling are mainly responsible for recent inter-est in this modeof heat transfer.
l_rpose of Experiment
The purpose of the experiment was to check the analysis of refer-ence i and also to provide infor_tion about the region of applicability,that is, the transition Reynolds and Rayieigh numbersand the entrancelengths required for the flow to becomefully developed. The limitingcase of pure la_nar forced convectiom, including thermal entrance ef-fects, was also to be studied.
The specific case chosen for the experiment was combined forced andfree is_inar convection in a vertical round tube with uniform wall heatflux and no internal heat generation. Provision was madefor both up-flow with heating and downflow with heating, that is, both positive andnegative Rayleigh numbers. T_e apparatus was designed to be suitable
as well for obtaining data on pure forced co_vection_ both laminar andturLu_lent. Previous data (refs. _ and 6) foc the laminar region weresul_jecb to large e::perimental error.
SURVEYOFTEELITERATURE
Theoretical Investiga _ions
The _alysis of the case of combined fo:'ced and free convection ina vertical round tu%ewith uniform wall heat flux is considered in ref-erences i and 4 to _. None of these analyses consider entrance effectso_• turbulence or transition to turbulence. The limiting case of pureforced convection in thermal entrance regions is analyzed in reference 0.
mxp_r_m_enca_]_Investig _tions
Somedata on combined forced and free c)nvection in vertical pipeswibh uniform wall heat flux are given in references _ 3, i0_ and i!.Refe_'enceI! includes somei_ufor_mtion on transition to turbulence.Si_n_'_e wall tempers_bures weL'e not measured it was not possible to calcu-late Nusselt mui_.bers.
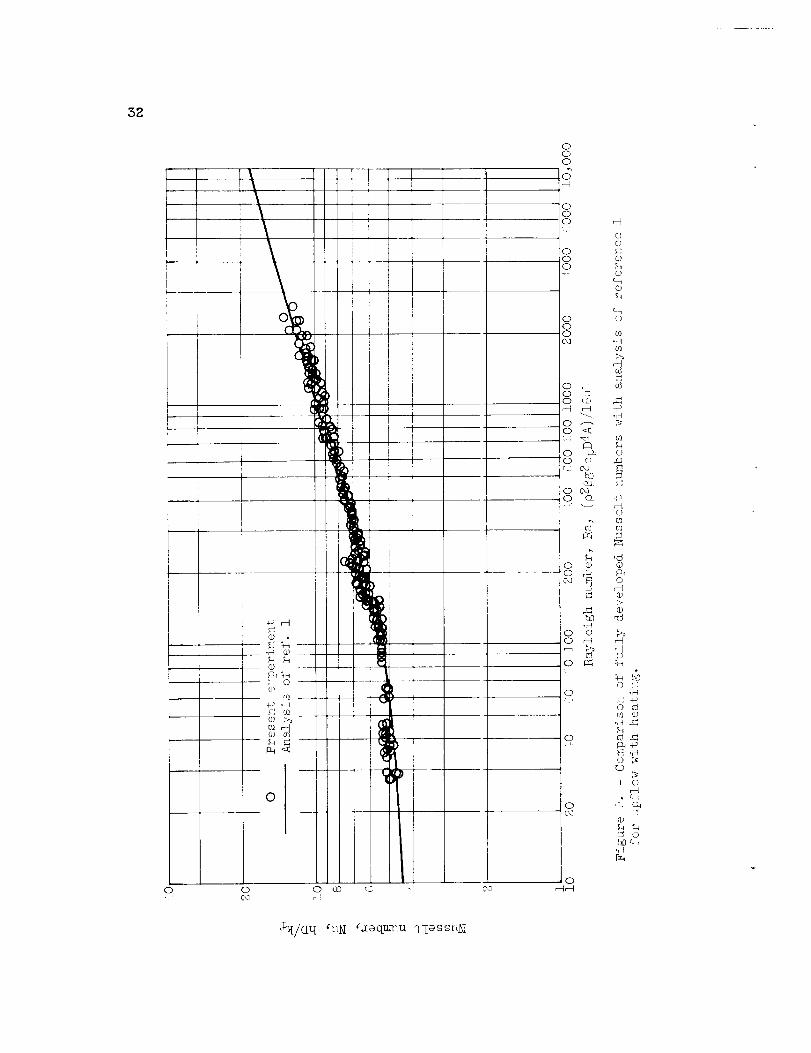
Comparison of Previous Experimen _s with Analysis
The e:<perimental data from o gher experi lents a_'e compared with the
analysis of reference i in figure 2. The sol_id line represents the anal-
ysis. Tl_e Nosselt n<mf_ers in the range i00:2 Ra S I0,000 are accurately
app_'oximated by the eo '_uatlon
Nu = 1.40 Ra 0"23 (1)
Tllis L'elation is shown iJi _'_{:_,_',<o_e 2 by the da{lled line. (S_Nil%ols are de-
fined in ,_ppendi_x A. )
The expe:ri:uental poinbs sho_u_ as square_ in figure Z are the data
of _'eference i0 for high-pressure water (20@) and iSO0 ib/sq in. abs)
flowing ul_,_ard in a vertical electrically he:Lted tube. The tube had an
inside dlm_oe • of 0.]_03 inc]_ and a lengbh _)f c_inches and thus an L/D
or ;-0.
These data fall below the analysis. In reference 18 these same data
a_'e co_@a_'ed on a _,_ifferent basis with other experimental data and are
t'o_,',d to fall low there as well.
f<
_%.7o other experiments have pJ'ovided data for Xower Rayleigh n_N1-
bets. Tkese experiments ;,,ere designed for pu_E'e fo_'ced convective i'lo_
but the Rayleig}L nu_:foers were high enougk in some cases to show signifi-
cant free convective effects. The first experiment is that of Gross
(ref. 2). TLese daba are shown as circles in figure 2 and are for ware:"
in upf!ow in an electrically heated tube. _qm:ee tubes of 0.SS44-_
0.SOo-_ and O.%SS-inch inside diameter were used.
Heated tube lengths varied from 2 to [i feet. Local heat-transfer
data were z'eported but only data wkicb satisfy the condition
> 0.0ooHePr
are plotted here. 3 This is tlLe condition found necessary in reference
9 fox" the Nusselt numbers for pure forced con,section l_J_inar heat t::'o,ns -
fer to be within 3 percent of the fully developed value. T]lis condition
is for a fully developed entering velocity profile and a _lnifor__l ;_all
heat flux corresponding to this experiment. Also_ all data for Re_n_olds
nuiilbers greater than 2000 were not plotted. It f_s seen that the scatte±'
in the a_ta of reference 8 is ,_=_ite large. The higher val_aes of Nusselt
numbers at low and high Ray!eigh nLmi}ers are bel_ieved to be cause rt by
bus bar conduction lowerin 6 the tube wall1_ temperatures at entrance s, nd
exit. Despite -the large scatter, the trend in tl_e data &way from the
pure forced convection Nusselt n%rki}er of 6.3_3 is largely accounted for
by the analytical curve shown.
_%_o data points at low Rayleigh numbeL" i'ro<_ an experiment repoli'ted
in reference S are shown as triang]_es in fi_s_tre 2. These data a_e fo '
water flowing utm:az'd in an electrically heated vertical tube. The %_be
had am inside dia_teter of 0.288% inch and a heated length of 12 feet.
The entering velocity p_"ofile was probably nearly Rniform_ so t}le only
data sho_sn are those for which
s'-%s-iD->RePr
This is the _'e,:£uzremcnb for the Nussel t numbers to be within i:} percent
of the fully developed, value ii" the entering velocity profile is _nifo_'iz
and the wall heat flux is uniform (re/'. 1S).
r.
OFor bh'_s reason -'e'_,er poknts are showm 11_n J'ic_±'e % than a]'e sho',..n
in .i'Lgure / of ik'eference 1.

DESCRIPTION OF APPARATUS
Flow Loop
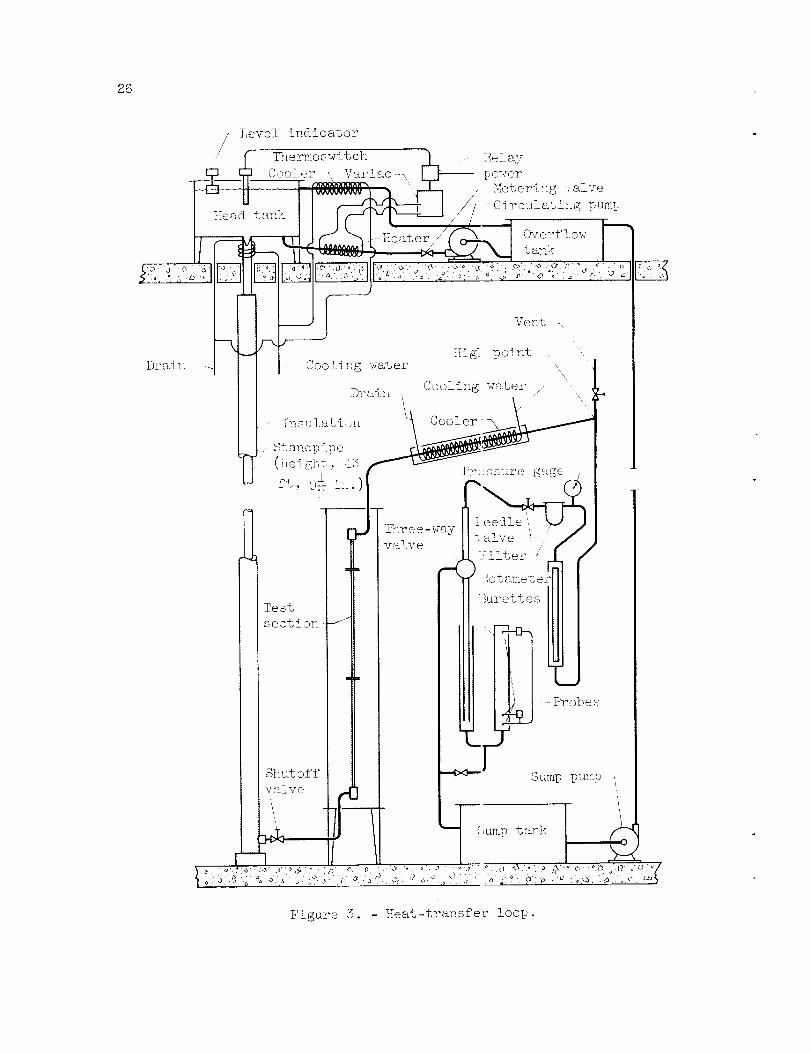
A scheIl_tic diagz_sml of the heat-transfer loop is shown in figure 5.Distilled and deionized water, o was circulated as the heat-transfer medium.
A constant-head tani_ was used to ensure a steE.dy flow through the test
secgion. This was found to be necessary from prelLmina±_y tests. The
ware±" was de-aerated by being heated to the boiling point in the head
tank, and it was then cooled to the desired temperature by water cooling
coils directly beneath the head tank. The flc.w was down a 44-foot in-
sulated standpipe bo an insulation tank which contained the heated test
section. The test section was surrounded by seven concentric alu_uinm_-
foil _'adiation guards. The tank air pressure was maintained at about I
micron of mercury. Such an arrangement gave s. rapid time response and
nearly negligible heat losses.
In upflow the fluid passed first through a bottom mixing box, where
the inlet bulk temperature was nleasured_ and _hen up through a S-foot
insulated hyd:'odynamic approacll section of 5/]6-inch bore. This section
i_ad a length-to-diameter ratio of llS to allow the velocity profile to
become fully developed. The water then flowec without intelu_uption
througll a Teflon insulating disk and into the heated test section. The
Inconel test section also had a S/i6-inch bore and was 5 feet long
(L/D = ii<<). It was heated by passing low-voltage alternating cui'ren_
axially t!m_ough the tube wall. Thermocouples attached to the outer wall
allowed a dete±mSnation of local wall temperature.
The heated water passed out through a second Teflon insulating disk
and ti_en to an outlet mixing box_ where the o_ tlet bulk temperature was
measured. The water left the insulation tank at the top and was cooled
to _L'oomtemperature in a heat excllanger. It _as then filtered and
pzssed through a flow control needle valve.
The discharge from the flow control needle valve went into two
glass burettes, whe2e the flow rate was de te_i:ined. This measurement
was accomplished by determining the time required to fill the burettes
when tlle outlet valve was closed. The time wss measured automatically
by a coi_foination of electronic relays and an _lectronic timer. Figure
5 [llustL'ates this system. A rotameter was also used to give a roughindication of the flow rate.
The water leaving the burette went to a smllp tank and then was
i<m_ped back up to an overflow tank by a s_np frump. A second circulating
mm_o transfe±u'ed tlle watei' f,'om the ovei'flow tank through a heated pipe
to tile ILead taIE_. The put-pose of the ileater was to heat the water to
uea' clle boii-ng point and bhus de-aerate it. The overflow from the
i'_eadta,,ii,:J'e_li'ned %o the ove_'flow tank through a cooler. The
bJ!
g
temperature o_' the water in the head tank was held near the boiling
point by a ther_oswitch-heater combination.
A bypass :_ixed-bed ion exchanger not shown in figure 3 was con-
nected between the bottom of the standpipe and the s_unp tank. A con-
stant flow through the ion exchanger _intained the high purity of the
distilled water.
Details of the various components of the flow loop are given in
reference 3.
For downi'low the water entered the insulation tank at the top and
left at the bottom. The rest of the flow loop was unchanged. The
starting length for downflow was considerably shorter_ being about 13
diameters.
Several _lodifications were i_de to the apparatus after 1, '_ _ns had
been made. One change was the addition of a temperature regulating bath
to control water inlet temperature. This bath reduced inlet temperature
fluctuations from i° F to less than 0.2 ° F. Another modification was
the installation of an i_mf_ersion heater in the head tank to replace a
wrap-around heater on the inlet line. This change allowed more reliable
operation and a steadier head tank temperature. A third modification
was an improvement in the vibration isolation of the insulation tank.
Vibrations from the vacuuuJl pm_ip had been felt in the insulation tank and
there was a possibility that this could cause an early transition to
turbulent flow.
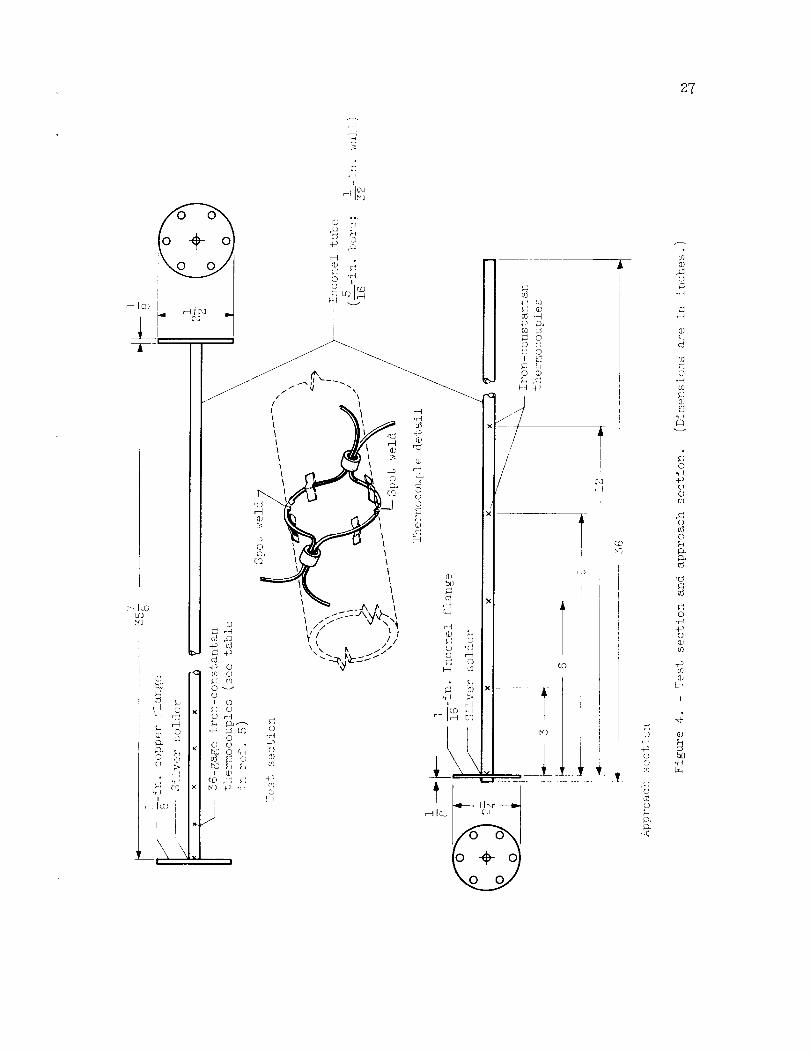
Test Section and Approach Section
The test section was a resistance-heated !nconel tube with a
0.31SO-inch bore and a O.O312-inch wall thickness. The length was
3,J.030 inches5 and the lengti_-to-dia_teter ratio was therefore about ii_.
A sketch of the test section and app_'oach sect±on is shown in figure 4_
and a p]_otograph of the assembly is given in figure b. The approach
section in downflow had a length-to-diameter ratio of 13.
F_fty-eight iron-constantan thermocouples were spot-welded to the
oultside of the test section in 2_ diametrically opposed pairs. A detail
of the method of attaclmlent is shown in figure 4. A listing of their
exact locations is given in reference L. The axial spacing of the ther-
mocouples near each end was small in order to allow an accurate deter_li-
nation of entrance region wall temperatures for both upflow and downflow.
A_:iaily adjacent pairs of thermocouples were positioned 90 ° apart. This
_,_:asdone to facil_ate detection of any asytmnetry in wall temperature
d_stribution.
C[._'cular col_per flanges we_'e s].lver solde_'ed to each end or the test
section. The power leads were connected to th_ outer circumference of
tkese _'langes. Po%entlal leads were solfl.ered -,o eack Ylange. These
rlanges also contained thermocouples which wer(_ used to determine heat
losses as is described in reference S. The -te_',t section was connected
to and insulated from the approach and exit se_,,tions by Teflon disk
spacers.
A detail alto'awing o±' the approach section _s given in fig]ire 4. The
approach section _<as :_dentical to the test sec _ion except that it was
not heated and had rewe__' thermocouples attachecL to it. The approach sec-
t[on_ Teflon spacers, test section, and e_£t s_._ction were all very care-
r_lly alined, doweled, and bolted in order to ensure that the flow pat-
tern would not be disturbed when the water passed from one section to
another.
I
O-q
Test-Section Insulati<_n
The s::_al! heat-transfer coefficients enco_.ntered in im_linar flow re-
quire an insulation superior to glass or %uart'.: wool. Two possibilities
which seemed promising were a vacuum bottle or a powdered insulation
under vacuum. The first approach was followed, because it was felt that
the large time constants involved with a low-thermal-diffusivity _mterial
would make operation difficult.
Seven concentric cylinders of aluminm_! fo: i were mounted between the
test section and the insulation bank -to act as __a_maolon shields.
The ._.'adial heat loss was measured with -th<_ test section drained and
plugged. A plot of heat loss per root is show_L in figure 6. The loss is
nearly a linear function of temperature dirfer_,_nce. It is possible to
compute a "the_'mal conductivity" of the i_nsula _ion tank. It is about
O.OOd,," Btu/(kr)(rt)(°F) compared with 0.023 BtIL/(hr)(ft)(OF) for glass
wool. Thus it is about rive times as e£fectiw_. The measurements we±'e
all made at the tanA operating pressure of 0.!3 to i _licron of mercury.
This L'ad[al heat loss is nea±'ly negll_g£ble for most runs but was included
Ru a!.!_ calculations.
Power Supply
The test section was resistance heated 10y the power supply shown
_;,c]_eE_atically in rigu±'e i". Power was supplied i'ro_n a 2SO-volt supply,
and _l_e cub'rent passed through a 4-kilovolt-am_ere electronic voltage
'eg,S_ato_ • w-th a lh_e voltage repudiation accu±'_cy of ±0.i percent. The
oub_uL, t_en passed [,o _ va_':_ab]_e autot_'ansL'o_'m_:r and then through two 2-
k i. lovo]_t-a_f_ei'e s tepduwn tk'ans 'orl_e_'s -.n paral.el_ w]_ich reduced the
voltage to a maximtuu of ll volts. From the transformers the current
flowed directly to the power lead connections on top of the insulation
tank.
Power Measuring Instr_u_ents
Power was measured by a L_lultiplied-deflection a-c potentiometer sim-
ilar to the one described in reference 14. This method has the advantage
that the accuracy is limited only by the full-scale accuracy of the me-
ters and £s independent of power level. This was highly desirable be-
cause power ranged from 0.17 watt on the heat loss Jueasurements to 4000
watts on the higher power heat-transfer runs. An a-c potentiometer was
of value also, because the low voltage drops across the test section
made it difficult to use a wattmeter directly. The voltmeter and a_mileter
were calibrated in an NASA instrm_ents laboratory and correction charts
_,_,ereused with them. The wattmeter was calibrated with a resistor whose
d-c res!.stance was accurately measured on a Kelvin bridge. The wattmeter
readings were compared with i2R of the tesb section_ and they always
agreed to within _ percent. _e power factor was very nearly unity at
all times.
Temperature Measuring System
iron-constantan thermocouples were used throughout i'or temperature
measurement. Test-section and _lixing-box thermocouples were carefully
calibrated. De_ails of the calibration procedure are given in refer-
ence b. The tables of NBS circular 861 were used for uncalibrated ther-
mocouples.
A circuit diagram £or the thermocouples is shown in figure 8. Test-
section wall thermocouples and the outlet mixing-box thermocouple were
always read with respect to the inlet mixing-box thermocouple. Since
both upflo_., and downflow runs were made_ provision was made for a re-
versing switch _o interchange roles of the mixing boxes. Each liixing-
box junction could be read with respect to an ice junction in order to
establish the absolute teiiperature level of the system. A self-balancing
potenbiometer was used to obtain rough readings when the system was ap-
proaching steady state.
A Rubicon potentiometer, Model B, was used to measure thermocouple
voltages. An electronic null indicator_ with a voltage sensitiv__ty of
i microvolt per small division, served in place of a conventional light
beam galvanometer to indicate the matching of potentiometer and thermo-
couple voltages.
i0
All thei'mocouple wii'es passed to a juncti)n bo_,_. The thermocouplewires on the test section and in the mixing bo<es were S_ gage and we_'eall cub fi'om the ss_le spools of wire. At the junction box the wires wereincreased in size to intakethe leads mo_edurable. Iron-constantan wirewas used throughout the theimlocouple ci_-cuits. F±_omthe junction box theleads went to a switch box, which housed all s_vitches. Leads from theswitch box passed to the self-balancing potent Lometer and the Rubiconpotent iomete='.
The junction box a_d switch box were of ilentical construction. All
thermocouple junctions were contained in a cop0er box. This coppei _ box
was sui'i'ounded by several inches of rosined-plastic insulation, which in
turn was contained in a wooden box. The purpo:3e of this type of con-
struction was to produce a uniform temperatui_e at the junction of each
pair of the±_mocouple wires. Even though the b)x te_ipe_'a_ure might change
because of changes in ambient conditions, both thermocouple junctions
would change in the ssmle way and thus prevent _ny stray voltages from
being develol)ed.
EXPERIMENTAL PROCEDUR
The e;<perimental data were taken in the f)llowing manner. Several
runs at different heating rates were usually t_ken at one flow rate.
When a new flow ±_ate was set by adjusting ghe flow control needle valve,
it was generally necessary to allow the apparatus to run overnight in
order that steady conditions would be establisi_ed. }_en the flow was
steady and the inlet water tempe±_ature variati)ns were tolerable, the
powez' was turned on and set at the desired vak_e. Usually a half hour'
was sufficient to attain equilibrium. This title was adequate because of
the fast time response of the thin aLuninum ra_[iation guards.
Readings were taken of volts, ampe±'es, wa_ts, voltage dividei _ ratio,
current transformer ratio, water inlet temperature above ice point, water
outlet temperature above ice point, and bulk t_mperature rise before,
half way through, and after the reading of wal. temperature the_mocouples.
As many readings of the time to fill burettes _rere taken as was possible
during the _un. Besides wall temperature read:ngs, data were taken on
room te:aperature, flange temperatures, and app:'oach section temperatures.
At the co_Lpletion of a ±'un the powe± _ level, was readjusted to obtain
a diffei'ent Rayleigh mmfoer.
!
O
EXPERIMENTAL RESULTS
The important results of the experiJ_ent ai'e presented and discussed
in this section, and a discussion of accuracy _nd anomalies of the
ii
experiment is given in appendix B. The experimental results are tabu-lated in reference S.
o
l
Results for Heating with Upflow
_ully developed heat transfer. - The primary objective of this ex-
periment was to verify the analysis which was n_de for the condition of
fully developed heat transfer and constant fluid properties. The data
which are believed to be fully developed and which were steady (nonfluc-
tuating) are shown in figure 9. The solid line is the predicted curve
of the analysis_ which is shown in figure 2 also. It is apparent that
these data confirm the analysis over the range presented. The data at
high values of Rayleigh nu_nber show some scatter and also seem to be
slightly below the analytical curve. Physical properties were evaluated
at the film temperature; some of the scatter may be due to physical prop-
erty variations with temperature. However, it is believed that these
data are low at high Rayleigh n_mnbers because of a peculiar entrance ef-
fect. This is discussed later when the thermal entrance region results
are presented.
Another observation to be made from fig_m_e 9 is that it is very dif-
ficult to confirm the pure forced convection fully developed Nusselt n_t-
ber of 48/11 (4.66) experimentally because of the influence of free con-
vection effects. The lowest Rayleigh nm_iber attainable with reasonable
accuracy was about 2_. This gives a Nusselt nmnber of _.62, about 6 per-
cent above the zero Rayleigh n_nber value.
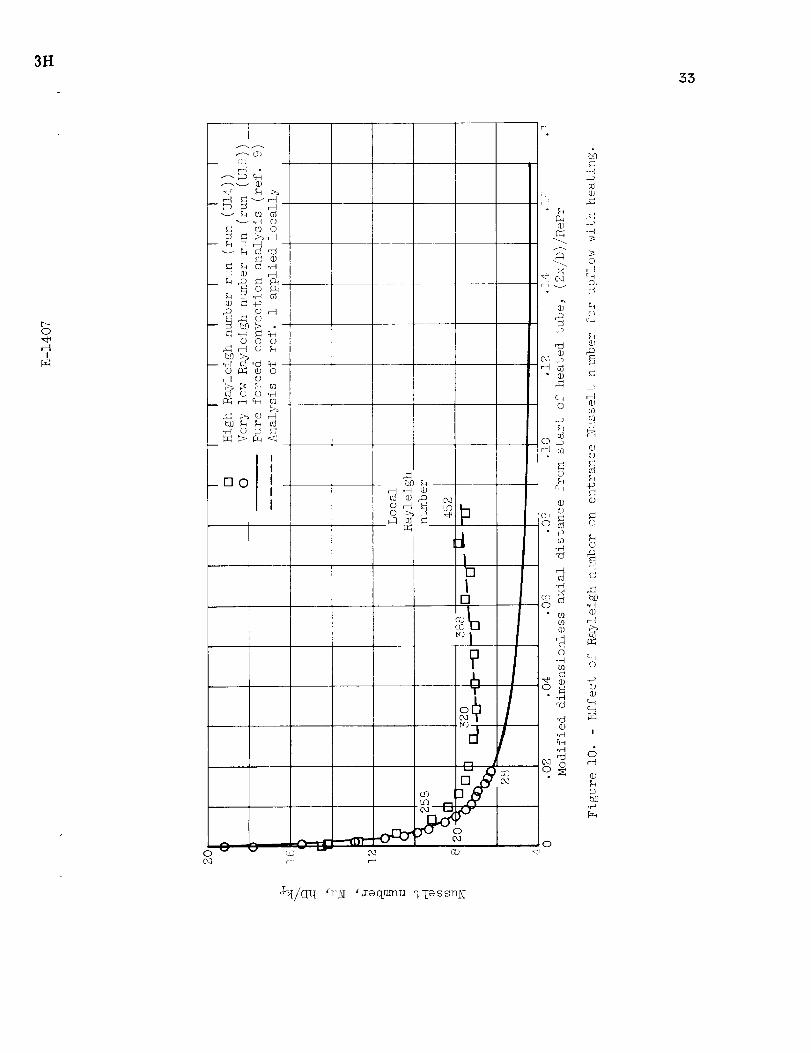
Theri_l entrance region data. - Having confirmed the fully developed
analysis, a question arises as to what length is required to produce the
fully developed condition. An investigation of this thermal entrance
length may be made by means of the experiment.
The pure forced convection (zero Rayleigh number) analysis of ref-
erence 9 provides a basis for comparison of thermal entrance region data.
The Nusselt nud_ibers very near the heated entrance will be independent of
the heating rate, because the Husselt nu_iber is determined only by the
flow pattern. The velocity profile will not be distorted from its en-
tering parabolic shape until a temperature pattern is created in the
fluid. This temperature pattern then creates radial density differences,
whic]l, in turn, distort the parabolic velocity profile and thus change
the Nusselt nunfoers fro1_ the pure forced convection values. A certain
heated length is required for this profile to be distorted.
The pure forced convection analysis results in a single relation
between Nusselt number and the pars_eter _ It is reasonable, then_RePr"
to present the data in terms of these va:_iables_ with Rayleigh ntmtber as
12
a pars_leter. Such a comparison is given in figure i0. The solid curveis the zero Rayleigh ntu_iberanalysis (ref. 9), and the data shownare fora very low Rayleigh nmllber run and for a typical high Rayleigh numberrun.Numbersbeside the data indicate local Rayleigh ntu_bers.
The very low Rayleigh nmllber run agrees well with the pure forcedconvection analysis of reference 9. Thesedata are typical of all lowRayleigh nmnberruns.
The high Rayleigh ntu_er run agrees with t_e zero Rayleigh nmnberanalysis very near the entrance, but soon breaks away, goes through aminimmu,and rises again. The dashed line is t_e fully developed com-bined forced and free convection analysis (ref. I) applied locally. TheRayleigh nun_er increases toward the pipe exit _ecauseof physical prop-erty variations. The agreementbetween the dat%and the dashed line in-dicates that the concept of a "locally fully deYeloped" heat transfer isa valid one. Again, this run is typical of manysuch runs taken and tab-ulated in tables II and !I! of reference S.
The highest Rayleigh nm_foerrun in which e:_trance data were obtainedis shownon the semletype of plot in figure ii. Again the analysis(ref. i) applied locally is shownas a dashed llne. In this run the datafall below the analysis and then gradually clim> to approach the analyti-cal curve. The effect is most pronounced in thls highest Rayleigh num-ber run. This effect was observed to a lesser :_xtent, in lower Rayleighnumberruns as well. It maybe due to experime:_tal error, but this isconsidered unlikely. At high values of Rayleigl nmuberan "undershoot"occurs, because the large velocity profile dist,>rtion involved requiresa considerable length in which to develop.
This argument and discussion are based on ;omewhatmeagerdata, Outthey are believed to explain the low Nussel_ n_ers observed at highRayleigh numbers in figure 9. These particular data were taken in the
vicinity of the transition points, discussed la_er, and complete entrance
data were not obtained. It is likely that some of these data are in the
"undershoot" region and hence would fall below _he analysis.
For pure forced convection, it is shown in reference 9 that the
value of (ix/D)/RePr at which the Nusselt nm_ibi_r cs_ne to within S percent
of its fully developed value was 0.08S.
The entrance length for the high Rayleigh _mnber run (run (UI4))
shown in figure i0 was taken to be
!
O
RePr _fd O. 034

IS
and rot run (U2,i)(fig. ii) this value was taken to be about 0.07o wherethe data becomeas_mlpbotic to the analysis, applied locally. Values of(ix/D)/RePr at which the data becameparallel to the analytical curveare plotbed in figure 12. The scatte__ in the data is very large becauseof the difficulty in accta_ately estimating when the fully developed con-dibion is reached. However, the trend definitely indicates a decreasein thermal entrance length with increase in Raylei_ghnud_ber-'ollowed byan increase at large Rayleigh nuJ_bers.
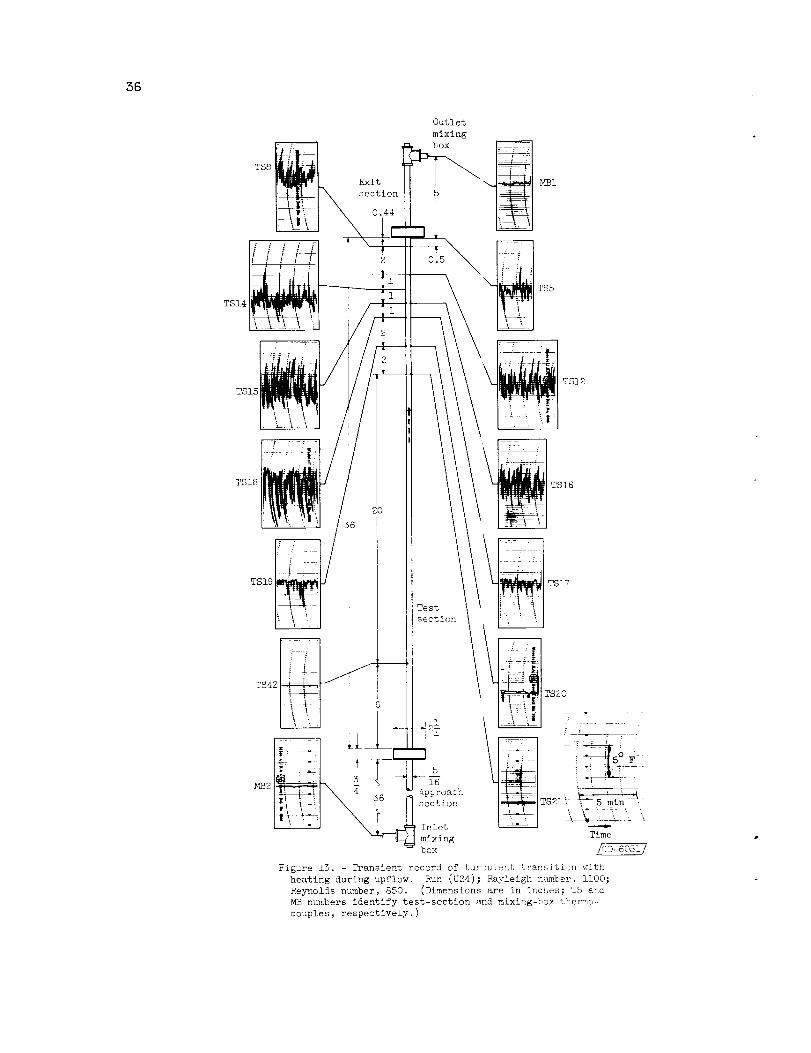
Transition data. - A transition from steady laminar flow to a slow,
apparently random, eddy flow was observed on some runs. ThKs was evi-
denced by wall telperature fluctuations appearing on the upper portions
o/ the heated tube. Temperature records taken with a photoelectric re-
corder are shown in fi_are i5 for a typical r_m in which transition oc-
curred. With an increase in heating rate, at a constant flow rate, the
transition point would travel down the tube toward the entrance. If the
flow rabe were increased, keel_ing the Rayleig}_ ntkmber constant, the tran-
sition point would travel up and eventually o_t the tube exit.
Special runs were _rmde in o_'der to gabber' data on this transition.
A tentative correlation of these tL'ansitlon data is shown in figu_'e 14.
RePrPlotted here against _ _s a special Rayleig}L numbe_' defined by
p3pg( .bw tm)D SRaD 9 P_' (2)
Physical propeL'bies are evaluated ab the fi]m_ temperature. The dashed
line is given by the equation
.-:. /RePr\l'SS
SLnce then_oco_Lples we±'e located only at 3-inc]_ intervals in most cases,
it was difficult bo locate the transition x/D exactly. In addition,
the tJ'ansition point was difficult to locate precisely, because tXe wall
tempeJature fluctuations were da_ped by the heat capacity of the tube
wall. The co:','elation is probably adequate for most applications, how-
ever.
Since transLbion is likely to be affected by such t]lings as vibra-
tion level, tube nonunLfoL'mLties, the tube being not exactly vertical_
and so i'o._'th,ib is i'ecom._ended that addit!_onal data be obtaLned in an-
ot] _e E' appa.E'a tus.
TransJ_i_ion data L'ecently obtained are reported ]n reference ii. The
transition point was detected by injecting dye into the water' u_st:_'ea4
id
and observing when -tile dye stre_ began to flvctuate at the exit of atransparent tube. These data are shownin figure 1%. Since observationswere madeat the exit only, no x/D variatior could be _m%de.The tran-sition point for strea_l fluctuation occu_-'sat lower values of RaD thanYor wall temperature fluctuations. This would be expected, since the
strea_ fluctuations would have to build up to some magnitude in order to
transport heat radially from the wall.
Selection of data. - A discussion of the selection or upflow data
is perhaps best introduced by referring to twc representative plots of
temperature against x/D.
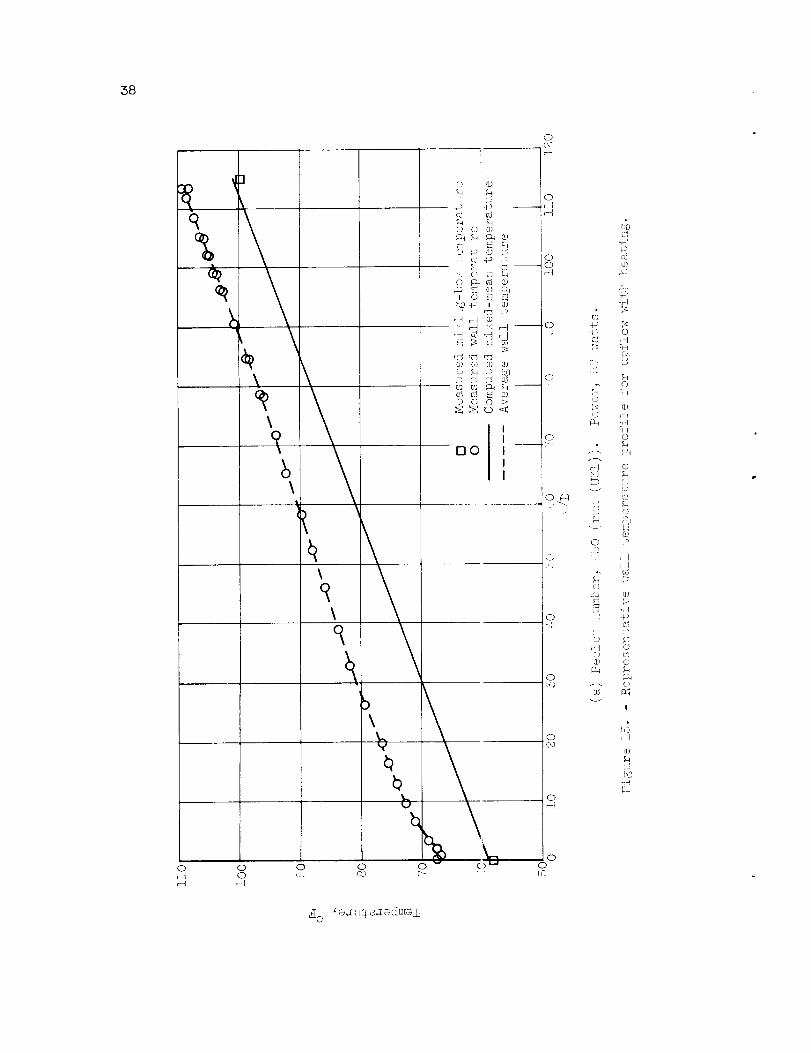
Figu±e l_:(a) shows a representative wall temperature plot for a low
Pecle t n<mlber (RePr) run. Generally there were two thermocouples at each
x/D, located dismletrically opposite. In some cases, however, only one
the_'mocouple was operative. The dashed line si_ow_ is a curve drawn
through cite points obtained by averaging tempeL_atures only at axial loca-
tions where both thermocouples were operative. The circles represent in-
dividuai therr.iocoupie temperatures. Several ooservations can be _mde
from this ri_g_re. First_ a very smooth curve _an be drawn through the
averaged data. Second, an as_mletric wall temperature distribution is
apparent near the tube exit. Third, a slight rise i_n temperature existsin the fi:'st several dismleters.
The fact that a smooth curve can be dLrawn through the averaged data
was used to rejec_ data points obtained when only one thermocouple ex-
isted at a location, since these points generally aid not tall on the
smooth curve because of the as_umuetry in wall temperature. The asy:m_letry
in wall temperature was more severe at higher 9owers. This could be
caused by a nonuniform tube wall causing nonunLform heating, or it could
be caused by an as_muetrlc flow pattern set up by free convection effects.
i_ is !0elieved to be principally the latter, b_cause in downflow the as_n-
merry, which had been near the top in upflow, _ow appeared near the bot-
to_. T}_is is discussed in rile next section. _he theory predicts that
tle _Jall temperatures should approach the flui i bulk temperature at the
entrance. Tills does not ]_appen in the experiment; in fact, there is a
slig]_t temperature rise very near the entrance. This is caused by
joulean heat _ik'omt]_e bottom bus bar being con lucted into the bottom
t_l_ange. The first few temperatures were inacc_±'ate because of this.
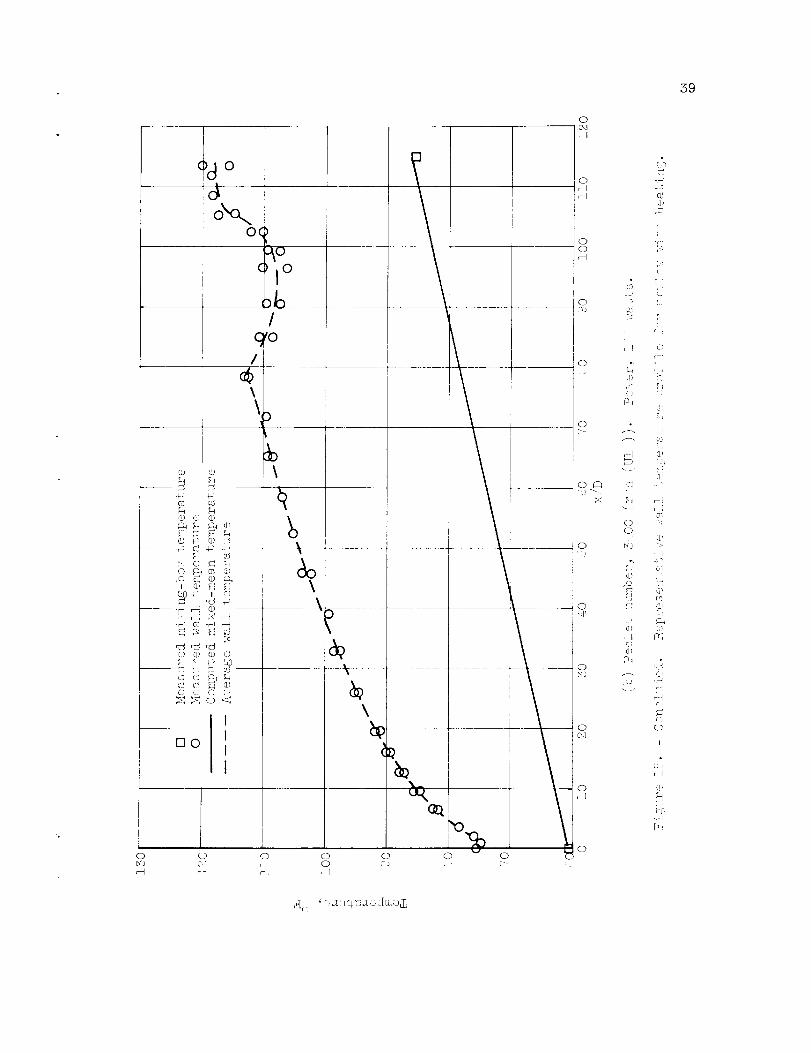
Figure l._(b) sl_ows a representative wall _emperature plot for a high
Pecle_ nLu_ber run. The s_il rise in tempera t,_re near the entrance is
s4ill present. The asy_p_etry in wall temperat _re is now more severe at
the higher power. The striking thing about th.s plot, however, is the
dLp in wall temperatu±'e near the exit of the t_be. This dip was present
in all ±'uns with Pecle% numbers of i!_00 or mor_. The dips had a minimum
at _' consta_t x/D ol about 0L (about 6 in. f'om exit) which did not
see_ _o shift under any ci±'c_stances. The exl)lanation for this dip is
!
O
IS
unAnown. It has been established that it is not (i) due to heat conduc-
tion througk a bundle or thermocouple leads which leaves at this point_
a hea leak in ns l tion at point, cause by anonuniform tube in this region, or (_i) a i%lse temperature caused by a-c
effects on tile ther_.ocouple circuits. No dip occurJ'ed in any down£1ow
runs. Data in this i!'eg-on are not presented in t}'e ±'esuits (although
they are tabulated in _'ef. S) because the reason ibr this behavior isriot kriown.
Results fo_' Heating with Dovnflow
The downi'low _'uns were cl_aracterized by an as_a_metry in wail te_:tper-
atu_-e which became more severe as the l_ea-ting rate was increased. For
the highest heating i'ates, the flow becs_e unsteady_ and tke wall te_llper-
atures in the lower poz%ion o±' the heated tube oscillated in a periodic
way.
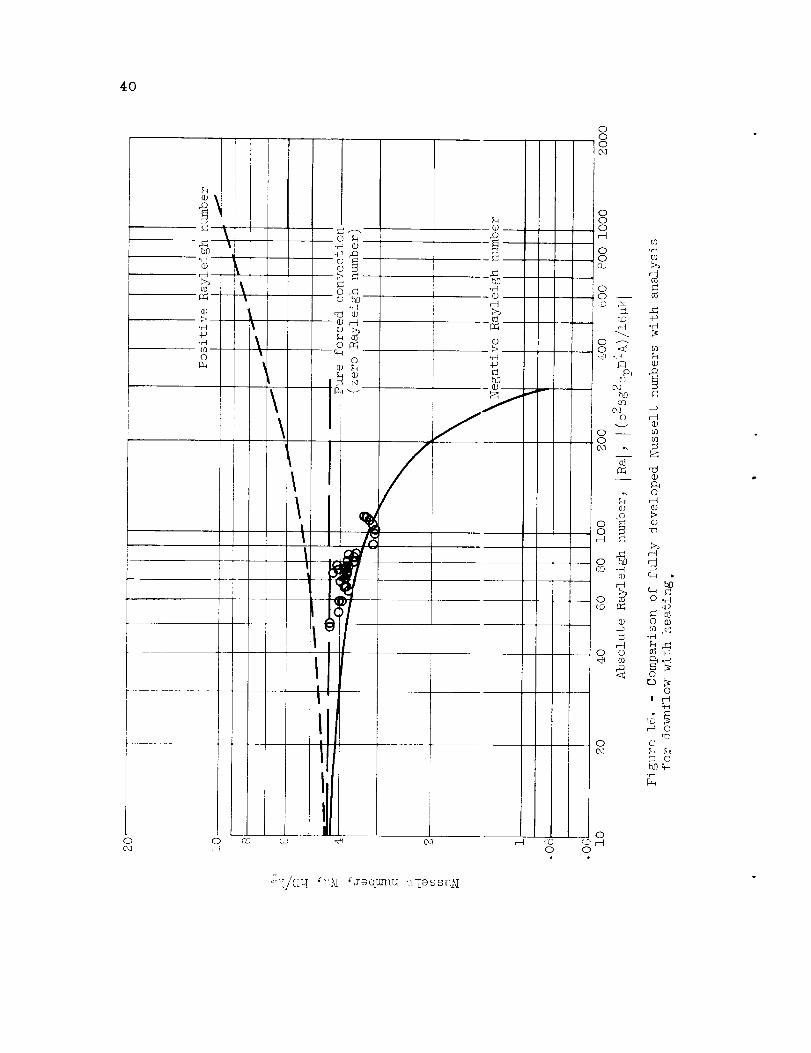
_lly developed heat transfeJ:. - The data which appea_'ed to be fully
developed are presented in figure 16 as a plot or Nusselt n_u:iber against
Rayleigh n_mlber. The line with whi_ch t]_e data are -to be compared is the
solid line labeled negative Rayleigl_ ntmlber. This line is derived in
reference b. Ti_e two dashed lines_ for zero Rayleigh n_unber and for pos-
itive Rayleigh number, are included to provide a comparq.son with previ-
ously discussed upflow results.
It is seen that _1ost of the data fall about lO percent above the
p_'edlcted curve. Each point shown is based on a wall temperature obtained
by averaging the tempe_'atR±'es of two ther_locouples placed diamet_'ically
opposite. These belperabure differences were as high as 7° F in some
cases when the a::ial temperature rise over tl_e length of the tube was
only _5 ° F. It is believed that this as_m!et_'y in wall temperature is
caused by an as_m:_ebry in flow pattern. It is not surp_'ising_ thez'efore_
that the data do not agree e_,_acbly with the analysis.
Even tl_ough most of the data fall above the analysis_ the trend in
the data is correctly pi'edicted. All the Nusselt n_u:_bers are below the
pure forced convection value of 4._.3, and considerably below the data
which have exactly the stone heating and i'low conditions but which have
the di±'ection of flo_,_reversed.
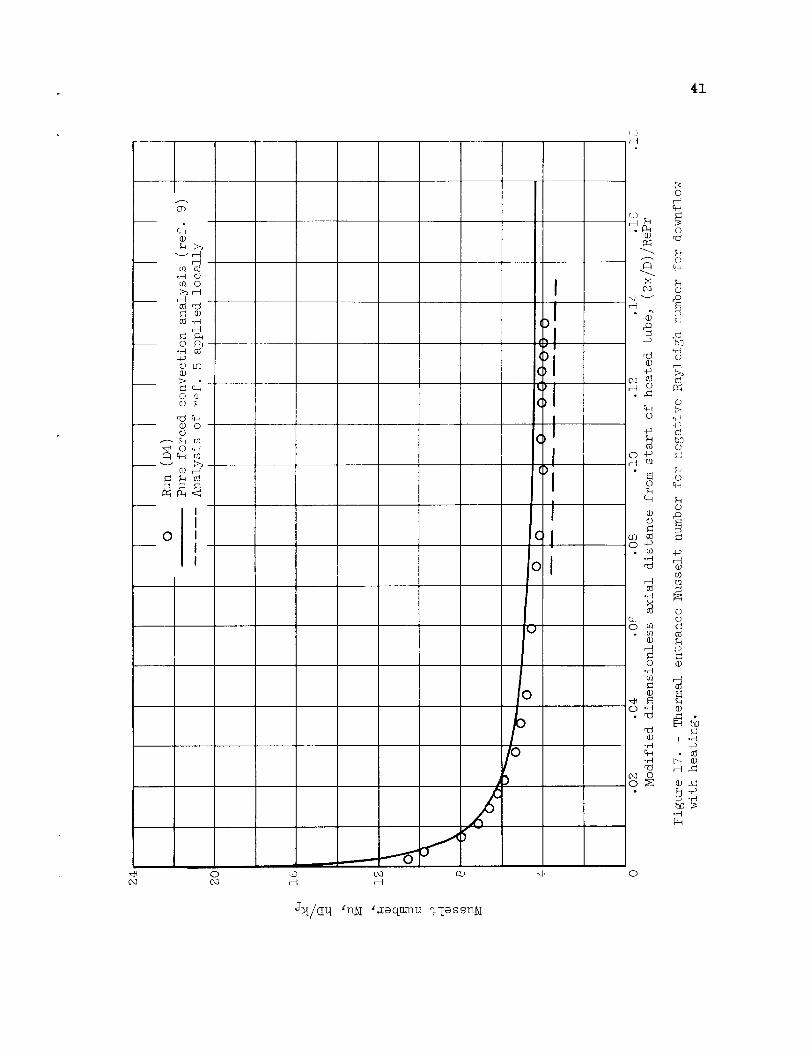
Thermal entrance region data. A typical plot of Nusselt ntunber
against the parameter (2x/D)/RePr is shown in figure 17. The data do not
reach the fRlly developed analysis (dashed iine) for reasons already dis-
cussed. The entrance lengths appear to be longer than for pure forced
convection_ although it is difficult to estimate entrance lengths accu-
rate!y. Estimation is difficult mainly because the local Rayleigh nmnber
decreases (negatively) with length and so the "local fully developed"
Nusselt nLmlbersdecrease with length. The ±'_ngeof Rayleigh ntu_iberswasquite s_mll. A rough estimate for entrance length is
Re r/fd
if the Rayleigh number is not below -120.
Closer to t]_e entrance, the Nusselt numlers agree quite well withthe pure forced convection analysis (as they did for positive Rayleighn<mlbers). The two low points, nearest the ertrance, are %elieved to becaused by bus ha±' conduction errors.
The approach section length-to-disi_leter ratio for downflow was aboutiS. The length-to-dismleter ratio required fcr fully developed flow isabout 0.0. J Re (ref. i[_). Host of the runs were madewith fully devel-oped flow at <he entrance to the heated section. The highest Reynoldsn_Lber used was SS0, which would L'equire an L/D of 19 for fully devel-oped _'low.
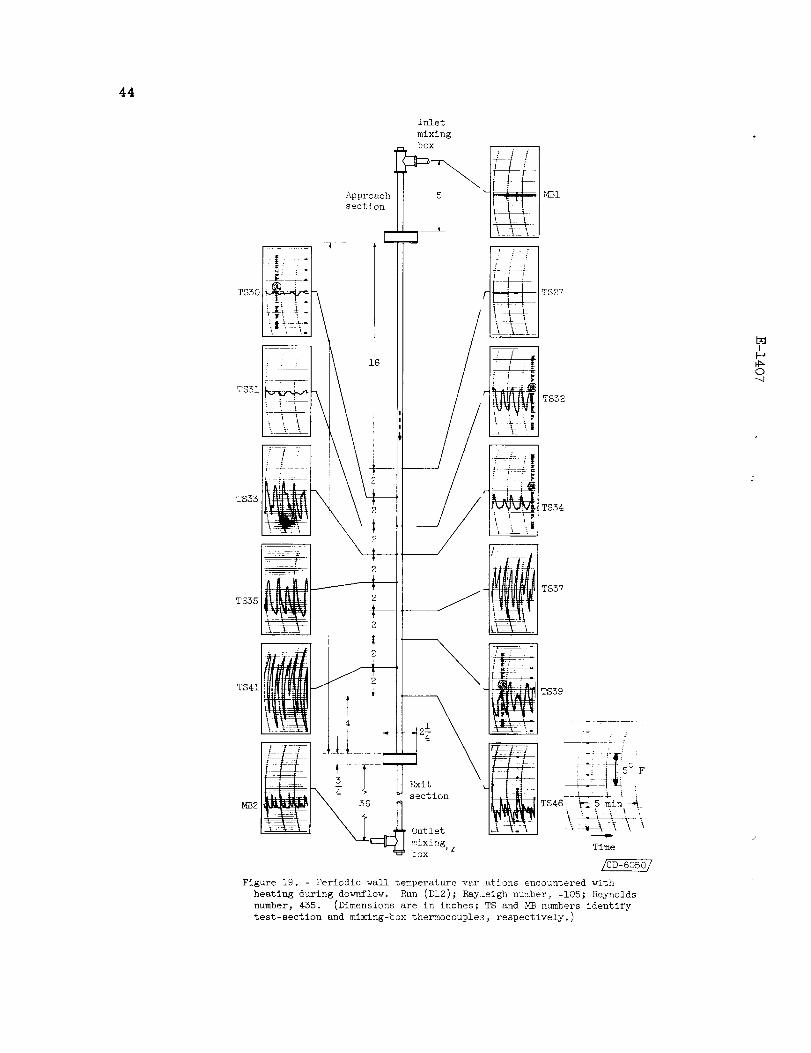
/U<ially as_nmTletric and periodic flow. - _he wall bemperature wasfound to vary around the circ<m_ference of the tube for all downi'low ru_us.
For a given run, the variations becm_le worse from inlet to outlet (top to
bottom)_ and for different runs, the variations becaae more severe with
inc 'easing ]:eating rages. For low power runs, the averaging of disunet-
ricalLy opposite thermocoup!e readings gave s smooth curve from top to
bottom (fig. ]_8(a)), whereas for higher poweK runs an apparent discon-
tinuity in this "aver_ge" wall te_pera_ure curve is indicated (fic.
18(b)). The variation across the tube below this discontinuity became
very large in so'._lecases, being as high as 2C ° F. One might speculate
tha_ above this discontinuity the flow is al_ys down, but is asf_met-
ric; below the dLscontinuity a ceil flow _._mybe set up, with a large
crossf!ow aL-,12_e position of the discontinuity. Since it was not pos-
sible to observe the flow, however_ one can cnly speculate.
Wit]_ a s bill_ greater increase in heating rate, the wall temperatures
beca_i:e iLnsteady in the lower portions of tiLe tube. The variations were
nea:'ly periodic in nature. The amplitude of the variations was different
at d-"L'fe_'ent points on the tube_ but the freqlency was the ss_e every-
where. Figure 19 g[_ves a ±'ecord of the fluct._ations observed for one
pa_:'_icu!ar :;un._ The variations were mo_'e re_lar in the upper part of
the _'egion t}_an in iY._elowe_' part. The frequency was about 0.J cycle per
minute for tlSs exaT_ple and was about 0.<: cycle per minute for one otherr_tu ±'eco_qed.
4In figure 19_ the indicated position of the recordings with re-
spect to circumferential location is not signLficant. The leaders are
used only to indicate axial position.
_JI
R_
Oq
2H17
Selection of data. - In downflow the circ_m_?erential wall tempera-
ture variations were much more severe than they were in upflow. For low
hea3ing ra_es the averaging of data for' pairs of thermocouples at each
axial position resulted in a smooth average wall temperature curve, as
indicated by figure iS(a). In that figure, symbols of the ss_le kind are
all on the same side of the tube and a smooth curve could be d_awn
through each set of s_mlbois. The temperature differences across the tL_be
are as high as &o F for this particular r'_uu.
A different wall temperature behavior was obse_'ved at higher heating
rates, as shown in fig-_ire iS(b). The points can be averaged to give a
smooth curve up to a certain position_ but then very large circtullferen-
tial wall temperature differences exist for the rest of the tube, the
differences being as high as 9° F. These temperatures are steady in ti_e.
The temperature pattern would indicate a cell flow. With a still further
increase in power, the periodic fluctuations discussed previously ap-
peared.
Since the flow is now down instead of up, the exit of the tube be-
comes the entrance. The asy_miletries present in upflow do not exist at
the top of the tube, nor was a dip in wall temperature evei • observed
the re.
Only wall tempe_'atures which fit the s_1ooth curve before the sudden
change in _,_all temperature (tistribution were used in plotting results to
be compared with the analysis. All data are presented in tables V and
VI of reference I_,. The temperature of each individual wall thermocouple
is reported in table VI of reference i along with the average wall tem-
perature at eac]i location.
CONCLUDING RE_t_KKS
The fully developed solutions of the analysis are all in the nature
of as_&ipbotic solutions and aJ'e expected to apply only far from the en-
trance. The results of the experiment indicate that_ for positive
Rayleigh ntkllbers_ these solutions do apply, and the concept of loca_ly
P_lly developed results is established. It is also concluded that the
bounda_._y condPtions associated with _hese solutions are physically
reali zab le.
The results of the analysis were found to apply only for values of
negative Rayleigl< nu_Lfoer which are small; for large negative Rayle[gh
ramblers axial as_m_etry and unsteady flow were observed, and these con-
ditions make tl_e analysis inapplicable.
The theriLal entrance region analysis of Siegel, Sparrow, and Ka]]__an
for pure forced convection was experimentally confirmed. Howeve_'_ the
itF
fully developed Nusselb n_mR:er' of 43/11, predlcbed ibr tkLs sitTlation, is
di±'f'icul% to veriYy e_.{perimental!y because of tiLe influence of f:'ee con-
vect ion effec%s.
The transibion observed .during heating ;._/th :_prlow would lead to the
conclusion that simi.la_" phenomena are likely to be encountered in other
sk.L-laL' t_-pes of flows. This would be expected to occur, for examp]_e_ in
u±.£1ow o.f a heab-generabing fluid in an insul_ted pipe. It is recom-
mendei tlLat i%l±'the.L' experiments be run to establis}__ b]_e _'egion of appli-
cability of 4hose po±'t[ons of the analysis _lafle in the Hal]i]m_n thesis
wtL]c}_ w_re nob investi6ated by the present e_:periment.
Lewi.s Research Center
.] 4-"Nati.onal Ae..ona_lcs and Space A_L_inistr_%tion
Cleveland, Ohio, A<lgu_b _d, 19ii1
I
o
APPENDIX A
SYI_tBOI_
A a;_:ialtemperatu::'e gradient in fluid, _t/$x, °F/ft
D tube inside diamete_ _, ft
g accelerat_"_on due to gravity, ft/sec '2
h heat-transfer coefficient, (_0m, Bbu/(sec)(sq ft)(°F)
I best-sect-on current, amp
k thermal conductivity of fluid, Btu/(sec)(sq ft)(°F/ft)
k r ther_l conductivity evaluated at fi_ tempe_'ature
L length of heated section, ft
Nu Nusselt number, _%D/k, dimensionless
Pr Prandtl n_oi_foer,_gcp/k, dimensionless
q wall heat-flux density_ Btu/(sec)(sq ft)
qe net electrical input to fluid, Btu/hr
qth ther_ml energy rise of fluid in passing through heated test sec-tion, Btu/hr
R test-section resistance_ olmls
Ra Rayleigh number, p2}gZcpD4A/16_k_ dimensionless
Ra D Rayleigh nm_iber based on diameter of tube, p2}g2CpDS(tw - tm)/_k ,dimensionless
Re Reynolds nuJ_iber, umD/w , dimensionless
t static fluid temperature, OF
ta ambient temperature, OF
_e exit temperature_ OF
IS'
_0
t_t mP,<ed-mean or bulk fluid tei_iperature, _F
t w inside tube wall temperature, OF
u m mean velocity of fluid in tube, ft/sec
x distance measured along axis of tube u_Tard from start of heated
length, £t
i_), (cu ft/OF)/cu ftthermal coefficient of vol_ne expansivLty, -_ P
d;_ mi;<ed-mean to wall temperature difference, OF
dynamic viscosity of fluid, (ib)(sec)/sq ft
v kinematic viscosity of fluid, sq ft/se'_
p mass density of fluid, (ib)(secZ)/ft %
Subs c_,'ipts:
i' f i ]li_ t e._lperatur e
fd fully developed
21
APPENDIXB
ACCURACYOFRESULTS
Error Analysis
A detailed error analysis was madefor one set of thermocouples inone run (run (US0)), and the result for Nusselt mt_tberwas 6.12±0.2S_ oran accuracy of about %perceut. The most important factor affecting theaccuracy in this case was the accuracy of the temperature difference%_- tm. The uncertainty calculated here was the uncertainty based on_0 to i odds.
Factors Affecting Accuracy of Results
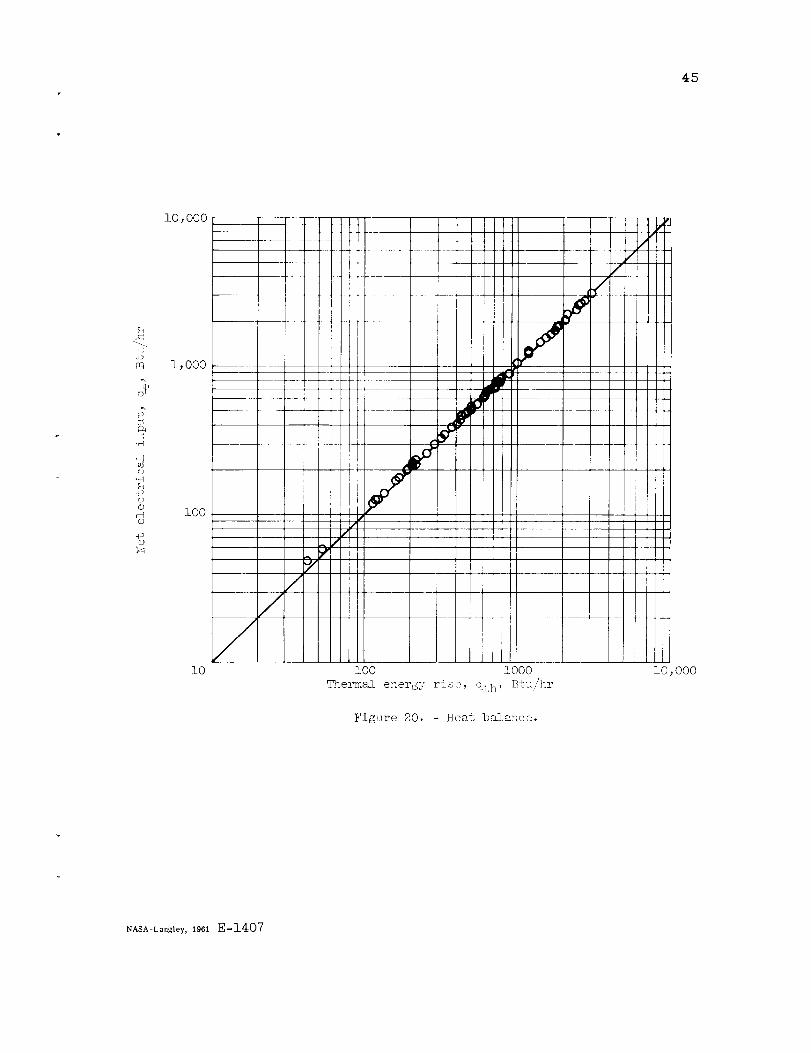
A heat balance between electrical energy input and the thermal en-e-_gy-ncrease of the fluid will give someindication of the magnitude ofer_'ors (known and unknown)which affect _'educedquantities such as localmLxed-o.ean temperature and wall heat flux. A plot of net electrical en-
ei'gy input (after heat loss corrections) against measured ther_l energy
rise is given in figure 20. A deviation ik,'omthe line indicates an im-
perfect heat balance. E-<cept for -the two lowest power runs_ the heat
balance is within i'percent, and for most runs it is much better. The
heat balance imps'ores with increase in power and in aL_los-t all cases the
elect_r'ical input (after loss corrections) is greater than the thermal
energy rise. Since_ by %he use of the a-c potentiometer_ the elect_ical
poweJ:' measurement accuracy should be nearly independent of pover level_
it is felt that tk'_s discrepancy is largely due to errors in bus bar heat
loss corrections and to e_u'ors ;n measuring bulk temperature rise. One
would expect the pe_'cenbage e_'ror in measuring a temperature difference
with a calibrated _her:nocouple to l_ecoue less as the temperature differ-
ence is incL'eased. This is consistent with the trend in the heat balance
data. It is concluded that the unknown error in overall heat balance is
There is some evidence %hat there are unknown errox's in the measure-
ment o.f wall temperature. These are felt to be largely caused by the in-
i'luence oL' stray alternating current on the d-c thertilocouple circuitry.
The %hermocouples were spot-velded directly to the test section, t.hich
was a-c r'esistance teated. A£ electronic null indicatoJ' _.,_asused with
a Rubicon_ }_del B, potentiometer to _,_leasurethecmocouple voltages. It
was first observeQ that the null indicatoL' los% sensitivity _,henever a
test-section thermocouple was being cead. When connected to an oscillo-
scope, a tO-cycle s_-c s£gnal was observed. This could be elimLnated by
using a .$O0-iicro_'a:'ad capacitor acz'oss -tiLeinl_,ttter!m£nals to the poten-
tiometer and by grounding one end of tie test section (which previously
]lad been floating). These changes gave good sensitivity except -,.,]ten

_'eadimg tRe!'_ocoupies near the ungrounded end nf the test section. This
_'_'ol'_lemwas corrected by usLng a ground a_ eac_ end and a toggle switch
to select Lhe end to be g_'ounded. The sensiti¢ity '._as good at each end
and _ole_able at _he cen_er of t_e test secgio_. The central test-
section thermocouple was read twice, once with each end grounded. The
'_a_.:im_u_discrepancy noted was 0.017 millivolt ',about O.g ° F), and in
most cases it was less bhan this.
The foregoing changes are believed _o _av_ L;'emoved the greatest pa_'t
o_' tlLis error but probably not all of it. One anomaly was _hat the
standardization point of the potentiome_er kep_ changing when a tempera-
ture traverse of %he %es_ section was being J_ale. Apparently the alter-
nating current still get bing into the potentio_leter affected the stand-
a2qlzatlon point. The potentiomet£J' was stand%rdized be£'oJ'e each ther-
mocouple reading.
!
o
REFERENCES
i. Ha!l_nan, T. M. : Co.llbined Forced and Free-L_._£na_ • Heat Transfer in
Vertical Tubes with Uniform Internal Heat Generation. T,_ans. ASHY,
vol. b, no. 8, Nov. !9_6_ pp. 1_31-18dl.
2. Gross, J. F.: Heat T±'ansfer in Laminar Flo, _. Ph.D. Thesis, Purdue
UnP.r., June 19&_d.
5. Donner, Thomas: L_lnar Flow Heat T_.'ansfer in a Round Tube. H.S.
Thesis, Rensselaer Polytech. Instit., Nov. 1967.
._. 0stro_.'_ov, G. A. : Free Convection Undez _ th_ Conditions or the Inter-
nal P_'oblem. NACA TM i_0;, i_035.
& . HalL:_n, T. H.: Combined Forced and Free C,}nvection in a Vertical
T_be. Ph.D. Thesis, l_ardue Univ., Hay 19. i8.
Hang'arty, Tl_o_'_as J., Rosen, Edward H., and ][abel_ Robert L.: E<fect
of Heat Transfer on Flow Field at low Reynolds Numbers in Vertical
%_tbes. Ind. and Eng. Chem., vol. S0, no. _, _y 19t.t:, pp. 91&-S_0.
Brown, W. G., and G_'assmann, P.: Der eini'l_ss des auftriebs auf
wa _:_e[_bergang und d_'uckgefa!le bei e rzwun_ene__ • st/6mung in lotrechten
i'okren Fo_'sel_ Geb. Ing-Wes , Bd. 8[ ......... , :_o. S: 1939, pp. _.r___<_
Tao, L. N. : On So'me laminar Forced-Convec_ on Pi_oblems. Paper C0-
WA-I£!9, ASHE, l_Ji0.

25
9. Siegel, R._ Sparrow, E. H., and Haleru%n, T. M. : Steady Lsmlinar Heat
Transfei _ in a Circular Tube with Prescribed Wall Heat Flux. Appl.
Sci. Res., sec. A, vol. /, no. b, 1938, pp. S,%C-SgZ.
i0. Clark, J. A., a_d Rohsenow, W. M.: Local Boiling Heat Transfer to
Water at Low Rey_olds N_:_bers and HIgL Pressure. Tech. Rep. no. _,
Dlv. Industrial Cooperation, M.i.T., July i, 19St.
ii. Scheele, George F., Rosen, Edward M., and Hanratty, Thomas J.: Effect
of Natural Convection on Tz_ansition to Turbulence in Vertical Pipes.
TLe Canadian Jour. Chem. Eng., vol. $8, no. S, June 1960, pp. G7-7S.
12. Ec_e_ 8_ E R G., DiagR_ila, Anthony J , and Livingood, John N. B :
Free-Convection Effects on Heat Transfer for Turbulent Flow Through
a Vertical Tube. NACA TN oco4,_'_'_ lgbb
13. Kays, W. M. : Nu_erical Solutions for La_p£nar-Flow Heat Transfer in
Circular" _bes. Trans. ASME, vol. ..'7,no. 8, Nov. 19SS, pp. 126S-127 _.
id. Marshall, Roland B. : Measurements in Electrical Engineering, 10t. II.
Second ed., Join S. Swift Co._ Inc., 1969.
13. Knudsen, J_i_es J._ and Katz, Donald L. : Fluid Dynamics and Heat
T2'ans2er. HcGraw-H!ll Book Co., Inc., l_oo, p. 286.
24
Large body of fluid
Tube -__ Exit
] Insu at onI_I / _, ient_tem-oerat ure _ ta
te
Insulation
Pump
(a) Free convection. (b) Cc_bined forced and free
conve_tion.
Figure i. - Combined forced and fzee convection.

oo0 O0 0
0
0
000
000cu
000
25
26
Drain
Vent
Cooling water
Drain
Insulation
I
Test
section -_
Figure S. - Heat-transfe_ loop.
>
-rdI
t CL]_t b')
I
©
O_
I
0 rt
0
!1
×
I
bO
P.7
r_u
-rd
0
OA
0.,q
+_0dOt.r]
L)_60
P_P,
,r3
0-rq
uq.id_
+__0Q
E_
I
d
u hi]
© "r_
0
%

28
Power lead
Ii
i
/Power lead
I !_ Mixing box
_ Approach section
Teflon disk
_-_' and flanges
!
_/
!,b,/
J
Test section
_ Teflon disk
I! , and flanges
J
Approach section
Mixing box
C -4:4756
Figure 5. Assembly photograph of test and approach
sections (radiation shields removed).

29
O
o
O
A
\
\
• • °
\
0
o
2_
4_
h
E_oo
'c:
o2
i4_
0 C
4J
0
©
.DC)
D]
4o
o,%
0r-_
rt
i
%
52
0 0
0
0i-t
000
_t
g_©
0
_© ,_
_ ._q
Cs)CI %
©
0 (1) ©
o
_ 0
0 _ _
0 _ _
, •
(2) ._:.' L', 4_
0 gJ
0 _
0
0
° g_
@% %
0
J_i/(lNq_ll_maquznu%laSS_ll
3H55
I-'--O
r-II
i
- _o _{u _ 40
© O
bo--._ _d
(u P:_ ®
0 0Pz; r4 %
,hi l>_ ®
_P_
_DO
,-t
oO
,H
,H
c_
,-t
©%
g4 -0
r/?
rt
I
IIII
O __o ¢q COcq rH _H
O,3
I
I[]
?
T/_d
oa
coto
Cq
r-i
d)
_C
4_
o_
©
q:2
8_
O
8i
rH
8 _O
O,Hr
74•r-I
©
d_
sOH
P_
o_
_.)
X
r-I®a)u)2_
@O
Cd
-F)
@
0
(D
bO-H63
q_0
4_
®
I
c;cq
%
hO
56
TSIA
Exit
section
0.44
Outlet
mixing
TS5
TSIS
TSI8
TSI9
20
section
Nt72 h
TSI2
TSI6
TSI7
TS20
Time
Figure 15. - Transient record of tur0ulent transition with
heating during upflow. Run (UZ4); Rayleigh number, ii00_
Reynolds number, 880. (Dimensions are in inches; TS and
MBnumbers identify test-section and mixlng-box the_m_o-
couples, respectively.)

s7
400×104
I
4-)
A
O4bD
b.0
_D,-qb_
g_
O.,-q+_
r_
200
100
80
CO
Unsteady
o Steady
LI
0 Present experiment
Ref. ii
9470fRePr_l'_3
4 " _ !0 20 40
RePr/I2_/D)
Figure 14. - Correlat_Ton of data for transition
in 1_pflow with heating.
58
Or4
t
%
OOr4
]
\
\
Ib\
O
\
\
b\
qbbh
O
© ©
4_ 4_
h h
N tb _ _
i © _ _
'd ,d _d© (It O @
_J @ O >
I
I
DO II
I
O
O0.]_4
oI:,D:I
S _q;
• ;-_
0 _-_ _-<_. -p_ 0
cd r-4
L;)0r _, C)
ILl
() r!P4 .,r
o o
r_ :, %
, d
0 ;)i£,
0 , t
©_Q (D_ P
0 a( "_¢., t )-ff_ c!
, i (D_) [fJ
0 _:'_
I
O _4
©
-rd
Or_
OOt_
4
O,
C
!
\\
cg c5
@ @ ©
L! x £ _@ 4_ @ ";
8J
0 _ @ £/
'IN
--._t _t @
cd
(D © © O
65 0S N @
@ <; O b-
Silo<
II
O© I
I
)
I°
/rO
3
tD\
\
0 0 0 0 0_¢.) 01 • [ 0 C.
_t ,q r-[ , [
I
L
oo
o
o
oo,-q
0
0
_q
d_
7_
f{
,])
ire
%
o0
_2
@
r_
@c_
:T]
'/c
r i
I
5_
" t
81
, },
S_
h_
_D
5_
il !
tL>
I->
• i
ej
(1
r_e
Otr
{P
O
O
I
rt
q)
h
_2
39
4O
000o3
00
o0003
.H
c6
-H
m%
H
r/l
0_
O,-t
r-t
_d
4_
O ©
-,--I
4-
_'_©
r_.) NO
_ r--t
H O
@% %
_0rH.r4
O H cOO
41
( ,}
_4
v
d_
o,-I
o°H_o0
oo
o
_ oA_
O
cJ¢D
o,-t
CO.H,--t¢h'_:::h-
LO
Q%
O -
r_.H
I
IIII
.@ o co o.1 coo_ oa ,-: ,-I
II
)
• !
()
I)II
ol
0
0
,,qk
"r_
_o
o_o_
cH
r_
do
_o,,-I
,d(b.r4
o
5:o
r_
o
oC_H
b.O.rq(b
pC;
Q,.">
bO®
0qq
h(b
4_
@r_
%4_
(1)
@
4_
p-- ¢0
.r-t
J_/(lq _nX _aqmmu %lassnX
44
TS30
TS31
Approach II
section_
Inlet
mixing
,_ TS27
TS32
b_!
O
TS33_TS34
TS35
TS37
MB2 TS46. _ 5 min -_
-z Time
Figure 19. - Periodic wall temperature var.ations encountered with
heating during downflow. Run (DI2); RayAeigh number, -105; Reynolds
number, 455. (Dimensions are in inches; TS and MB numbers identify
test-section and mixlng-box thermocouples, respectively.)
45
>J_
:!
4
k_c)@
©
4"CO
i0_000
1,000
i00
20
r
/J
/
!
F
__-
lO0 1000
Thermal enerdb' rLs_;, '%th; lBtu/hr
/
Figure 80. Heat balance.
i
lO, 000
NASA-Langley, 1961 E-1407


![|}~a= @C 4 '( 3 · 2020. 6. 4. · H z Ò/ Y ( E_ 0K OºÒ É Ç _õ ØYZ[\A ©a+& H J II @M g(] ^E 3òD / ¸ ( M _ 4!"g Mx Ý2Ø (b :3¡>xù \ Í, Î 4f8¸ ;_ ]Ã(] ^E_ ©\î_ usP](https://img.pdfslide.us/doc/110x75/60f7027904112f6179328e0a/a-c-4-3-2020-6-4-h-z-y-e-0k-o-yza-a.jpg)


![· st LLOZ 8380130 - uaawaldas IVIELSnC]Nl -Knunoo .10] dn OUOOUIOS 02 E 01 êlqe Bupq U! 1 puv pue 0) 02 uos.lôd e sa-ledaxd sapen 02 uoyysue.n I(llensn](https://img.pdfslide.us/doc/110x75/5e65350e1089dd343914789a/st-lloz-8380130-uaawaldas-ivielsncnl-knunoo-10-dn-ouoouios-02-e-01-lqe-bupq.jpg)