Embed Size (px)
Citation preview

1
ROADS TASK FORCE Thematic Analysis
Roads Task Force – Technical Note 5 What are the main trends and developments affecting van traffic in London? Introduction
This paper is one of a series of thematic notes, produced to contribute to the Roads Task Force Evidence Base. It provides an overview of trends affecting van traffic in London.
Summary • Vans account for 13 per cent of motorised vehicle kilometres in London (3.8 billion of
29.1 billion in 2011). There are approximately four times as many van kilometres in London as HGV kilometres.
• Van traffic has grown, albeit slowed by the recent recession. There were 5 per cent more van kilometres in London in 2011 compared to 2000. By contrast, HGV traffic has fallen – being 11 per cent lower in 2011 compared to 2000.
• There is evidence that vans are being used as substitutes for HGVs – less regulation, fewer skills/lower pay for van drivers and greater flexibility (eg for home deliveries) being key reasons. These trends are expected to continue, although they may lead to less-efficient utilisation of road capacity.
• 221,000 vans are registered in London, 7 per cent of the GB total. 62 per cent of vans circulating in London are of the ‘panel’ body type, and 60 per cent are in the heaviest weight class for vans (2.6-3.5 tonnes gross).
• The van population of London is dominated by a relatively small number that are present frequently with a long ‘tail’ of infrequent visitors.
• 56 per cent of London-based vans are privately-owned, eg ‘own account’ trades people. 44 per cent are ‘company’ owned (eg delivery companies). 22 per cent of trips by privately-owned vans are ‘non-commercial’ (ie for personal use).
• Vans are relatively poorly-utilised – 39 per cent are less than one-quarter full with an average payload of just 300 kg.
• 50 per cent of vans fail their MOT first time (GB level), there is frequent contravention of maximum permissible weight regulations and parking availability and compliance are major issues – 838,000 PCNs are issued to vans in London per year – proportionately higher than their incidence in traffic.
• 92 per cent of vans registered in London are diesel-fuelled; however London’s Low Emission Zone requires Euro 3 emissions standard compliance for vans to operate in London – setting a basic minimum cleanliness standard for these vehicles.
• Van collision and casualty rates/severities are roughly in proportion to the share of motorised traffic and are not dissimilar in London compared to nationally.
• Peak van flows in central London occur between 7 and 8 am, with 24 per cent of daily van traffic in the congestion charging zone taking place between 7 am and 10 am, followed by a steady decline as the day progresses – just 12 per cent of daily van traffic takes place between 5 and 7 pm (average of 7 day week).

2
ROADS TASK FORCE Thematic Analysis
Definitions and sources
Vans are of increasing interest as they account for around 13 per cent of motorised traffic in London – and this share has been growing recently. However, there is a general lack of good information about vans. Much of the material in this note is drawn from a recent study by AECOM for TfL, which consolidated much of the available information, including new information on the ‘London van population’ arising from the enforcement arrangements for the London Low Emission Zone. The term ‘vans’ is used here to describe vehicles in the N1 taxation class, having a gross weight not exceeding 3.5 tonnes. Vehicles in this class are extremely diverse and range from ‘car-derived’ types, which are essentially car bodies adapted to carry small payloads, through ‘Luton’ or ‘Transit’ type ‘panel vans’ to small ‘tipper’ or ‘box’ vans. Larger cars – Sports Utility Vehicles – are excluded from this categorisation.
Vans in traffic
• Vans comprise 13 per cent of motorised traffic (vehicle kilometres) in London, compared to 14 per cent of motorised traffic in Great Britain as a whole (2011).
• Approximately 3.8 billion van-kilometres are driven annually in London – about four times that for HGVs.
• Van traffic over the last 11 years has grown by 5 per cent in London in aggregate, and by 28 per cent at the GB level. However, van kilometres in London have fallen rapidly since 2007, reflecting the economic recession (Figure 1).
• At the same time, HGV traffic has fallen – down by 11 per cent in London and 9 per cent in GB (figure 1).
• The number of vans registered in the UK has increased by 32 per cent over the past 10 years to 3.2 million (Figure 2).
Figure 1 Trend for van traffic in London (with equivalent trend for Gross Value Added) and Heavy Goods Vehicles.
0
20
40
60
80
100
120
140
160
180
1994
1995
1996
1997
1998
1999
2000
2001
2002
2003
2004
2005
2006
2007
2008
2009
2010
Inde
x (1
994=
100)
Gross value added LGV vehicle km HGV vehicle km

3
ROADS TASK FORCE Thematic Analysis
Figure 2 GB trend for van and HGV registrations.
Registrations and population profile
221,000 vans are registered to addresses in London (7 per cent of the national total of 3.2 million).
44 per cent of all vans registered in GB make a trip in London at least once a year. Almost half (49 per cent) of vans visiting London in any one year do so infrequently – four times a year or less. About a quarter of vans who are present in London at least once per year do so at least once a week, with about 10 per cent being present ‘almost every day’. London’s van population therefore comprises a relatively small number of unique vehicles that are present most days, and a long ‘tail’ of vehicles that appear infrequently.
Vans change hands rapidly – just over half of all van purchases are second-hand.
Types of van in London – body type
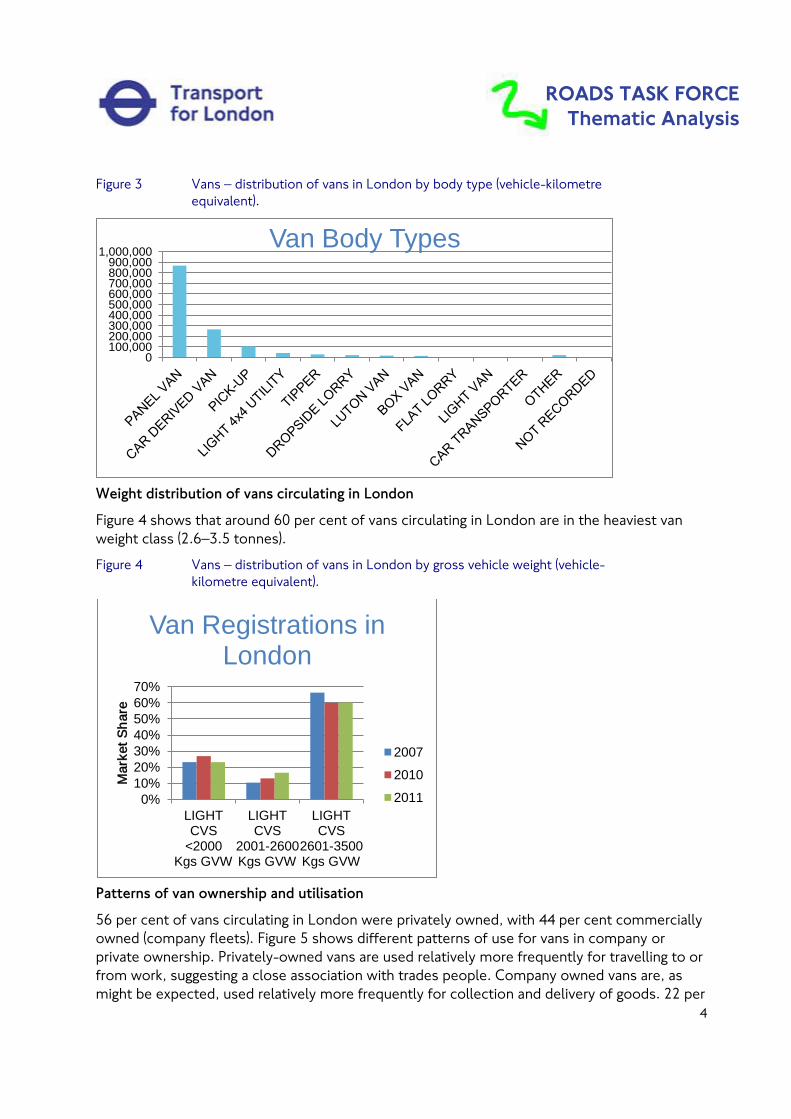
62 per cent of vans circulating in London are of the ‘panel’ body type. Nineteen per cent are car-derived vans, with pick up type vans comprising 8 per cent. All three types together account for 89 per cent of van traffic in London (Figure 3).
0
500
1,000
1,500
2,000
2,500
3,000
3,500
Thou
sand
Veh
icle
s
Number of vans and HGVs registered in the UK
Vans
HGVs
4
ROADS TASK FORCE Thematic Analysis
Figure 3 Vans – distribution of vans in London by body type (vehicle-kilometre equivalent).
Weight distribution of vans circulating in London
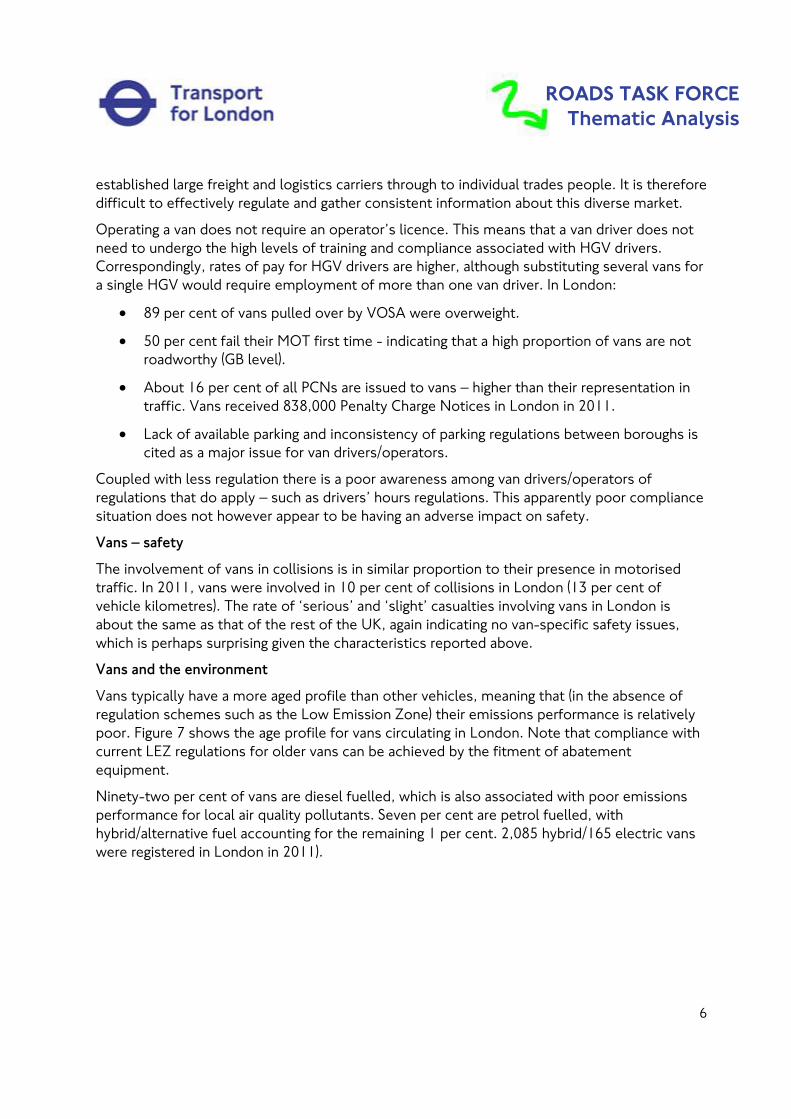
Figure 4 shows that around 60 per cent of vans circulating in London are in the heaviest van weight class (2.6–3.5 tonnes).
Figure 4 Vans – distribution of vans in London by gross vehicle weight (vehicle-kilometre equivalent).
Patterns of van ownership and utilisation
56 per cent of vans circulating in London were privately owned, with 44 per cent commercially owned (company fleets). Figure 5 shows different patterns of use for vans in company or private ownership. Privately-owned vans are used relatively more frequently for travelling to or from work, suggesting a close association with trades people. Company owned vans are, as might be expected, used relatively more frequently for collection and delivery of goods. 22 per
0 100,000 200,000 300,000 400,000 500,000 600,000 700,000 800,000 900,000
1,000,000 Van Body Types
0% 10% 20% 30% 40% 50% 60% 70%
LIGHT CVS
<2000 Kgs GVW
LIGHT CVS
2001-2600 Kgs GVW
LIGHT CVS
2601-3500 Kgs GVW
Mar
ket S
hare
Van Registrations in London
2007
2010
2011

5
ROADS TASK FORCE Thematic Analysis
cent of trips by privately-owned vans are for ‘non-commercial’ use, this being 14 per cent for company-owned vans.
Figure 5 Vans – patterns of use (journey purpose).
Figure 6 Vans – average load factor.
Many vans suffer from poor utilisation (as a commercial asset) as they are typically left idle on site after being used to transport a worker and their equipment. The average load factor for vans in London is 38 per cent (about 300kg payload). Thirty-nine per cent of vans are less than one quarter full (figure 6). However, vans are also notable for being driven overweight (see below).
Vans and the law
The van market has been described as ‘well developed, growing and likely to continue to grow, but one that is fragmented across many sectors’. Van users cover a wide spectrum - from
05
101520253035404550
Perc
enta
ge o
f util
isatio
n
Privately-owned
Company-owned
Less that 1/4 full
39%
Between 1/4 and 1/2 full
27%
Between 1/2 and 3/4 full
20%
Over 3/4 full 14%
Van utilisation
6
ROADS TASK FORCE Thematic Analysis
established large freight and logistics carriers through to individual trades people. It is therefore difficult to effectively regulate and gather consistent information about this diverse market.
Operating a van does not require an operator’s licence. This means that a van driver does not need to undergo the high levels of training and compliance associated with HGV drivers. Correspondingly, rates of pay for HGV drivers are higher, although substituting several vans for a single HGV would require employment of more than one van driver. In London:
• 89 per cent of vans pulled over by VOSA were overweight.
• 50 per cent fail their MOT first time - indicating that a high proportion of vans are not roadworthy (GB level).
• About 16 per cent of all PCNs are issued to vans – higher than their representation in traffic. Vans received 838,000 Penalty Charge Notices in London in 2011.
• Lack of available parking and inconsistency of parking regulations between boroughs is cited as a major issue for van drivers/operators.
Coupled with less regulation there is a poor awareness among van drivers/operators of regulations that do apply – such as drivers’ hours regulations. This apparently poor compliance situation does not however appear to be having an adverse impact on safety.
Vans – safety
The involvement of vans in collisions is in similar proportion to their presence in motorised traffic. In 2011, vans were involved in 10 per cent of collisions in London (13 per cent of vehicle kilometres). The rate of ‘serious’ and ‘slight’ casualties involving vans in London is about the same as that of the rest of the UK, again indicating no van-specific safety issues, which is perhaps surprising given the characteristics reported above.
Vans and the environment
Vans typically have a more aged profile than other vehicles, meaning that (in the absence of regulation schemes such as the Low Emission Zone) their emissions performance is relatively poor. Figure 7 shows the age profile for vans circulating in London. Note that compliance with current LEZ regulations for older vans can be achieved by the fitment of abatement equipment.
Ninety-two per cent of vans are diesel fuelled, which is also associated with poor emissions performance for local air quality pollutants. Seven per cent are petrol fuelled, with hybrid/alternative fuel accounting for the remaining 1 per cent. 2,085 hybrid/165 electric vans were registered in London in 2011).

7
ROADS TASK FORCE Thematic Analysis
Figure 7 Age profile for vans circulating in London (vehicle kilometre equivalent).
Are vans substituting for HGVs ?
There is evidence that vans are being used as substitutes for HGVs. Van traffic is increasing whereas HGV traffic has been more stable. There are several plausible reasons for this – including more regulation for HGVs compared to vans, the greater flexibility that they offer, particularly for the rapidly-increasing home-delivery market (eg residential roads), tied to a general increase in ‘just in time’ deliveries and reduced stockholding levels. Rates of pay for van drivers are lower than the (more skilled and regulated) job of HGV driver.
Figure 8 shows that, until the recession, new registrations for heavier vans were several times those for lighter vans, indicating a disproportionate rise in demand for these types of vehicle. However, such substitution is not necessarily optimal – vans are relatively less energy-efficient at moving tonnage compared to HGVs, use much more road space for an equivalent payload than a single HGV, and several van drivers may be required.
Van activity is expected by the Department for Transport to continue to increase – at approximately four times the rate expected for heavy goods vehicles. This reflects general economic growth and wider structural factors such as the continued growth of the internet for shopping in particular.
0
20,000
40,000
60,000
80,000
100,000
120,000
140,000
160,000
2012
20
11
2010
20
09
2008
20
07
2006
20
05
2004
20
03
2002
20
01
2000
19
99
1998
19
97
1996
19
95
1994
19
93
1992
19
91
1990
Year of registration, vans entering the LEZ

8
ROADS TASK FORCE Thematic Analysis
Figure 8 GB-level trend for new van registrations by weight class.
Vans – spatial pattern of road usage
Figures 9, 10 and 11 illustrate how vans use the London road network.
Figure 9 shows the percentage of motorised traffic flow that vans account for on the major road network. It is a measure of the relative density of vans in traffic, The highest densities – up to and exceeding 50 per cent of traffic – are found in central London, with other ‘hot-spots’ around key town centres in inner London.
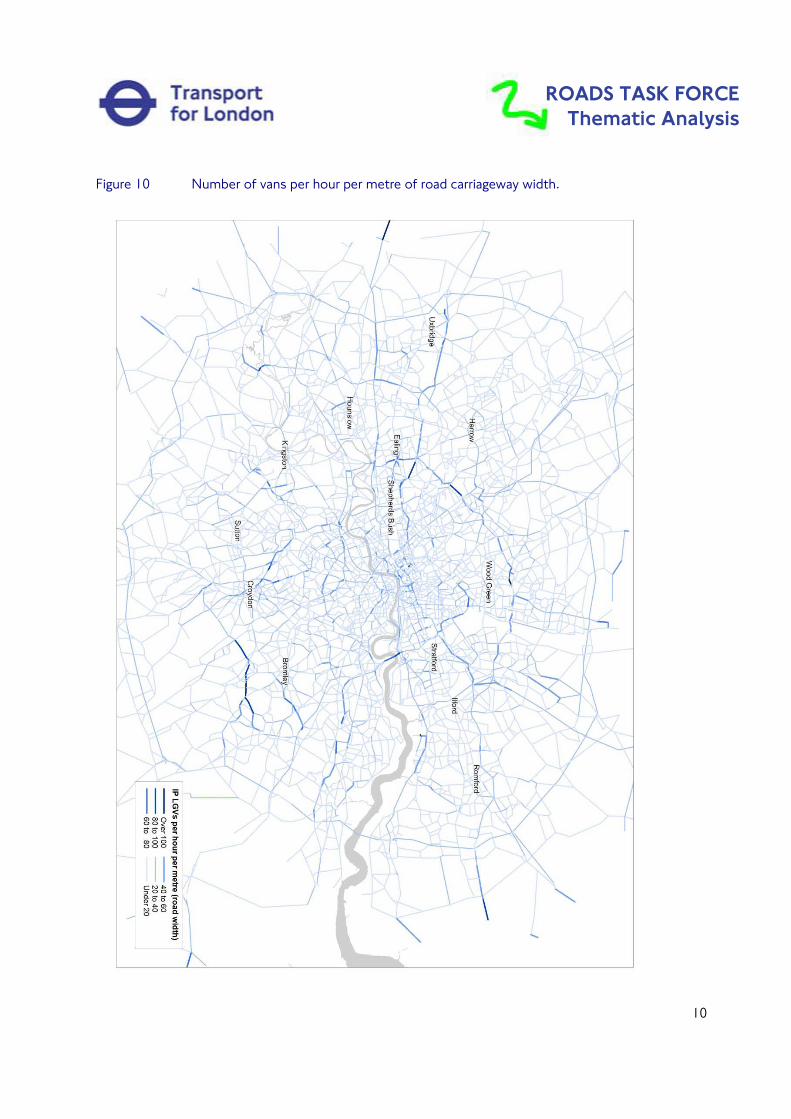
Figure 10 shows the number of vans per hour per metre of road width. It is a measure of the absolute density of vans on the road network, and shows a different pattern to Figure 9. Highest densities are seen on the more major roads – such as the north/south circulars and major radial corridors, as would be expected.
Figure 11 shows the degree to which vans use the available junction capacity, expressed as a percentage of the available capacity. The pattern is indistinct, although vans use 20 per cent or more of the available junction capacity on many roads across Greater London. This compares to an average presence in motorised traffic of 13 per cent.
0 2000 4000 6000 8000
10000 12000 14000 16000
Year
LIGHT 4X4 UTILITIES LIGHT CVS <2000 Kgs GVW LIGHT CVS 2001-2600 Kgs GVW

9
ROADS TASK FORCE Thematic Analysis
Figure 9 Percentage of motorised traffic accounted for by vans – weekday inter-peak.
10
ROADS TASK FORCE Thematic Analysis
Figure 10 Number of vans per hour per metre of road carriageway width.

11
ROADS TASK FORCE Thematic Analysis
Figure 11 Number of vans per hour per metre of road carriageway width.

12
ROADS TASK FORCE Thematic Analysis
Vans: temporal pattern of road usage
Figure 12 shows an indicative temporal profile for the use of the road network by vans (relating to the central London congestion charging zone). Twenty-four per cent of vans entering/leaving the congestion charging zone on any one day do so during the hours of 7 am to 10 am, with 41 per cent between 10 am and 5 pm, with a marked drop in activity later in the day – just 12 per cent of the daily total between the hours of 5 and 7 pm.
Figure 12 Vans entering and leaving the central London congestion charging zone by hour of day. Percentage of hourly flow in given hour. Seven day week average.
0
1
2
3
4
5
6
7
8
9
Perc
enta
ge s
hare
of d
aily
tota
l
Vans entering/leaving central London congestion charging zone. Percentage of daily flow by hour.
2011 average day


![The Main Shopping Season Trends [Infographic]](https://img.pdfslide.us/doc/110x75/559f26421a28ab48578b475a/the-main-shopping-season-trends-infographic.jpg)