Embed Size (px)
Citation preview
MENA-OECD Investment Programme
Draft Background Note:
Recent FDI Trends in the MENA Region
LAS-OECD Regional Conference and MENA-OECD Regional Investment Working
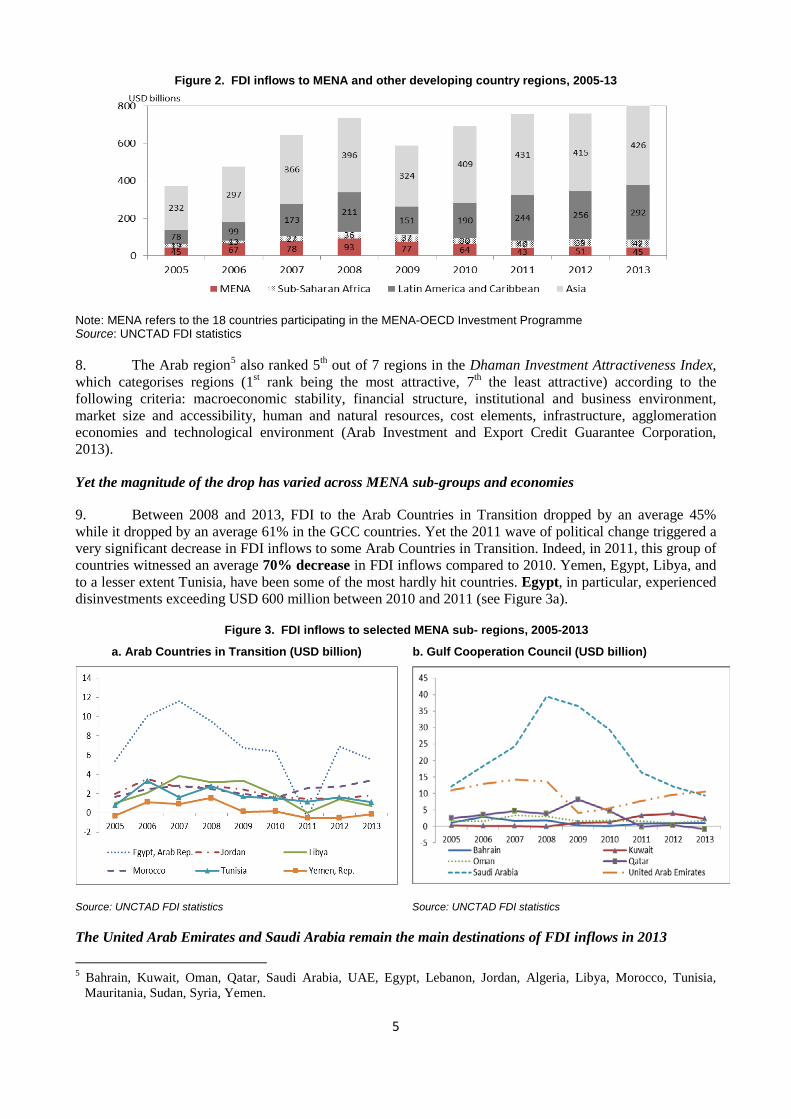
Group
9-11 December 2014, Cairo, Egypt
2
ABSTRACT
This draft note is written for discussion at the LAS-OECD Regional Conference and MENA-OECD Regional Investment Working Group on 9-11 December 2014 in Cairo, Egypt. It examines recent foreign direct investment (FDI) trends in the Middle East and North Africa (MENA) region. It analyses FDI inflows to the region by main destinations, sources and sectors and examines intra-regional FDI flows. The note concludes by providing selected policy recommendations for the region.
The note focuses on the 18 participating economies of the MENA-OECD Investment Programme:
• Gulf Cooperation Council countries (GCC): Bahrain, Kuwait, Oman, Qatar, Saudi Arabia and United Arab Emirates.
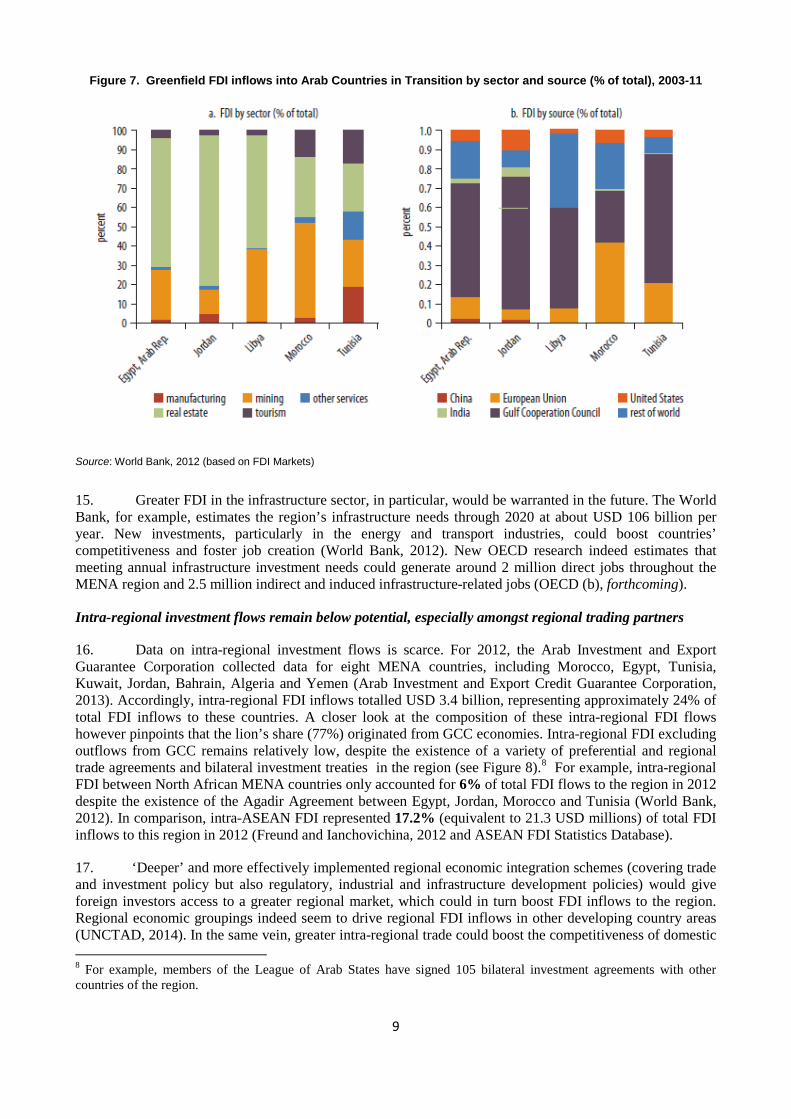
• Arab Countries in Transition: Egypt, Jordan, Morocco, Tunisia, Yemen and Libya
• Other MENA economies: Algeria, Iraq, Djibouti, Lebanon, Mauritania, and the Palestinian Authority.
While most of the data pertaining to the 18 participating MENA economies has been generated from available databases (e.g., UNCTAD FDI Statistics), some information comes from secondary sources due to lack of access or availability of reliable statistics.
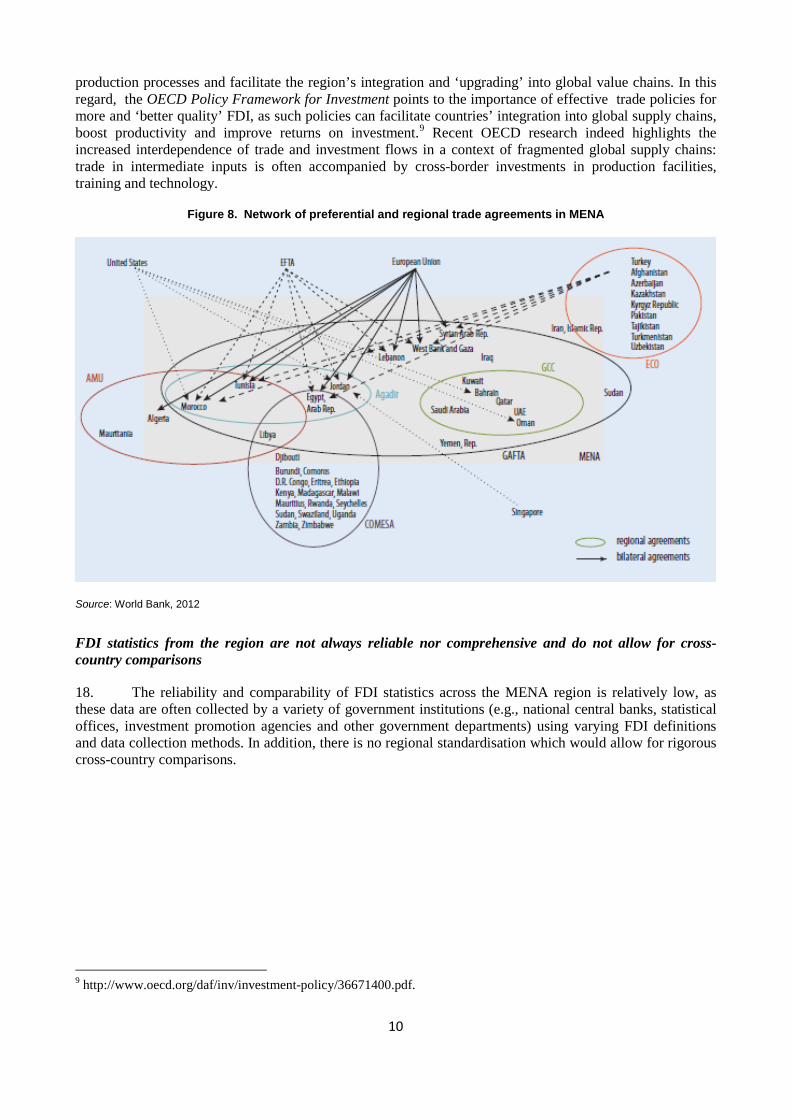
The draft note has been prepared by Caroline Lesser and Juliane Stolle from the OECD Global Relations Secretariat.
3
The global economic slowdown and ‘Arab transitions’ have led to a slump in real GDP growth rates and important increases in unemployment in the MENA region, particularly among youth
1. After almost a decade of sustained economic growth and increased foreign investment inflows, economies in the Middle East and North Africa (MENA) region have since 2009 been exposed to repeated external and internal shocks as a result of the global economic and financial crisis and, more importantly, the ‘Arab transitions’ (also referred to as ‘Arab Spring’). The ensuing economic, political and social turmoil significantly affected the macroeconomic fundamentals of the region, particularly in Arab Countries in Transition. Many of these countries’ governments in fact responded to social demands by increasing public spending, including subsidies, wages and pensions, and public sector employment. This has led to rising fiscal deficits and public debt (reaching respectively an average 11.3% and 67% of GDP in 2013), which in turn fuelled inflationary pressures. Current account deficits have also worsened, reaching an average 6.3% of GDP in 2013 in Arab Countries in Transition, because of declines in net exports (IMF World Economic Outlook Database, October 2014).
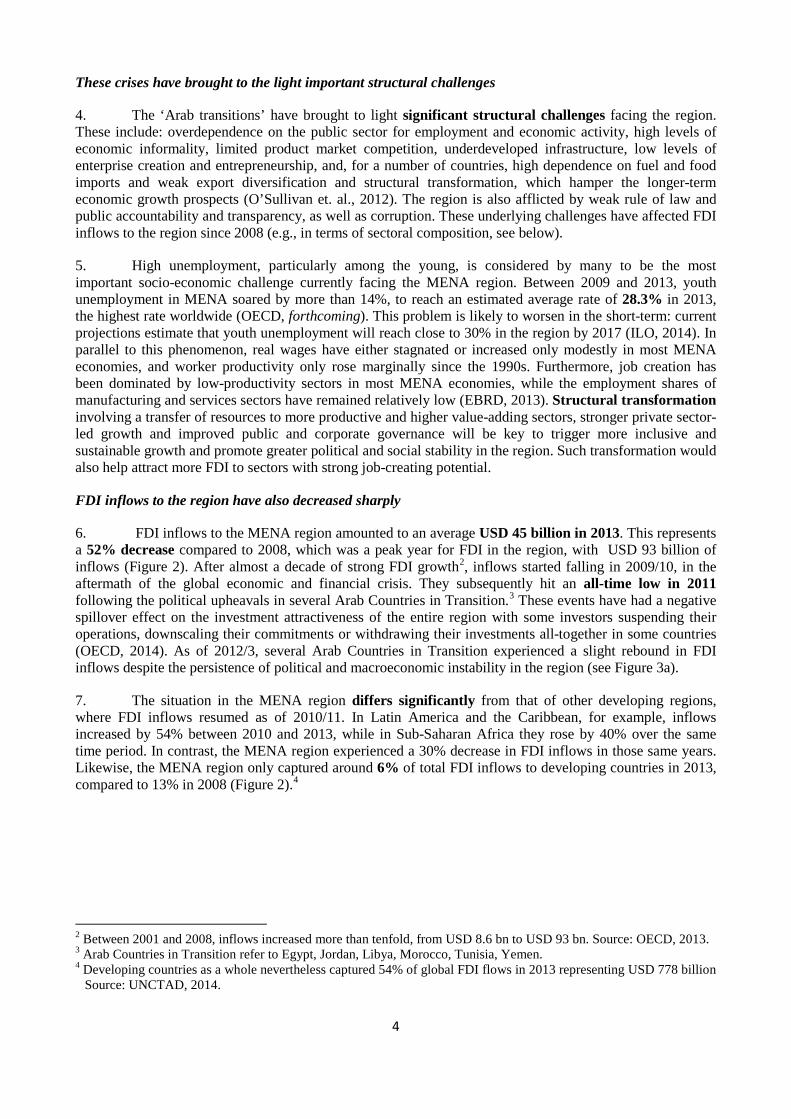
2. The MENA region1 achieved an average real GDP growth of 3.9% in 2013 compared with an average 6.9% in 2003-08 (IMF World Economic Outlook Database, October 2014). The Gulf Cooperation Council (GCC) bloc remains the fastest growing MENA sub-region with 4.2% of annual average growth in 2013, although its economic expansion has slowed in comparison with previous years (see Figure 1a). Continued heavy reliance on natural resources exposes the GCC economies to growth volatility due to commodity price and demand shocks.
3. The unrest and policy uncertainty that followed the ‘Arab transitions’ continue to impact the economic activity and near-term prospects of the MENA region. Libya, Iraq, Syria and Yemen are still torn by internal conflicts while Tunisia and Egypt remain subject to social tensions, as a result of complex political transitions and spillovers from conflicts in neighbouring countries. IMF growth projections for the MENA region are modest: 3.3% in 2014 and 4.1% in 2015 (IMF World Economic Outlook Database, October 2014).
Figure 1. Real GDP growth rates and youth unemployment in selected MENA economies
Note: Figure a: Arab Countries in Transition include Egypt, Jordan, Morocco, Tunisia and Yemen yet exclude Libya. Figure b: The youth unemployment rate is defined as the number of unemployed youth (15-24 years) divided by the youth labour force. Data for Jordan is an average of unemployment rates for the 15-19 and 20-24 age groups. Source: Figure a:IMF World Economic Outlook Database (October 2014) and Figure b: ILOSTAT Database.
1 The ‘MENA region’ refers in this paper to the 18 countries participating in the MENA-OECD Invesmtent Programme
unless stated otherwise.
4
These crises have brought to the light important structural challenges
4. The ‘Arab transitions’ have brought to light significant structural challenges facing the region. These include: overdependence on the public sector for employment and economic activity, high levels of economic informality, limited product market competition, underdeveloped infrastructure, low levels of enterprise creation and entrepreneurship, and, for a number of countries, high dependence on fuel and food imports and weak export diversification and structural transformation, which hamper the longer-term economic growth prospects (O’Sullivan et. al., 2012). The region is also afflicted by weak rule of law and public accountability and transparency, as well as corruption. These underlying challenges have affected FDI inflows to the region since 2008 (e.g., in terms of sectoral composition, see below).
5. High unemployment, particularly among the young, is considered by many to be the most important socio-economic challenge currently facing the MENA region. Between 2009 and 2013, youth unemployment in MENA soared by more than 14%, to reach an estimated average rate of 28.3% in 2013, the highest rate worldwide (OECD, forthcoming). This problem is likely to worsen in the short-term: current projections estimate that youth unemployment will reach close to 30% in the region by 2017 (ILO, 2014). In parallel to this phenomenon, real wages have either stagnated or increased only modestly in most MENA economies, and worker productivity only rose marginally since the 1990s. Furthermore, job creation has been dominated by low-productivity sectors in most MENA economies, while the employment shares of manufacturing and services sectors have remained relatively low (EBRD, 2013). Structural transformation involving a transfer of resources to more productive and higher value-adding sectors, stronger private sector-led growth and improved public and corporate governance will be key to trigger more inclusive and sustainable growth and promote greater political and social stability in the region. Such transformation would also help attract more FDI to sectors with strong job-creating potential.
FDI inflows to the region have also decreased sharply
6. FDI inflows to the MENA region amounted to an average USD 45 billion in 2013. This represents a 52% decrease compared to 2008, which was a peak year for FDI in the region, with USD 93 billion of inflows (Figure 2). After almost a decade of strong FDI growth2, inflows started falling in 2009/10, in the aftermath of the global economic and financial crisis. They subsequently hit an all-time low in 2011 following the political upheavals in several Arab Countries in Transition.3 These events have had a negative spillover effect on the investment attractiveness of the entire region with some investors suspending their operations, downscaling their commitments or withdrawing their investments all-together in some countries (OECD, 2014). As of 2012/3, several Arab Countries in Transition experienced a slight rebound in FDI inflows despite the persistence of political and macroeconomic instability in the region (see Figure 3a).
7. The situation in the MENA region differs significantly from that of other developing regions, where FDI inflows resumed as of 2010/11. In Latin America and the Caribbean, for example, inflows increased by 54% between 2010 and 2013, while in Sub-Saharan Africa they rose by 40% over the same time period. In contrast, the MENA region experienced a 30% decrease in FDI inflows in those same years. Likewise, the MENA region only captured around 6% of total FDI inflows to developing countries in 2013, compared to 13% in 2008 (Figure 2).4
2 Between 2001 and 2008, inflows increased more than tenfold, from USD 8.6 bn to USD 93 bn. Source: OECD, 2013. 3 Arab Countries in Transition refer to Egypt, Jordan, Libya, Morocco, Tunisia, Yemen. 4 Developing countries as a whole nevertheless captured 54% of global FDI flows in 2013 representing USD 778 billion
Source: UNCTAD, 2014.
5
Figure 2. FDI inflows to MENA and other developing country regions, 2005-13
Note: MENA refers to the 18 countries participating in the MENA-OECD Investment Programme Source: UNCTAD FDI statistics
8. The Arab region5 also ranked 5th out of 7 regions in the Dhaman Investment Attractiveness Index, which categorises regions (1st rank being the most attractive, 7th the least attractive) according to the following criteria: macroeconomic stability, financial structure, institutional and business environment, market size and accessibility, human and natural resources, cost elements, infrastructure, agglomeration economies and technological environment (Arab Investment and Export Credit Guarantee Corporation, 2013).
Yet the magnitude of the drop has varied across MENA sub-groups and economies
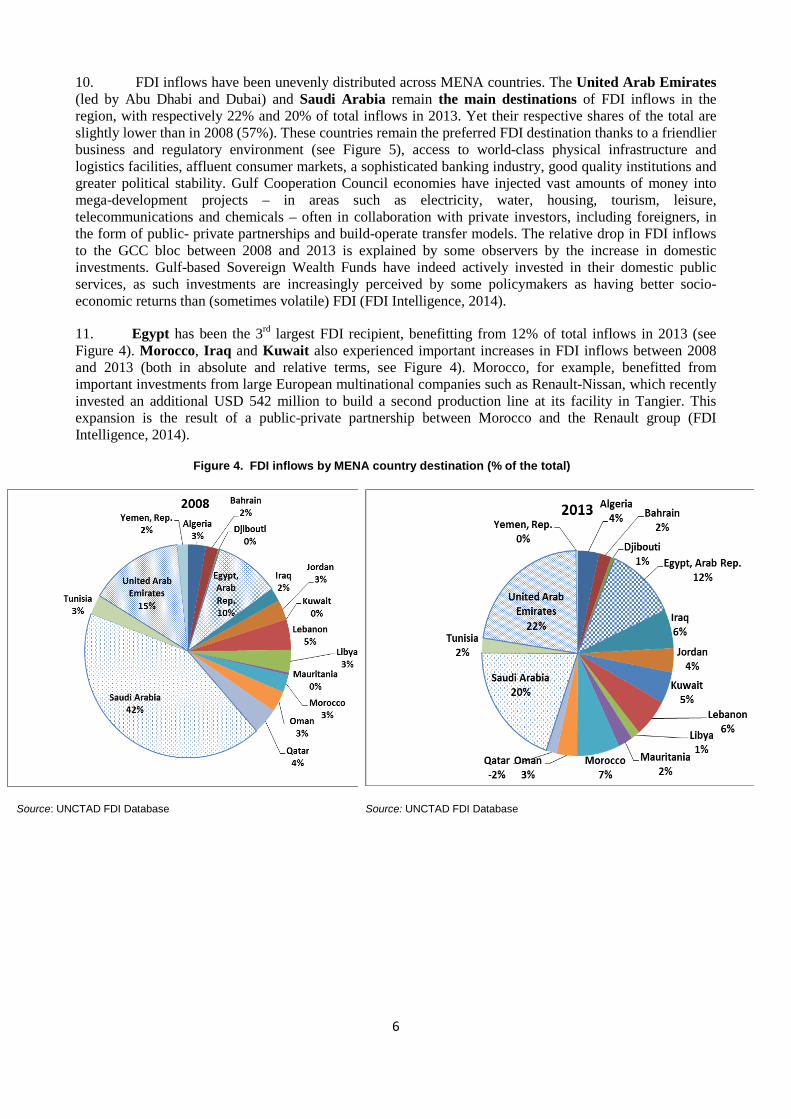
9. Between 2008 and 2013, FDI to the Arab Countries in Transition dropped by an average 45% while it dropped by an average 61% in the GCC countries. Yet the 2011 wave of political change triggered a very significant decrease in FDI inflows to some Arab Countries in Transition. Indeed, in 2011, this group of countries witnessed an average 70% decrease in FDI inflows compared to 2010. Yemen, Egypt, Libya, and to a lesser extent Tunisia, have been some of the most hardly hit countries. Egypt, in particular, experienced disinvestments exceeding USD 600 million between 2010 and 2011 (see Figure 3a).
Figure 3. FDI inflows to selected MENA sub- regions, 2005-2013 a. Arab Countries in Transition (USD billion) b. Gulf Cooperation Council (USD billion)
Source: UNCTAD FDI statistics Source: UNCTAD FDI statistics
The United Arab Emirates and Saudi Arabia remain the main destinations of FDI inflows in 2013
5 Bahrain, Kuwait, Oman, Qatar, Saudi Arabia, UAE, Egypt, Lebanon, Jordan, Algeria, Libya, Morocco, Tunisia,
Mauritania, Sudan, Syria, Yemen.
6
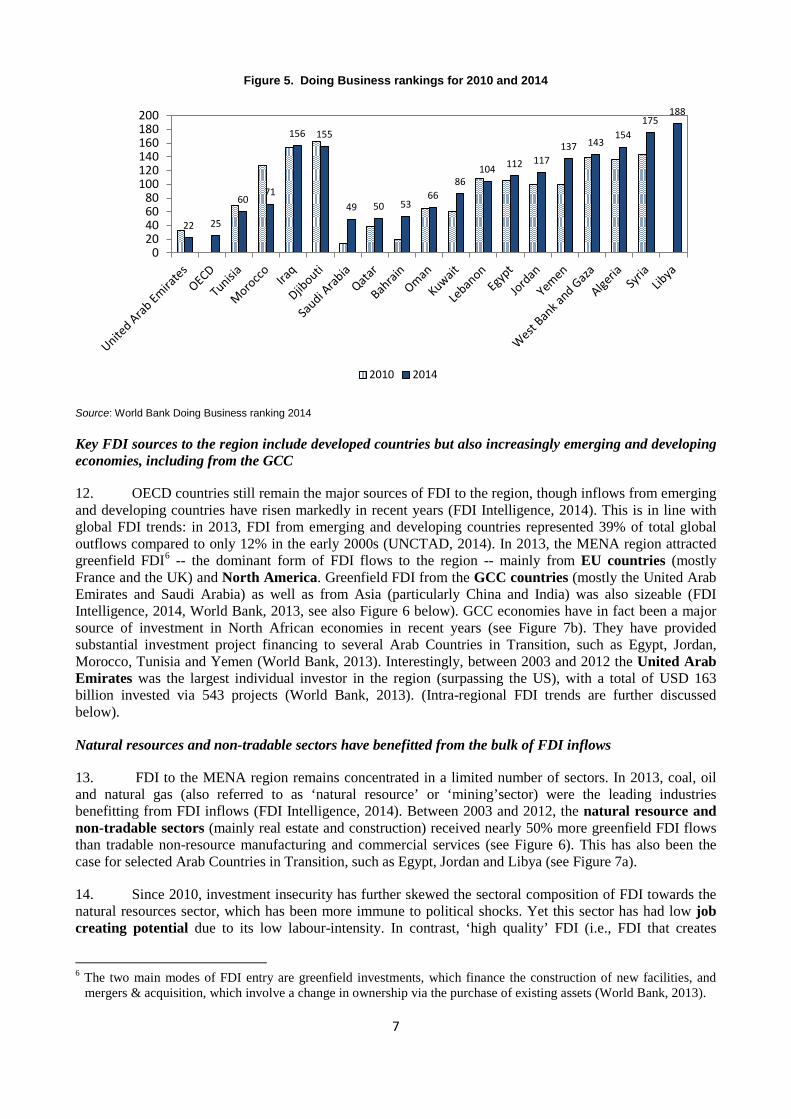
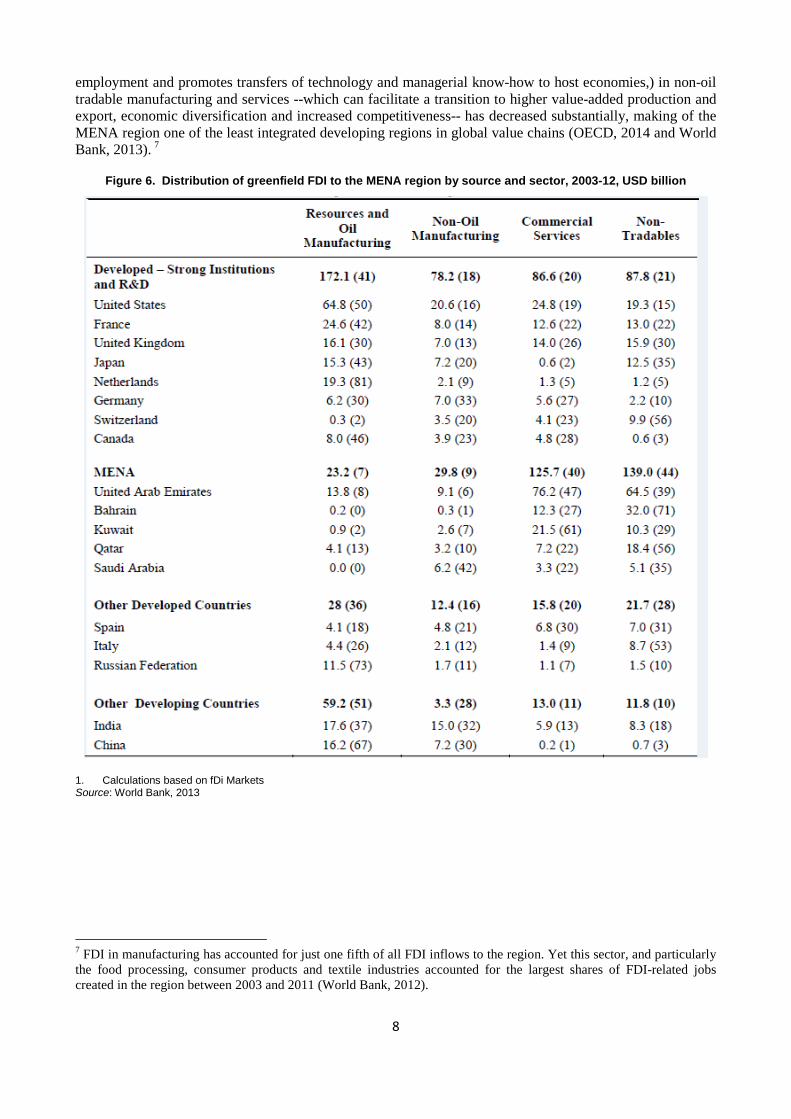
10. FDI inflows have been unevenly distributed across MENA countries. The United Arab Emirates (led by Abu Dhabi and Dubai) and Saudi Arabia remain the main destinations of FDI inflows in the region, with respectively 22% and 20% of total inflows in 2013. Yet their respective shares of the total are slightly lower than in 2008 (57%). These countries remain the preferred FDI destination thanks to a friendlier business and regulatory environment (see Figure 5), access to world-class physical infrastructure and logistics facilities, affluent consumer markets, a sophisticated banking industry, good quality institutions and greater political stability. Gulf Cooperation Council economies have injected vast amounts of money into mega-development projects – in areas such as electricity, water, housing, tourism, leisure, telecommunications and chemicals – often in collaboration with private investors, including foreigners, in the form of public- private partnerships and build-operate transfer models. The relative drop in FDI inflows to the GCC bloc between 2008 and 2013 is explained by some observers by the increase in domestic investments. Gulf-based Sovereign Wealth Funds have indeed actively invested in their domestic public services, as such investments are increasingly perceived by some policymakers as having better socio-economic returns than (sometimes volatile) FDI (FDI Intelligence, 2014).
11. Egypt has been the 3rd largest FDI recipient, benefitting from 12% of total inflows in 2013 (see Figure 4). Morocco, Iraq and Kuwait also experienced important increases in FDI inflows between 2008 and 2013 (both in absolute and relative terms, see Figure 4). Morocco, for example, benefitted from important investments from large European multinational companies such as Renault-Nissan, which recently invested an additional USD 542 million to build a second production line at its facility in Tangier. This expansion is the result of a public-private partnership between Morocco and the Renault group (FDI Intelligence, 2014).
Figure 4. FDI inflows by MENA country destination (% of the total)
Source: UNCTAD FDI Database Source: UNCTAD FDI Database
7
Figure 5. Doing Business rankings for 2010 and 2014
22 25
6071
156 155
49 50 5366
86104 112 117
137 143154
175188
020406080
100120140160180200
2010 2014
Source: World Bank Doing Business ranking 2014
Key FDI sources to the region include developed countries but also increasingly emerging and developing economies, including from the GCC
12. OECD countries still remain the major sources of FDI to the region, though inflows from emerging and developing countries have risen markedly in recent years (FDI Intelligence, 2014). This is in line with global FDI trends: in 2013, FDI from emerging and developing countries represented 39% of total global outflows compared to only 12% in the early 2000s (UNCTAD, 2014). In 2013, the MENA region attracted greenfield FDI6 -- the dominant form of FDI flows to the region -- mainly from EU countries (mostly France and the UK) and North America. Greenfield FDI from the GCC countries (mostly the United Arab Emirates and Saudi Arabia) as well as from Asia (particularly China and India) was also sizeable (FDI Intelligence, 2014, World Bank, 2013, see also Figure 6 below). GCC economies have in fact been a major source of investment in North African economies in recent years (see Figure 7b). They have provided substantial investment project financing to several Arab Countries in Transition, such as Egypt, Jordan, Morocco, Tunisia and Yemen (World Bank, 2013). Interestingly, between 2003 and 2012 the United Arab Emirates was the largest individual investor in the region (surpassing the US), with a total of USD 163 billion invested via 543 projects (World Bank, 2013). (Intra-regional FDI trends are further discussed below).
Natural resources and non-tradable sectors have benefitted from the bulk of FDI inflows
13. FDI to the MENA region remains concentrated in a limited number of sectors. In 2013, coal, oil and natural gas (also referred to as ‘natural resource’ or ‘mining’sector) were the leading industries benefitting from FDI inflows (FDI Intelligence, 2014). Between 2003 and 2012, the natural resource and non-tradable sectors (mainly real estate and construction) received nearly 50% more greenfield FDI flows than tradable non-resource manufacturing and commercial services (see Figure 6). This has also been the case for selected Arab Countries in Transition, such as Egypt, Jordan and Libya (see Figure 7a).
14. Since 2010, investment insecurity has further skewed the sectoral composition of FDI towards the natural resources sector, which has been more immune to political shocks. Yet this sector has had low job creating potential due to its low labour-intensity. In contrast, ‘high quality’ FDI (i.e., FDI that creates
6 The two main modes of FDI entry are greenfield investments, which finance the construction of new facilities, and
mergers & acquisition, which involve a change in ownership via the purchase of existing assets (World Bank, 2013).
8
employment and promotes transfers of technology and managerial know-how to host economies,) in non-oil tradable manufacturing and services --which can facilitate a transition to higher value-added production and export, economic diversification and increased competitiveness-- has decreased substantially, making of the MENA region one of the least integrated developing regions in global value chains (OECD, 2014 and World Bank, 2013). 7
Figure 6. Distribution of greenfield FDI to the MENA region by source and sector, 2003-12, USD billion
1. Calculations based on fDi Markets Source: World Bank, 2013
7 FDI in manufacturing has accounted for just one fifth of all FDI inflows to the region. Yet this sector, and particularly the food processing, consumer products and textile industries accounted for the largest shares of FDI-related jobs created in the region between 2003 and 2011 (World Bank, 2012).
9
Figure 7. Greenfield FDI inflows into Arab Countries in Transition by sector and source (% of total), 2003-11
Source: World Bank, 2012 (based on FDI Markets)
15. Greater FDI in the infrastructure sector, in particular, would be warranted in the future. The World Bank, for example, estimates the region’s infrastructure needs through 2020 at about USD 106 billion per year. New investments, particularly in the energy and transport industries, could boost countries’ competitiveness and foster job creation (World Bank, 2012). New OECD research indeed estimates that meeting annual infrastructure investment needs could generate around 2 million direct jobs throughout the MENA region and 2.5 million indirect and induced infrastructure-related jobs (OECD (b), forthcoming).
Intra-regional investment flows remain below potential, especially amongst regional trading partners
16. Data on intra-regional investment flows is scarce. For 2012, the Arab Investment and Export Guarantee Corporation collected data for eight MENA countries, including Morocco, Egypt, Tunisia, Kuwait, Jordan, Bahrain, Algeria and Yemen (Arab Investment and Export Credit Guarantee Corporation, 2013). Accordingly, intra-regional FDI inflows totalled USD 3.4 billion, representing approximately 24% of total FDI inflows to these countries. A closer look at the composition of these intra-regional FDI flows however pinpoints that the lion’s share (77%) originated from GCC economies. Intra-regional FDI excluding outflows from GCC remains relatively low, despite the existence of a variety of preferential and regional trade agreements and bilateral investment treaties in the region (see Figure 8).8 For example, intra-regional FDI between North African MENA countries only accounted for 6% of total FDI flows to the region in 2012 despite the existence of the Agadir Agreement between Egypt, Jordan, Morocco and Tunisia (World Bank, 2012). In comparison, intra-ASEAN FDI represented 17.2% (equivalent to 21.3 USD millions) of total FDI inflows to this region in 2012 (Freund and Ianchovichina, 2012 and ASEAN FDI Statistics Database).
17. ‘Deeper’ and more effectively implemented regional economic integration schemes (covering trade and investment policy but also regulatory, industrial and infrastructure development policies) would give foreign investors access to a greater regional market, which could in turn boost FDI inflows to the region. Regional economic groupings indeed seem to drive regional FDI inflows in other developing country areas (UNCTAD, 2014). In the same vein, greater intra-regional trade could boost the competitiveness of domestic 8 For example, members of the League of Arab States have signed 105 bilateral investment agreements with other countries of the region.
10
production processes and facilitate the region’s integration and ‘upgrading’ into global value chains. In this regard, the OECD Policy Framework for Investment points to the importance of effective trade policies for more and ‘better quality’ FDI, as such policies can facilitate countries’ integration into global supply chains, boost productivity and improve returns on investment.9 Recent OECD research indeed highlights the increased interdependence of trade and investment flows in a context of fragmented global supply chains: trade in intermediate inputs is often accompanied by cross-border investments in production facilities, training and technology.
Figure 8. Network of preferential and regional trade agreements in MENA
Source: World Bank, 2012
FDI statistics from the region are not always reliable nor comprehensive and do not allow for cross-country comparisons
18. The reliability and comparability of FDI statistics across the MENA region is relatively low, as these data are often collected by a variety of government institutions (e.g., national central banks, statistical offices, investment promotion agencies and other government departments) using varying FDI definitions and data collection methods. In addition, there is no regional standardisation which would allow for rigorous cross-country comparisons.
9 http://www.oecd.org/daf/inv/investment-policy/36671400.pdf.
11
Box 1. Measuring FDI- The OECD Benchmark FDI Definition
OECD countries have made efforts over the past decade to align their national statistics with the recommendations of the OECD Benchmark Definition of Foreign Direct Investment to provide more reliable, comprehensive and internationally comparable FDI statistics.
The OECD and the IMF define FDI as a category of investment that reflects the objective of establishing a lasting interest by a resident enterprise in one economy (direct investor) in an enterprise (direct investment enterprise) that is resident in an economy other than that of the direct investor. The lasting interest implies the existence of a long-term relationship between the direct investor and the direct investment enterprise and a significant degree of influence on the management of the enterprise. The numerical threshold of ownership of 10% of the voting power determines the existence of a direct investment relationship between the direct investor and the direct investment enterprise. The population of enterprises to be included in the statistics is determined according to the Framework of Direct Investment Relationship (FDIR). The statistical unit is the enterprise (as opposed to local enterprise group) resident within an economic territory.
The OECD recommends that FDI statistics be compiled and disseminated for inward/outward FDI positions (stocks of equity and intercompany debt) as well as for financial flows (of equity, reinvestment of earnings, and intercompany debt) and income flows (for dividends, reinvested earnings and interest on intercompany debt). Data should be based on the methodology referred to as the “directional principle” and be provided for subcomponents by partner country and by industry (according to International Standard Industry Classification (ISIC). Market value should be applied by using recommended proxies for unlisted companies. For data dissemination, OECD recommends standard presentation distinguishing transactions and positions of resident Special Purpose Entities (SPEs) and proposes a list of supplemental presentations.
Data collection in OECD countries is based primarily on annual (and quarterly) enterprise surveys complemented by other sources such as the International Transactions System (ITRS), administrative sources, press, etc. Data collection is subject to special legislations in all OECD countries which is a necessary element for the safeguard of data confidentiality and to ensure the collection of reliable and complete information from reporting enterprises. The existence of legislation also enables to achieve a good response rate while sanctions are included for non-response. Source : OECD, 2013b
Conclusions and policy implications
19. Short-term FDI prospects for the MENA region are subject to a variety of risks, due to continued armed conflicts and political and social tensions in a number of countries and modest global and regional growth prospects (including in developed countries which are important FDI sources of the region). Several MENA countries –such as Morocco, Egypt and the United Arab Emirates-- are nevertheless likely to continue to benefit from an upward FDI trend. Policy uncertainty in some Arab Countries in Transition remains a key obstacle to foreign investment, particularly in the non-oil tradable manufacturing and services sectors which play a key role in deepening these countries’ integration into world markets. FDI in these sectors also has a significant job creation potential which could lead to ensuing socio-economic and social benefits for the local population.
20. Beyond reaching a national consensus on political reforms and restoring political stability in the region, MENA policymakers should also seek to introduce structural reforms that will help boost economic growth and improve their country’s investment attractiveness. These include but are not limited to economic diversification, private sector and entrepreneurship development, greater openness and competition in key economic sectors and well-functioning labour markets. Policymakers should also seek to establish predictable, non-discriminatory and transparent regulatory and legal frameworks (including the establishment of a ‘level playing field’ among new entrants and a few privileged insiders) and simpler business-related procedures (via administrative simplification) to enhance the business climate and restore investor confidence.
21. In addition, in order to further boost the region’s (or sub-regions’) attractiveness to foreign investors (including from emerging economies), policymakers may consider reinforcing the implementation
12
of existing regional economic integration schemes, and deepen and consolidate the latter where relevant. Such a move may not only increase FDI inflows to the region in the longer term, but also promote these countries’ integration into the global economy. The recent amendment of the Arab League Investment Agreement is a good case in point. The 2013 update aims to spur intra-regional investment by enhancing cooperation amongst Arab countries, namely via the establishment of common standards and improved information-sharing on rules and business opportunities. The amendment reinforces existing investment protection and treatment standards while introducing new ones (such as the Most-Favoured Nation clause). In addition, it strengthens the role of Arab League institutions to promote harmonised investment policies and disseminate investment-related information. More importantly, the update introduces an improved dispute settlement mechanism to encourage better enforcement of the Agreement (OECD, 2014b).
22. Finally, policymakers may also seek to improve data collection of FDI statistics, including via the adoption of a common definition and greater harmonisation of data collection methods within and across countries. In this regard, MENA policymakers may consider engaging with the OECD Working Group on International Investment Statistics, a subsidiary body of the OECD Investment Committee that is responsible for methodological issues regarding FDI statistical data collection, in order to benefit from international best practice in this area. In addition, the OECD could assist countries in the region to adopt the OECD definition and methodology, in view of facilitating regional and international comparisons.10
10 Similar work is for example conducted by the OECD on revenue statistics in Africa/Latin America, in order to
provide internationally comparable data on tax levels and tax structures for a selection of African /Latin American countries. The model used is the OECD Revenue Statistics Database.
13
BIBLIOGRAPHY
Arab Investment and Export Credit Guarantee Corporation (2013), Investment Climate in Arab Countries: Dhaman Investment Attractiveness Index 2012-2013, Kuwait.
European Bank for Reconstruction and Development (EBRD) (2013), Transition Report 2013, EBRD, London.
FDI Intelligence (2014), The FDI Report 2014: Global Greenfield Investment Trends, London, UK.
International Monetary Fund (IMF) (2014), Regional Economic Outlook: Middle East and Central Asia, October 2014, IMF, Washington D.C.
Malik, A., and Awadallah, B. (2013), The Economics of the Arab Spring, in: World Development, 45, pp. 296-313.
Organisation for Economic Cooperation and Development (OECD) (2013), “Assessment of Investment Policies in the MENA Countries”, Paper prepared for the MENA-OECD Regional Investment Working Group, 19-20 March 2013..
OECD (2013b), OECD Investment Policy Reviews: Jordan 2013, OECD Publishing, Paris
OECD (2014), “Protecting Investment in Arab Countries in Transition”, DAF/INV(2014)11/REV1, OECD Publishing, Paris.
OECD (2014b), “The 2013 Amendment to the 1980 Arab League Investment Agreement: A Step Towards Improving the Region’s Attractiveness to Investors”, Paper prepared for the LAS-OECD Technical Workshop on the Amended Arab League Investment Agreement, 7-8 April 2014, Cairo, Egypt.
OECD (forthcoming), Tackling Youth Unemployment in the MENA Region Through Private Sector Development: Learning from Good Practice, OECD Publishing, Paris.
OECD (b) (forthcoming), OECD (b) (forthcoming), Public-Private Partnerships in the Middle East and North Africa: A Handbook for Policymakers, OECD Publishing, Paris.
Freund, C. and Ianchovichina, E. (2012), Infrastructure and Employment Creation in the Middle East and North Africa, World Bank Quick Notes Series Number 54, World Bank Group, Washington D.C.
United Nations Conference on Trade and Development (UNCTAD) (2014), World Investment Report 2014, UNCTAD, Geneva.
World Bank (2012), From Political to Economic Awakening in the Arab World, World Bank Group, Washington D.C.
World Bank (2013), Middle East and North Africa Economic Developments and Prospects: Investing in Turbulent Times, October 2013, World Bank Group, Washington D.C.