Embed Size (px)
Citation preview

MULTIMODAL SYSTEMS IN LOCAL COMPREHENSIVE PLANS—THREE CITIES
TECHNICAL MEMORANDUM: THE CITY OF TAMPA
Technical Memorandum – City of Temple TerraceDecember 2007

MULTIMODAL SYSTEMS IN LOCAL COMPREHENSIVE PLANS—THREE CITIES
Technical Memorandum – City of Tampa December 2007 2
S.0 EXECUTIVE SUMMARY The City of Tampa and its community members have expressed interest in providing welcoming conditions for walking, bicycling, and transit. Meanwhile, changes to Florida Statute require the City of Tampa to implement proportionate a “fair share” ordinance, clearly demonstrating the financial feasibility of it’s Capital Improvement Element (CIE) and update it’s Transportation Concurrency Exception Areas (TCEAs) to plan for future mobility.
As the City of Tampa reviews its level of service (LOS) standards to update its Comprehensive Plan, it is recommended that adopted standards support the City’s vision. Current transportation LOS standards are based on roadway capacity. However, with the escalating cost of roadway construction in urbanized areas, is it realistic to assume that transportation needs can be met by widening roads alone? More importantly, does this standard place value on the characteristics that the City’s members have identified for their community?
If the City of Tampa were to reshape its LOS standards, what guidance exists for measuring an adequate multimodal level-of-service for transit, walking, and bicycling infrastructure?
Florida Department of Transportation (FDOT) developed sample guidelines in its Multimodal Transportation Districts and Areawide Quality of Service Handbook (MMTD Handbook), published by the FDOT Systems Planning Office in 2004. Since that time, an evaluation of TCEA’s conducted by the DCA favored TCEA’s with measurable standards for multimodal mobility like the standards in the MMTD Handbook. In addition, SB 360 raised the bar for TCEA’s, requiring that the Comprehensive Plan identify how mobility will be maintained. Use of the MMTD Handbook standards for multimodal mobility is a method of documenting the City’s multimodal facilities and plans.
This technical memorandum identifies and documents questions and issues pertaining to the implementation of Senate Bill (SB) 360 mitigation requirements for the City of Tampa. According to F.S. 163.3180(5)(f) for TCEAs or F.S. 163.3180(15)(a) for multimodal transportation districts (MMTDs), the purpose of this legislation is to provide guidance to local jurisdictions for use in developing community improvements that support walking, bicycling, and transit use. This memorandum also evaluates multimodal policy considerations for the City of Tampa. Specific evaluations discussed in the technical memorandum include:
Feasibility evaluation of implementing a MMTD using multimodal area-wide Quality Level-of-Service (Q/LOS) measures identified in the Multimodal Transportation Districts and Areawide Quality of Service Handbook (MMTD Handbook), published by the FDOT Systems Planning Office;
Summary of relevant statutes and/or policy statements and other guidance from the Department of Community Affairs (DCA) and FDOT;
Documentation of several possible questions/issues for review by DCA and FDOT staff;
Documentation of statewide best practices and identification of peer agencies with multimodal mitigation strategies and approaches;

MULTIMODAL SYSTEMS IN LOCAL COMPREHENSIVE PLANS—THREE CITIES
Technical Memorandum – City of Tampa December 2007 3
Peer agency interviews and evaluation of perceived strengths and weaknesses of each approach with regards to the intentions of the Growth Management Act/SB 360;
Identification of hybrid policies and/or procedural mechanisms necessary to implement a multimodal approach for the City of Tampa; and
Description of possible methodologies for calculating alternate mode mitigation for the consideration and comment by the City, DCA, and FDOT.
This technical memorandum also attempts to quantify the role of local transit systems in mitigating the impacts of growth on the State’s Strategic Intermodal System (SIS). The Hillsborough Area Regional Transit Authority’s (HART) bus system service area is focused on the City of Tampa and most of the TCEA. Consequently, the greatest potential for the bus system to mitigate SIS impacts is by providing modal alternatives for person trips that both originate and are destined for locations within the TCEA or intra-TCEA trips. As shown in Table 6.1 in Section 6.0 (pg. 58), there are approximately 610,000 intra-TCEA trips forecasted to use SIS facilities in 2025. Comparatively, the cost of improving the proposed transit emphasis corridors would be approximately $116 million over a twenty year service life as indicated in Table 2.18 of Section 2.3.3 (pg. 40) or cost approximately $1,900 per residential dwelling unit and $1,500 per square foot of office (Table 2.19).
A regional transit system could assist in further mitigating the impacts to SIS facilities for TCEA growth that generates external to internal TCEA trips, such as commercial developments which draw commuters from outside of the TCEA. These external to internal TCEA trips constitute the City’s greatest impact to SIS facilities with approximately 2.67 million trips.
As a result, this report recommends that the City of Tampa consider amendments to their Comprehensive Plan identifying policies, objectives, and goals to update the existing TCEA with multimodal standards and multimodal impact mitigation calculation strategies. This approach could potentially provide mobility options for development’s impact on SIS facilities. Section 6.0 of this technical memorandum describes in detail the methodologies and strategies required to implement the recommended hybrid approach.

MULTIMODAL SYSTEMS IN LOCAL COMPREHENSIVE PLANS—THREE CITIES
Technical Memorandum – City of Tampa December 2007 4
1.0 STUDY BACKGROUND In 2005, the Florida Legislature enacted SB 360, setting a deadline for local governments to develop a financially feasible CIE of the Comprehensive Plan, providing funding to maintain adopted LOS standards on major roadways. SB 360 also requires the municipality to update elements of its Comprehensive plan related to any areas within its political boundaries that have been designated as a TCEA. These TCEA requirements, described in detail below, stipulate that each municipality shall:
Plan for and implement strategies to support and fund mobility including alternative modes of transportation;
Address urban design;
Address appropriate land use mixes, including density and intensity;
Address network connectivity plans needed to promote urban infill, redevelopment, or downtown revitalization; and
Provide data and analysis justifying the size and area of a given TCEA.
The TCEA requirements introduced in SB 360 are, in many ways, similar to the concepts and implementation criteria associated with MMTD, a concurrency management tool which post-dates the TCEA. In 1999, the MMTD option was introduced into the Florida Growth Management Act as an alternative method to manage the traffic impacts of growth in areas where the provision of alternate modes of travel, supported by appropriate land uses, could reasonably enable a local government to consider a multimodal LOS standard in lieu of typical roadway LOS criteria. Although a MMTD does not require explicit infill, redevelopment, or downtown revitalization strategies, consideration of converting from a TCEA to a MMTD or implementing MMTD strategies within the policy framework of a TCEA may assist municipalities in the following ways:
Implementation of multimodal LOS standards may provide a framework for establishing multimodal mitigation requirements as part of the municipality’s Land Development Code/Concurrency Management System; and
Introduction of multimodal LOS standards into the capital planning process and consideration of the interaction of multimodal facilities with land use density, intensity, and organization that satisfy most of the SB 360 TCEA comprehensive planning requirements listed above and stipulated by 163.3180(5)(e).
Both TCEAs and MMTDs place the same standard upon the implementing local government agency(s) with respect to Strategic Intermodal System (SIS) facilities and Transportation Regional Incentive Program (TRIP) funded roadways. According to F.S. 163.3180(5)(f) for TCEAs or F.S. 163.3180(15)(a) for MMTDs, the implementing local government must consult with their District FDOT office to assess the impacts of the exception area or multimodal district on SIS and TRIP-funded facilities, as well as coordinate with the District to develop a plan to mitigate those impacts.

MULTIMODAL SYSTEMS IN LOCAL COMPREHENSIVE PLANS—THREE CITIES
Technical Memorandum – City of Tampa December 2007 5
2.0 MULTIMODAL DISTRICT EVALUATION This section evaluates the existing conditions present within the City of Tampa based on the requirements established in Florida Administrative Code 9J-5 and also considers the current TCEA, and sub-areas within it, using multimodal area-wide Quality Level-of-Service (Q/LOS) measures identified in the Mutlimodal Transportation Districts and Area-wide Quality of Service Handbook (MMTD Handbook), published by the FDOT Systems Planning Office. Each evaluation uses updated socioeconomic data to determine whether infrastructure planning under the MMTD framework is a feasible response to a city’s mobility needs. Summary order of magnitude needs associated with meeting benchmark bicycle, pedestrian, and transit areawide LOS standards are also provided.
2.1 Introduction The City of Tampa, located north of Tampa Bay and east of the Cities of Clearwater and St. Petersburg (Figure 2.1) has Comprehensive Plan policies that established a TCEA that is bounded by the Tampa City Limits with the exception of the region north of Fletcher Avenue known as the University North District. The City of Tampa TCEA includes Urban Infill, Urban Redevelopment, and Downtown Revitalization Districts. Pursuant to SB 360, the City of Tampa is required to develop a financially feasible CIE which provides for the adopted LOS for the City’s major roadway/transportation network. SB 360 also requires Tampa to update their TCEA to:
Plan for and implement strategies to support and fund mobility… including alternative modes of transportation,
Address urban design,
Address appropriate land use mixes, including density and intensity,
Address network connectivity plans needed to promote urban infill, redevelopment, or downtown revitalization; and,
Provide data and analysis justifying the size and area of the TCEA.
Provided that the City can identify a funding program which can eventually implement the necessary urban design elements, the TCEA, with multimodal policy considerations, may provide a framework to allow developers to contribute to improvements that satisfy multimodal Q/LOS standards and can provide a clear mechanism for the planning and prioritization of multimodal investments.

MULTIMODAL SYSTEMS IN LOCAL COMPREHENSIVE PLANS—THREE CITIES
Technical Memorandum – City of Tampa December 2007 6

MULTIMODAL SYSTEMS IN LOCAL COMPREHENSIVE PLANS—THREE CITIES
Technical Memorandum – City of Tampa December 2007 7
2.2 Multimodal Mobility and Land Use Evaluation The MMTD Handbook provides an illustrated guide to evaluate the land use and transportation features necessary to establish a MMTD. Based on the direction provided by the MMTD Handbook, the following ten criteria have been evaluated for the City of Tampa:
Appropriate Scale of Development, Complementary Mix of Uses, Land Uses Promoting Multimodal Usage, Acceptable Separation of Land Uses, Appropriate Density and Intensity of Use, Appropriate Organization of Land Uses, Regional Intermodal Connectivity, Interconnected Multimodal Network, Acceptable LOS for Each Mode, and Acceptable Area-wide Quality of Service for Each Mode.
Although the Hillsborough Planning Commission Draft Concept Map regions extend beyond the City limits and the current TCEA, only those portions of each region within the current TCEA were evaluated. These impact fee districts and sub-areas are illustrated in Figures 2.2 and 2.3.
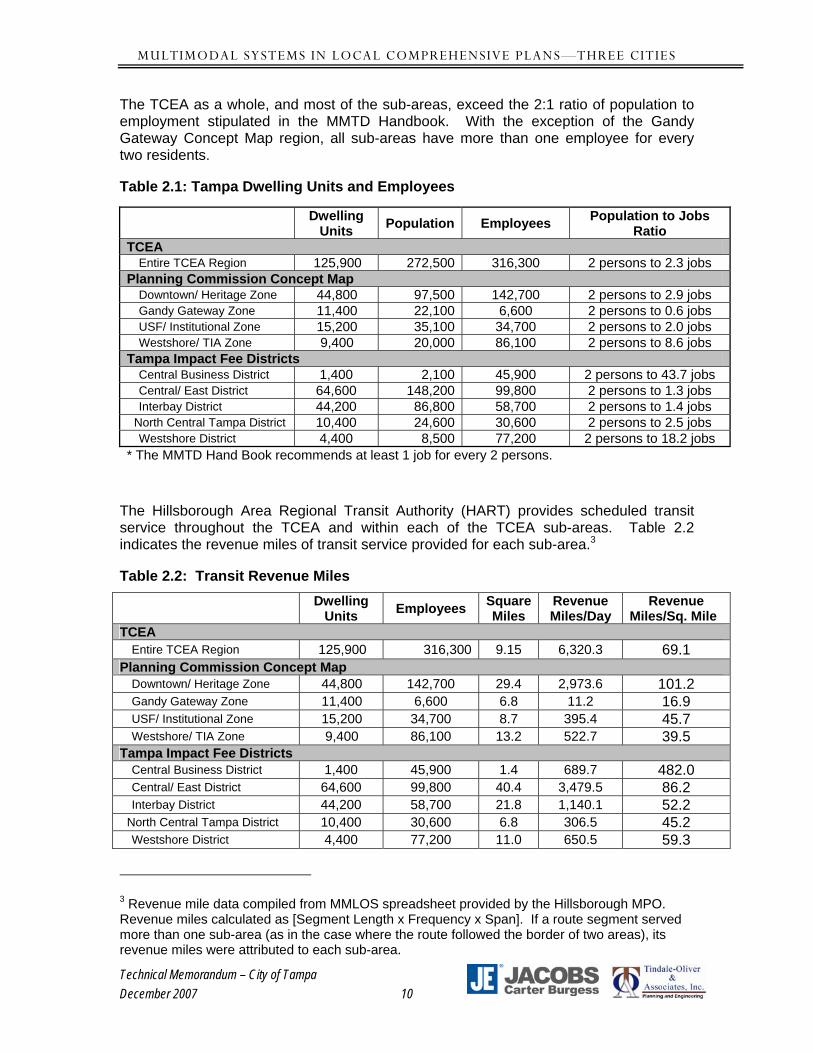
2.2.1 Appropriate Scale of Development A MMTD should have a “critical mass” of population and employment and should provide scheduled transit service when the subject district is too large to traverse on foot. The MMTD Handbook identifies a minimum threshold of 5,000 residents and a 2:1 ratio of population to employment. Table 2.1 shows the population and employment of the TCEA and TCEA sub-areas. The data shown in the table is based on year 2000 Tampa Bay Regional Planning Model (TBRPM) traffic analysis zone (TAZ) data and therefore is a conservative estimate of current (2007) population and employment statistics.
Although the population estimates exceed the recommended minimum threshold for the TCEA as a whole, each Concept Map region, and most of the impact fee districts, the year 2000 data indicates that the Central Business District (CBD) impact fee district has fewer than 5,000 permanent residents. Based on data provided by the Downtown Partnership1 the current (year 2007) estimate of dwelling units within the CBD is 3,340, translating into a potential of approximately 5,010 residents2. This figure generally supports the 2015 TBRPM estimate of 4,410 dwelling units as well as the 2025 City of Tampa Community Planning Division estimate of 15,640 dwelling units in the downtown core. As such, the TCEA and all sub-areas reasonably meet the minimum 5,000 person threshold.
1 http://marketing.cbre.com/tampa/tampa_downtown/timeline.htm 2 1.5 residents per Dwelling Unit based on smaller units and potential seasonal occupancy

MULTIMODAL SYSTEMS IN LOCAL COMPREHENSIVE PLANS—THREE CITIES
Technical Memorandum – City of Tampa December 2007 8

MULTIMODAL SYSTEMS IN LOCAL COMPREHENSIVE PLANS—THREE CITIES
Technical Memorandum – City of Tampa December 2007 9
MULTIMODAL SYSTEMS IN LOCAL COMPREHENSIVE PLANS—THREE CITIES
Technical Memorandum – City of Tampa December 2007 10
The TCEA as a whole, and most of the sub-areas, exceed the 2:1 ratio of population to employment stipulated in the MMTD Handbook. With the exception of the Gandy Gateway Concept Map region, all sub-areas have more than one employee for every two residents.
Table 2.1: Tampa Dwelling Units and Employees
The Hillsborough Area Regional Transit Authority (HART) provides scheduled transit service throughout the TCEA and within each of the TCEA sub-areas. Table 2.2 indicates the revenue miles of transit service provided for each sub-area.3
Table 2.2: Transit Revenue Miles
Dwelling
Units Employees Square Miles
Revenue Miles/Day
Revenue Miles/Sq. Mile
TCEA Entire TCEA Region 125,900 316,300 9.15 6,320.3 69.1
Planning Commission Concept Map Downtown/ Heritage Zone 44,800 142,700 29.4 2,973.6 101.2 Gandy Gateway Zone 11,400 6,600 6.8 11.2 16.9 USF/ Institutional Zone 15,200 34,700 8.7 395.4 45.7 Westshore/ TIA Zone 9,400 86,100 13.2 522.7 39.5
Tampa Impact Fee Districts Central Business District 1,400 45,900 1.4 689.7 482.0 Central/ East District 64,600 99,800 40.4 3,479.5 86.2 Interbay District 44,200 58,700 21.8 1,140.1 52.2
North Central Tampa District 10,400 30,600 6.8 306.5 45.2 Westshore District 4,400 77,200 11.0 650.5 59.3
3 Revenue mile data compiled from MMLOS spreadsheet provided by the Hillsborough MPO. Revenue miles calculated as [Segment Length x Frequency x Span]. If a route segment served more than one sub-area (as in the case where the route followed the border of two areas), its revenue miles were attributed to each sub-area.
Dwelling
Units Population Employees Population to Jobs Ratio
TCEA Entire TCEA Region 125,900 272,500 316,300 2 persons to 2.3 jobs
Planning Commission Concept Map Downtown/ Heritage Zone 44,800 97,500 142,700 2 persons to 2.9 jobs Gandy Gateway Zone 11,400 22,100 6,600 2 persons to 0.6 jobs USF/ Institutional Zone 15,200 35,100 34,700 2 persons to 2.0 jobs Westshore/ TIA Zone 9,400 20,000 86,100 2 persons to 8.6 jobs
Tampa Impact Fee Districts Central Business District 1,400 2,100 45,900 2 persons to 43.7 jobs Central/ East District 64,600 148,200 99,800 2 persons to 1.3 jobs Interbay District 44,200 86,800 58,700 2 persons to 1.4 jobs
North Central Tampa District 10,400 24,600 30,600 2 persons to 2.5 jobs Westshore District 4,400 8,500 77,200 2 persons to 18.2 jobs
* The MMTD Hand Book recommends at least 1 job for every 2 persons.

MULTIMODAL SYSTEMS IN LOCAL COMPREHENSIVE PLANS—THREE CITIES
Technical Memorandum – City of Tampa December 2007 11
As shown in the Tables 2.1 and 2.2, the Downtown/Heritage Zone and Central Business District have better than average transit coverage. The table also shows that the Gandy Gateway Zone presently has a minimal level of transit coverage. Transit level of service (frequency) will be discussed in subsequent sections of this chapter.
2.2.2 Land Use Diversity The following three MMTD Handbook criteria provide for a qualitative evaluation of land use made up by identifying primary “anchor” land uses and evaluating the spatial relationship of these uses to one another as well as to other supporting uses.
Complementary Mix of Uses (three or more significant land uses),
Land Uses Promoting Multimodal Usage (land uses that are mutually supporting), and
Acceptable Separation of Land Uses (different land uses within acceptable walking range - 1/4 to 1/2 mile).
Figure 2.4 shows the organization of these primary and supporting uses. For the City of Tampa analysis, primary uses within the corporate limits include:
Center Office (Westshore and Downtown CBDs),
Regional Shopping Centers
Hospitals
Recreational (Convention Center, Arena/Stadium, Major Parks)
Cultural (Performing Arts Center, Art Museum, and Regional Library)
Schools/Colleges (Public and Private Schools, Colleges, and Universities)
Governmental/Institutional (Downtown City and County Government Centers and County and Federal Courts Complex)
High Density Residential (Greater than 16 Dwelling Units/Acres)
Intermodal Centers (Tampa International Airport, Cruise Ship Terminal, Union Station)
Although there is a greater concentration of primary uses within the downtown core, many of the primary uses are distributed throughout the TCEA; especially schools, recreational centers, and high-density residential areas. Overall, there is a significant amount of regionally significant land uses within the Tampa TCEA indicative of the City’s role as a regional employment and cultural center.

MULTIMODAL SYSTEMS IN LOCAL COMPREHENSIVE PLANS—THREE CITIES
Technical Memorandum – City of Tampa December 2007 12

MULTIMODAL SYSTEMS IN LOCAL COMPREHENSIVE PLANS—THREE CITIES
Technical Memorandum – City of Tampa December 2007 13
Table 2.3 indicates the quantity and percentage of dwelling units and jobs within half mile of one or more primary use sites. This evaluation is based on TBRPM year 2000 socioeconomic data and does not consider which specific use (example: St. Pete Times Forum) within a given category (example: Recreational Uses) is accessible, only whether some use from a given category may be reasonably accessed on foot. No benchmark values are provided in the MMTD Handbook although as a general conclusion, increasing residential densities near the downtown core will positively influence residential accessibility to the Center Office, Intermodal Center, Government Center, and Cultural primary uses.
Although access from general residential or employment uses to one or more primary attractors may be a more relevant measure of an area’s day-to-day multimodal potential, the co-location of multiple primary uses within walking distance of each other may create a sense of place and density which facilitates multimodal infrastructure investments such as the TECO streetcar which connects Ybor City with the Tampa Port, Channel District, St. Pete Times Forum, and Convention Center. Table 2.4 on the next page illustrates the cross-accessibility between uses.
Table 2.3: Residential and Employment Access to Primary Land Uses
Primary Use Dwelling
Units within ½ Mile
Percent of Total TCEA
Dwelling Units
Employees within ½
Mile
Percent of Total TCEA Employees
Office Center 530 0.4% 61,850 19.6% Intermodal Center 1,550 1.2% 49,640 15.7% Recreational 50,760 40.3% 148,570 47.0% Hospitals 11,210 8.9% 45,150 14.3% Regional Malls/Shopping Centers 1,000 0.8% 30,960 9.8%
Schools/Colleges 105,620 83.9% 239,950 75.9% Government/Institutional 480 0.4% 45,010 14.2% Cultural 1,510 1.2% 42,270 13.4% High Density Residential (>16 DU/Acre) 24,790 19.7% 123,200 39.0%
TCEA TOTAL 125,900 316,300

MULTIMODAL SYSTEMS IN LOCAL COMPREHENSIVE PLANS—THREE CITIES
Technical Memorandum – City of Tampa December 2007 14

MULTIMODAL SYSTEMS IN LOCAL COMPREHENSIVE PLANS—THREE CITIES
Technical Memorandum – City of Tampa December 2007 15
2.2.3 Appropriate Density and Intensity of Use The MMTD Handbook indicates that marginal transit supportive densities may be realized with residential densities of four dwelling units per acre and employment intensities of 40 employees per acre. This density/intensity analysis is presented in terms of both total developable acreage and also acreage of residential and non-residential developable land.
As shown in Figure 2.5, both density/intensity methods remove public infrastructure, parks, and intermodal facilities from the density/intensity calculation, the evaluation of density/intensity using only residential or non-residential land in the denominator will result in higher measured density/intensity than when all developable land is considered.
Figure 2.5: Density/Intensity Acreage Methods
100 GrossAcres
60 ResidentialAcres
20 Non-ResidentialAcres15 Public
Acres5 VacantAcres
85 DevelopableAcres
DU/100; EMP/100 DU/85; EMP/85 DU/60; EMP/20
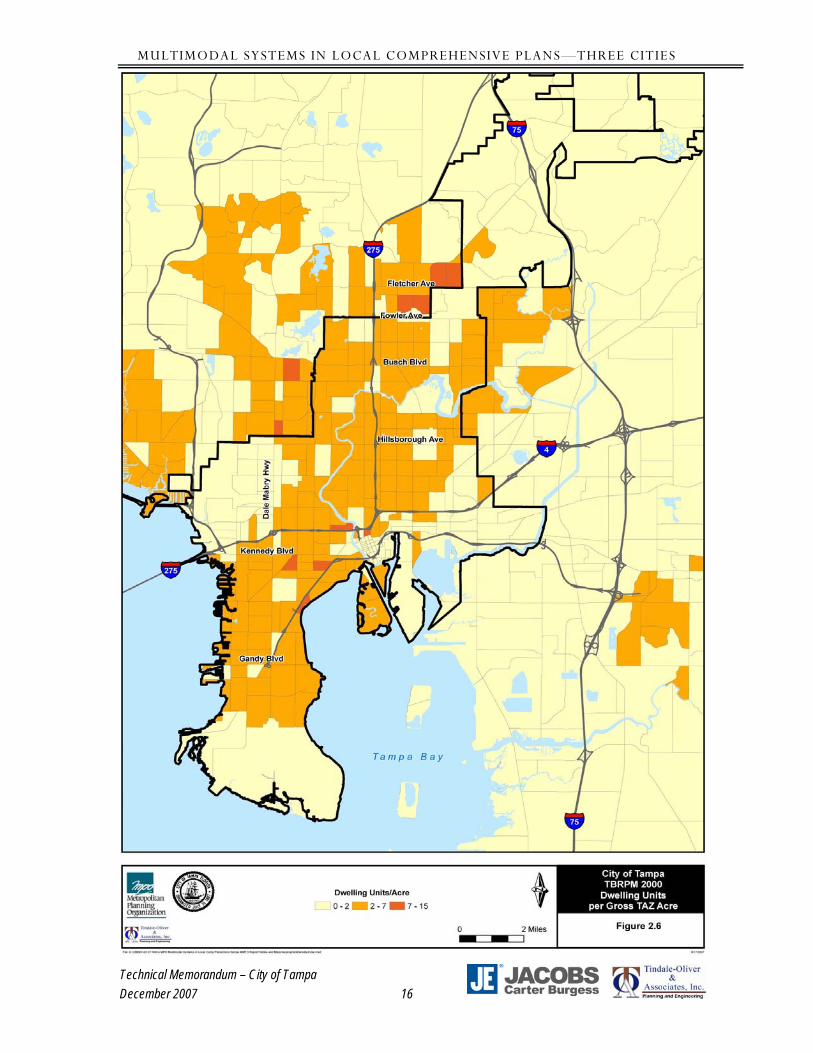
Figures 2.6 and 2.7 on the following pages illustrate the density and intensity of each TCEA traffic analysis zone based on year 2000 TBRPM data. Table 2.4 shows the dwelling units per acre and employees per acre using both the All Developable Acres and Net Acres figures in the denominator. Based on this analysis, the TCEA and many TCEA sub-areas meet the MMTD Handbook Criteria using a Net Acres analysis. Using the All Developable Acres Methodology, all of the sub areas excluding the Westshore areas meet the residential density criteria, whereas only the Central Business District meets the employment intensity criteria.
MULTIMODAL SYSTEMS IN LOCAL COMPREHENSIVE PLANS—THREE CITIES
Technical Memorandum – City of Tampa December 2007 16

MULTIMODAL SYSTEMS IN LOCAL COMPREHENSIVE PLANS—THREE CITIES
Technical Memorandum – City of Tampa December 2007 17

MULTIMODAL SYSTEMS IN LOCAL COMPREHENSIVE PLANS—THREE CITIES
Technical Memorandum – City of Tampa December 2007 18
Table 2.4: Dwelling Units, Employees per Acre
2.2.4 Appropriate Organization of Land Uses The MMTD Handbook recommends activities and key land uses be organized around core areas able to support bicycle and pedestrian travel for intra-activity center trips; these activity centers should be organized along transit corridors. To evaluate this criterion, net residential and non-residential densities were calculated and estimated at the parcel level by re-allocating year 2000 TBRPM TAZ dwelling unit and employment data to the residential and non-residential properties within each City of Tampa TAZ. The HART transit route system was then used to determine what percentage of TCEA dwelling units and population are currently within a quarter mile service area of a current transit route. This data is shown in Table 2.5 below.
Table 2.5: Dwelling Units, Employees within Quarter Mile of a Transit Route
Employees Dwelling Units
Served by Transit Route 287,800 106,900
Percent of Total 91% 85%
Total 316,300 125,900
Additional analysis was performed to show the relative concentration of dwelling units and employees within the TCEA. As illustrated in Table 2.6 all TCEA TAZs were sorted based on their density/intensity. A running total of dwelling units and acreage was then calculated in order to establish a relationship between consumption of land and population and employment concentrations.
Dwelling Units per
Developable Acre
Employees per
Developable Acre
Dwelling Units per Net
Residential Acre
Employees per Net Non-
Residential Acre
TCEA Entire TCEA Region 4.7 11.8 7.6 41.5
Planning Commission Concept Map Downtown/ Heritage Zone 4.7 15.0 8.7 45.3 Gandy Gateway Zone 4.9 2.8 7.9 15.1 USF/ Institutional Zone 5.0 11.4 8.8 32.3 Westshore/ TIA Zone 2.8 26.0 8.4 47.4
Tampa Impact Fee Districts Central Business District 4.3 140.9 12.5 424.4 Central/ East District 4.7 7.2 7.4 27.0 Interbay District 5.5 7.2 7.3 45.8
North Central Tampa District 4.5 13.4 8.6 33.4 Westshore District 1.8 32.5 8.4 47.4

MULTIMODAL SYSTEMS IN LOCAL COMPREHENSIVE PLANS—THREE CITIES
Technical Memorandum – City of Tampa December 2007 19
Table 2.6: Density/Intensity Method [Example]
In the example, above 25 percent of dwelling units are accommodated in only 12 percent of the land area. The relationships for the Tampa TCEA are shown in Figures 2.8, 2.9 and 2.10 which map the net residential and non-residential densities and intensities by 20% increments of population and employees accommodated. The relationships for the Tampa TCEA are also shown in Figures 2.11 and 2.12 which graph the ratio of population and employees to land area consumed. Generally, it can be stated that 80% of TCEA dwelling units are accommodated on only 40% of the total land area while 80% of TCEA jobs require only 35% of the total land area.
The concentration of dwelling units along a North-South axis roughly defined by the Lee Roy Selmon Crosstown Expressway and US 41 combined with a concentration of employment intensity along an East-West axis between Columbus Avenue and State Road 60 generally corresponds with the Phase I alignment of the Tampa Light Rail Study. Figure 2.10 shows the TAZs which fall in either the 60th percentile density or intensity tiers along with a half mile Tampa Light Rail Transit service area buffer.

MULTIMODAL SYSTEMS IN LOCAL COMPREHENSIVE PLANS—THREE CITIES
Technical Memorandum – City of Tampa December 2007 20
MULTIMODAL SYSTEMS IN LOCAL COMPREHENSIVE PLANS—THREE CITIES
Technical Memorandum – City of Tampa December 2007 21

MULTIMODAL SYSTEMS IN LOCAL COMPREHENSIVE PLANS—THREE CITIES
Technical Memorandum – City of Tampa December 2007 22

MULTIMODAL SYSTEMS IN LOCAL COMPREHENSIVE PLANS—THREE CITIES
Technical Memorandum – City of Tampa December 2007 23
Figure 2.11: Relationship of Population to Land Area Consumed
Residential Density / Land Area
0%10%20%30%40%50%60%70%80%90%
100%
0% 20% 40% 60% 80% 100%
Percent of Dwelling Units
Perc
ent o
f Lan
d
Percent of Dwelling Units (Number of Dwelling Units)
20% (24,300)
40% (50,600)
60% (75,000)
80% (100,800)
Percent of Land (Number of Acres)
6% (2,800)
16% (6,900)
26% (11,800)
41% (18,100)
Figure 2.12: Relationship of Employees to Land Area Consumed
Employment Intensity / Land Area
0%10%20%30%40%50%
60%70%80%90%
100%
0% 20% 40% 60% 80% 100%
Percent of Employees
Perc
ent o
f Lan
d
Percent of Employees (Number of Employees)
20% (63,500)
40% (126,100)
60% (189,400)
80% (252,800)
Percent of Land (Number of Acres)
1% (450)
5.5% (2,450)
14.5% (6,400)
33.1% (14,700)

MULTIMODAL SYSTEMS IN LOCAL COMPREHENSIVE PLANS—THREE CITIES
Technical Memorandum – City of Tampa December 2007 24
2.2.5 Regional Intermodal Connectivity The City of Tampa hosts several significant intermodal centers, such as the Tampa International Airport, Peter O’ Knight Airport, Marion Transit Center, Cruise Ship Terminal, and Union Station.
Table 2.7 indicates whether each of the listed intermodal centers is served by fixed route transit service and how many dwelling units and employees are within a half mile from pedestrian access of each center.
Table 2.7: Regional Intermodal Connectivity
Dwelling Units within 1/2 Mile
of an Intermodal
Center
Percent of TCEA Dwelling Units within 1/2
Mile of an Intermodal
Center
Employees within 1/2 Mile of an Intermodal
Center
Percent of TCEA
Employees within 1/2 Mile
of an Intermodal
Center
Accessible by HART
(within 1/4 Mile of Transit Route)
Tampa International Airport
0 0.00% 5,200 1.64% Yes
Peter O'Knight Airport 430 0.34% 0 0.00% Yes
Marion Transit Center 510 0.41% 41,300 13.06% Yes
Cruise Ship Terminal 250 0.20% 4,100 1.30% Yes
Union Station 660 0.52% 19,000 6.01% Yes
Total TCEA 125,900 316,300
While only a small percentage of the TCEA population has ready pedestrian access to these centers, their universal transit access means that over 85% of dwelling units and 90% of employees (as previously shown in Table 2.3) can access the TCEA’s intermodal centers without the use of an automobile.
2.2.6 Interconnected Multimodal Network To reduce walking and biking trip lengths and provide multiple alternative routes, a well-defined grid street pattern is necessary. The MMTD Handbook recommends a measure which calculates the number of blocks per square mile as a means of estimating the street network connectivity. Based on this methodology, a measure of 50 blocks per square mile is considered to be an acceptable level of grid street network refinement. For the purpose of this analysis, all roadway segments were considered to be elements of the bicycle and pedestrian network. Generally, the availability of sidewalks and bike lanes on local neighborhood streets is not a prerequisite for their consideration as bicycle and pedestrian facilities.
It should be noted that of approximately 295 miles of major roadway segments evaluated by the Hillsborough MPO, approximately 225 miles have 100% sidewalk coverage along one or more side of the roadway allowing for uninterrupted travel between intersections.

MULTIMODAL SYSTEMS IN LOCAL COMPREHENSIVE PLANS—THREE CITIES
Technical Memorandum – City of Tampa December 2007 25
Only a limited number of the City’s major roadways have striped bicycle lanes. Necessary improvements to the bicycle and sidewalk network will be discussed in more detail in Section 2.3 of this report; however, these existing deficiencies were not considered as part of the connectivity analysis nor were off-street trails or pedestrian paths.
Figure 2.13 illustrates the block densities within the TCEA and also shows other areas within the Hillsborough County urban services boundary for comparison purposes. As shown on the map, the TCEA generally provides adequate block density with some exceptions associated with the Hillsborough River, Tampa International Airport, and the CSX corridor south of Gandy Boulevard. Table 2.8 shows the Blocks per Square Mile tabulation for the TCEA as a whole and the TCEA sub-areas. With the exception of the Westshore and Gandy Draft Concept Map regions and the Westshore impact fee district, all sub-areas meet the 50 block per mile standard established in the MMTD Handbook.
Principal network connectivity barriers include the Hillsborough River, the Interstate Highway system, and the Lee Roy Selmon Cross-town Expressway. Outside of the downtown area, the one mile arterial street grid provides the only means to cross the Hillsborough River and Interstate and Expressway crossings are generally available only at arterial access points and major collector roadway under-passes at approximately half mile intervals. Major roadways can also be a barrier to bicycle and pedestrian travel. Table 2.9 shows the average signal spacing for the TCEA and each TCEA sub-area for all multi-lane surface roadways. Outside the Downtown/Heritage zone and the CBD impact fee district signal spacing along major multi-lane roadways generally exceeds a quarter of a mile. Increasing the frequency of controlled bicycle and pedestrian crossings will reduce the effect of these roadways as barriers to bicycle and pedestrian mobility.
Table 2.8: Blocks per Square Mile
Count of Blocks Acres Square
Miles Blocks/Square
Mile TCEA (excluding MacDill AFB) 6,300 39,000 60.9 100
Planning Commission Concept Map
Downtown/ Heritage Zone 2,800 13,900 21.8 130
Gandy Gateway Zone 100 3,400 5.3 20
USF/ Institutional Zone 400 4,500 7.0 60
Westshore/ TIA 300 6,400 10.0 30
Tampa Impact Fee Districts
Central Business District 200 600 0.9 220
Central/ East District 3,700 19,300 30.2 120
Interbay District 1,600 10,200 15.9 100
North Central Tampa District 400 3,600 5.6 70
Westshore District 300 5,300 8.3 40

MULTIMODAL SYSTEMS IN LOCAL COMPREHENSIVE PLANS—THREE CITIES
Technical Memorandum – City of Tampa December 2007 26
Table 2.9: Average Signal Spacing Distance
Miles of Multilane Surface Roadway
Count of Segments
with a Signal
Average Distance Between Signals
(In Miles)
TCEA
Entire TCEA 156.4 557 0.28
Planning Commission Concept Map
Remaining TCEA 42.2 116 0.36
Downtown / Heritage Zone 72.3 321 0.23
Gandy Gateway Zone 0.7 2 0.35
USF / Institutional Zone 19.3 49 0.39
Westshore / TIA Zone 21.9 69 0.32
Tampa Impact Fee Districts
Central Business District 13.9 144 0.10
Central / East Tampa District 69.3 208 0.33
Interbay District 29.9 80 0.37
North Central Tampa District 19.1 48 0.40
Westshore District 24.2 77 0.31

MULTIMODAL SYSTEMS IN LOCAL COMPREHENSIVE PLANS—THREE CITIES
Technical Memorandum – City of Tampa December 2007 27

MULTIMODAL SYSTEMS IN LOCAL COMPREHENSIVE PLANS—THREE CITIES
Technical Memorandum – City of Tampa December 2007 28
2.2.7 Acceptable Level of Service for Each Mode Using the multimodal LOS grading system documented in the 2002 FDOT Q/LOS Manual, the Hillsborough MPO gathered bicycle and pedestrian infrastructure and transit service data and calculated Q/LOS grades for the major roadway network and several minor roadways within the existing TCEA. Appendix A includes a map series showing the current bicycle, pedestrian, and transit LOS scores for Tampa.
Tables 2.10 and 2.11 show the composition of each modal network based on TCEA sub-area and level of service scores. The table includes sub-totals indicating what component of the sub-area network is considered to offer an acceptable modal LOS grade. The tables also indicate the area-wide LOS score for each sub-area mode. As stipulated in the MMTD Handbook methodology, area-wide modal LOS is calculated by dividing the sum-product of segment length and numerical (raw) LOS scores by the total network length of a given study area as shown in the example below:
In this example, the weighted-average Raw Score is 3.6/1.5 or 2.4 which relates to LOS “C”. Table 2.10 shows the area-wide LOS for the Tampa TCEA and the Planning Commission Draft Concept Map regions, while Table 2.11 shows Tampa impact fee districts. Overall, the TCEA currently provides LOS “D” for the pedestrian and bicycle modes and LOS “E” for the Transit mode.
It should be noted that although the CBD impact fee district indicates an area-wide LOS “E” transit score, the major roadway network density in the CBD is much greater than the TCEA as a whole and therefore there are many roadways without transit service which run parallel to nearby transit routes. This discrepancy is addressed in the next section of this report which shows the percentage of jobs and dwelling units served by adequate multimodal facilities. Generally, service population measures are more relevant for transit than weighted distance measures.
Length Raw Score Grade Sum Product0.50 3.2 C 1.6000.75 2.1 B 1.5750.25 1.7 B 0.425
1.5 - - 3.6

MULTIMODAL SYSTEMS IN LOCAL COMPREHENSIVE PLANS—THREE CITIES
Technical Memorandum – City of Tampa December 2007 29
Table 2.10: Planning Commission Concept Map Zones LOS

MULTIMODAL SYSTEMS IN LOCAL COMPREHENSIVE PLANS—THREE CITIES
Technical Memorandum – City of Tampa December 2007 30
Table 2.11: Tampa Impact Fee Districts LOS

MULTIMODAL SYSTEMS IN LOCAL COMPREHENSIVE PLANS—THREE CITIES
Technical Memorandum – City of Tampa October 2007 - 31 -
2.2.8 Acceptable Area-Wide Quality of Service for Each Mode Area-wide quality of service (QOS) for each mode is evaluated by calculating the percentage of population and employees served by adequate multimodal facilities. For the purpose of this analysis, adequate LOS for transit and pedestrian modes is LOS “C” and adequate LOS for the bicycle mode is LOS “D”. Net residential land use densities and non-residential land use intensities calculated from TBRPM year 2000 socioeconomic data were applied to the residential and non-residential acreage as shown in the figure below:
Figure 2.14: Area-wide QOS Methodology
LOS C or BetterTransit; ¼ MileService Area
Study Area Acreage:20 Non-Residential Acres60 Residential Acres
Study Area Control Totals100 Employees300 Dwelling Units
Study Area Acreage Served:20 Non-Residential Acres20 Residential Acres
Dwellings and Employees Served:20 Acres X 100 Emp/20 Acres = 10020 Acres X 300 DU/60 Acres = 100
Percent DU and Employees Served:100 Emp/100 Emp Served = 100%300 DU/100 DU Served = 33%
Non-Residential Land
Residential Land
Vacant Land
Non-Developable Land
For each mode, the total number of dwelling units and employees likely to be situated within a quarter of a mile of roadway segments with adequate LOS scores was calculated. Tables 2.12– 2.14 show the overall percentage of jobs and dwelling units served by adequate multimodal LOS for each mode for the TCEA as a whole and for each TCEA sub-area. Presently, the Downtown CBD impact fee district is the only sub-area which meets all three multimodal QOS standards without additional multimodal infrastructure investment. Because this district exceeds many of the QOS standards and because the larger, Draft Concept Map Downtown/Heritage region encompasses the CBD impact fee district, it is reasonable to assume that some intermediate boundary between these two sub-areas could also meet the benchmark 70% service threshold for adequate multimodal LOS. To meet the service standards recommended in the MMTD Handbook, for other sub-areas or throughout the TCEA as a whole, improvements to the provision of multimodal infrastructure and service will be necessary as discussed in more detail in Section 2.3 of this report.

MULTIMODAL SYSTEMS IN LOCAL COMPREHENSIVE PLANS—THREE CITIES
Technical Memorandum – City of Tampa October 2007 - 32 -
Table 2.12: Percent of Dwelling Units and Employees Served by Adequate Transit LOS
MULTIMODAL SYSTEMS IN LOCAL COMPREHENSIVE PLANS—THREE CITIES
Technical Memorandum – City of Tampa October 2007 - 33 -
Table 2.13: Percent of Dwelling Units and Employees Served by Adequate Pedestrian LOS

MULTIMODAL SYSTEMS IN LOCAL COMPREHENSIVE PLANS—THREE CITIES
Technical Memorandum – City of Tampa October 2007 - 34 -
Table 2.14: Percent of Dwelling Units and Employees Served by Adequate Bicycle LOS

MULTIMODAL SYSTEMS IN LOCAL COMPREHENSIVE PLANS—THREE CITIES
Technical Memorandum – City of Tampa October 2007 - 35 -
2.3 Multimodal System Needs The current multimodal infrastructure does not fully support and integrate the mixture of primary and supporting uses based on the threshold criteria established in the MMTD Handbook. The following sections describe potential capital improvements to Tampa pedestrian and bicycle infrastructure as well as capital and operating improvements to HART routes serving Tampa. Projects and costs included in this section are derived from the Hillsborough County Metropolitan Planning Organization’s (MPO’s) 2025 Long Range Transportation Plan (LRTP), adopted November 2004 and various projects identified by the City of Tampa.
2.3.1 Pedestrian System Needs The 2025 LRTP shows several major roadway facilities within the City of Tampa with incomplete sidewalk facilities. As discussed in Section 2.2, of approximately 295 miles of major roadway facilities, approximately half have complete sidewalks on both sides of the road and approximately three quarters have complete sidewalks along one side of the road.
Table 2.15: Current Major Roadway Network Sidewalk Coverage
Table 2.16: Major Roadway Network Sidewalk Needs
Presently, the City of Tampa allocates approximately $680,000/year to new sidewalk construction. At this rate, development of a 100% sidewalk system along one side of the street could require between 7 and 25 years of investment, assuming no funds were allocated to the local street system. Assuming a 20-year growth forecast of approximately 37,000 dwelling units and 120,000 employees, the cost of building-out the City’s major roadway network sidewalk system, if allocated entirely to new development, ranges from $700 - $56 per dwelling unit per 1,000 square feet of office space. This estimated unit cost is shown in Table 2.17.
Table 2.17: Pro-Rata Costs of Sidewalk Needs Allocated to New Development Units

MULTIMODAL SYSTEMS IN LOCAL COMPREHENSIVE PLANS—THREE CITIES
Technical Memorandum – City of Tampa October 2007 - 36 -
2.3.2 Bicycle System Needs With the exception of the Westshore impact fee district, the Tampa TCEA meets the requisite LOS “D” bicycle level of service based on the area-wide LOS criteria established for transit-oriented multimodal districts. Of 295 centerline miles of major surface roadways within the TCEA, only 25 miles of roadway have striped, paved shoulders. An additional 35 miles of roadway have wide outside lanes affording cyclists extra room alongside motorists.
The addition of a striped bicycle lane, where possible within the roadway cross-section, represents a marginal cost when performed as part of standard roadway resurfacing and rehabilitation. Where the existing roadway cross section can accommodate a striped-bicycle lane, or when an open drainage system can allow for installation of a paved shoulder without significant modifications to the existing storm-water system, the construction and marking of designated bicycle lanes should be considered.
A summary review of multi-lane roadways with less than 3,500 Average Annual Daily Traffic (AADT) per lane indicates approximately 13 miles of four lane undivided roadway which could potentially be converted to two lane divided roadway with bicycle lanes. Additionally, there are approximately 13 miles of three and four lane one way streets, most of which are located in the downtown area, which may have sufficient capacity to allow one lane to be converted for multimodal use.
Within the Westshore impact fee district, where the area-wide bicycle LOS score is “E”, several proposed on-road and off-road greenways could improve the provision of bicycle infrastructure within the district. The West Tampa Greenway would connect Cypress Street to the Courtney Campbell Causeway and the Rocky Point area via a trail along Old Tampa Bay. Additional off-road trails are proposed along Tampa Bay Boulevard and Westshore Boulevard in the Drew Park area and along Dale Mabry Highway from Hillsborough Avenue to Boy Scout Boulevard/Columbus Drive.
2.3.3 Transit System Needs As illustrated in this report, while the HART fixed-route transit system provides service to 85% of TCEA households and 90% of TCEA jobs, the transit system frequency and span of service does not achieve the LOS “C” standards specified for transit-oriented multi-modal districts. The MMTD Handbook indicates that adequate transit mobility can be achieved by servicing 70% or more of jobs and households with LOS “C” or better transit service. To evaluate options and costs for providing this quality of service within the Tampa TCEA, a composite of HART Transit Emphasis Corridors and improvements to existing routes was examined.
The Transit Emphasis Corridors were identified and evaluated by HART in order to develop candidate corridors for Bus Rapid Transit (BRT) implementation. These corridors primarily represent top performing existing routes, or logical composites of existing routes which could take advantage of roadway infrastructure improvements. Figure 2.15 shows the seven emphasis corridors identified in the 2004 HART study along with two other corridors located on Kennedy Boulevard and Dale Mabry Highway included as part of this analysis to increase the total “premium” transit service area. These corridors would provide 15-minute service frequency and enhanced service spans needed for a transit LOS “C” or better.
As shown in Figure 2.15, 0.25 and 0.50 mile service areas were used to calculate the number of dwelling units and jobs likely to be serviced by the Transit Emphasis Corridor network. This analysis, summarized in Table 2.18, was performed using both year 2000 TBRPM traffic

MULTIMODAL SYSTEMS IN LOCAL COMPREHENSIVE PLANS—THREE CITIES
Technical Memorandum – City of Tampa October 2007 - 37 -

MULTIMODAL SYSTEMS IN LOCAL COMPREHENSIVE PLANS—THREE CITIES
Technical Memorandum – City of Tampa October 2007 - 38 -

MULTIMODAL SYSTEMS IN LOCAL COMPREHENSIVE PLANS—THREE CITIES
Technical Memorandum – City of Tampa October 2007 - 39 -
analysis zone data as well as 2025 projections from the TBPRM and City of Tampa Community Planning Division. Generally, a 0.50 mile service area is acceptable for consideration of commute trips when premium (BRT or better) transit service is being considered. A 0.25 mile service area, is more appropriate for non-commute trips.
With the inclusion of the Dale Mabry and Kennedy Boulevard routes, the 70% service area dwelling unit and employee thresholds are substantially met for both current and future planning scenarios based on a 0.50 mile service area. Using a more conservative 0.25 mile service area just under 70% of jobs are served by the (expanded) Transit Emphasis Corridor system, although less than 50% of households are serviced by the system.
Table Based on estimates developed for the 2004 HART study, the total cost of implementing the Transit Emphasis Corridor system shown in Figure 2.16 would require approximately $25 million in start-up costs and could require approximately $116 million over a 20-year service life as shown in Table 2.19. These cost estimates only reflect the marginal cost of improving route facilities and frequencies beyond the existing local-route service already in place. If an improved premium service system were contemplated, this new service would complement rather than enhance existing service, though costs could be considerably higher.
Table 2.19: Transit Emphasis Corridor Capital and Operating Costs
Table 2.20 shows the $116 million cost of providing 20 years of LOS “C” or better transit service allocated to 20 years of projected development. Using both the TBRPM growth projections and the projections developed by the City’s Community Planning Division, the table assumes an even split between employment and residential uses and shows the cost allocation based on three scenarios:
costs attributed only to development within 0.25 miles of emphasis corridors, costs attributed only to development within 0.50 miles of emphasis corridors, and costs attributed to all new development
The highest unit cost based on a 0.25 mile service area and TBRPM residential development projections is $3,900 per dwelling unit while the lowest unit costs ($1,500 per dwelling unit) are achieved by the applying the overall costs to all development anticipated by the Community Planning Division projections.
MULTIMODAL SYSTEMS IN LOCAL COMPREHENSIVE PLANS—THREE CITIES
Technical Memorandum – City of Tampa October 2007 - 40 -
Table 2.20: Pro-Rata Costs of Transit Emphasis Corridor Allocated to New Development

MULTIMODAL SYSTEMS IN LOCAL COMPREHENSIVE PLANS—THREE CITIES
Technical Memorandum – City of Tampa October 2007 - 41 -
3.0 MULTIMODAL MITIGATION This section of the technical memorandum identifies and documents questions and issues pertaining to the implementation of SB 360 mitigation requirements for the City of Tampa. Acceptable policy approaches and quantitative methods for addressing SIS and non-SIS impacts have been documented and any unresolved or previously unrealized issues have been identified. A summary of policy statements and other guidance from the DCA and FDOT and several possible mitigation questions and/or issues for future review by DCA and FDOT staff have been documented.
3.1 Summary of Existing Multimodal Mitigation Policies The following is a summary of policy statements and other guidance from the DCA and FDOT regarding the use of multimodal and mobility measures to offset SIS facility impacts.
3.1.1 TCEA and MMTD Impacts on the SIS Florida statutes, as amended by SB 360 in 2005, stipulate new requirements for TCEAs and MMTDs with respect to the assessment and mitigation of impacts to the SIS. Additionally, the statute regarding MMTDs includes language describing the context under which development permits may be issued by local government agencies with respect to the implementation of the districts’ community design standards/capital program. The policy language for these statutes is described as follows:
163.3180(5)(f) and 163.3180(15)(a) state: Prior to the designation of a concurrency exception area/multimodal transportation district, the state land planning agency and the Department of Transportation shall be consulted by the local government to assess the impact that the proposed exception area/multimodal district is expected to have on the adopted level-of-service standards established for Strategic Intermodal System facilities, as defined in s. 339.64, and roadway facilities funded in accordance with s. 339.2819. Further, the local government shall, in consultation with the state land planning agency and the Department of Transportation, develop a plan to mitigate any impacts to the Strategic Intermodal System, including, if appropriate, the development of a long-term concurrency management system pursuant to subsection (9) and s. 163.3177(3)(d).
The term “assess the impact of the proposed exception area/multimodal district is expected to have on the adopted level-of-service standards…” can be narrowly or broadly defined. A broad definition would possibly consider the impact of all development within the TCEA/MMTD on the SIS regardless of whether that development would otherwise be subject to concurrency review and/or require a concurrency certificate from the local government to proceed. A possible narrow policy definition would consider only the impact of development within the TCEA/MMTD which would be subject to concurrency review in the absence of the TCEA or MMTD policy. This narrow definition would exclude the impacts of vested development associated with approved Development of Regional Impacts (DRI) (pursuant to the specific terms of the DRI) and developments which do not have significant impacts on SIS facilities based on the local agency’s concurrency review and/or traffic impact study procedures – assuming such procedures are consistent with professionally acceptable standards.

MULTIMODAL SYSTEMS IN LOCAL COMPREHENSIVE PLANS—THREE CITIES
Technical Memorandum – City of Tampa October 2007 - 42 -
3.2 Multimodal Mitigation Policy Questions and Issues Questions and/or issues related to current available policy guidance and its viability to use alternate modes of travel to offset SIS mitigation impacts have been identified below. These questions and/or issues will then be posed to both FDOT District Seven and DCA for future review and comment. Each section identifies a specific policy statement along with the corresponding question and/or issue.
3.2.1 Capital Planning in MMTDs 163.3180(15)(c) states: Local governments may establish multimodal level-of-service standards that rely primarily on non-vehicular modes of transportation within the district, when justified by an analysis demonstrating that the existing and planned community design will provide an adequate level of mobility within the district based upon professionally accepted multimodal level-of-service methodologies. The analysis must also demonstrate that the capital improvements required to promote community design are financially feasible over the development or redevelopment timeframe for the district and that community design features within the district provide convenient interconnection for a multimodal transportation system. Local governments may issue development permits in reliance upon all planned community design capital improvements that are financially feasible over the development or redevelopment timeframe for the district, without regard to the period of time between development or redevelopment and the scheduled construction of the capital improvements. A determination of financial feasibility shall be based upon currently available funding or funding sources that could reasonably be expected to become available over the planning period.
The term “community design” refers to both the design/development of public infrastructure and private property. Reference to “capital improvements” refers to public infrastructure –presumably street connectivity, public squares, appropriate traffic calming/management features, and bicycle and pedestrian facilities. While these terms could reasonably be used to describe fixed-transit infrastructure (stations, bus lanes, kiosks, etc.) the paragraph does not seem to fully consider transit capital and makes no reference to the substantial operating expense associated with the provision of transit service. Nonetheless, the provision of Q/LOS “C” transit service is considered essential for transit-oriented multi-modal districts.
Question and/or Issue May local governments issue development permits in a MMTD even when funding sources necessary to fund Q/LOS “C” transit operations are not currently available or reasonably expected to become available over the planning period so long as capital projects (including transit capital projects) are funded?
3.2.2 Financial Feasibility 163.3164(32) states: "Financial feasibility" means that sufficient revenues are currently available or will be available from committed funding sources for the first 3 years, or will be available from committed or planned funding sources for years 4 and 5, of a 5-year capital improvement schedule for financing capital improvements, such as ad valorem taxes, bonds, state and federal funds, tax revenues, impact fees, and developer contributions, which are adequate to fund

MULTIMODAL SYSTEMS IN LOCAL COMPREHENSIVE PLANS—THREE CITIES
Technical Memorandum – City of Tampa October 2007 - 43 -
the projected costs of the capital improvements identified in the Comprehensive Plan necessary to ensure that adopted level-of-service standards are achieved and maintained within the period covered by the 5-year schedule of capital improvements. A Comprehensive Plan shall be deemed financially feasible for transportation and school facilities throughout the planning period addressed by the capital improvements schedule if it can be demonstrated that the level-of-service standards will be achieved and maintained by the end of the planning period even if in a particular year such improvements are not concurrent as required by s. 163.3180.
163.3180(10) further states: With regard to roadway facilities on the Strategic Intermodal System designated in accordance with ss. 339.61, 339.62, 339.63, and 339.64, the Florida Intrastate Highway System as defined in s. 338.001, and roadway facilities funded in accordance with s. 339.2819, local governments shall adopt the level-of-service standard established by the Department of Transportation by rule…
A local agency must adopt the standard set by the Department of Transportation of SIS facilities. The current capital plan for the SIS system, as described in the MPO Transportation Improvement Program (TIP) and Long Range Transportation Plan (LRTP) does not appear to achieve the LOS standard established by the Department of Transportation based on 2025 development projections. Local agency revenue capacity is generally understood to be insufficient to fund the necessary improvements to the relevant components of the SIS system.
Question and/or Issue How can local agencies’ CIE be deemed “Financially Feasible” if the adopted LOS standard on the SIS system is not funded?
3.2.3 SIS Backlogs and Local Agency Responsibility FDOT District Seven Planning staff indicated at the May 14, 2007 (See Section 4.0) meeting that FDOT was cognizant of the fact that current backlogs and future projections do not achieve the required LOS “D” standard for several SIS facilities and that development mitigation assessments within the TCEA would be insufficient to cure this backlog. Staff elaborated that FDOT would be looking for local jurisdictions to put forth a plan which addressed multi-modal solutions to reduce the impact of local trips on the SIS and that this plan should be backed by a cost-feasible CIE.
Funding for improvements to the SIS system shown in the current adopted LRTP indicates a mix of sources including dedicated SIS funding as well as other state and federal highway monies. SIS funding is intended to service inter-regional trips (i.e. Orlando metro area to Tampa metro area) and trips to and from inter-modal centers such as Tampa International Airport and Tampa’s port facilities. Other funding components being applied to the SIS roadways are intended to serve intra-regional travel demand.
Question and/or Issue Given existing and projected backlogs on the area SIS systems and funding options, which component of a planned SIS system expansion may be relied upon to serve new development within the City of Tampa?

MULTIMODAL SYSTEMS IN LOCAL COMPREHENSIVE PLANS—THREE CITIES
Technical Memorandum – City of Tampa October 2007 - 44 -
Question and/or Issue Does reference to “local trips” refer to intra-TCEA trips or does this also mean trips into and out of the TCEA?
3.2.4 Transportation Supportive Land Uses FDOT District Seven Planning staff indicated at the May 14, 2007 meeting that implementation of land development regulations and/or land use planning necessary to support mass transit corridors would be essential for success.
Many of the current rail-transit plans and some of the proposed bus rapid transit corridors are either parallel to elements of the SIS or serve development centers which are also served by the SIS. Intensification of land use along these transit corridors, regardless of the density, intensity, diversity, and design of the development will have a cumulative impact on the SIS. For example, if a 20 percent non-single occupant vehicle (SOV) mode share is assumed, then for every 100 new development trips, 80 will rely on single occupant vehicles. To the extent that development is intensified along transit corridors which are also serviced by the SIS, it is reasonable that non-transit trips generated by this development will utilize the SIS system. Further, it is likely (at least in the current comprehensive planning horizon) that more traffic generated by new development along SIS/transit corridors will use the SIS roadway system than will use transit/non-SOV modes.
Question and/or Issue Should local jurisdictions consider the proximity of transit corridors/station areas to SIS roadway facilities/access points to the extent that the overlay of transit corridors with existing SIS facilities may result in a greater impact to the SIS system than would occur if the intensification of transit supportive uses occurred away from SIS corridors? If so, how can Federal Transit Authority (FTA) rider-ship projection requirements be met without reliance on existing development nodes, most of which are serviced by SIS facilities?
3.2.5 Proportionate Fair Share FDOT District Seven Planning staff indicated at the May 14, 2007 meeting that a proportionate fair share calculation had been performed for development in Plant City pursuant to anticipated impacts to I-4 and that a similar calculation could be established for impacts to SIS facilities in other jurisdictions.
Current SIS capacity projects include substantial right of way acquisition and reconstruction tasks to create an “envelope” for future roadway and rail system installation. This means that the use of the literal costs and capacity improvements of these projects would result in very high dollar value per unit of development for capacity assumptions. Also, the current SIS does not meet adopted service standards, and current financially feasible capital plans are not keeping pace with expected traffic growth.
Question and/or Issue Can proportionate fair share contributions assessed for impacts to the SIS system (whether directed to roadway improvements or multimodal improvements) reflect unfunded service capacities, or must they reflect only currently funded service capacities?

MULTIMODAL SYSTEMS IN LOCAL COMPREHENSIVE PLANS—THREE CITIES
Technical Memorandum – City of Tampa October 2007 - 45 -
Question and/or Issue How would a proportionate fair share assessment be calculated when the set of sample capacity projects have very high cost to capacity ratios?
Question and/or Issue If the above issues could be resolved, would an SIS impact proportionate fair share assessment substantively mitigate impacts of development on the SIS regardless of substantial advancement to the SIS capacity projects caused by funds generated by that assessment?
Question and/or Issue Could a proportionate share assessment based on roadway impacts to the SIS be used to fund local match requirements for rail transit capital expenses?

MULTIMODAL SYSTEMS IN LOCAL COMPREHENSIVE PLANS—THREE CITIES
Technical Memorandum – City of Tampa October 2007 - 46 -
4.0 AGENCY COORDINATION In attempt to coordinate the efforts of this project with responsible review agencies, two meetings were held with both the FDOT District Seven on May 14 and September 19, 2007, respectively. A third meeting was held with the Florida DCA on September 20, 2007. The purpose of these meetings was to introduce project goals and objectives, efforts completed to date, and begin a dialogue between each agency and project team members. These meetings represent the first of several coordination meetings to discuss the issues highlighted in Section 3.2. Future coordination with each agency is anticipated and will be documented and incorporated into supplemental technical memoranda. Listed below are detailed descriptions of the major discussion points from each meeting.
4.1 May 14, 2007 with FDOT District Seven District Seven staff indicated that current backlogs and future projections do not achieve the
required LOS “D” standard for some SIS facilities and that development mitigation assessment would be insufficient to mitigate this backlog,
District Seven staff indicated that the District would be looking for each jurisdiction to put forth a plan which addressed multi-modal solutions to reduce the impact of local trips on the SIS and that this plan be backed by a cost-feasible CIE,
District Seven staff suggested that implementation of land development regulations and/or land use planning necessary to support mass transit corridors would be needed,
District Seven staff indicated that a proportionate fair share calculation had been performed for development in Plant City pursuant to anticipated impacts to I-4 and that a similar calculation could be established for other jurisdiction’s impacts to SIS facilities; and,
District Seven staff indicated that mechanisms for assessing the benefits of transit service improvements to the SIS had not been defined.
4.2 September 19, 2007 with FDOT District Seven District Seven suggested developing a method of quantifying the effect of the proposed
MMTD on trip lengths within the proposed district and along SIS facilities,
District Seven suggested coordination between the jurisdiction proposing the MMTD and the local transit service provider in Hillsborough County (HART),
District Seven suggested that larger MMTD may need to be broken up into more manageable sub-districts, each with its own mobility goals,
District Seven requested that a strong line of communication remain open between project team members and FDOT; and,
District Seven has expressed support for the use of MMTD and looks forward to reviewing project findings.
4.3 September 20, 2007 with DCA DCA suggested that the project team continue to coordinate closely with DCA and FDOT.
DCA expressed support for use of MMTD and looks forward to reviewing project findings.

MULTIMODAL SYSTEMS IN LOCAL COMPREHENSIVE PLANS—THREE CITIES
Technical Memorandum – City of Tampa October 2007 - 47 -
5.0 STATEWIDE BEST PRACTICES Project team members conducted a statewide data collection effort to identify Florida jurisdictions that have proposed or implemented a multimodal mitigation approach. All available public resources, including local Comprehensive Plans, were reviewed. As a result, ten different municipalities with relevant multimodal strategies or mechanisms were identified. These municipalities are listed below:
City of Destin MMTD
City of Gainesville TCEA
City of Deland MMTD
Broward County Transit Oriented Concurrency Districts
City of Orlando Experimental Land Use Concept
Miami-Dade County TCEA
Polk County Transportation Planning Organization
City of Boca Raton
Martin and St. Lucie Counties
City of Jacksonville Transition Areas
5.1 Selection of Peer Agencies Discussion of each of the ten jurisdictions at a meeting with Hillsborough County MPO staff and consultant team members on April 19, 2007 resulted in the selection of five peer agencies. These five peer agencies were chosen using comparisons to the conditions and challenges present in Hillsborough County. Consideration was also given to jurisdictions that represented a wide range of variables, challenges faced, and strategies proposed or implemented. These peer agencies are listed below:
City of Gainesville TCEA
Broward County Transit Oriented Concurrency Districts
City of Orlando Experimental Land Use Concept
Miami-Dade County TCEA
Polk County Transportation Planning Organization
5.2 Peer Agency Evaluations The following section provides a summary of the peer agency evaluation interview process. Data collected from these interviews were then used to determine perceived strengths and weaknesses of each peer agency approach with regards to DCA and FDOT approval and effectiveness of implementing multimodal mitigation strategies under SB 360.

MULTIMODAL SYSTEMS IN LOCAL COMPREHENSIVE PLANS—THREE CITIES
Technical Memorandum – City of Tampa October 2007 - 48 -
5.2.1 Peer Agency Interviews Team members and MPO staff developed a list of questions to be used during telephone interviews with each of the five peer agencies. The questions were intended to identify each agency’s approach and perceived strength or weakness in several different topic areas, including ease of implementation, effectiveness, acceptance, and common obstacles. A detailed list of questions, along with various conversation points used to facilitate discussion is provided in Appendix B. Appendix C provides a detailed log of when and with whom each interview was conducted. Appendix D describes in detail the responses provided to each interview question during the peer agency interviews.
5.2.2 Evaluation Matrix After the peer agency interviews were completed in June 2007, each agency was scored in ten categories on its approach toward developing effective multimodal mitigation policies relevant to Hillsborough County. A scoring matrix was developed to judge the perceived strengths and weaknesses of each approach. Scoring was based on a rating of 1 to 10, with 1 reflecting a perceived weakness and 10 reflecting a perceived strength. Below is a list of each scoring category with a brief description of each category’s intended goal.
Ease of Implementation This scoring category evaluates the ease of developing and implementing multimodal concurrency policies and mitigation along with the amount of staff time required to develop said policies.
Clear Guidance to Developers Evaluating developer guidance, this category identifies each approach’s perceived strength or weakness providing clear, understandable, and concise concurrency contribution calculations for developers applying for building certificate approval.
Concise Multimodal Standards This scoring category evaluates each multimodal policy’s ability to provide clear and concise multimodal LOS standards.
Effectiveness of Implementing Pedestrian Improvements Evaluating implementation strategies, this category identifies each approach’s perceived strength or weakness of implementing pedestrian improvements using multimodal standards and policies.
Effectiveness of Implementing Bicycle Improvements Evaluating implementation strategies, this category identifies each approach’s perceived strength or weakness of implementing bicycle improvements using multimodal standards and policies.
Effectiveness of Implementing Transit Improvements This scoring category evaluates each multimodal policy’s ability to implement both transit infrastructure improvements and increase quality/frequency of service using multimodal standards.

MULTIMODAL SYSTEMS IN LOCAL COMPREHENSIVE PLANS—THREE CITIES
Technical Memorandum – City of Tampa October 2007 - 49 -
Ability to Stimulate Redevelopment and Infill This scoring category evaluates each multimodal policy’s ability to stimulate redevelopment and development infill within each district using multimodal standards and policies.
Coordination between Agencies Evaluating inter-agency coordination strategies, this category identifies each approach’s perceived strength or weakness with coordinating multimodal policies between various agencies.
FDOT and DCA Acceptance This scoring category evaluates each multimodal policy’s ability to coordinate and develop acceptable multimodal policies using FDOT and DCA guidance.
Clear Mechanisms for Collecting and Distributing Contributions Evaluating each approach’s perceived strength and weakness, this category identifies how clear each approach mechanism is at collecting and distributing multimodal contributions.
Using the categories above, Table 5.1 summarizes the scoring of each peer agency in comparison to one another. Appendix E provides a detailed description of each peer agency’s perceived strength and weakness by category.
Table 5.1: Peer Agency Scoring Matrix
Peer Jurisdictions Performance Criteria City of
Gaines-ville
Broward County
City of Orlando
Miami-Dade
County City of
Lakeland
Ease of Implementation 4 5 8 6 8
Clear Guidance to Developers 9 8 5 7 6
Concise Multimodal Standards 10 7 6 6 5
Effectiveness of Implementing Pedestrian Improvements 9 4 5 5 6
Effectiveness of Implementing Bicycle Improvements 8 4 8 5 6
Effectiveness of Implementing Transit Improvements 7 10 6 8 7
Ability to Stimulate Redevelopment and Infill 9 8 8 8 8
Coordination Between Agencies 8 8 3 3 3
FDOT and DCA Acceptance 6 6 5 5 5
Clear Mechanisms for Collecting and Distributing Contributions 8 7 4 4 6
Grand Total 78 67 58 57 60

MULTIMODAL SYSTEMS IN LOCAL COMPREHENSIVE PLANS—THREE CITIES
Technical Memorandum – City of Tampa October 2007 - 50 -
5.2.3 Summary Using the scoring results presented in Table 5.1, the peer agencies receiving the highest scores were the City of Gainesville TCEA’s multimodal standards and Broward County’s Transit Oriented Concurrency system. While other peer agency approaches received comparable scores, it was determined that these two peer agencies had the strongest perceived multimodal approaches as they relate to the challenges faced by Hillsborough County. Specifically, the City of Gainesville’s approach provided clear developer guidance with qualitative multimodal standards that are effective at implementing pedestrian and bicycle improvements, whereas, the Broward County approach also provided clear developer guidance with concise quantitative multimodal standards and was effective at implementing transit improvements. The following section highlights some of the perceived advantages and disadvantages of both the City of Gainesville and Broward County approaches.
5.2.4 City of Gainesville Approach The City of Gainesville has adopted a TCEA district with three separate sub-zones. The goal of each sub-zone is to regulate development through the use of various multimodal standards, identified in the Gainesville Comprehensive Plan. To encourage development and redevelopment, each sub-zone has outlined several various requirements. Zone A, the least restrictive, focuses on providing sidewalks and pedestrian circulation, closure of excessive curb-cuts, and the deeding of land or conveyance of easements to the City for construction of sidewalks. Zones B and C implement the same TCEA requirements as Zone A, but add additional multimodal requirements. Both Zones B and C require that development meet additional multimodal standards based on trip generation and proportional impact to roadways. Depending on the number of trips generated, each development is required to implement 12 out of 23 multimodal standards in Zone B or 18 out of 22 multimodal standards in Zone C.
Tables 5.2 and 5.3, taken directly from the Gainesville Comprehensive Plan, are the trip generation tables and number of standards required within Zones B and C. The City of Gainesville Comprehensive Plan’s, Concurrency Management Element is provided for reference in Appendix F.
Table 5.2: Gainesville TCEA Requirements for Zone B
Net, New Average Daily Trip Generation Number of Standards That Must be Met
Less than 50 At least one standard
50 to less than 100 At least two standards
100 to 400 At least three standards
400 to 999 At least five standards
Greater than 1,000 trips, but less than 5,000 trips At least eight standards
Greater than 5,000 trips At least 12 standards and meet a. or b. below: a. Be on an existing transit route b. Provide funding for a new transit route.
Source: City of Gainesville Comprehensive Plan, Concurrency Management Element, Policy 1.1.6 (Revised 2005).

MULTIMODAL SYSTEMS IN LOCAL COMPREHENSIVE PLANS—THREE CITIES
Technical Memorandum – City of Tampa October 2007 - 51 -
Table 5.3: Gainesville TCEA Requirements for Zone C
Net, New Average Daily Trip Generation Number of Standards that Must be Met Less than 50 At least one standard 50 to less than 100 At least 3 standards 100 to 400 At least 4.5 standards 400 to 999 At least 7.5 standards Greater than 1,000 trips but less than 5,000 trips At least 12 standards
Greater than 5,000 trips At least 18 standards and meet a. or b. below: a. Be on an existing transit route b. Provide funding for a new transit route.
Source: City of Gainesville Comprehensive Plan, Concurrency Management Element, Policy 1.1.7 (Revised 2005).
The clear benefit of this approach is that the City provides clear and concise guidance that identifies how many standards should be met by potential developers and is easily understandable. These standards focus on multimodal improvements that encompass requirements for pedestrian, bicycle, and transit.
A few disadvantages to this approach are that the City of Gainesville does not provide headway or LOS standards for transit or any clear mechanism for calculating developer contribution towards the operating cost of increased transit services over time. Other major disadvantages of this approach, as identified by survey participant, are the considerable amount of time required to develop the multimodal standards and the requirement that each proposed development uses additional staff resources to calculate developer contributions as well as negotiate the appropriateness of the standards selected, all on a “case-by-case” basis.
5.2.5 Broward County Approach Broward County has adopted a Transit Oriented Concurrency Management System which is based on five-year Transit Development Plans adopted by the County. This approach calculates total peak-hour trip generation of proposed development. These trips are then multiplied by a cost per trip or transit concurrency fee for ten individual County districts. In order to calculate a transit concurrency fee, proposed development uses a county approved peak hour trips generation rate (by land use). The total number of trips generated is then calculated by a trip length factor (again by land use). This number is then multiplied by a cost per trip by district, determining the appropriate developer contribution. Prior to application for a building permit, the proposed developer must obtain a Transportation Concurrency Satisfaction Certificate from Broward County.
Table 5.4, taken directly from the Broward County Transit Oriented Concurrency Management System, is an example of the concurrency fees per trip for each district. An expert from Broward County Land Development Code, specifically dealing with the Transit Oriented Concurrency Management System, is provided in Appendix G.
MULTIMODAL SYSTEMS IN LOCAL COMPREHENSIVE PLANS—THREE CITIES
Technical Memorandum – City of Tampa October 2007 - 52 -
Table 5.4: Broward County Concurrency Fees
Source: Broward County Transit Oriented Concurrency Management System
The obvious benefit of this approach is that the County provides clear and concise guidance on identifying LOS standards for transit service within the TCEA as well as with calculating the cost per trip generated by the proposed development. As a result, several improvements along with increased transit service has been and are currently being implemented. Also, trip calculations are well documented and easily understood.
A few disadvantages to this approach are that Broward County Transit Oriented Concurrency Management System does not make provisions for pedestrian or bicycle improvements. Another major disadvantage of this approach was the considerable time required by the County and local transit provider to monitor transit LOS standards. The County also only collects fees from new development for three years, leaving the County to provide funding for the system after the impact fees are paid. This has resulted in an ever-increasing disparity between maintaining LOS standards and the need for collecting greater farebox recovery along with increased County subsidies over time.

MULTIMODAL SYSTEMS IN LOCAL COMPREHENSIVE PLANS—THREE CITIES
Technical Memorandum – City of Tampa October 2007 - 53 -
6.0 MULTIMODAL APPROACH FOR TAMPA The following section identifies policy approaches and procedural mechanisms to formulate a hybrid strategy or the “best-fit” multimodal approach for the City of Tampa. Sections 2.0 through 5.0 document the advantages, disadvantages, unknowns, and effectiveness of implementing multimodal policies and mitigation strategies under SB 360. Specifically, this approach incorporates the feasibility evaluation of implementing a MMTD, multimodal policy considerations for updating the City of Tampa TCEA, and example methodologies for calculating multimodal mitigation.
6.1 Multimodal District Evaluation An evaluation was completed to determine the feasibility for implementing a MMTD using multimodal area-wide Q/LOS measures identified in the MMTD Handbook. As a result, the City of Tampa was compliant in the following evaluation areas:
Appropriate Scale of Development,
Complementary Mix of Uses,
Land Use Promoting Multimodal Usage,
Appropriate Density and Intensity of Use,
Appropriate Organization of Land Uses,
Interconnected Multimodal Network, and
Regional Intermodal Connectivity.
The MMTD Handbook indicates that the City of Tampa currently does not meet the criteria established for the following MMTD evaluation areas:
Acceptable LOS for each mode
Acceptable Q/LOS for each mode
However, the City of Tampa could feasibly implement a MMTD by putting into practice new multimodal policies that address the above criteria and work towards the implementation of the pedestrian, bicycle, and transit improvements identified in Section 2.3.
6.2 Policy Considerations Currently, SB 360 requires the City of Tampa to plan for and implement strategies to support and fund mobility which includes alternative modes of transportation and analysis justifying the size and area of the existing TCEA. As described in Section 1.0, these requirements are similar to a MMTD designation and consideration of converting from a TCEA to a MMTD or implementing MMTD strategies within the policy framework of a TCEA may assist the City in the implementation of multimodal level of service standards while establishing multimodal mitigation requirements as part of the City’s Land Development Code/Concurrency Management System.
Legislation also allows the City of Tampa to use alternative approaches to concurrency determinations (Chapter 163.3180(15)(d), F.S.). As a general rule, most minimum LOS standards are established solely on vehicle usage. In a MMTD or TCEA, these standards may be based on multimodal performance measures that consider multimodal transportation, including walking, biking, and transit. Where minimum automobile LOS standards are exceeded
MULTIMODAL SYSTEMS IN LOCAL COMPREHENSIVE PLANS—THREE CITIES
Technical Memorandum – City of Tampa October 2007 - 54 -
by proposed developments, “local governments may issue development permits in reliance upon all planned community design capital improvements that are financially feasible over the development or redevelopment time frame, without regard to the period of time between development or redevelopment and the scheduled construction of capital improvements” - Chapter 163.3180(15)(c)(c).
Multimodal plans for each sub-district within the existing TCEA are also recommended using the FDOT Community Impact Assessment Handbook to evaluate the transportation needs of an area and the potential impacts of proposed plans on the community and its quality of life (FDOT Community Impact Assessment Handbook, 2000).
6.2.1 TCEA Update with Multimodal Considerations A number of local governments around the state have investigated multimodal transportation improvements as an essential component of the development review process (Section 5.0). For the City of Tampa, development and approval of multimodal policy initiatives and LOS standards would work to satisfy the needed TCEA update using the criteria identified in Florida Administrative Code 9J-5. Development of these future multimodal polices may also consider the application of a multimodal concurrency management system. This management system could involve the identification of long-term infrastructure improvements, increases in frequency, and quality of multimodal service.
This long-term management strategy represents a possible hybrid of policy initiatives that looks beyond the five-year CIE of the Comprehensive Plan and evaluates the total development potential within the City’s TCEA impact fee districts over a predetermined planning horizon. The determination of long-term needs may be based on speculative improvements from transit development plans and long-term planning and visioning studies.
The development of each multimodal standard for use in the TCEA’s multimodal concurrency management system could be partially based on the quantitative strengths of the LOS transit standards used in Broward County’s Transit Oriented Concurrency Management System. These transit LOS standards would be a viable consideration for identifying long term transit infrastructure and service needs within the TCEA. The qualitative multimodal policy standards identified in the City of Gainesville’s TCEA would be another viable consideration for implementing needed pedestrian and bicycle standards. The combination of both of these approaches may reflect the “best-fit” approach to establish elements or ordinances for a long term multimodal concurrency management system for the City of Tampa TCEA.
The City of Tampa is required to address its growth management needs in their CIE update by December 2008. The updated CIE must demonstrate progress over the course of the term and financial feasibility at the end of the term. The benefit of using the recommended long-term multimodal concurrency management system as part of the TCEA and CIE update provides greater flexibility in the City’s policies. For example, the City can apply proportionate fair share ordinances to area wide multimodal standards versus only along identified corridors. The City could also stipulate that each standard would not need to be met until the scheduled improvements are completed. They could also identify planned funding for years 4 through 15 that could potentially detail developer contributions.
6.2.2 Example Policies Broward County’s Transit Oriented Concurrency System uses a total peak hour person trip generation and total trip length of trip calculation for each proposed development. These trip

MULTIMODAL SYSTEMS IN LOCAL COMPREHENSIVE PLANS—THREE CITIES
Technical Memorandum – City of Tampa October 2007 - 55 -
rates are then multiplied by a cost per trip figure which represents the future transit development plans for that particular sub-district. A similar calculation for the City of Tampa could determine a cost for transit, pedestrian, and bicycle trips generated by development that correlates to proposed LOS standards. An example multimodal mitigation calculation technique is described in detail in Section 6.3. A policy example from Broward County’s Transit Oriented Concurrency System is highlighted below. Further detail can be found in Appendix E.
Sec. 5-182. Development Review Requirements
An application for a development permit must comply with the requirements of this section. To determine compliance with these requirements, within municipalities, the County shall conduct an independent review; provided, however, that in conducting such review the County shall utilize and consider whatever documentation and recommendation is provided to it by the relevant municipality as a result of that municipality’s own review of such subject matters.
Levels of Service (LOS) Standards
a) LOS Standards within Transit Oriented Concurrency Districts
For the purpose of issuing development permits, the LOS Standards within Transit Oriented Concurrency Districts are as follows:
Northeast District: Achieve headways of 30 minutes or less on 90% of routes. Establish at least one neighborhood transit center. Establish at least one additional community bus route.
North Central District: Achieve headways of 30 minutes or less on 90% of routes. Establish at least one neighborhood transit center. Establish at least one additional community bus route. Expand coverage area to 53 percent.
Central District: Achieve headways of 30 minutes or less on 80% of routes. Establish at least one neighborhood transit center. Establish at least two additional community bus routes.
- Broward County Transit Oriented Concurrency District
The City of Gainesville’s multimodal development standards with the City’s TCEA identifies a predetermined list of multimodal standards with the scale of the proposed development determining how many of these standards are required to be implemented before development approval can be given. These standards provide clear developer guidance towards the implementation of improvements that may be considered more qualitative, where as a quantitative calculation method is not appropriate. This is of particular importance for the City of Tampa when attempting to collect developer contributions toward pedestrian and bicycle amenities, such as bicycle racks and benches which promote alternate modes of travel. A policy example from the City of Gainesville’s Comprehensive Plan: Concurrency Management Element Goals, Objectives, and Policies are highlighted below. Further detail can be found in Appendix F.

MULTIMODAL SYSTEMS IN LOCAL COMPREHENSIVE PLANS—THREE CITIES
Technical Memorandum – City of Tampa October 2007 - 56 -
Policy 1.1.6
Within Zone B, development or redevelopment shall be required to meet the following development standards, provided at developer expense, based on the development’s (including all phases) trip generation and proportional impact on roadway facilities. The developer may sign a development agreement or contract with the City of Gainesville for the provision of these standards. The choice of standards shall be subject to the final approval of the City during the plan approval process. The standards chosen shall relate to the particular site and transportation conditions where the development is located. The developer may choose to provide one or more standards off-site with the City’s approval. In recognition of the varying costs associated with the standards, the City shall have the discretion to count some individual standards, based on cost estimates provided by the developer and verified by the City, as meeting two or more standards.
Net, new average daily trip generation Number of standards which must be met
Less than 50 At least one standard 50 to less than 100 At least two standards 100 to 400 At least three standards 400 to 999 At least five standards Greater than 1,000 trips but less than 5,000 trips At least eight standards
Greater than 5,000 trips At least 12 standards and meet a. or b. below: a. Be on an existing transit route b. Provide funding for a new transit route.
a. Intersection and/or signalization modifications to improve LOS and safety and
address congestion management. This may include, but is not limited to: o signal timing studies, o fiber optic inter-connection for traffic signals, o roundabouts, o OPTICOM signal preemption, and/or implementation of elements of the
Gainesville Traffic Signalization Master Plan Update. o Implementation of the Master Plan includes installation of Intelligent
Transportation System (ITS) features such as state of the art traffic signal controllers, dynamic message signs, and traffic monitoring cameras designed to maximize the efficiency of the roadway network by reducing congestion and delay.
b. Addition of dedicated turn lanes into and out of the development. c. Construction of bus shelters built to City specifications or bus shelter lighting
using solar technology designed and constructed to City specifications. d. Construction of bus turn-out facilities. e. Provision of bus pass programs provided to residents and/or employees of the
development. The bus passes must be negotiated as part of a contract with the Regional Transit System.

MULTIMODAL SYSTEMS IN LOCAL COMPREHENSIVE PLANS—THREE CITIES
Technical Memorandum – City of Tampa October 2007 - 57 -
6.3 Multimodal Mitigation Calculation Considerations Four possible methodologies for calculating multimodal policies and LOS standards described in Section 6.2 may be used to mitigate development impacts. Described below are the benefits of four approaches which are titled Travel Demand Modeling, Roadway Capacity Equivalency, Multimodal Needs Assessment, and Service Area Trip Capture for the purposes of this report.
6.3.1 Travel Demand Modeling Travel demand mitigation calculations evaluate potential transit route impacts on roadway volumes using the locally adopted travel demand model. The adopted travel demand model for FDOT District Seven is the West Central Florida Regional Planning Model (WCFRPM). As a result of efforts completed by FDOT District Seven’s Strategic Regional Needs Assessment study, the WCFRPM includes an updated mode choice model.
The benefit of this calculation method is that the model would substantially reduce the amount of effort needed to manually calculate the effect of increased multimodal service on SIS facilities and the proposed district as a whole. However, the model does not accurately quantify or reflect the benefits of adding pedestrian or bicycle improvements to any given area or sub-district. The model would also likely require significant recalibration to suite the purposes of this multimodal calculation methodology.
6.3.2 Roadway Capacity Equivalency Another possible multimodal mitigation methodology may be the use of a multimodal mode capacity analysis which applies peak hour person-trip capacities of existing and/or proposed transit routes to parallel roadway facilities.
Using this method, the LOS on roadway facilities could be calculated using the combined capacity of both the roadway facility and adjacent multimodal modes. This methodology would first identify the number of total person trips and length of trip generated by each proposed development within the TCEA or MMTD. Once this value has been established, the next step would be to determine the total person trip capacity of surrounding transportation facilities, including roadway and multimodal systems. Using established LOS standards, the impact of the proposed development could be calculated including the cost of any additionally required multimodal transportation infrastructure improvements.
The benefit of this calculation method is that there is the direct identification of the impact of transit service on the capacity of any given roadway facility. However, the method does not accurately quantify or reflect the benefits of adding pedestrian or bicycle improvements to any given area or sub-district. This method would also likely require significant amounts of effort to calculate the additional person trip capacity to each roadway facility, including effort to monitor the cumulative effects of multiple development projects.
6.3.3 Multimodal Needs Assessment Multimodal needs assessment analysis evaluates the total potential development within each sub-district within the TCEA or MMTD over a predetermined planning horizon. Using established multimodal standards and this predetermined planning horizon, the multimodal infrastructure needs required to support the forecasted development could be identified. The total cost of these needed improvements could then be divided by the total number of trips generated by the forecasted growth. This calculation would result in an individual cost per trip.

MULTIMODAL SYSTEMS IN LOCAL COMPREHENSIVE PLANS—THREE CITIES
Technical Memorandum – City of Tampa October 2007 - 58 -
The benefit of this approach is that it considers and incorporates transit service/operational costs and bicycle and pedestrian improvements over time. This approach could also be used to determine multimodal cost for regional systems with alignments within the MMTD or TCEA, requiring a local funding match to other County, State, and Federal investments. These regional alignments will be determined by the Tampa Bay Area Regional Transportation Authority. Potential issues related to this approach are that this method assumes that there are existing constrained roadway facilities, which is generally the case for the City of Tampa. However, multimodal improvements could not be implemented in areas where there are sufficient existing roadway capacity operating below the LOS standard to accommodate proposed development.
6.3.4 Service Area Trip Capture The last possible methodology is the calculation of internal capture of a transit system within a given service area. This calculation determines the number of internal trips that could be removed from the quantity of traffic impacting an SIS facility. This calculation methodology provides a conceptual framework for considering the maximum amount of new development which could be accommodated on the basis of using transit modes to mitigate SIS impacts.
For example, if a transit route service area generates 10,000 trips and 10% of these begin and end within the transit route service area, then 10% (1,000) of the trips have a good potential of being served by the transit system. If half of these intra-service area trips currently use SIS facilities then development of the transit system (and supporting multimodal infrastructure/urban design) has the potential to remove 500 trips from the same SIS facilities. If only 10% of the intra-service area trips use SIS facilities then the proposed transit system has the potential to remove only 100 trips from the impacted SIS facilities.
Table 6.1 shows the distribution of traffic on Tampa TCEA roadways in terms of origin and destination (inside and outside the TCEA) and what share of each origin-destination category uses the interstate highway system. For example, approximately 42% of all vehicle miles of travel in the millions (mvmt) within the TCEA occurs on the SIS system. However, looking only at trips whose origins and destinations both occur within the TCEA (Intra-TCEA trips), only 21% of mvmt occurs on the SIS
Table 6.1: Overall Component TCEA Roadway Travel Demand (2025)
TCEA Traffic (mvmt) SIS Traffic (mvmt) % SIS Intra-TCEA 2.93 24% 0.61 12% 21% Internal to External 5.91 48% 2.67 52% 45% External to External 3.51 28% 1.86 36% 53% TOTAL 12.35 100% 5.14 100% 42% Source: Tindale-Oliver & Associates, Inc.
Given that 28% of traffic on TCEA roads passes through the TCEA without stopping (external to external trips). Traffic generated by TCEA development (intra-TCEA and internal to external trips) is approximately 8.84 million vehicle miles of travel. As shown in Table 6.2, 37% of this travel is on the SIS. For every 100 vehicle miles of travel generated by TCEA development on all TCEA roadways, 37 miles of travel are on the SIS.

MULTIMODAL SYSTEMS IN LOCAL COMPREHENSIVE PLANS—THREE CITIES
Technical Memorandum – City of Tampa - 95 - 7002 rebotcO
Table 6.2: Component TCEA Roadway Travel Demand for TCEA Trips (2025)
TCEA Traffic (mvmt) SIS Traffic (mvmt) % SIS Intra-TCEA 2.93 33% 0.61 19% 21%
Internal to External 5.91 67% 2.67 81% 45%
Total TCEA Travel Demand 8.84 100% 3.28 100% 37% Source: Tindale-Oliver & Associates, Inc.
Figure 6.1: Example Transit Service Area Trip Capture Schematic
Trips Offset from SIS = Intra-Service Area Trips X SIS Share of Intra-Service Area Trips
OR 69,000 = 330,000 X 21%
New Trip Allowance = Offset Trips / SIS Share of All Trips
OR 186,500 = 69,000 / 37%
Source: Tindale-Oliver & Associates, Inc.
LEGEND

MULTIMODAL SYSTEMS IN LOCAL COMPREHENSIVE PLANS—THREE CITIES
Technical Memorandum – City of Tampa October 2007 - 60 -
As shown in Figure 6.1, an assumption has been made that the intra-service area trip capture and SIS usage characteristics of a subject transit corridor are comparable to the Tampa TCEA as a whole. If the total travel generated by a theoretical transit service area within the Tampa TCEA is 1,000,000 vehicle miles traveled (vmt) and 33% of these have an origin and destination within the service area, then the proposed transit service has a reasonable potential of servicing 330,000 vmt. Since 21% (Figure 6.1) of Tampa TCEA intra-service area trips use the SIS system it can be concluded that the proposed transit service has the potential to remove 69,000 vmt from the SIS (330,000 x 21%). Since 37% of overall TCEA traffic (excluding external service area to external service area trips) relies the SIS, then the proposed transit facility would provide an “allowance” of 186,500 new TCEA vmt (69,300 / 37% = 187,300).
This measure provides a conceptual framework for considering the maximum amount of new development which could be accommodated on the basis of using transit/alternative modes to mitigate SIS impacts. It is not realistic to assume that every trip that could realistically be accommodated by transit modes will utilize transit. Nor is it realistic to assume that the transit system could necessarily accommodate the number of trips that would be required to realize the hypothetical benefit, but the combination of the internal capture rate of the transit service area and the impact of the internally captured trips on the SIS could determine the potential of the transit mode to mitigate SIS impacts.
The benefit of this calculation method is that there is the direct identification of the impact of transit service on the capacity of any given SIS facility for a large geographic area such as the City of Tampa.
6.3.5 Hybrid Best-Fit Approach Given the conditions and size of the Tampa TCEA, this report recommends using hybrid policy and mitigation strategies. With regards to policy, it is recommended that the Tampa TCEA update and justify the TCEA size as required by Florida Administrative Code 9J-5 with the incorporation of multimodal LOS standards or policies for transit , similar to the Broward County example, and the incorporation of pedestrian and bicycle standards or policies which are similar to the City of Gainesville’s TCEA.
This report’s best-fit approach to mitigating roadway and SIS development impacts within the Tampa TCEA recommends a hybrid approach that includes the use of the Service Area Trip Capture methodology along with either the Roadway Capacity Equivalency or Multimodal Needs Assessment. By using the Service Area Trip Capture mitigation calculation for a region as large as the Tampa TCEA, development impact and future development potential could be calculated with respect to its impact on area SIS facilities and the TCEA as a whole. The Roadway Capacity Equivalency or Multimodal Needs Assessment methodologies working concurrently with the Service Area Trip Capture mitigation calculation are recommended to determine proportionate fair share and/or the developer contribution within each sub-district. After total development potential has been calculated and individual projects have been approved, the City of Tampa could use either a multimodal cost per trip calculation, as described in the Multimodal Needs Assessment calculation, or proportionate cost per improvement, as described in the Roadway Capacity Equivalency methodology to establish the developer contribution amount.