Embed Size (px)
Citation preview
Technical Memorandum
Strategic Transportation System (STS) Corridors
Prepared for:
Prepared by:
October 2013

i
Table of Contents
Executive Summary.................................................................................................................................. iii
1. Introduction ........................................................................................................................................ 1
2. Corridor Identification and Categorization ....................................................................................... 2
3. Corridor Criteria by Transportation Mode ........................................................................................ 3 3.1 Aviation ..................................................................................................................................... 3 3.2 Bicycle ....................................................................................................................................... 3 3.3 Highway ..................................................................................................................................... 6 3.4 Maritime .................................................................................................................................... 9 3.5 Rail ............................................................................................................................................. 9 3.6 Transit ..................................................................................................................................... 11 3.7 Freight and Passenger Intermodal Facilities ........................................................................... 13 3.8 Corridor Segmentation ............................................................................................................ 13 3.9 Development of the Statewide Strategic Transportation System (STS) ................................. 13
4. Corridor Analysis .............................................................................................................................. 17 4.1 Corridor Characteristics .......................................................................................................... 18
4.1.1 Aviation Corridor Characteristics ............................................................................... 18 4.1.2 Bike Characteristics .................................................................................................... 19 4.1.3 Highway Characteristics ............................................................................................. 19 4.1.4 Maritime Characteristics ............................................................................................ 21 4.1.5 Rail Characteristics ..................................................................................................... 21 4.1.6 Transit Characteristics ................................................................................................ 21
4.2 Corridor Performance Attributes ............................................................................................ 22 4.2.1 Aviation Performance Attributes by Goal Area .......................................................... 22 4.2.2 Bike Performance Attributes ...................................................................................... 24 4.2.3 Highway Performance Attributes ............................................................................... 25 4.2.4 Maritime Performance Attributes ............................................................................. 27 4.2.5 Rail Performance Attributes ....................................................................................... 28 4.2.6 Transit Performance Attributes ................................................................................. 29 4.2.7 Performance Attributes Summary ............................................................................. 29
5. Regional Transportation Needs (RTN) ............................................................................................. 31
6. Utilizing the Strategic Transportation System Corridor Analysis ................................................... 33
APPENDIX A: RTNs by Region ................................................................................................................. 34
APPENDIX B: Corridor Analysis Spreadsheet per mode ......................................................................... 37
ACCESS OHIO 2040
Technical Memorandum • Strategic Transportation System (STS) Corridors ii
List of Tables
Table 3-1: Aviation Service Area Classification Criteria ............................................................................ 3 Table 3-2: Bike Corridor Classification Criteria ......................................................................................... 3 Table 3-3: Highway Corridor Classification Criteria ................................................................................... 6 Table 3-4: Maritime Corridor Classification Criteria ................................................................................. 9 Table 3-5: Rail Corridor Classification Criteria ........................................................................................ 11 Table 3-6: Transit Service Area Criteria ................................................................................................... 13 Table 4-1: Corridor Analysis Performance Attributes .............................................................................. 30 Table 5-1: Critical Corridor Segment Need Thresholds ........................................................................... 31
List of Figures
Figure 3-1: Ohio AO40 Aviation Corridors ................................................................................................ 4 Figure 3-2: National and Statewide Bicycle Routes ................................................................................... 5 Figure 3-3: Highway Corridors .................................................................................................................. 7 Figure 3-4: Highway Freight Corridors ...................................................................................................... 8 Figure 3-5: Maritime Freight Corridors ................................................................................................... 10 Figure 3-6: Rail Corridors ........................................................................................................................ 12 Figure 3-7: Transit Corridors ................................................................................................................... 14 Figure 3-8: Intermodal Facilities Corridors ............................................................................................. 15 Figure 3-9: Access Ohio’s Strategic Transportation System ................................................................... 16
ACCESS OHIO 2040
iii
EXECUTIVE SUMMARY The Ohio Department of Transportation (ODOT) is responsible for maintaining an extensive multi-modal transportation system that supports passenger and freight movements and is vital to the citizens and businesses in Ohio, its sub-state economic regions, and the nation. To manage an efficient and sustainable transportation network, ODOT must identify and address the state’s most critical transportation infrastructure needs. As part of its development of Access Ohio 2040 (AO40), ODOT used a corridor analysis to highlight the state’s most used and valuable aviation, bicycle, highway, maritime, rail, and transit corridors, and the diverse multi-modal transportation facilities connecting them. This network will be referred to as Ohio’s Strategic Transportation System (STS) and represents the backbone of Ohio’s transportation network. After defining the STS, performance attributes on the STS facilities were analyzed to pinpoint needs on the system and develop strategies for addressing those needs.
Purpose of the STS Corridor Analysis The purposes of the AO40 corridor analysis were to:
Define Ohio’s Strategic Transportation System (STS), Analyze performance attributes on Ohio’s STS facilities to determine system needs, and Develop strategies for improving the STS.
Corridor Analysis Overview The AO40 corridor analysis included the following:
Identification of Ohio’s Strategic Transportation System (STS) The STS is a set of aviation, bicycle, highway, maritime, rail, and transit facilities that make up the backbone of Ohio’s transportation system. The STS was determined based on several existing factors.
Volume: The STS contains transportation facilities that carry the highest volumes of passenger and freight traffic for their respective modes.
Classification: Transportation facilities with a national or statewide designation1 were included in the STS.
Connectivity: The STS includes transportation facilities that connect urbanized areas in Ohio and neighboring states with populations exceeding 50,000.
Classification of STS Corridors STS corridors for each transportation mode were classified as national corridors, statewide primary corridors, or statewide secondary corridors. Local corridors were also identified, but were not
1 Corridors with a National and Statewide destination are those calculated to have the highest volumes of traffic, the greatest connectivity and special designations as compared to all other transportation facilities in Ohio..
ACCESS OHIO 2040
Technical Memorandum • Strategic Transportation System (STS) Corridors iv
included as part of the STS and were not included in the corridor analysis. An in depth explanation of STS identification and classification for each mode is provided in Chapter 1 of the STS Corridors Technical Memorandum.
Segmentation of STS Corridors for Analysis Each STS corridor was subdivided into segments based on characteristics that include traffic pattern or volume changes and STS corridor intersection points. The segmentation provided ODOT with sections of corridors that were reasonable for assessing conditions, and comparing the performance of corridor segments.
Selection of Performance Attributes for Corridor Analysis ODOT planning staff worked with other transportation decision-makers to determine performance attributes that could be used to rate or assess each STS corridor or facility. Many of the performance attributes were linked with the overarching Access Ohio 2040 goals and objectives, or corresponded to the critical success factors that ODOT uses to measure the conditions of Ohio’s transportation network. The performance attributes that were chosen for the corridor analysis were constrained by data availability, which was lacking for a few transportation modes.
Stakeholder Review Once the STS was identified and performance attributes were selected, ODOT consulted with stakeholders at AO40 Steering Committee meetings throughout the state to ensure that the STS accurately depicted Ohio’s most critical transportation infrastructure. Corridors that were identified in the Statewide Freight Study as carrying significant amounts of freight were included within the STS.
Analysis of STS Corridor Segments After finalizing the STS, its segmentation, and assessment criteria, a matrix was created for each transportation mode listing all STS corridors by segment and classification. The matrices were then populated with performance attribute information associated with existing and projected 2040 conditions. If available data did not correspond to the exact geography of a given corridor segmentation, a weighted average was calculated and presented in the matrix.
The matrices of performance attributes were color coded using the following methodology, and used to compare and evaluate STS corridor segments.
Green: Denotes corridor segment that is performing well and meeting or exceeding ODOT goals and standards for the given performance attribute.
Yellow: Denotes corridor segment that is performing acceptably and in acceptable condition relative to ODOT goals and standards for the given performance attribute.
Red: Denotes corridor segment that is performing below ODOT standards for the given performance attribute.
A more detailed methodology for color coding each modal matrix is explained in Chapter 4 of this Technical Memorandum.
ACCESS OHIO 2040
Technical Memorandum • Strategic Transportation System (STS) Corridors v
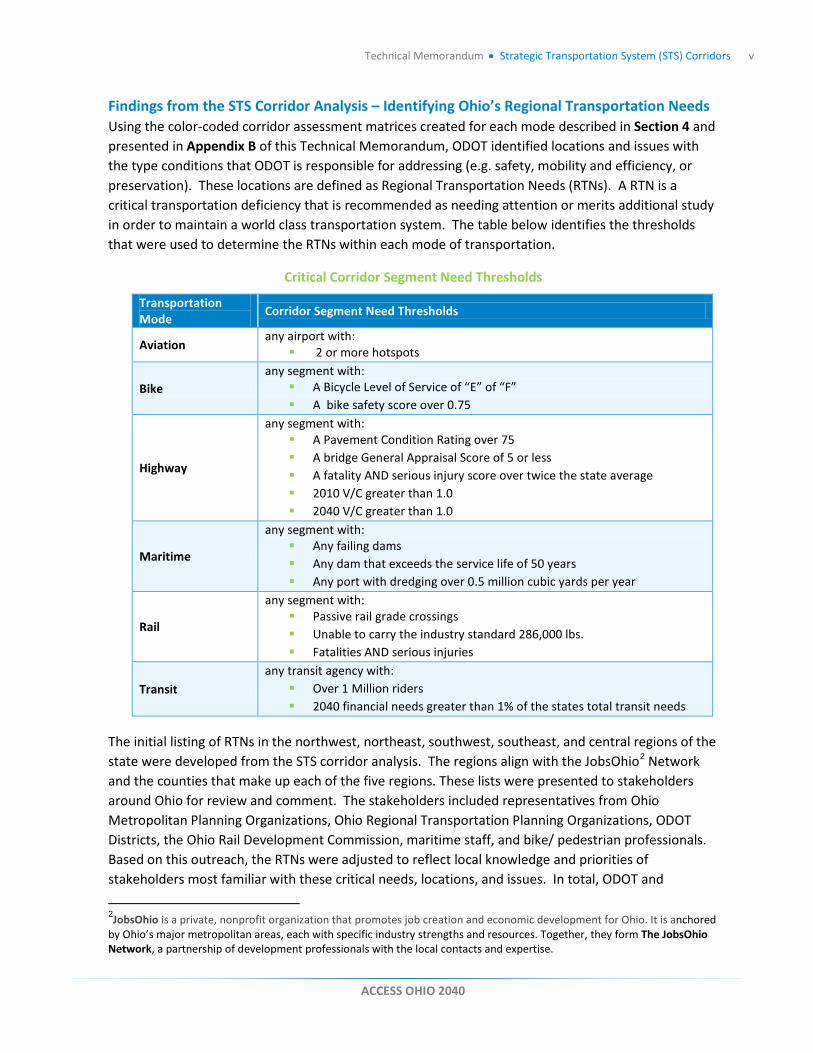
Findings from the STS Corridor Analysis – Identifying Ohio’s Regional Transportation Needs Using the color-coded corridor assessment matrices created for each mode described in Section 4 and presented in Appendix B of this Technical Memorandum, ODOT identified locations and issues with the type conditions that ODOT is responsible for addressing (e.g. safety, mobility and efficiency, or preservation). These locations are defined as Regional Transportation Needs (RTNs). A RTN is a critical transportation deficiency that is recommended as needing attention or merits additional study in order to maintain a world class transportation system. The table below identifies the thresholds that were used to determine the RTNs within each mode of transportation.
Critical Corridor Segment Need Thresholds
Transportation Mode Corridor Segment Need Thresholds
Aviation any airport with: 2 or more hotspots
Bike any segment with: A Bicycle Level of Service of “E” of “F” A bike safety score over 0.75
Highway
any segment with: A Pavement Condition Rating over 75 A bridge General Appraisal Score of 5 or less A fatality AND serious injury score over twice the state average 2010 V/C greater than 1.0 2040 V/C greater than 1.0
Maritime
any segment with: Any failing dams Any dam that exceeds the service life of 50 years Any port with dredging over 0.5 million cubic yards per year
Rail
any segment with: Passive rail grade crossings Unable to carry the industry standard 286,000 lbs. Fatalities AND serious injuries
Transit any transit agency with: Over 1 Million riders 2040 financial needs greater than 1% of the states total transit needs
The initial listing of RTNs in the northwest, northeast, southwest, southeast, and central regions of the state were developed from the STS corridor analysis. The regions align with the JobsOhio2 Network and the counties that make up each of the five regions. These lists were presented to stakeholders around Ohio for review and comment. The stakeholders included representatives from Ohio Metropolitan Planning Organizations, Ohio Regional Transportation Planning Organizations, ODOT Districts, the Ohio Rail Development Commission, maritime staff, and bike/ pedestrian professionals. Based on this outreach, the RTNs were adjusted to reflect local knowledge and priorities of stakeholders most familiar with these critical needs, locations, and issues. In total, ODOT and
2JobsOhio is a private, nonprofit organization that promotes job creation and economic development for Ohio. It is anchored by Ohio’s major metropolitan areas, each with specific industry strengths and resources. Together, they form The JobsOhio Network, a partnership of development professionals with the local contacts and expertise.
ACCESS OHIO 2040

Technical Memorandum • Strategic Transportation System (STS) Corridors vi
stakeholders agreed on and identified 55 regional transportation needs. A complete list of RTNs in the northwest, northeast, southwest, southeast, and central regions of the state are shown in Appendix A.
ACCESS OHIO 2040
1
1. INTRODUCTION Ohio’s multi-modal transportation network is owned, operated, and managed by a host of public and private transportation entities, including ODOT. As a “home rule” state, Ohio law provides counties, townships and municipalities the authority to develop and implement their own transportation plans. This creates challenges in preparing a statewide transportation plan with consistent goals, objectives and policies for every transportation asset within the state. In the development of Ohio’s Statewide Long Range Transportation Plan, Access Ohio 2040 (AO40), ODOT addresses these challenges by using a corridor approach to evaluate, rate and measure the performance of Ohio’s aviation, bicycle, highway, maritime, rail, and transit transportation facilities. The focus of the corridor approach is on the analysis of transportation corridors which move the highest volumes of passengers and freight and which connect population and employment centers inside Ohio and in adjacent states. The AO40 corridor analysis provides a means to monitor and compare select measurable attributes on identified corridors in an effort to:
Guide transportation investment strategies; Inform transportation investment decision makers of current system conditions; and Support economic development and stewardship in the state
The corridor approach allows for a thorough and meaningful statewide analysis of transportation assets, while respecting home rule provisions that reserve local municipalities’ role in developing and implementing local transportation plans.
ACCESS OHIO 2040
2
2. CORRIDOR IDENTIFICATION AND CATEGORIZATION In order to provide an unbiased corridor analysis, objective criteria were developed to identify and categorize corridors for each transportation mode. The criteria used to identify the corridors include:
Volume - a measure of passenger and freight traffic
Classification - federal or state designations
Connectivity - a consideration of connections to other identified corridors or large population and employment centers
These criteria were established by ODOT staff through an iterative consultation process with stakeholders representing all modes of transportation throughout the state, and included the use of travel demand modeling and other studies. Four categories of corridors were defined as part of AO40:
National Corridors - connect large metropolitan areas in Ohio and adjacent regions. These corridors support heavy passenger traffic and are important to the national economy as they carry large volumes of freight both inside and outside Ohio.
Statewide Primary Corridors - connect metropolitan areas within Ohio. They are important to the statewide economy as they carry freight between regions of the state. These corridors have some national travel, but are predominately used for statewide passenger and freight trips.
Statewide Secondary Corridors - connect people and goods within and between regions of the state. They have some national and statewide travel, but are predominantly used for smaller regional trips.
Local Corridors - have lower traffic volumes and provide connectivity between other local corridors and local destinations.
ACCESS OHIO 2040
3
3. CORRIDOR CRITERIA BY TRANSPORTATION MODE
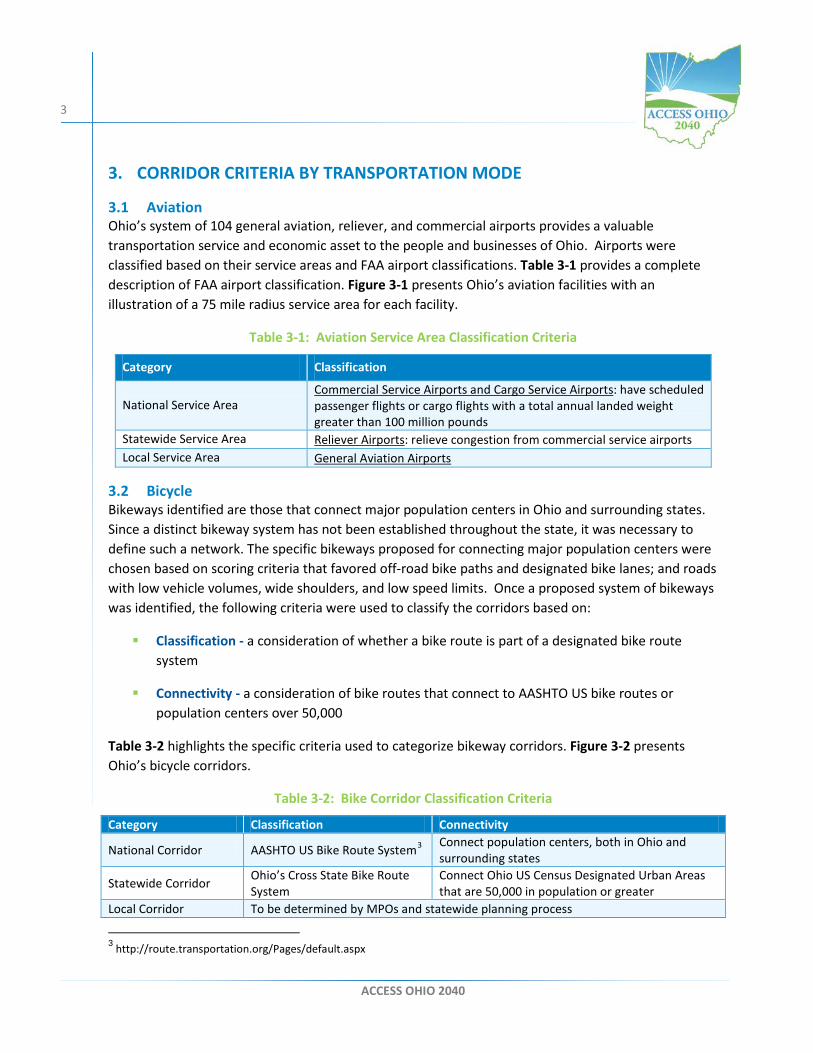
3.1 Aviation Ohio’s system of 104 general aviation, reliever, and commercial airports provides a valuable transportation service and economic asset to the people and businesses of Ohio. Airports were classified based on their service areas and FAA airport classifications. Table 3-1 provides a complete description of FAA airport classification. Figure 3-1 presents Ohio’s aviation facilities with an illustration of a 75 mile radius service area for each facility.
Table 3-1: Aviation Service Area Classification Criteria
Category Classification
National Service Area Commercial Service Airports and Cargo Service Airports: have scheduled passenger flights or cargo flights with a total annual landed weight greater than 100 million pounds
Statewide Service Area Reliever Airports: relieve congestion from commercial service airports Local Service Area General Aviation Airports
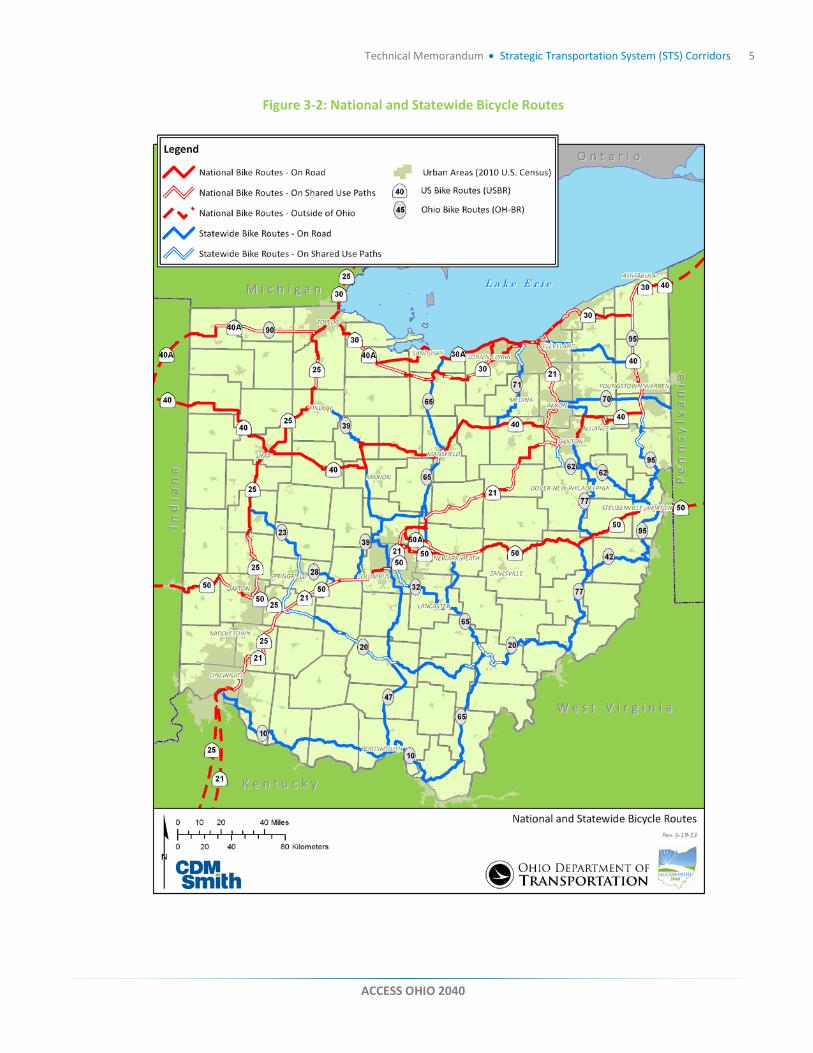
3.2 Bicycle Bikeways identified are those that connect major population centers in Ohio and surrounding states. Since a distinct bikeway system has not been established throughout the state, it was necessary to define such a network. The specific bikeways proposed for connecting major population centers were chosen based on scoring criteria that favored off-road bike paths and designated bike lanes; and roads with low vehicle volumes, wide shoulders, and low speed limits. Once a proposed system of bikeways was identified, the following criteria were used to classify the corridors based on:
Classification - a consideration of whether a bike route is part of a designated bike route system
Connectivity - a consideration of bike routes that connect to AASHTO US bike routes or population centers over 50,000
Table 3-2 highlights the specific criteria used to categorize bikeway corridors. Figure 3-2 presents Ohio’s bicycle corridors.
Table 3-2: Bike Corridor Classification Criteria
Category Classification Connectivity
National Corridor AASHTO US Bike Route System3 Connect population centers, both in Ohio and surrounding states
Statewide Corridor Ohio’s Cross State Bike Route System
Connect Ohio US Census Designated Urban Areas that are 50,000 in population or greater
Local Corridor To be determined by MPOs and statewide planning process
3 http://route.transportation.org/Pages/default.aspx
ACCESS OHIO 2040
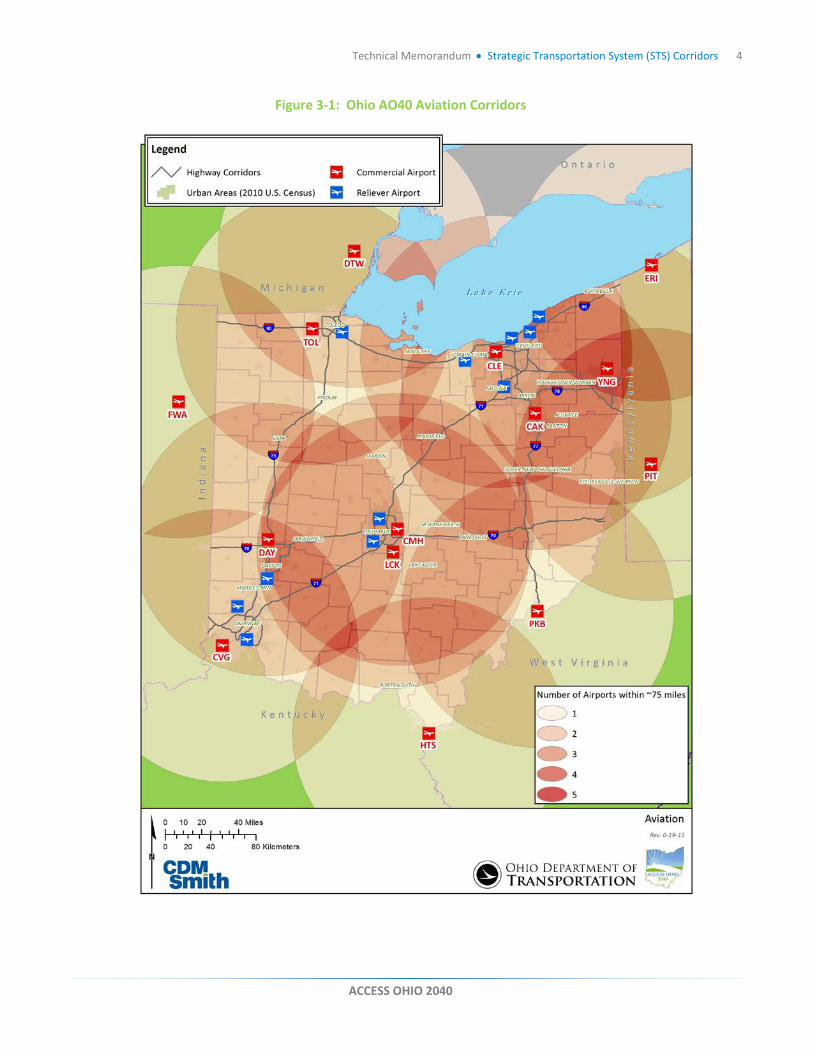
Technical Memorandum • Strategic Transportation System (STS) Corridors 4
Figure 3-1: Ohio AO40 Aviation Corridors
ACCESS OHIO 2040
Technical Memorandum • Strategic Transportation System (STS) Corridors 5
Figure 3-2: National and Statewide Bicycle Routes
ACCESS OHIO 2040
Technical Memorandum • Strategic Transportation System (STS) Corridors 6
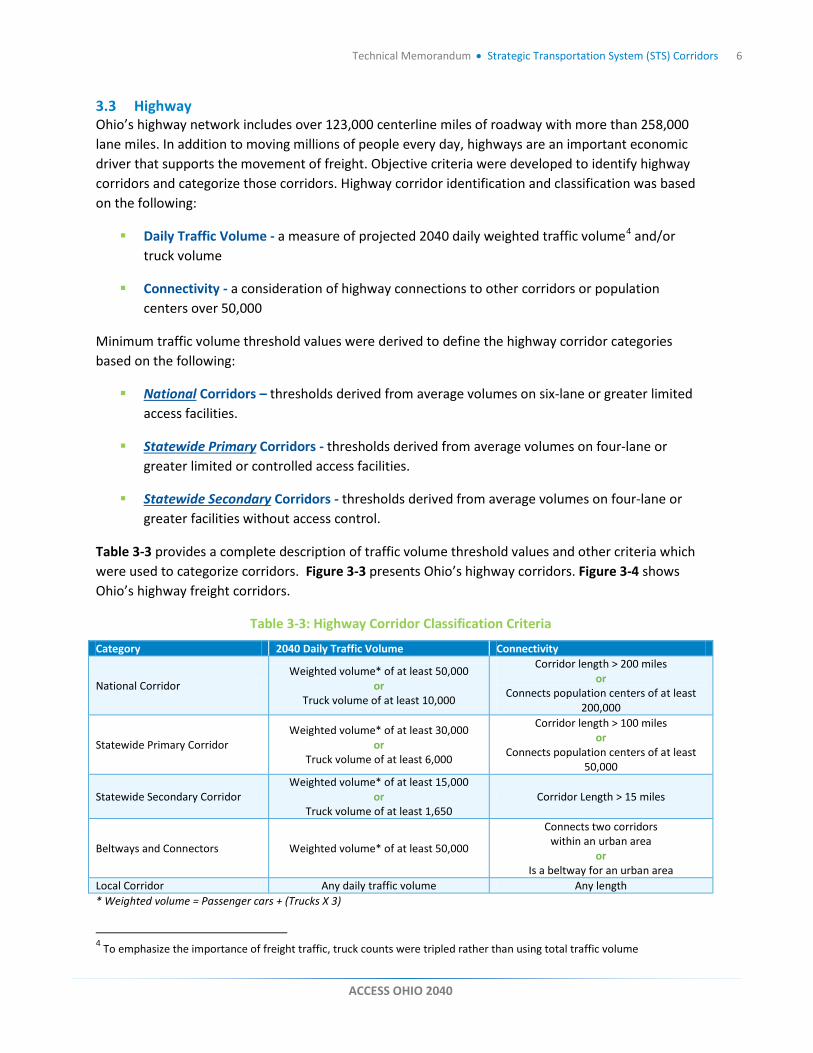
3.3 Highway Ohio’s highway network includes over 123,000 centerline miles of roadway with more than 258,000 lane miles. In addition to moving millions of people every day, highways are an important economic driver that supports the movement of freight. Objective criteria were developed to identify highway corridors and categorize those corridors. Highway corridor identification and classification was based on the following:
Daily Traffic Volume - a measure of projected 2040 daily weighted traffic volume4 and/or truck volume
Connectivity - a consideration of highway connections to other corridors or population centers over 50,000
Minimum traffic volume threshold values were derived to define the highway corridor categories based on the following:
National Corridors – thresholds derived from average volumes on six-lane or greater limited access facilities.
Statewide Primary Corridors - thresholds derived from average volumes on four-lane or greater limited or controlled access facilities.
Statewide Secondary Corridors - thresholds derived from average volumes on four-lane or greater facilities without access control.
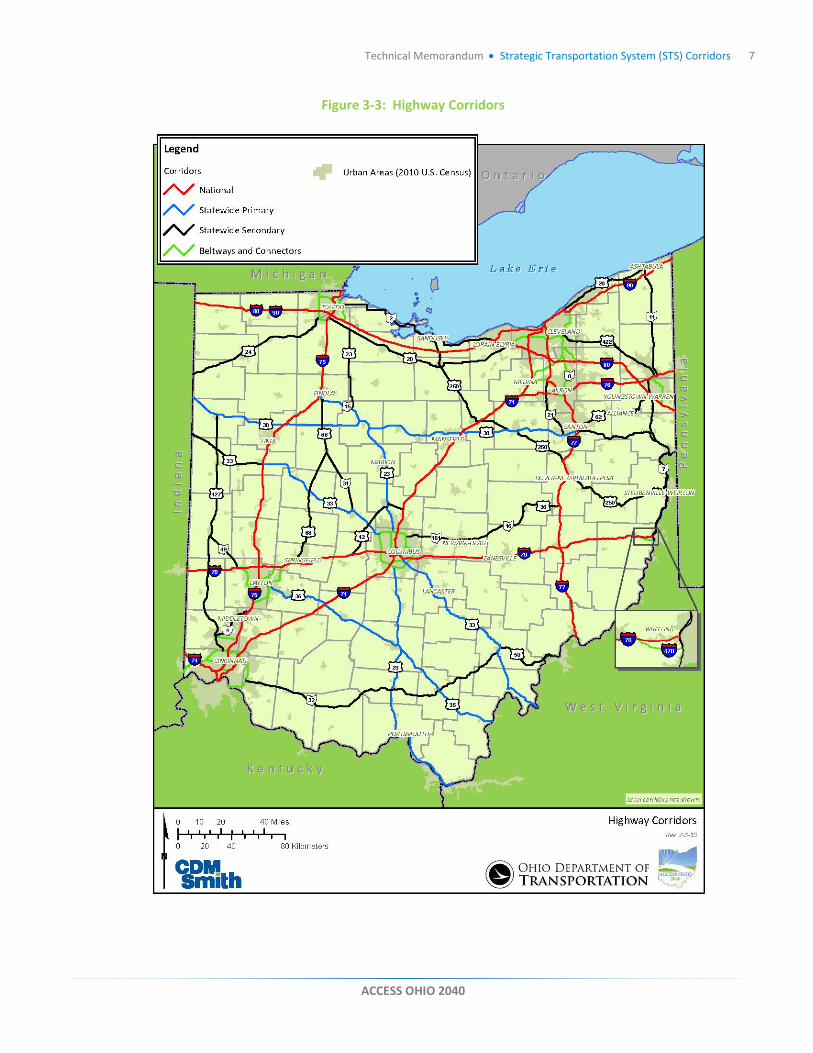
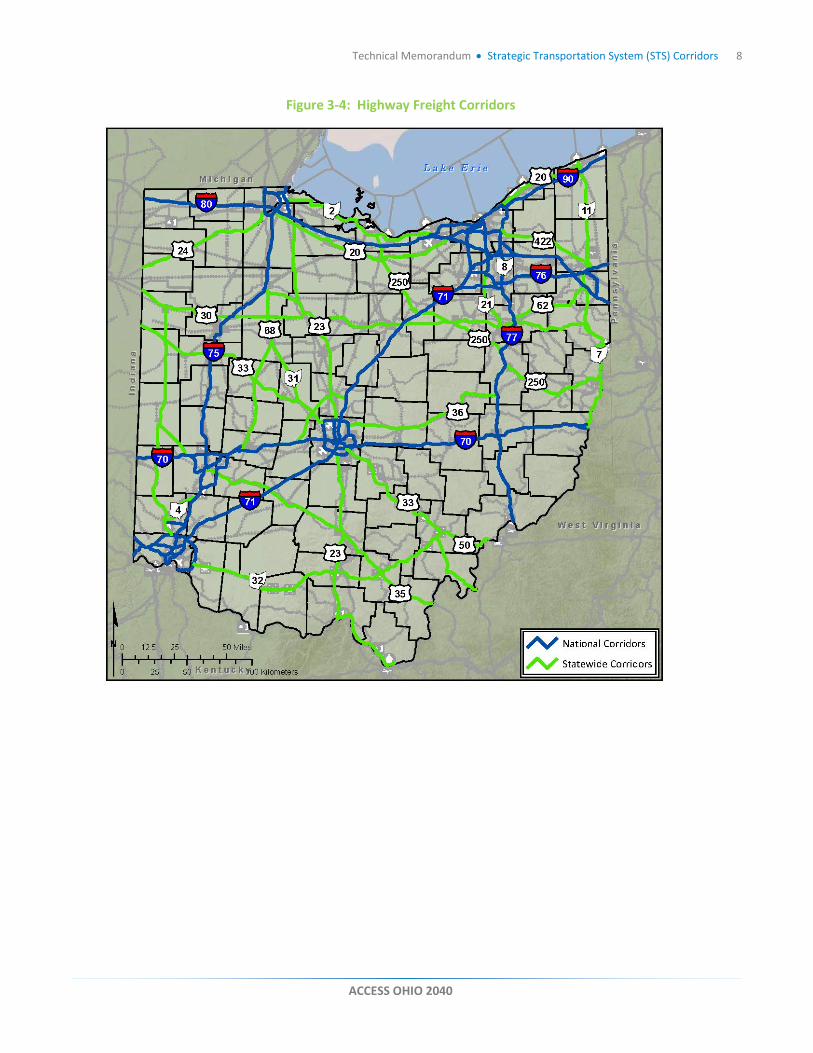
Table 3-3 provides a complete description of traffic volume threshold values and other criteria which were used to categorize corridors. Figure 3-3 presents Ohio’s highway corridors. Figure 3-4 shows Ohio’s highway freight corridors.
Table 3-3: Highway Corridor Classification Criteria
Category 2040 Daily Traffic Volume Connectivity
National Corridor Weighted volume* of at least 50,000
or Truck volume of at least 10,000
Corridor length > 200 miles or
Connects population centers of at least 200,000
Statewide Primary Corridor Weighted volume* of at least 30,000
or Truck volume of at least 6,000
Corridor length > 100 miles or
Connects population centers of at least 50,000
Statewide Secondary Corridor Weighted volume* of at least 15,000
or Truck volume of at least 1,650
Corridor Length > 15 miles
Beltways and Connectors Weighted volume* of at least 50,000
Connects two corridors within an urban area
or Is a beltway for an urban area
Local Corridor Any daily traffic volume Any length * Weighted volume = Passenger cars + (Trucks X 3)
4 To emphasize the importance of freight traffic, truck counts were tripled rather than using total traffic volume
ACCESS OHIO 2040
Technical Memorandum • Strategic Transportation System (STS) Corridors 7
Figure 3-3: Highway Corridors
ACCESS OHIO 2040
Technical Memorandum • Strategic Transportation System (STS) Corridors 8
Figure 3-4: Highway Freight Corridors
ACCESS OHIO 2040
Technical Memorandum • Strategic Transportation System (STS) Corridors 9
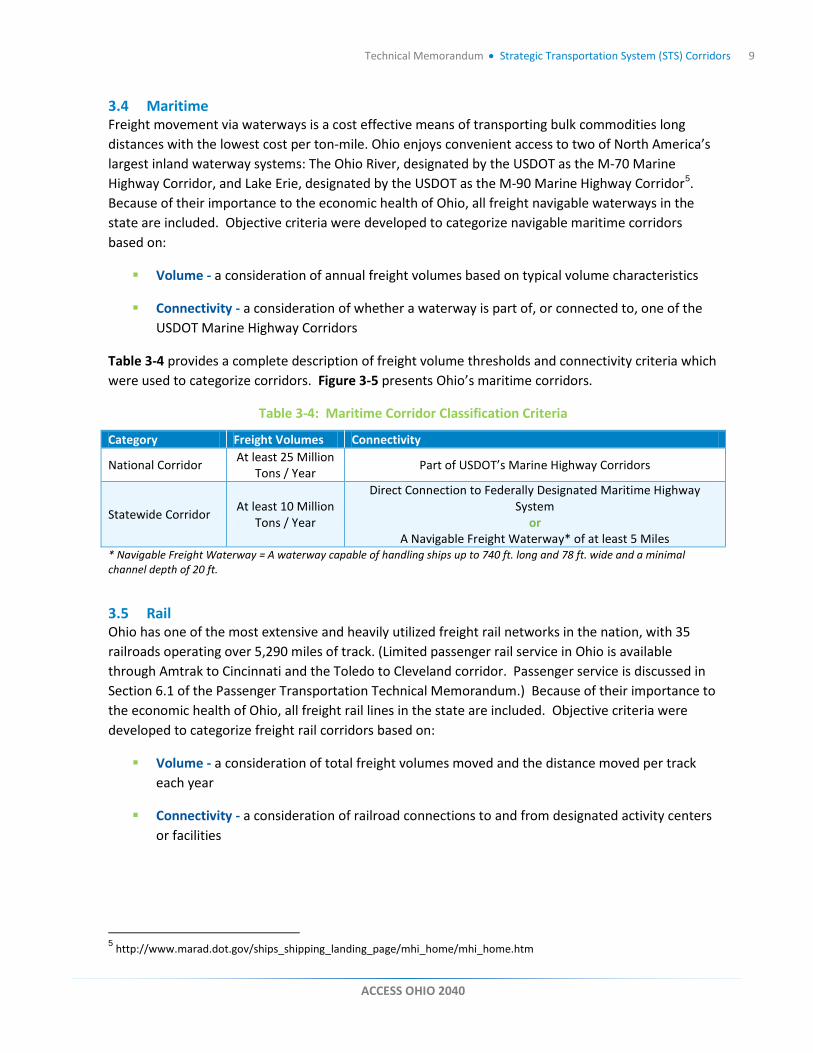
3.4 Maritime Freight movement via waterways is a cost effective means of transporting bulk commodities long distances with the lowest cost per ton-mile. Ohio enjoys convenient access to two of North America’s largest inland waterway systems: The Ohio River, designated by the USDOT as the M-70 Marine Highway Corridor, and Lake Erie, designated by the USDOT as the M-90 Marine Highway Corridor5. Because of their importance to the economic health of Ohio, all freight navigable waterways in the state are included. Objective criteria were developed to categorize navigable maritime corridors based on:
Volume - a consideration of annual freight volumes based on typical volume characteristics
Connectivity - a consideration of whether a waterway is part of, or connected to, one of the USDOT Marine Highway Corridors
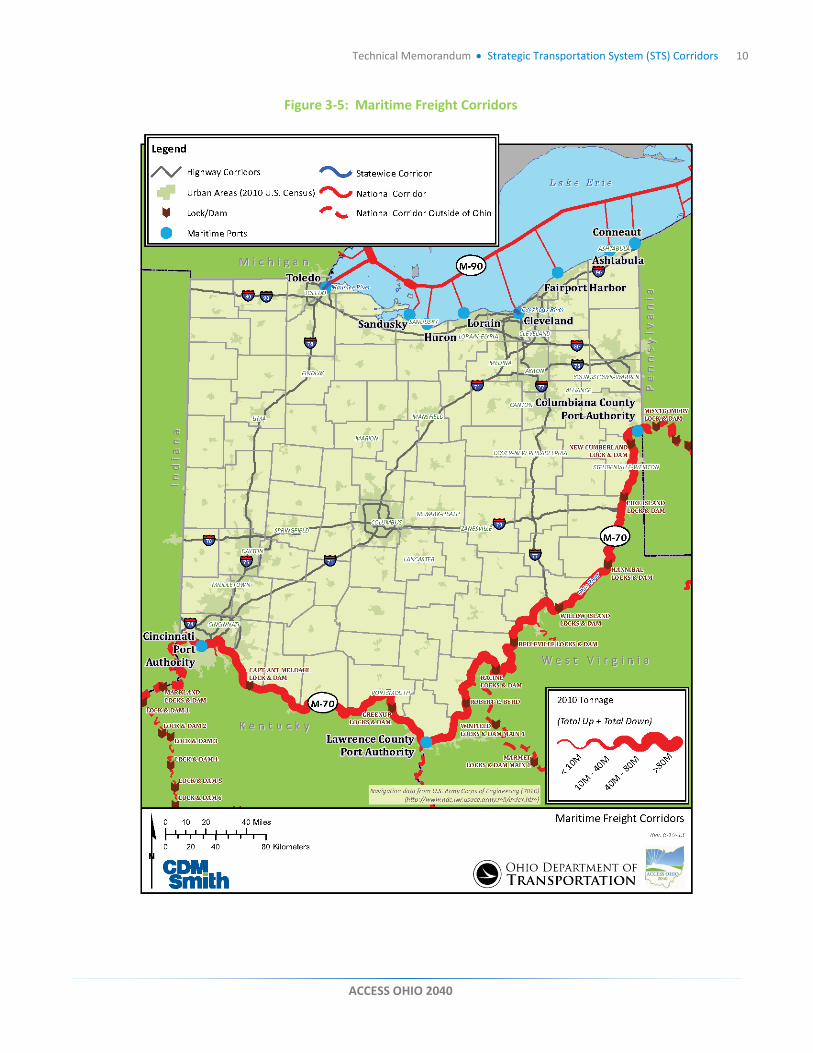
Table 3-4 provides a complete description of freight volume thresholds and connectivity criteria which were used to categorize corridors. Figure 3-5 presents Ohio’s maritime corridors.
Table 3-4: Maritime Corridor Classification Criteria
Category Freight Volumes Connectivity
National Corridor At least 25 Million Tons / Year Part of USDOT’s Marine Highway Corridors
Statewide Corridor At least 10 Million Tons / Year
Direct Connection to Federally Designated Maritime Highway System
or A Navigable Freight Waterway* of at least 5 Miles
* Navigable Freight Waterway = A waterway capable of handling ships up to 740 ft. long and 78 ft. wide and a minimal channel depth of 20 ft.
3.5 Rail Ohio has one of the most extensive and heavily utilized freight rail networks in the nation, with 35 railroads operating over 5,290 miles of track. (Limited passenger rail service in Ohio is available through Amtrak to Cincinnati and the Toledo to Cleveland corridor. Passenger service is discussed in Section 6.1 of the Passenger Transportation Technical Memorandum.) Because of their importance to the economic health of Ohio, all freight rail lines in the state are included. Objective criteria were developed to categorize freight rail corridors based on:
Volume - a consideration of total freight volumes moved and the distance moved per track each year
Connectivity - a consideration of railroad connections to and from designated activity centers or facilities
5 http://www.marad.dot.gov/ships_shipping_landing_page/mhi_home/mhi_home.htm
ACCESS OHIO 2040
Technical Memorandum • Strategic Transportation System (STS) Corridors 10
Figure 3-5: Maritime Freight Corridors
ACCESS OHIO 2040
Technical Memorandum • Strategic Transportation System (STS) Corridors 11
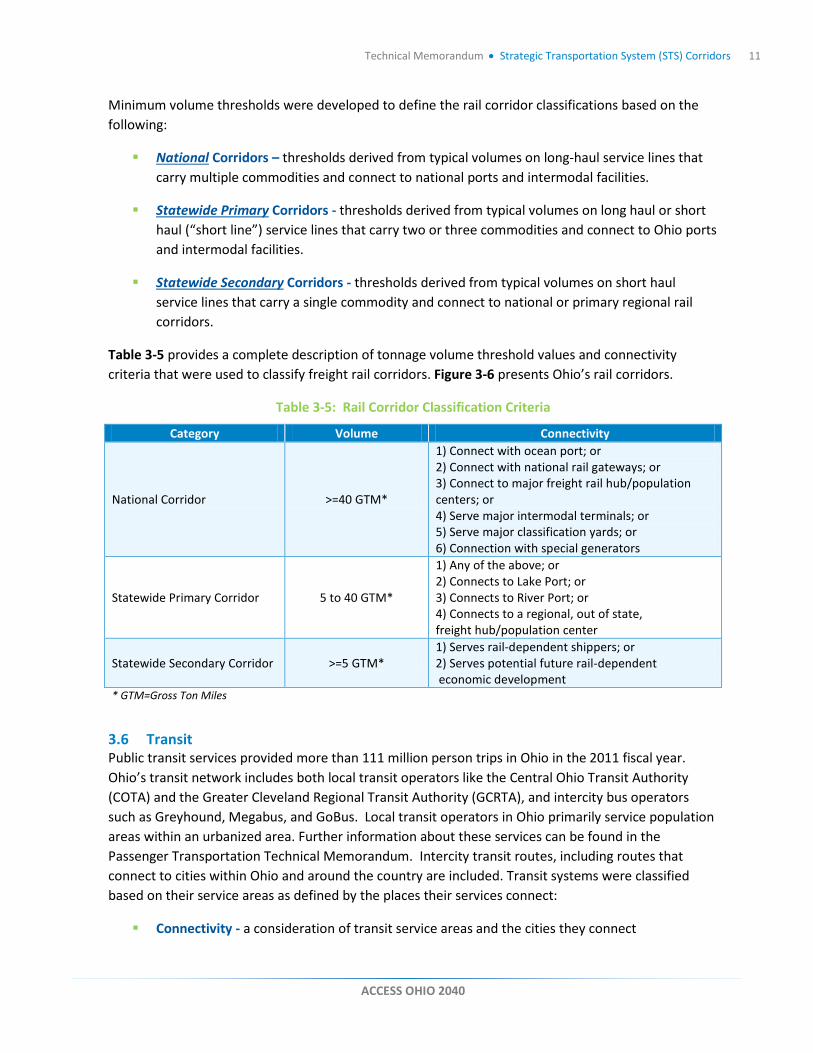
Minimum volume thresholds were developed to define the rail corridor classifications based on the following:
National Corridors – thresholds derived from typical volumes on long-haul service lines that carry multiple commodities and connect to national ports and intermodal facilities.
Statewide Primary Corridors - thresholds derived from typical volumes on long haul or short haul (“short line”) service lines that carry two or three commodities and connect to Ohio ports and intermodal facilities.
Statewide Secondary Corridors - thresholds derived from typical volumes on short haul service lines that carry a single commodity and connect to national or primary regional rail corridors.
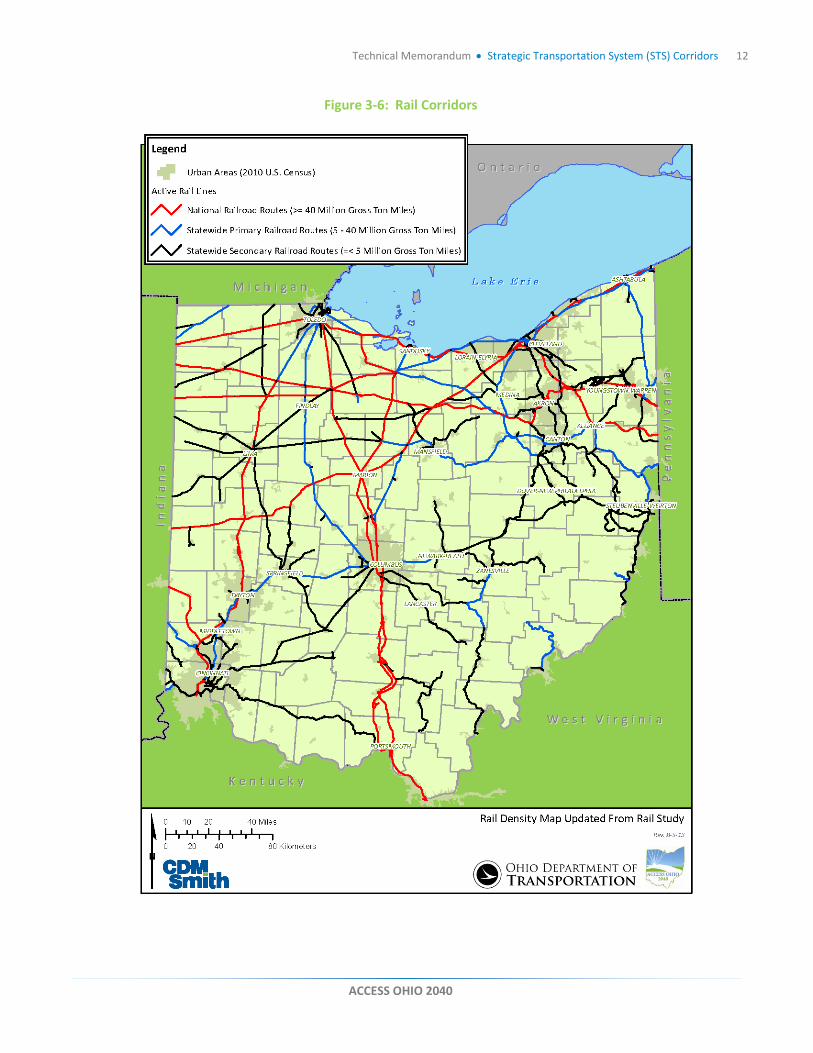
Table 3-5 provides a complete description of tonnage volume threshold values and connectivity criteria that were used to classify freight rail corridors. Figure 3-6 presents Ohio’s rail corridors.
Table 3-5: Rail Corridor Classification Criteria
Category Volume Connectivity
National Corridor >=40 GTM*
1) Connect with ocean port; or 2) Connect with national rail gateways; or 3) Connect to major freight rail hub/population centers; or 4) Serve major intermodal terminals; or 5) Serve major classification yards; or 6) Connection with special generators
Statewide Primary Corridor 5 to 40 GTM*
1) Any of the above; or 2) Connects to Lake Port; or 3) Connects to River Port; or 4) Connects to a regional, out of state, freight hub/population center
Statewide Secondary Corridor >=5 GTM* 1) Serves rail-dependent shippers; or 2) Serves potential future rail-dependent economic development
* GTM=Gross Ton Miles
3.6 Transit Public transit services provided more than 111 million person trips in Ohio in the 2011 fiscal year. Ohio’s transit network includes both local transit operators like the Central Ohio Transit Authority (COTA) and the Greater Cleveland Regional Transit Authority (GCRTA), and intercity bus operators such as Greyhound, Megabus, and GoBus. Local transit operators in Ohio primarily service population areas within an urbanized area. Further information about these services can be found in the Passenger Transportation Technical Memorandum. Intercity transit routes, including routes that connect to cities within Ohio and around the country are included. Transit systems were classified based on their service areas as defined by the places their services connect:
Connectivity - a consideration of transit service areas and the cities they connect
ACCESS OHIO 2040
Technical Memorandum • Strategic Transportation System (STS) Corridors 12
Figure 3-6: Rail Corridors
ACCESS OHIO 2040
Technical Memorandum • Strategic Transportation System (STS) Corridors 13
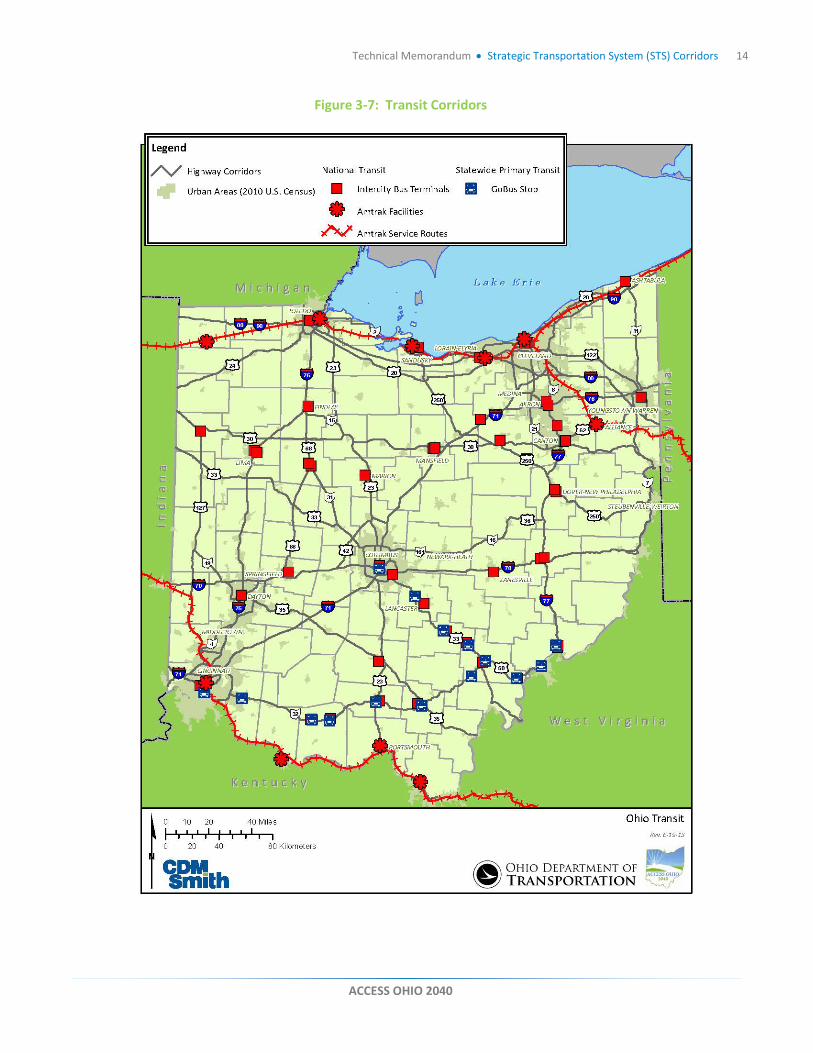
Table 3-6 provides a complete description of service area categories based on connectivity. Figure 3-7 presents Ohio’s intercity transit corridors.
Table 3-6: Transit Service Area Criteria
Category Connectivity
National Service Areas Connection to cities in Ohio and major cities outside of Ohio
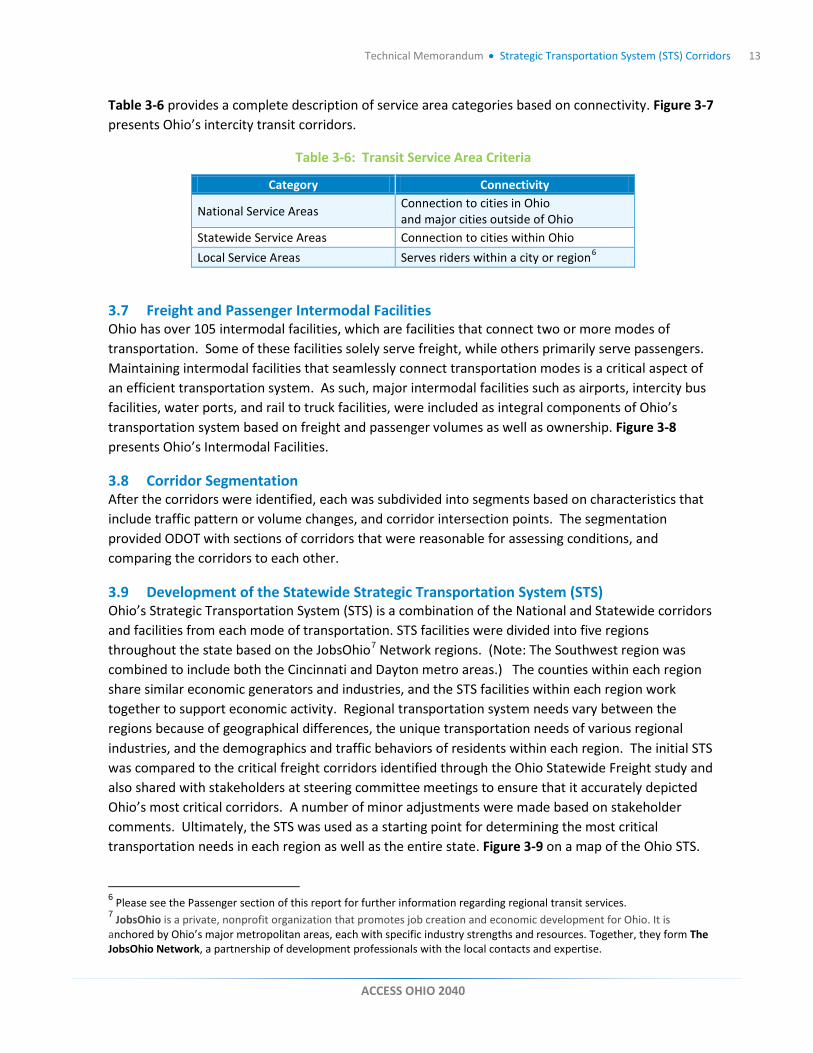
Statewide Service Areas Connection to cities within Ohio Local Service Areas Serves riders within a city or region6
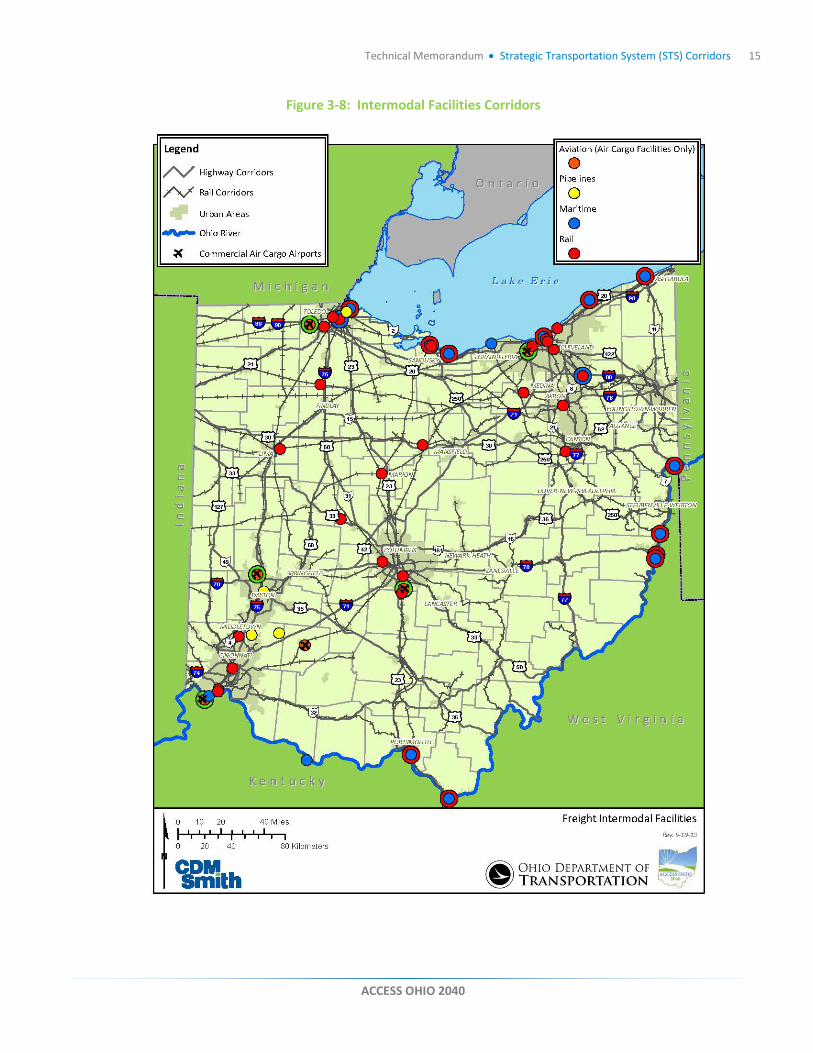
3.7 Freight and Passenger Intermodal Facilities Ohio has over 105 intermodal facilities, which are facilities that connect two or more modes of transportation. Some of these facilities solely serve freight, while others primarily serve passengers. Maintaining intermodal facilities that seamlessly connect transportation modes is a critical aspect of an efficient transportation system. As such, major intermodal facilities such as airports, intercity bus facilities, water ports, and rail to truck facilities, were included as integral components of Ohio’s transportation system based on freight and passenger volumes as well as ownership. Figure 3-8 presents Ohio’s Intermodal Facilities.
3.8 Corridor Segmentation After the corridors were identified, each was subdivided into segments based on characteristics that include traffic pattern or volume changes, and corridor intersection points. The segmentation provided ODOT with sections of corridors that were reasonable for assessing conditions, and comparing the corridors to each other.
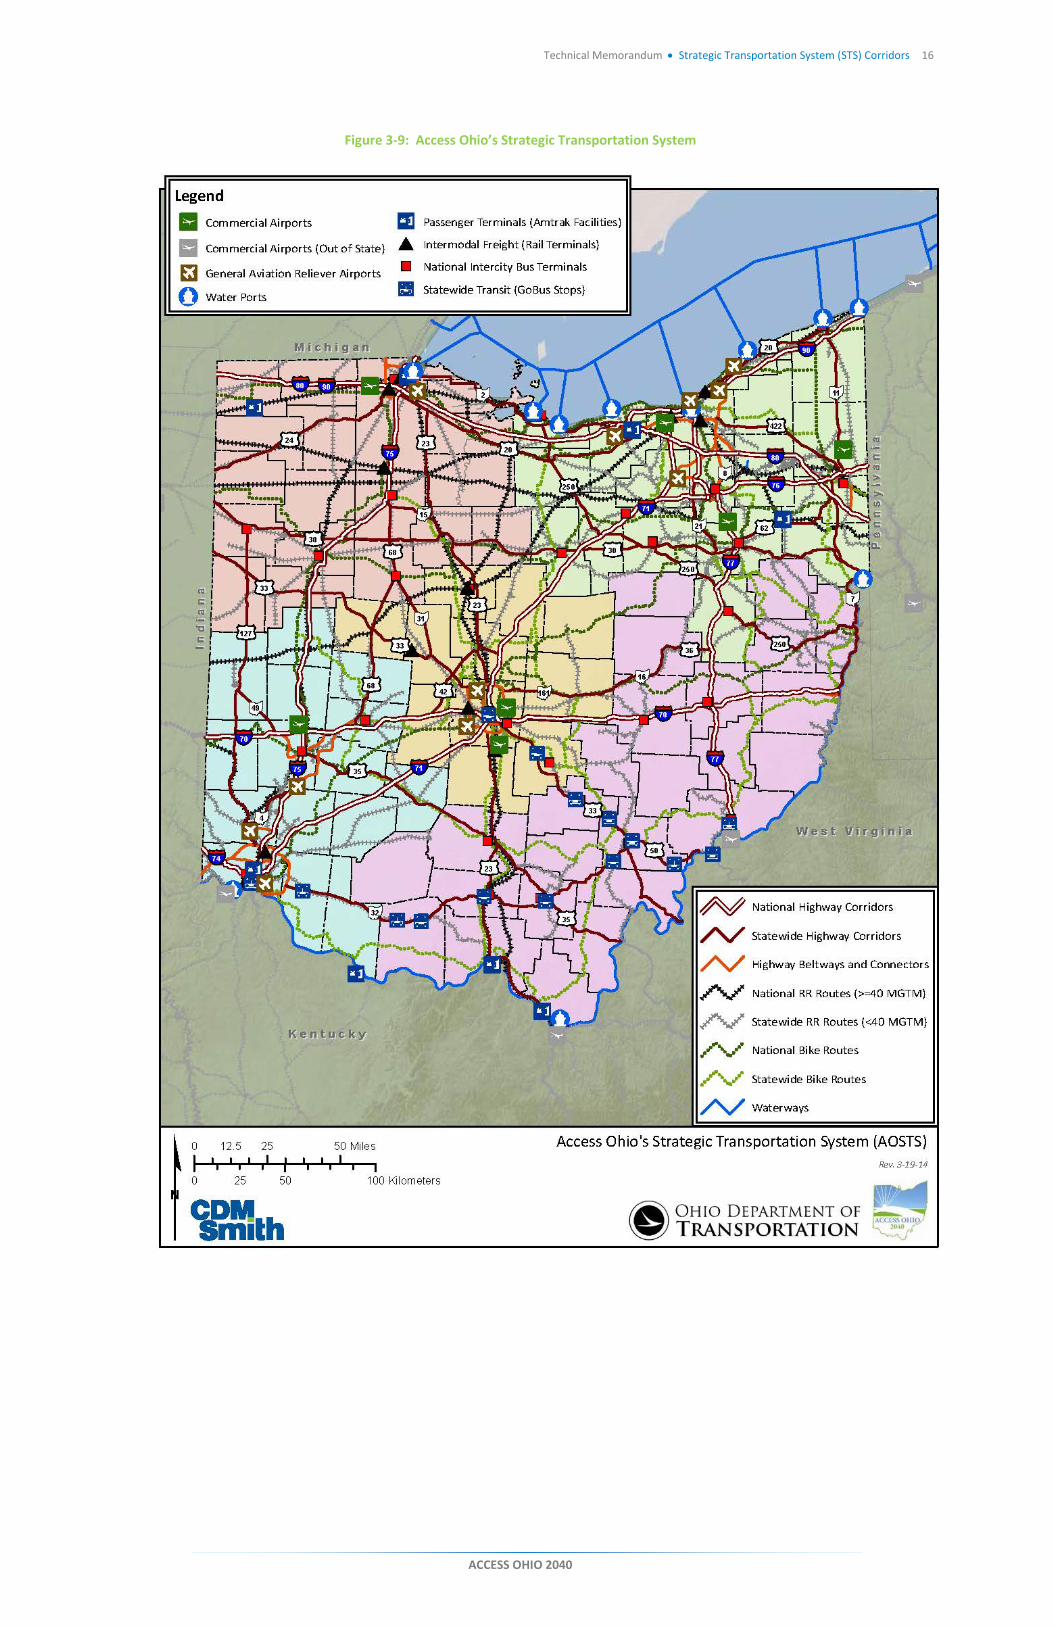
3.9 Development of the Statewide Strategic Transportation System (STS) Ohio’s Strategic Transportation System (STS) is a combination of the National and Statewide corridors and facilities from each mode of transportation. STS facilities were divided into five regions throughout the state based on the JobsOhio7 Network regions. (Note: The Southwest region was combined to include both the Cincinnati and Dayton metro areas.) The counties within each region share similar economic generators and industries, and the STS facilities within each region work together to support economic activity. Regional transportation system needs vary between the regions because of geographical differences, the unique transportation needs of various regional industries, and the demographics and traffic behaviors of residents within each region. The initial STS was compared to the critical freight corridors identified through the Ohio Statewide Freight study and also shared with stakeholders at steering committee meetings to ensure that it accurately depicted Ohio’s most critical corridors. A number of minor adjustments were made based on stakeholder comments. Ultimately, the STS was used as a starting point for determining the most critical transportation needs in each region as well as the entire state. Figure 3-9 on a map of the Ohio STS.
6 Please see the Passenger section of this report for further information regarding regional transit services. 7 JobsOhio is a private, nonprofit organization that promotes job creation and economic development for Ohio. It is anchored by Ohio’s major metropolitan areas, each with specific industry strengths and resources. Together, they form The JobsOhio Network, a partnership of development professionals with the local contacts and expertise.
ACCESS OHIO 2040
Technical Memorandum • Strategic Transportation System (STS) Corridors 14
Figure 3-7: Transit Corridors
ACCESS OHIO 2040
Technical Memorandum • Strategic Transportation System (STS) Corridors 15
Figure 3-8: Intermodal Facilities Corridors
ACCESS OHIO 2040
Technical Memorandum • Strategic Transportation System (STS) Corridors 16
Figure 3-9: Access Ohio’s Strategic Transportation System
ACCESS OHIO 2040
17
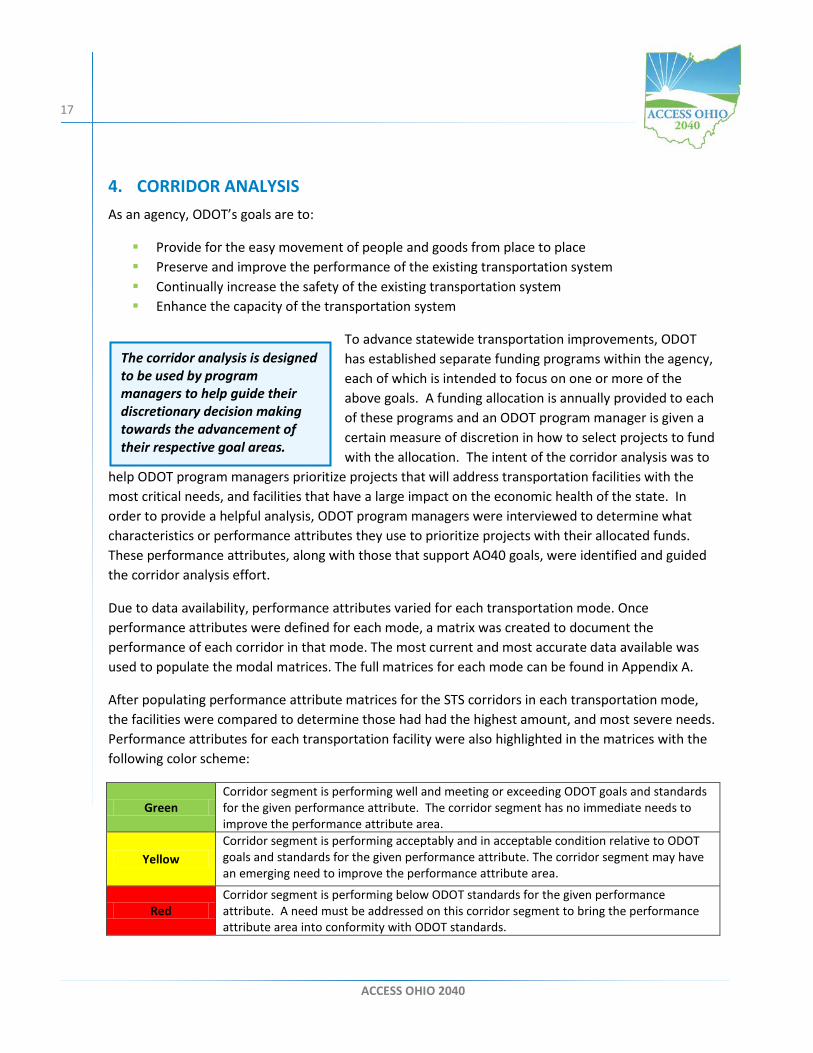
4. CORRIDOR ANALYSIS As an agency, ODOT’s goals are to:
Provide for the easy movement of people and goods from place to place Preserve and improve the performance of the existing transportation system Continually increase the safety of the existing transportation system Enhance the capacity of the transportation system
To advance statewide transportation improvements, ODOT has established separate funding programs within the agency, each of which is intended to focus on one or more of the above goals. A funding allocation is annually provided to each of these programs and an ODOT program manager is given a certain measure of discretion in how to select projects to fund with the allocation. The intent of the corridor analysis was to
help ODOT program managers prioritize projects that will address transportation facilities with the most critical needs, and facilities that have a large impact on the economic health of the state. In order to provide a helpful analysis, ODOT program managers were interviewed to determine what characteristics or performance attributes they use to prioritize projects with their allocated funds. These performance attributes, along with those that support AO40 goals, were identified and guided the corridor analysis effort.
Due to data availability, performance attributes varied for each transportation mode. Once performance attributes were defined for each mode, a matrix was created to document the performance of each corridor in that mode. The most current and most accurate data available was used to populate the modal matrices. The full matrices for each mode can be found in Appendix A.
After populating performance attribute matrices for the STS corridors in each transportation mode, the facilities were compared to determine those had had the highest amount, and most severe needs. Performance attributes for each transportation facility were also highlighted in the matrices with the following color scheme:
Green Corridor segment is performing well and meeting or exceeding ODOT goals and standards for the given performance attribute. The corridor segment has no immediate needs to improve the performance attribute area.
Yellow Corridor segment is performing acceptably and in acceptable condition relative to ODOT goals and standards for the given performance attribute. The corridor segment may have an emerging need to improve the performance attribute area.
Red Corridor segment is performing below ODOT standards for the given performance attribute. A need must be addressed on this corridor segment to bring the performance attribute area into conformity with ODOT standards.
The corridor analysis is designed to be used by program managers to help guide their discretionary decision making towards the advancement of their respective goal areas.
ACCESS OHIO 2040
Technical Memorandum • Strategic Transportation System (STS) Corridors 18
Sections 4.1 and 4.2 describe the characteristics and performance attributes that were documented for each transportation mode.
4.1 Corridor Characteristics Corridor characteristics are descriptive attributes that were used to identify compare the corridors. The majority of these characteristics pertain to AO40’s goals and objectives, as well as the critical success factors that ODOT uses to rate transportation facilities. Below are the corridor characteristics that were documented for each mode.
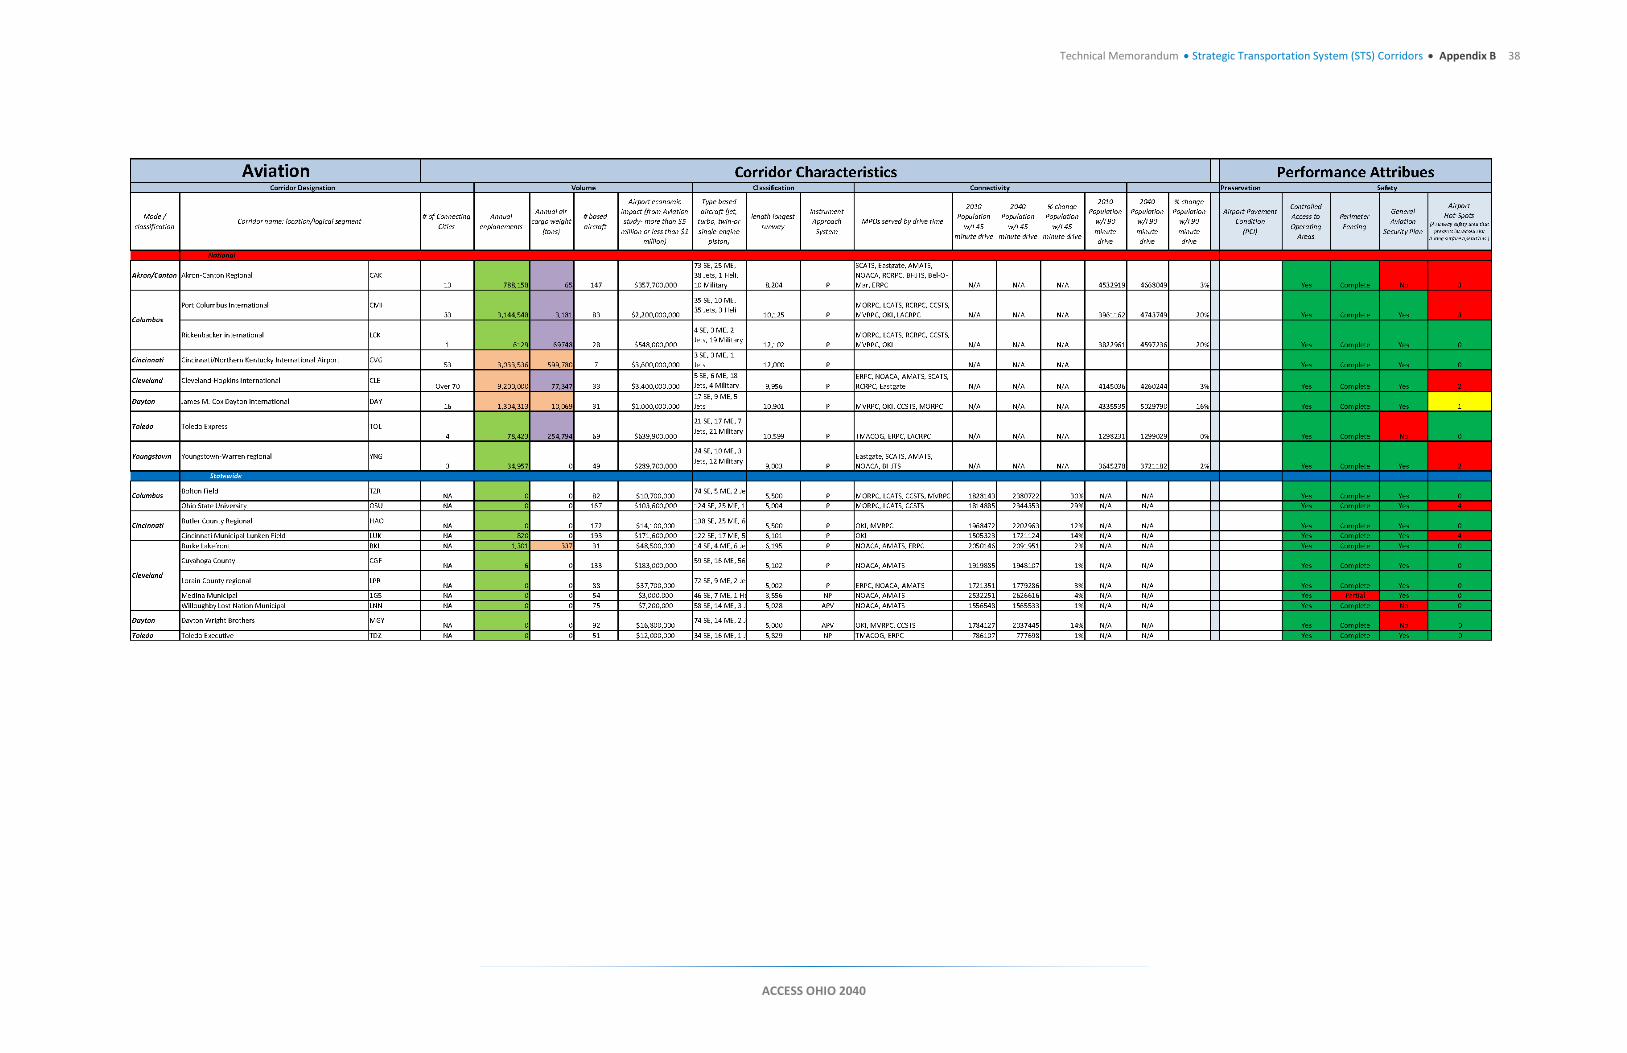
4.1.1 Aviation Corridor Characteristics # Of Connecting Cities = Number of different cities served by scheduled, nonstop flights from
commercial airports (data from airport websites)
Annual Enplanements = Most recent available data (2010 or better) for yearly passenger enplanements for each airport (data from airport website, direct contact, or FAA Terminal Area Forecasts)
Annual Air Cargo Weight = Total air cargo handled per airport in tons (data from airport website or Airports Council International)
Number of Based Aircraft = Number of aircraft based at each airport (data from FAA Form 5010)
Airport Economic Impact = Economic impact value that each airport brings to the surrounding area, reported from Ohio State Airport System Plan 2006
Type of Based Aircraft = Sum of the following aircraft types as recorded by FAA Form 5010 1) Jet 2) Turbo 3) Twin 4) Single Engine Piston 5) Rotorcraft
Length of Longest Runway = Length in feet of the airport’s longest runway (data from Ohio Airports Focus Study)
Instrument Approach System = Type of instrument approach system at each airport (data from Ohio Airports Focus Study)
MPOs Served by drive time = List of the MPO’s served by each airport within a 90 (national) or 45 (statewide) minute drive8
2010 Population w/in 45 Minute Drive = Sum of 2010 population within a 45 minute drive of an airport (data from ODOT GIS files)
8 CDM Smith GIS analysis of OSOT shapefile data used for aviation, bike, and highway characteristic analysis - including drive time; ODOT GIS files - 90minuteDriveTime.shp, and Ohio_Pop_BlockGroups_2010_2040.shp; and bikes_routes_050222013.shp; Ohio_MPO_boundary.shp; Ohio_Pop_BlockGroups_2010.shp).
ACCESS OHIO 2040
Technical Memorandum • Strategic Transportation System (STS) Corridors 19
2040 Population w/in 45 Minute Drive = Sum of projected 2040 population within a 45 minute drive of an airport (data from ODOT GIS)
2010 Population w/in 90 Minute Drive = Sum of the population within a 90 minute drive of an airport (data from ODOT GIS files)
2040 Population w/in 90 Minute Drive = Sum of projected 2040 population within a 90 minute drive of an airport (data from ODOT GIS files)
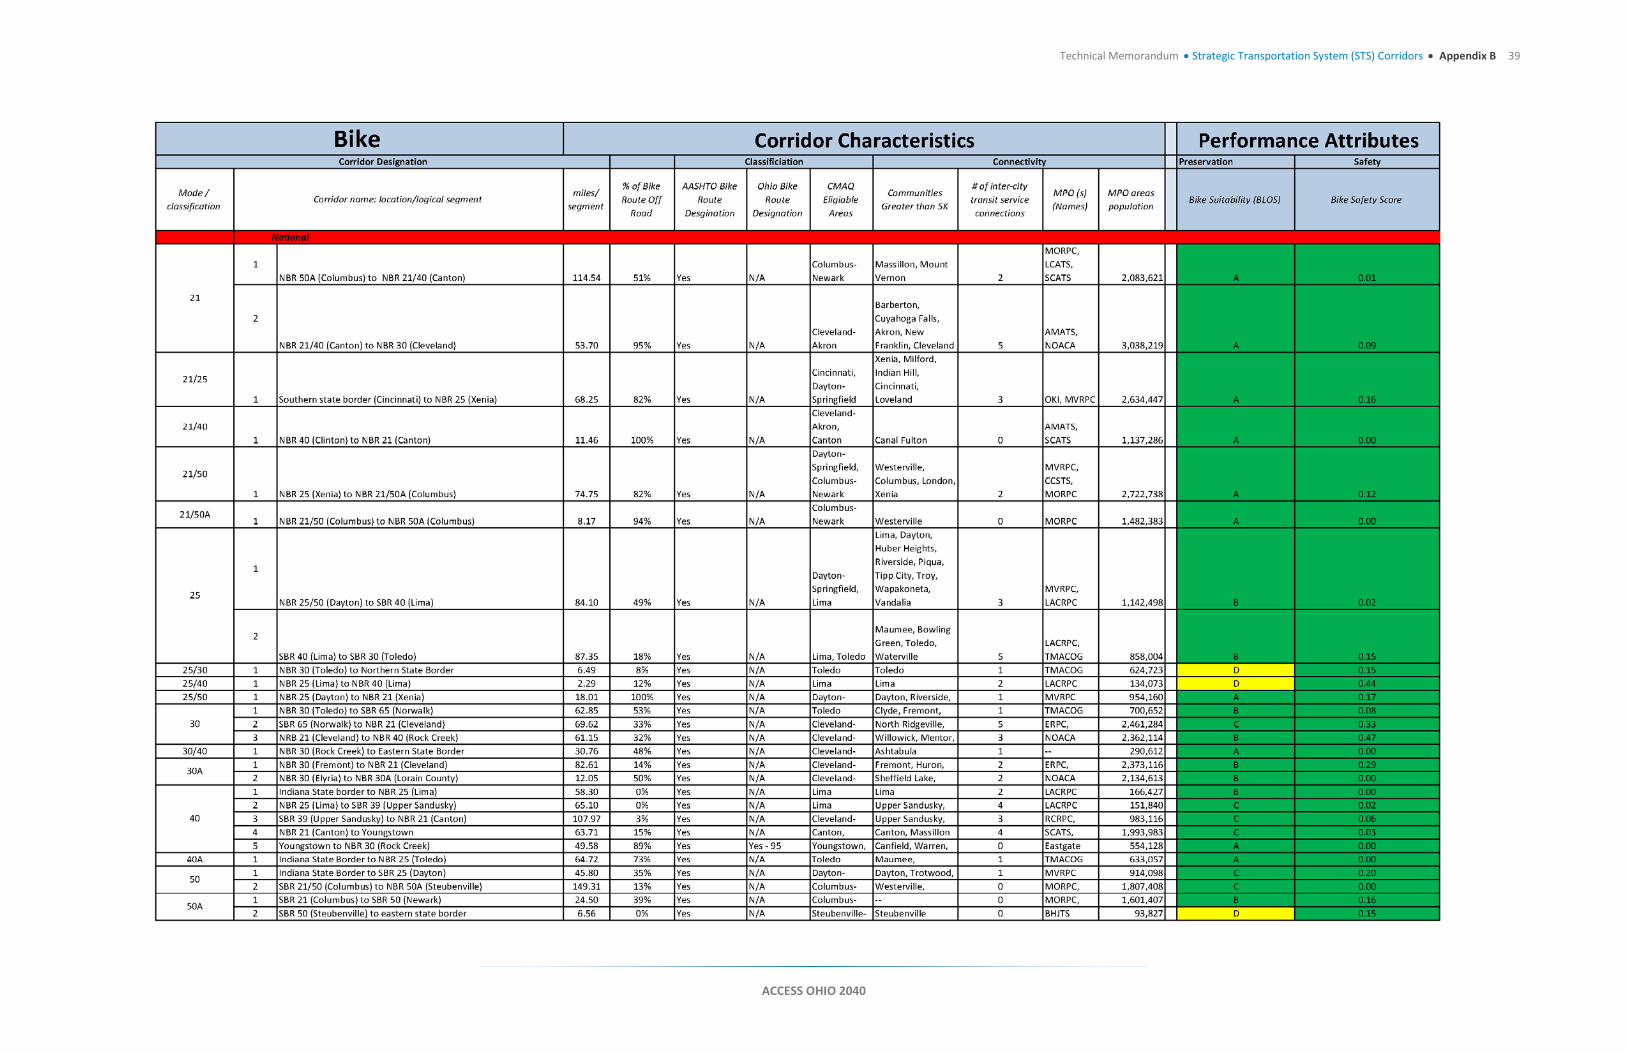
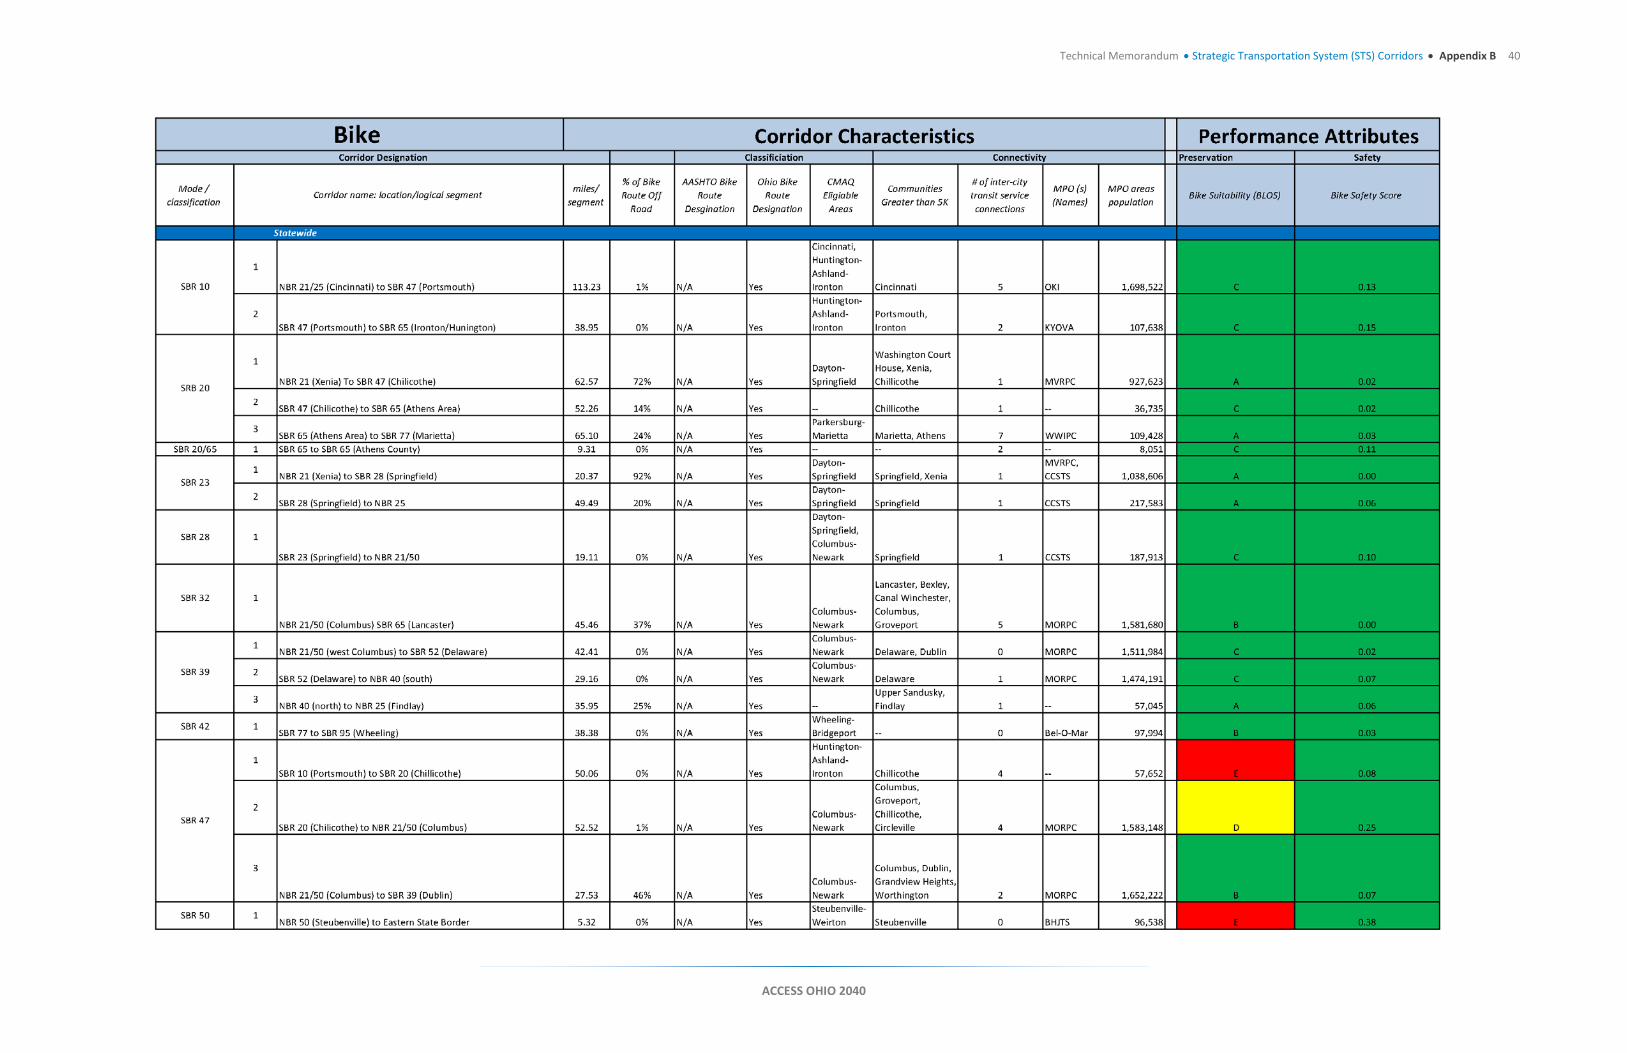
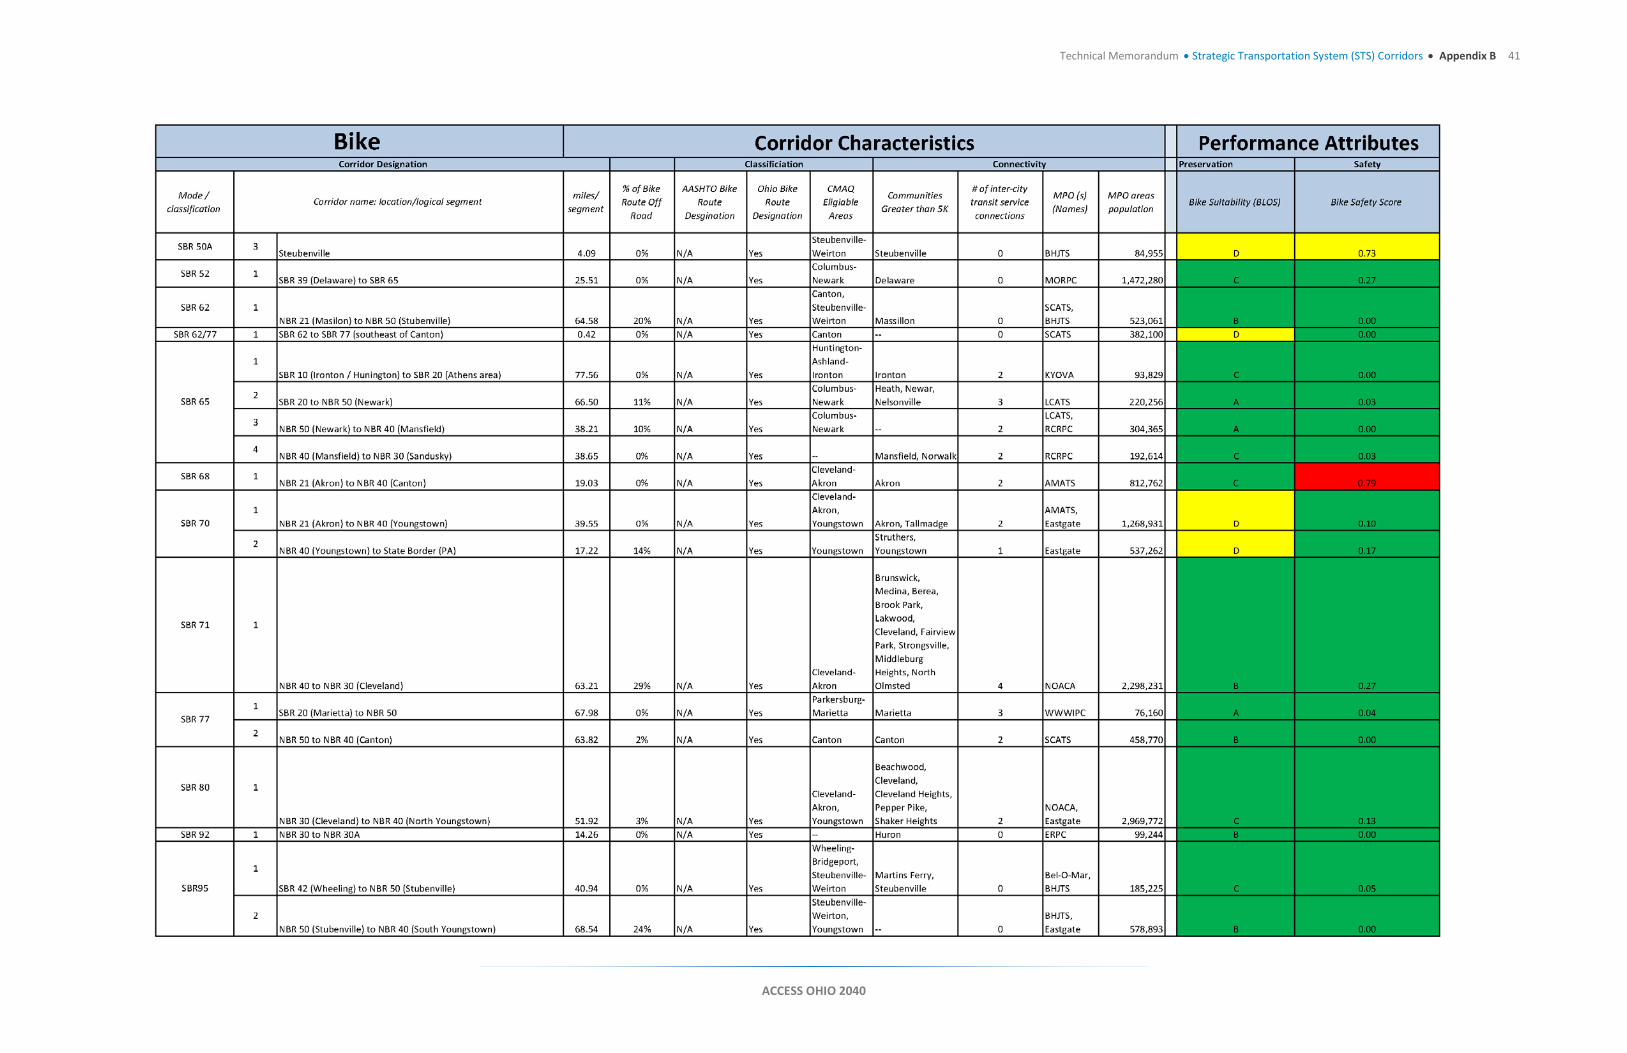
4.1.2 Bike Characteristics % of Bike Route Off-Road = The percent of each bike segment that is on either a shared use
path, an off road facility, or a designated bicycle lane, compared to the total segment length (data from ODOT GIS files)
AASHTO US Bike Route Designation = Yes/no function that determines if a segment has been designated as an AASHTO US bike route (data from ODOT GIS files)
Ohio Bike Route Designation = Yes/no function that determines if a segment has been designated as an ODOT bike route (data from ODOT GIS files)
CMAQ Eligibility Areas = the CMAQ eligible (non-attainment) areas touched by the bike corridor segment. Many bike facility projects are eligible for this funding source. (data from ODOT GIS files)
Communities Greater than 5K = List of the communities with populations greater than 5,000 that the corridor segment passes through (data from U.S. Census)
# Of Intercity Transit Service Connections = List of the intercity transit terminals within a 5 mile bandwidth (i.e. 5 miles on either side) of a corridor segment
MPO (s) = List of MPO geographies that the corridor segment passes through (data from ODOT GIS files)
Population = Sum of the population within a 1 mile bandwidth of the corridor, (data from ODOT GIS files)
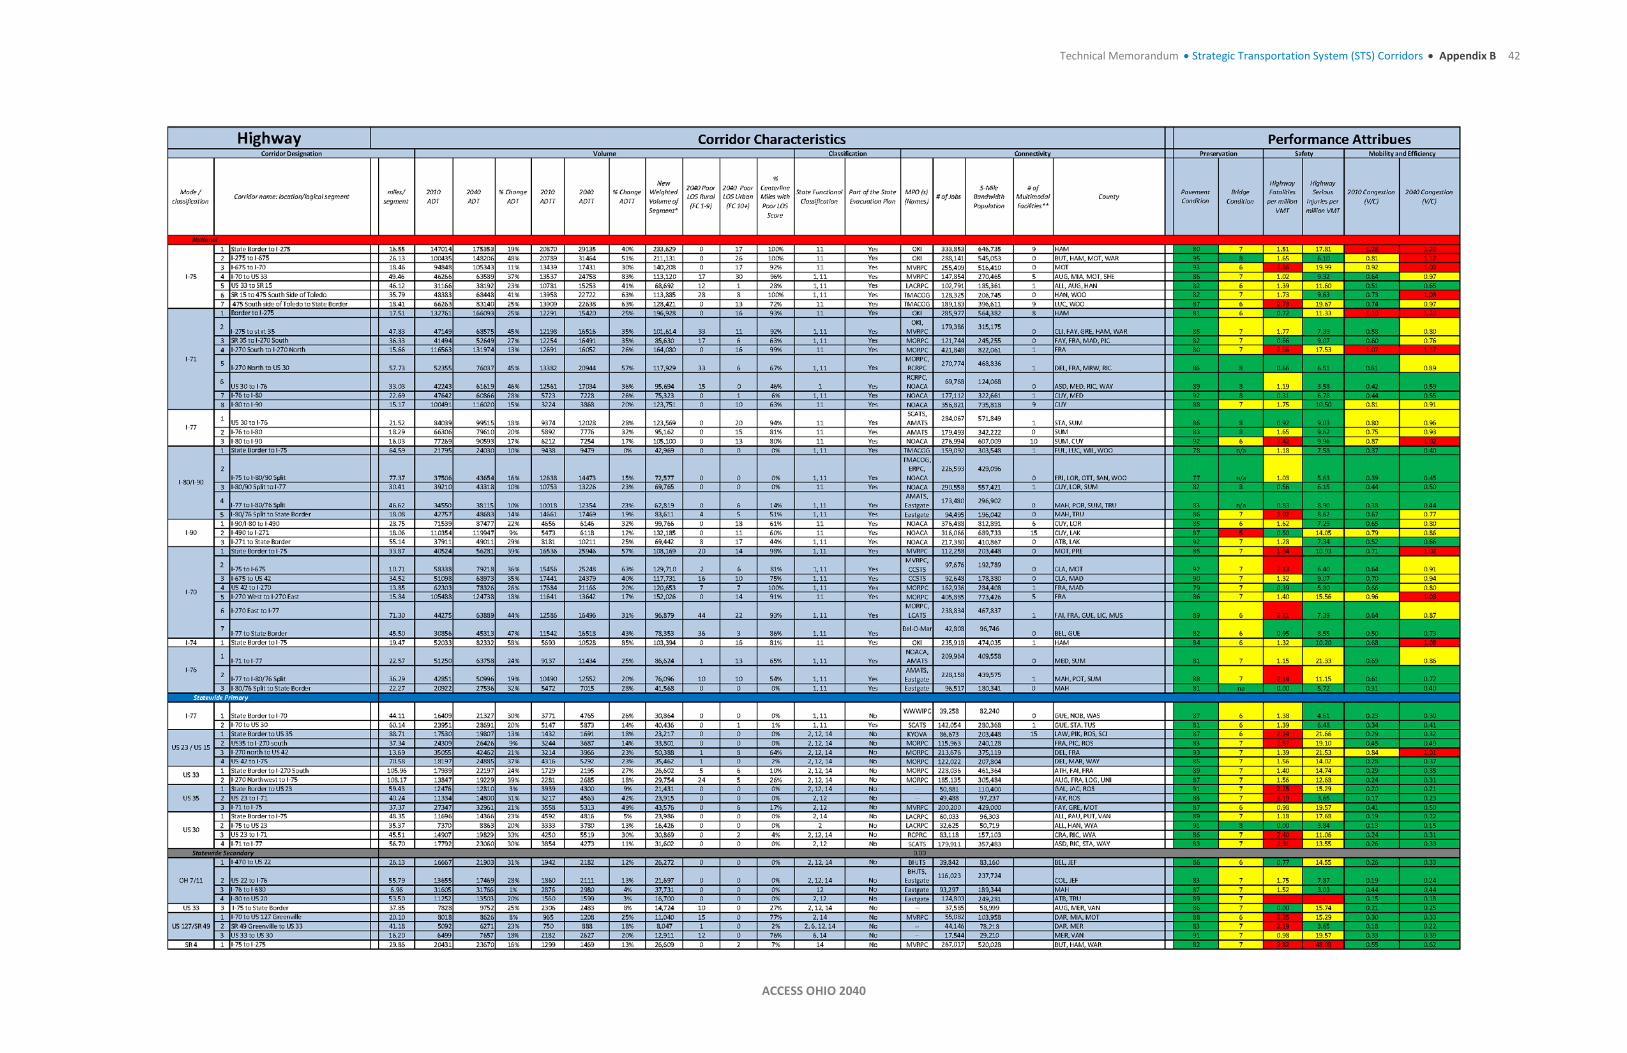
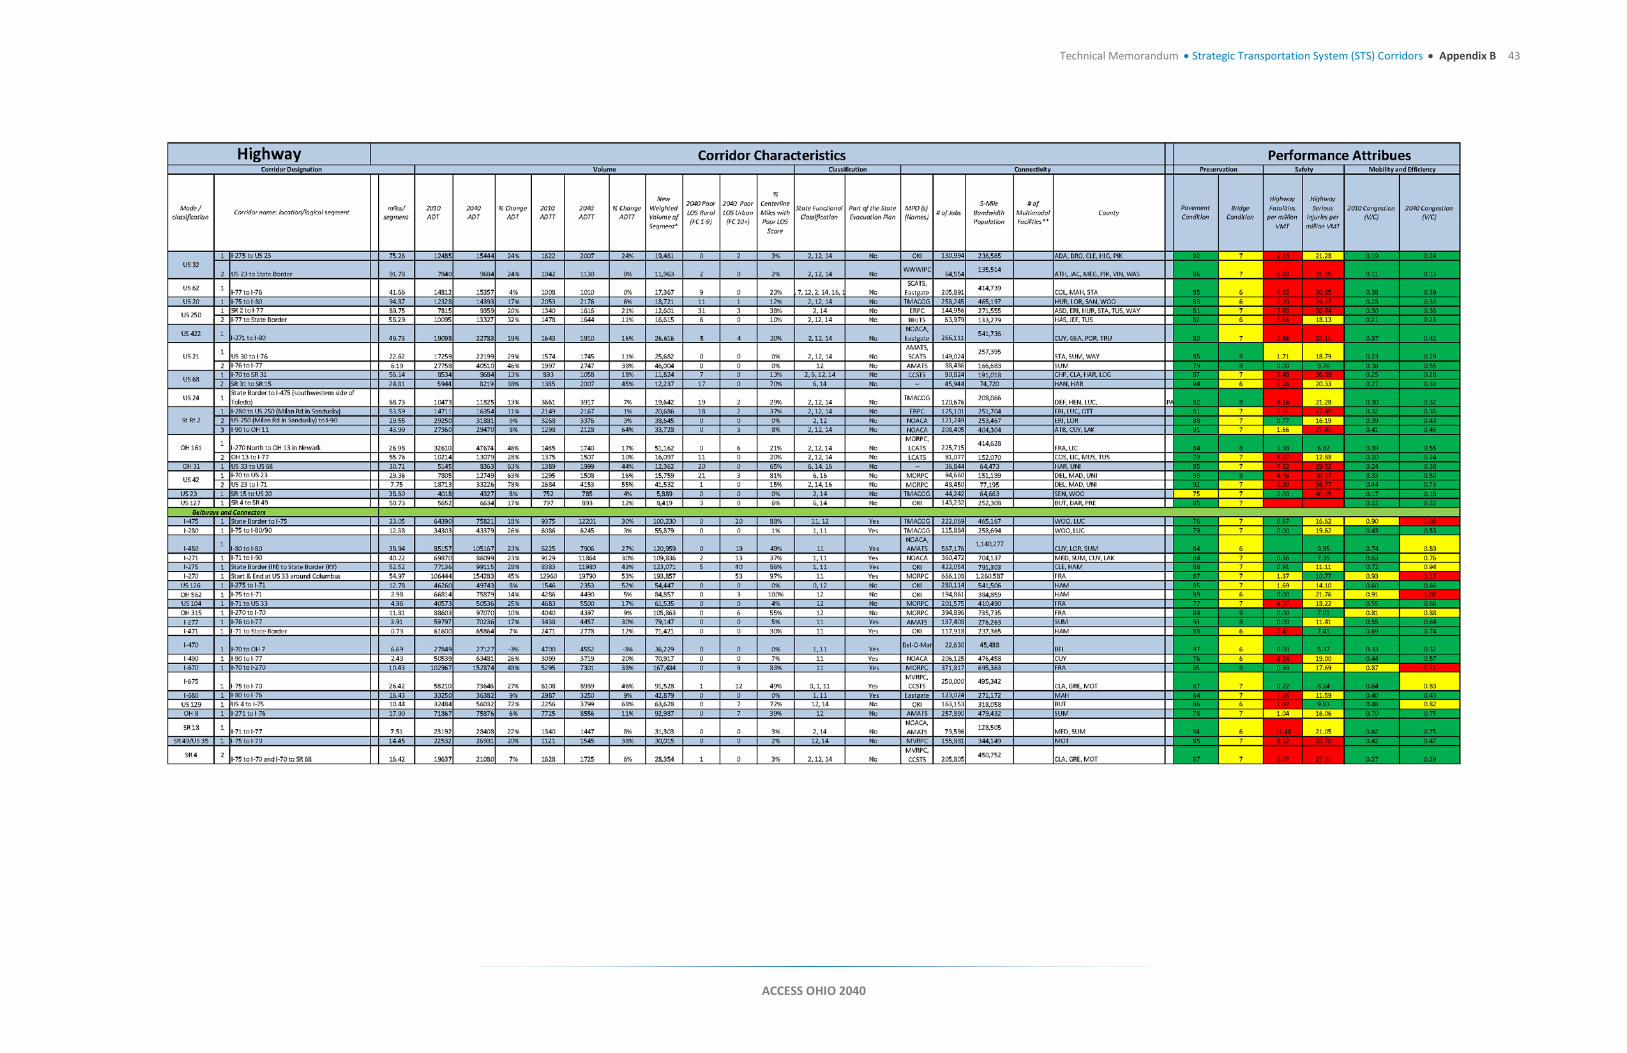
4.1.3 Highway Characteristics 2010 ADT = Year 2010 average daily traffic volumes per segment9
2040 ADT = Year 2040 forecasted average daily traffic volumes using the travel demand model forecast per segment10
% Change ADT = Percent change in average daily traffic between 2010 and 2040 per segment
9 Ohio Statewide Travel Demand Model Congestion Management System 10 Data source for highway characteristics is Ohio Statewide Travel Demand Model Congestion Management System (2040_Corridors_05082013.shp (edited from ODOT shapefile) - unless noted
ACCESS OHIO 2040
Technical Memorandum • Strategic Transportation System (STS) Corridors 20
2010 ADTT = Year 2010 average daily truck traffic volumes per segment (data from 2010 spreadsheet from ODOT traffic counts)
2040 ADTT = Year 2040 forecasted average daily truck traffic using the travel demand model forecast per segment
% Change ADTT = Percent change in average daily truck traffic between 2010 and 2040 per segment
Value of Commodities = Total value of all commodities traveled per segment
% GSP = Percent of the estimated Gross State Product (GSP) within a 5 mile bandwidth of a corridor segment
2040 Weighted Volume = o (2040 projected passenger vehicle volume) + 3 x (2040 projected truck volume) per
segment 2040 Poor LOS Rural (FC 1-9) = Total centerline miles per segment with a 2040 LOS score of
“E” or “F” on rural functional class routes 1 through 9
2040 Poor LOS Urban (FC 10+) = Total centerline miles per segment with a 2040 LOS score of “E” or “F” on urban functional class routes 10 plus
% Centerline Miles with Poor LOS Score = Percent of centerline miles per segment with a 2040 LOS score of “E” or “F” on rural and urban routes
State Functional Classification = Federal functional classification reported as the functional class number and description (FC#-Text description)
State Evacuation Plan = Lists whether or not a corridor segment is part of the State Evacuation Plan. (data from State Emergency Evacuation Plan)
MPO = List of MPO geographies touched by the corridor segment
Number of Jobs = Number of jobs within a 5 mile bandwidth of corridor segment as reported by 2010 census data (data from U.S. Census, tract level)
5-Mile Bandwidth Population = Sum of the population within a 5 mile bandwidth of the corridor, plus the population served by each MPO area touched per segment (data from U.S. Census, tract level)
Number of Multimodal Facilities = Number of Ohio designated intermodal facilities that are located directly on or connect to a statewide corridor. (data from ODOTs Transportation Information Management System)
ACCESS OHIO 2040

Technical Memorandum • Strategic Transportation System (STS) Corridors 21
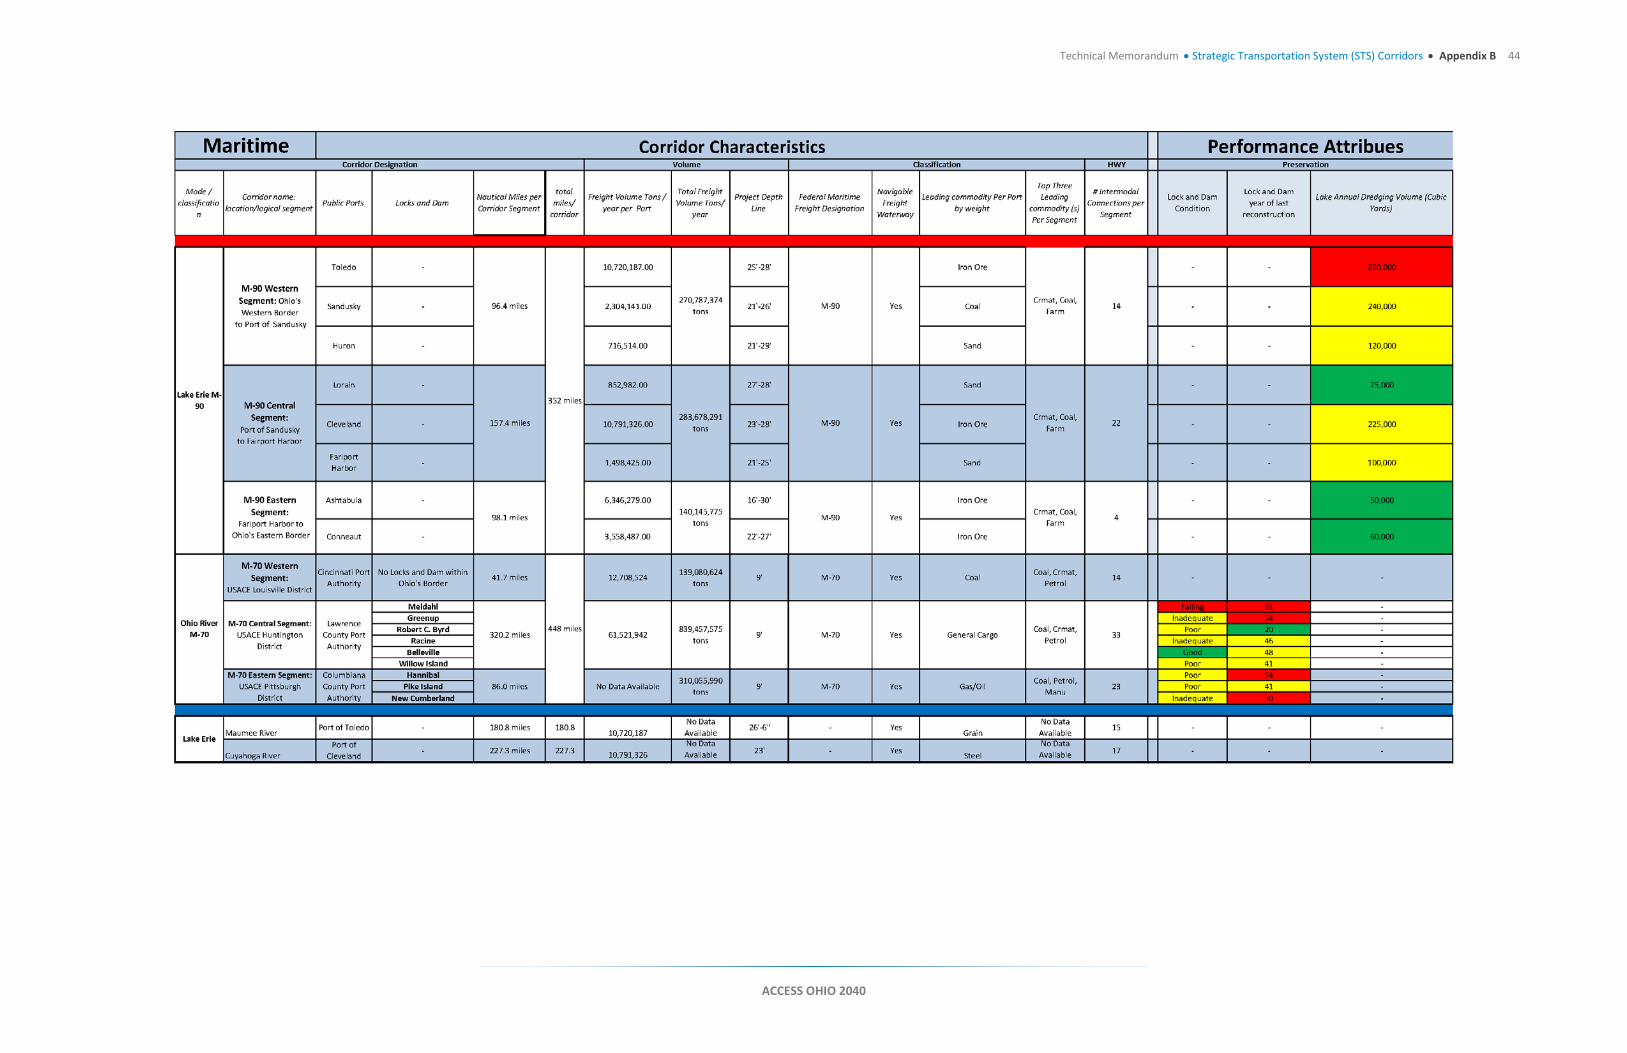
4.1.4 Maritime Characteristics Freight Volume Tons/ Year per Port = Sum of all freight moved per port in tons (data from
ODOT GIS files)
Total Freight Volume Tons/ Year per Segment = Sum of freight moved per segment in tons (data from ODOT GIS files)
Project Depth Line = Average project depth line maintained by the Army Corps of Engineers per corridor segment (ODOT data)
Federal Maritime Freight Designation = Yes or no function determining if the corridor segment is part of the USDOT proposed national freight network (ODOT data)
Navigable Freight Waterway = Lists whether a water way is capable of handling ships up to 740 ft. long and 78 ft. wide. To handle a vessel of this size, a minimal channel depth of 20 ft. is required
Leading commodity Per Port by weight (data from US Army Corp, 2010)
Three Top Leading Commodities per Segment= List the three top commodities per port (data from ODOT GIS files)
# Intermodal Connections per Segment = Number of the intermodal terminals on or within a 2 mile buffer segment of each corridor segment (data from Transportation Information Management System)
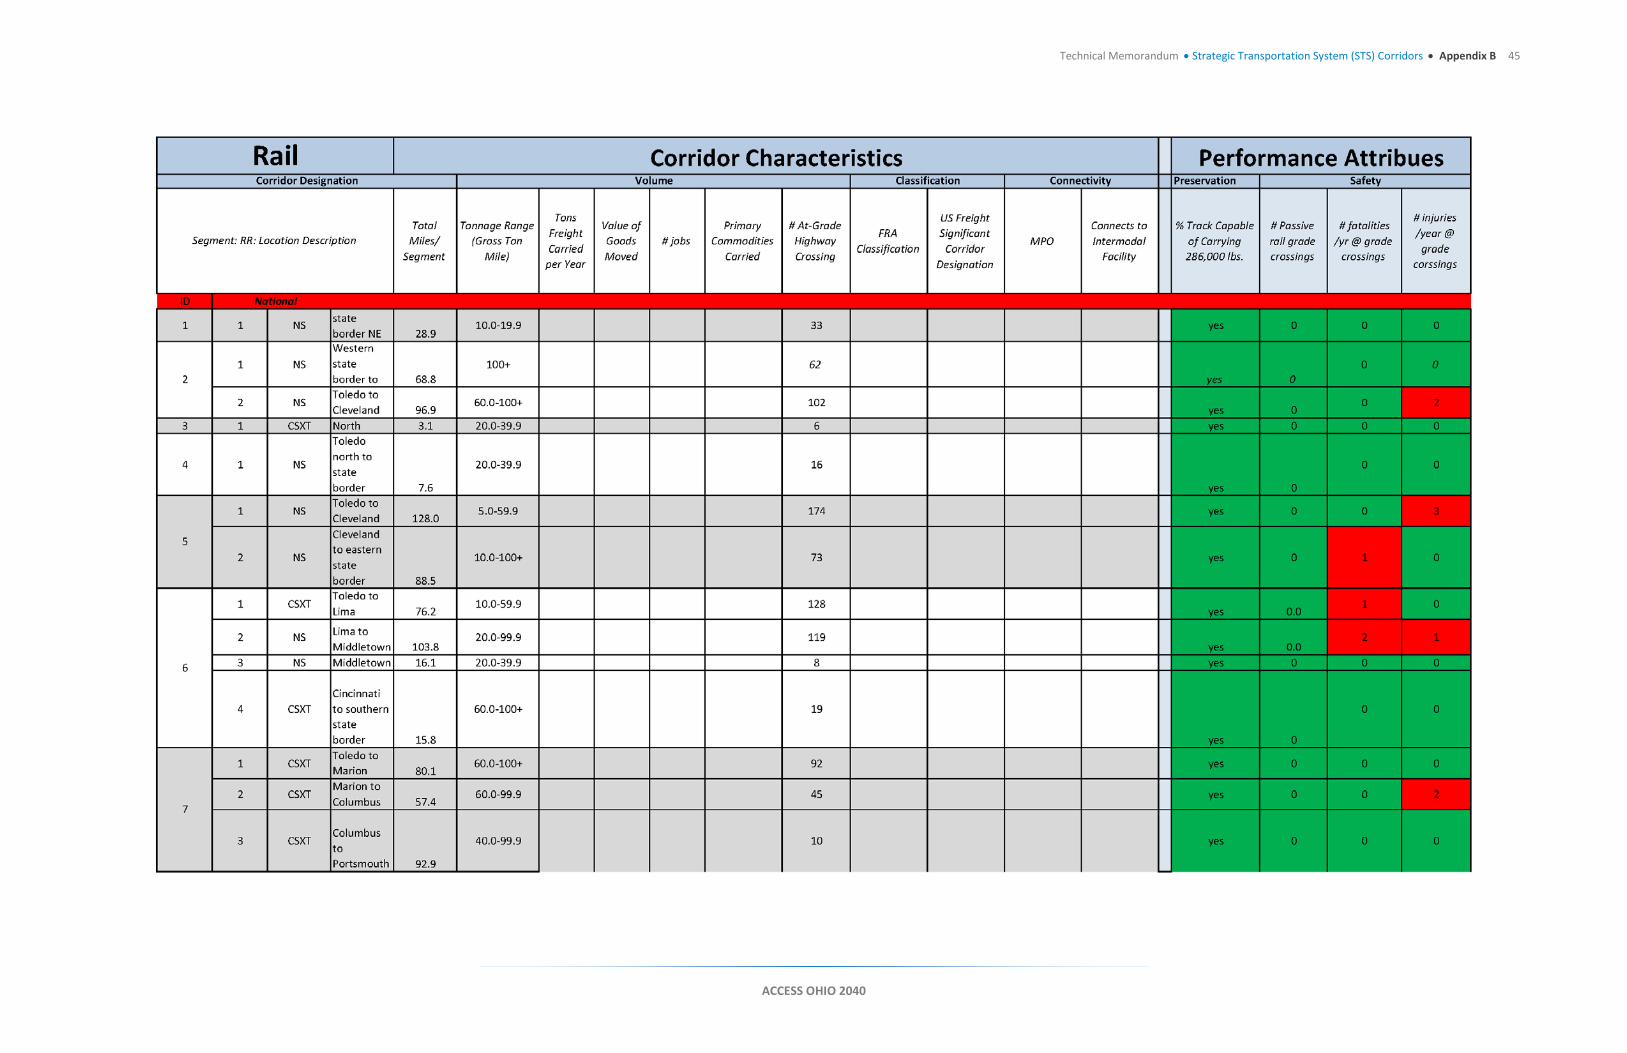
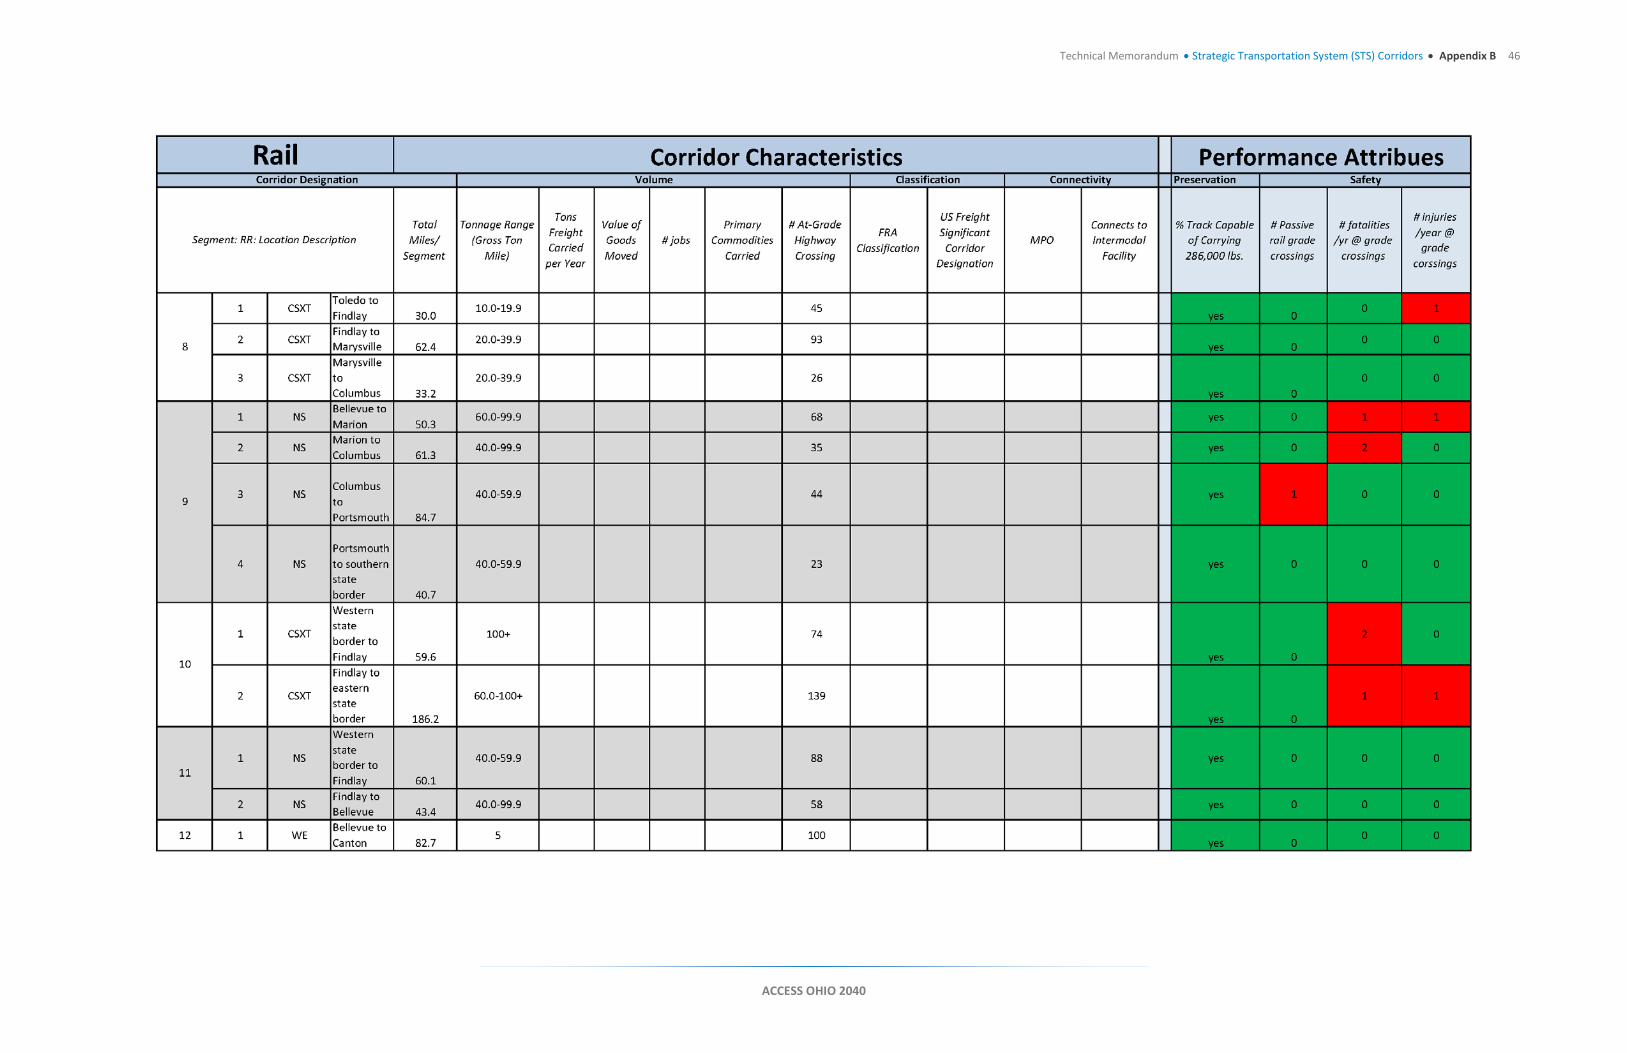
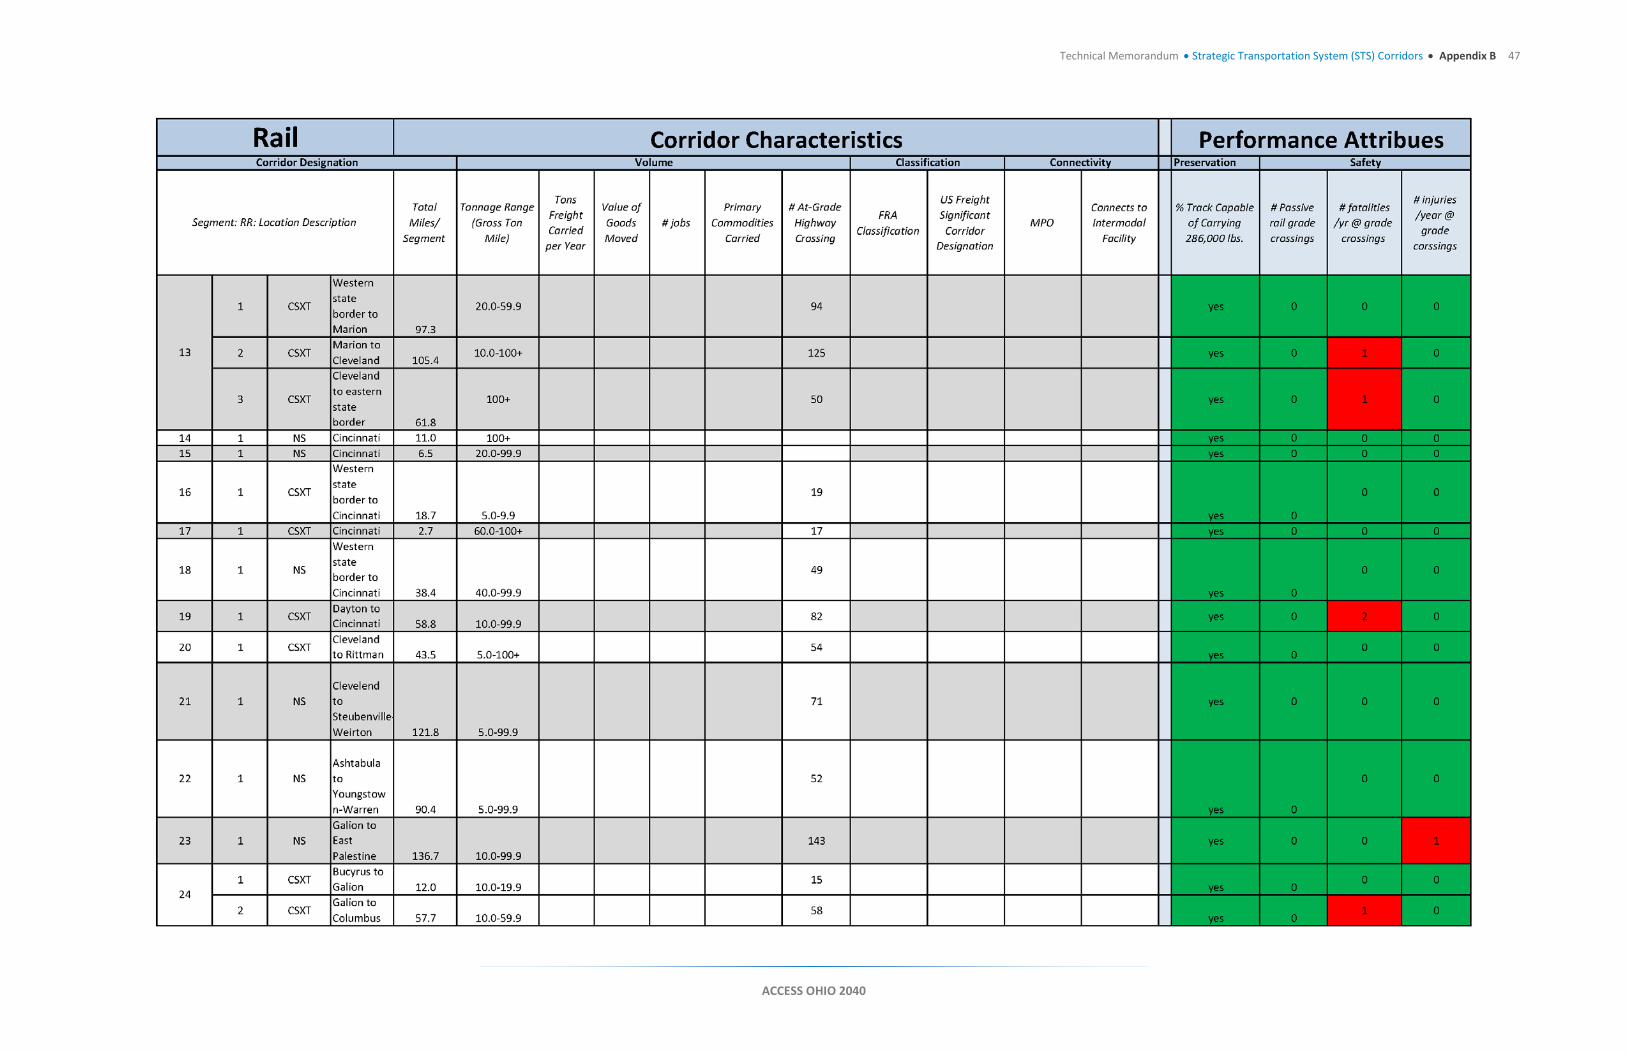
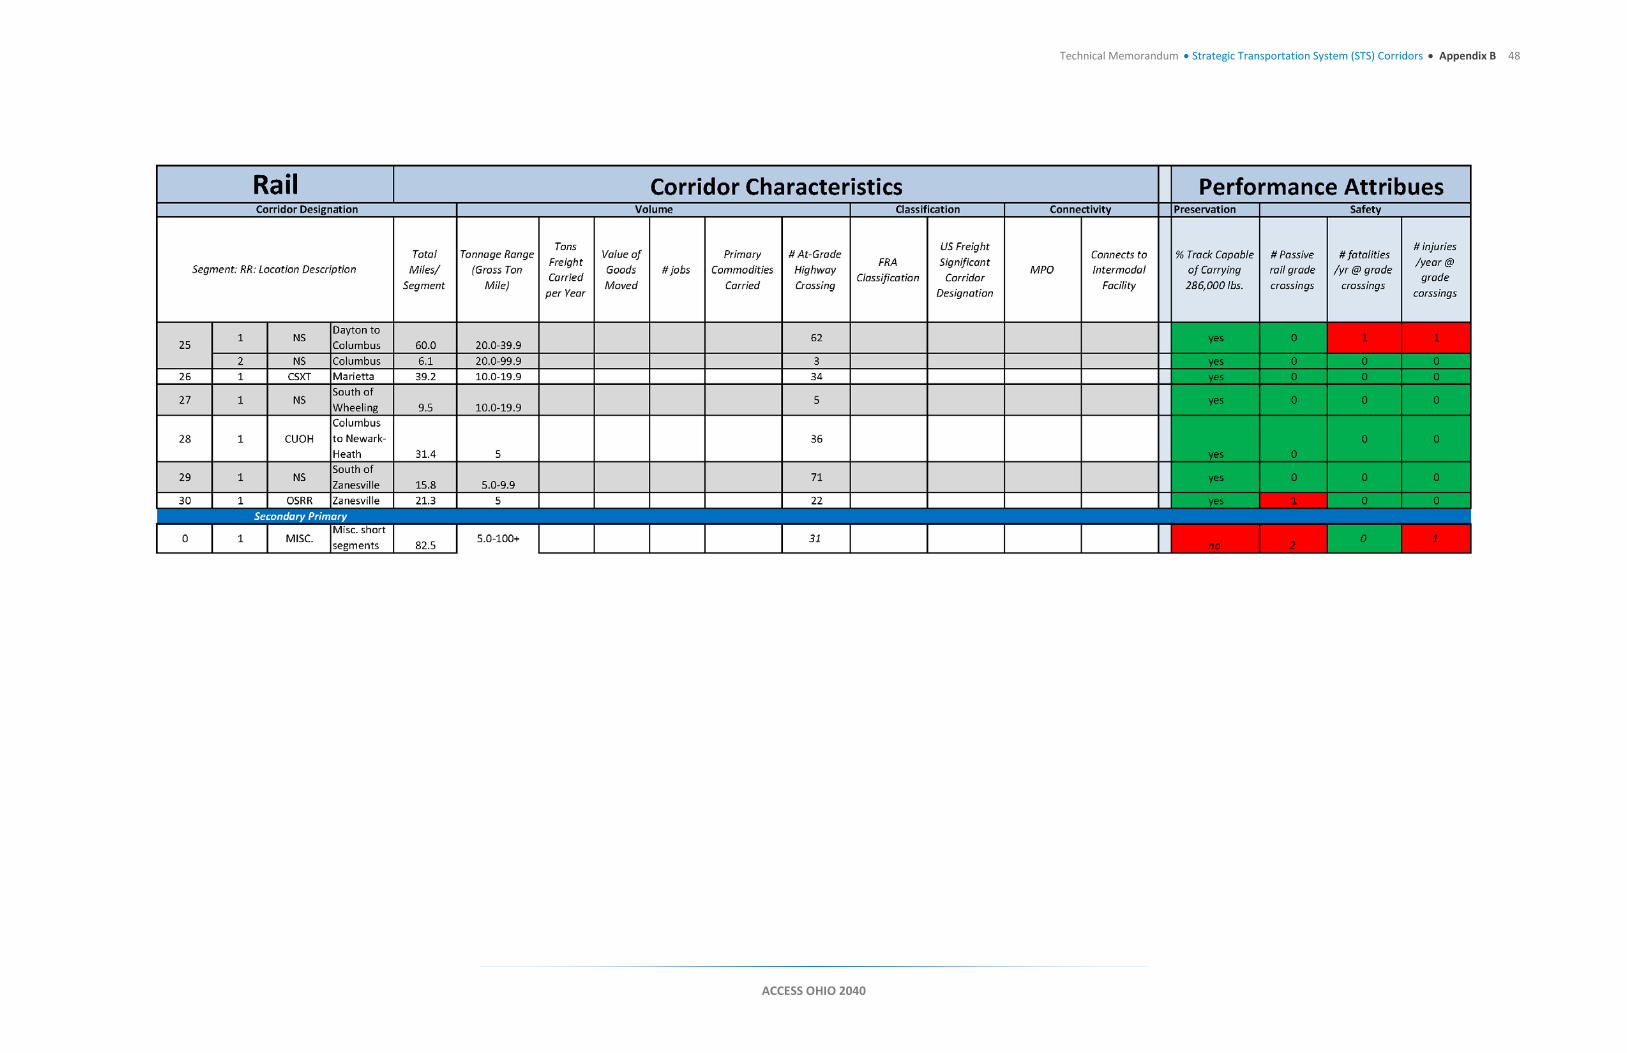
4.1.5 Rail Characteristics Tonnage Range = Annual range of gross ton miles moved per segment
# At-Grade Highway Crossings = Total at-grade crossings per railroad segment that cross the States System. (Data from The Ohio Rail Development Commission)
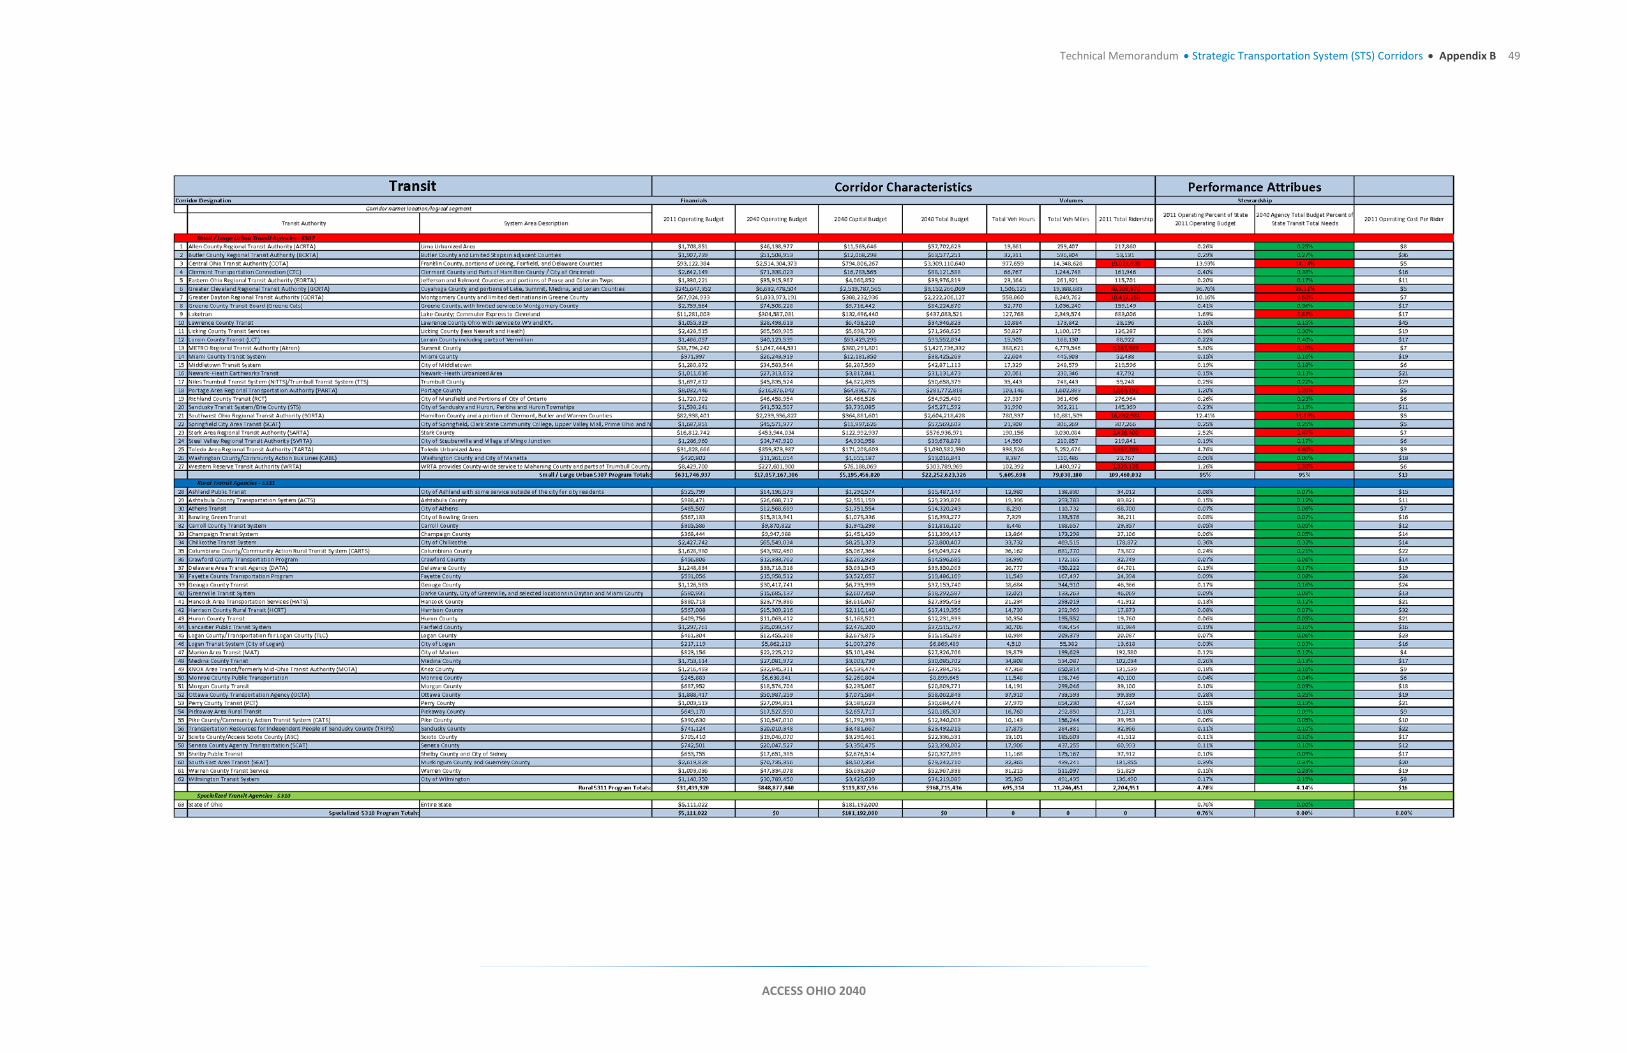
4.1.6 Transit Characteristics 2011 Operating Budget = 2011 operating budget per agency. (data from Access Ohio
Passenger Transportation Existing and Future Conditions)
2040 Operating Budget = 2040 estimated operating budget per agency. (data from Access Ohio Passenger Transportation Existing and Future Conditions)
2040 Capital Budget = 2040 estimated capital budget per agency. (data from Access Ohio Passenger Transportation Existing and Future Conditions)
2040 Total Budget = 2040 estimated operating and capital budget per agency. (data from Access Ohio Passenger Transportation Existing and Future Conditions)
Total Vehicle Hours = Sum of 2011 fixed route and demand response vehicle hours. (data from Access Ohio Passenger Transportation Existing and Future Conditions)
ACCESS OHIO 2040
Technical Memorandum • Strategic Transportation System (STS) Corridors 22
Total Vehicle Miles = Sum of 2011 fixed route and demand response vehicle miles. (data from Access Ohio Passenger Transportation Existing and Future Conditions)
Total Ridership = Sum of 2011 fixed route and demand response total ridership. (data from Access Ohio Passenger Transportation Existing and Future Conditions)
4.2 Corridor Performance Attributes The Corridor performance attributes are geared toward measuring the conditions on each corridor segment relative to their respective goal areas. For example, total crashes on a highway corridor segment are a performance attribute that is used to measure the safety of the corridor. Performance attributes were created only for those goal areas that pertain to infrastructure performance. The attributes provided the quantitative comparative data for the analysis of the performance of each corridor segment. Each attribute received a single score that represents the overall condition of each segment. As stated, three colors are used to identify the priority of needs across each network.
The red indicators are not designed to identify a precise need, rather they identify that further investigation along a segment is necessary to understand the problem. Additionally, program managers can use this as a high level analysis to identify priorities for investment within their respective goal areas.
The following section describes the performance attributes for each transportation mode. These attributes were used to populate the matrices.
4.2.1 Aviation Performance Attributes by Goal Area
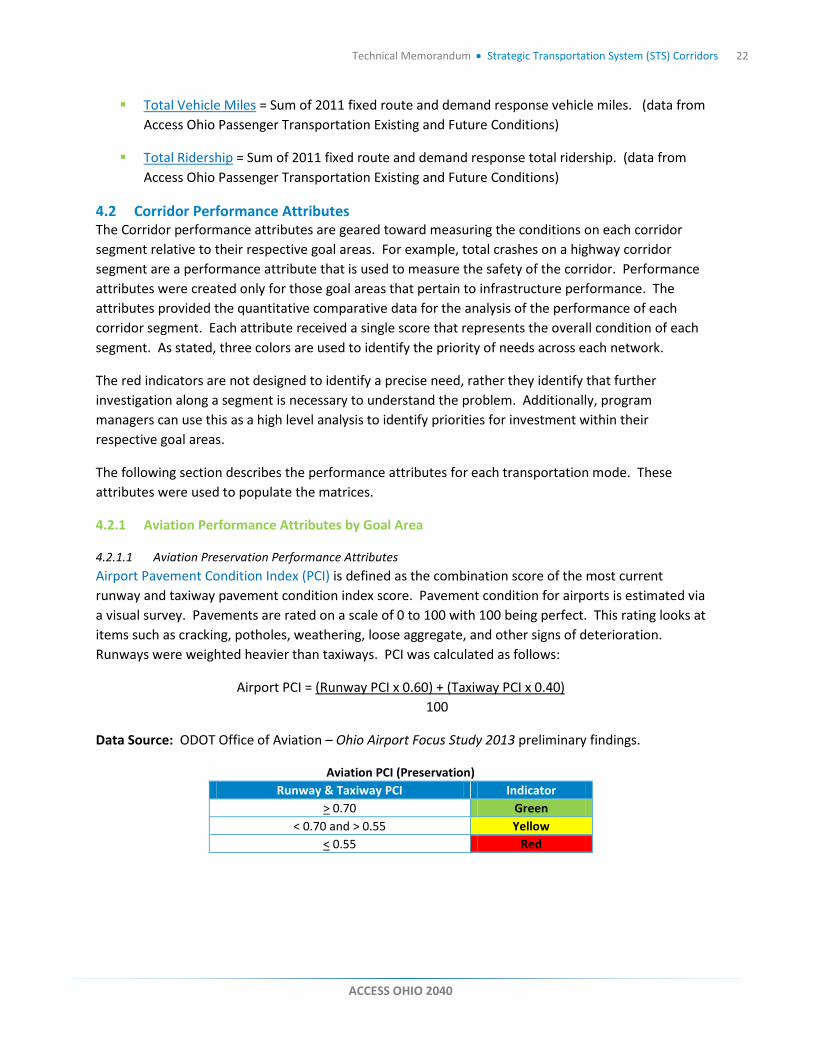
4.2.1.1 Aviation Preservation Performance Attributes Airport Pavement Condition Index (PCI) is defined as the combination score of the most current runway and taxiway pavement condition index score. Pavement condition for airports is estimated via a visual survey. Pavements are rated on a scale of 0 to 100 with 100 being perfect. This rating looks at items such as cracking, potholes, weathering, loose aggregate, and other signs of deterioration. Runways were weighted heavier than taxiways. PCI was calculated as follows:
Airport PCI = (Runway PCI x 0.60) + (Taxiway PCI x 0.40) 100
Data Source: ODOT Office of Aviation – Ohio Airport Focus Study 2013 preliminary findings.
Aviation PCI (Preservation) Runway & Taxiway PCI Indicator
> 0.70 Green < 0.70 and > 0.55 Yellow
< 0.55 Red
ACCESS OHIO 2040
Technical Memorandum • Strategic Transportation System (STS) Corridors 23
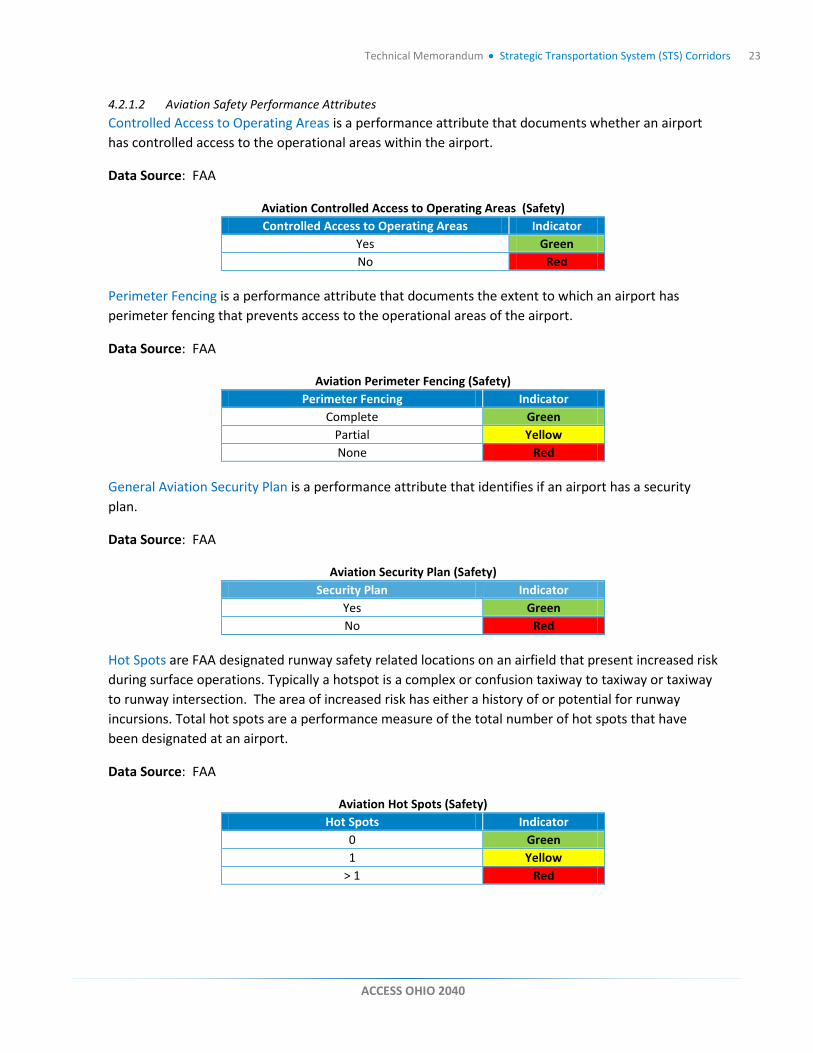
4.2.1.2 Aviation Safety Performance Attributes Controlled Access to Operating Areas is a performance attribute that documents whether an airport has controlled access to the operational areas within the airport.
Data Source: FAA
Aviation Controlled Access to Operating Areas (Safety) Controlled Access to Operating Areas Indicator
Yes Green No Red
Perimeter Fencing is a performance attribute that documents the extent to which an airport has perimeter fencing that prevents access to the operational areas of the airport.
Data Source: FAA
Aviation Perimeter Fencing (Safety) Perimeter Fencing Indicator
Complete Green Partial Yellow None Red
General Aviation Security Plan is a performance attribute that identifies if an airport has a security plan.
Data Source: FAA
Aviation Security Plan (Safety) Security Plan Indicator
Yes Green No Red
Hot Spots are FAA designated runway safety related locations on an airfield that present increased risk during surface operations. Typically a hotspot is a complex or confusion taxiway to taxiway or taxiway to runway intersection. The area of increased risk has either a history of or potential for runway incursions. Total hot spots are a performance measure of the total number of hot spots that have been designated at an airport.
Data Source: FAA
Aviation Hot Spots (Safety) Hot Spots Indicator
0 Green 1 Yellow
> 1 Red
ACCESS OHIO 2040
Technical Memorandum • Strategic Transportation System (STS) Corridors 24
4.2.1.3 Aviation Performance Attributes Summary
Aviation Performance Attribute Summary Goal Area Indicator
Preservation Safety PCI Control Access Perimeter Fencing Security Plan Hot spots
Green > 0.70 Yes Complete Yes 0 Yellow < 0.70 and > 0.55 - Partial - 1
Red < 0.55 No None No >1
4.2.2 Bike Performance Attributes
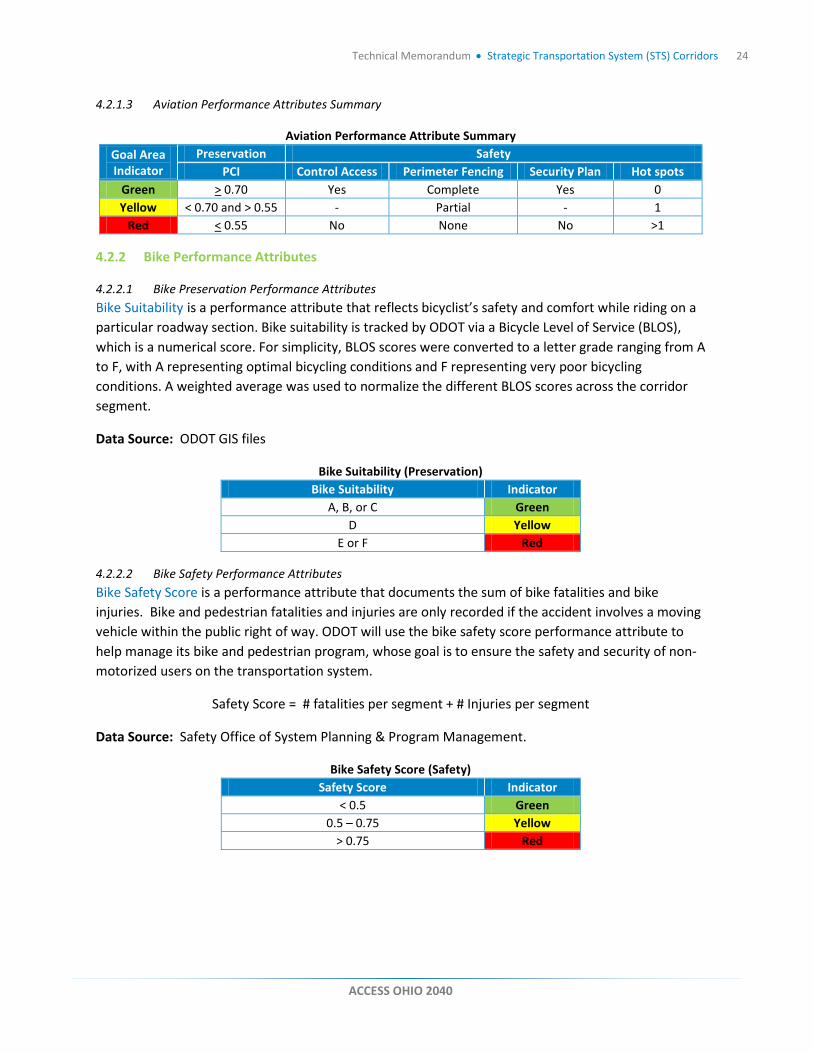
4.2.2.1 Bike Preservation Performance Attributes Bike Suitability is a performance attribute that reflects bicyclist’s safety and comfort while riding on a particular roadway section. Bike suitability is tracked by ODOT via a Bicycle Level of Service (BLOS), which is a numerical score. For simplicity, BLOS scores were converted to a letter grade ranging from A to F, with A representing optimal bicycling conditions and F representing very poor bicycling conditions. A weighted average was used to normalize the different BLOS scores across the corridor segment.
Data Source: ODOT GIS files
Bike Suitability (Preservation) Bike Suitability Indicator
A, B, or C Green D Yellow
E or F Red
4.2.2.2 Bike Safety Performance Attributes Bike Safety Score is a performance attribute that documents the sum of bike fatalities and bike injuries. Bike and pedestrian fatalities and injuries are only recorded if the accident involves a moving vehicle within the public right of way. ODOT will use the bike safety score performance attribute to help manage its bike and pedestrian program, whose goal is to ensure the safety and security of non-motorized users on the transportation system.
Safety Score = # fatalities per segment + # Injuries per segment
Data Source: Safety Office of System Planning & Program Management.
Bike Safety Score (Safety) Safety Score Indicator
< 0.5 Green 0.5 – 0.75 Yellow
> 0.75 Red
ACCESS OHIO 2040
Technical Memorandum • Strategic Transportation System (STS) Corridors 25
4.2.2.3 Bike Performance Attributes Summary
Bike Performance Attribute Summary Goal Area Preservation Safety Indicator Bike Suitability Safety Score
Green A, B, or C < 0.5 Yellow D 0.5 – 0.75
Red E or F > 0.75
4.2.3 Highway Performance Attributes
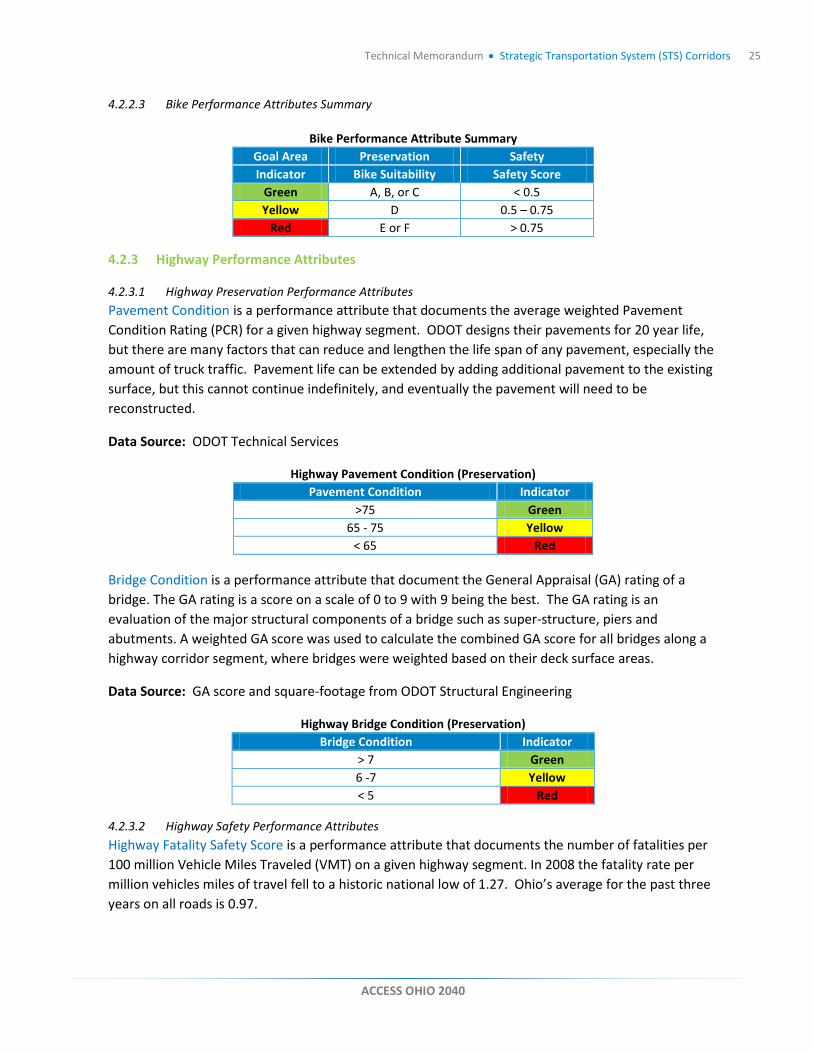
4.2.3.1 Highway Preservation Performance Attributes Pavement Condition is a performance attribute that documents the average weighted Pavement Condition Rating (PCR) for a given highway segment. ODOT designs their pavements for 20 year life, but there are many factors that can reduce and lengthen the life span of any pavement, especially the amount of truck traffic. Pavement life can be extended by adding additional pavement to the existing surface, but this cannot continue indefinitely, and eventually the pavement will need to be reconstructed.
Data Source: ODOT Technical Services
Highway Pavement Condition (Preservation) Pavement Condition Indicator
>75 Green 65 - 75 Yellow
< 65 Red
Bridge Condition is a performance attribute that document the General Appraisal (GA) rating of a bridge. The GA rating is a score on a scale of 0 to 9 with 9 being the best. The GA rating is an evaluation of the major structural components of a bridge such as super-structure, piers and abutments. A weighted GA score was used to calculate the combined GA score for all bridges along a highway corridor segment, where bridges were weighted based on their deck surface areas.
Data Source: GA score and square-footage from ODOT Structural Engineering
Highway Bridge Condition (Preservation) Bridge Condition Indicator
> 7 Green 6 -7 Yellow < 5 Red
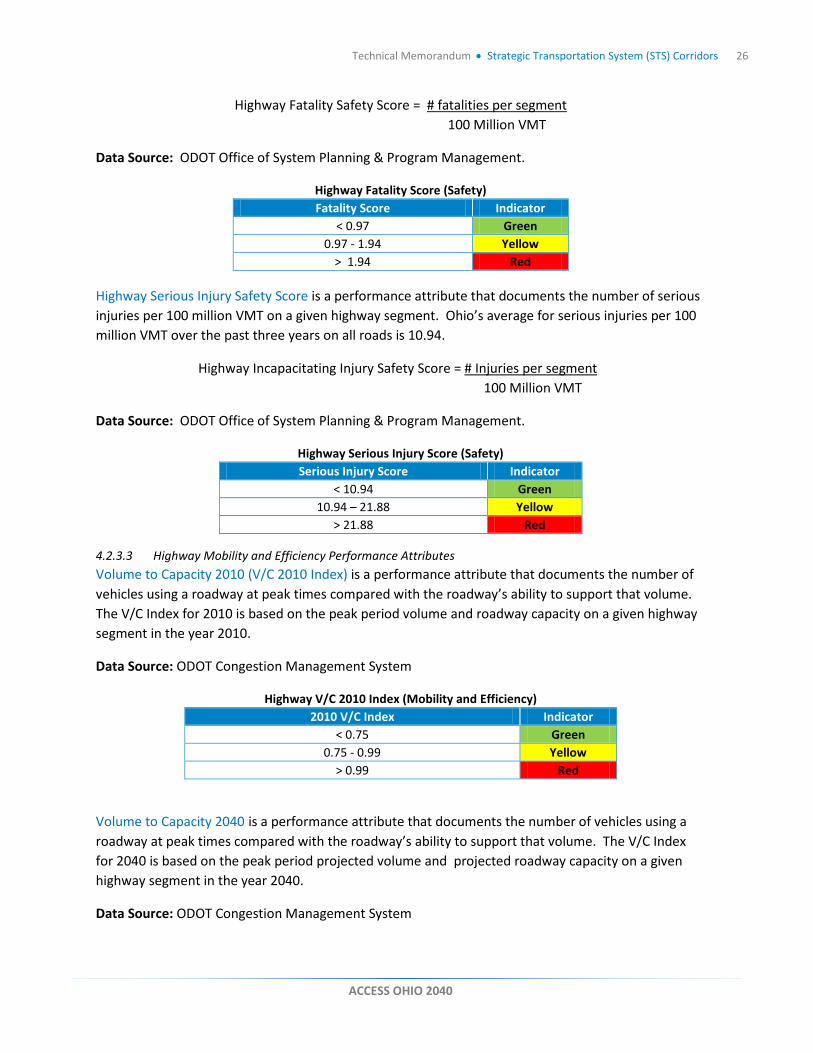
4.2.3.2 Highway Safety Performance Attributes Highway Fatality Safety Score is a performance attribute that documents the number of fatalities per 100 million Vehicle Miles Traveled (VMT) on a given highway segment. In 2008 the fatality rate per million vehicles miles of travel fell to a historic national low of 1.27. Ohio’s average for the past three years on all roads is 0.97.
ACCESS OHIO 2040
Technical Memorandum • Strategic Transportation System (STS) Corridors 26
Highway Fatality Safety Score = # fatalities per segment 100 Million VMT
Data Source: ODOT Office of System Planning & Program Management.
Highway Fatality Score (Safety) Fatality Score Indicator
< 0.97 Green 0.97 - 1.94 Yellow
> 1.94 Red
Highway Serious Injury Safety Score is a performance attribute that documents the number of serious injuries per 100 million VMT on a given highway segment. Ohio’s average for serious injuries per 100 million VMT over the past three years on all roads is 10.94.
Highway Incapacitating Injury Safety Score = # Injuries per segment 100 Million VMT
Data Source: ODOT Office of System Planning & Program Management.
Highway Serious Injury Score (Safety) Serious Injury Score Indicator
< 10.94 Green 10.94 – 21.88 Yellow
> 21.88 Red
4.2.3.3 Highway Mobility and Efficiency Performance Attributes Volume to Capacity 2010 (V/C 2010 Index) is a performance attribute that documents the number of vehicles using a roadway at peak times compared with the roadway’s ability to support that volume. The V/C Index for 2010 is based on the peak period volume and roadway capacity on a given highway segment in the year 2010.
Data Source: ODOT Congestion Management System
Highway V/C 2010 Index (Mobility and Efficiency) 2010 V/C Index Indicator
< 0.75 Green 0.75 - 0.99 Yellow
> 0.99 Red
Volume to Capacity 2040 is a performance attribute that documents the number of vehicles using a roadway at peak times compared with the roadway’s ability to support that volume. The V/C Index for 2040 is based on the peak period projected volume and projected roadway capacity on a given highway segment in the year 2040.
Data Source: ODOT Congestion Management System
ACCESS OHIO 2040
Technical Memorandum • Strategic Transportation System (STS) Corridors 27
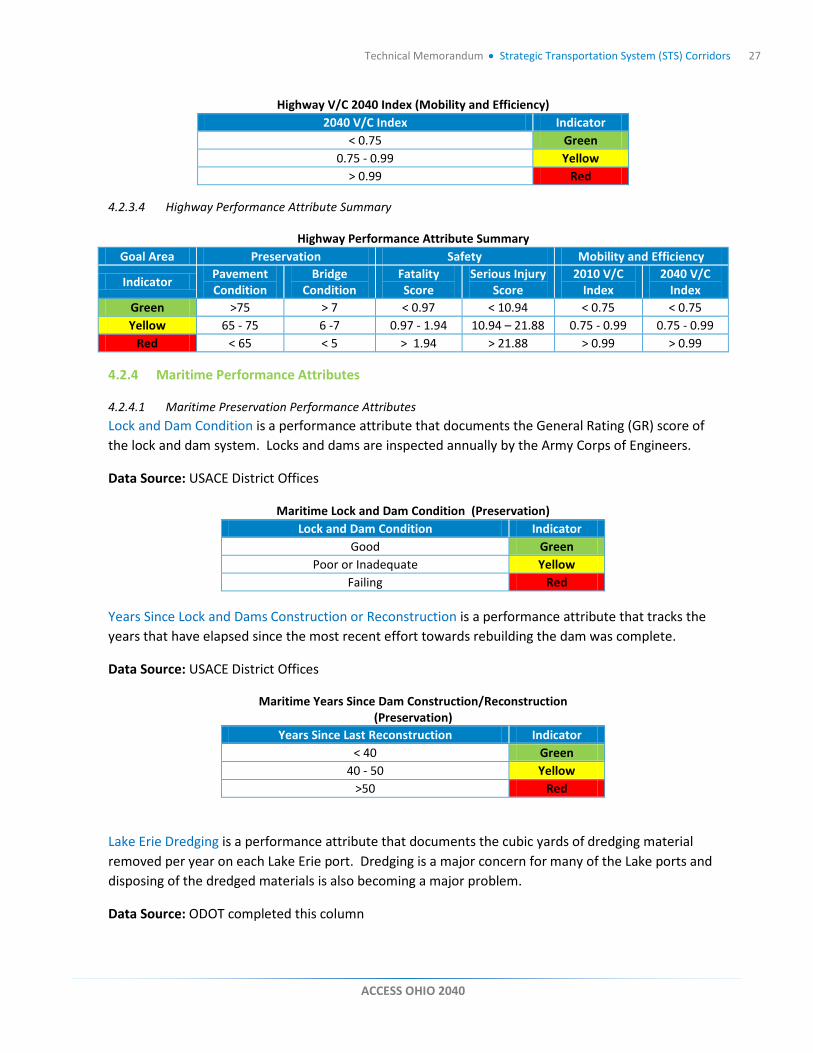
Highway V/C 2040 Index (Mobility and Efficiency) 2040 V/C Index Indicator
< 0.75 Green 0.75 - 0.99 Yellow
> 0.99 Red
4.2.3.4 Highway Performance Attribute Summary
Highway Performance Attribute Summary Goal Area Preservation Safety Mobility and Efficiency
Indicator Pavement Condition
Bridge Condition
Fatality Score
Serious Injury Score
2010 V/C Index
2040 V/C Index
Green >75 > 7 < 0.97 < 10.94 < 0.75 < 0.75 Yellow 65 - 75 6 -7 0.97 - 1.94 10.94 – 21.88 0.75 - 0.99 0.75 - 0.99
Red < 65 < 5 > 1.94 > 21.88 > 0.99 > 0.99
4.2.4 Maritime Performance Attributes
4.2.4.1 Maritime Preservation Performance Attributes Lock and Dam Condition is a performance attribute that documents the General Rating (GR) score of the lock and dam system. Locks and dams are inspected annually by the Army Corps of Engineers.
Data Source: USACE District Offices
Maritime Lock and Dam Condition (Preservation) Lock and Dam Condition Indicator
Good Green Poor or Inadequate Yellow
Failing Red
Years Since Lock and Dams Construction or Reconstruction is a performance attribute that tracks the years that have elapsed since the most recent effort towards rebuilding the dam was complete.
Data Source: USACE District Offices
Maritime Years Since Dam Construction/Reconstruction (Preservation)
Years Since Last Reconstruction Indicator < 40 Green
40 - 50 Yellow >50 Red
Lake Erie Dredging is a performance attribute that documents the cubic yards of dredging material removed per year on each Lake Erie port. Dredging is a major concern for many of the Lake ports and disposing of the dredged materials is also becoming a major problem.
Data Source: ODOT completed this column
ACCESS OHIO 2040
Technical Memorandum • Strategic Transportation System (STS) Corridors 28
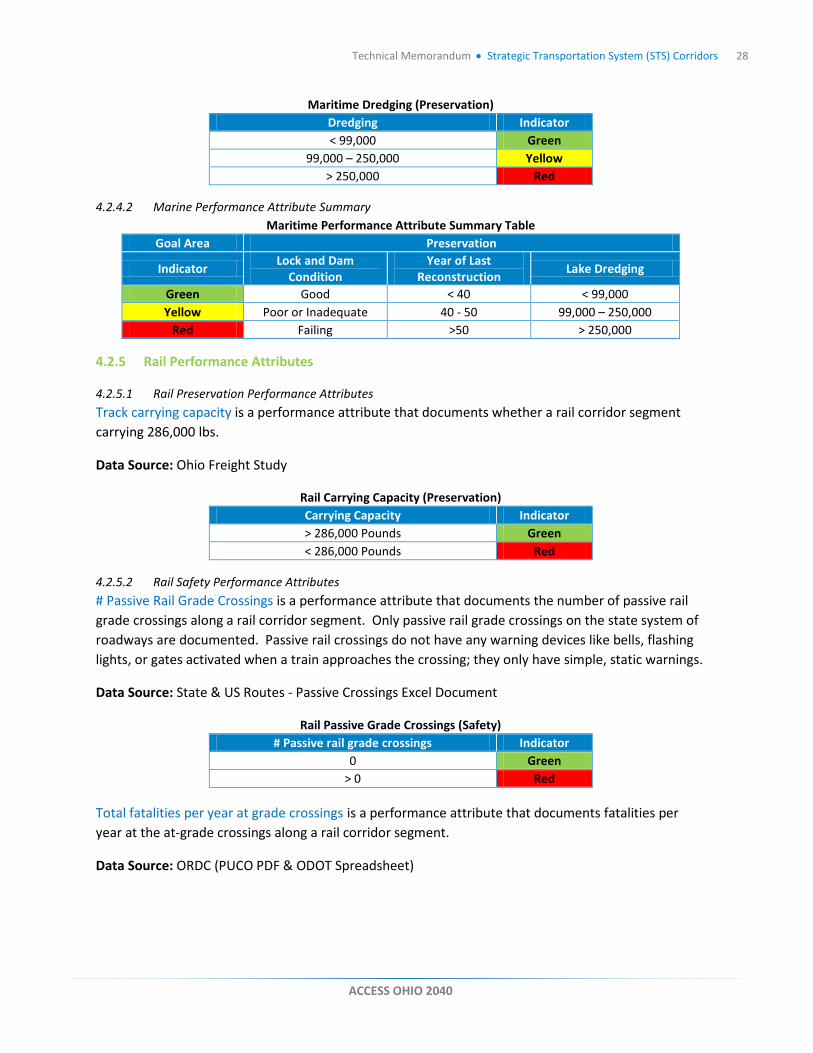
Maritime Dredging (Preservation) Dredging Indicator < 99,000 Green
99,000 – 250,000 Yellow > 250,000 Red
4.2.4.2 Marine Performance Attribute Summary Maritime Performance Attribute Summary Table
Goal Area Preservation
Indicator Lock and Dam Condition
Year of Last Reconstruction Lake Dredging
Green Good < 40 < 99,000 Yellow Poor or Inadequate 40 - 50 99,000 – 250,000
Red Failing >50 > 250,000
4.2.5 Rail Performance Attributes
4.2.5.1 Rail Preservation Performance Attributes Track carrying capacity is a performance attribute that documents whether a rail corridor segment carrying 286,000 lbs.
Data Source: Ohio Freight Study
Rail Carrying Capacity (Preservation) Carrying Capacity Indicator > 286,000 Pounds Green < 286,000 Pounds Red
4.2.5.2 Rail Safety Performance Attributes # Passive Rail Grade Crossings is a performance attribute that documents the number of passive rail grade crossings along a rail corridor segment. Only passive rail grade crossings on the state system of roadways are documented. Passive rail crossings do not have any warning devices like bells, flashing lights, or gates activated when a train approaches the crossing; they only have simple, static warnings.
Data Source: State & US Routes - Passive Crossings Excel Document
Rail Passive Grade Crossings (Safety) # Passive rail grade crossings Indicator
0 Green > 0 Red
Total fatalities per year at grade crossings is a performance attribute that documents fatalities per year at the at-grade crossings along a rail corridor segment.
Data Source: ORDC (PUCO PDF & ODOT Spreadsheet)
ACCESS OHIO 2040
Technical Memorandum • Strategic Transportation System (STS) Corridors 29
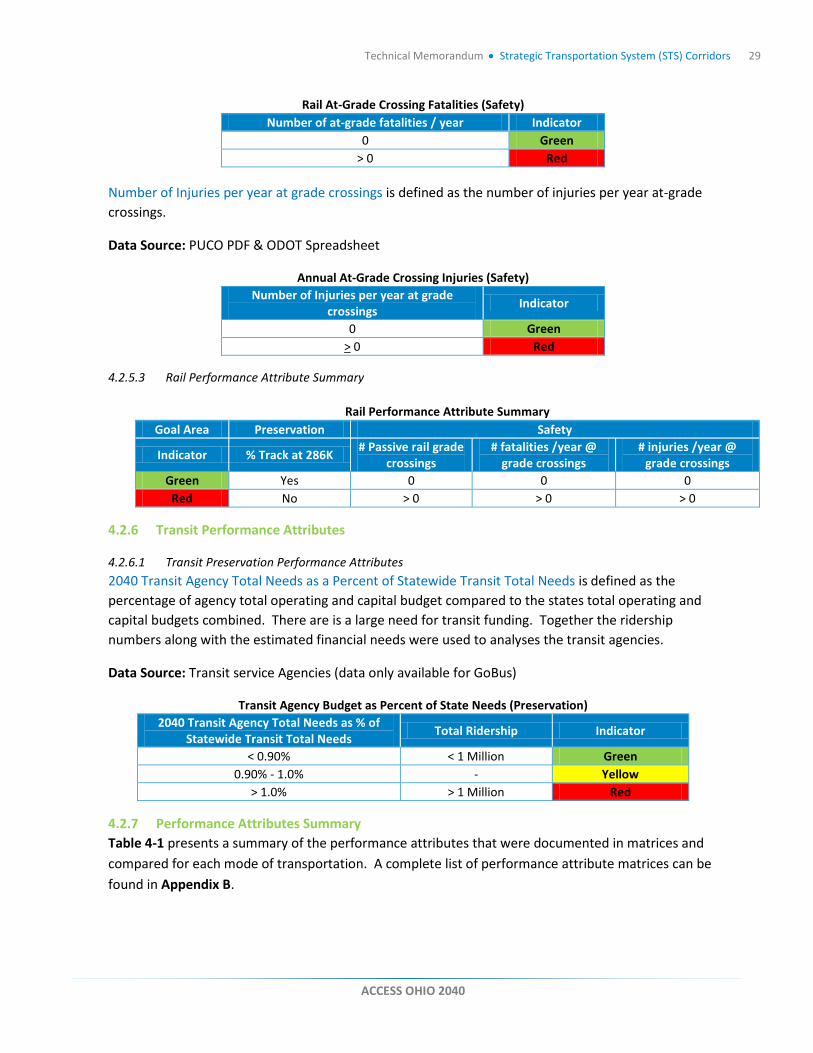
Rail At-Grade Crossing Fatalities (Safety) Number of at-grade fatalities / year Indicator
0 Green > 0 Red
Number of Injuries per year at grade crossings is defined as the number of injuries per year at-grade crossings.
Data Source: PUCO PDF & ODOT Spreadsheet
Annual At-Grade Crossing Injuries (Safety) Number of Injuries per year at grade
crossings Indicator
0 Green > 0 Red
4.2.5.3 Rail Performance Attribute Summary
Rail Performance Attribute Summary Goal Area Preservation Safety
Indicator % Track at 286K # Passive rail grade crossings
# fatalities /year @ grade crossings
# injuries /year @ grade crossings
Green Yes 0 0 0 Red No > 0 > 0 > 0
4.2.6 Transit Performance Attributes
4.2.6.1 Transit Preservation Performance Attributes 2040 Transit Agency Total Needs as a Percent of Statewide Transit Total Needs is defined as the percentage of agency total operating and capital budget compared to the states total operating and capital budgets combined. There are is a large need for transit funding. Together the ridership numbers along with the estimated financial needs were used to analyses the transit agencies.
Data Source: Transit service Agencies (data only available for GoBus)
Transit Agency Budget as Percent of State Needs (Preservation) 2040 Transit Agency Total Needs as % of
Statewide Transit Total Needs Total Ridership Indicator
< 0.90% < 1 Million Green 0.90% - 1.0% - Yellow
> 1.0% > 1 Million Red
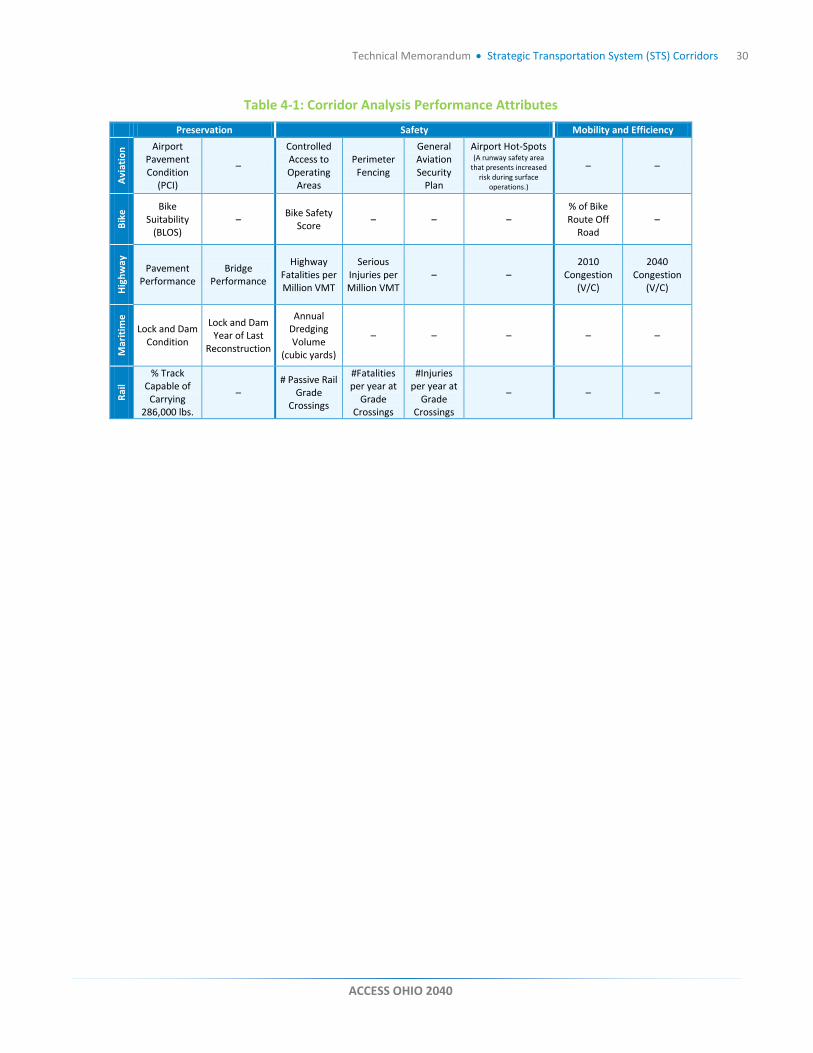
4.2.7 Performance Attributes Summary Table 4-1 presents a summary of the performance attributes that were documented in matrices and compared for each mode of transportation. A complete list of performance attribute matrices can be found in Appendix B.
ACCESS OHIO 2040
Technical Memorandum • Strategic Transportation System (STS) Corridors 30
Table 4-1: Corridor Analysis Performance Attributes
Preservation Safety Mobility and Efficiency Av
iatio
n Airport Pavement Condition
(PCI)
–
Controlled Access to Operating
Areas
Perimeter Fencing
General Aviation Security
Plan
Airport Hot-Spots (A runway safety area
that presents increased risk during surface
operations.)
– –
Bike
Bike Suitability
(BLOS) – Bike Safety
Score – – – % of Bike Route Off
Road –
High
way
Pavement Performance
Bridge Performance
Highway Fatalities per Million VMT
Serious Injuries per Million VMT
– – 2010
Congestion (V/C)
2040 Congestion
(V/C)
Mar
itim
e
Lock and Dam Condition
Lock and Dam Year of Last
Reconstruction
Annual Dredging Volume
(cubic yards)
– – – – –
Rail
% Track Capable of
Carrying 286,000 lbs.
– # Passive Rail
Grade Crossings
#Fatalities per year at
Grade Crossings
#Injuries per year at
Grade Crossings
– – –
ACCESS OHIO 2040
31
5. REGIONAL TRANSPORTATION NEEDS (RTN) From a statewide corridor perspective, ODOT is responsible for:
Addressing continuity gaps, and missing or congested segments in the transportation system;
Removing transportation barriers to economic vitality, and ensuring its transportation strategies help existing businesses grow;
Attracting new businesses and jobs, while avoiding a transportation system imbalance that results in businesses merely relocating or shifting locations within the state.
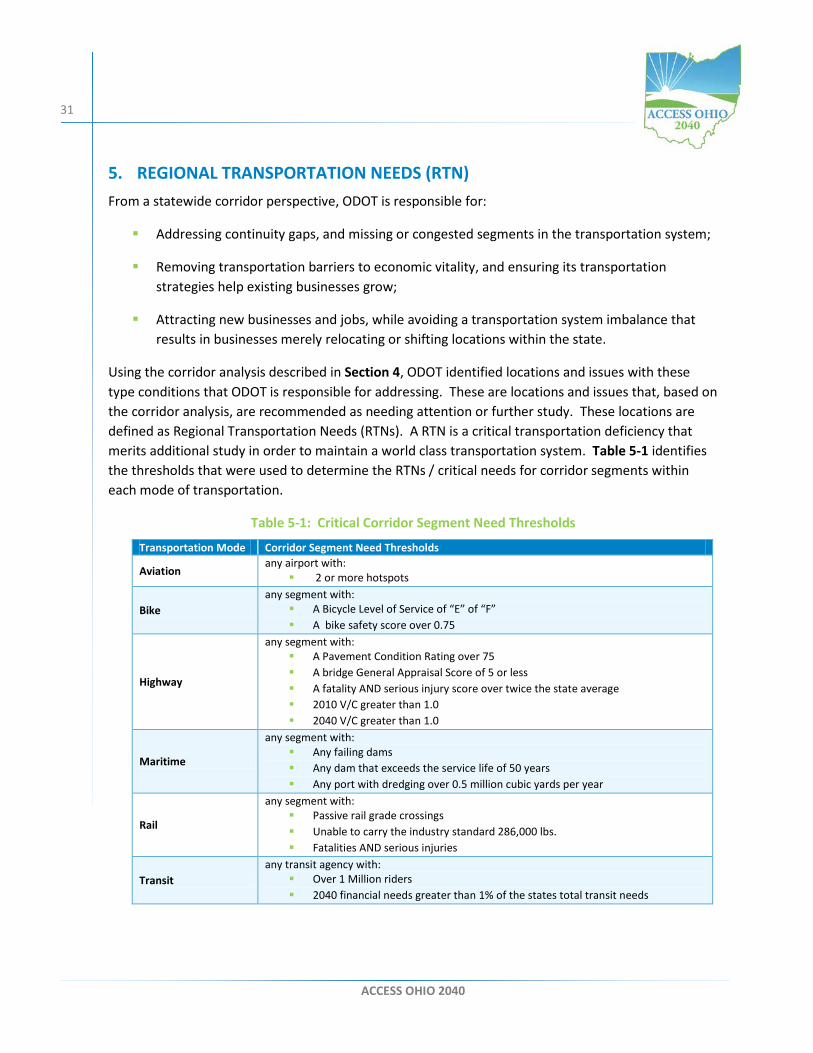
Using the corridor analysis described in Section 4, ODOT identified locations and issues with these type conditions that ODOT is responsible for addressing. These are locations and issues that, based on the corridor analysis, are recommended as needing attention or further study. These locations are defined as Regional Transportation Needs (RTNs). A RTN is a critical transportation deficiency that merits additional study in order to maintain a world class transportation system. Table 5-1 identifies the thresholds that were used to determine the RTNs / critical needs for corridor segments within each mode of transportation.
Table 5-1: Critical Corridor Segment Need Thresholds
Transportation Mode Corridor Segment Need Thresholds
Aviation any airport with: 2 or more hotspots
Bike any segment with: A Bicycle Level of Service of “E” of “F” A bike safety score over 0.75
Highway
any segment with: A Pavement Condition Rating over 75 A bridge General Appraisal Score of 5 or less A fatality AND serious injury score over twice the state average 2010 V/C greater than 1.0 2040 V/C greater than 1.0
Maritime
any segment with: Any failing dams Any dam that exceeds the service life of 50 years Any port with dredging over 0.5 million cubic yards per year
Rail
any segment with: Passive rail grade crossings Unable to carry the industry standard 286,000 lbs. Fatalities AND serious injuries
Transit any transit agency with:
Over 1 Million riders 2040 financial needs greater than 1% of the states total transit needs
ACCESS OHIO 2040
Technical Memorandum • Strategic Transportation System (STS) Corridors 32
In addition to selecting critical needs based on STS corridor segment thresholds, ODOT reached out to stakeholders around Ohio to review and determine other critical regional transportation needs. The stakeholders that ODOT consulted with included representatives from Ohio Metropolitan Planning Organizations, Ohio Regional Transportation Planning Organizations, ODOT Districts, the Ohio Rail Development Commission, maritime staff, and bike/ pedestrian professionals. Based on this outreach, the RTNs were adjusted to reflect local knowledge and priorities of stakeholders most familiar with these critical need locations and issues.
In total, ODOT along with stakeholder involvement agreed on and identified 55 regional transportation needs. A list of RTNs in the northwest, northeast, southwest, southeast, and central regions of the state are shown in Appendix A. The critical multi-modal transportation needs for each region of Ohio are composed of STS facilities that have safety, mobility and efficiency, or preservation problems.
ACCESS OHIO 2040
33
6. UTILIZING THE STRATEGIC TRANSPORTATION SYSTEM CORRIDOR ANALYSIS
The AO40 corridor analysis focuses on defining, rating and analyzing only “significant” transportation infrastructures, services and facilities. Highway, rail, maritime, bike, aviation, and transit corridors are designated as “Corridors of Significance.” These corridors:
Connect Ohio’s key urban population and employment areas within and outside the state;
Provide the highest level of transportation services for Ohio’s citizens, businesses, and industries, and;
Carry the highest volumes of people and freight within and through the state.
Each of the regional transportation needs (RTNs) that was identified in the corridor analysis is located on the Strategic Transportation System (STS). The RTNs represent the state’s most critical multi-modal transportation needs and will help ODOT program managers to prioritize transportation facility improvements that will have maximum statewide impacts. It is important to note that discretionary funding will not solely be invested into the RTNs, as ODOT strives to provide a balanced program of projects that address needs at multiple scales throughout the state.
ACCESS OHIO 2040
34
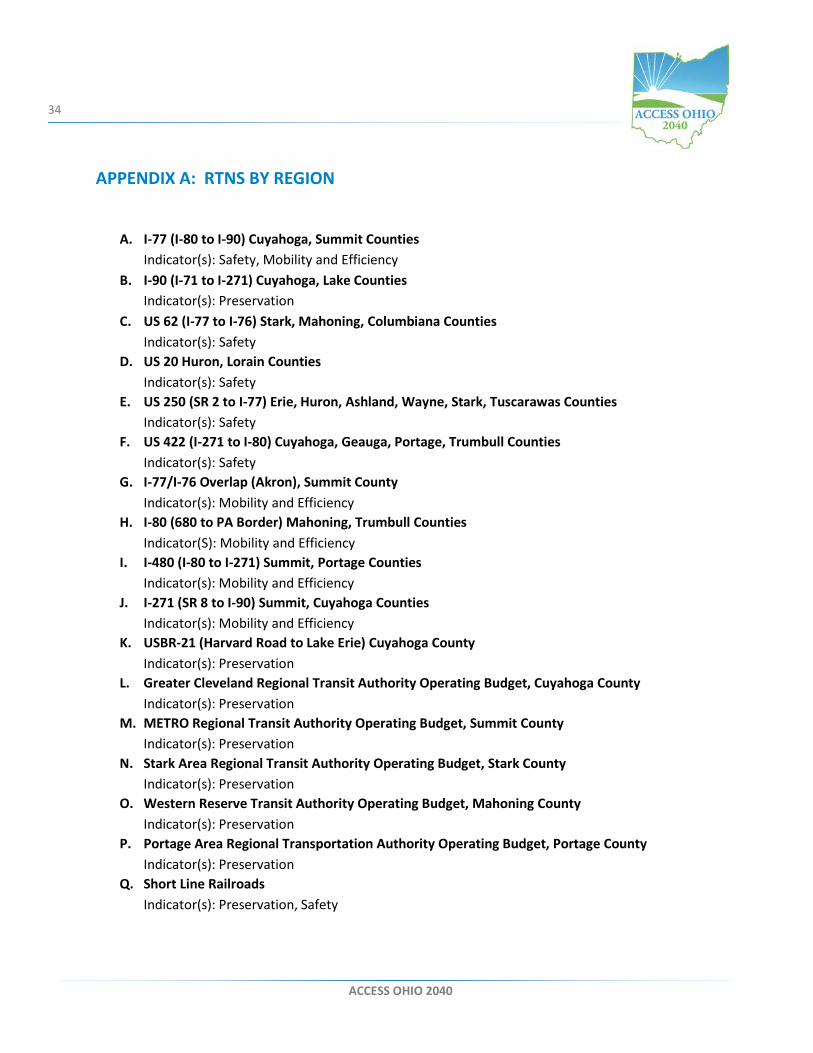
APPENDIX A: RTNS BY REGION
A. I-77 (I-80 to I-90) Cuyahoga, Summit Counties Indicator(s): Safety, Mobility and Efficiency
B. I-90 (I-71 to I-271) Cuyahoga, Lake Counties Indicator(s): Preservation
C. US 62 (I-77 to I-76) Stark, Mahoning, Columbiana Counties Indicator(s): Safety
D. US 20 Huron, Lorain Counties Indicator(s): Safety
E. US 250 (SR 2 to I-77) Erie, Huron, Ashland, Wayne, Stark, Tuscarawas Counties Indicator(s): Safety
F. US 422 (I-271 to I-80) Cuyahoga, Geauga, Portage, Trumbull Counties Indicator(s): Safety
G. I-77/I-76 Overlap (Akron), Summit County Indicator(s): Mobility and Efficiency
H. I-80 (680 to PA Border) Mahoning, Trumbull Counties Indicator(S): Mobility and Efficiency
I. I-480 (I-80 to I-271) Summit, Portage Counties Indicator(s): Mobility and Efficiency
J. I-271 (SR 8 to I-90) Summit, Cuyahoga Counties Indicator(s): Mobility and Efficiency
K. USBR-21 (Harvard Road to Lake Erie) Cuyahoga County Indicator(s): Preservation
L. Greater Cleveland Regional Transit Authority Operating Budget, Cuyahoga County Indicator(s): Preservation
M. METRO Regional Transit Authority Operating Budget, Summit County Indicator(s): Preservation
N. Stark Area Regional Transit Authority Operating Budget, Stark County Indicator(s): Preservation
O. Western Reserve Transit Authority Operating Budget, Mahoning County Indicator(s): Preservation
P. Portage Area Regional Transportation Authority Operating Budget, Portage County Indicator(s): Preservation
Q. Short Line Railroads Indicator(s): Preservation, Safety
ACCESS OHIO 2040
Technical Memorandum • Strategic Transportation System (STS) Corridors • Appendix A 35
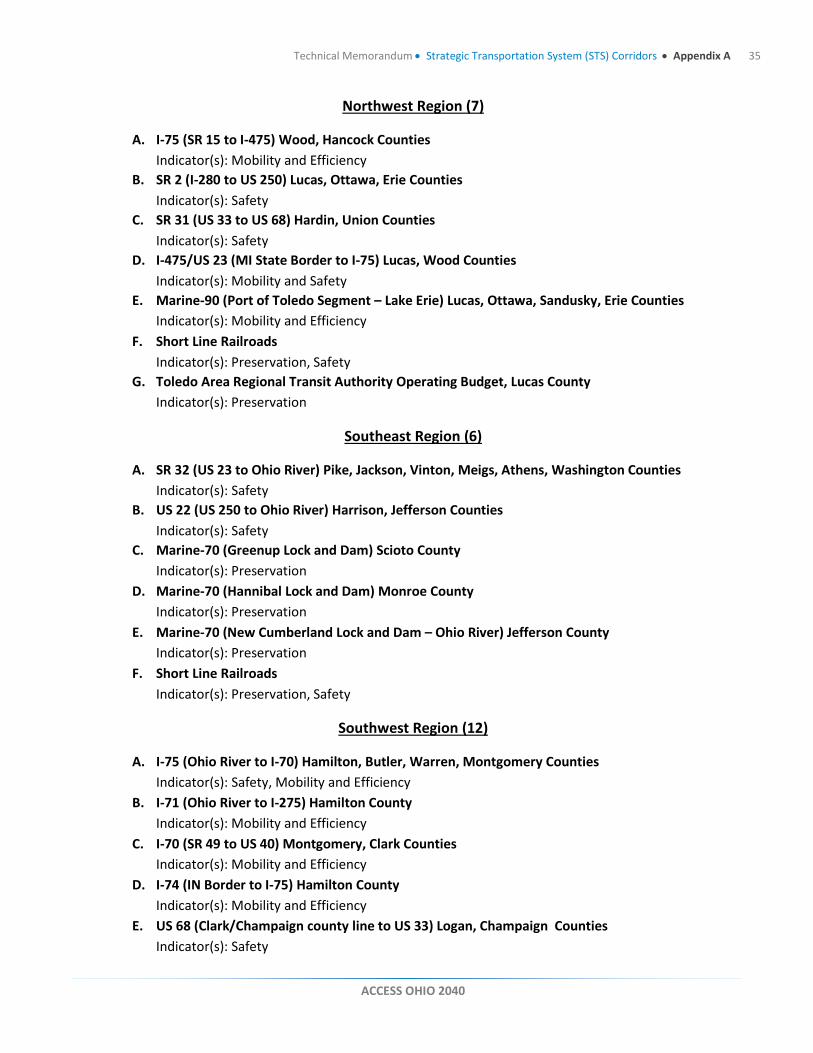
Northwest Region (7)
A. I-75 (SR 15 to I-475) Wood, Hancock Counties Indicator(s): Mobility and Efficiency
B. SR 2 (I-280 to US 250) Lucas, Ottawa, Erie Counties Indicator(s): Safety
C. SR 31 (US 33 to US 68) Hardin, Union Counties Indicator(s): Safety
D. I-475/US 23 (MI State Border to I-75) Lucas, Wood Counties Indicator(s): Mobility and Safety
E. Marine-90 (Port of Toledo Segment – Lake Erie) Lucas, Ottawa, Sandusky, Erie Counties Indicator(s): Mobility and Efficiency
F. Short Line Railroads Indicator(s): Preservation, Safety
G. Toledo Area Regional Transit Authority Operating Budget, Lucas County Indicator(s): Preservation
Southeast Region (6)
A. SR 32 (US 23 to Ohio River) Pike, Jackson, Vinton, Meigs, Athens, Washington Counties Indicator(s): Safety
B. US 22 (US 250 to Ohio River) Harrison, Jefferson Counties Indicator(s): Safety
C. Marine-70 (Greenup Lock and Dam) Scioto County Indicator(s): Preservation
D. Marine-70 (Hannibal Lock and Dam) Monroe County Indicator(s): Preservation
E. Marine-70 (New Cumberland Lock and Dam – Ohio River) Jefferson County Indicator(s): Preservation
F. Short Line Railroads Indicator(s): Preservation, Safety
Southwest Region (12)
A. I-75 (Ohio River to I-70) Hamilton, Butler, Warren, Montgomery Counties Indicator(s): Safety, Mobility and Efficiency
B. I-71 (Ohio River to I-275) Hamilton County Indicator(s): Mobility and Efficiency
C. I-70 (SR 49 to US 40) Montgomery, Clark Counties Indicator(s): Mobility and Efficiency
D. I-74 (IN Border to I-75) Hamilton County Indicator(s): Mobility and Efficiency
E. US 68 (Clark/Champaign county line to US 33) Logan, Champaign Counties Indicator(s): Safety
ACCESS OHIO 2040
Technical Memorandum • Strategic Transportation System (STS) Corridors • Appendix A 36
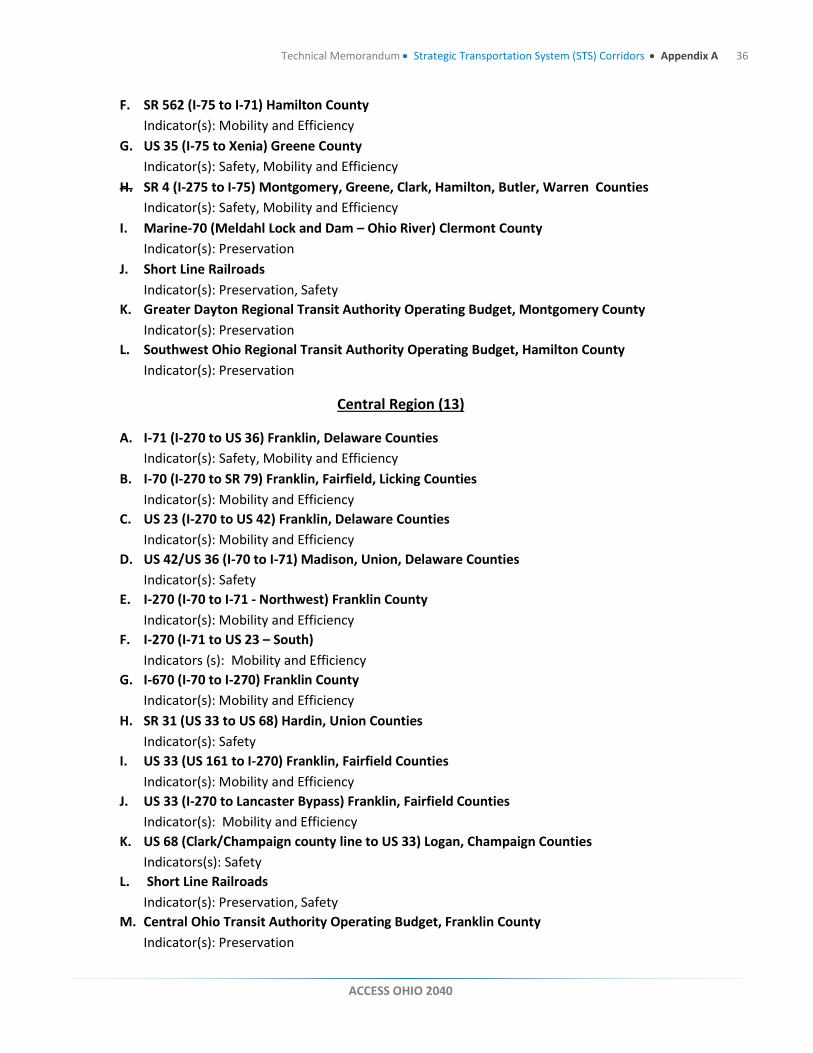
F. SR 562 (I-75 to I-71) Hamilton County Indicator(s): Mobility and Efficiency
G. US 35 (I-75 to Xenia) Greene County Indicator(s): Safety, Mobility and Efficiency
H. SR 4 (I-275 to I-75) Montgomery, Greene, Clark, Hamilton, Butler, Warren Counties Indicator(s): Safety, Mobility and Efficiency
I. Marine-70 (Meldahl Lock and Dam – Ohio River) Clermont County Indicator(s): Preservation
J. Short Line Railroads Indicator(s): Preservation, Safety
K. Greater Dayton Regional Transit Authority Operating Budget, Montgomery County Indicator(s): Preservation
L. Southwest Ohio Regional Transit Authority Operating Budget, Hamilton County Indicator(s): Preservation
Central Region (13)
A. I-71 (I-270 to US 36) Franklin, Delaware Counties Indicator(s): Safety, Mobility and Efficiency
B. I-70 (I-270 to SR 79) Franklin, Fairfield, Licking Counties Indicator(s): Mobility and Efficiency
C. US 23 (I-270 to US 42) Franklin, Delaware Counties Indicator(s): Mobility and Efficiency
D. US 42/US 36 (I-70 to I-71) Madison, Union, Delaware Counties Indicator(s): Safety
E. I-270 (I-70 to I-71 - Northwest) Franklin County Indicator(s): Mobility and Efficiency
F. I-270 (I-71 to US 23 – South) Indicators (s): Mobility and Efficiency
G. I-670 (I-70 to I-270) Franklin County Indicator(s): Mobility and Efficiency
H. SR 31 (US 33 to US 68) Hardin, Union Counties Indicator(s): Safety
I. US 33 (US 161 to I-270) Franklin, Fairfield Counties Indicator(s): Mobility and Efficiency
J. US 33 (I-270 to Lancaster Bypass) Franklin, Fairfield Counties Indicator(s): Mobility and Efficiency
K. US 68 (Clark/Champaign county line to US 33) Logan, Champaign Counties Indicators(s): Safety
L. Short Line Railroads Indicator(s): Preservation, Safety
M. Central Ohio Transit Authority Operating Budget, Franklin County Indicator(s): Preservation
ACCESS OHIO 2040
37
APPENDIX B: CORRIDOR ANALYSIS SPREADSHEET PER MODE
ACCESS OHIO 2040
Technical Memorandum • Strategic Transportation System (STS) Corridors • Appendix B 38
ACCESS OHIO 2040
Technical Memorandum • Strategic Transportation System (STS) Corridors • Appendix B 39
ACCESS OHIO 2040
Technical Memorandum • Strategic Transportation System (STS) Corridors • Appendix B 40
ACCESS OHIO 2040
Technical Memorandum • Strategic Transportation System (STS) Corridors • Appendix B 41
ACCESS OHIO 2040
Technical Memorandum • Strategic Transportation System (STS) Corridors • Appendix B 42
ACCESS OHIO 2040
Technical Memorandum • Strategic Transportation System (STS) Corridors • Appendix B 43
ACCESS OHIO 2040
Technical Memorandum • Strategic Transportation System (STS) Corridors • Appendix B 44
ACCESS OHIO 2040
Technical Memorandum • Strategic Transportation System (STS) Corridors • Appendix B 45
ACCESS OHIO 2040
Technical Memorandum • Strategic Transportation System (STS) Corridors • Appendix B 46
ACCESS OHIO 2040
Technical Memorandum • Strategic Transportation System (STS) Corridors • Appendix B 47
ACCESS OHIO 2040
Technical Memorandum • Strategic Transportation System (STS) Corridors • Appendix B 48
ACCESS OHIO 2040
Technical Memorandum • Strategic Transportation System (STS) Corridors • Appendix B 49
ACCESS OHIO 2040