Embed Size (px)
Citation preview
TECHNICAL MEMORANDUM ----------------------------------------------------------------------------------------------------------- DATE: 26 January 2007 TO: Casey McKeon, Ph.D. (RCM) FROM: Mark J. Logsdon (Geochimica) SUBJECT: GEOCHEMICAL CHARACTERIZATION OF DEVELOPMENT
ROCK FOR PROPOSED SHAFT NO. 10, RESOLUTION PROJECT: ADEQ Tier 1 Results and Inertness Analysis
----------------------------------------------------------------------------------------------------------- 1.0 BACKGROUND Resolution Copper Mining, LLC (RCM) requires underground access to accurately and completely characterize the nature of the porphyry copper prospect near Superior, Arizona that they are evaluating. The first necessary step in developing the required underground access is to sink a new shaft, collared at the East Plant Site, to an expected total depth of 2191 m (7,188 ft) below ground surface (bgs). The rock removed during the shaft sinking will be entirely non-ore-grade; as is traditional in mining, this rock is called “development rock”, to reflect its origin as rock that must be moved to develop an underground mine. Shaft sinking for Resolution follows a numbered sequence that was initiated during mining the Superior ore body. The last Superior shaft was No. 9, so the first RCM shaft will be designated as Shaft No 10. Long-term RCM plans anticipate future shafts in additional locations, but this study deals only with Shaft No. 10. RCM will execute additional technical studies for other shafts and other parts of the underground development program, but these cannot yet be anticipated. Based on detailed engineering plans and calculations by RCM, the sinking of Shaft No. 10 will generate 1.9 Million tonnes1 of development rock. RCM’s current schedule anticipates producing the initial rock form Shaft No. 10 in the 1st Quarter of 2008, and shaft-sinking would continue to mid-year 2011. (The entire development-rock development program assuming RCM’s project proceeds as anticipated would extend to 2015. As stated above, additional technical studies, including geochemical testing, will be developed as the other projects are planned.) Most of the development rock will be Tertiary Apache Leap Tuff and Whitetail Conglomerate that are much younger than and not associated with the target mineralization. [Traces of native copper have been observed in drill core from the basal portion of the Whitetail Conglomerate.] Once the shaft reaches approximately 1000 m below ground surface (BGS), development rock will encounter propylitically altered Cretaceous rocks, and below approximately 1750 m BGS, development rock will be in quartz-sericite-pyrite (QSP)
1 Assuming a specific gravity of 2.7 for low-sulfide rock and 2.8 for sulfide-rich rock and a conservative swell factor of 1.5, the anticipated volume of total development rock is 1.3 Million cubic yards (GAI, 2007).
alteration with sulfide-sulfur concentrations that exceed 0.5 wt%. In the Precambrian to Mississipian sequence, sulfide-sulfur concentrations are expected to be above 1%. The development rock form shaft sinking will be stockpiled at one or more location on RCC property. This will constitute “waste rock” as described in the APP Guidance, and its potential impacts on water resources must be considered in order to obtain an Aquifer Protection Permit (APP). 1.1 Purpose and Objectives The purpose of this Technical Memorandum is to describe and present the results of a ADEQ Tier 1 geochemical characterization program of development rock for proposed Shaft No. 10 based detailed sampling and analysis of samples from a pilot drill hole along the entire vertical section of the proposed shaft. Specific objectives of the report include:
• Describing the important geologic controls of the rocks that Shaft No. 10 will encounter
• Describing the sampling and analysis program executed by the RCM team • Presenting the geochemical results of the test work • Evaluating the geochemical results within the context of the ADEQ guidance for the
APP program • Recommending that there is a reliable technical basis for determining that the upper
1633 m of the section meet ADEQ criteria for “inert rock”. • Describing the technical approach that RCM intends to implement for further
development-rock characterization (i.e., from other shafts and underground developments)
1.2 Terms of Reference RCM asked Mark Logsdon (Geochimica, Inc, Aptos, CA) to prepare and execute a plan to geochemically characterize development rock from shaft sinking. The test work must meet requirements for material characterization under the Arizona Department of Environmental Quality’s Aquifer Protection Permit Program (ADEQ-APP). In addition, the test work must be consistent with internal Rio Tinto standards and applicable guidance. In preparing the program, we have:
• Consulted the relevant ADEQ guidance documents. • Reviewed available data and reports on the geology, mineralogy and geochemistry of
the deposit. • Reviewed background information on the geology and geochemistry of the Superior
District and porphyry copper deposits in Arizona (and elsewhere) • Obtained data and information from RCM mine planners and engineers working for
RCM on development of the No. 10 Shaft. • Reviewed the internal Rio Tinto guidance on geochemical characterization of sulfide-
bearing rock. • Developed a sampling-and-analysis plan.
• Researched and recommended to RCM a testing and analytical facility. • Reviewed and evaluated the geochemical data developed by the testing laboratory,
both with respect to specific geochemical issues and in the context of the APP guidance. This technical memorandum is the report of those investigations.
• Asked that a third-party expert, Dr. Rens Verburg (Golder Associates, Inc., Redmond, Washington) review the plans and reports of the project.
Samples for testing, based on the Sampling and Analysis Plan developed by Geochimica, were provided by RCM geologists, who arranged for the samples to be delivered directly from the RCM core archive to the analytical laboratory for testing and analysis. The geochemical test work was performed by ACZ Laboratories, Inc. (Steamboat Springs, CO). ACZ is pre-qualified for the geochemical analyses required by ADEQ for the APP program. 2.0 ISSUES RCM asked for specific evaluation of the following three issues:
1. What is the potential for geochemical reactivity in rocks of the pilot-hole for Shaft No. 10?
2. What are the geochemical controls on reactivity? 3. Is there a well-defined geologic or elevation break between “inert” (in the ADEQ
sense) and reactive rock in the Shaft No. 10 materials? 3.0 TECHNICAL APPROACH Geochimica adopted the phased approach to geochemical characterization that is described in detail in the APP Guidance (ADEQ, 2006). Firstly, we developed a sampling and analysis plan (Geochimica, 2006) organized around RCM’s geologic data for pilot-hole core for Shaft No. 10 and detailed conceptual models for the geology and mineralogy of Resolution and other Arizona porphyry copper deposits (e.g., Manske and Paul, 2002; Lowell and Gilbert, 1970; Meyer and Hemley, 1967; Titley and Hicks, 1966; Titley, 1983a; and references in these sources). ADEQ Tier #1 (static) tests were used to scope the general risk of acid-rock drainage and metals leaching with adequate spatial and statistical characterization. The Tier #1 steps included:
• Evaluation of geology, stratigraphy, and mineralogy of the samples • Static acid-base accounting using the EPA methods (Sobek et al., 1978) • Static leach testing using EPA Method 1312 (Synthetic Precipitation Leaching
Procedure, SPLP)
The geology and mineralogy of the rocks was evaluated within the general approach of “geo-environmental models developed by the US Geological Survey (du Bray. 1995; Plumlee, 1999) and specifically in light of the models and data for porphyry copper systems (Cox et

al., 1995; Plumlee, 1999; Plumlee et al. 1999). In addition to the Tier #1 tests stipulated by ADEQ, samples were tested for total metals concentrations (a Tier #2 step). The Method 1312 leachates were analyzed for Gross Alpha and Gross Beta activities and also for dissolved Uranium. The Sobek-style static acid-base accounting approach was supplemented with another geochemical test called Net Acid Generation Potential (Miller et al., 1990; Tran, 2003) that provides an independent assessment of acid-generation potential. 4.0 METHODS AND PROCEDURES RCM divides its drill-core into nominal 3 m intervals for description and evaluation. All geochemical testing has been done on single lithologies within 3m intervals. To avoid “smera8ing” of material and therefore geochemical properties, there has been no compositing across intervals or of lithologies that range within a 3-m interval. Tier #1 geochemical tests (ABA and SPLP leaching) have been performed by the methods and procedures listed in ADEQ guidance (Sobek et al., 1978), as certified by ACZ. An independent review of the methodologies for acid-rock drainage estimation is provided in White et al., 1999 and has recently been summarized again by Maest et al., 2006). The whole-rock chemical analyses were performed by a subcontractor laboratory (ALS Environmental) using standard EPA methods for extractions (crushing and dissolution) and analyses (ICP preparation with analysis by emission spectroscopy or mass spectrometry, depending on the EPA designated finish. The results are reported in units of mg/kg or ug/kg of solids. In addition, as is standard in geologic materials, the major rock-forming components were tested separately by whole-rock X-ray fluorescence and the results reported as the standard oxides (e.g., Al as Al2O3 in wt%. Quality assurance/quality control checks and discussion are included in the laboratory reports. The principal concern for water-quality impacts in a porphyry copper deposit such as Resolution is that the sulfide minerals (predominantly pyrite, FeS2) will oxidize, producing acidic drainage that solubilizes trace metals. Therefore the first geochemical step in the Tier #1 process is to determine the amount of sulfide-sulfur present in samples (in this case as a function of rock type and depth). Sulfur values in the ABA analysis are determined by full pyrolysis in a Leco induction furnace. The sulfur-bearing phases generate SO2 gas that is analyzed by infra-red spectroscopy and reported as wt% of the solid mass. Sulfate concentrations (e.g, gypsum (CaSO4.2H20) or barite (BaSO4) are determined by acid-leaching of the sample to dissolve sulfate minerals and a second Leco/IR analysis, with the sulfate given by difference. The sulfate minerals are not acid generating, so the Sulfide-sulfur value is taken to be the difference between total sulfur and sulfate-sulfur. This is the most conservative way to estimate sulfide-sulfur concentrations. Neutralization potentials are determined on separate sample splits. The sample is reacted with known, but excess strong sulfur, and the resulting solution is back-titrated with a strong base to determine how much of str9ng acid was neutralized by the rock.
The two basic measurements sulfide-sulfur concentration and titrated neutralization potential, are converted to common units of kg CaCO3 eq/tonne2 rock to allow comparison in consistent units. The procedure for the conversion is standard in the EPA protocol (Sobek et al., 1978), based on the stoichiometries of two model reactions: [1] FeS2 + 15/4 O2 + 7/2 H2O Fe(OH)3 + 2 SO4
2- + 4 H+ [i.e., the oxidation of pyrite by oxygen in the presence of water to produce ferric
hydroxide (solids) plus dissociated sulfuric acid, H2SO4] [2] H2SO4 + CaCO3 H2CO3 + CaSO4 [i.e., the neutralization of the strong acid, sulfuric acid by calcite (CaCO3) to produce a
solution of weak acid (carbonic, H2CO3, the specific form of which depends on solution pH, e.g., Holland, 1978) and calcium sulfate (gypsum when there is excess water and T< 50C.]
The calculation is entirely stoichiometric; all sulfide minerals are treated as pyrite (the most acid generating), and there is no necessary implication that calcite is the neutralizing mineral, which is why it is called “equivalent” CaCO3 in the ABA units. The sulfide-sulfur values are used to estimate the Acid Generation Potential (AGP or AP). In some jurisdictions, this is called Maximum Potential Acidity, MPA, to emphasize that the manner of its calculation is highly conservative, assuming that all pyritic sulfur oxidizes essentially instantaneously. The neutralization values are called Acid Neutralization Potentials (ANP or NP). When presented in consistent units, the values can be compared using a “factor of safety” approach) as either a difference, Net Neutralization Potential [NNP = NP-AP] or as a Neutralization Potential Ratio, [NPR = NP/AP]. A NNP > 0 or an NPR > 1 implies that the rock sample has more Neutralization Potential than Acid Generation Potential; NNP<o or NPR < 1, implies that the acid generation potential is greater. Conventions for considering the ABA values for decision-making are discussed below, after presentation of the results. The Net Acid Generation (NAG) test, widely used in Australasia and increasingly in North America, is a different analytical scheme. Rather than test the AP and NP separately, as is done with the Sobek methods, the NAG test uses a strong oxidant, hydrogen peroxide, to rapidly oxidize the sulfides in a sample and then allow the residual rock-mass itself to neutralize as much of the acid as it can. The reactions occur quickly (typically in 4-6 hours, although the test generally runs for 12-24 hours for convenience and to ensure full reaction). The pH of the spent peroxide solution (a normal aqueous solution) is then measured; the result is called the NAGpH. If NAGpH is < 4.5, the solution is titrated for acidity, and that is reported as the NAG value. (At pH > 4,5, the solution will have net titratable alkalinity, so an acidity titration makes no sense). At a screening level, NAGpH values < 4.5 indicate
2 “CaCO3 eq”, read “calcium carbonate equivalent” is the amount of calcite (chemical formula CaCO3) that would be the chemical equivalent of the neutralization value calculated as described in the text. The strong base used in the titration test is usually NaOH, but sodium hydroxide does not exist as a rock-forming mineral, so its neutralization effect has to be determined in terms of a rock-forming mineral that is significant in the context, and calcite is the standard choice.
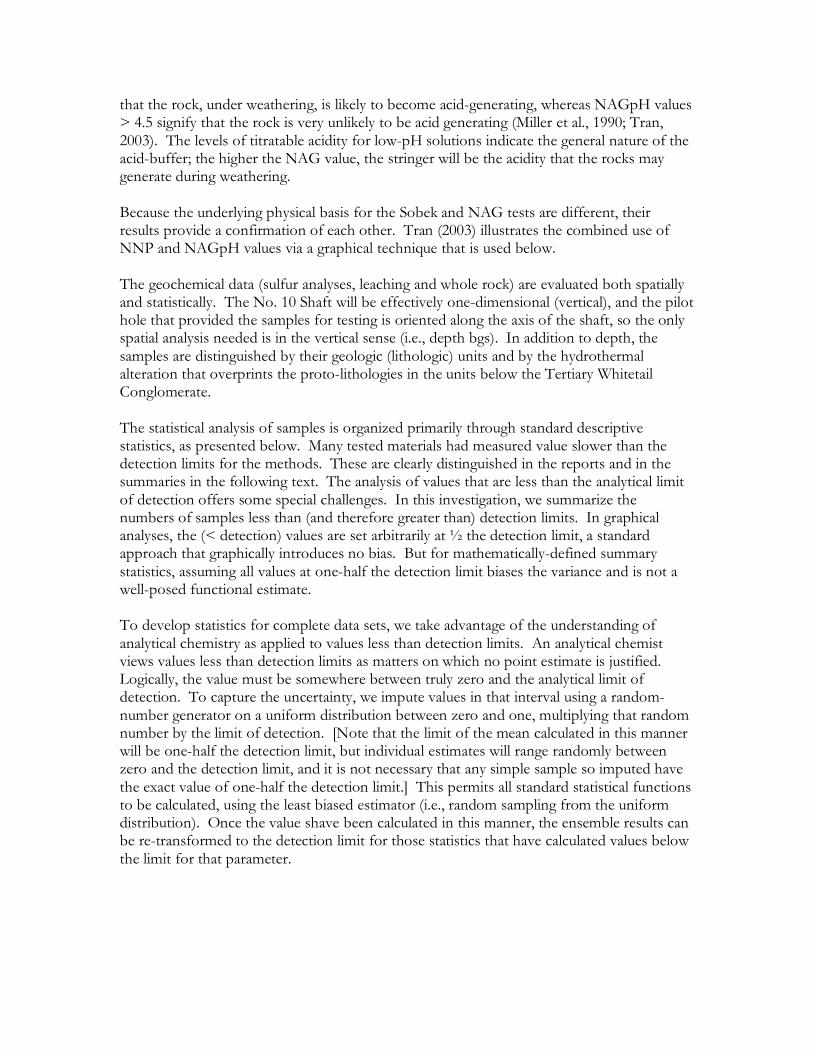
that the rock, under weathering, is likely to become acid-generating, whereas NAGpH values > 4.5 signify that the rock is very unlikely to be acid generating (Miller et al., 1990; Tran, 2003). The levels of titratable acidity for low-pH solutions indicate the general nature of the acid-buffer; the higher the NAG value, the stringer will be the acidity that the rocks may generate during weathering. Because the underlying physical basis for the Sobek and NAG tests are different, their results provide a confirmation of each other. Tran (2003) illustrates the combined use of NNP and NAGpH values via a graphical technique that is used below. The geochemical data (sulfur analyses, leaching and whole rock) are evaluated both spatially and statistically. The No. 10 Shaft will be effectively one-dimensional (vertical), and the pilot hole that provided the samples for testing is oriented along the axis of the shaft, so the only spatial analysis needed is in the vertical sense (i.e., depth bgs). In addition to depth, the samples are distinguished by their geologic (lithologic) units and by the hydrothermal alteration that overprints the proto-lithologies in the units below the Tertiary Whitetail Conglomerate. The statistical analysis of samples is organized primarily through standard descriptive statistics, as presented below. Many tested materials had measured value slower than the detection limits for the methods. These are clearly distinguished in the reports and in the summaries in the following text. The analysis of values that are less than the analytical limit of detection offers some special challenges. In this investigation, we summarize the numbers of samples less than (and therefore greater than) detection limits. In graphical analyses, the (< detection) values are set arbitrarily at ½ the detection limit, a standard approach that graphically introduces no bias. But for mathematically-defined summary statistics, assuming all values at one-half the detection limit biases the variance and is not a well-posed functional estimate. To develop statistics for complete data sets, we take advantage of the understanding of analytical chemistry as applied to values less than detection limits. An analytical chemist views values less than detection limits as matters on which no point estimate is justified. Logically, the value must be somewhere between truly zero and the analytical limit of detection. To capture the uncertainty, we impute values in that interval using a random-number generator on a uniform distribution between zero and one, multiplying that random number by the limit of detection. [Note that the limit of the mean calculated in this manner will be one-half the detection limit, but individual estimates will range randomly between zero and the detection limit, and it is not necessary that any simple sample so imputed have the exact value of one-half the detection limit.] This permits all standard statistical functions to be calculated, using the least biased estimator (i.e., random sampling from the uniform distribution). Once the value shave been calculated in this manner, the ensemble results can be re-transformed to the detection limit for those statistics that have calculated values below the limit for that parameter.
5.0 RESULTS Appendix A is an Excel workbook that identifies all geologic and mineralogical data for the pilot hole; sample intervals selected for testing are identified. A total of 96 samples have been tested, 20 in a preliminary survey in 2005 and another 76 (17 of which replicate the earlier intervals as a QA check) in the most recent program. A summary worksheet identifies samples and briefly summarizes their critical geologic and mineralogical characteristics. The additional worksheets provide additional detail on lithology, alteration mineralogy, and copper mineralization. Figure 1 is a generalized stratigraphic section for the Project area. The ore body is (schematically) in the right-hand portion of the section, east of the major sub0svertical fault that down-drops Cretaceous sedimentary and vocaniclastic rock (Kvs on the figure). Figure 2 is a cross-sectional view of the alignment of Shaft No. 10 and the subsequent underground drives toward the resolution ore body, shown in relationship to the underground geology. Analytical reports from ACZ laboratories are presented verbatim in Attachment 1. Appendix B compiles the Acid-Base data (Sobek and NAG). Appendix C compiles the SPLP (Method 1312) leachates, as well as chemical analyses of the leachates from all the NAG tests. Appendix D compiles the whole-rock chemistry, including trace metals. Appendices A-D and Attachment 1 are presented in large electronic files on the CD in the pocket to this report. Key results are displayed in the following figures, each of which will be discussed in the following section: Figure 3. Vertical section showing the spatial distribution of Sulfide-Sulfur concentrations in relationship to the depth and geology (lithologies, alteration zones) of Shaft No. 10. Figure 4. Vertical section showing the spatial distribution of Neutralization Potentials in relationship to depth and the geology (lithologies, alteration zones) of Shaft No. 10. Figure 5. Vertical section showing the spatial distribution of NPR (ratio of NP/AP) in relationship to the depth and geology (lithologies, alteration zones) of Shaft No. 10. Figure 6. Bivariate plot of NP vs AP, with samples distinguished by geologic unit in stratigraphic order. Figure 7. Vertical section showing the spatial distribution of NAGpH in relationship to the depth and geology (lithologies, alteration zones) of Shaft No. 10.

Figure 8. Bivariate plot of Net Neutralization Potential vs NAGpH, with samples distinguished by geologic unit in stratigraphic order. Figure 9. Vertical section showing the spatial distribution of Method 1312 and NAG leachate concentrations for SO4 and Fe in relationship to the depth and geology (lithologies, alteration zones) of Shaft No. 10. Figure 10. Vertical section showing the spatial distribution of total metals concentrations for Cu and Zn in relationship to depth and the geology (lithologies, alteration zones) of Shaft No. 10.
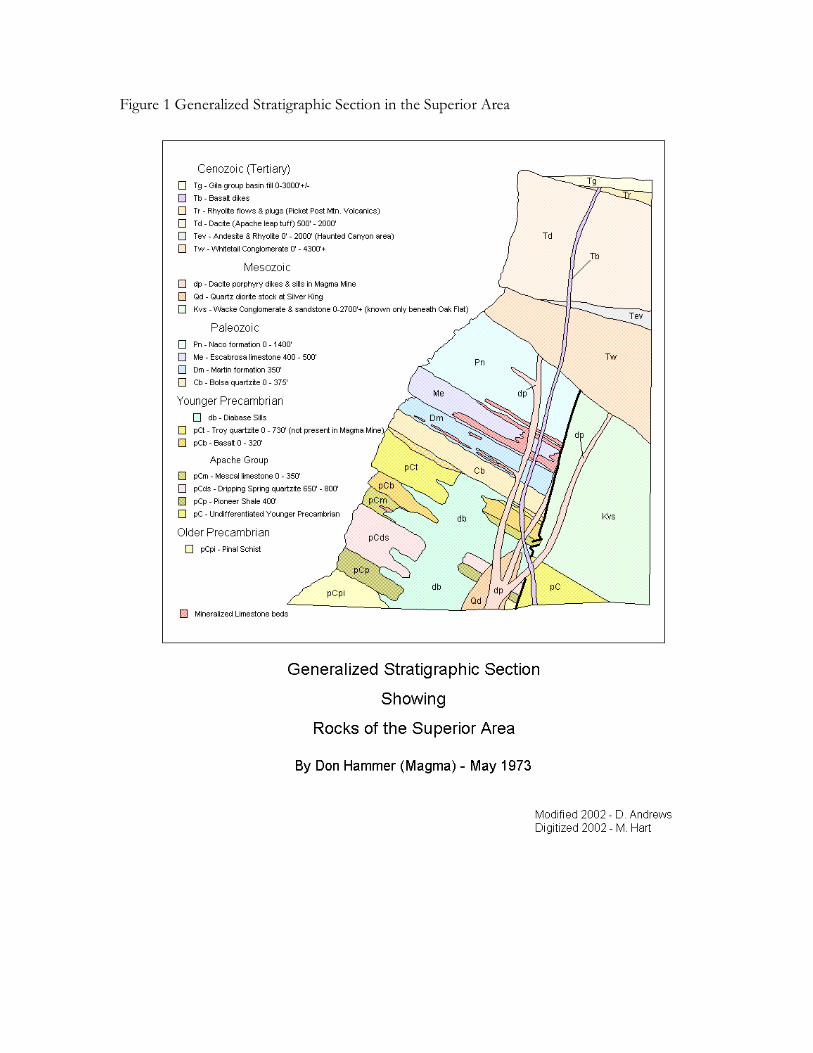
Figure 1 Generalized Stratigraphic Section in the Superior Area

Figure 2 Geologic Cross-Section of Resolution Deposit Showing Pilot Hole for No. 10 Shaft and Drift Level (prepared by M. Hart, RCM)
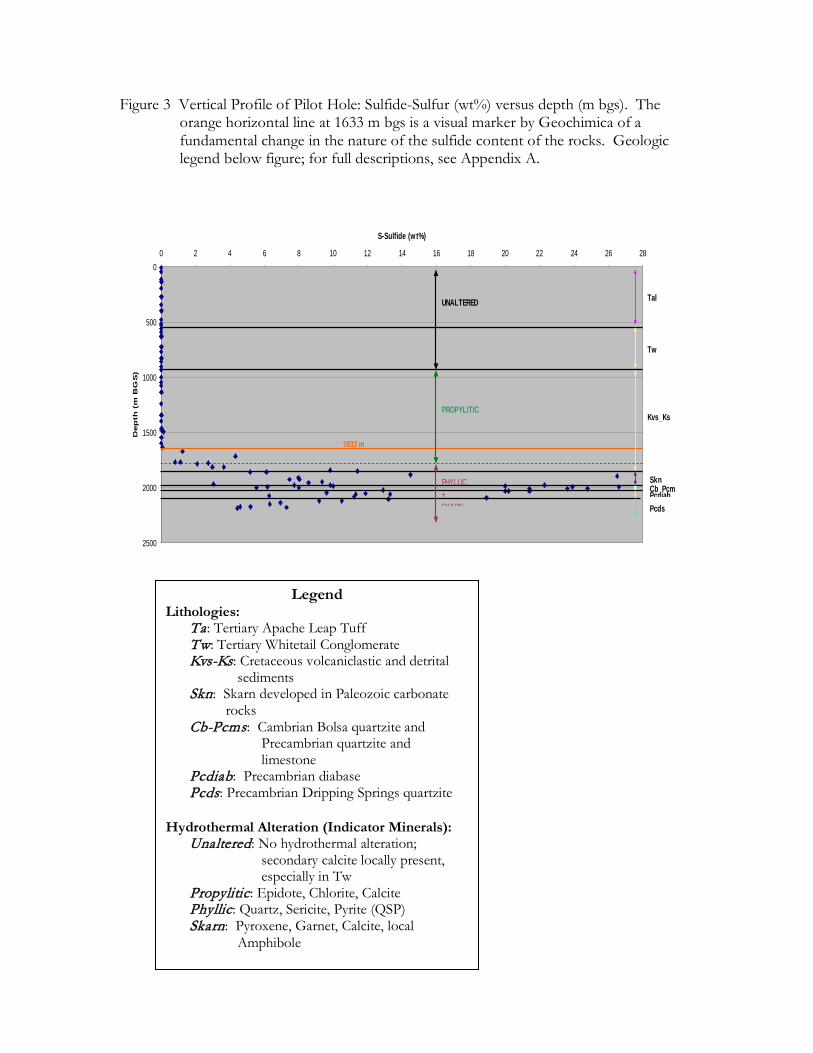
Figure 3 Vertical Profile of Pilot Hole: Sulfide-Sulfur (wt%) versus depth (m bgs). The orange horizontal line at 1633 m bgs is a visual marker by Geochimica of a fundamental change in the nature of the sulfide content of the rocks. Geologic legend below figure; for full descriptions, see Appendix A.
0
500
1000
1500
2000
2500
0 2 4 6 8 10 12 14 16 18 20 22 24 26 28
S-Sulfide (wt%)
Dep
th (
m B
GS
)
1633 m
Tal
Tw
Kvs_Ks
SknCb_PcmPcdiabPcds
UNALTERED
PHYLLIC+SKARN
PROPYLITIC
Legend Lithologies:
Ta: Tertiary Apache Leap Tuff Tw: Tertiary Whitetail Conglomerate Kvs-Ks: Cretaceous volcaniclastic and detrital
sediments Skn: Skarn developed in Paleozoic carbonate
rocks Cb-Pcms: Cambrian Bolsa quartzite and
Precambrian quartzite and limestone
Pcdiab: Precambrian diabase Pcds: Precambrian Dripping Springs quartzite
Hydrothermal Alteration (Indicator Minerals):
Unaltered: No hydrothermal alteration; secondary calcite locally present, especially in Tw
Propylitic: Epidote, Chlorite, Calcite Phyllic: Quartz, Sericite, Pyrite (QSP) Skarn: Pyroxene, Garnet, Calcite, local
Amphibole
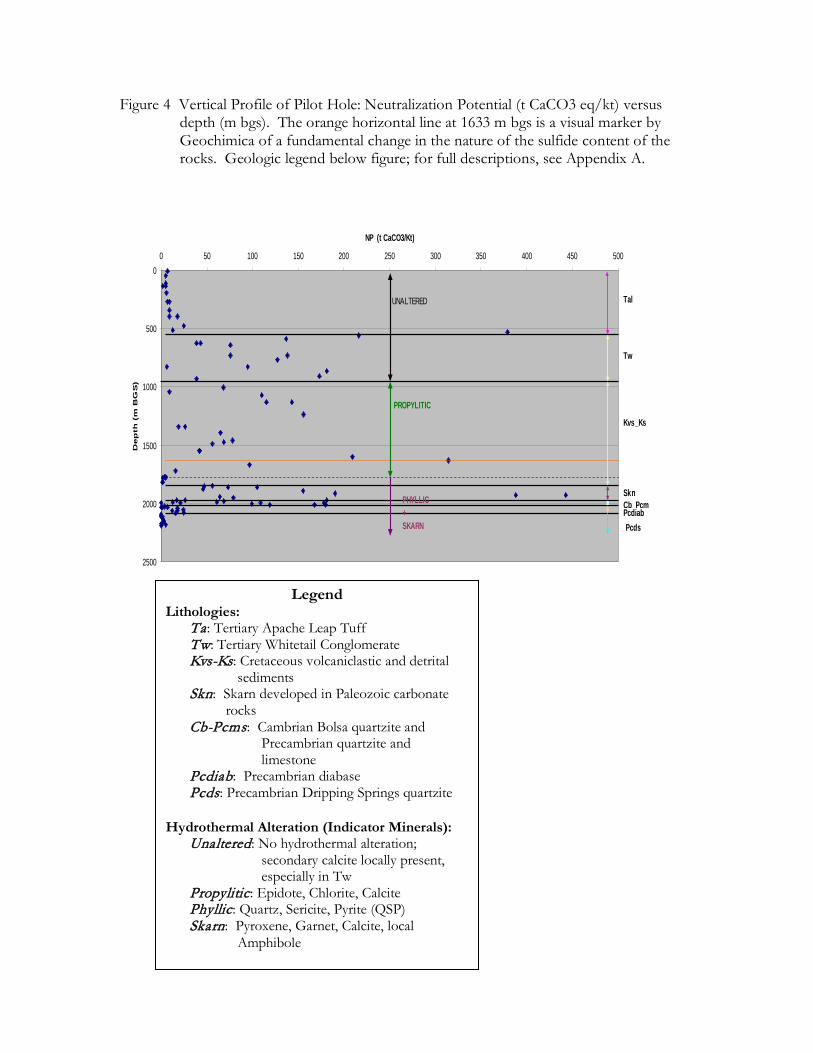
Figure 4 Vertical Profile of Pilot Hole: Neutralization Potential (t CaCO3 eq/kt) versus depth (m bgs). The orange horizontal line at 1633 m bgs is a visual marker by Geochimica of a fundamental change in the nature of the sulfide content of the rocks. Geologic legend below figure; for full descriptions, see Appendix A.
Legend Lithologies:
Ta: Tertiary Apache Leap Tuff Tw: Tertiary Whitetail Conglomerate Kvs-Ks: Cretaceous volcaniclastic and detrital
sediments Skn: Skarn developed in Paleozoic carbonate
rocks Cb-Pcms: Cambrian Bolsa quartzite and
Precambrian quartzite and limestone
Pcdiab: Precambrian diabase Pcds: Precambrian Dripping Springs quartzite
Hydrothermal Alteration (Indicator Minerals):
Unaltered: No hydrothermal alteration; secondary calcite locally present, especially in Tw
Propylitic: Epidote, Chlorite, Calcite Phyllic: Quartz, Sericite, Pyrite (QSP) Skarn: Pyroxene, Garnet, Calcite, local
Amphibole
0
500
1000
1500
2000
2500
0 50 100 150 200 250 300 350 400 450 500
NP (t CaCO3/Kt)
Dep
th (
m B
GS
)
UNALTERED
PROPYLITIC
PHYLLIC+SKARN
Tal
Tw
Kvs_Ks
SknCb PcmPcdiabPcds
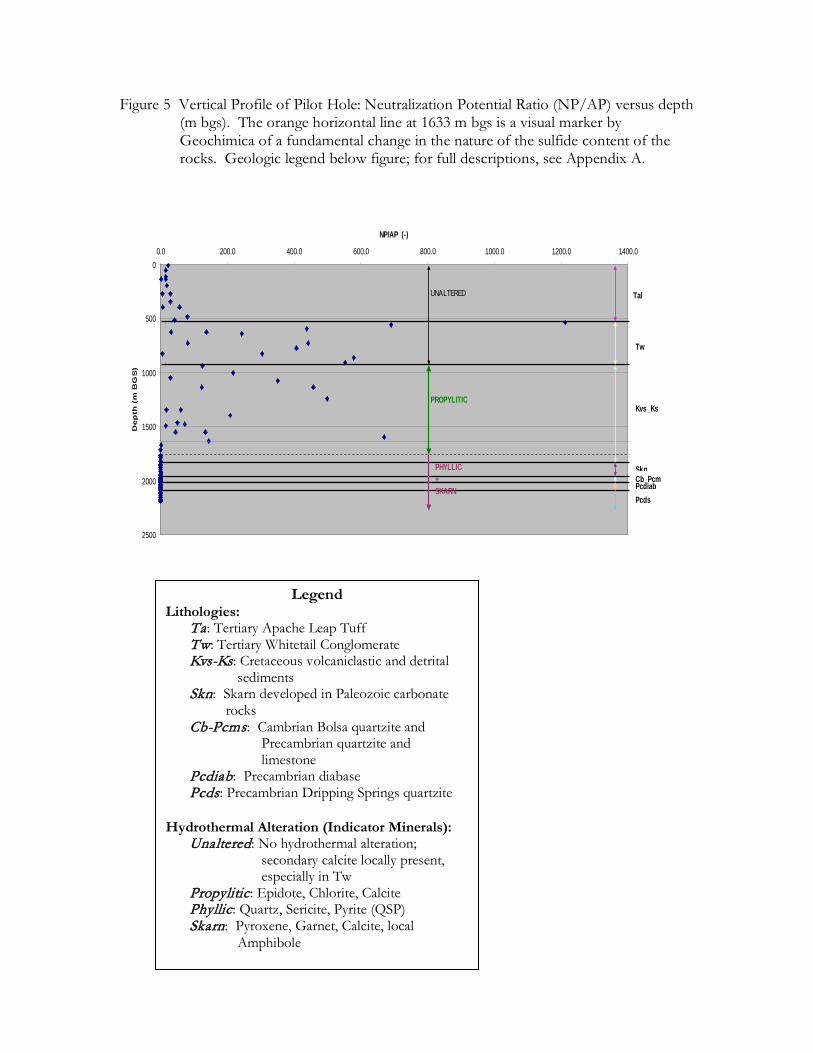
Figure 5 Vertical Profile of Pilot Hole: Neutralization Potential Ratio (NP/AP) versus depth (m bgs). The orange horizontal line at 1633 m bgs is a visual marker by Geochimica of a fundamental change in the nature of the sulfide content of the rocks. Geologic legend below figure; for full descriptions, see Appendix A.
Legend Lithologies:
Ta: Tertiary Apache Leap Tuff Tw: Tertiary Whitetail Conglomerate Kvs-Ks: Cretaceous volcaniclastic and detrital
sediments Skn: Skarn developed in Paleozoic carbonate
rocks Cb-Pcms: Cambrian Bolsa quartzite and
Precambrian quartzite and limestone
Pcdiab: Precambrian diabase Pcds: Precambrian Dripping Springs quartzite
Hydrothermal Alteration (Indicator Minerals):
Unaltered: No hydrothermal alteration; secondary calcite locally present, especially in Tw
Propylitic: Epidote, Chlorite, Calcite Phyllic: Quartz, Sericite, Pyrite (QSP) Skarn: Pyroxene, Garnet, Calcite, local
Amphibole
0
500
1000
1500
2000
2500
0.0 200.0 400.0 600.0 800.0 1000.0 1200.0 1400.0
NP/AP (-)
Dep
th (
m B
GS
)
UNALTERED
PROPYLITIC
PHYLLIC+SKARN
Tal
Tw
Kvs_Ks
SknCb_PcmPcdiabPcds
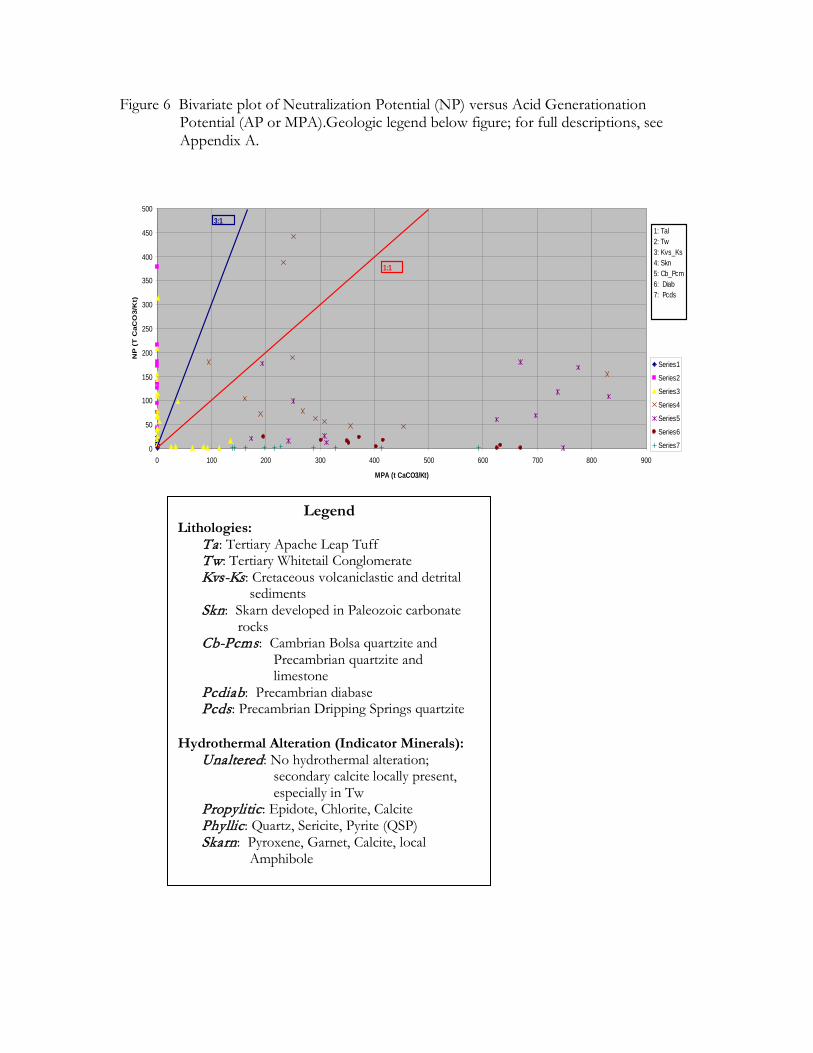
Figure 6 Bivariate plot of Neutralization Potential (NP) versus Acid Generationation Potential (AP or MPA).Geologic legend below figure; for full descriptions, see Appendix A.
Legend Lithologies:
Ta: Tertiary Apache Leap Tuff Tw: Tertiary Whitetail Conglomerate Kvs-Ks: Cretaceous volcaniclastic and detrital
sediments Skn: Skarn developed in Paleozoic carbonate
rocks Cb-Pcms: Cambrian Bolsa quartzite and
Precambrian quartzite and limestone
Pcdiab: Precambrian diabase Pcds: Precambrian Dripping Springs quartzite
Hydrothermal Alteration (Indicator Minerals):
Unaltered: No hydrothermal alteration; secondary calcite locally present, especially in Tw
Propylitic: Epidote, Chlorite, Calcite Phyllic: Quartz, Sericite, Pyrite (QSP) Skarn: Pyroxene, Garnet, Calcite, local
Amphibole
0
50
100
150
200
250
300
350
400
450
500
0 100 200 300 400 500 600 700 800 900
MPA (t CaCO3/Kt)
NP
(T
CaC
O3/
Kt)
Series1
Series2
Series3
Series4
Series5
Series6
Series7
1: Tal2: Tw3: Kvs_Ks4: Skn5: Cb_Pcm6: Diab7: Pcds
1:1
3:1
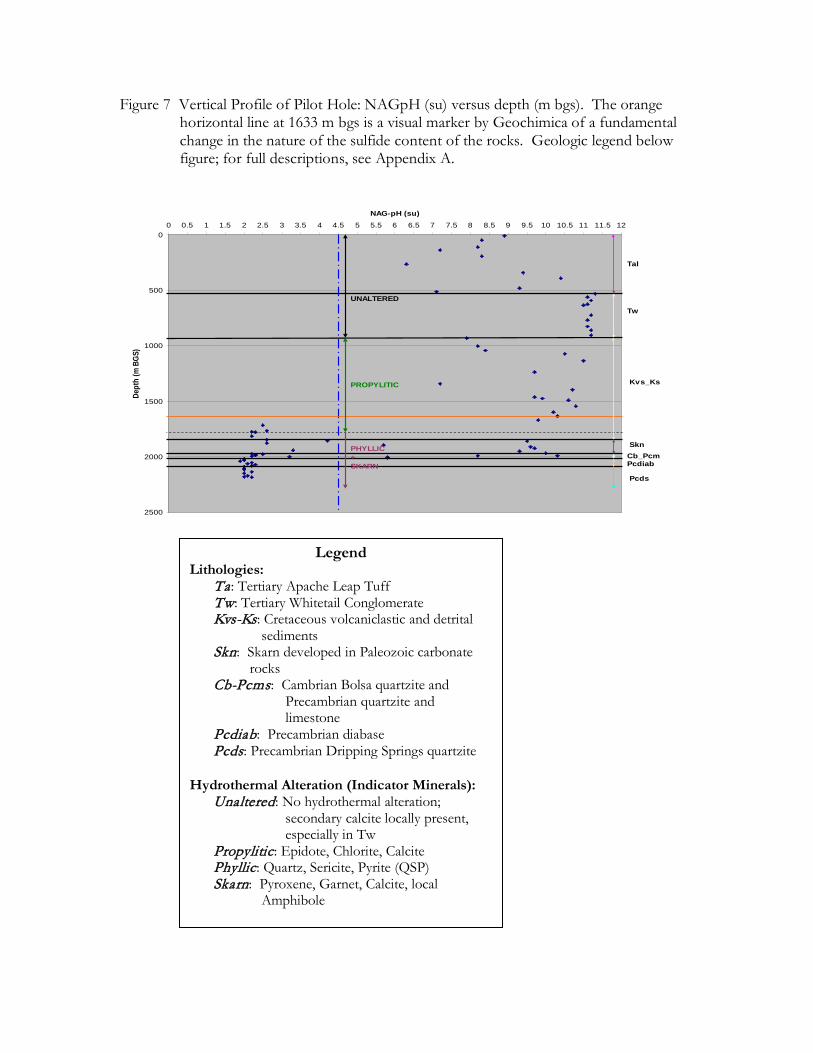
Figure 7 Vertical Profile of Pilot Hole: NAGpH (su) versus depth (m bgs). The orange horizontal line at 1633 m bgs is a visual marker by Geochimica of a fundamental change in the nature of the sulfide content of the rocks. Geologic legend below figure; for full descriptions, see Appendix A.
Legend Lithologies:
Ta: Tertiary Apache Leap Tuff Tw: Tertiary Whitetail Conglomerate Kvs-Ks: Cretaceous volcaniclastic and detrital
sediments Skn: Skarn developed in Paleozoic carbonate
rocks Cb-Pcms: Cambrian Bolsa quartzite and
Precambrian quartzite and limestone
Pcdiab: Precambrian diabase Pcds: Precambrian Dripping Springs quartzite
Hydrothermal Alteration (Indicator Minerals):
Unaltered: No hydrothermal alteration; secondary calcite locally present, especially in Tw
Propylitic: Epidote, Chlorite, Calcite Phyllic: Quartz, Sericite, Pyrite (QSP) Skarn: Pyroxene, Garnet, Calcite, local
Amphibole
0
500
1000
1500
2000
2500
0 0.5 1 1.5 2 2.5 3 3.5 4 4.5 5 5.5 6 6.5 7 7.5 8 8.5 9 9.5 10 10.5 11 11.5 12
NAG-pH (su)
Dept
h (m
BGS
)
UNALTERED
PROPYLITIC
PHYLLIC+SKARN
Tal
Tw
Kvs_Ks
SknCb_PcmPcdiab
Pcds

Figure 8 Bivariate plot of Net Neutralization Potential (NNP) versus NAGpH. Geologic legend below figure; for full descriptions, see Appendix A.
NNP vs NAG pH - Formations
-1000
-800
-600
-400
-200
0
200
400
600
0 0.5 1 1.5 2 2.5 3 3.5 4 4.5 5 5.5 6 6.5 7 7.5 8 8.5 9 9.5 10 10.5 11 11.5 12
NAGpH (su)
NN
P (
t C
aC
O3/K
t)
Series1
Series2
Series3
Series4
Series5
Series6
Series7
1: Tal2: Tw3: Kvs_Ks4: Skn5: Cb_Pcm6: Diab7: Pcds
Legend
Lithologies: Ta: Tertiary Apache Leap Tuff Tw: Tertiary Whitetail Conglomerate Kvs-Ks: Cretaceous volcaniclastic and detrital
sediments Skn: Skarn developed in Paleozoic carbonate
rocks Cb-Pcms: Cambrian Bolsa quartzite and
Precambrian quartzite and limestone
Pcdiab: Precambrian diabase Pcds: Precambrian Dripping Springs quartzite
Hydrothermal Alteration (Indicator Minerals):
Unaltered: No hydrothermal alteration; secondary calcite locally present, especially in Tw
Propylitic: Epidote, Chlorite, Calcite Phyllic: Quartz, Sericite, Pyrite (QSP) Skarn: Pyroxene, Garnet, Calcite, local
Amphibole
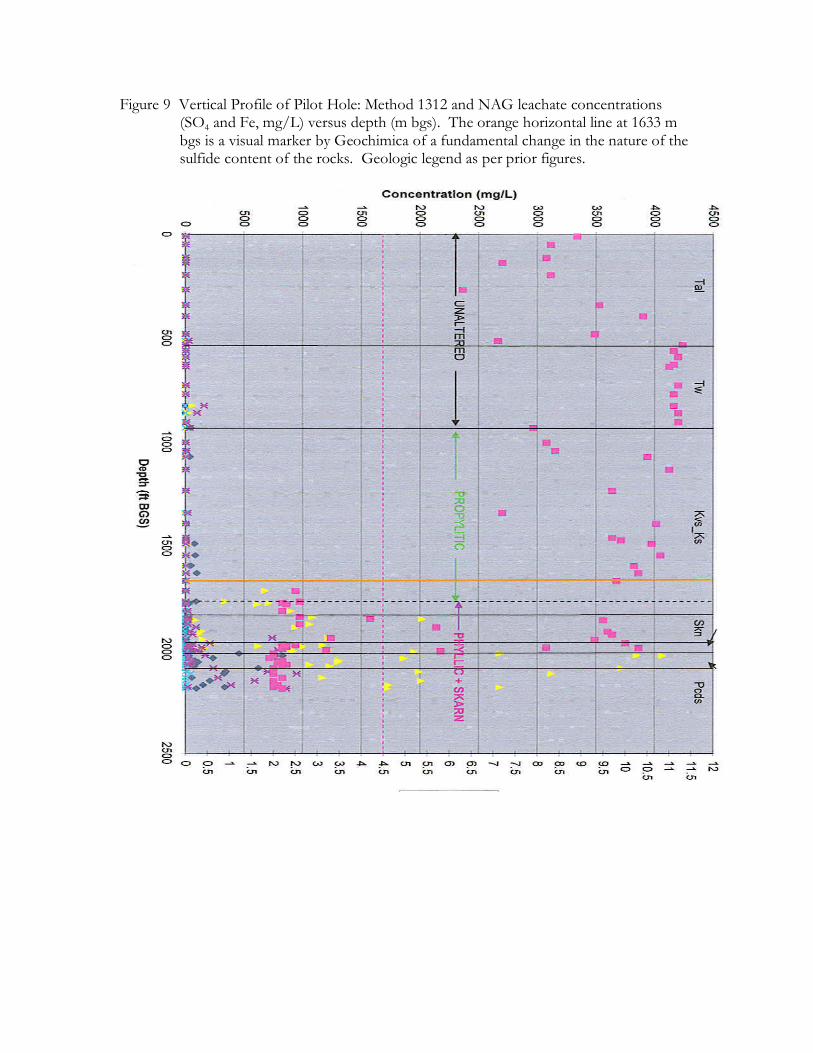
Figure 9 Vertical Profile of Pilot Hole: Method 1312 and NAG leachate concentrations (SO4 and Fe, mg/L) versus depth (m bgs). The orange horizontal line at 1633 m bgs is a visual marker by Geochimica of a fundamental change in the nature of the sulfide content of the rocks. Geologic legend as per prior figures.
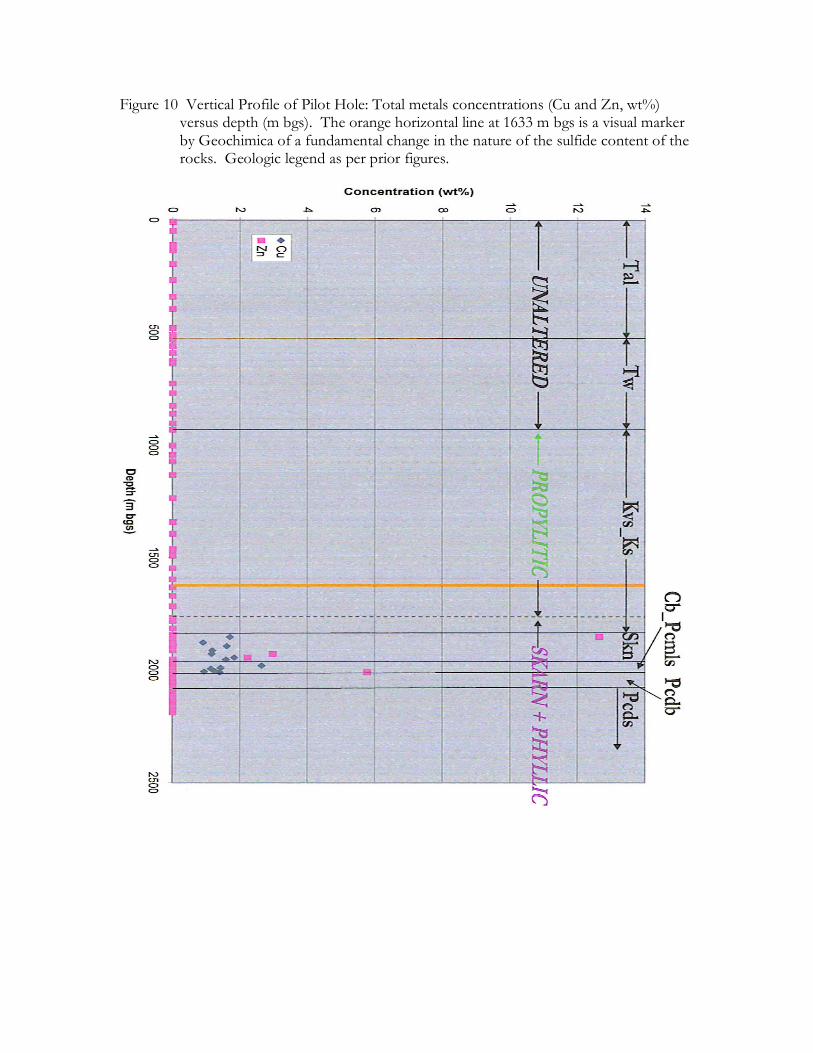
Figure 10 Vertical Profile of Pilot Hole: Total metals concentrations (Cu and Zn, wt%) versus depth (m bgs). The orange horizontal line at 1633 m bgs is a visual marker by Geochimica of a fundamental change in the nature of the sulfide content of the rocks. Geologic legend as per prior figures.
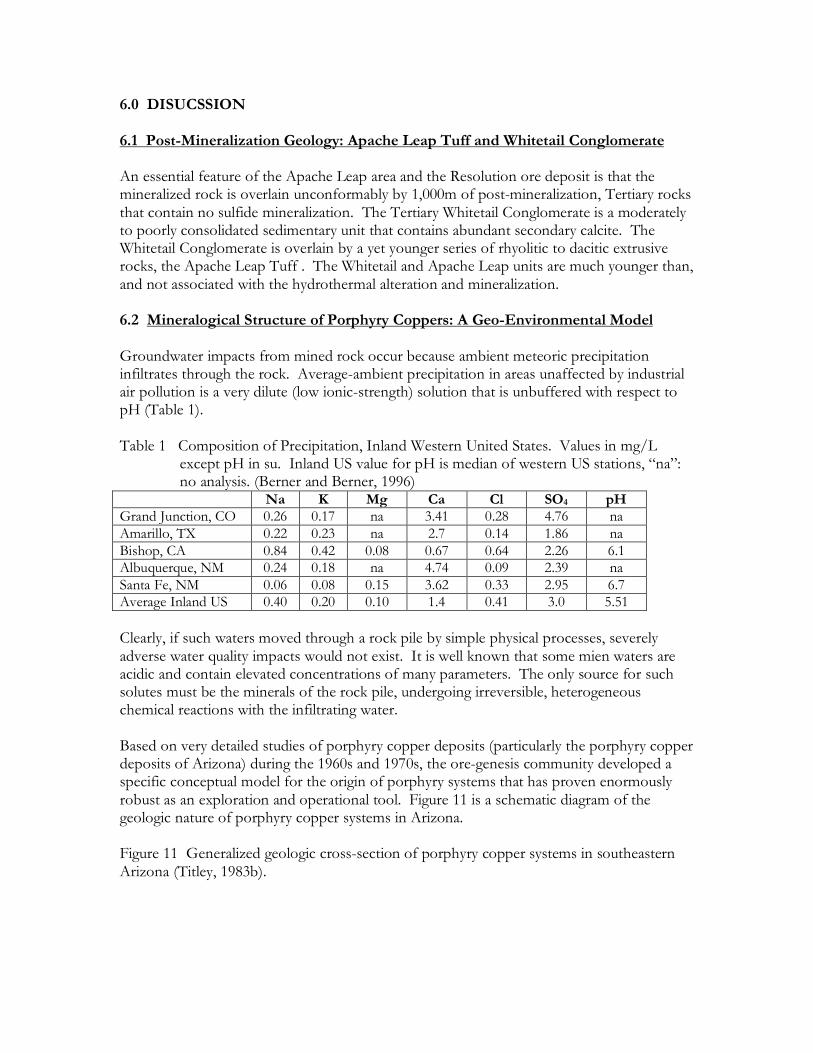
6.0 DISUCSSION 6.1 Post-Mineralization Geology: Apache Leap Tuff and Whitetail Conglomerate An essential feature of the Apache Leap area and the Resolution ore deposit is that the mineralized rock is overlain unconformably by 1,000m of post-mineralization, Tertiary rocks that contain no sulfide mineralization. The Tertiary Whitetail Conglomerate is a moderately to poorly consolidated sedimentary unit that contains abundant secondary calcite. The Whitetail Conglomerate is overlain by a yet younger series of rhyolitic to dacitic extrusive rocks, the Apache Leap Tuff . The Whitetail and Apache Leap units are much younger than, and not associated with the hydrothermal alteration and mineralization. 6.2 Mineralogical Structure of Porphyry Coppers: A Geo-Environmental Model Groundwater impacts from mined rock occur because ambient meteoric precipitation infiltrates through the rock. Average-ambient precipitation in areas unaffected by industrial air pollution is a very dilute (low ionic-strength) solution that is unbuffered with respect to pH (Table 1). Table 1 Composition of Precipitation, Inland Western United States. Values in mg/L
except pH in su. Inland US value for pH is median of western US stations, “na”: no analysis. (Berner and Berner, 1996)
Na K Mg Ca Cl SO4 pH Grand Junction, CO 0.26 0.17 na 3.41 0.28 4.76 na Amarillo, TX 0.22 0.23 na 2.7 0.14 1.86 na Bishop, CA 0.84 0.42 0.08 0.67 0.64 2.26 6.1 Albuquerque, NM 0.24 0.18 na 4.74 0.09 2.39 na Santa Fe, NM 0.06 0.08 0.15 3.62 0.33 2.95 6.7 Average Inland US 0.40 0.20 0.10 1.4 0.41 3.0 5.51 Clearly, if such waters moved through a rock pile by simple physical processes, severely adverse water quality impacts would not exist. It is well known that some mien waters are acidic and contain elevated concentrations of many parameters. The only source for such solutes must be the minerals of the rock pile, undergoing irreversible, heterogeneous chemical reactions with the infiltrating water. Based on very detailed studies of porphyry copper deposits (particularly the porphyry copper deposits of Arizona) during the 1960s and 1970s, the ore-genesis community developed a specific conceptual model for the origin of porphyry systems that has proven enormously robust as an exploration and operational tool. Figure 11 is a schematic diagram of the geologic nature of porphyry copper systems in Arizona. Figure 11 Generalized geologic cross-section of porphyry copper systems in southeastern Arizona (Titley, 1983b).

The central feature of the Arizona model is that intermediate igneous intrusives interact with pre-existing rocks, the nature of which is site-specific. At Resolution, the host rocks include Precambrian, Paleozoic and Mesozoic rocks (Figures 1 and 2), consistent with the Totley model. The essentially symmetric nature of the system is well shown in the Titley figure. This symmetry of alteration and mineralization derives form the establishment of forced convection of hydrothermal fluids as the hot igneous rocks intrude the pre-existing system. The hydrothermal waters probably include a portion of truly primitive igneous water expelled from the magma as it cools, but were predominantly re-circulating meteoric water (e.g., Burnham, 1997; Cathles, 1997). The heated and mineralized waters circulate around the intrusive heat source for some few millions of years, with the convective cells gradually decaying with time (Cathles, 1997). The nature of the convective flow over long times redistributes mass in a quite regular manner, with most of the sulfide mineralization occurring near the contact of the intrusive and the country rocks, often more in the country rock. The essential symmetry of sulfide mineralization and hydrothermal alteration is emphasized in the classic figure from Lowell and Guilbert (1970), Figure 12. The zonation of hydrothermal alteration, the reaction products of the hydrothermal solutions and the country rocks, has a traditional set of names and a spatial sequence, ranging from Potassic alteration in the core outward through Phyllic (or Quartz-Sericite-Pyrite), to Propylitic zones. If (as shown schematically in Figure 11) the hydrothermal system encounters carbonate rocks, which are both more permeable and more chemically reactive than other host rocks, Skarn mineralization forms. Figure 12 Symmetrical Zonation of Arizona-Type Porphyry Copper Mineralization (Lowell
and Guilbert, 1970).

The No. 10 Shaft will not encounter any Potassic alteration, but does show Phyllic, Propylitic and Skarn zones, depending on elevation and host lithology. The indicator minerals for the observed alteration zones are shown in the legend for Figures 3-5. Phyllic and Skarn zones are especially high in sulfide minerals (see Appendix A, Worksheet Mineralization, and Appendix B for sulfur concentrations). Propylitically altered rocks (which Shaft No. 10 will encounter in the upper portion of the Cretaceous sedimentary sequence) typically have significant amounts of calcite, CaCO3 to provide available neutralization potential (see Appendix A, Worksheet Alteration and Figure 4) Shaft No. 10 will encounter (at depth) sulfide-mineralized, but not ore-grade rocks, because it accesses the Resolution system from the outside. The typically zoned nature of the Resolution ore deposit is consistent with the Titley and Lowell and Guilbert models, as shown in Figure 13.
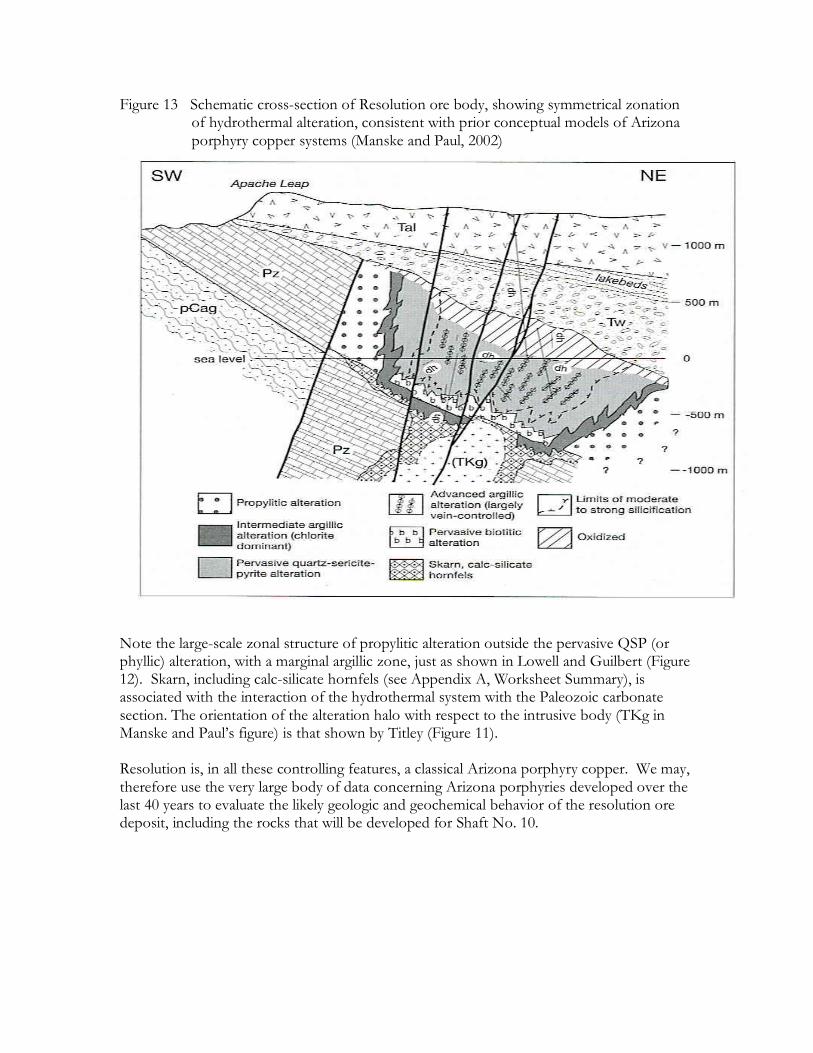
Figure 13 Schematic cross-section of Resolution ore body, showing symmetrical zonation of hydrothermal alteration, consistent with prior conceptual models of Arizona porphyry copper systems (Manske and Paul, 2002)
Note the large-scale zonal structure of propylitic alteration outside the pervasive QSP (or phyllic) alteration, with a marginal argillic zone, just as shown in Lowell and Guilbert (Figure 12). Skarn, including calc-silicate hornfels (see Appendix A, Worksheet Summary), is associated with the interaction of the hydrothermal system with the Paleozoic carbonate section. The orientation of the alteration halo with respect to the intrusive body (TKg in Manske and Paul’s figure) is that shown by Titley (Figure 11). Resolution is, in all these controlling features, a classical Arizona porphyry copper. We may, therefore use the very large body of data concerning Arizona porphyries developed over the last 40 years to evaluate the likely geologic and geochemical behavior of the resolution ore deposit, including the rocks that will be developed for Shaft No. 10.
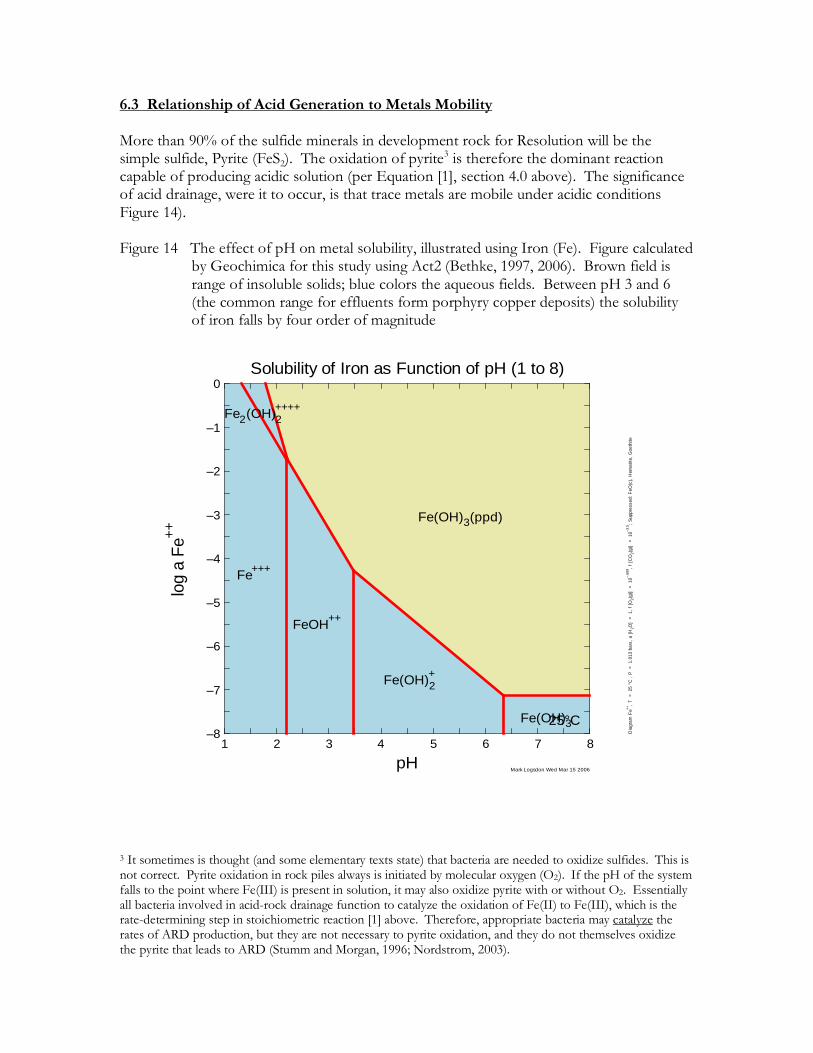
6.3 Relationship of Acid Generation to Metals Mobility More than 90% of the sulfide minerals in development rock for Resolution will be the simple sulfide, Pyrite (FeS2). The oxidation of pyrite3 is therefore the dominant reaction capable of producing acidic solution (per Equation [1], section 4.0 above). The significance of acid drainage, were it to occur, is that trace metals are mobile under acidic conditions Figure 14). Figure 14 The effect of pH on metal solubility, illustrated using Iron (Fe). Figure calculated
by Geochimica for this study using Act2 (Bethke, 1997, 2006). Brown field is range of insoluble solids; blue colors the aqueous fields. Between pH 3 and 6 (the common range for effluents form porphyry copper deposits) the solubility of iron falls by four order of magnitude
4 order of magnmitude
3 It sometimes is thought (and some elementary texts state) that bacteria are needed to oxidize sulfides. This is not correct. Pyrite oxidation in rock piles always is initiated by molecular oxygen (O2). If the pH of the system falls to the point where Fe(III) is present in solution, it may also oxidize pyrite with or without O2. Essentially all bacteria involved in acid-rock drainage function to catalyze the oxidation of Fe(II) to Fe(III), which is the rate-determining step in stoichiometric reaction [1] above. Therefore, appropriate bacteria may catalyze the rates of ARD production, but they are not necessary to pyrite oxidation, and they do not themselves oxidize the pyrite that leads to ARD (Stumm and Morgan, 1996; Nordstrom, 2003).
1 2 3 4 5 6 7 8–8
–7
–6
–5
–4
–3
–2
–1
0
pH
log
a Fe
++
Solubility of Iron as Function of pH (1 to 8)
Fe+++
Fe(OH)2+
Fe(OH)3
Fe2(OH)2++++
FeOH++
Fe(OH)3(ppd)
25°C
Mark Logsdon Wed Mar 15 2006
Dia
gram
Fe++
, T =
25
°C ,
P =
1.0
13 b
ars,
a [H
2O]
= 1
, f [O
2(g)
] =
10–.
699 , f
[CO
2(g)
] =
10–3
.5; S
uppr
esse
d: F
eO(c
), H
emat
ite, G
oeth
ite
Between pH 3 and 6 (the common range for effluents from porphyry copper deposits) the solubility of iron falls by four order of magnitude; similar solubility curves exist for all transition metals, and metal attenuation by surface reactions (“sorption”) also is pH-sensitive (Bethke, 1997; Smith, 1999). Therefore, the fundamental geochemistry of metals, the principal source of risk to human health and the environmental in contaminated mining waters, is related to the risk of acid generation. 6.4 Acid-Base Balance in Shaft No. 10 The fundamentals of acid-base chemistry for the Shaft No. 10 rocks are summarized in Figures 3-6. To recapitulate, the two fundamental chemical reactions that summarize acid-base accounting are reaction [1] and [2] in Section 4.0 above: [1] FeS2 + 15/4 O2 + 7/2 H2O Fe(OH)3 + 2 SO4
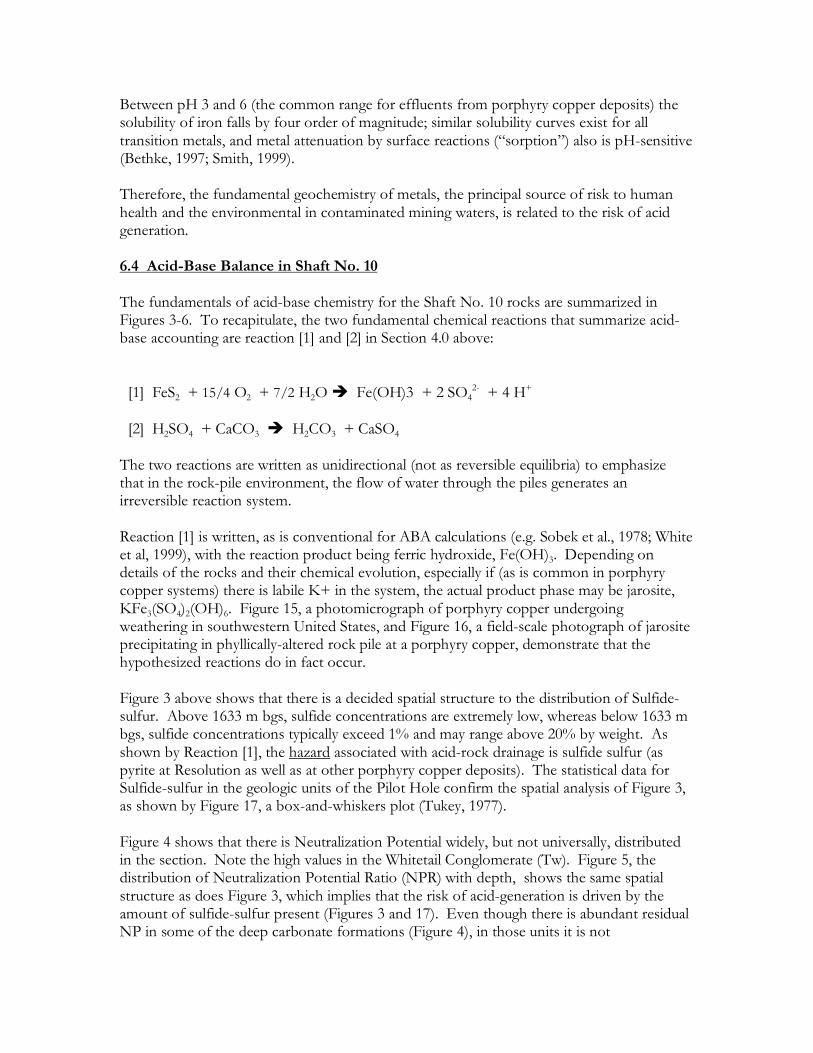
2- + 4 H+ [2] H2SO4 + CaCO3 H2CO3 + CaSO4 The two reactions are written as unidirectional (not as reversible equilibria) to emphasize that in the rock-pile environment, the flow of water through the piles generates an irreversible reaction system. Reaction [1] is written, as is conventional for ABA calculations (e.g. Sobek et al., 1978; White et al, 1999), with the reaction product being ferric hydroxide, Fe(OH)3. Depending on details of the rocks and their chemical evolution, especially if (as is common in porphyry copper systems) there is labile K+ in the system, the actual product phase may be jarosite, KFe3(SO4)2(OH)6. Figure 15, a photomicrograph of porphyry copper undergoing weathering in southwestern United States, and Figure 16, a field-scale photograph of jarosite precipitating in phyllically-altered rock pile at a porphyry copper, demonstrate that the hypothesized reactions do in fact occur. Figure 3 above shows that there is a decided spatial structure to the distribution of Sulfide-sulfur. Above 1633 m bgs, sulfide concentrations are extremely low, whereas below 1633 m bgs, sulfide concentrations typically exceed 1% and may range above 20% by weight. As shown by Reaction [1], the hazard associated with acid-rock drainage is sulfide sulfur (as pyrite at Resolution as well as at other porphyry copper deposits). The statistical data for Sulfide-sulfur in the geologic units of the Pilot Hole confirm the spatial analysis of Figure 3, as shown by Figure 17, a box-and-whiskers plot (Tukey, 1977). Figure 4 shows that there is Neutralization Potential widely, but not universally, distributed in the section. Note the high values in the Whitetail Conglomerate (Tw). Figure 5, the distribution of Neutralization Potential Ratio (NPR) with depth, shows the same spatial structure as does Figure 3, which implies that the risk of acid-generation is driven by the amount of sulfide-sulfur present (Figures 3 and 17). Even though there is abundant residual NP in some of the deep carbonate formations (Figure 4), in those units it is not
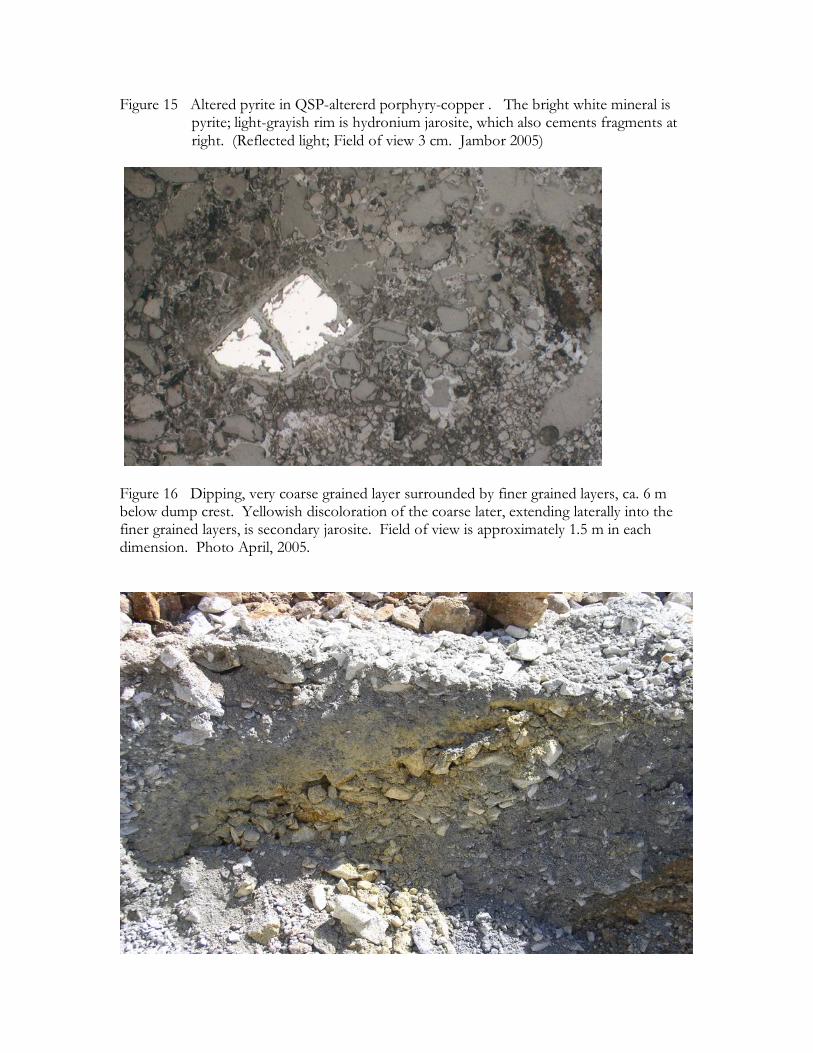
Figure 15 Altered pyrite in QSP-altererd porphyry-copper . The bright white mineral is pyrite; light-grayish rim is hydronium jarosite, which also cements fragments at right. (Reflected light; Field of view 3 cm. Jambor 2005)
Figure 16 Dipping, very coarse grained layer surrounded by finer grained layers, ca. 6 m below dump crest. Yellowish discoloration of the coarse later, extending laterally into the finer grained layers, is secondary jarosite. Field of view is approximately 1.5 m in each dimension. Photo April, 2005.

Figure 17 Statistical data summary, Sulfide-Sulfur. Data for Kvs-Ks is divided into those at or above 1633m bgs (“Kvs”) and those below 1633m (“Kvs_1633”). Y-axis in wt% Sulfur.
TAL: Apache Leap Tuff; TW” Whitetail Conglomerate; KVS: Cretaceous volcaniclastics and sediments; Skr: Skarns in Paleoizoix carbonates; CB_PCMLS: Bolsa Quartzite and upper Precambrian sedimentary rocks; PCDIAB: Precambrian diabase; PCDSLS: Precambrian Drippings Springs formation adequate to offset the Acid Generation Potential derived from the very high sulfide-sulfur values in those units (see medians and inter-quartile ranges in Figure 17). Figure 6, the NP and AP (MPA) relationship, and Figure 8, the relationship of NNP to NAGpH, confirm that almost all samples fall into classes that are clearly expected to be acid-generating or clearly non-acid-generating. When the plots include (as do Figures 6 and 8) identifications of the geologic units, it is clear that these figures also express the shallow-deep division seen in Figures 3, 5 and 17. The few (~5% of total tested intervals) that are classified on these plots as “uncertain” are easily explain as being samples form the skarnified units that contain residual calcite. In such samples the single-addition NAG test used for this study may be dominated by the short-range reactivity of the carbonates and not reflect the full acidification potential of the massive sulfide portion of the skarn (Miller et al., 1990). Geochemical and industry experience dictate that the very high sulfide contents would generate high TDS (dominated by dissolved sulfate) waters, capable of adversely affecting groundwater, even before the samples became acid generating. In light of this and also their position in the mining sequence, RCM would treat all such “uncertain” samples as if they would become acid-generating. The data clearly show that, because they contain de minimis levels of sulfide-sulfur, rocks above 1633m bgs have no risk of generating acidic leachates to ground water.
Min-Max25%-75%Median value
Box & Whisker Plot
-2
2
6
10
14
18
22
26
30
TALTW
KVSKVS_1630
SKRCB_PCMLS
PCDIABPCDSLS
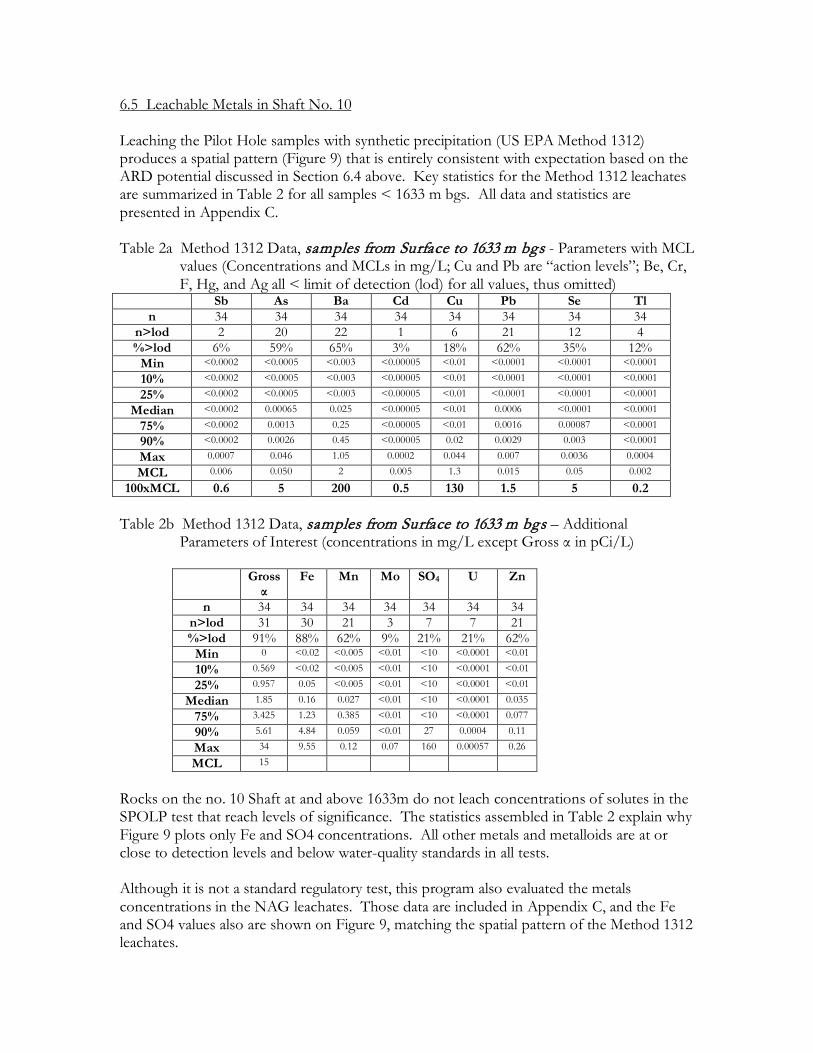
6.5 Leachable Metals in Shaft No. 10 Leaching the Pilot Hole samples with synthetic precipitation (US EPA Method 1312) produces a spatial pattern (Figure 9) that is entirely consistent with expectation based on the ARD potential discussed in Section 6.4 above. Key statistics for the Method 1312 leachates are summarized in Table 2 for all samples < 1633 m bgs. All data and statistics are presented in Appendix C. Table 2a Method 1312 Data, samples from Surface to 1633 m bgs - Parameters with MCL
values (Concentrations and MCLs in mg/L; Cu and Pb are “action levels”; Be, Cr, F, Hg, and Ag all < limit of detection (lod) for all values, thus omitted)
Sb As Ba Cd Cu Pb Se Tl n 34 34 34 34 34 34 34 34
n>lod 2 20 22 1 6 21 12 4 %>lod 6% 59% 65% 3% 18% 62% 35% 12%
Min <0.0002 <0.0005 <0.003 <0.00005 <0.01 <0.0001 <0.0001 <0.0001 10% <0.0002 <0.0005 <0.003 <0.00005 <0.01 <0.0001 <0.0001 <0.0001 25% <0.0002 <0.0005 <0.003 <0.00005 <0.01 <0.0001 <0.0001 <0.0001
Median <0.0002 0.00065 0.025 <0.00005 <0.01 0.0006 <0.0001 <0.0001 75% <0.0002 0.0013 0.25 <0.00005 <0.01 0.0016 0.00087 <0.0001 90% <0.0002 0.0026 0.45 <0.00005 0.02 0.0029 0.003 <0.0001 Max 0.0007 0.046 1.05 0.0002 0.044 0.007 0.0036 0.0004
MCL 0.006 0.050 2 0.005 1.3 0.015 0.05 0.002
100xMCL 0.6 5 200 0.5 130 1.5 5 0.2 Table 2b Method 1312 Data, samples from Surface to 1633 m bgs – Additional
Parameters of Interest (concentrations in mg/L except Gross α in pCi/L)
Gross α
Fe Mn Mo SO4 U Zn
n 34 34 34 34 34 34 34 n>lod 31 30 21 3 7 7 21 %>lod 91% 88% 62% 9% 21% 21% 62%
Min 0 <0.02 <0.005 <0.01 <10 <0.0001 <0.01
10% 0.569 <0.02 <0.005 <0.01 <10 <0.0001 <0.01 25% 0.957 0.05 <0.005 <0.01 <10 <0.0001 <0.01
Median 1.85 0.16 0.027 <0.01 <10 <0.0001 0.035
75% 3.425 1.23 0.385 <0.01 <10 <0.0001 0.077
90% 5.61 4.84 0.059 <0.01 27 0.0004 0.11
Max 34 9.55 0.12 0.07 160 0.00057 0.26
MCL 15
Rocks on the no. 10 Shaft at and above 1633m do not leach concentrations of solutes in the SPOLP test that reach levels of significance. The statistics assembled in Table 2 explain why Figure 9 plots only Fe and SO4 concentrations. All other metals and metalloids are at or close to detection levels and below water-quality standards in all tests. Although it is not a standard regulatory test, this program also evaluated the metals concentrations in the NAG leachates. Those data are included in Appendix C, and the Fe and SO4 values also are shown on Figure 9, matching the spatial pattern of the Method 1312 leachates.
6.6 Total Metals in Shaft No. 10 All data on total metals concentrations are provided in Appendix D. As shown in Figure 10, the only samples in which any metals approach or exceed 1 wt% are in the section below 1633 m bgs, and only Cu and Zn (among trace metals) exceed 1% in any sample. These two metals are elevated in the skarn zones, which is expected for the reactivity of carbonate-bearing sequences and fully consistent with other Arizona porphyry copper systems (E.g., Einaudi, 1983). Measurable concentrations of metals and other species exist in most of the samples, but the leachability, discussed in Section 6.5 above, is extremely limited. 7.0 CONCLUSIONS AND RECOMMENDATIONS 7.1 Geochemical Reactivity Geochemical reactivity that could adversely affect water quality in rocks to be mined during sinking of Shaft No. 10 is limited to rocks below 1633 m bgs. At and above 1633 m bgs, there is no discernible risk of acid generation, leachable metals (by Method 1312) are not a risk, and total metal concentrations are very low. Below 1633 m bgs, sulfide concentrations are elevated (> 1wt%), there are elevated total metals preset, and metals and some metalloids are leachable under synthetic precipitation testing. 7.2 Controls on Geochemical Reactivity The controls on geochemical reactivity are very clear: sulfide mineralization and hydrothermal alteration that has depleted the Neutralization Potential compared to the Acid-Generation Potential. This is entirely consistent with other porphyry-copper systems in Arizona and aroudnthe world, and is expected for a geo-environmental model of porphyry coppers (e.g., du Bray, 1995, Plumlee et al., 1999). The upper 1000 m of the system is unmineralized rock deposited millions of years after the ore-forming event. The Whitetail Conglomerate, particularly, contains substantial secondary carbonate, but neither rit nor the Apache Leap Tuff have sulfide-sulfur at more than de minimis levels. Because Shaft No. 10 will be peripheral to the ore deposit (by more than a kilometer), the observed hydrothermal alteration and mineralization is very low compared to the rocks of the ore deposit itself. Therefore, the initial 600 m of the Cretaceous rock encountered in shaft sinking will be propylitized (adding Neutyralization Potential), but very low in sulfide-sulfur. The empirical data are completely consistsent with the largely symmetrical nature of porphyry-copper systems, as diascussed in detail in Section 6.2 above. 7.3 “Inert” Material Based on the geochemical test work, and evaluated in terms of the geologic and geo-environmental model for a porphyry copper system, Geochimica recommends that development rock from ground surface to 1633 m bgs in Shaft No. 10 be considered “inert”
in the sense of ADEQ 2006 guidance. Because of the very clear geologic and mineralogical break that distinguishes the upper, inert section from the lower reactive section, visual observation by a trained geologist or geological technician would be adequate to confirm that mined rock from ground surface tio 1633m bgs in fact corresponds to the rock tested in the Pilot Hole. We recommend that rocks below 1633 m bgs in Shaft No. 120 and in break-out zones from the base of the shaft that are in equivalent lithologies should be treated as geochemically reactive with respect to potential impacts to groundwater were they placed in rock piles at the ground surface. Additional geochemical characterization is expected to support APP application and detailed disposal planning for reactive rock below 1633 m bgs in Shaft No. 10. Such rock will not be encounterd for at least two years after shaft-sinking commences, and so does not need to be addressed at this time. 7.4 Application of This Methodology to Future RCM Excavations The identification of 1633 m bgs as a reliable boundary for distinguishing inert rock from geochemically reactive rock that needs to be managed under the Aquifer Protection Permitting Program is specific to Shaft No. 10. The geology of the overall Resolution Project site is reasonably consistent, but not identical in all respects at all places. Therefore Geochimica recommends, and understands that RCM agrees, that future shafts and other excavations will require project-specific geochemical characterization analogous to the approach used for the Shaft No. 10 characterization. 8.0 REFERENCES Arizona Department of Environmental Quality (ADEQ), 2006. Arizona Mining BADCT
Guidance Manual, Aquifer Protection Program, ADEQ Publication # TB 04-01. [The text we used was provided by ADEQ in Adobe pdf format. The document is undated, but our download was made in April 2006]
Berner, E.K. and R.A. Berner, 1996. Global Environment: Water, Air, and Geochemical Cycles.
Upper Saddle River, NJ: Prentice Hall. Bethke, C.M., Geochemical Reaction Modeling. New York: Cambridge University Press. Bethke, C.M., 2005. The Geochemist’s Workbench (Release 6.0) Reference Manual. University of
Illinois. (Updated to Release 6.0.4, 2006) Burnham, C.W., 1997. Magmas and Hydrothermal Fluids, in H.L. Barnes (Ed.), Geochemistry
of Hydrothermal Ore Deposits, 3rd Ed., New York: John Wiley & Sons, p. 63-123. Cathles, L.M., III, 1997. Thermal Aspects of Ore Formation, in H.L. Barnes (Ed.),
Geochemistry of Hydrothermal Ore Deposits, 3rd Ed., New York: John Wiley & Sons, p. 191-227.
du Bray, E.A. (Ed.), 1995. Preliminary descriptive geo-environmental models of mineral deposits: U.S. Geological Survey Open-File Report 95-231.
Einaudi, M.T., 1983. General Features and Origin of Skarns Associated with Porphyry
Copper Plutons, Southwestern North America., in S.R. Titley, S.R., 1983. Advances in Geology of the Porphyry Copper Deposits, Southwestern North America. Tucson, University of Arizona Press. P. 185-209.
Golder Associates, Inc. (GAI), 2007. Development Rock Disposal – APP Pre-Application
Meeting: RCML Introduction. Powerpoint® presentation package to K. Kilgore (ADEQ), 05 January 2007.
Holland, H.D., The Chemistry of the Atmosphere and Oceans. New York: John Wiley & Sons. Jambor, J.L., 2005. Environmental Mineralogy of Waste Rock, Eastside Rock Piles,
Bingham Canyon, Utah. Contractor Report. Lowell, J.D. and J.M. Guilbert, 1970. Lateral and vertical alteration-mineralization zoning in
porphyry ore deposits. Economic Geology, vol. 65, p. 373-408. Maest, A.S, J.R. Kuipers, C.L. Travers, and D.A. Atkins, 2006. PredictingWater QWuality at
Hradrock Pines: methods and Models, Uncertainties, and State-of-the-Art. Privately published by Earthworks and the Wilburforce Foiundation.
Manske, S.L. and A.H. Paul, 2002. Geology of a Major New Porphyry Copper Center in the
Superior (Pioneer) District, Arizona. Economic Geology, vol. 97, p. 197-220. Meyer, Charles and J.J. Hemley, 1967. Wall rock alteration, in H.L. Barnes (Ed.) Geochemistry
of Hydrothermal Ore Deposits. New York: Holt, Rinehart and Wimnston, p. 166-235. Miller, S.D., J.J. Jeffery, and G.S.C. Murray, 1990. Identification and management of acid-
generating wastes – Procedures and Practices in Southeast Asia and the Pacific Regions, in J.W. Gadsby, J.A. Malick, and S.J. Day (eds.), Acid Mine Drainage – Designing for Closure. BiTech Publishers (Vancouver BC), p 1-11.
Nordstrom, D.K., 2003. Effects of Microbiological and Geochemical Interactions in Mine
Drainage, in J.L. Jambor, D.W. Blowes, and A.I.M. Ritchie (Eds), Environmental Aspects of Mine Wastes. Mineralogical Association of Canada Short Course Series, Vol. 31, p. 227-238
Plumlee, G.S., 1999. The Environmental Geology of Mineral Deposits, in G.S. Plumlee and
M.J. Logsdon (Eds.), The Environmental Geochemistry of Mineral Deposits, Part A: Processes, Techniques, and Health Issues. Society of Economic Geologists, Reviews in Economic Geology, Vol. 6A, p. 71-116.
Plumlee, G.S., K.S. Smith, M.R. Montour, W.H. Ficklin, and E.L. Mosier, 1999. Geologic
Controls on the Composition of Natural Waters and Mine Waters Draining Diverse Mineral-Deposit Types, in L.H. Filipek and G.S. Plumlee (Eds.), The Environmental
Geochemistry of Mineral Deposits, Part B: Case Studies and Research Topics. Society of Economic Geologists, Reviews in Economic Geology, Vol. 6B, p. 373-432.
Sobek, A.A., W.A. Schuller, J.R. Freeman, and R.M. Smith, 1978. Field and laboratory
methods applicable to overburden and minesoils. U.S. E.P.A. Report EPA-600/2-78-054.
Smith, K.S., 1999. Metal Sorption on Mineral Surfaces: An Overview with Examples
Relating to Mineral Deposits, in G.S. Plumlee and M.J. Logsdon (Eds.), The Environmental Geochemistry of Mineral Deposits, Part A: Processes, Techniques, and Health Issues. Society of Economic Geologists, Reviews in Economic Geology, Vol. 6A, p. 71-116.
Stumm, Werner and J.J. Morgan, 1996. Aquatic Chemistry: Chemical Equilibria and Rates in
Natural Waters, 3rd Ed. New York: John Wiley & Sons. Titley, S.R. (Ed.), 1983a. Advances in Geology of the Porphyry Copper Deposits, Southwestern
North America. Tucson, University of Arizona Press. Titley, SR, 1983b. The Style and Progress of Mineralization and Alteration in Porphyry
Copper Systems, American Southwest, in S.R. Titley, S.R., 1983. Advances in Geology of the Porphyry Copper Deposits, Southwestern North America. Tucson, University of Arizona Press. P. 93-116.
Titley, S.R. and C.L. Hicks, 1967. Geology of the Porphyry Copper Deposits, Southwestern North
America. Tucson, University of Arizona Press. Tran, A.B, 2003. Geochemistry of Acid Generating Waste Rock Dumps: M.Phil. (U. Queensland,
Civil Engineering) Thesis. Appendix B3, pages B3.1-B3.4. Tukey, J.W., 1977. Exploratory Data Analysis. Reading, MA: Addison-Wesley. White, W.W., K.A. Lapakko, and R.L. Cox, 1999. Static-Test Methods MostCommonly
Used to Predict Acid0Minre Drainage: Practical Guidelines for Use and Interpretation, in G.S. Plumlee and M.J. Logsdon (Eds.), The Environmental Geochemistry of Mineral Deposits, Part A: Processes, Techniques, and Health Issues. Society of Economic Geologists, Reviews in Economic Geology, Vol. 6A, p. 325-338.