Embed Size (px)
Citation preview

HDR Engineering, Inc.
6300 So Old Village Place Suite 100 Sioux Falls, South Dakota 57108
Phone (605) 977-7740 Fax (605) 977-7747 www.hdrinc.com
Page 1 of 5
Technical Memo To: Steve Gramm, SDDOT
From: Rick Laughlin, HDR Project: I-190/Silver St. Study, Phase II
CC:
Date: 7/20/11 Job No: HDR 137390, Work order PD-02-09, Amendment 3, Agreement 410445
RE: Traffic Analysis
This memorandum documents the traffic analysis conducted for the second phase of the Interstate 190/Silver Street study in Rapid City, SD. The results of the traffic analysis have also been carried forward for use in the Interchange Justification Report (IJR) and Environmental Assessment (EA) being prepared for this study.
Lane Demand
The number and types of lanes needed to provide at least Level of Service D were determined using traffic forecasts and Synchro software. The traffic forecasts were based on output from the regional travel demand model maintained by the City of Rapid City. While a similar analysis was conducted for a much larger area in Phase 1, this memorandum is confined to the IJR study area.
The analysis shows that no additional mainline lanes will be required on I-190, with all sections of I-190 running at LOS “A” or “B” with the existing 4-lane configuration. The mainline levels of service are summarized in the following table:
TABLE: INTERSTATE MAINLINE LOS 2030 CONDITIONS
2010 NO‐BUILD ALT. 1 ALT. 1A ALT. 2A ALT. 3A
SECTION AM PM AM PM AM PM AM PM AM PM AM PMNB OMAHA TO SILVER OFF A A B C B B B B B B B B NB SILVER OFF TO ANAMOSA A A B B NB SILVER OFF TO SILVER ON B B B B B B B B NB SILVER ON TO I‐90 B B B B B B B B NB ANAMOSA TO I‐90 A A B B SB I‐90 TO SILVER OFF A A B B B B B B B B B B SB SILVER OFF TO SILVER ON A A B A A B A B A B A B
SB SILVER ON TO OMAHA A A B B B B B B B B B B The ramps at the I-190/Silver Street interchange and at Interstate 90 are also expected to operate well with the existing single-lane configuration. The ramp levels of service are summarized in the following table:

HDR Engineering, Inc.
6300 So Old Village Place Suite 100 Sioux Falls, South Dakota 57108
Phone (605) 977-7740 Fax (605) 977-7747 www.hdrinc.com
Page 2 of 4
TABLE: INTERSTATE RAMP LOS 2030 CONDITIONS
2010 NO‐BUILD ALT. 1 ALT. 1A ALT. 2A ALT. 3A
RAMP AM PM AM PM AM PM AM PM AM PM AM PM SILVER OFF NB A B B B B A B A B B B B ANAMOSA ON NB A B B B SILVER ON NB A A A A A A A A I‐90 OFF NB A A A A A A A A A A A A I‐90 OFF WB A A A A A A A A A A A A I‐90 ON WB A A A A A A A A A A A A I‐90 ON SB A A B B A A A A A A A A SILVER OFF SB A A B A A A A A A A A A
SILVER ON SB A A B A A A B B B B A B
The study area intersections are expected to continue to operate at acceptable levels of service into the future, with a few changes related to the implementation of each of the future interchange alternatives. The intersection operations are summarized in the following table:
TABLE: INTERSECTION LOS
2030 CONDITIONS
2010 NO‐BUILD ALT. 1 ALT. 1A ALT. 2A ALT. 3A
INTERSECTION AM PM AM PM AM PM AM PM AM PM AM PMCROSSROAD/I‐190 SB A A A A B B B B A A CROSSROAD/I190 NB A A C B B B B B B B CROSSROAD/I‐190 COMMON B B NORTH ST./MT. RUSHMORE RD. C B C C B A B A B A B A OMAHA ST./MT. RUSHMORE RD. C D D D D D D D D D D D
OMAHA ST./I‐190/WEST BLVD. C C C C C C C C C C C C
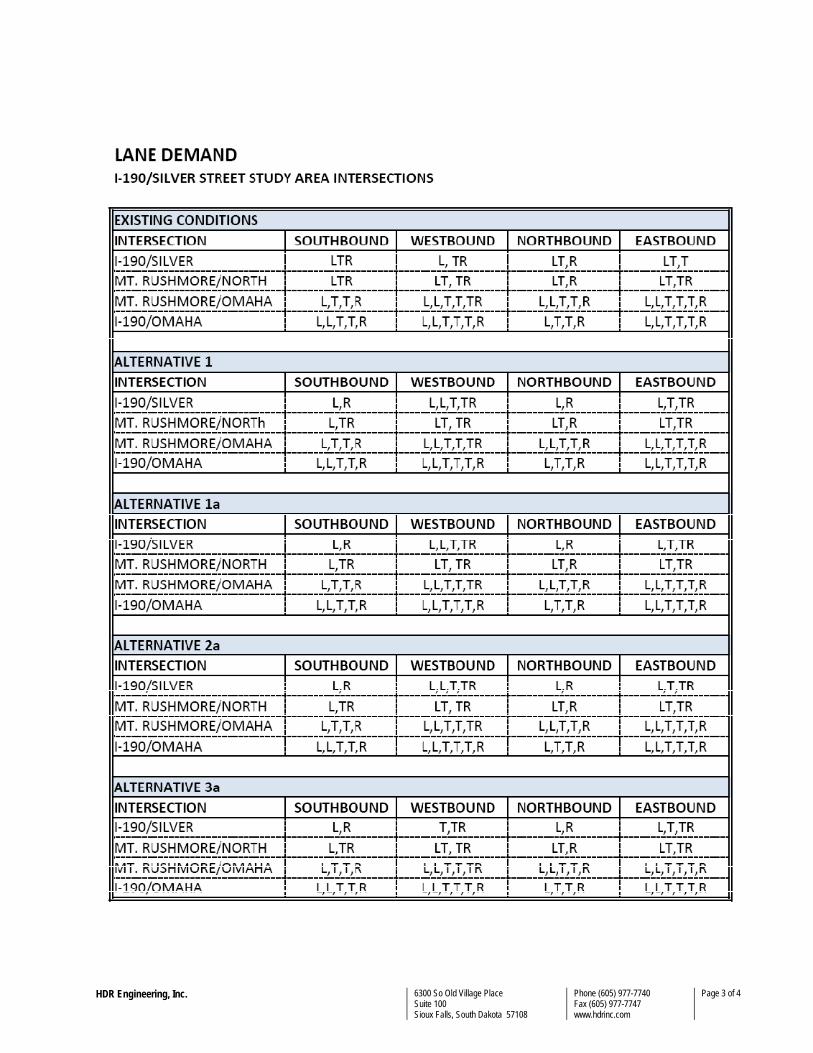
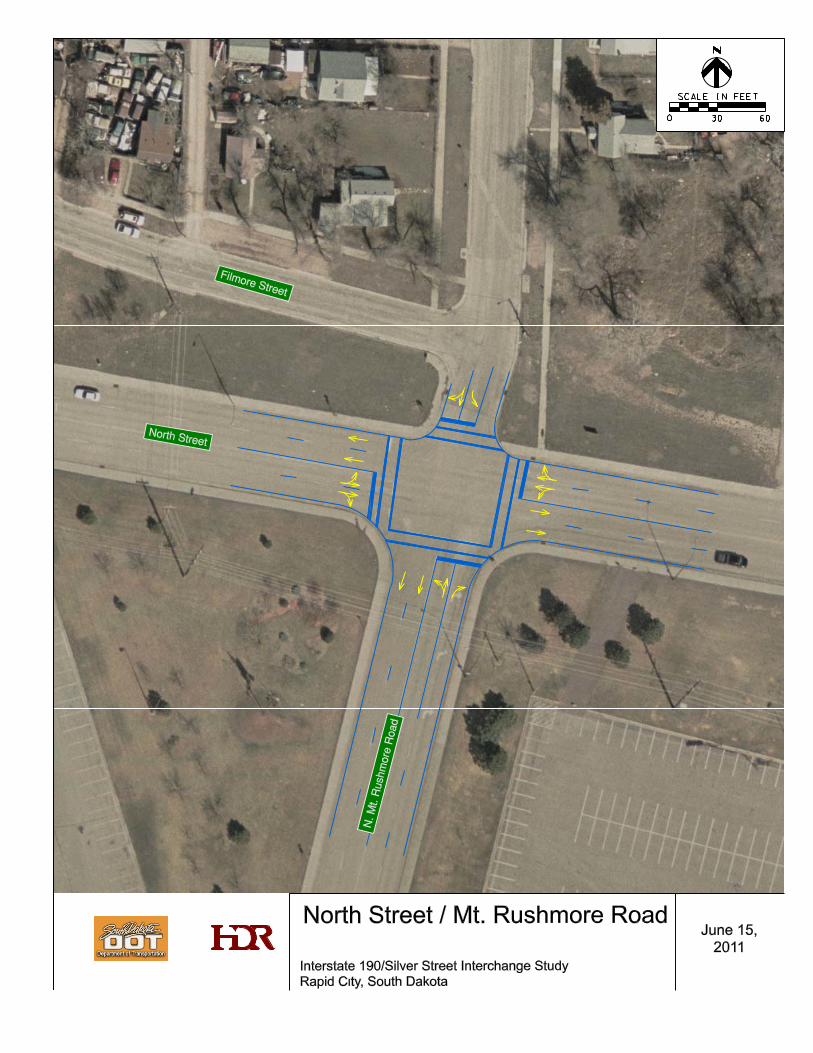
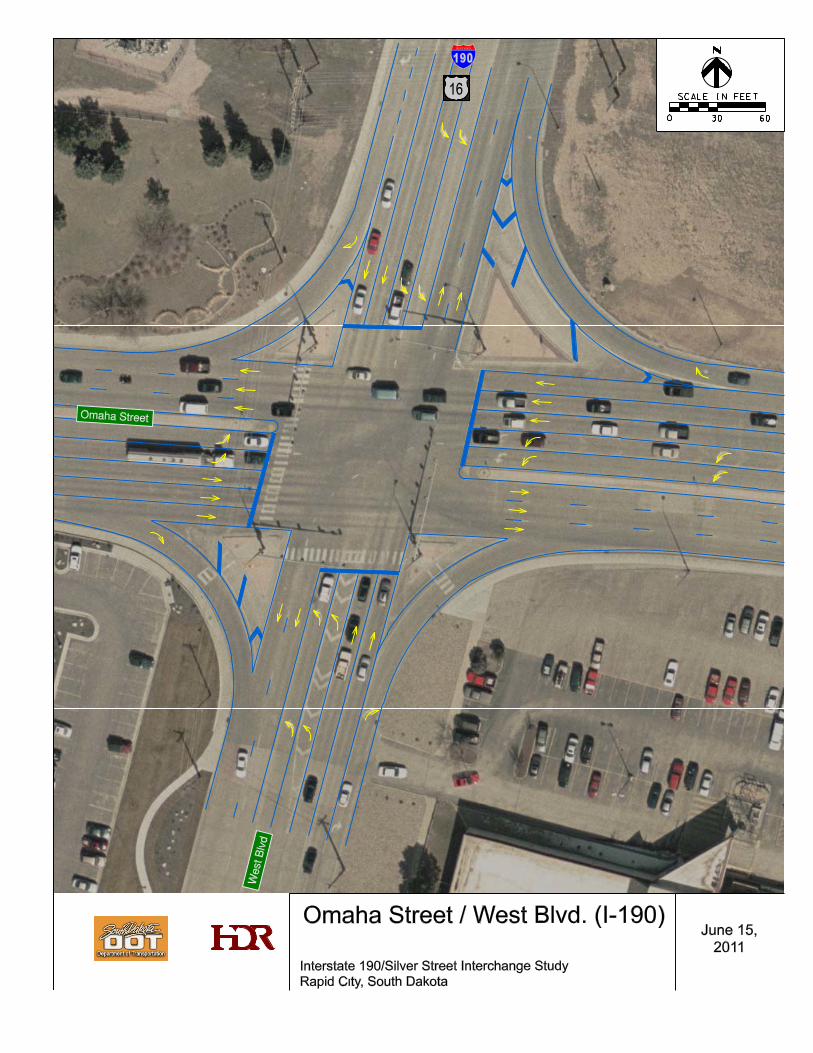
The lane demand for each study area intersection is shown in the following table for each interchange alternative. The lane demand is also shown in the interchange alternative graphics included later in this memorandum. The code used in the table is outlined below:
L = left turn lane
T = thru lane
R = right turn lane
LT = combined left/thru lane
RT = combined right/thru lane
(lanes are separated by commas)
HDR Engineering, Inc.
6300 So Old Village Place Suite 100 Sioux Falls, South Dakota 57108
Phone (605) 977-7740 Fax (605) 977-7747 www.hdrinc.com
Page 3 of 4
HDR Engineering, Inc.
6300 So Old Village Place Suite 100 Sioux Falls, South Dakota 57108
Phone (605) 977-7740 Fax (605) 977-7747 www.hdrinc.com
Page 4 of 4
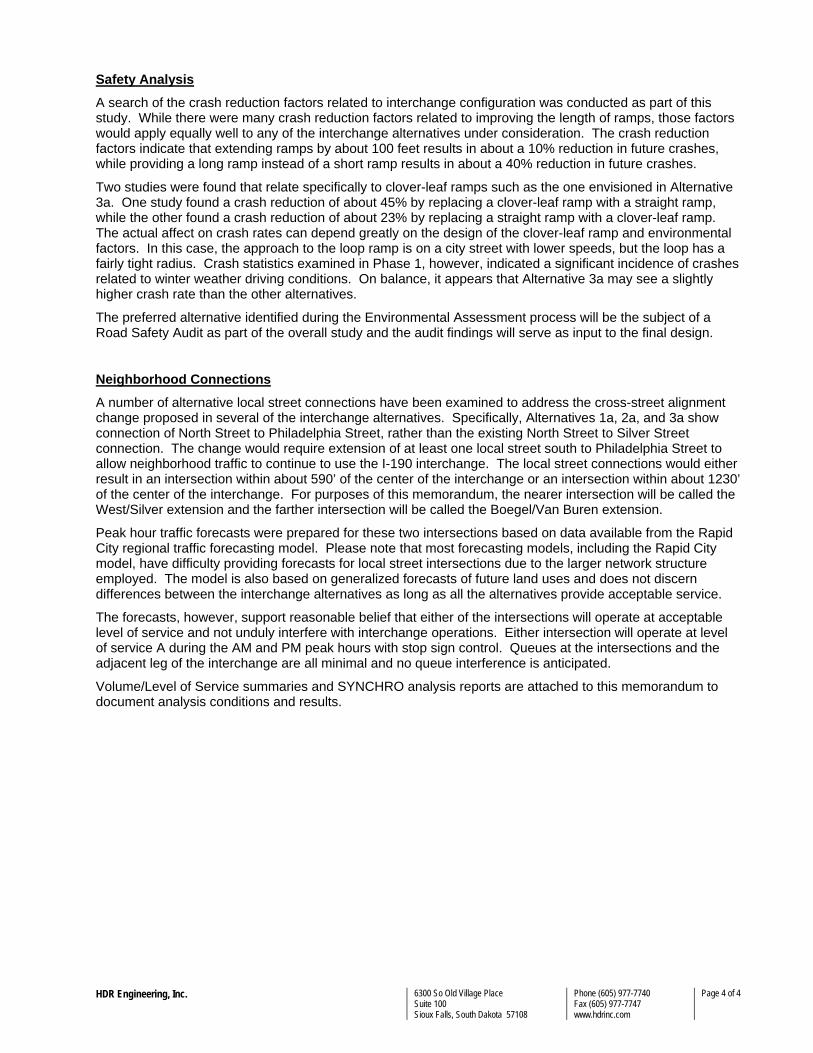
Safety Analysis
A search of the crash reduction factors related to interchange configuration was conducted as part of this study. While there were many crash reduction factors related to improving the length of ramps, those factors would apply equally well to any of the interchange alternatives under consideration. The crash reduction factors indicate that extending ramps by about 100 feet results in about a 10% reduction in future crashes, while providing a long ramp instead of a short ramp results in about a 40% reduction in future crashes.
Two studies were found that relate specifically to clover-leaf ramps such as the one envisioned in Alternative 3a. One study found a crash reduction of about 45% by replacing a clover-leaf ramp with a straight ramp, while the other found a crash reduction of about 23% by replacing a straight ramp with a clover-leaf ramp. The actual affect on crash rates can depend greatly on the design of the clover-leaf ramp and environmental factors. In this case, the approach to the loop ramp is on a city street with lower speeds, but the loop has a fairly tight radius. Crash statistics examined in Phase 1, however, indicated a significant incidence of crashes related to winter weather driving conditions. On balance, it appears that Alternative 3a may see a slightly higher crash rate than the other alternatives.
The preferred alternative identified during the Environmental Assessment process will be the subject of a Road Safety Audit as part of the overall study and the audit findings will serve as input to the final design.
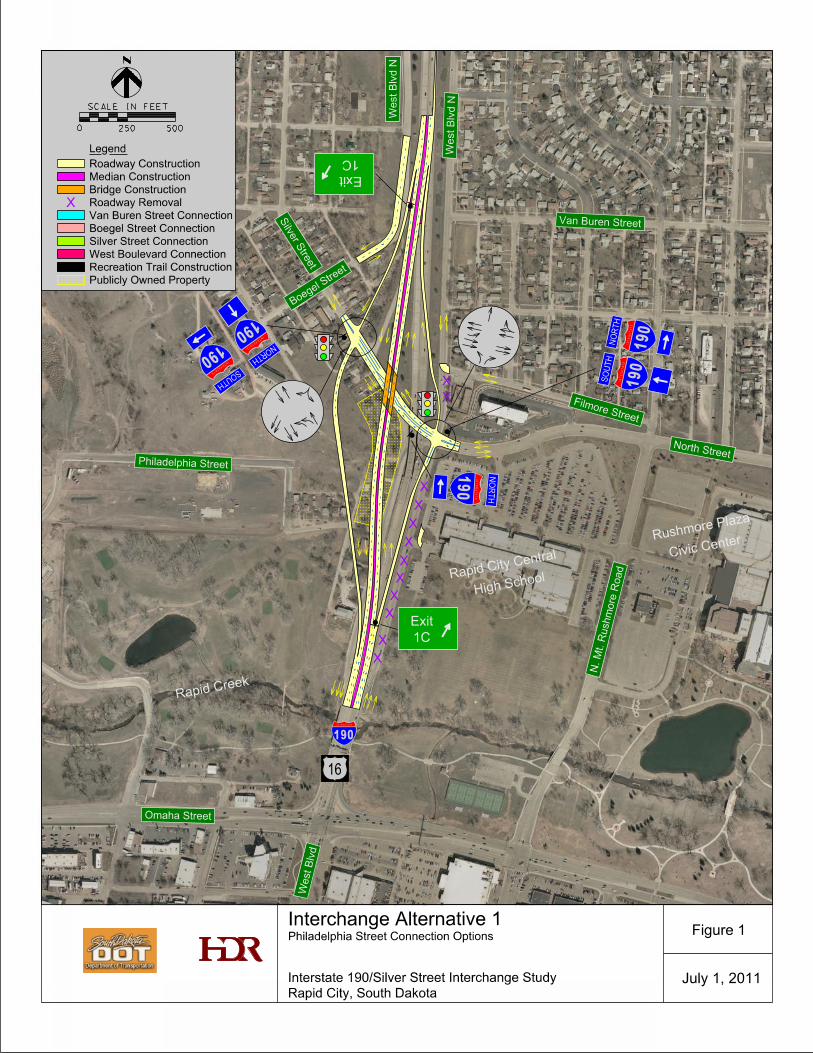
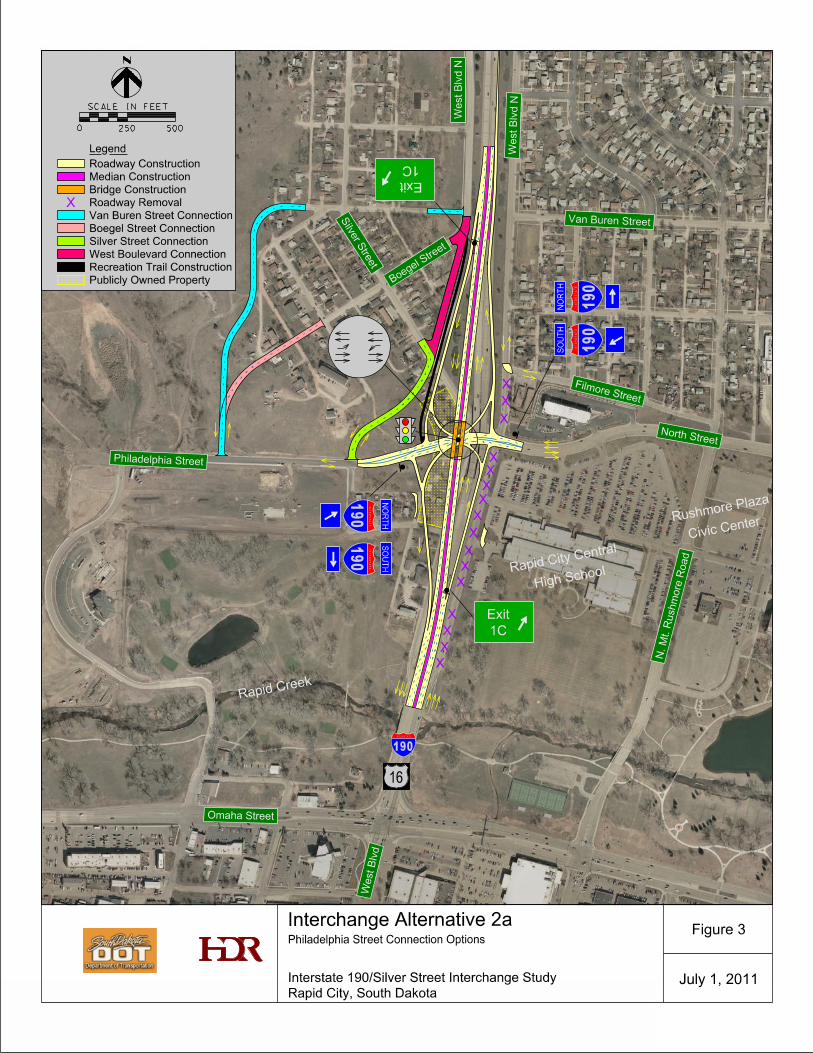
Neighborhood Connections
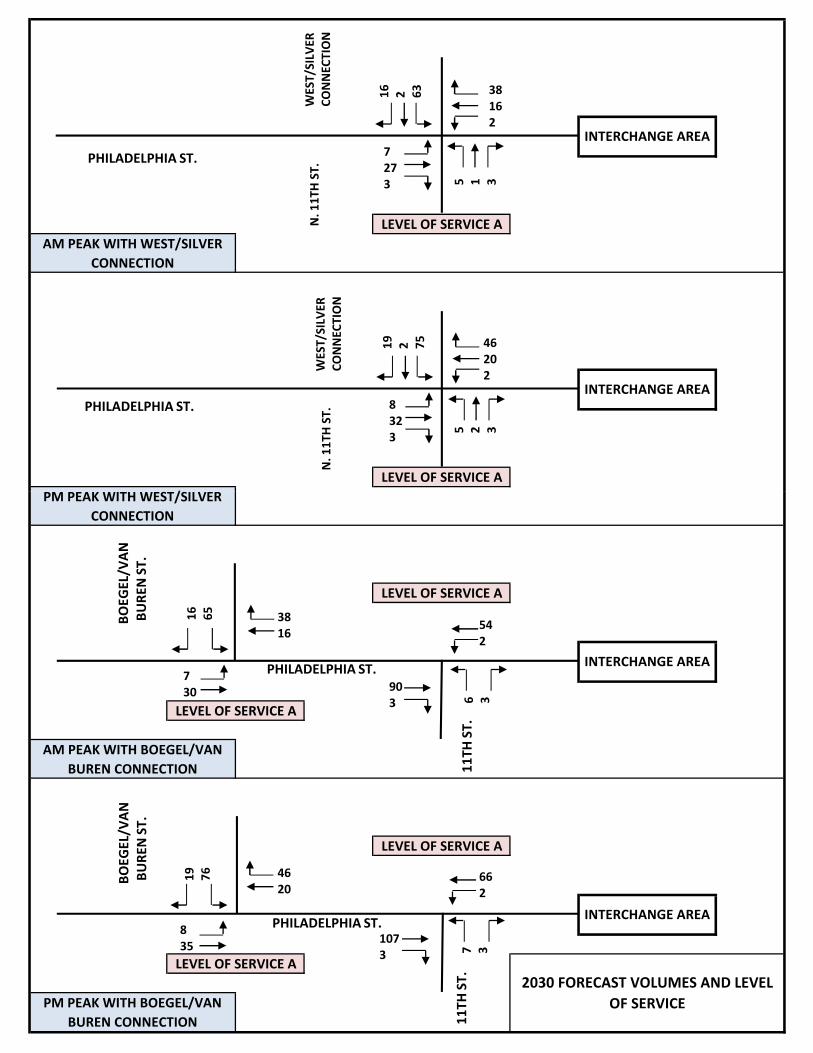
A number of alternative local street connections have been examined to address the cross-street alignment change proposed in several of the interchange alternatives. Specifically, Alternatives 1a, 2a, and 3a show connection of North Street to Philadelphia Street, rather than the existing North Street to Silver Street connection. The change would require extension of at least one local street south to Philadelphia Street to allow neighborhood traffic to continue to use the I-190 interchange. The local street connections would either result in an intersection within about 590’ of the center of the interchange or an intersection within about 1230’ of the center of the interchange. For purposes of this memorandum, the nearer intersection will be called the West/Silver extension and the farther intersection will be called the Boegel/Van Buren extension.
Peak hour traffic forecasts were prepared for these two intersections based on data available from the Rapid City regional traffic forecasting model. Please note that most forecasting models, including the Rapid City model, have difficulty providing forecasts for local street intersections due to the larger network structure employed. The model is also based on generalized forecasts of future land uses and does not discern differences between the interchange alternatives as long as all the alternatives provide acceptable service.
The forecasts, however, support reasonable belief that either of the intersections will operate at acceptable level of service and not unduly interfere with interchange operations. Either intersection will operate at level of service A during the AM and PM peak hours with stop sign control. Queues at the intersections and the adjacent leg of the interchange are all minimal and no queue interference is anticipated.
Volume/Level of Service summaries and SYNCHRO analysis reports are attached to this memorandum to document analysis conditions and results.


INTERCHANGE AREA
INTERCHANGE AREA
AM PEAK WITH WEST/SILVER CONNECTION
LEVEL OF SERVICE A
S /SLEVEL OF SERVICE A
WEST/SILVER
CO
NNECTION
N. 11TH ST.
PHILADELPHIA ST.
WEST/SILVER
CO
NNECTION
N. 11TH ST.PHILADELPHIA ST.
38162
16 2 63
7273 5 1 3
19 2 75 46202
5 2 3
8323
2030 FORECAST VOLUMES AND LEVEL
INTERCHANGE AREA
INTERCHANGE AREA
LEVEL OF SERVICE A
LEVEL OF SERVICE A
PM PEAK WITH WEST/SILVER CONNECTION
AM PEAK WITH BOEGEL/VAN BUREN CONNECTION
LEVEL OF SERVICE A
LEVEL OF SERVICE A
PHILADELPHIA ST.
BOEG
EL/V
AN
BURE
N ST.
PHILADELPHIA ST.
BOEG
EL/V
AN
BURE
N ST.
11TH
ST.
ST.
730
16 65 3816
903 6 3
542
835
4620
19 76
1073
662
7 3
2030 FORECAST VOLUMES AND LEVEL OF SERVICEPM PEAK WITH BOEGEL/VAN
BUREN CONNECTION 11TH
S
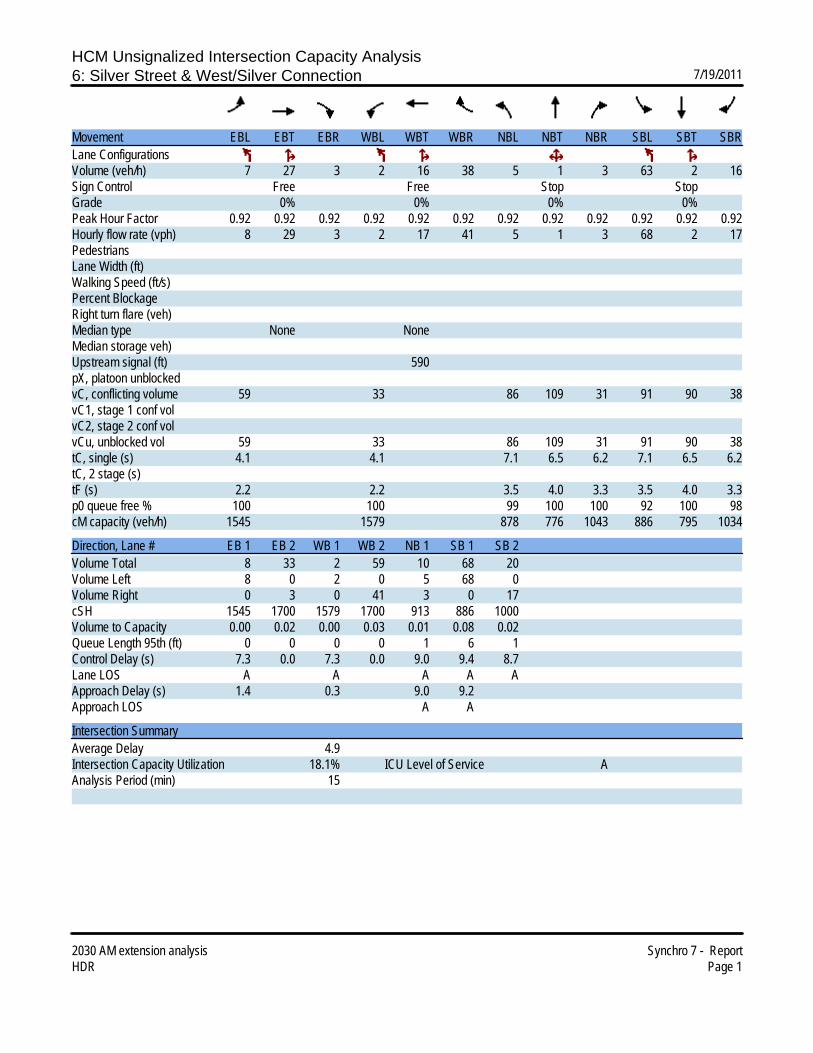
HCM Unsignalized Intersection Capacity Analysis6: Silver Street & West/Silver Connection 7/19/2011
2030 AM extension analysis Synchro 7 - ReportHDR Page 1
Movement EBL EBT EBR WBL WBT WBR NBL NBT NBR SBL SBT SBRLane ConfigurationsVolume (veh/h) 7 27 3 2 16 38 5 1 3 63 2 16Sign Control Free Free Stop StopGrade 0% 0% 0% 0%Peak Hour Factor 0.92 0.92 0.92 0.92 0.92 0.92 0.92 0.92 0.92 0.92 0.92 0.92Hourly flow rate (vph) 8 29 3 2 17 41 5 1 3 68 2 17PedestriansLane Width (ft)Walking Speed (ft/s)Percent BlockageRight turn flare (veh)Median type None NoneMedian storage veh)Upstream signal (ft) 590pX, platoon unblockedvC, conflicting volume 59 33 86 109 31 91 90 38vC1, stage 1 conf volvC2, stage 2 conf volvCu, unblocked vol 59 33 86 109 31 91 90 38tC, single (s) 4.1 4.1 7.1 6.5 6.2 7.1 6.5 6.2tC, 2 stage (s)tF (s) 2.2 2.2 3.5 4.0 3.3 3.5 4.0 3.3p0 queue free % 100 100 99 100 100 92 100 98cM capacity (veh/h) 1545 1579 878 776 1043 886 795 1034
Direction, Lane # EB 1 EB 2 WB 1 WB 2 NB 1 SB 1 SB 2Volume Total 8 33 2 59 10 68 20Volume Left 8 0 2 0 5 68 0Volume Right 0 3 0 41 3 0 17cSH 1545 1700 1579 1700 913 886 1000Volume to Capacity 0.00 0.02 0.00 0.03 0.01 0.08 0.02Queue Length 95th (ft) 0 0 0 0 1 6 1Control Delay (s) 7.3 0.0 7.3 0.0 9.0 9.4 8.7Lane LOS A A A A AApproach Delay (s) 1.4 0.3 9.0 9.2Approach LOS A A
Intersection SummaryAverage Delay 4.9Intersection Capacity Utilization 18.1% ICU Level of Service AAnalysis Period (min) 15
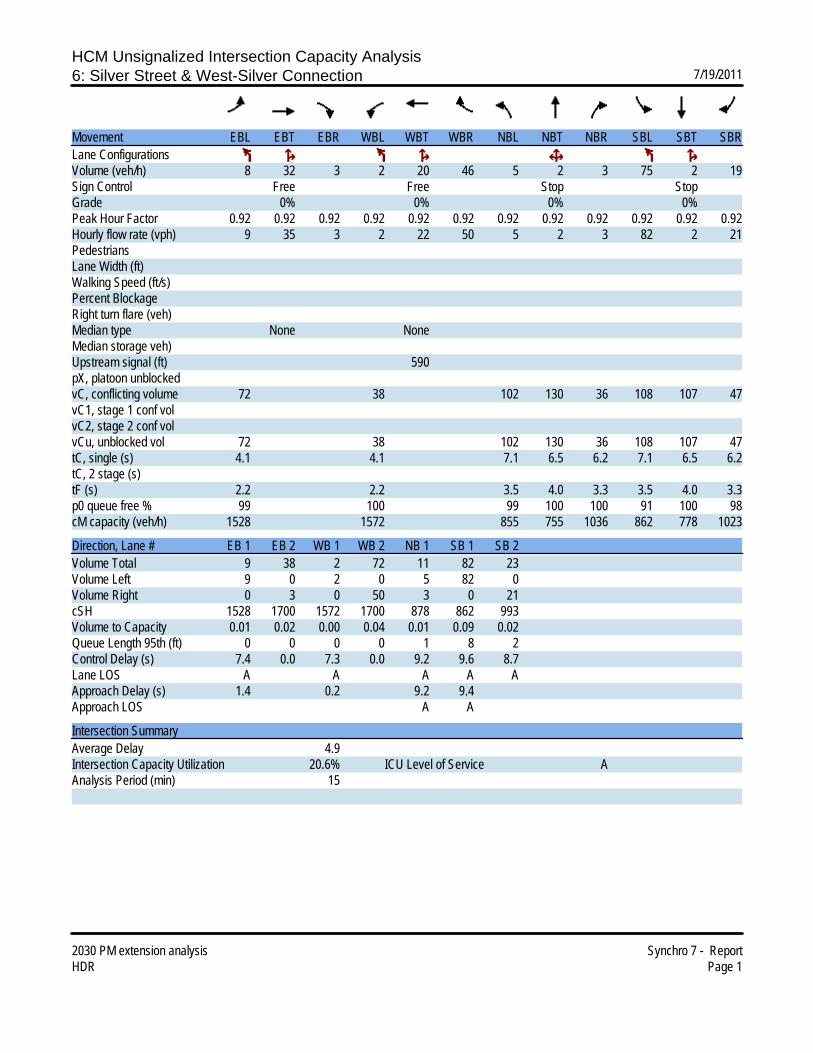
HCM Unsignalized Intersection Capacity Analysis6: Silver Street & West-Silver Connection 7/19/2011
2030 PM extension analysis Synchro 7 - ReportHDR Page 1
Movement EBL EBT EBR WBL WBT WBR NBL NBT NBR SBL SBT SBRLane ConfigurationsVolume (veh/h) 8 32 3 2 20 46 5 2 3 75 2 19Sign Control Free Free Stop StopGrade 0% 0% 0% 0%Peak Hour Factor 0.92 0.92 0.92 0.92 0.92 0.92 0.92 0.92 0.92 0.92 0.92 0.92Hourly flow rate (vph) 9 35 3 2 22 50 5 2 3 82 2 21PedestriansLane Width (ft)Walking Speed (ft/s)Percent BlockageRight turn flare (veh)Median type None NoneMedian storage veh)Upstream signal (ft) 590pX, platoon unblockedvC, conflicting volume 72 38 102 130 36 108 107 47vC1, stage 1 conf volvC2, stage 2 conf volvCu, unblocked vol 72 38 102 130 36 108 107 47tC, single (s) 4.1 4.1 7.1 6.5 6.2 7.1 6.5 6.2tC, 2 stage (s)tF (s) 2.2 2.2 3.5 4.0 3.3 3.5 4.0 3.3p0 queue free % 99 100 99 100 100 91 100 98cM capacity (veh/h) 1528 1572 855 755 1036 862 778 1023
Direction, Lane # EB 1 EB 2 WB 1 WB 2 NB 1 SB 1 SB 2Volume Total 9 38 2 72 11 82 23Volume Left 9 0 2 0 5 82 0Volume Right 0 3 0 50 3 0 21cSH 1528 1700 1572 1700 878 862 993Volume to Capacity 0.01 0.02 0.00 0.04 0.01 0.09 0.02Queue Length 95th (ft) 0 0 0 0 1 8 2Control Delay (s) 7.4 0.0 7.3 0.0 9.2 9.6 8.7Lane LOS A A A A AApproach Delay (s) 1.4 0.2 9.2 9.4Approach LOS A A
Intersection SummaryAverage Delay 4.9Intersection Capacity Utilization 20.6% ICU Level of Service AAnalysis Period (min) 15
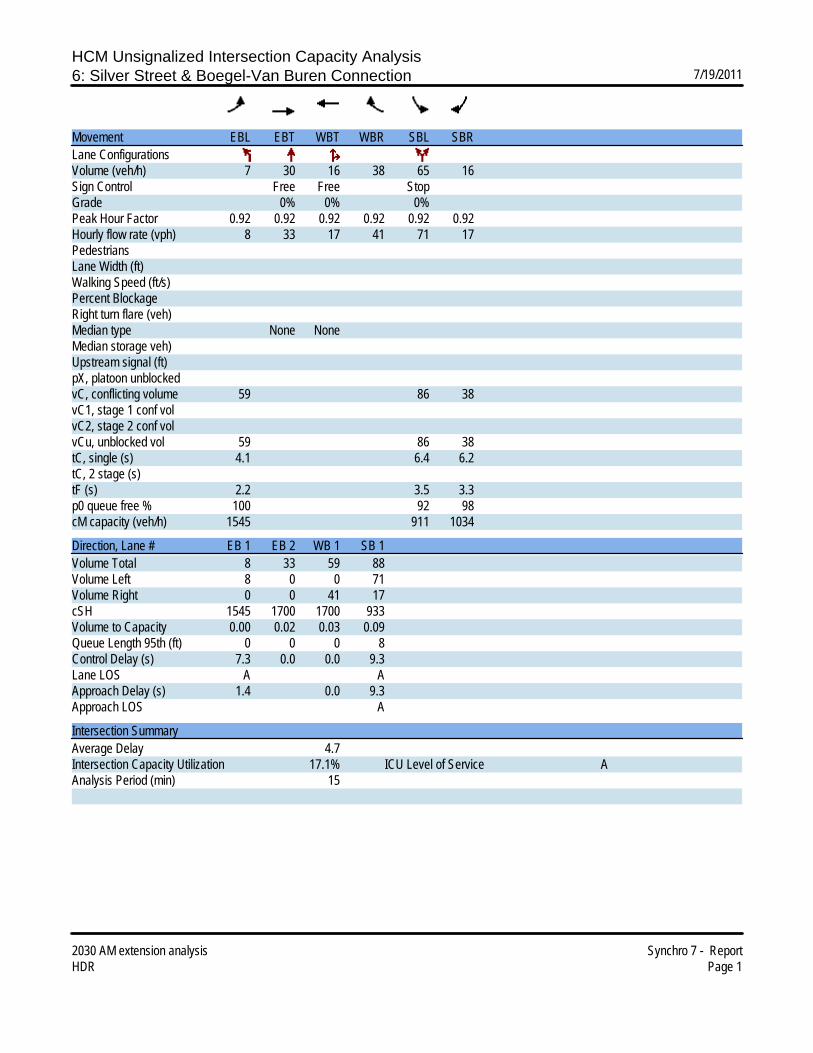
HCM Unsignalized Intersection Capacity Analysis6: Silver Street & Boegel-Van Buren Connection 7/19/2011
2030 AM extension analysis Synchro 7 - ReportHDR Page 1
Movement EBL EBT WBT WBR SBL SBRLane ConfigurationsVolume (veh/h) 7 30 16 38 65 16Sign Control Free Free StopGrade 0% 0% 0%Peak Hour Factor 0.92 0.92 0.92 0.92 0.92 0.92Hourly flow rate (vph) 8 33 17 41 71 17PedestriansLane Width (ft)Walking Speed (ft/s)Percent BlockageRight turn flare (veh)Median type None NoneMedian storage veh)Upstream signal (ft)pX, platoon unblockedvC, conflicting volume 59 86 38vC1, stage 1 conf volvC2, stage 2 conf volvCu, unblocked vol 59 86 38tC, single (s) 4.1 6.4 6.2tC, 2 stage (s)tF (s) 2.2 3.5 3.3p0 queue free % 100 92 98cM capacity (veh/h) 1545 911 1034
Direction, Lane # EB 1 EB 2 WB 1 SB 1Volume Total 8 33 59 88Volume Left 8 0 0 71Volume Right 0 0 41 17cSH 1545 1700 1700 933Volume to Capacity 0.00 0.02 0.03 0.09Queue Length 95th (ft) 0 0 0 8Control Delay (s) 7.3 0.0 0.0 9.3Lane LOS A AApproach Delay (s) 1.4 0.0 9.3Approach LOS A
Intersection SummaryAverage Delay 4.7Intersection Capacity Utilization 17.1% ICU Level of Service AAnalysis Period (min) 15

HCM Unsignalized Intersection Capacity Analysis9: Silver Street & 11th St. 7/19/2011
2030 AM extension analysis Synchro 7 - ReportHDR Page 1
Movement EBT EBR WBL WBT NBL NBRLane ConfigurationsVolume (veh/h) 90 3 2 54 6 3Sign Control Free Free StopGrade 0% 0% 0%Peak Hour Factor 0.92 0.92 0.92 0.92 0.92 0.92Hourly flow rate (vph) 98 3 2 59 7 3PedestriansLane Width (ft)Walking Speed (ft/s)Percent BlockageRight turn flare (veh)Median type None NoneMedian storage veh)Upstream signal (ft) 700pX, platoon unblockedvC, conflicting volume 101 162 99vC1, stage 1 conf volvC2, stage 2 conf volvCu, unblocked vol 101 162 99tC, single (s) 4.1 6.4 6.2tC, 2 stage (s)tF (s) 2.2 3.5 3.3p0 queue free % 100 99 100cM capacity (veh/h) 1491 827 956
Direction, Lane # EB 1 WB 1 WB 2 NB 1Volume Total 101 2 59 10Volume Left 0 2 0 7Volume Right 3 0 0 3cSH 1700 1491 1700 866Volume to Capacity 0.06 0.00 0.03 0.01Queue Length 95th (ft) 0 0 0 1Control Delay (s) 0.0 7.4 0.0 9.2Lane LOS A AApproach Delay (s) 0.0 0.3 9.2Approach LOS A
Intersection SummaryAverage Delay 0.6Intersection Capacity Utilization 14.9% ICU Level of Service AAnalysis Period (min) 15

HCM Unsignalized Intersection Capacity Analysis6: Silver Street & Boegel-Van Buren Connection 7/19/2011
2030 PM extension analysis Synchro 7 - ReportHDR Page 1
Movement EBL EBT WBT WBR SBL SBRLane ConfigurationsVolume (veh/h) 8 35 20 46 76 19Sign Control Free Free StopGrade 0% 0% 0%Peak Hour Factor 0.92 0.92 0.92 0.92 0.92 0.92Hourly flow rate (vph) 9 38 22 50 83 21PedestriansLane Width (ft)Walking Speed (ft/s)Percent BlockageRight turn flare (veh)Median type None NoneMedian storage veh)Upstream signal (ft)pX, platoon unblockedvC, conflicting volume 72 102 47vC1, stage 1 conf volvC2, stage 2 conf volvCu, unblocked vol 72 102 47tC, single (s) 4.1 6.4 6.2tC, 2 stage (s)tF (s) 2.2 3.5 3.3p0 queue free % 99 91 98cM capacity (veh/h) 1528 891 1023
Direction, Lane # EB 1 EB 2 WB 1 SB 1Volume Total 9 38 72 103Volume Left 9 0 0 83Volume Right 0 0 50 21cSH 1528 1700 1700 915Volume to Capacity 0.01 0.02 0.04 0.11Queue Length 95th (ft) 0 0 0 10Control Delay (s) 7.4 0.0 0.0 9.4Lane LOS A AApproach Delay (s) 1.4 0.0 9.4Approach LOS A
Intersection SummaryAverage Delay 4.7Intersection Capacity Utilization 18.7% ICU Level of Service AAnalysis Period (min) 15
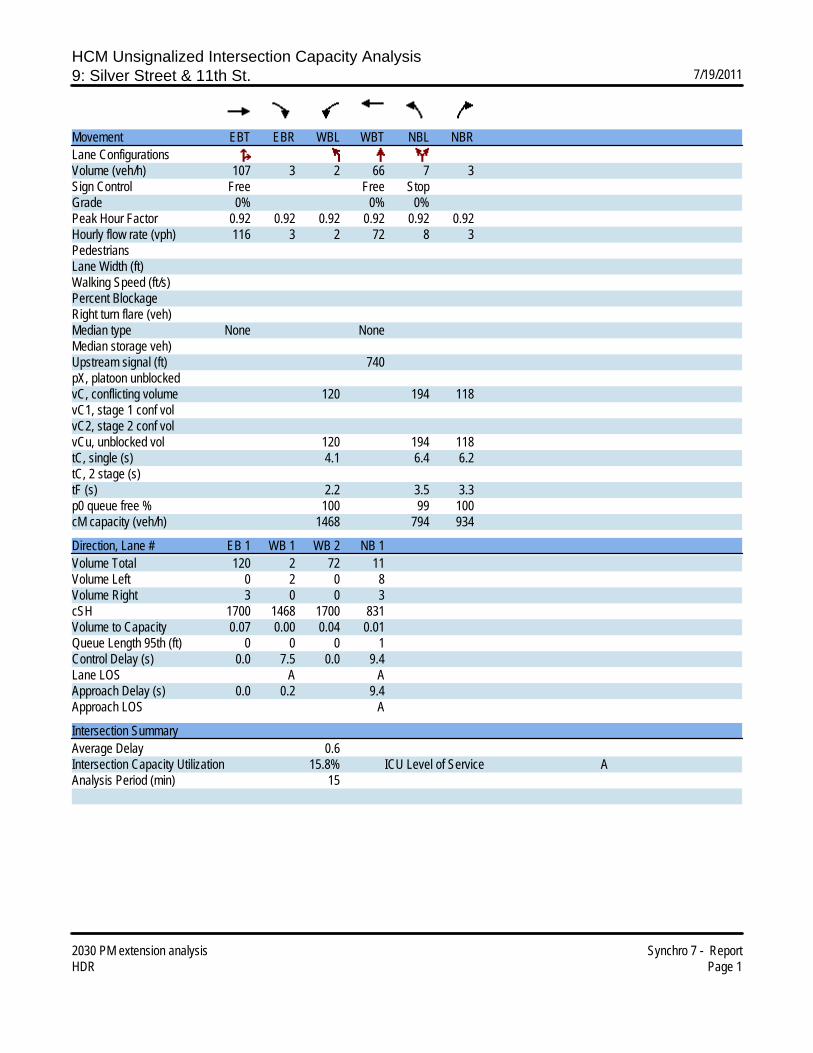
HCM Unsignalized Intersection Capacity Analysis9: Silver Street & 11th St. 7/19/2011
2030 PM extension analysis Synchro 7 - ReportHDR Page 1
Movement EBT EBR WBL WBT NBL NBRLane ConfigurationsVolume (veh/h) 107 3 2 66 7 3Sign Control Free Free StopGrade 0% 0% 0%Peak Hour Factor 0.92 0.92 0.92 0.92 0.92 0.92Hourly flow rate (vph) 116 3 2 72 8 3PedestriansLane Width (ft)Walking Speed (ft/s)Percent BlockageRight turn flare (veh)Median type None NoneMedian storage veh)Upstream signal (ft) 740pX, platoon unblockedvC, conflicting volume 120 194 118vC1, stage 1 conf volvC2, stage 2 conf volvCu, unblocked vol 120 194 118tC, single (s) 4.1 6.4 6.2tC, 2 stage (s)tF (s) 2.2 3.5 3.3p0 queue free % 100 99 100cM capacity (veh/h) 1468 794 934
Direction, Lane # EB 1 WB 1 WB 2 NB 1Volume Total 120 2 72 11Volume Left 0 2 0 8Volume Right 3 0 0 3cSH 1700 1468 1700 831Volume to Capacity 0.07 0.00 0.04 0.01Queue Length 95th (ft) 0 0 0 1Control Delay (s) 0.0 7.5 0.0 9.4Lane LOS A AApproach Delay (s) 0.0 0.2 9.4Approach LOS A
Intersection SummaryAverage Delay 0.6Intersection Capacity Utilization 15.8% ICU Level of Service AAnalysis Period (min) 15