Embed Size (px)
Citation preview

-, lJAD
technicalRteport
* .. - United States ArmyBelvoir Research, Development & Engineering CenterFort Belvoir, Virginia 22060-5606
Report'2477
Environmental Stress",Screening (ES Gud
-.-Authored By: William H. Homer, Project Manager.-
t jReport Date: January 1989
Distribution unlimited; approved for public release.'al
fELECTE~ ,~"APR 07198
89 4 n P/

Destroy this report when it is no longer needed.Do not return it to the originator.
The citation in this report of trade names ofcommercially available products does not constituteofficial endorsement or approval of the use of suchproducts.

UNCLASSIFIED
SECURITY CLASSIFICATION OF THIS PAGE D x o 6REPORT DOCUMENTATION PAGE Form Approved
OMB No. 0704-0188
la. REPORT SECURITY CLASSIFICATION lb. RESTRICTIVE MARKINGSUnclassified None
2a. SECURITY CLASSIFICATION AUTHORITY 3. DISTRIBUTION/AVAILABILITY OF REPORTDistribution unlimited; approved for public release.
2b. DECLASSIFICATION/DOWNGRADING SCHEDULE
4. PERFORMING ORGANIZATION REPORT NUMBER(S) 5. MONITORING ORGANIZATION REPORT NUMBER(S)2477
6a. NAME OF PERFORMING ORGANIZATION 6b. OFFICE SYMBOL 7a. NAME OF MONITORING ORGANIZATIONBcivoir RD&E Center (I applicable)Product Assurance Division STRBE-TQE
6c. ADDRESS (City, State, and ZIP Code) 7b. ADDRESS (City, State, and ZIP Code)
Fort Belvoir, VA 22060-5606
Ba. NAME OF FUNDING/SPONSORING 8b. OFFICE SYMBOL 9. PROCUREMENT INSTRUMENT IDENTIFICATION NUMBERORGANIZATION (If applicable)
8c. ADDRESS (City, State, and ZIP Code) 10. SOURCE OF FUNDING NUMBERS
PROGRAM PROJECT TASK IWORK UNITELEMENT NO. NO. NO. ACCESSION NO.
11. TITLE (Include Security Classification)Environmental Stress Screening (ESS) Guide (U)
12. PERSONAL AUTHOR(S)William H. Homer, Project Manager, and Evaluation Research Corporation, McLean, VA
13a. TYPE OF REPORT 13b. TIME COVERED 14. DATE OF REPORT (Year, Month, Day) 15. PAGE COUNTFinal I FROM TO January 1989[ 117
16. SUPPLEMENTARY NOTATION
17, e OSATI ES 1 .' UBJECT TERMS (Continue on reverse if necessary and identify by block number)
FIELD GROUP SUB-GROUP -Therma]cycling. $:' ." ' .'
Random vibration. (" " -) -i'.19, ABSTRCT (Continue on reverse if necessary and identify by block number)
._- This guide provides a step-by-step approach to the planning, implementing, and monitoring of anEnvironmental Stress Screening (ESS).Plfrogram for Army Materiel Commao. (AMCylIroop SupportCommand (TROSCOM) hardware contracts and repair activities. This guide'10- not replace logicalthinking on the part of the user, but ,4P~presenrthe various elements of an ESS Program and advisethe user in their selection and use. 4_7--I-
20. DISTRIBUTION/AVAILABILITY OF ABSTRACT 21. ABSTRACT SECURITY CLASSIFICATION[-IUNCLASSIFIEDIUNLIMITED ] SAME AS REPORT,- DTIC USERS Unclassified
22a. NAME OF RESPONSIBLE INDIVIDUAL 22b. TELEPHONE (Include Area Code) 22c. Office SymbolWilliam H. Homer 703-664-5771 STRBE-TQE
DD Form 1473, JUN 86 Previous editions are obsolete. SECURITY CLASSIFICATION OF THIS PAGEUNCLASSIFIEDi

PREFACE
PURPOSE
This guide provides a step-by-step approach to the planning, implementing, and monitoring of anEnvironmental Stress Screening (ESS) Program for Army Materiel Command (AMC) TroopSupport Command (TROSCOM) hardware contracts and repair activities. This guide will notreplace logical thinking on the part of the user, but will present the various elements of an ESSProgram and advise the user in their selecton and use.
AUDIENCE
This guide is intended for use by product assurance engineers, project engineers, project managers,item managers, and administrative personnel who are responsible for planning, implementing, ormonitoring an ESS Program.
WHAT IS ESS?
In any manufacturing or assembly process involving people and machinery, a small percentage ofdefects usually occurs. There are many techniques used by industry to reduce the number of defectsremaining in hardware when it leaves the factory. These techniques include process control,training, inspection, and testing. A number of these defects will escape detection in the factory inspite of these standard defect prevention techniques. These undetected defects will be manifest asearly life failures during the hardware's field use. These early life, or infant, failures will reducefield reliability, even though the number of undetected defects is small. For this reason, it isimportant to detect and eliminate as many defects as possible before the hardware leaves the factory.
" The increasing complexity of mechanical equipment and miniaturization of electronic equipmenthas made traditional methods of defect detection less efficient. One of the most effective techniquesused to identify and eliminate these defects is ivironmental stress screening (ESSI. ESS is theprocess of applying environmental stresses, in conjunction with functional testing, in order tostimulate the failure mechanisms of defects to the point of detection. Most of these defects arecaused by flawed parts and poor assembly workmanship. The stress levels of applied stimuli mustbe as harsh as possible to precipitate the defects without causing damage to or reducing the usefullife of properly manufactured hardware. ThiLpplication of environmental stresses will acceleratethe latent (or undetected) defects to become patent (detected), with functional testing required todetect failures. Functional testing can be performed either during or after the application of stress. PThe advantage of functional testing during stress application is that it allows the detection ofintermittent failures.
! ,"' 4. - i• -
, ,", ., )-1t Codes
-,zd /or•"Dist ouial
loi,9I

ESS had its beginning in the space programs of the 1960s,where high reliability requirements andthe absence of supportability dictated that equipment be 100% defect-free. Since that time, ESS hasgained increasing recognition throughout the defense industry as a cost effective quality controlmethod. Today, each military department has made ESS an integral part of major systemsacquisitions. The exceptional benefits derived from ESS applications will ensure itsinstitutionalization in the defense system's acquisition process.
ORGANIZATION
This guide is intended to be used by both experienced and inexperienced engineers to developstatements of work (SOWs) to implement ESS. Several sections describe ESS, when it should beapplied, and how to develop stress intensity levels. These sections contain basic explanatoryinformation and lay the foundation for decisions that must be made when specifying ESS. Users ofthis guide who have not been exposed to ESS should begin by reading the tutorial Sections Ithrough IV, and becoming familiar with the definitions and acronyms on the following pages.
Section V contains a description of the different contract deliverables normally required in an ESSProgram. Along with a discussion of the requirement, a sample SOW clause invoking it and achecklist for reviewing the deliverable are included.
Section IX contains the description of the ESS cost model. All screening decisions should be madewith an eye to the cost-benefits. The cost model is used to estimate the cost of the screeningprogram and the break-even point where the screening becomes cost-effective. All users of thisguide should use the cost model to justify the cost of implementing a screening system.
DEFINITIONS
Assembly A combination of parts joined together to perform a specific functionand be capable of disassembly.
Design capability The level of stress (thermal or mechanical) which an item is able toachieve or endure without damage or significant reduction of itsoverall usable life.
Failure mode The fundamental physical or chemical process responsible for afailure; the causative agents of a failure, including circumstancesduring design, manufacture or use that may lead to a failure.
Hermeticity The ability of a sealed item to remain impervious to outsidecontaminants.
iv

Indenture level Level of assembly; the highest indenture level is a system, the lowestis apart.
Infant mortality Failures occurring on units in the field.
Isolation The reduction in severity of response force or motion to inputstimulus.
Latent defect An inherent or induced weakness, not detectable by ordinary means,which will either be precipitated to early failure under ESS conditionsor eventually fail in the intended-use environment.
Module A self-contained collection of chassis-mounted components and/orprinted wiring assemblies (PWAs) within one package whichperforms a specific function or group of functions, and which isremovable as a single package from an operating system.
Part Any identifiable item within the product which can be removed orrepaired (e.g., discrete semiconductor, resistor, integrated circuit,solder joint, connector); used interchangeably with piece part,component part, and device.
Patent defect An inherent or induced weakness which can be detected by inspection,functional test, or other defined means without the need for stressscreens.
Precipitation The process of transforming a latent (undetected) defect into a patent(of defects) (detected) defect through the application of stress screens.
Printed wiring An assembly containing a group of interconnected componentsassembly (PWA) mounted on a single printed circuit board; equivalent terminology is
circuit card assembly and printed circuit assembly.
Screening Generally, a measure of the capability of a screen to precipitate latenteffectiveness defects to failures; sometimes used specifically to mean screening
strength.
Screening strength The probability that a specific screen will precipitate a latent defect tofailure, given that a latent defect susceptible to the screen is present.
Stress screening The process of applying mechanical, electrical, and/or thermal stressesto an equipment item for the purpose of precipitating latent part andworkmanship defects to early failure.
V

System A group of units interconnected or assembled to perform an overallfunction.
Transmissibility The ratio of output response to input motion.
Unit A group of modules interconnected or assembled to perform a specificfunction with a system.
ACRONYMS
AMCCOM US Army Armaments, Munitions, and Chemical CommandAMC-R US Army Materiel Command RegulationAQL Acceptable Quality LevelATP Acceptance Test Procedure
CCA Circuit Card AssemblyCDRL Contract Data Requirements ListCDU Control and Display Unitcf Cubic Foot
dB DecibelDID Data Item DescriptionDOD Department of DefenseDPA Die Shear Physical AnalysisDT/OT Development Test/Operational Test
EC Equipment CostECP Engineering Change ProposalED Equipment DesignEIR Equipment Improvement RecommendationEMW Equipment Manufacturing WorkmanshipESS Environmental Stress ScreeningETU Engineering Test Unit
FCAC Family of Compact Air ConditionersFFT Fast Fourier TransformFRACA Failure Reporting, Analysis, and Corrective ActionFSED Full Scale Engineering DevelopmentFTU Field Test UnitFY Fiscal Year
vi

HMMWV High Mobility Multiwheeled Vehicle
IC Integrated CircuitIEEE Institute of Electronic and Electrical EngineersIES Institute of Environmental SciencesIMU Inertial Measurement UnitI/O Input/OutputIPT Initial Production Test
JSIIDS Joint Service Interior Intrusion Detection System
LRU Line Replaceable UnitLSI Large Scale Integration
MIL-STD Military StandardMRSA USAMC Materiel Readiness Support ActivityMTBF Mean Time Between FailureMTBR Mean Time Between ReplacementMTBUME Mean Time Between Unscheduled Maintenance Events
NAVMAT Naval Material CommandNDI Nondevelopment ItemNPN Negative-Positive-NegativeNSN National Stock Number
OTS Off the Shelf
PA Percent ApproximatePADS Position and Azimuth Determining System
PCB Printed Circuit BoardPD Part DesignPIND Particle Impact Noise DetectionPMW Part Manufacturing WorkmanshipPNP Positive-Negative-Positiveppm Parts Per MillionPS Power SupplyPSD Power Spectral DensityPWA Printed Wiring Assembly
QC Quality ControlQDR Quality Deficiency Report
vii

RADC Rome Air Development CenterR&M Reliability and MaintainabilityRAM Reliability, Availability, and MaintainabilityRGA Residual Gas Analysis
RFP Request for ProposalRMS Root Mean Squarerpm Revolutions Per Minute
SDC Sample Data CollectionSE Software Errors
SMM Status Monitor ModuleSOW Statement of WorkSS Screening Strength
TAMMS The Army Maintenance Management SystemTDP Technical Data PackageTECOM US Army Test and Evaluation CommandTROSCOM US Army Troop Support Command
UME Unscheduled Maintenance Event
VLSI Very Large Scale Integration
viii

TABLE OF CONTENTS
Page
SECTION I GENERAL LEVELS OF ASSEMBLY ................................. I
Part Level Screening ............................................................... 2Assembly Level Screening ....................................................... 3Unit (or Higher) Level Screening ........................................... 5Sum m ary .................................................................................. 6
SECTION H PART LEVEL SCREENS .................................................... 7
IC and Semiconductor Defect Modes ..................................... 7Temperature Cycling (or Thermal Shock) .............................. 8Sum m ary .................................................................................. 8
SECTION III ASSEMBLY LEVEL SCREENS ........................................ 9
Therm al Cycling ..................................................................... 10Random Vibration ....................................................................... 11
SECTION IV DETERMINATION OF THERMAL CYCLINGREQUIREMENTS ........................................................... 13
Thermal Cycling Screen ......................................................... 13Thermal Characterization Survey ........................................... 21
SECTION V DETERMINATION OF RANDOM VIBRATIONREQUIREMENTS .............................................................. 25
Random Vibration Screening .................................................. 25Random Vibration Characterization Survey .......................... 33
ix

SECTION VI OTHER CONSIDERATIONS ..... ...... . .............. 37
Power-On versus Power Off .................................................. 37Pre- and Postscreen Functional Testing ................................. 39Screening Sequence .............................................................. 39
SECTION VII ESS PROGRAM ELEMENTS . ..................................... 41
Equipment and Process Characterization ............................. 41ESS Plan ............................................................................... 42ESS Procedures ..................................................................... 44Periodic ESS Performance Reports ....................................... 47
SECTION VIII ENVIRONMENTAL TESTING LABS ............................ 51
SECTION IX COST MODEL .................................................................. 53
Cost M odel Structure ........................................................... 53Stress Screening Cost Model ................................................. 61Field Failure Cost Model ....................................................... 78Comparison for Cost Effectiveness ....................................... 81LOTUS Cost M odel .............................................................. 81
APPENDIX A FRACTION DEFECTIVE TABLES ................................ A-I
APPENDIX B SELECTION OF SOW DD Form 1423, AND DATAITEM DESCRIPTIONS ................................................... B-I
APPENDIX C ENVIRONMENTAL STRESS SCREENING COSTMODEL ............................................................................. C-1
REFERENCES ..................................................................................... References I
x

FIGURES
I Repair Cost Per Failure Location ............................................................. 22 Fraction Defective Parts versus Fraction Defective
A ssem blies .............................................................................................. 33 Typical PWA Thermal Cycling Profile .................................................... 164 Typical Unit (or Higher) Thermal Cycling Profile ................................... 185 Random Vibration Profiles ....................................................................... 286 Sample Envelope-Acceleration Spectra for Random
V ibration .................................................................................................. 297 Percent Fallout as Vibration Time Increases for Unit/
System Level Screening (Using 6 g rms RandomV ibration) ................................................................................................ 3 1
8 Top Level Cost Model ............................................................................. 549 Equipment Cost Flow Diagram ................................................................ 55
10 Survey Cost Flow Diagram ...................................................................... 5611 Item Screening Cost Flow Diagram ......................................................... 57
12 Failure Cost Flow Diagram ...................................................................... 5813 Cost Effectiveness Flow Diagram ........................................................... 5914 Cost Effectiveness Flow Diagram ........................................................... 6015 Unit Breakdown Chart .............................................................................. 7116 Worksheet for Estimating Number of Defects ......................................... 7217 System Breakdown Chart ......................................................................... 7318 System Breakdown Chart for a Communications System ........................ 7519 Processor Unit Breakdown to the Assembly Level .................................. 7520 Completed Worksheet for a Sample Assembly ......................................... 77
TABLES
I Assembly Level Defect Types Precipitated by Thermal
and Vibration Screens .............................................................................. 102 Screening Strenth, Temperature Cycling Screens .................................... 143 Baseline Thermal Cycling Conditions ..................................................... 204 Screening Strength for Random Vibration Screens .................................. 265 Baseline Vibration Conditions .................................................................. 32
6 ESS Equipment Price Ranges .................................................................. 667 Quality Levels for Various Part Types ..................................................... 748 List of Processor Unit PWAs .................................................................... 76
xi

SECTION I. GENERAL LEVELS OF ASSEMBLY
Different stress types are associated with different levels of assembly. The same stress that producesgood results during part level screening may not produce the same outcome at a higher level ofassembly. For example, a high temperature bake is a good part level screen but is not an effectivescreen for a printed wiring assembly. This is because the defect types and the equipment responsecan be different at different levels of assembly. As the level of assembly increases, the equipmentstructural and thermal characteristics change. Equipment response is the mechanism that acceleratesdefects to failure. As equipment response changes, the screening efficiency changes. Stress typesmust be modified as the level of assembly changes.
The proper application of ESS largely depends on the degree to which it is understood. While theunderlying mechanisms remain unchanged, the application of ESS to different levels of assemblyrequires different test equipment, stress levels, and cost considerations. This section identifies thefactors involved in deciding to perform ESS at different levels of assembly.
Screening at the lowest level of assembly is the least costly option in terms of rework costs. Thelabor and material resources required to troubleshoot, repair, and retest a failed item increase by atleast one order of magnitude at each higher level of assembly. Finding a defective component at thepart level screen will prevent its introduction into a higher level assembly where the task of isolatingthe defect is more complex. Another factor, schedule slippage, increases as defects are discoveredlater in the manufacturing process. Early detection of defects minimizes rework time by virtue ofless complex rework and retest procedures. It also permits earlier reprocurement of defective parts,in order to maintain original production schedules. Failures occurring at higher levels of assemblyrequire more time to troubleshoot, rework, and retest, resulting in more immediate impact on theproduction schedule. Early detection of defects has less impact because it requires less time torepair defects and the repair time can be absorbed over a longer period remaining in the productionschedule.
Figure 1 shows the increased costs of repair associated with higher levels of assembly. Repair orreplacement cost at the part level range from $1 to $5. At the assembly level, repair costs typicallyrange from $30 to $50, while in the field, total support costs of $5,000 to $15,000 per failure aretypical.

PRINTED PURCHASED PJRCHASEOCIRCUIT BOARDS ASSEMBLIES UNIT$
UNITSPIECE MODULES 5 LACK SYSTEM IFIELDPART ASSEMBLIES BORES
WIRING WIRING CABLES
$ -$5 $30 $50 $250.4500 $SO-S 1.000 $5.000 $15.000
FACTORY FIELD
Figure 1. Repair Cost Per Failure Location (Ref: RADC TR-82-87)
Another important benefit of early defect detection is that more immediate feedback can be given tothe activity responsible for the defect. Corrective action will be more effective if less time hasexpired between creation and detection of the defect. Circumstances surrounding the event can bemore readily remembered or recreated. Operators' methods are still fresh in their minds. Evidencecontributing to the investigation of the root cause of failure is more likely to be present if the defectis detected soon after is was caused. These facilitates analysis and implementation of correctiveaction to preclude recurrence of the problem. Screening at the lowest level of assembly createsadditional effort in the early stages of development and production, but fosters cost savings andproject success by reducing later failures.
This section provides a general discussion of three different levels of assembly for stress screening;part (or component), assembly, and unit. A more detailed discussion of the types of stress for eachlevel of assembly can be found in Sections II through V.
PART LEVEL SCREENING
At this level, screens are conducted on individual piece parts such as an integrated circuit (IC),resistor, diode, transistor, transformer or other nonrepairable electronic component. Part levelscreens are usually performed, as a minimum, by the part vendor or an outside screening facility.Reducing defects at the part level is the most cost-effective approach and is of such great importancethat the US Air Force Reliability and Maintainability (R&M) 2000 ESS policy requires that themanufacturing process begin with piece parts having a remaining part fraction defective below1,000 parts per million (ppm) by Fiscal Year (FY) 1987 and below 100 ppm by FY90. Data fromone military hardware contractor indicated a defect rate of 6,000 ppm on incoming parts. 1 Thispresents a significant challenge to hardware contractors and component manufacturers if they are tomeet the R&M 2000 goal and produce truly reliable hardware.
2

The defect rate of incoming parts has a significant impact on the assembly defect rate. As thenumber of parts in an assembly increases, the effect of the part defect rate is more pronounced.Figure 2 illustrates the effect that a higher proportion of part defectives has on the incidence ofassembly defectives. For example, a 150-part assembly containing parts with a fraction defective of0.1 has an assembly fraction defective of 0.8. In this case, first-time assembly test yield would beonly 20%.
1.00
0.90
. 0.70
W UAU
go •
o 0.40
- 0.30
0.20
0.10
N =PARTS/ASSEMBLY
I I111111 I Ii lI I0.001 0.01 0.10
FRACTION DEFECTIVE PARTS
Figure 2. Fraction Defective Parts vs. Fraction Defective Assemblies
For an assembly containing 300 parts having a .001% defective, the fraction defective at theassembly level is 0.27, barring any further defects being introduced by the assembly process.Experience has shown, however, that many additional defects are caused during the manufacturingprocess.
ASSEMBLY LEVEL SCREENING
Screening at the assembly level exposes interconnections, fasteners, and manufacturing processesperformed by the assembly manufacturer to environmental stress. An assembly level screenprovides the first stimulation of defects caused by the assembly manufacturer's own personnel,manufacturing methods, and production equipment. A study performed by the Institute ofEnvironmental Sciences in 1984 revealed that failures discovered during unit level testing were
3

reduced by 27 to 70% after the introduction of assembly level screening. 2 The following types of
defects can be introduced into an assembly during the production process:
Parts
" Broken or damaged in handling* Wrong one installed" Correct one installed incorrectly* Failure due to electrical overstress or electrostatic discharge* Missing.
Interconnections
* Incorrect wire termination* Open wire due to handling damage* Wire short to ground due to misrouting or insulation damage
* Missing wire* Open etch on printed wiring board* Open plated-through hole* Shorted etch" Solder bridge* Loose wire strand* Ineffective potting" Leaking seals.
ESS is applied to assemblies to precipitate these defects before further assembly into units orsystems. ESS is not intended for detecting failures that can be detected by other quality control(QC) means (less expensive) such as visual inspection, x-ray, bum-in, etc.
Screening at the assembly level requires design and fabrication of specialized test equipment. Thefunction of an assembly may be to process various electrical signals and generate a certain output.The equipment needed to power and monitor this assembly must be able to create similar inputsignals and record the required output. This simulates the functional test equipment needed for pre-ESS and post-ESS functional testing and is considered specialized test equipment. Such equipmentmay be required for use during the actual stress screen, if specifications require the assembly to bescreened with power on and monitored. Such test fixturing will increase the costs associated withassembly level ESS. To avoid such costs yet still derive some benefit from thermal cycling andrandom vibration stress screens, AMC Regulation 702-25 recommends that baseline conditions forassembly level screens should have power off and no monitoring. This policy is intended todiscourage elaborate test fixturing for assembly level screens, unless such screens are found to benecessary because of equipment criticality, equipment design, manufacturing methods or cost. An
4

undesirable shortcoming of not powering and monitoring assemblies during screening is thatintermittent shorts, opens or other problems occurring only under thermal or vibration stress maynot be detected. If the occurrence of such defects is critical, the cost consideration may beoutweighed, and the assembly may have to be powered and monitored during screening. If notpowered and monitored, detecting these intermittent failures may be delayed until a higher levelscreen.
Mechanical or electromechanical equipment may contain defective sealed or pressurized assembliesthat are subject to failure and should require ESS. Performing a vibration or thermal cycling mayprecipitate failures before further assembly. The degree to which the assembly is an integral part ofa unit, and the ability to isolate inputs and outputs of the assembly will determine the cost of testfixtures needed to monitor, test or inspect the assembly after stress application. Where complicatedinterconnections are required for mechanical assembly level ESS, unit level testing may prove cost
effective. However, postponing the stress screen of an assembly causes delayed identification ofdefects and may impact the delivery schedule. Field failures of the assembly are an indication ofineffective screening and may justify the cost of the test fixturing required for performing ESS at the
assembly rather than unit or system level.
UNIT (OR HIGHER) LEVEL SCREENING
Screening at this level is favored by many manufacturers because electrical and mechanicalfixturing are relatively simple. Units are typically self-supporting structures with limited inputcabling and few output channels to monitor. Interfaces are more standard at this level than at thelower assembly level, facilitating fixture design. Units can be mounted directly on shaker tableswithout requiring special fixtures. For units too large to be mounted on shaker tables, vibrationtransducers can be directly mounted on the unit to provide vibration stimulus.
Stresses applied during assembly and unit level screens should not be as severe as during part levelscreens. As the level of assembly increases, the equipment is more susceptible to damage (fromvibration resonance or temperature limited components) and stress intensity must be reduced
accordingly. Also, the assemblies and components in units or systems may have already beenscreened to eliminate defects arising from parts or lower level assembly operations. The purpose ofunit or system level screening is to stimulate defects in fasteners and interconnections betweenPWAs, subassemblies, and assemblies. These interconnections may not have been screenedpreviously and should be stressed before leaving the factory. Screening at this level is important, asit is the first opportunity to detect defects arising from final assembly operations that wouldotherwi ie result in field failures. Low frequency vibration screening should be applied at the unitlevel to precipitate those defects that could be stimulated by the transportation environment.
For mechanical or electromechanical equipment, a failure-free functional test may be the best screenavailable. Large systems with self-contained cooling features, generators, engines, pumps, and
5

motors can be adequately screened by a functional test at or slightly over design rating. Operating apump at 110% of design pressure will sufficiently stress marginal components or assemblies tofailure. Running an internal combustion engine to 110% of design revolutions per minute (rpm) willdisclose part and workmanship defects that may not have been detected at normal stress levels.Operating heaters and air conditioners at maximum and minimum temperature limits will allow
detection of performance loss due to flow restriction, inadequate heat transfer, or othermanufacturing-induced deficiencies. Ambient environmental operation or low speed operation ofsuch mechanical assemblies will not disclose defects that are only detectable when the unit issubjected to stress.
SUMMARY
In summary, screening at lower levels of assembly can reduce schedule impact as well as reworkcosts. Stress screening at the part level is generally the most cost effective. ESS at higher levels ofassembly is necessary to assure the integrity of interconnections and fasteners introduced duringlater assembly stages, and to stimulate transportation-induced types of failures. For units that arenot suited to conventional temperature and vibration ESS, full performance or slight overstresstesting can serve as an effective screen for part and workmanship defects.
6

SECTION II. PART LEVEL SCREENS
This section concerns screens used for piece parts only. Screens for assemblies, units, and higher
levels of assembly are described in Section III.
Screening at the part level is generally the most cost-effective method for reducing the number of
defective parts prior to assembly. The cost of finding defective parts at the PWA level is
approximately 10 times greater than finding them at the part level. Based on the number of parts to
be used, this can result in sizable cost savings.
IC AND SEMICONDUCTOR DEFECT MODES
To deveiop an effective part level screening program, it is necessary to understand the defect modes
for ICs and semiconductors. The failures can usually be attributed to one of two major causes: (1)chip or die-related failures resulting from the fabrication process, or (2) package-related defects
caused by assembly errors. Examples of the failure causes are:
Chip or Die-Related Failure Causes
* Oxide fault/pinholes/breakdown* Oxide junction contaminants/leakage" Diffusion defects (such as spikes)* Passivation defects
* Mechanical defects in the chip (cracked dies, crystal imperfections, scratched dies)* Design defects (mask faults)" Foreign materials/particles* Metallization defects (opens, shorts for both single and multilayer metal)
" Residual process chemical* Human-derived chemical agents (spittle).
Assembly or Package-Related Failure Causes
* Open/shorted wires* Lifted/broken wire bonds
" Misplaced wire bonds" Multiple wire bonds* Lifted chips" Improperly sealed packages* Die attach defects* Excessive seal material* External lead defects" Overbonding/underbonding
7

" Residual process chemicals" Human-derived chemical agents (spittle)" Moisture" Outgassing polymers (poorly cured organic adhesives such as epoxy die attach)0 Broken wires0 Poor lead dress* Corroded wires.
There are several other failure mechanisms in parts that can cause failure. The decomposition ofsealants or adhesives can introduce materials that interact with IC materials to cause failure. Thepresence of water can cause internal shorts. Metal impurities in aluminum or gold bond wires couldcause hardening or microcracks leading to failure.
TEMPERATURE CYCLING (OR THERMAL SHOCK)
Temperature cycling and thermal shock impose mechanical stresses on parts through the expansionand contraction of materials. Microcracks, hard precipitates, and abnormally thin features becomestress concentrators that will accelerate crack growth through cycling-induced fatigue. Good partswill experience some fatigue life loss. However, it should not be enough to cause degradation.Temperature cycling is generally composed of 10 cycles, between -650C to +150 0C, with a 5-minutemaximum transfer time between temperature extremes. Temperature cycling uses an air-to-airmedium, while thermal shock uses a liquid-to-liquid medium to increase the thermal rate of change.Thermal shock must be used carefully for screening as it is more likely than temperature cycling todamage good parts. Thermal shock can generate microcracks in insulators or dielectrics. Thesemicrocracks may then grown in size to the point where they cause failures during the storage oroperating life of a device. Temperature cycling and thermal shock will precipitate the followingtypes of defects:
" Bad bonds• Thermal mismatch of materials, such as die-to-package interfaces" Lid seal anomalies on hermetically sealed packages* Inadequately or improperly cured plastic packages or material, such as epoxy die attach" Cracked dies or substrate mounting.
SUMMARY
Part screening tests are the most economical means of detecting parts defects. Screening at the partlevel is the least costly means of finding and eliminating part defects from hardwae. In addition, itis not always possible to determine if a part defect found at the assembly level is an escape from apart level screen or if the defect was introduced during handling, test or assembly procedures.Therefore, part screening should be done for every program as it facilitates failure analysis at higherlevels of assembly and reduces subsequent rework and schedule slippage.
8

SECTION III. ASSEMBLY LEVEL SCREENS
When parts are combined into assemblies and units, defects will be introduced throughworkmanship errors, contamination, miscalibrated equipment, and the use of defective parts. If highreliability parts are utilized, the number of defective parts advancing to the assembly level should beminimal. Some defective parts will exist, however, and subsequent damage to good parts fromhandling, electrostatic discharge or overstressing during the assembly and testing processes resultsin some defects residing in higher level assemblies. For these reasons, it is necessary to subjectassemblies and units to ESS to precipitate these defects.
There are many screens that can be used at the assembly level to precipitate and detect latentdefects. These screens include:
" Thermal cycling" Random vibration• Immersion" Overpressure, and* Voltage variation.
Short descriptions of the most common screens are provided in the following paragraphs. Each ofthe screens primarily precipitates specific types of defects, although some may have overlappingcapabilities. The choice of which screens to use depends on the equipment design and the types ofdefects expected to be found. Stress screening must be tailored to the specific equipment-it is notenough to simply impose thermal cycling and random vibration on all hardware. Form mechanicalsystems containing pressurized assemblies (fuel supply, pneumatics), these conventional stresses(thermal, vibration) may not precipitate as many defects as overpressure or pressure cycling.
For electronic systems, thermal cycling and random vibration have been found to be the mosteffective screens available, and are the most widely used. They are excellent for uncovering themicroscopic defects that are present in electronic equipment. Table 1 shows the types of defectsprecipitated by thermal cycling and random vibration. As can be seen, there is a lot of overlap in thedefect types precipitated by these two screens. The most effective ESS Program for electronicequipment would consist of both screens being used.
9

Table 1. Assembly Level Defect TypesPrecipitated by Thermal and Vibration Screens
DEFECT TYPE THERMAL VIBRATIONDETECTED SCREEN SCREEN
Defective part X XBroken part X XImproperly installed part X XSolder connection X XPCB etch, shorts, and opens X XLoose contact XWire insulation XLoose wire termination X XImproper crimp or mating XContamination XDebris XLoose hardware XChafed, pinched wires XParameter drift XHermetic seal failure XAdjacent boards/parts shorting X
THERMAL CYCLING
Thermal cycling is the least controversial and most widely used stress screen. It is an effectivescreen for precipitating defects at all levels of assembly, from PWAs to complete end items.Thermal cycling is a relatively inexpensive screen, especially when performed at the PWA levelwhere many units can be screened simultaneously in one chamber.
Thermal cycling consists of changing the temperature of the equipment at a fairly high rate ofchange in order to induce stresses on the parts and connections. There are three main parametersthat determine the strength of the screen: the temperature range, the thermal rate of change, and thenumber of cycles. The temperature range and rate of change must be specified as hardware
temperature values, not as chamber air temperature values. The equipment being screened has alarger thermal mass than the chamber air, so equipment response will lag behind the input stress.Experimental surveys (see page 33) are necessary to ensure that the equipment response is stressful
enough to precipitate defects while not damaging good units.
Thermal cycling causes stress in the test items through the expansion and contraction of materialsdue to temperature change. The repeated cycling will cause different materials to expand andcontract at different rates, resulting in stress at mating points, such as solder joints and connections.
10
Stress concentrations caused by microcracks, voids or material impurities will cause failure fromfatigue buildup, while good connections will have no stress concentrations. The high temperaturewill accelerate part failure mechanisms while the low temperature will precipitate electrical shortsdue to condensation.
The equipment should be powered up and monitored when possible in order to detect intermittentfaults. For example, a solder joint that has broken will contract at low temperature, creating an opencircuit, but when the temperature returns to ambient, the joint will expand, establishing electricalcontinuity. If testing is only performed after screening is complete (at ambient temperature), thefault might not be found and could result in failure on a cold day in the field. Power-on monitoringis easier at the unit level than at the PWA level. If PWAs are not powered up and monitored at thePWA level, a power-on, monitored screen should be performed at a higher level to ensure allintermittent defects are discovered.
RANDOM VIBRATION
Random vibration has been less widely accepted as an environmental screen than thermal cycling,but is equally effective. The major reason for the reluctance to use random vibration is that it is arelatively new stress type and the effect on the equipment is not always accurately predictable.Random vibration stress levels must be developed through experimentation with the equipment tobe screened; so called "standard" stresses may cause damage through overstress. The standard stresslevels must be used as baseline values only, with the contractor required to perform analysis toensure that the equipment is not damaged during the application and that defects are screened out.
Random vibration has replaced sine and swept-sine vibration as a stress screen because it has beenshown to be more effective in precipitating latent defects. Sine vibration applies energy at only onefrequency and does not exercise all resonances of the equipment. In addition, the danger of fatiguefailure is increased since all the energy goes into the one frequency. Swept-sine vibration appliesenergy at different frequencies sequentially. The dwell time at each frequency is not long enough tocause fatigue problems. Neither is the dwell time long enough to give the equipment enough time tofully respond to the input stimulus. Random vibration applies relatively constant energy in allfrequencies. The energy applied at any one frequency is much smaller than that provided by sinevibration, so there is less danger of fatigue damage. Since the vibration occurs at all frequenciesduring the entire screen, the equipment also has time to reach a steady state response to the input.Random vibration is also the closest approximation ot the actual vibration seen by the equipment inthe field. These factors all combine to make random vibration a more effective, less damagingscreen when applied correctly. Experimental surveys (see page 33) are essential to ensure that the
equipment is not damaged by the vibratory stress levels imposed for screening.
There are three parameters which determine the effectiveness of a random vibration screen: theresponse profile, the duration of the screen (in each axis), and the number of axis. The response
11

profile is a measure of the total energy received by the equipment (as opposed to the input profile)and is determined by the excitation frequency range and the power spectral density (PSD), theenergy input at each discrete frequency. The duration of screening in each axis should be 10minutes. After 10 minutes, the fallout rate approaches zero and the screen effectiveness diminishes.The 10-minute random vibration should be performed on each of the three orthogonal axis.Excitation of multiple axis simultaneously gives a more realistic screen than discrete axis screening,and should be used when possible.
Random vibration stresses the equipment by imposing acceleration forces on solder joints andconnectors. These forces cause stress concentrations around material impurities, voids, andmicrocracks. The repeated application of force will cause crack growth and failure due to fatigue.Good equipment will not be damaged by fatigue since the stress level is not great enough to causefailure except where stress concentrations are present. Random vibration is also effective inidentifying conductive particles, debris, poor fasteners, and loose hardware.
12

SECTION IV. DETERMINATION OF
THERMAL CYCLING REQUIREMENTS
This section describes the methods for determining the stress intensity levels for thermal cycling.
THERMAL CYCLING SCREEN
Thermal cycling should be performed on all items to detect part defects and workmanship errors. Itshould be used in conjunction with random vibration and is particularly applicable to electronicequipment. Thermal cycling, when using good parts and packaging techniques, is not degrading tothe equipment, even after several hundred cycles. It is suggested that thermal cycling be done atleast twice on each item, once at the PWA level and once at a higher indenture level. Power shouldbe applied when possible and the hardware should be functionally tested during screening wheneconomically feasible in order to identify defects that only become detectable under certainenvironmental conditions.
Screen Strength
Thermal cycling is a much stronger screen than a high temperature bum-in or ambient bum-in. Thescreen strength is a measure of the effectiveness of the specific screen. The strength of the screen isdefined as the probability that the screen will precipitate a given defect, providing the defect ispresent in the equipment, and is determined by the following equation:
SSTC = I - exp [-0.0017 x (R+0.6)0 .6 x (In (e + dT))3 x Ncy]
where
SSTC = Thermal Cycling Screening StrengthR = Temperature range, Tmax-Tmin ('C)dT = Thermal rate of change (0C per minute)Ncy = Number of cycles
The three parameters that determine the strength of the thermal cycling screen are the temperaturerange, the thermal rate of change, and the number of thermal cycles. Table 2 provides a tabulationof values of thermal cycling strength for different combinations of these parameters. The parametricvalues must be measured on the hardware, not the chamber air. The equation for screening strengthis based on an analysis of actual results from many screening programs.
The thermal cycling requirements will be different for lower and higher levels of assemblies.Hardware characteristics such as thermal capacitance, materials, and part specifications will impactthe values of the stress than can be applied during the screen. The development of stress values willbe divided into PWAs and unit (or higher) level assemblies.
13

Table 2. Screening Strength, Temperature Cycling Screens
NUMBER OF TEMPERATURE RANGE (R) (-C)CYCLES (Ncy) 20 40 60 80 100 120 140 160 180
2dT5. .1633 .2349 .2886 .3324 .3697 .4023 .4312 .4572 .4809
10. .2907 .4031 .4812 .5410 .5891 .6290 .6629 .6920 .717315. .3911 .5254 .6124 .6752 .7232 .7612 .7920 .8175 .8388
20. .4707 .6155 .7034 .7636 .8075 .8407 .8665 .8871 .9037
4dT5. .2998 .4147 .4939 .5543 .6027 .6427 .6765 .7054 .7305
10. .4969 .6437 .7308 .7893 .8312 .8624 .8863 .9051 .920115. .6292 .7748 .8498 .8945 .9234 .9430 .9567 .9667 .9740
20. .7198 .8522 .9120 .9441 .9629 .9746 .9822 .9873 .9907
6 dT5. .4141 .5522 .6400 .7025 .7496 .7864 .8160 .8401 .8601
10. .6431 .7873 .8603 .9033 .9306 .9489 .9617 .9708 .9774
15. .7742 .8931 .9418 .9657 .9788 .9864 .9910 .9939 .995820. .8517 .9432 .9739 .9868 .9929 .9960 .9976 .9986 .9991
8dT5. .5098 .6574 .7439 .8014 .8422 .8723 .8953 .9132 .9274
10. .7469 .8731 .9275 .9556 .9715 .9811 .9871 .9910 .993615. .8625 .9493 .9774 .9889 .9941 .9967 .9981 .9989 .999320. .9215 .9781 .9923 .9969 .9986 .9994 .9997 .9998 .9999
10dT5. .5898 .7379 .8178 .8674 .9005 .9237 .9405 .9529 .9623
10. .8204 .!.242 .9624 .9796 .9883 .9930 .9956 .9972 .9982
15. .9163 .9759 .9913 .9964 .9984 .9992 .9996 .9998 .9999
20. .9585 .9916 .9977 .9993 .9997 .9999 .9999 .9999 .9999
12
dT
5. .6568 .7994 .8704 .9115 .9373 .9544 .9661 .9744 .9804
10. .8726 .9548 .9805 .9906 .9952 .9974 .9985 .9991 .999515. .9490 .9886 .9966 .9988 .9996 .9998 .9999 .9999 .9999
20. .9780 .9968 .9993 .9998 .9999 .9999 .9999 .9999 .9999
14
Printed Wiring Assembly Requirements
Temperature Range
For PWAs, the temperature range should be as large as component characteristics will permit. Thenominal value for the PWA temperature range is -50C to +75C. One potential problem that mustbe considered when determining the temperature range is the thermal overstressing of componentparts. If the PWA contains parts that are not rated to the nominal extremes cited above, thetemperature range should be limited by the component part values. For best screening results, therange should be at least 110C for PWAs. If component values reduce the range below 1 10C, morecycles or a higher rate of change can be used to increase screening strength.
Rate of Change
The thermal rate of change of the individual parts is the stress of interest, and is dependent on thechamber capacity and the size of the hardware. In general, the thermal rate of change should fallbetweeii 5°C/minute and 20°C/minute, with the higher rates providing a better screen. The thermalrate of change should be determined by a thermocouple mounted directly on the electronic
component with the largest mass, not by the temperature of the input air. The PWA has a largerthermai capacitance than the chamber air, so the temperature of the PWA components will changemore slowly. A thermal characteristic survey (see page 33) is required to determine the equipmentresponse to the input air. The minimum rate of change for PWA screening shall be 5°C/minute.
Number of Cycles
The number of thermal cycles required is more closely related to the temperature range and rate ofchange than to the equipment complexity or number of parts. For PWAs, there should be at least 20cycles, with more required if the thermal rate of change is less than 15'C/minute or the range is lessthan 1 10°C. For every drop in rate of change of 5°C/minute, the number of cycles should beincreased by 5; i.e., for a rate of change of 10°C/minute, there should be 25 cycles. For every 10'Cdrop in temperature range below I 10°C, an additional 5 cycles should be required. These values arebaseline values only, and the program should allow modification if effective screening can beachieved with different values.
Profile
A profile of a typical thermal cycle for PWAs is presented in Figure 3 and shows both the chamberair temperature and the PWA thermocouple temperature. The dwell times at +700C and -400 Cshould be only long enough to reach thermal stability. Thermal stability is achieved when thelargest thermal mass within the PWA comes within 2C of the temperature extreme or when the rateof change falls below 20C/hour.
15

TEMPRATURE DWEL WEL
70CHAMBER AIRTEMPERATURE
I, j THERMOCOUPLETEMPERATURE
Room \I/,-P I,I \I
ROI \ II \1
/ \ /0I
1 I /
-40 '1mg___,_____ -WELL'
TIME It
*TIME TO REACH THERMAL STABILITY
Figure 3. Typical PWA Thermal Cycling Profile
Performance Monitoring
Performance monitoring and power on-off cycling is usually not cost effective for PWAs. This is
because it is difficult and expensive to develop the signal generating and output monitoring testequipment. It would be advantageous to monitor the PWAs in order to identify intermittent defectsthat only occur at temperature extremes. However, by requiring a power on, monitored thermalscreen at a higher level of assembly, the majority of these defects can subsequently be identified andremoved.
During screen development and initial implementation, the thermal cycling screen results should bemonitored and analyzed to optimize the screen. It is suggested that a functional test be run after
every 5 cycles to determine the fallout rate. The number of cycles can be modified if the majority ofdefects are consistently identified during the first part of the screen.
Unit (or Higher) Assembly Level Requirements
As the lcvel of assembly increases, thermal cycling becomes more complex and harder to performeffectively. The thermal capacitance of the assembly increases due to more mass, and it becomesharder to stress parts internal to the assembly. Nevertheless, thermal cycling is an effective screen atthe unit (and higher) levels of assembly.
16

Temperature Range
For unit level and higher, the equipment specifications for maximum and minimum storage andoperating temperatures should be used to establish the baseline temperature range. Nominal valuesfor the temperature range (storage) are -40'C to +70'C for units and -40'C to +60'C for completesystems. Care should be taken to ensure that the temperature range does not overstress any internal,temperature-dependent component parts. If the unit is powered up, the internal temperature will risedue to the parts' heat dissipation and could overshoot the input temperature extreme.
Rate of Change
The thermal rate of change for units is also dependent on the chamber capacity and the mass of theequipment. The rate of change should be between 5°C/minute and 10'C/minute, when measured bya thermocouple mounted on the largest PWA. The chamber air rate of change must be greater thanthis to overcome the unit's thermal capacitance. Typically, when chamber air is cycled at a rate of50 C/minute, the actual equipment rate of change is l°C/minute to 21C/minute.
Number of Cycles
The number of cycles required for unit (or higher) level screening should be between 10 and 20. Atthe beginning of the screening program, the number of failures per cycle should be monitored andanalyzed. If the data shows that a large majority of the defects can be screened out in fewer cycles,the number of cycles may be reduced in order to maximize the cost effectiveness. The nominalnumber of cycles for units or higher level assemblies is 12.
One failure-free cycle should be required during thermal cycling to ensure that all defects have beenremoved from the unit. A failure-free cycle is one complete cycle with no defects found duringperformance monitoring. In the event a defect is discovered, the unit should be repaired andrequired to pass another failure-free cycle.
Profile
A typical thermal cycle profile for a unit, showing both chamber air and PWA responsetemperatures, is presented in Figure 4. The dwell time at the maximum and minimum operating andstorage temperatures should be only long enough to achieve thermal stability. When thermalstability is achieved at the upper and lower operating temperatures, a functional check should beperformed to identify any temperature-induced defects.
17

TEMPERATURE ("C-
MX - - D CHAMBER AIR TEMPERATURE
STORAGE PM* -- COLD PLATE TEMPERATURE
MAXOPERATING
/
ROOM,TEMPERATURE
/
DWELL-MIN
OPERATINGDW
STORAGE -POWER ON --- -POWER OFF PWO
TIME
*PM = PERFORMANCE MONITORING**T1Mt =TIME TO REACH THERMAL STABILITV
Figure 4. Typical Unit (or Higher) Thermal Cycling Profile
Performance Monitoring
Units (and higher assemblies) should have power-on cycling during the screen, as was shown inFigure 4. Power is applied at low operating temperature and the unit remains on during theincreasing temperature ramp. Having the unit powered during the ramp increases the thermal rate of
change due to the heat dissipation from the component parts. Once a functional check is performed
at the high operating temperature, power should be cycled off to avoid thermally overstressing theunit during transition to the maximum storage temperature. It should remain off during the
decreasing temperature ramp to aid in achieving a higher thermal rate of change. If power is onduring the cold ramp, the chamber input air will have to overcome both the thermal capacitance ofthe equipment and the heat dissipated by the parts.
The unit (or higher assembly) should be monitored for functional integrity during the screen. This isespecially important if PWA level screening is done without performance monitoring. A large
percentage of ESS-detected defects are intermittents, occurring only under a specific set ofenvironmental conditions. Monitoring performance will provide evidence of the intermittent
defects, making their isolation and removal possible. Higher level test equipment is cheaper todevelop than PWA equipment, since many of the input signals are internally generated.
18

Special Considerations
Magnetic Devices
Magnetic devices continue to be a problem area for thermal cycling. Poor quality magnetics canhave a high fallout rate from thermal cycling. The problem is that magnetics are not effectivelyscreened at the assembly level because their temperature rate of change lags behind the rate ofchange of the rest of the components by an excessive amount. A piece of equipment (excluding themagnetics) can reach thermal stability in 15 minutes, but it takes several hours for the magnetics toreach thermal stability. The dwell time at the temperature extremes is normally set for the smallerelectronic components and not for the magnetics.
There is an alternative screen for magnetics. Magnetics should be built to MIL-T-27E and should besubjected to the optional MIL-STD-202F thermal shock screen on a 100% basis. While the data tosupport this is small, it appears that thermally shocked magnetics have little or no additional falloutwith subsequent equipment thermal cycling. For some time, thermally shocking magnetics havebeen a requirement for power supply reliability.
Water-Cooled Power Supplies
Power supply thermal cycling has presented some unique problems. There have been several casesof power supplies being subjected to thermal cycling while mounted on water-cooled cold plates.This means that the unit cannot be cycled to temperatures much below 00 C or the water in the coldplate will freeze. Worse, the water stabilizes the internal temperature of the unit which means theelectronics are not actually experiencing the thermal cycling.
A better alternative is to perform most thermal cycling on power supplies without the water-cooledplates. In most cases, power can still be applied, but care must be taken not to cause degradation bythermally overstressing the components.
Potted Units
There are many questions about the value of thermal cycling of potted power supplies and units. Itmight appear that this screen would have limited value for potted units. While there may bearguments that the screening effectiveness is less for potted units, there have been significantreliability improvements on a variety of power supplies from different vendors that have addedthermal screening to existing designs. It can be stated that potted power supplies and units shouldhave some thermal screening. In most cases, it is advisable to do the thermal cycling prior topotting.
19

Summary
Thermal cycling is the most common stress screen used to precipitate latent defects at both the PWAand unit levels of assembly. The part or unit specifications should be used to determine thetemperature range, and all parameters should be measured on the PWAs. While power-on cyclingand functional monitoring are usually not cost effective at the PWA level, they should be performedat the unit (and higher) level of assembly to identify intermittent defects. Some components musthave special consideration and may have to be removed from assemblies during screening. Allbaseline values are for guidance only; the final parameters should be based on equipment responseand analysis of screening results. The nominal baseline stress levels to be used during developmentof thermal cycling are presented in Table 3.
Table 3. Baseline Thermal Cycling Conditions
LOW HIGH RATE OF POWER FAILURELEVEL TEMP TEMP CHANGE ON MONITOR CYCLES FREE
Assembly -500C +75°C 15°C/minute No No 20 noneUnit -400C +70C 10°C/minute Yes Yes 12 last 1System -400C +60'C 10'C/minute Yes Yes 12 last I
Sample Statement of Work (SOW) for Thermal Cycling
Application: Production contract/Request for Proposal (RFP); Development contractlRFPPWAs, units, systems
Temperature cycling shall be conducted in accordance with the table below for each productionunit, all printed circuit board assemblies, power supplies, and units including spares unlessdetermined otherwise by the procuring activity.
Temperature Cycling Baseline Conditions
LOW HIGH RATE OF POWER FAILURELEVEL TEMP TEMP CHANGE ON MONITOR CYCLES FREEAssembly -50 OC + 75 °C 15 C/minute No No 20 none
Unit -409C +70'C 100Clminuie Yes Yes 12 last I
System -40 rC +60 'C 10 °C/minute Yes Yes 12 last I
Decreased stress levels are subject to Government approval, based on thermal survey results,component specifications, or other suitable technical justification submitted by the contractor inESS procedures or other documents. Increased stress levels may be applied to improve screeningeffectiveness provided that the design capability is not exceeded.
20

Dwell time at the temperature extremes shall be sufficient to bring the point of maximum thermalinertia (see MIL-STD-781DE, Task 201) to within 2 0C of the specified limit, or to a thermal rate ofchange of 2 0C or less/hour. Functional testing shall be performed immediately prior to, andimmediately following, thermal cycling. Failures occurring during thermal cycling shall beanalyzed for root cause and entered into the contractor's failure reporting and corrective actionsystem with verification that corrective action will preclude recurrence of the failure mode. If size,mass or cost preclude screening at the system or subsystem level, the contractor shall recommendthermal cycling at lower levels and/or full-scale performance testing of the entire system for afailure-free period, subject to approval by the procuring activity. Results of thermal cycling shallbe included in Contract Data Requirements List (CDRL) number "ESS PerformanceReports" and procedures used to conduct thermal cycling shall be included in CDRLnumber "ESS Procedures. "
THERMAL CHARACTERIZATION SURVEY
After manufacture of an initial prototype in the development phase or a first article in the productionphase, a unit shall be subjected to a thermal characterization survey. The purpose of the survey is todetermine the thermal rate of change response and the time to reach thermal stabilization, and toidentify any "hot spots" in the unit that could degrade equipment reliability. The thermal surveyshould be performed prior to implementing thermal screening.
MIL-STD-78 ID, Task 201, paragraph 201.2.1, is an appropriate task to be invoked in a contractSOW to perform a vibration survey. Data item description DI-RELI-80247 describes the data andreport to be submitted by the contractor following the survey.
This survey should be conducted before other reliability testing because results may indicate theneed for a design or processing change. Corrective action resulting from these discoveries canimpact design and must be resolved prior to further testing to ensure valid results.
The outcoime of the survey will also be used as input to ESS procedures, specifically to determinethe temperature levels, time durations, and thermal rates of change needed to precipitate defectswithout damaging the article.
The temperature of each component identified as a high power-dissipating component shall bemonitored during the survey to identify actual thermal stress and to compare actual operatingtemperatures to those arrived at analytically or through the manufacturer's specified limits. Cases ofconflict or significant deviation from expected values shall require investigation, corrective action,and verification of problem resolution.
An output of the survey is a time/temperature plot showing actual temperatures of the high-powerdissipating components, chamber air temperature, chamber controller temperature commands, and atime axis for the survey. This plot will yield a temperature rate of change that can be compared tothe required values.
21

If the article has a self-contained cooling system, inlet and outlet temperatures and flow rates should
be recorded. The report should also describe the test equipment, probe locations, and unit under
test. A diagram of the test set-up should be included, as should a discussion of thermal
measurements' accuracy.
A thermal survey should be conducted initially in the development phase to define ESS levels as
early as possible. This also provides early feedback to the design process if any revisions are found
necessary.
During the production phase, a first article should be subjected to the same thermal survey
conducted during development to validate that the parts, processes, and personnel used in
production have not caused a deviation from the performance of hardware produced during
development. An approximate cost of a thermal survey is less than $1,000 for a printed circuit
board (PCB) or small unit. If there is insufficient funding to perform a thermal survey during
production, the validity of the development results will have to be assumed. This could lead to later
identification of problems caused by parts or processing changes used in production. A thermal
survey on production first articles ensures early identification of such problems, thereby maximizing
the potential for project success.
Sample Statement of Work (SOW) for Thermal Survey
A thermal survey shall be performed in accordance with MIL-STD-781D, Task 201, paragraph .2.1,
for each level of assembly to be screened. After performance of the surveys, a thermal survey
report shall be prepared in accordance with data item description DI-RELI-80247 and delivered in
accordance with the CDRL. The survey report shall contain the results of the surveys performed on
each level of assembly subjected to screening. The thermal cycling baseline conditions shall be
used as the thermal limits for the surveys.
Procedures used to conduct the thermal survey shall be included in CDRL number "ESS
Procedures," and shall be approved by the Government prior to use.
Review of Thermal Survey Report
The following is intended to assist the Government activity having responsibility for review and
approval of the thermal survey report.
A therma, survey report provides the results of a survey performed by the contrac~or to determine
the response of an article to thermal stress. The report should describe the techniques used to
conduct the survey, the number and types of temperature probes used, locations of probes,
temperature ranges applied, time durations, and identification of the article under test. These
elements are derived from MIL-STD-781D, Task 201, paragraph 201.2.1, which is an appropriate
22

task to be invoked in a contract SOW for performing a thermal survey. Additional details aredefined by data item description DI-RELI-80247 which describes the data and report to besubmitted by the contractor.
The thermal survey shall be used to determine hot spots on the article and the component of greatestthermal inertia, and to establish the time/temperature relationship between the equipment and thechamber air. The results shall be used to determine the thermal limits, the chamber air inputrequirements, and the screen time durations that will be incorporated into the ESS procedures.
The following checklist is to be used by the activity responsible for approval of the thermal surveyreport. The reviewer should note in the review any discrepancies or missing information. Essentialdeficiencies noted by the Government reviewer may constitute rejection of the report and requirerevision and resubmission by the contractor.
Thermal Survey Report Checklist (Ref. MIL-STD-781D, Task 201, Paragraph 201.2.1, andDI-RELI-80247)
" Temperature measurements are provided for those parts identified as high power-dissipatingparts and those representative of part populations. These measurements are shown on atemperature versus time plot which also indicates the temperature being commanded by thechamber controller and the actual chamber temperature.
" Description of the item under test includes equipment serial number, date of test, and location oftest facility.
* Identification of test equipment includes manufacturer, model numbers, accuracy, and a diagramshowing test setup.
" Discussion of thermal measurement accuracy is provided.
" The flow rate of coolant used in the equipment (if applicable) and their inlet and outlettemperatures.
" Is power applied to the item during the survey?
n High and low temperature limits applied during the survey are given. If operating temperaturelimits are different from 'torage temperature limits, both are stated.
* Temperatures of the item and chamber air are recorded continuously and shown on atemperature versus time plot.
" Areas of heat concentration (hot spots) are identified and verified not to exceed itemspecifications at temperature extremes.
23

" Duty cycle and temperature durations are recorded.
" Temperature rate of change for heating and cooling cycle transitions is stated, based on recordedtemperature/time data.
* The component of greatest thermal inertia is identified.
" The lower test temperature stabilization time is shown to be the point in time where thetemperature of the component of maximum thermal inertia is within 2'C of the lower testtemperature specified for thermal cycling, or the rate of change of this component is less than2'C per hour. The upper test temperature stabilization time is determined likewise.
" All test failures, unexpected hot spots, or thermal excursions beyond specified limits have
resulted in corrective action and been resolved.
" The number and types of probes and measuring devices are stated.
" The locations of probes and instrumentation used to measure temperatures of parts and ambientchamber air are stated.
24

SECTION V. DETERMINATION OFRANDOM VIBRATION REQUIREMENTS
This section describes the method for determining stress intensity levels for random vibration.
RANDOM VIBRATION SCREENING
Random vibration, while more controversial, is an effective stress screen and should be used inconjunction with thermal cycling to precipitate latent part and workmanship defects. The stressmust be closely tailored to the equipment design capability to provide an effective screen withoutdamaging good components. Specification of so called "standard" stress levels have resulted inscreens which are either ineffective or cause hardware damage. Therefore, the stress levelsspecified in contracts should be baseline values only, and the contractor should be required toexperiment with the equipment to determine either: (1) that the baseline values are not damagingand produce and effective screen or (2) that different stress levels are necessary.
Random vibration stress levels have been mistakenly specified as input stress values in manyprograms. The stress levels specified for random vibration must be the response levels measured onthe equipment, not the input levels. The mechanism that accelerates the failure of marginal defectsis the actual stress that is induced on the parts. In all assemblies, there are inherent structuralcharacteristics which provide either amplification or attenuation of the input stress on its path to thecomponent parts. For example, , if a PWA is vibrated at its natural frequency, the vibratory forceseen by a component on the board can be many times larger than the driving force. Isolation of aboard can result in much less stress being achieved at the part than intended. Structuralcharacteristics of the test fixtures can also have an impact on the value of the stress applied at thepart location. For these reasons, the random vibration stress levels must be specified as the levelsachieved at the part, not as input values. A vibration survey (see page 33) must be performed oneach assembly to be screened to determine the response of the equipment to the input forces and todevelop the input stress levels necessary to achieve the required response.
Screen Strength
There are two factors which determine the strength of a random vibration screen: the accelerationlevel and the duration of the applied stress. The strength of a screen is defined as the probabilitythat the screen will precipitate a defect, given that the defect is present. Screen strength values havebeen determined experimentally by the Rome Air Development Center in several documents. Thelatest version of the screen strength equation for a random vibration screen is:
25

SSRV = I - exp [-0.0046 Grms 1.71 t]where
SSRv = Random vibration screen strengthGrms = The root mean square (rms) acceleration levelt = The duration of the screen (minutes)
Table 4 provides a tabulated summary of screen strength values determined by using this equation
for various combinations of Grins level and time. The equation considers vibration in one axis at atime only. One note of caution: defects are not always equally screenable in each axis (i.e., a defectmay be precipitated by z-axis vibration but not by x-axis or y-axis vibration), so the screen strength
applies only to defects screenable in that axis.
Table 4. Screening Strength for Random Vibration Screens
Grns LEVEL
DURATION
(minutes) 0.5 1.0 1.5 2.0 2.5 3.0 3.5 4.0 4.5 5.0 5.5 6.0 6.5 7.0
5 0.007 0.023 0.045 0.072 0.104 0.140 0.178 0.218 0.260 0.303 0.346 0.389 0.431 0.473
10 0.014 0.045 0.088 0.140 0.198 0.260 0.324 0.389 0.452 0.514 0.572 0.627 0.677 0.723
15 0.021 0.067 0.129 0.202 0.282 0.363 0.444 0.522 0.595 0.661 0.720 0.772 0.816 0.854
20 0.028 0.088 0.168 0.260 0.356 0.452 0.543 0.626 0.700 0.764 0.817 0.861 0.896 0.923
25 0.035 0.109 0.206 0.314 0.424 0.529 0.625 0.708 0.778 0.835 0.880 0.915 0.941 0.959
30 0.041 0.129 0.241 0.363 0.484 0.595 0.691 0.772 0.836 0.885 0.922 0.948 0.966 0.979
35 0.048 0.149 0.275 0.409 0.538 0.651 0.746 0.822 0.878 0.920 0.949 0.968 0.981 0.989
40 0.055 0.168 0.308 0.452 0.586 0.700 0.791 0.860 0.910 0.944 0.966 0.981 0.989 0.994
45 0.061 0.187 0.339 0.492 0.629 0.742 0.829 0.891 0.933 0.961 0.978 0.988 0.994 0.997
50 0.068 0.205 0.369 0.529 0.668 0.778 0.859 0.915 0.951 0.973 0.986 0.993 0.996 0.998
55 0.074 0.224 0.397 0.563 0.702 0.809 0.884 0.933 0.964 0.981 0.991 0.996 0.998 0.999
60 0.081 0.241 0.424 0.595 0.734 0.836 0.905 0.948 0.973 0.987 0.994 0.997 0.999 1.000
Since the random vibration stress levels must be so closely tailored to the design capabilities of eachassembly to be screened, only general baseline values can be provided in specifications. The
contractor must experiment with the equipment to find the optimal stress levels. The baseline valuesspecified will not be different for different levels of assembly. The major differences between eachassembly level will be whether or not power is applied and the system is monitored.
26

Random Vibration Screening Parameters
There are five main parameters of random vibration screening which must be specified in thecontract or SOW:.
1 Power spectral density (PDS)
2 Frequency range
3 Duration of screening
4 Number of axis, and
5 Performance monitoring.
The first two parameters, the PSD and the frequency range, are combined to give the overall Grmslevel and the vibration profile for the screen. Due to the varying parameters of electronic andelectromechanical hardware and the complexity of optimizing the vibration levels, there is no oneprofile applicable for all equipment.
Vibration Profile
The vibration profile specified by the Naval Material Command (NAVMAT) document P-9492,3implementing random vibration as a stress screen, is provided in Figure 5, Program F. SinceNAVMAT P-9492 was published in 1979, this profile has been erroneously considered the"standard" random vibration profile and has been specified on numerous ESS programs. Peoplehave mistakenly assumed that since the profile was in the guidance document, it was applicable toall programs. In fact, this is the vibration profile as measured on the instrument panel in the cockpitof a military jet aircraft, and the profile was developed to screen a unit that would be used in thatenvironment. Blanket imposition of this requirement, without consideration for the equipmentdesign or the expected field environment, has resulted in screens that were ineffective or that causeddamage to the hardware. A more efficient method of determining the required profile is to use theexpected field environment as a baseline and experiment with the equipment to determine the PSDlevels and profile necessary to screen out defects.
Random vibration profiles do not have to match the NAVMAT profile to be effective. Industrialstudies have shown that effective screening can be accomplished with many different profiles. Onestudy 4 of six different pieces of equipment shows good results with all six of the profiles shown inFigure 5. A profile giving white noise, such as in Program E, is probably the best one to start within developing a screen. The Grms values of the six screens range from 2.67 through 6.3 Grins.
27

0 CO
cc a.
U. c
I('H/&D) AWSN30 IVJ3dS W3MOd(ZH/rOP A.ISNI V.L3dg tf3MOd
z Z C
(LA cc LA a
(zH/zfDI A.lISN3I VU.IdS IRM~d (zH/zOP A.ISN3O 1VW.DUdS H3MOd
AS-
L9 A >.
cc a~ LA
~LO. .= cc
p U. cc.
0iO IL
(214/zO) AJ.ISN3I VULOUdS M3MOd ('H/top A.LISN30 IVIU33dS V3M~d
28

Root Mean Square Acceleration Force
The Grins value is defined as the square root of the area tinder the vibration profile. In real terms, itis the time and frequency average of the vibratory energy produced by the profile. The energyintroduced at any particular frequency is specified in terms of PSD. The dimensions of PSD are g2per hertz (Hz). Therefore, multiplying the PSD times the frequency bandwidth over which it isapplied will give the energy in terms of g2 . The square root of this number will give the overallGrms level. The Institute of Environmental Sciences (IES) Guide to ESS for Assemblies 2 states thateffective results have been achieved by random vibration screens with levels of 3 to 6 Grms. TheNAVMAT profile produces a level of 6.04 Grms.
Figure 6 provides a random vibration envelope which may be used as a starting point for specificequipment random vibration screens. The parameters which determine the vibration profile are thePSD and the frequency. The PSD level should be between .02 and .07 g2/Hz, with a nominal valueof .04 g2/Hz used as the baseline to begin tailoring the screen to the equipment. This level will bespecified as the input level and the structural response of the equipment must be measured to ensurethat the vibratory force is being transmitted to the component parts. The input level may be scaledup or down if the structural response of the equipment is not satisfactory.
Frequency Range
The frequency range is the other parameter in the development of the vibration profile. The inputfrequency range should be 5 to 2,000 Hz. The lower frequency stress will excite the same defectsthat will be exercised during transportation. The frequency range should excite a number ofdifferent modes of the equipment. The input bandwidth can be modified if experimental resultsshow that the equipment response is still in the specified range.
- IO7 0"141
\ '\
22
I II I
I II I
FA USNC V
Figure 6. Sample Envelope-Acceleration Spectra for Random Vibration
29

If the equipment resonant frequencies fall within the input frequency range, excess energy could beseen by the equipment and damage could occur. During experimentation with the equipment, theresonant frequencies should be identified. When equipment resonant frequencies fall within theinput bandwidth, there are two ways to prevent equipment damage. If the program is in the full-scale engineering development (FSED) stage, the equipment design can be modified to provide amore rugged unit and force the resonances to fall outside the frequency range. If this is not possible,or the equipment is in the production stage, intelligent notching of the input profile can be achieved.
Notching is the process of reducing the input PSD levels over a small frequency bandwidth so thatequipment is not damaged due to overstress at the resonant frequencies. Notching the input profilemust be closely tied to the equipment response. The notch should be only large enough so that theequipment response matches the specified profile. Overnotching, or reducing the input levels toomuch, will cause the equipment to see no stress at that frequency, so defects that would have beenexcited by that frequency go undetected. There is no notching in the field; those defects will showup as early life failures. Notching is a less desirable alternative than modifying the equipment;however, in some cases, design modifications are impractical.
Since the equipment response depends more on its structural characteristics than the input profile,tight control of the input profile is not necessary. It is recommended that tolerances of 20% beallowed for the overall Grins level, lower frequency limit, and upper frequency limit. Once theappropriate input PSD levels are determined, they should be controlled within ± 3 decibels (dB).
Screen Duration
The other parameter in the screen strength equation for random vibration is the duration of theapplied stress. The majority of the failures will be precipitated in the first portion of the screen, andcontinued screening will become less efficient. Figure 7 provides a graph showing the percent ofdefects that are precipitated in a 6 Grins screen over time. After 10 minutes, almost 70% of thescreenable failures have been detected. Increasing the exposure time above 10 minutes may providesome additional fallout, but will also place extra stress on the good items. In addition, since theequipment should be exposed to vibration in each of the three orthogonal axis, screen durationshould be kept as short as possible to reduce total screening time.
30

"0
0 40-02 I
0 z0 20 W 40 so
VISRATION TIME, MINUTES
Figure 7. Percent Fallout as Vibration Time Increasesfor Unit/System Level Screening
(Using 6 Grms Random Vibration)
Number of Axis
Defects are not always screenable in all three axis; some defect modes will only be precipitated byvibration in a specific axis. In order to screen as many defects as possible, random vibration should
be applied in all three axis. This is especially true for units where parts can be mounted in manydifferent orientations. For PWAs, screening may be reduced to one axis if the three-axis screeningresults indicate that a majority of the defects are precipitated in one axis. If single axis screening isused for PWAs, z-axis (perpendicular to the PWA plane) should be used. Simultaneous multi-axisexcitation is also an acceptable method of performing a random vibration screen. If multi-axisscreening is used, the duration of the screen should be at least 10 minutes.
Performance Monitoring
Powering up and functionally monitoring the equipment during vibration provides the most effectivescreen. However, for PWA screening, the cost and complexity of developing the monitoringequipment, signal generators, and associated cabling make most monitoring inefficient. Therefore,unless the PWA operation is simple enough for the monitoring system to be developedinexpensively, PWA screening should be done with power off and unmonitored. Unit (or higher)
31

level random vibration screening should be done with power on and functional monitoring of theequipment. The intermittent failures that would be detected through monitoring will escape thePWA screen, but will be detected during the higher level screen.
Summary
Random vibration is an effective screen for both PWAs and higher level assemblies. The vibrationstress levels, however, must be tailored to the equipment design capabilities. The response of theequipment to the input stress is the factor of interest; the input does not have to be tightly controlledproviding that the response is appropriate. The input stress may be either random or quasi-random.If equipment resonant frequencies are excited by the input stress, the equipment design should bemodified to change the resonant frequency. If design modification is not possible, input stressnotching may be applied, providing that the equipment response does not fall below the specifiedresponse levels. All specified values are baseline values to be used as take-off points for equipmentexperimentation to determine the actual stress levels. Equipment characterization surveys (seepage 33) are necessary to determine the equipment response to the input stress. The baseline levelsto be used in random vibration screening are presented in Table 5.
Table 5. Baseline Vibration Conditions
INTENSITY DURATION FREQUENCY(Grms: PER AXIS POWER RANGE
LEVEL g2 /Hz) AXIS (minutes) ON MONITOR (Hertz)
Assembly 6: 0.04 3 10 No No 5 - 2.000
Unit 6:0.04 3 10 Yes Yes 5-2.000
System 6: 0.04 3 10 Yes Yes 5 - 2,000
Sample Statement of Work (SOW) for Random Vibration
The following statement of work clause shall be utilized to specify the performance of randomvibration screening on TROSCOM equipment:
Random vibration shall be performed on all units, PIWAs, and power supplies, including spares,produced under this contract. The baseline values provided in the following table shall be used asstarting points for the development of the screen.
32

INTENSITY DURATION FREQUENCY(Grins: PER AXIS POWER RANGE
LEVEL g21Hz) AXIS (minutes) ON MONITOR (Hertz)
Assembly 6:0.04 3 10 No No 5- 2,000
Unit 6:0.04 3 10 Yes Yes 5- 2,000
System 6:0.04 3 10 Yes Yes 5- 2.000
The contractor shall conduct testing and analysis of initial units to determine the article responsecharacteristics. The above baseline values may be modified, subject to Government approval, if thevibration levels cause damage to the test article, exceed design capability or fail to precipitatedefects that surface at a later screen or infield use. The number of axis may be reduced, subject toGovernment approval, if evidence shows that vibration in fewer axes successfully screens out thesame number of defects.
The specified intensity value shall be measured on the test article after mounting on the vibrationfixture. Measured values at different points on the article shall be averaged to compare to thespecified intensity. Functional testing shall be performed immediately prior to, and immediatelyfollowing, the random vibration screen.
All the failures occurring during random vibration screening shall be analyzed for root cause,entered into the failure reporting and corrective action system, with verification that correctiveaction will preclude recurrence of thefailure mode. If size, mass or cost preclude random vibrationscreening at the unit or system level, the contractor shall recommend vibration screening at lowerlevels and/or full scale performance testing of the entire system for a failure-free period, subject toapproval by the procuring activity.
Results of vibration screening shall be included in CDRL number "ESS Performance Report"and procedures used to conduct vibration screening shall be included in CDRLnumber "ESS Procedures."
RANDOM VIBRATION CHARACTERIZATION SURVEY
After production of an initial prototype in the development phase or first article in the productionphase, a unit shall be subjected to a vibration characterization survey. MIL-STD-781D, Task 201,paragraph 201.2.2, is an appropriate task to be invoked in a contract SOW to perform a vibrationsurvey. Data item description DI-RELI-80248 provides a description of the data and structure of thereport to be submitted by the contractor.
The purpose of the survey is to determine if any resonant conditions exist within the test article ortest fixture. In addition, the survey will disclose design weaknesses that become apparent fromexposure to vibration. Early discovery and correction of these weaknesses is essential to project
33

success and incurs far less cost than later discovery. For this reason, the vibration survey should beconducted before other reliability testing is initiated.
The vibration characterization survey may be performed in parallel with, prior to, or after, thethermal survey. Corrective action resulting from discoveries made during these surveys can impactdesign and must be resolved prior to further testing to ensure valid results.
The results of the vibration survey will be used to validate the proposed baseline vibration levels orto establish alternate levels. The approved vibration intensity, frequency range, duration, and axis ofacceleration will then be incorporated into the ESS procedure for performing vibration screening.Optimum levels of these parameters will be adequate to precipitate defects, but not cause damage tothe article. The screen parameters should exceed the vibration environment expected during thearticle's life.
Vibration levels expected over an item's life cycle include those anticipated during use, storage, andtransport. Transportation often involves trucks in Army environments, and it has been shown thattruck transport induces vibration peaks at frequencies as low as 2 Hz. It is therefore important toinclude this low frequency vibration component for articles intended for truck transport.
An output of the survey is a plot showing vibration input levels compared to article response levelsover the tested frequency range. This is important because the specified vibration levels are to bemeasured on the article rather than the fixture or control commands. The measured response of thearticle can vary from the input energy.
If the article has self-contained vibration dampers or isolators, these devices should be removed toensure that vibration energy reaches internal components that may have workmanship flaws. Adiagram of the survey setup should be included, as well as a discussion of measurement accuracy.
A vibration survey should be conducted initially in the development phase to define vibration ESSlevels as early as possible. During the production phase, a first article from production should besubjected to the same vibration survey conducted during development to validate that the parts,processes, and personnel used in production have not caused a deviation from the performance ofhardware produced during development.
Approximate cost for a vibration survey of a PC board or small unit is less than $1,000. If there isinsufficient funding to perform a vibration survey during production, the validity of the developmentresults will have to be assumed. This could lead to later identification of problems caused by partsor processing changes used in production. A vibration survey provides the earliest opportunity todisclose such problems, thereby maximizing the potential for project success.
34

Sample Statement of Work (SOW) for Vibration Survey
A vibration characterization survey shall be performed in accordance with MIL-STD-781D, Task201, paragraph 201.2.2, for each level of assembly to be screened. After performance of thesurvey, a vibration survey report shall oe prepared in accordance with data item descriptionDI-RELI-80248 and delivered in accordance with the CDRL. The report shall contain the resultsfor each level of assembly subjected to screening. In addition to the requirements of DI-RELI-80248, a plot shall be included in the report showing vibration input, command levels, and testarticle response levels versus frequency.
Vibration levels for the article tested during the survey shall be the baseline levels specified forscreening.
Procedures used to conduct the vibration survey shall be included in CDRL number _ "ESS
Procedures," and shall be approved by the Government prior to use.
Review of Vibration Survey Report
This section assists the Government activity having responsibility for review and approval of thevibration survey report.
A vibration survey report provides the results of vibration tests conducted by the contractor todetermine if any resonant conditions exist within the equipment. Accelerometers are placed atvarious locations on the article being vibrated to measure the acceleration forces at specific points.Measurement data can then be analyzed to assess possible overstress of structures or components.These elements are derived from MIL-STD-781D, Task 201, paragraph 201.2.2, which isappropriate task to invoke in a contract SOW for performing a vibration survey. Additional detailsare provided by data item description DI-RELI-80248 which describes the data and report to besubmitted by the contractor.
The report should state the initial vibration intensity and frequency range, and any increased levelsthat my be applied. Any test article failures occurring during the vibration survey shall be reported,investigated, and analyzed for cause. Necessary corrective action shall be implemented and verifiedbefore further testing commences.
Equipment shall be mounted in a manner simulating actual use. Vibration in more than one axismay be required and should be accurately reported.
The following checklist is to be used by the activity responsible for approval of the vibration surveyreport. The reviewer should note in the review any discrepancies, missing information, or othershortcomings of the contractor's report. Essential comments (not suggestions) by the governmentreviewer will constitute rejection of the report and will require revision and resubmission by thecontractor.
35

Vibration Survey Report Checklist (Ref. MIL-STD-781D, Task 201, Paragraph 201.2.2, and
Data Item Description DI-RELI-80248)
" Vibration frequency spectra are stated. Revised frequency range is stated if applicable.
" Specified vibration intensity levels are stated. Revised levels are also stated in cases whereintensity levels are modified during the survey.
" Locatic~i of accelerometers is stated.
" Axis of vibration are stated and are as required by the baseline values. Changes to the baselinevalues shall have technical justification described.
" Techniques used to perform the survey and record accelerometer output are described insufficient detail.
" Fixture resonance was measured over the vibration test frequency range. Final test fixture
configuration has no resonance within the screening frequency range.
" Duration of random vibration is stated.
" Rationale is provided for selection of items monitored by sensors and for accelerometerplacement.
" Measured vibration values of the structural package and of parts and subassemblies mountedtherein are reported.
* A comparison has been made of actual vibration data within calculated or specified levels.
" Identification of the article under test, date of test, and location of test facility are provided.
" Test methods are described including a description of instrumentation used, manufacturer, modelnumber, and accuracy.
" A discussion of measurement accuracy is provided.
* Any resonant conditions exhibited in the article during vibration are identified.
" Analysis has been performed to assure that acceleration forces resulting from the identifiedresonance do not overstress any component or assembly.
" Description of failures occurring during the survey and corrective action taken to precluderecurrence.
* Failures are analyzed to determine whether cause of failure was due to defect or damage fromscreening.
" A plot is provided showing vibration input levels versus article response levels over the testedfrequency range.
36

SECTION VI. OTHER CONSIDERATIONS
This section discusses other factors to be considered when specifying ESS in production ordevelopment contracts.
POWER ON vs. POWER OFF
The question arises during ESS planning, "Should the article under test be powered and monitoredduring screening?" The answer depends on the amount of effort required to fabricate operationalinterfaces with the article.
Power On vs. Power Off-Part Level
At the part level, the fixture required to mount and test a part is relatively simple. Many companiesproduce component testing systems that will simultaneously test dozens or hundreds of a givencomponent. The mounting interfaces can be adapted to many physical configurations, and the
electrical input power and signals can be selected for a given type of component. Testing in largequantities and employing commercially available test equipment reduce the cost per part forfunctional testing.
Using such test equipment, parts can be subjected to environmental stresses while being poweredand monitored to disclose intermittent failures that only occur under stress. Examples of suchdefects include poor internal solder joints or other intermittently open connections, or a contaminantthat intermittently causes a short. Functional testing at room temperature will not expose suchintermittent defects that only occur during temperature extremes or vibration.
Compared to the cost of detecting failures at higher levels of assembly, powered and monitoredstress screening of parts is cost effective and prevents schedule slippage. For these reasons, it isrecommended that part screening include powered and monitored stress screens.
Power On vs. Power Off-Assembly Level
At the assembly level, functional test equipment usually has to be specially designed and built forthe specific assembly to be tested. Generic zest equipment for assemblies is not widely available
commercially because assemblies perform specific processes, have specific input power and signalrequirements, and produce specific outputs that are not common to other assemblies. Test
equipment must be able to generate these input power voltages and signal types, and be able torecord assembly output and response to signal variations and environmental stresses. Thecomplexity of the test equipment increases rapidly and becomes a major cost consideration. In-
37
house test engineering departments are often called upon to design and fabricate one or two test setsfor a certain assembly. The cost per article tested is, therefore, quite high due to the specialized,one-of-a kind design and fabrication effort involved in producing the test set.
The objective of powered and monitored assembly screening is to detect intermittent defects thatonly occur under certain environmental stresses. Because of the cost consideration, powered andmonitored stress screening may be postponed to the unit, or system level unless failure of theassembly is critical. ESS should still be performed on assemblies; it is simply done withoutpowering up or monitoring the assembly.
Screening assemblies without being powered or monitored will precipitate the same number ofdefects as screening with power and monitoring. Some of the defects (50%) will be caught by thepost-ESS functional test, but the rest will remain in the hardware until unit-level ESS is performedwith power on and functional monitoring, or until the failure occurs in the field. Thermal cyclingtemperature limits are wider for assemblies than for units, allowing intermittent defects that occuronly near the assembly-level temperature extremes to remain undetected. Postponing powered andmonitored ESS from the assembly level to the unit level simply postpones the detection of defectsprecipitated by the unpowered, unmonitored stress screen applied at the assembly. Onedisadvantage of this practice is that failures detected at a higher level of assembly require more timeand expense to diagnose and repair.
Power On vs. Power Off-Unit (or Higher) Level Screening
It is essential that articles undergoing unit (or higher) level ESS be powered up and monitoredduring the stress screen. These articles are at the last stage of production before being placed infield use. Undetected defects remaining after this screen will cause field failures that cost 10 to 15times more to repair than in-house failures. Customer (user) satisfaction will wane and apparentreliability will decrease as a result of field failures.
Fabrication of interface devices is less complicated at the unit level, as internal processing need notbe simulated for powering and monitoring. The performance of the unit as a whole can bemonitored with fewer discrete output and input connections than for lower-level assemblies.
Although the temperature extremes for unit-level thermal cycling are less than those for assemblies,the stress is adequate to precipitate and detect most intermittent failures remaining in assemblies thatwere not powered and monitored during the previous screens. Production processes, piece parts,electrical connections, and fasteners that are added to a unit at final assembly require unit-level ESSto stimulate part or workmanship defects introduced by these final assembly operations. Poweredand monitored stress screens at this stage are necessary to detect failures that only appear duringtemperature transition, temperature extremes, and vibration. Screening at lower levels of assemblywill help reduce defects reaching this stage, but powered and monitored unit-level ESS is essential
38

for detecting defects resulting from previous unmonitored screens and from final assemblyoperations.
PRE- AND POSTSCREEN FUNCTIONAL TESTING
Pre- and postscreen functional tests are essential to a properly conducted ESS program. Screeneffectiveness can only be determined through an evaluation of the failures precipitated by the screen.If there are defects present at the start of the screen, the apparent number of failures will be higherthan the number of defects actually precipitated by the application of environmental stress. Thiscould cause a screen to be evaluated as effective when, in actuality, the defects were present anddetectable prior to screening. Postscreen testing is also essential to detect the defects that wereprecipitated during the screen. This is especially important if the item was not powered up andmonitored during the screen.
Functional tests should be performed immediately prior to the screen and immediately after itscompletion. This will serve to eliminate concern about whether the defect was precipitated duringthe screen, or it it was introduced during cleaning or handling the item between the functional testand the application of stress. For best results, the pre- and postscreen tests should be performedwhen the item is in the test chamber and ready for screening. In addition, both functional testprocedures must be identical to assure that the defects were precipitated by the screen, rather than
being present, but undetected, prior to the screen.
Functional testing should be performed after the application of each stress, not just prior to and afterthe entire screening process. This will allow an analysis of the effectiveness of each stress and maybe used for modifying the screening program. When possible and cost effective, functional testingshould also be performed during the application of stresses. This will ensure that stress-dependentfaults such as intermittents and temperature- or timing-sensitive defects will be detected and can beremoved.
SCREENING SEQUENCE
There is some debate over the sequence in which environmental stresses should be applied tohardware. The debate, however, is not over whether screening will be effective, but which sequencewill optimize screening effectiveness. Screen effectiveness will be achieved regardless of thescreening sequence used.
Most authorities agree that thermal cycling should be performed first at the PWA (or smallestassembly level) and followed by random vibration. This screen should then be followed by thermalcycling at the next highest level of assembly. Vibration and thermal cycling both work inconjunction with each other; one stress precipitates some defects close to the point of failure and theother stress then accelerates the failure to the point of detection.
39

There are no standard screening sequence requirements that should be used for all screeningprograms. The best way to determine the optimum sequence is through experimentation withdifferent sequences, when time and money are available. If it is not possible to do this, thermalcycling should be perforimed first, followed by random vibration.
When other stresses are used for screening (i.e., overpressure, immersion, etc.), they should beperformed after thermal cycling and random vibration (if they are applied). Thermal cycling andrandom vibration will serve to initially stress the connections and interfaces that will then bescreened through applications of other stresses.
40
SECTION VII. ESS PROGRAM ELEMENTS
This section describes the essential elements of an ESS Program, and provides sample SOWs whichcan be involved in whole or in part in contracts. Data items to be delivered in conjunction with thesample SOWs are also described and checklists are provided for reviewing data deliverables.
An ESS Program is recognized by military and commercial equipment manufacturers as an effectivetool for reducing early life failures and improving field reliability. ESS results in fewer field failuresby detecting defects in parts and workmanship before the equipment leaves the factory.
The essential elements in an effective ESS Program include the following:
* Equipment and Process Characterization
" ESS Plan" ESS Procedures" ESS Performance Reports
EQUIPMENT AND PROCESS CHARACTERIZATION
The contractor must analyze the article being produced to identify its response to input stimuli.Different masses require different thermal cycling profiles to induce the same response in the article.This response is determined by a thermal characterization survey which will provide the contractorwith the knowledge required to prevent damage to the article, while maintaining an effective screen.(For discussion of the thermal survey, and the associated report, refer to page 21).
The vibration characterization survey yields knowledge about the response of an article to inputvibration stimulus. Resonances can be identified and article response can be measured to ensureadequate stimulation of hardware and avoidance of damage due to overstress. (For discussion of thevibration survey and its associated report, refer to page 33)
Production processes require analysis to determine possible failure modes that could result fromworkmanship errors, defective parts or materials, and flaws that are difficult to detect. Smallelectronic parts such as microcircuits and semiconductors can contain flaws that are impossible todetect visually, or only fail under specific stresses. Poor solder joints have typical failure modes thatcan be precipitated by certain types of stress. Sealed assemblies can be defective due tocontamination or improperly applied sealant. Knowledge of the possible flaws in manufacturingmethods and processes should be included in the determination of stress types within the ESSProgram.
The design and intended use of the article being procured should be thoroughly analyzed by the ESSstaff. Knowledge of hardware configuration is of primary importance in building an effective ESS
41

Program. Screens are not to be applied universally, without consideration of the types of parts andassemblies contained in the article. Defects in printed wiring assemblies are best detected withcertain types and magnitudes of stress. Defects in electronic Ua;ts are best detected by differentprofiles of applied stresses. Defects in mechanical assemblies can be precipitated by a variety ofstress types that must be specific to the type of device and its method of manufacture.
The intended operational environment is another factor affecting the activities of the ESS Program.Transportation profiles provide input to the necessary vibration spectra. Storage and operationaltemperatures affect thermal screening profiles. An article should not be exposed to its maximumstress for the first time when it is in the user's hands in the field. Much military hardware is critical;i.e., failure could result in personnel injury or loss of mission. For this reason, it is imperative thatmilitary hardware be as defect-free as possible. Analysis of the article's environment throughout itslife cycle can identify stress screens to precipitate failures that would otherwise occur in the field.
ESS PLAN
An ESS Plan is the first deliverable document required by the contract, and is the Government'searliest opportunity to assess a manufacturer's ability to implement an ESS Program. The ESS Planprovides the manufacturer's general outlines for the design and implementation of ESS. In general,the ESS Plan should show that the manufacturer has a basic knowledge of ESS, including the typesof stresses used, how to determine stress levels, and how to verify the effectiveness of the screens.
The areas covered by the ESS Plan will differ, depending on whether the contract is for developmentor production. The development phase ESS Plan should concentrate on the identification of stressesand assembly levels to be screened, experimentation to determine the most effective stress levelsthat will stimulate defects while not damaging good equipment, and gathering data to be used foreffectiveness evaluation and future screening requirements.
The production phase ESS Plan should contain more well-defined ESS parameters, since theexperimental work should have been done in the development phase. The production phase shouldinclude the identification of the items to be screened, the stress levels to be applied to each item, andthe exposure time or number of thermal cycles used as a baseline. The ESS Plan in the productionphase should also stress the importance of modifying the ESS Program based on screening results.Significant numbers of field failures attributable to workmanship could indicate an inadequatescreen intensity. Damage to equipment during screening could indicate excessive screen intensity.The rationale and methods for adjusting screen intensity should be provided by the Plan.
Sample Statement of Work (SOW) for ESS Plan
The following clause shall be inserted into the SOW for environmental stress screening:
42
The contractor shall prepare and submit an ESS Plan, in accordance with CDRL number
describing the approach to the implementation of an ESS Program. The plan shall address, as aminimum, the following items:
e Identification of the levels of assembly to be screenede How initial stress levels will be determined* How screen effectiveness and nondegradation of equipment will be verified* How failed equipment will be handled* Description of the data collection and analysis system to be used* Location of ESS efforts (whether in-house or contracted out)e Description of the type and amount of equipment to be used* A time and milestone schedule for getting the screening program on line.
ESS Plan Review
When the ESS Plan is submitted, it will be reviewed by the responsible Government activity forcompleteness and soundness of the technical approach. If there are questions or uncertainties aboutthe manufacturer's plan, the most appropriate time to resolve them is while the program is in theplanning phase.
Since the Plan is delivered while the details are being worked out by the manufacturer, it will onlycontain a description of the screening approach. The Plan should address all the items called out inthe SOW. A checklist to be used in reviewing the ESS Plan follows.
ESS Plan Checklist (Ref. MIL-STD-781D, Task 401 and DI-R-8XXX85)
" How assembly levels to be screened will be chosen
" Which types of stresses will be applied
" How applied stress levels will be determined
" How screens will be shown to be effective and nondamaging to good equipment
* Will the items have power applied and be monitored for intermittent defects during the screen
" When, why, and how screening will be modified
" How failed items will be rescreened
* What type of data collection and analysis system will be used
43

" What type and amount of equipment to be used
" Time and milestone schedule for implementing the screening program (delivery and installationof equipment, surveys, and effectiveness testing, training, etc.)
* How failure analysis will be conducted and the method for feedback of corrective action
" Where ESS will be performed (in-house or contracted out).
ESS PROCEDURES
The ESS Procedures are the detailed steps taken during the implementation of the ESS Program.The Procedures should contain the specific method of accomplishing each task and should includeall information necessary to perform ESS. The Procedures should cover the detailed steps ofapplying the environmental stresses, including the stress levels, applied stress profiles, and means ofmounting the item to the test equipment. The Procedures should also define data collection andanalysis, use of functional tests, and handling of defective units. Another important requirement isthat ESS Procedures address the steps to be taken to modify the screening program whenappropriate. The Procedures should also identify the analysis and results that would necessitatechanges, as well as all authorizations (including Government authorization) that must be obtainedprior to implementing the change.
The Procedures should follow the approach provided by the manufacturer in the ESS Plan. Whilebaseline stress levels are given in the Plan and the SOW, the ESS Procedures must have provisionsfor modifying those levels based on analysis or experimental results.
Procedures for performing thermal cycling, random vibration, or any other prescribed stress screenshall be written in sufficient detail for an operator to understand and perform without seeking otherguidance. In addition to procedures for performing production-type stress screens, preproductionsurveys shall be governed by appropriate ESS Procedures.
If a thermal or vibration survey is required by the contract, the steps to be used during the surveysshould be provided as ESS Procedures. Following the performance of the surveys, a revision of theESS Procedures may be required in order to use the survey results to modify the applied stresslevels.
ESS Procedures can also be used for inspecting and auditing a contractor's ESS Program. Thesegive details on who, how, when, and why each step will be accomplished and are subject toverification by outside sources at any time during contract performance.
44

Sample of Statement of Work (SOW) for ESS Procedures
The following clause shall be used in the SOW to require delivery of ESS Procedures.
The contractor shall prepare detailed ESS Procedures with associated stress levels for each item, ateach applicable assembly level, as required in the Government-approved Plan. The individual ESSProcedures and stress levels shall be submitted as required by CDRL number . The
approved approach as outlined in the ESS Plan shall be applied to develop each screen. TheProcedures shall include, as a minimum, the following items:
e Identification of each assembly to be screened.
o Detailed description of the stress types, stress levels and profiles, and amounts of exposure timefor each assembly to be screened. The description shall include the number of thermal cyclesor axis of vibration, the thermal rate of change, number of failure-free cycles, and sequence ofscreening.
o Determination of whether power will be applied during screening and, if so, identification ofthe specific parameters to be monitored.
o Use of functional tests prior to screening to verify quality of equipment and after screening toensure all defects are eliminated.
o Definition of what will be counted as a failure during screening.
e Identification of screening location.
o Description of procedure for modifying ESS Program, including justification for modificationand obtaining in-house and Government approval.
o Procedure to befollowedforfeeding back screening results into screen specifications.
o Procedure for conducting thermal survey, if applicable.
o Procedure for conducting vibration survey, if applicable.
o Procedure for performing thermal stress screening, if applicable.
* Procedureforperforming vibration screening, if applicable.
45

Review of Contractor ESS Procedures
The Government must review the contractor's ESS Procedures to ensure compliance with thecontract and the adequacy of the technical program. The Procedures contain the detailed steps to betaken in the performance, monitoring, and modification of the ESS Program. Particular attentionshould be given to the feedback of thermal and vibration surveys to the applied stress levels, and tothe necessity of iteration and modification of the Program based on screening and field performanceresults.
The following checklist may be used when reviewing the contractor's ESS Procedures. If any areasare not addressed, the contractor should be required to revise the Procedures prior to approval.
ESS Procedures Checklist
" Are the stress types to be applied to each assembly identified?
* Are all assemblies to be screened identified?
* Are the stress levels, profiles, number of cycles/axis, thermal rate of change, stress exposureduration, failure-free intervals, and test fixture mounting identified?
* Do the procedures indicate, at each assembly level, whether power will be applied?
" Are the specific functional parameters to be monitored identified?
" Is the sequence of the screening tasks identified (pre- and postscreen functional tests,environmental screens)?
" Will the screening be done in-house or at a subcontractor?
" Is a failure defined?
* Is a data collection system described?
" Is rescreening of reworked items required?
* Do procedures identify all personnel who must sign approval and authorization for screenmodification?
46

PERIODIC ESS PERFORMANCE REPORTS
At the interval prescribed in the CDRL (usually every 30 days), the contractor should report theresults of screening activities. The ESS Performance Report is a formal record of these results.DI-RELI-80249 provides a detailed description of the necessary contents of the report. when a
contract requires only one type of stress application, the Data Item Description (DID) may requiretailoring to delete the inapplicable sections.
All ESS activities should be reported, including the number and types of units tested, subassembliestested or parts tested, and all failures occurring during these tests and during the functional testsimmediately preceding and immediately following the stress screen.
Another important feature of this report is the analysis of screening results to determine screen
effectiveness. Failures occurring at assembly or unit-level screens may indicate an ineffectivescreen at the subassembly or part level. This information should lead the contractor to increase theintensity of the lower level screen to precipitate more latent defects at the lower assembly level. An
analysis of screening effectiveness is an essential tool for maintaining control of the ESS Program,and should be reported periodically by the contractor.
Approval of each monthly submittal would be a burden to the Government approval activity, so only
the first submittal requires approval. The criteria for approval includes proper organization of thereport, and verification that the elements contained in the attached checklist are addressed (whenapplicable).
Sample Statement of Work (SOW) to Prepare ESS Performance Reports
Application: Development/Production; Contract/RFP
The contractor shall prepare periodic environmental stress screening (ESS) reports in accordance
with CDRL number and DI-RELI-80249. The reports are the formal record of the
contractor's ESS results, including results of the functional tests performed prior to and after eachscreen, and shall provide feedback to adjust the stress levels such that the screen is effective inprecipitating most of the defects, but does not cause damage to the article.
Checklist for ESS Performance Report
Random Vibration
" Report period (dates of the time period covered by ESS report)
" Equipment nomenclature
47

" Equipment part number
* Subassembly part number (if ESS is performed at the subassembly level)
" Date of the vibration screen
" Serial number of the unit(s) subjected to vibration screen
" Axis of vibration
* Time at the start of vibration
* Time when vibration stopped
" Duration of the vibration screen
" Elapsed time from the start of the vibration screen to each failure (if any)
* Failed component (PWA, unit, or assembly)
" Part number or name of failed part
" Reference designation of failed part
* Description of part failure
* Cause of failure of part
" Corrective action required, taken or planned
* Analysis of results to determine screening effectiveness
" Any recommended changes to the ESS Procedures or Program
* Categorization of failure (design, parts, workmanship, etc.)
Temperature Cycling
* Report period (date(s) of the time period covered by ESS report)
* Equipment nomenclature
48

" Equipment part number
" Subassembly part number (if ESS is performed at the subassembly level)
" Date and time of temperature cycling (at the start of each cycle)
" Serial number of the unit(s) subjected to temperature cycling
* Elapsed time from start of temperature cycling to each failure (if any)
" Number of the cycle during which each failure occurred
* Indication of point in cycle when failure occurred (hot or cold)
* Failed component (PWA, unit, or subassembly)
" Part number and name of failed part
* Reference designation of failed part
* Failure mode of failed part
" Cause of failure of part
" Corrective action required, taken or planned
" Analysis of results to determine screening effectiveness
" Any recommended changes to the ESS Procedures or Program
" Categorization of failure (design, parts, workmanship, etc.)
49
Laboratory Equipment Data
The following data regarding laboratory equipment used to perform the environmental stress screenshall be included in the initial ESS report submittal. This data shall be included in a subsequentsubmittal only if any laboratory equipment is replaced prior to completion of the screening phase.
Random Vibration Equipment
" Identification by model number and manufacturer of equipment in the vibration system
" Description of mounting arrangement and accelerometer locations, if applicable
" A plot of the actual random vibration spectrum recorded during vibration and that which is usedfor control purposes, identifying frequencies, power spectral density, and degrees of freedom (oractual filter bandwidths used in the analyses of the spectrum)
" Description of procedure used to perform the vibration.
Temperature Cycling Equipment
" Identification by model number and manufacturer of the temperature chamber
o Maximum and minimum temperatures
" Maximum and minimum rate of change of temperature
" Description of procedure used to perform the temperature cycling.
Functional Test Results
The report includes results from functional tests performed immediately prior to and after subjectinga unit the the stress screen.
50

SECTION VIII. ENVIRONMENTAL TESTING LABS
Using environmental testing labs (also referred to as screening houses) can be an alternative toperforming in-house screening. The testing labs will perform all of the requirements for surveys andscreening projects. Different labs offer different sizes of screening equipment to fit different needs.Some labs screen only microelectronics, while others will screen any variety of assemblies, units, orsystems. Most, however, only perform thermal cycling and/or vibration screening. Since these twoforms of screening are usually the most beneficial and widely used, most ESS Program needs can besatisfied through the use of screening houses.
The testing labs vary in price according to the screening required. For example, power-on screeningis more expensive than power-off screening. Many labs require manuf ,cturers to supply their ownsignal generators and monitoring equipment if power-on modes are desired. Others, however, havetheir own equipment for power-on screening and have technicians who will do the monitoring.Some labs do both thermal cycling and random vibration screening while others specialize in onearea.
Screening houses can be very beneficial for the contractor who does not have the revenue to acquireall of the screening equipment he needs. However, if the screening is going to proceed over a longperiod of time and the production lot is large, purchasing the equipment and performing in-housescreening may be more cost effective.
Cost rates for testing labs are figured in many ways. Some labs charge for thermal cycling by theday and for vibration screening by the hour, while others charge according to the screeningrequirements of the item. Testing lab charges for screening are very diverse. To find out whatspecific costs will be for screening by a testing lab, contact them directly with the item specificationand SOW. They can then provide an estimate for performing the screening. This cost should becompared to the in-house screening cost development in the cost model described in Section IX todetermine the most cost-effective alternative.
51
SECTION IX. COST MODEL
This section contains mathematical cost models used to determine screening costs and effectiveness.The models indicate approximately how many units have to be in the production lot to allow ESS tobe cost effective. Also, an estimate is derived demonstrating screening cost versus field failure costto determine potential cost savings. For a more detailed analysis, a much more complex model isrequired and has already been developed; the Institute of Environmental Sciences (IES), the RomeAir Development Center (RADC), and the US Army Armaments, Munitions, and ChemicalCommand (AMCCOM) have developed stress screening cost analysis models for various levels ofassembly. Many more parameters, however, are needed for these analyses. This model is intendedto be as simple as possible. The model has been adapted to the LOTUS software package to assistin calculating the screening and field failure costs. The disk with the LOTUS cost model can beobtained by contacting:
CommanderBelvoir RD&E CenterATTIN: STRBE-TQEFort Belvoir, VA 22060-5606
Commercial: 703/664-5771AUTOVON: 354-5771E-mail: STRBE-TQE @
Belvoir-EMH3.ARMY.MIL
The user is encouraged to utilize the other alternative cost models if enough resources are available,and if incorporation of more parameters is desired. If these other models are not satisfactory to theuser, adapting the cost model is encouraged.
COST MODEL STRUCTURE
The cost model is composed of three sections:
o Stress Screening Cost Modelo Field Failure Cost Modelo Cost-Effectiveness Comparison
Each model progresses from a top tier equation presenting basic cost elements to a second tier thatdefines the major sub-elements. Next, a third level is provided that consists of a checklist anddefinitions of parameters used when estimating each sub-element cost.
To assist in using the cost model, flow diagrams in Figures 8 through 14 lead the user through themodel.
53

TOP LEVEL MODEL IS:SCST I C -CS -SC, + PC
SC5T -SCREENING COSTISUBTOTAU
EC -EQUIPMENT COSTCS -COST OF SURVEYSCI COST OF SCREENING
ITEMS PROCESSPC -FAILURE COST
WANT YES 00G TO FIGURE I
TO ESTIMATE EQUIPMENT COST A TO FIGURE 9
EC? PLOW DIAGRAM
NoEC COSTS
0 FROM FIGURE~ 1
WES AN MORE O IUR
SCNoN TECOSTSTOO SEUR CON
WATIDEREDoFIUR i
CALCUL ATE TAL SCREENING CS OFGR
COSTIClO L SCREENST
PAG
FR M FI UE1
FIWRENUME YES GO TO FIGURE 12
O ESIMARTOIL FAILURE CT a T IUE1
NO ____ ____ ____Hj FROM FIGURE 12
FigureBL 8, Top Leve Cos Mode
COST4

EQUIPMENMT COST MODEL IS:Ic *SCC + CM + SC5s + [CpC + SC0
EC -TOTAL EQUIPMENT COSTCCHCIAMBER EQUIPMENT COST
%Cj MONITOR COSTES SUPPORT EQUIPMENT COSTECF - FIXTURE COSTECpC - FACILITIES COST
E - OTHER EQUIPMENT COST
PPCLE CC. C.S 5 ?
SCPC b C0 COT
TESIMT IUR
Fiue9.CupmnMs lw iga
SE55GE6

c FROM FIGURE I
SURVEYING COST MODEL IS:-S . L + S
CS - SURVEYING COST FOR SAMPLE UNITS
Figur 10 Survey C tOloSDaga
CSA-ADMIISTRTIVEC56

E FROM FIGURE I
UNIT SCREENING COST MODEL IS:Set - SCO+SCA3
SCI- SCREENING COST FOR UNITS
Figur LAB. Itm SrennOosSTw iga
*CA-ADMIISTRTIVECOS7

F ROM FIGURE S
FAILURE COST MOCEL IS:PC - PCA + PCR + p.
PC - FAILURE COSTCA- FAILURE ANALYSIS COST
PCR - REPAIR COSTPCRS RESCREENING COST
Figur 12Y alreCESlo iga
ESTIMAE F58

F5-RETRN ON FIEL OSTg 9- FAILURE AYI COST
F7 -DCUMENATGORIOST
THE FIELD FAILURE COST/RFAILED ITEMIS
F = COTM IN PRCURAIEDEM LOSPTOEOD2 . CDEOT PLAERFE ITEM I IL
Fiur -3 CostT EffectivenessIATO FlwOiarT
F, - EPAI PART CO9

FROM FIGURE 13
IS CIF > SC T YSISCST EFFECTIVE
ISLO NOTU
COSTOEEFETV
WATOFUR
ige1.Cs&fetieesFoDiga
ARIABL6O

STRESS SCREENING COST MODEL
Top Tier Equations for Screening
The top tier screening cost model consists of the basic statement:
SCST = EC + SCI + CS + FC [Equation 11
where:
SCST = Screening cost (subtotal)EC = Equipment cost
SCI = Cost of item screening processCS = Cost of surveyFC = Failure cost of defects found during screening
This equation is used to determine the total cost of a given screen.
The model can be easily used when performing more than one type of screening; for example,thermal cycling and random vibration. Simply follow the flow diagram for each screen and add thetotals to calculate the sum of both screens (SCT). Be aware that the more screens you use, the morecostly the project will be. One screen is the minimum that can be done, and is the least expensive;however, two screens are usually better. For example, vibration screening implemented withthermal cycling may not be much more expensive than thermal cycling alone, since vibrationcycling does not require an extensive amount of time to conduct.
When two or more screens are applied, the following equation should be used:
SCT = SCST + SCST + ........ + SCST [Equation 2]1 2 N
where:
SCT = Total screening cost of all screens
SCsT = Screening cost (subtotal of first screen)SCsT2 ,
SCST = Screening cost (subtotal of second screen)
SCST N= Screening cost (subtotal of nth screen)
N = Number of screens
61
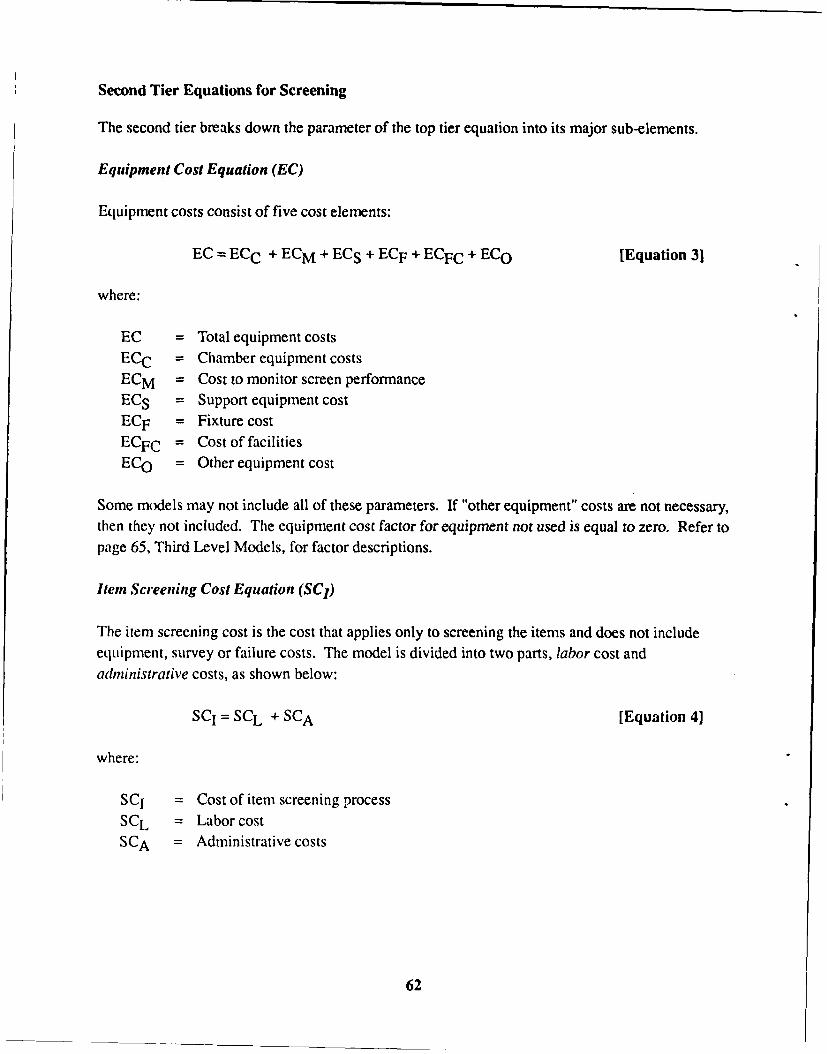
Second Tier Equations for Screening
The second tier breaks down the parameter of the top tier equation into its major sub-elements.
Equipment Cost Equation (EC)
Equipment costs consist of five cost elements:
EC = ECC + ECM + EC S + ECF + ECFC + ECO [Equation 31
where:
EC = Total equipment costsECC = Chamber equipment costsECM = Cost to monitor screen performanceECS = Support equipment costECF = Fixture costECFC = Cost of facilitiesEC O = Other equipment cost
Some models may not include all of these parameters. If "other equipment" costs are not necessary,then they not included. The equipment cost factor for equipment not used is equal to zero. Refer topage 65, Third Level Models, for factor descriptions.
Item Screening Cost Equation (SCI)
The item screening cost is the cost that applies only to screening the items and does not includeequipment, survey or failure costs. The model is divided into two parts, labor cost andadministrative costs, as shown below:
SCI=SCL +SCA [Equation 4]
where:
SCI = Cost of item screening processSCL = Labor costSCA = Administrative costs
62

Labor Cost (SCL) Equation. Screening is usually performed in sets. For example, a chamber mayhold a set of 10 items at a time. A larger chamber may hold a set of 15 or more depending on thesize of the items. Labor time is based on how long it takes a technician to perform the screening ofone set. The labor cost, then is defined as follows:
SCL = [ (H + MI- + UH + F1 I) LR 1I [Equation 51IPS
where:
SCL = Labor costsLH = Number of hours to load one set into the fixtureMH = Number of hours to monitor chamber while screening one setUH = Number of hours to unload one set from the fixtureFH = Number of hours to run a postfunctional test on a setIPS = Number of items per setLR = Labor rate of a technician ($/hour)I = Number of items in procurement lot
Administrative Cost (SCA) Equation. Administrative costs are calculated as follows:
SCA = AC (I) [Equation 6]
where:
SCA = Total administrative costsAC = Administrative costs associated with screening one itemI = Number of items in procurement lot
Refer to page 68 for further explanation of item screening cost factors.
Survey Cost (SC) Equation
Survey costs are generally cheaper than total screening costs for a lot. The survey usually takes onlya few hours (2-3). Therefore, the same costs to screen the items apply to the survey costs. The onlydifference will be in the number of hours the survey takes, and the number of items in the survey(see page 68). Studies have shown that a vibration survey takes approximately 5 hours and athermal survey can take at least 24 hours.
63

Failure Cost (FC) Equation
The failure cost model relates to the costs associated with defects found during screening. Thefailure cost model consists of the following parameters:
FC = FCA + FCR + FCRS [Equation 71
where:
FC = Failure costsFCA = Failure analysis costsFCR = Repair costsFCRS = Rescreening costs
Failure Analysis Cost (FCA) Equation. The failure analysis cost is calculated as follows:
FCA = A (P) (D) (I) (UD) [Equation 81
where:
FCA = Cost for failure analysis of production lotA = Cost for one full failure analysis for an unknown defectP = Percentage of defects found needing a full analysis to find the cause of failure
(decimal)D = Number of defects per itemI = Number of items in procurement lot
UD = Percent of defects uncovered by this screen (decimal)
Repair Cost (FCR) Equation. The repair cost is found as follows:
FCR = [PC + ((LR) (HTR)) ] (D) (I) (UD) [Equation 9]
where:
FCR = Cost to repair all defective itemsPC = Cost of parts to repair a defective itemLR = Labor rate of a repair technician ($/hour)HTR = Number of hours to repair one defective item (decimal hours)D = Number of defects per itemI = Number of items in procurement lot
UD = Percent of defects uncovered by this screen
64

Rescreening Cost (FCRS) Equation. Rescreening costs involve the same costs as the initial
screening costs. Rescreening is performed in sets, with the same number of items as initialscreening. The only difference is that they may be screened for a lesser number of cycles, hence ashorter time period. The cost involves the following:
FCRS = I (LH + MHR + UH + FH) LR + AC] (D) (I) (UD) [Equation 101
UPSwhere:
FCRS Cost of rescreening ali failed itemsLH = Number of hours to load one set into the fixture
MHR = Number of hours to monitor chamber while screening one repaired setUH = Number of hours unload one set from the fixtureFH = Number of hours to run a postfunctional test on the rescreened itemsUPS = Number of items per one setLR = Labor rate of a technician ($/hour)AC = Administrative costs associated with screening one defective itemD = Number of defects per itemI = Number of items in procurement lotUD = Percent of defects uncovered by this screen
Refer to page 69 for Failure Cost Parameter Descriptions.
Third Tier-Parameter Descriptions for Screening Costs
The third tier parameter definitions consist of a series of descriptions to assist the user in accountingfor the full range of screening cost factors.
Equipment Cost Parameter Descriptions
A tabulation of ESS equipment price ranges is contained in Table 6. This table provides nominalvalues of current industrial equipment costs.
ECC (chamber equipment cost). Examples of chamber equipment are temperature chambers,vibration shaker tables, immersion tanks, etc. Factors considered when choosing the number andsizes of the chamber(s) are:
" Number of items in production lot
" Size of items" Production rate
The set can include as many items as you like, however, the bigger the chamber, the more expensive
the cost of the chamber. Purchasing more than one chamber should be considered with large
65

procurements. This cuts down on total screening time and reduces the facility and labor costs, butincreases the equipment cost.
ECM (monitor costs). Monitoring equipment is used to monitor the chamber(s) during operation.This allows technicians to check the operation of the chamber and items. If monitoring equipmenthas the capacity to document item output, then labor costs are reduced in terms of actual man-hours.Types of monitors are magnetic tape recorders, oscillographic recorders, computer printout, and stripchart recorders.
ECS (support equipment costs). Support equipment costs include all those extras needed to run thechamber(s) and monitor(s). Examples are:
" Interface connectors" Cables" Random controller for a vPbration table (see Table 6 for prices).
ECF (fixture costs). These are the costs of the fixture(s) required to hold the items in place duringscreening. One fixture can usually be used for both a thermal chamber and a vibration table.
Table 6. ESS Equipment Price Ranges
EQUIPMENT DESCRIPTION SIZE PRICE RANGE
Agree Chamber * Thermal Screening Chamber compatible 32cf $40,000-50,000with vibration testing equipment forcombined environment testing 100cf $55,000-60,000
* Temperature rate of change:100C to 20°C/minute
9 Temperature range: -730C to +177 0C
Temperature/ * Temperature range: -680C to 177°C 32cf $50,000-60,000Humidity Chamber
e Humidity range: 20% RH to 95% RH 100cf $65,000-75000
Flexisystem * Thermal Chamber adaptable for batch load, 32cf:Chamber fixtured cart, or total automation -650C to +125 0C $200,000-250,000
-400C to +1250C $190,000-195,000* Fixtured system
* Temperature rate of change: 642cf:120C to 120 0C/minute -650C to +125 0C $300,000-325,000
-40°C to +125 0C $260,000-290.000
Thermal e Chamber for small lots 24cf:Chamber * Fixtured system -650C to +I 250C $130,000-140,000
-400C to +125 0C $150,000-160,000
66

Table 6. ESS Equipment Price Ranges (continued)
Agrce Compatible * Two small vibration shaker tables and 6 Grins $10,000-12,000Vibration Equipment complete control ter to screen one 3 lb PWA
o Vibration shaker table with amplifier 500 force-lb random $20,00()-25,(X)
600 force-lb sine
* Vibration shaker table 6,000 force-lb $50,000-60,000
Vibration Equipment o Shaker with air-cooled amplifier and 9,000 lb rms random $55,000-60,0002,500 lb load capacity
* Shaker with water-cooled amplifier and 9,000 lb rms random $80,000-90,00010,000 lb load capacity
Random Controller o Needed to change sine wave into $25,000-30,000random wave
o Allows frequency range to go down to0.5Hz
Vibration Monitor o Allows acceleration and displacement to be $3,000-4,000Limiter monitored and limited either together or
independently
Oscilloscope o Monitoring equipment $1,500-7,000
Strip Chart o Two channel $2,000-8,000Recorder o Four channel
o Six channelo Eight channel
Fixtures o Holds item(s) in place for vibration and/or Holds six PWAs $600-800thermal cycling. One fixture can be usedfor both. (This price includes one fixtureto hold six PWAs on vibration shaker andin a thermal chamber.)
ECFC (cost offacilities). This is the cost of any new facilities required to perform the screening.Examples would be buildings, air conditioners, and rooms. Such items are included in the total ifthe purchase is specifically done for this screening. If the facility is shared with other activities orwill be put to other uses after completion of the program, a percentage of the facility cost could beused. Other costs that can be included in the facilities cost are:
" Procurement" Installation" Operation" Utilities" Repair and upkeep.
67

EC0 (other equipment costs). These costs are used to include other equipment parameters besidesthe ones listed for this model. Many times, this parameter will be zero.
Item Screening Cost Parameter Descriptions
L11 (number of hours to load one set into the fixture). Depending on the size of the chamber, thenumber of items in a set will vary. A large chamber will hold a larger set than a smaller chamber. Itmay, however, take a little longer to load and unload a larger set. Approximately 10 PCBs can beloaded in half an hour.
MH (number of hours to monitor the chamber while screening a set). This parameter accounts forthe manual labor needed to monitor the screen. Increasing the use of automated monitoringequipment will decrease this cost. For example, if a printout is produced in the monitoring of avibration table, the technician's monitoring hours are limited to reading the printout at the end of thescreen. The same would be true for a thermal chamber monitoring system. When thermal cyclingwould take many hours to conduct, a monitor would become very cost-effective. If automatedmonitoring equipment is not used, the technician has to monitor the chamber constantly. This takesmore time, and incurs more direct labor costs to the project. With large procurements, monitoringequipment may be less expensive than paying a technician to visually monitor the screen. Usingmonitoring equipment, approximately half an hour is needed to monitor the screening of a set of10 PCBs.
UH (number of hours to unload one set from the fixture). This parameter follows the ideasexpressed in LH-the number of hours to unload one set from the fixture.
F1 (number of hours to run a postfunctional test). This test is done to ensure that the item isfunctioning properly after screening, or if it is not functioning properly, to validate a defect found inmonitoring.
IPS (items per set). This parameter defines how many items can fit into a chamber at once: a set.
LR (labor rate). This parameter, the cost per hour, defines the current average rates for screeningtechnicians. This rate varies depending on location. A labor rate guide for the specific area shouldbe consulted.
I (number of items in a procurement lot). This parameter defines the total number of items in theprocurement lot to be screened over the life of the contract.
68

AC (administrative cost associated with one item). This parameter defines the screeningdocumentation cost. The requirement usually exists to document the techniques used to performscreening and the results of the screening. Administrative costs include:
* Monthly ESS report" Screening plans and procedures" Data documentation such as paper tapes and computer printouts
These costs should be combined and divided by the number of items being produced.
Survey Cost Parameter Descriptions
See parameter discussion on page 68.
Failure Cost Parameter Descriptions
A (cost of one full failure analysis of an unknown defect). Many times, a defect's cause can bedetermined by either visual inspection or testing. This parameter details the cost of analysis to findthe root cause of the failure for a defect whose cause is unknown.
P (percentage of defects found that need afull analysis tofind the cause offailure). This value, indecimal form, determines an average failure analysis cost per each defect. As stated in theexplanation of A (cost of one full failure analysis of an unknown defect), not all defects need a fullfailure analysis. P is the percentage of defects that do need a full failure analysis. This value willprobably be around 0.20 or 0.30, but is certainly not restricted to that.
D (number of defects per item). This value represents the number of inherent part defects per item.It is based on the incoming defect estimation desc-ibed on page 70.
PC (cost of parts to repair a defective item). This cost represents the material costs associated withthe replacement of failed parts. The advantages of screening at lower levels of assembly werediscussed on page 2.
LR (labor rate of a repair technician in $/hour). See page 68.
HTR (number of hours to repair one defective item). This decimal value gives the average time for a
qualified repair technician to repair an item.
L1 (number of hours to load one set into the fixture for rescreening). See page 68.
69

MHR (number of hours to monitor chamber while rescreening one repaired set). See page 68.(Note: Manual monitoring may take less time for rescreening since the number of cycles that therepaired item is subjected to will most likely be less.)
Ul (number of hours to unload one set). See page 68.
FH (number of hours to run a postfunctional test). See page 68. (Note: This cost model assumesthat once a defect is repaired, the amount of items that do not pass the second postfunctional test isnegligible.
UPS (units per set). See page 68.
AC (administrative costs). See page 68.
Incoming Defect Estimation
The objective of this section is to estimate the incoming defects that are introduced into the itemduring its manufacture. This estimate will serve as the basis for determining if stress screening is
cost effective.
The incoming defect estimation procedure, adapted from RADC-TR-87, "Guide to EnvironmentalStress Screening," uses a three-level equipment breakdown structure. The example given here usesthe system, unit, and assembly levels for the breakdown. In most cases, the breakdown is limited tothree levels of assembly. It can be adapted to cover more than the three levels if needed; theworksheets just require expansion. All three levels are not needed in some cases. If only a unit is tobe screened, only the unit breakdown chart in Figure 15 and worksheet 16 in Figure 16 need to beused.
System Breakdown
The system to be stress screened will be broken down into system (Figure 17) and unit (Figure 15)levels. Figure 17 shows the system breakLown; in this case, into three units. The total number ofdefects in the system is determined by summing the defects estimates from each unit.
Unit Defect Estimates
For each unit identified in the System Breakdown Chart, a unit breakdown chart (Figure 15) isprepared showing the unit broken down into its assemblies. A defect estimation worksheet (Figure
16) is then completed for each assembly listed under the unit. The value for the total number ofdefects in each assembly is then listed in the appropriate space provided on the unit breakdown chart(Figure 15). The total number of defects in one unit is found by summing all of the assembly defectestimates. The unit total is then placed in the space provided for that unit in the system breakdownchart (Figure 17).
70

SIM161NAVIGATIONUNI'T
NUMBER OF
DEFECTS
PRINTrED POWER
WIRING SUPPLY
MuA S E M B E S U A N T IY ,, A S S E M B E S A S E M B E S
PERUNIT
9 W Q1 4 2 9 M8 1 O T 2 I L N S -S -O V 20 2m m
Figure 15. Unit Breakdown Chart
71

DEFECT ESTIMATION WORKSHEET
Program/Project System Nomenclature Envir.
Unit Assembly Prepared by Date
Quality Fraction EstimatedPart Type Level Quantity Defective Defects*
Microelectronic
Transistors
Diodes
Resistors
Capacitors
Inductive Devices
Rotating Devices
Relays
Switches
Connectors
Printed Wiring Boards
Connections, Hand Solder
Connections, Crimp
Connections, Weld
Connections, Solderless Wrap
Connections, Wrapped and Soldered
Connections, Clip Termination
Connections, Reflow Solder
Total No. of Defects
Figure 16. Worksheet for Estimating Number of Defects
72

PART NUMBER - 9668CM
PROCESSINGSYSTEM
NUMBER OFDEFECTS
QUANTITY 9668110 1 geaso
968161 1 ,4 PERNAVIGATION SYSTEM SIGNAL RECEIVER
PROCESSOR UIUNIT UNIT UNIT
Figure 17. System Breakdown Chart
Assembly Defect Estimation
Each of the assemblies shown in the unit breakdown chart requires a worksheet, shown in Figure 16,
to be completed as follows:
Part Type. Part types shown on the worksheet are the standard types included in MIL-HDBK-217E.Miscellaneous part types can be added as appropriate.
Quality Level. Enter the appiupriate quality level as identified in Table 7. If quality levels are not
specified, use the lowest quality level as a conservative estimate.
Quantity. Enter the quantity of each part type.
Fraction Defective. Determine the fraction defective for each part type using environmental factors
and quality levels in Appendix A. Enter this number on the worksheet.
Estimated Defects. Determine the estimated number of defects by multiplying the quantity by thefraction defective and enter on the worksheet. Keep in mind that this number is defects per million
parts.
73
Totals. Enter the total estimated number of defects on the worksheet and enter in the correspondingspace of the unit breakdown chart. Again, keep in mind that this value is defects per million parts.
Table 7. Quality Levels for Various Part Types
PART TYPE QUALITY LEVELS
Microelectronic Devices S, B, B-0, B-l, B-2, C, C-i, D, D- 1Transistors JANTXV, JANTX, JAN, LOWER, PLASTICDiodes JANS, JANTXV, JANTX, JAN, LOWER, PLASTICResistors S, R, P, M, MIL-SPEC, LOWERCapacitors S, R, P, M, L, MIL-SPEC, LOWERTransformers MIL-SPEC, LOWERCoils S, R, P, M, MIL-SPEC, LOWERRelays MIL-SPEC, LOWERSwitches MIL-SPEC, LOWERConnectors MIL-SPEC, LOWERPrinted Wiring Boards MIL-SPEC, LOWER
Example
The following example demonstrates an incoming defect estimation. The example illustrates acommul ications system that is to be stress screened. The system is comprised of nine units, asshown ifi Figure 18. Each unit is then further broken down into assembly levels as shown in Figure19. Only the processor unit breakdown is illustrated in this example. The printed wiring assemblies(PWAs) contained in this unit are shown in Table 8. Figure 20 shows the defect estimation for oneof the assemblies in Table 8, the Interface Assy-1, part number 9664074. A Defect EstimationWorksheet is needed for each assembly in the communication system. (If only this assembly is to be
screened, this defect estimation worksheet is all that is needed).
Once all of the Defect Estimation Worksheets are completed, assembly totals are entered on the UnitBreakdown Chart (Figure 19) and unit totals are entered onto the System Breakdown Chart(Figure 18). In this example, it is estimated that each system produced will have approximately1.414 defects. The total shown in Figure 18 is defects per million parts. If the processor unit isscreened alone, the defect estimate would be 0.769 defects per processor unit. The number ofdefects ;)er system is used to arrive at the estimated number of field failures. The number of fieldfailures is multiplied by the average cost of failure (see page 78) to get the total cost of all fieldfailures. This cost is then compared to the total screening costs to determine cost-effectiveness of
ESS.
74

96600
COMMUNICATIONSSYSTEM
1.413,330.9
9664009 9663006 966313
PROCESSOR CONTROL RF AMPLIFIERUNIT UNIT UNIT
769,173.5 71,154.7 21,983.0
9647002 9663026 9511880
HP AMPLIFIER ANTENNA SECUREUNIT UNIT UNIT
156,366.8 86,142.3 8998.6
9641004 9663040 9663014
HPA LP AMPLIFIER RF COMBINERPOWER SUPPLY UNIT UNIT
64,545.4 225,380.5 11,197.1
Figure 18. System Breakdown Chart for a Communications System
9664009
PROCESSORUNIT
769,173.5
9664002 9603(E ITENLSR ODULATOR _PROCESSORENCOSREASS'Y PWA'S
CONVERTER AMPLIFIER com-ASSY AsS PWA'S
40,405.4178857,3.
WW= 660069292
DETECTOR INTERFACE MEMORYASS'Y ASS'Y ASS"Y
40,3 6.6 6M.0
Figure 19. Processor Unit Breakdown to the Assembly Level
75

Table 8. List of Processor Unit PWAs
ESTIMATED
QTY PART NUMBER NOMENCLATURE DEFECTS*
1 9664060 Sequencer Assembly 13,771.8
1 9664061 Timing Assembly-1 21,256.2
1 9664062 Timing Assembly-2 19,829.0
1 9664063 Event Sequencer Assembly 13,864.4
1 9664064 Timing Control Assembly 12,990.2
1 9664065 Interleave Assembly 22,791.6
1 9664066 Interleave Timing Assembly 11,446.8
1 9664067 Delay Assembly-A 26,098.2
1 9664068 Demodulator Assembly 60,096.5
1 9664069 Tracker Assembly 5,328.6
1 9664070 Delay Assembly-B 20,811.0
1 9664071 Input Buffer Assembly 25,174.6
1 9664072 Output Buffer Assembly 17,298.8
1 9664073 Formatter Assembly 21,785.9
1 9664074 Interface Assembly-1 6,160.9
1 9664075 Clock Control Assembly 20,371.8
4 9664076 Correlator Assembly 50.998.4
1 9664077 Arithmeic/Memory Assembly 14,083.4
1 9664078 Address Select Assembly 25,234.4
1 9664079 Interface Assembly-2 4,395.4
1 9664080 Timing Assembly-3 2,117.0
1 9664081 Detector Assembly 33,008.3
1 9664082 Frequency Selector Assembly 5,083.2
1 9664083 Interface Assembly-3 16,379.1
1 9664084 Fault Isolation Assembly 13,842.4
1 9664085 Frequency Control Assembly 5,327.2
1 9664086 Timing Assembly-4 20,921.0
1 9664087 Quantizer Assembly 24,216.6
1 9664088 Arithmetic Assembly 2,662.8
Total Defects 537,786.1
*per 106
76

DEFECT ESTIMATION WORKSHEET
Program/Project System Nomenclature Envir
Communications Distribution (ommunicalions SNc(ern 9664(0)8 AllProgram
Unit Assembly Prepared by Date
Processor Unit Interface Ass?-1 A.E. Saari 3/211859664009 9664074
Quality Fraction EstimatedPart Type Level Quantity Defective Defects*
Microelectronic B-0 49 87.0 4263,0
Transistors
Diodes JANTX 1 46.9 46,9
Resistors ER- _ 18 23.8 428.4
Capacitors ER-_ 1 !115.3 115.3
Inductive Devices
Rotating Devices
Relays
Switches
Connectors _I/S I 168.0 168.0
Printed Wiring Boards NI/S I 1139.3 1139.3
Connections, Hand Solder
Connections, Crimp
Connections, Weld
Connections, Solderless Wrap
Connections, Wrapped and Soldered
Connections. Clip Termination
Connections, Reflow Solder
*per 106 Total No. of Defects 6160.9
Figure 20. Completed Worksheet for a Sample Assembly
77

FIELD FAILURE COST MODEL
The field failure costs detail the cost of a failed item as it experiences on of three conditions. Thismodel covers three conditions that deal with an item when it fails:
No Failure. In some cases, an item is labeled "failed," even though it has not. Operator error is thebiggest cause of this category. This occurs approximately 20 percent of the time. In this case, the"percent approximate (PA)" would be 0.20.
Discard. This category applies when the failed item is beyond repair. When an item is destroyed, itis beyond repair. This value is typically 0.20.
Repairable. This category applies when the failed item is repairable. The PA for this category willhave the highest percent in most cases, usually 0.60.
Top Tier Field Failure Cost Equation
To find the weighted average based on the costs and the percentages of the three categoriespreviously described, the following equation is used to average field failure cost per failed item:
FFCT = (PA1 ) (FFC 1) + (PA2) (FFC 2 ) + (PA3 ) (FFC3) [Equation 111
where:
FFCT = Average field failure cost per failed itemFFC1 = Field failure cost per failed item for "no failure"FFC2 = Field failure cost per failed item for "discard"FFC 3 = Field failure cost per failed item for "repairable"PA 1 = Approximate percentage of "no failures"PA2 = Approximate percentage of "discards"PA3 = Approximate percentage of "repairables"
78

Second Tier Field Failure Cost Model
The following equation can be used to calculate each of the three field failure categories. Some ofthe parameters will not be used for some of the conditions. The third tier cost section belowexplains this in more detail.
FFC = F1 +F 2 + F3 +F 4 +F 5 +F 6 +F 7 +F 8 [Equation 12]
where:
FFC = Field failure cost per failed item for each conditionF1 = Cost to pack failed item and ship to depotF2 = Cost of temporary replacement in fieldF3 = Fault isolation/verification costsF4 = Repair parts costsF5 = Return to field costsF6 = Failure analysis costsF7 = Documentation costsF 8 = Other costs
Note: For total cost in field, use the following equation:
CIF = FFCT x I x D [Equation 13]where:
CIF = Cost in field (total for all defects)I = Number of items in procurement lotD = Number of defects estimated per itemFFCT = Average field failure cost per item
Third Tier Failure Cost Parameter Descriptions
F1 (cost to pack failed item and ship to depot). This cost will involve the following:
e Packing cost* Shipping and handling charges.
In the case of the "discard" item, this cost may or may not be zero. If failure analysis is desired, theitem will have to be shipped back.
79

F2 (cost of temporary replacement infield). This cost will be the same for all three cases (or
conditions) suggested for the field failure costs. In most cases, you will always have to replace the
item in the field whether you are waiting for the failed item to be repaired or waiting for a new item
to be shipped to you. The only time this cost will be zero is when necessity of the item is not
critical, and does not need an immediate replacement. When a replacement is needed, the cost will
be prorated based on usage of the item. For example, if the life of a $2,000 item is 10 years (120
months), and you only use it for 6 months before you receive the repaired item, the cost of the
replacement is calculated as follows:
Cost = usage time (in months) x cost of itemlife of item (in months)
Cs= 6 monthsCost = months x $2,000 = $100120 months
The cost for the example is, therefore, $100.
F3 (fault isolation/verification costs). This cost involves the following:
" Labor to test the item to validate a failure" Labor to repair the item.
If the item is discarded, this cost is zero.
F4 (repair parts costs). This value will be much greater than the parts cost value of parameter PC
on page 69, unless "no failure" of the item was found. If no failure was found, this cost will be zero.
If the failed item is "discarded," the cost for this parameter is the cost for a new item. If the item is"repairable," this value is the cost for whatever needs to be repaired or replaced on the item.
F5 (return tofield costs). This cost parameter follows parameter F1 . In most cases, this cost will be
the same. In the case of the "discarded" item, this cost covers the shipment of the new replacement
item to the field.
F6 (failure analysis costs). This cost will be zero for the cases of "no failure" and the "discard"
item. For the item th:at is "repairable," this cost will follow the basis of FCA described on page 64.
the number of defects found in each failed item will be equal to one. Keep in mind that not all failed
items will be subjected to a failure analysis.
F7 (documentation costs). This cost includes everything mentioned for cost parameter AC on
page 68; however, cost parameter AC is onl, for documentation at one place. For any of the
80

categories, the failed item will have to be documented in the field, at the depot, for shipping andhandling, and again when it or its replacement is back in the field. This cost will be more than theadministrative costs described on page 68.
F8 (other costs). This cost covers any other costs that need to be accounted for, but were notmentioned by any of the seven parameters listed previously.
PA (percent approximate). This parameter describes the percent of time that one of the conditionsoccurs. See page 78.
D (defects per item). See page 69.
COMPARISON FOR COST EFFECTIVENESS
To determine cost effectiveness based on parts defects alone, simply compare the total costs foundfor stress screening and field failures. If the cost to run all screens (SCT from equation 2) is lessthan the cost to repair all defects once they are in the field (CIF from equation 13), then costeffectiveness has been achieved. Even if the numbers are very close in value, ESS is advised. Theestimates developed for field failure costs are conservative since they do not take into account thedefects introduced by assembly and workmanship errors. ESS will also be justified by consideringother benefits, such as earlier defect identification and corrective action.
LOTUS COST MODEL
The cost model has been adapted to the LOTUS software package. The disk can be obtained bycontacting:
CommanderBelvoir RD&E CenterATI'N: STRBE-TQEFort Belvoir, VA 22060-5606
Commercial: 703/664-5771AUTOVON: 354-5771E-mail: STRBE-TQE @
Belvoir-EMH3.ARMY.MIL
The program is designed to assist the user in calculating the screening and field failure costs, andcomparing them. Some knowledge of the LOTUS software is needed to begin the computer costmodel. A default cost model can be seen in Appendix C. This model will always be kept a filename "DEFAULT." The following steps will help you accurately use the LOTUS cost model.
81
1. Boot up LOTUS 1-2-3.
2. Place your cost model disk into the data disk drive when prompted. Follow LOTUS directions.
3. To retrieve the default cost model, type /FR. There will be three files listed to chose from:
DEFAULT, ESS 1, and ESS2. Choose DEFAULT. When saving your modified cost model,name it ESS1 or ESS2. Never save a changed cost model under DEFAULT. This should always
be the original.
4. You will now see the beginning of the cost model. There is a special menu at the top of the
screen. It allows you to do the following:
" Retrieve another cost model.
" Save the cost model and the chart currently on the screen as ESS 1 or ES S2.
" Print the current cost model (CPRINT)." Print the current cost chart (CCHART)." View the cost chart associated with the customized cost model (VIEW).
" View and save the current graph associated with model filed as ESSI (IGRAPH). The graphwill show the crossover point at the number of defects needed for the given lot size where
the stress screen becomes cost effective.
" View and save the current graph associated with model filed as ESS2 (2GRAPH)
" Quit and go to ready mode.
Select "QUIT" to enter the ready mode where you can now move around the screen using the arrowkeys. Ready mode also allows you to change the default values within the brackets to fit the cost
model. Remember, all responses in the brackets of the default model are default values. Change
them to fit your screens. The default cost model displays costs associated with screening printedwiring assemblies within a unit valued at $800 with a 10-year life, an 8-month replacement period,
and a median defect estimate of 0.7. In this example, the units are screened using thermal cyclingand random vibration. Your screens and values may be different. All parameter considerations
can be found in the third tier cost parameter description (pages 65 and 79).
5. To print either of the stored graphs, you will have to exit LOTUS 1-2-3, and use the LOTUSPrintgraph system. Graphs will already have been saved under IGRAPH and 2GRAPH. Graphs
are saved each time you view zhem in LOTUS 1-2-3.
82

APPENDIX AFRACTION DEFECTIVE TABLES
AIC Airborne Inhabited Cargo
AIT Airborne Inhabited Trainer
AIB Airborne Inhabited Bomber
AIA Airborne Inhabited Attack
AIF Airborne Inhabited Fighter
AUC Airborne Uninhabited Cargo
AUT Airborne Uninhabited Trainer
AUB Airborne Uninhabited Bomber
AUA Airborne Uninhabited Attack
AUF Airborne Uninhabited Fighter
ARW Airborne Rotary Wing
CL Cannon Launch
GB Ground Benign
GF Ground Fixed
GM Ground Mobile
ML Missile Launch
MFF Missile Free Flight
MFA Airbreathing Missile Flight
MP ManpackNS Naval Sheltered
NU Naval Unsheltered
NUU Naval Undersea Unsheltered
NSB Naval Submarine
NH Naval Hydrofoil
SF Space Flight
USL Undersea Launch
A-I

CA -(N " M- m ci mi C4
00 r.
*q c!. 'IN\c oo \ 0 !o m V :C
C4) 00I ON 00 -c
-1 qC--
o> \0 C\.-
C, *q r- %r
vi \,6 0,0 'C C OfT O' C g ON t-:- C i iC. C4 -r- C', (N C Cq (N - ;~ - w i :; m
-4 W n n -2el k )k)V

Table A-2. Fraction Defective, Transistors (Defects/106)
QUALITY LEVEL
ENVIRONMENT JANTXV JANTX JAN LOWER PLASTIC
GB 10.9 21.9 109 3 546.6 1,093.2
GF 34.6 69.2 346.0 1,730.2 3,460.4
GM 98.8 189.5 947.7 4,738.5 9,477.0
MP 65.2 130.4 651.8 3,259.0 6,518.0
NSB 54.3 108.7 543.3 2,716.5 5,433.1
NS 54.3 108.7 543.3 2,716.5 5,433.1
NU 109.6 219.1 1,095.7 5,478.3 10,956.6
NH 99.7 199.4 997.0 4,985.1 9,970.2
NUU 104.6 209.3 1,046.3 5,231.7 10,463.4
ARW 139.2 278.3 1,391.6 6,957.8 13,915.6
AIC 52.9 105.7 528.5 2,642.6 5,285.1
AIT 80.0 160.0 799.8 3,998.8 7,997.5
AIB 178.6 357.2 1,786.1 8,930.5 17,860.9
AIA 104.6 209.3 1,046.3 5,231.7 10,463.4
AIF 203.3 406.5 2,032.7 10,163.4 20,326.8
AUC 80.0 160.0 799.8 3,998.8 7,997.5
AUT 129.3 258.6 1,292.9 6,464.6 12,929.2
AUB 301.9 603.8 3,019.0 15,095.1 30,190.1
AUA 178.6 357.2 1,786.1 8,930.5 17,860.9
AUF 326.6 653.1 3,265.6 16,328.0 32,656.0
SF 8.0 15.9 79.7 398.6 797.3
MFF 65.2 130.4 651.8 3,259.0 6,518.0
MFA 89.8 179.7 898.4 4,491.9 8,983.9
USL 183.5 367.1 1,835.4 9,177.0 18,354.1
ML 208.2 416.4 2,082.0 10,410.0 20,819.9
CL 3,408.9 6,817.7 34,088.7 170,443.3 340,886.7
A-3

Table A-3. Fraction Defective, Diodes (Defects/10 6 )
QUALITY LEVEL
ENVIRONMENT JANS JANTXV JANTX JAN LOWER PLASTIC
GB 1.2 5.9 11.8 59.2 296.2 592.3
GF 1.7 8.6 17.2 86.0 430.0 860.0
GM 4.3 21.16 43.2 216.2 1,080.8 2,161.5
MP 3.2 16.1 32.2 160.8 803.8 1,607.7
NSB 1.9 9.4 18.9 94.3 471.5 943.1
NS 1.9 9.4 18.9 94.3 471.5 943.1
NU 4.9 24.4 48.8 243.8 1,219.2 2,438.5
NUU 4.7 23.5 46.9 234.6 1,173.1 2,346.2
ARW 6.0 29.9 59.8 299.2 1,496.2 2,992.3
AIC 3.8 18.8 37.7 188.5 942.3 1,884.6
AIT 4.7 23.5 46.9 234.6 1,173.1 2,346.2
AIB 6.5 32.7 65.4 326.9 1,634.6 3,269.2
AIA 5.6 28.1 56.2 280.8 1,403.8 2,807.7
AIF 7.5 37.3 74.6 373.1 1,865.4 3,730.8
AUC 5.6 28 1 56.2 280.8 1,403.8 2,807.7
AUT 6.5 32.7 65.4 326.9 1,634.6 3,269.2
AUB 10.2 51.2 102.3 511.5 2,557.7 5,115.4
AUA 8.4 41.9 83.8 419.2 2,096.2 4,192.3
AUF 10.2 51.2 102.3 511.5 2,557.7 5,115.4
SF 1.2 5.9 11.8 59.2 296.2 592.3
MFF 3.2 16.1 32.2 160.8 803.8 1,607.7
MFA 4.1 20.7 41.4 206.9 1,034.6 2,069.2
USL 7.6 38.2 76.5 382.3 1,911.5 3,823.1
ML 8.6 42.8 85.7 428.5 2,142.3 4,284.6
CL 128.4 641.9 1,283.8 6,419.2 32,096.2 64,192.3
A-4

Table A-4. Fraction Defective, Resistors (Defects/10 6 )
QUALITY LEVEL
ENVIRONMENT S R p M MIL-SPEC LOWER
GB 0.4 1.2 3.7 12.3 61.4 184.2
GF 0.6 2.0 6.1 20.3 101.7 305.2
GM 1.5 5.1 15.4 51.5 257.4 772.3
MP 1.7 5.7 17.2 57.2 286.2 858.7
NSB 0.9 3.1 9.2 30.7 153.6 460.9
NS 1.0 3.4 10.1 33.6 168.1 504.2
NU 2.6 8.7 26.2 87.2 436.2 1,308.5
NH 2.6 8.7 26.2 87.2 436.2 1,308.5
NUU 2.8 9.3 27.9 93.0 465.0 1,395.0
ARW 3.5 11.6 34.8 116.1 580.3 1,740.9
AIC 0.6 2.1 6.3 20.9 104.6 313.9
AIT 0.7 2.4 7.1 23.8 119.0 357.1
AIB 1.3 4.4 13.2 44.0 219.9 659.8
AlA 1.2 4.1 12.3 41.1 205.5 616.6
AIF 1.8 5.8 17.5 58.4 292.0 876.0
AUC 1.4 4.7 14.1 46.9 234.4 703.1
AUT 1.3 4.4 13.2 44.0 219.9 659.8
AUB 2.8 9.3 27.9 93.0 465.0 1,395.0
AUA 2.8 9.3 27.9 93.0 465.0 1,395.0
AUF 3.7 12.2 36.5 121.8 609.1 1,827.4
SF 0.3 0.9 2.6 8.8 44.1 132.3
MFF 1.7 5.8 17.3 57.8 289.1 867.4
MFA 2.3 7.6 22.7 75.7 378.5 1,135.5
USL 4.7 15.6 46.9 156.4 782.1 2,346.3
ML 5.4 17.9 53.8 179.5 897.4 2,692.2
CL 88.4 294.7 884.1 2,947.0 14,735.0 44,205.0
A-5

Table A-S. Fraction Defective, Capacitors (Defects/10 6 )
QUALITY LEVEL
MIL-SPEC
ENVIRONMENT S R P M L NON-ER LOWER
GB 1.2 3.8 11.5 38.4 115.3 115.3 384.4
GF 1.8 6.2 18.4 61.5 184.5 184.5 615.0
GM 9.0 30.0 89.9 299.8 899.4 899.4 2,998.1
MP 12.7 42.3 126.8 422.8 1,268.4 1,268.4 4,228.1
NSB 5.8 19.2 57.7 192.2 576.6 576.6 1,921.9
NS 6.3 21.1 63.4 211.4 634.2 634.2 2,114.1
NU 14.3 47.7 143.0 476.6 1,429.9 1,429.9 4,766.2
NH 18.4 61.5 184.5 615.0 1,845.0 1,845.0 6,150.0
NUU 20.8 69.2 207.6 691.9 2,075.6 2,075.6 6,918.7
ARW 27.7 92.2 276.7 922.5 2,757.5 2,767.5 9,225.0
AIC 3.5 11.5 34.6 115.3 345.9 345.9 1,153.1
AIT 3.5 11.5 34.6 115.3 345.9 345.9 1,153.1
AIB 5.8 19.2 57.7 192.2 576.6 576.6 1,921.9
AIA 3.5 11.5 34.6 115.3 345.9 345.9 1,153.1
AIF 6.9 23.1 69.2 230.6 691.9 691.9 2,306.2
AUC 8.6 28.8 86.5 288.3 864.8 864.8 2,882.8
AUT 9.2 30.7 92.2 307.5 922.5 922.5 3,075.0
AUB 11.5 38.4 115.3 384.4 1,153.1 1,153.1 3,843.7
AUA 9.2 30.7 92.2 307.5 922.5 922.5 3,075.0
AUF 17.3 57.7 173.0 576.6 1,729.7 1,729.7 5,765.6
SF 0.9 3. 1 9.2 30.7 92.2 92.2 307.5
MFF 12.7 42.3 126.8 422.8 1,268.4 1,268.4 4,228.1
MFA 17.3 57.7 173.0 576.6 1,729.7 1,729.7 5,765.6
USL 36.9 123.0 369.0 1,230.0 3,690.0 3,690.0 12,300.0
ML 41.5 138.4 415.1 1,383.7 4,151.2 4,151.2 13,837.5
CL 703.4 2,344.7 7,034.1 23,446.9 70,340.6 70,340.6 234,468.6
A-6

Table A-6. Fraction Defective, Inductive Devices (Defects/10 6 )
QUALITY LEVEIL
EN V I RON MEI:NT N1I I -S PEC' LO(WE1"R
GB 537.2 1,790.7
GF 1,222.9 4,076.4
GM 2,142.0 7,140.1
MP 1,996.1 6,653.8
NSB 1,135.4 3,784.6
NS 1,222.9 4,076.4
NU 2,433.8 8,112.7
NH 2,725.6 9,085.3
NUU 3,017.4 10,058.0
ARW 3,892.7 12,975.8
AIC 1,047.8 3,492.8
AIT 1,266.7 4,222.3
AIB 1,266.7 4,222.3
AIA 1,266.7 4,222.3
AIF 1,704.4 5,681.2
AUC 1,339.6 4,465.4
AUT 1,339.6 4,465.4
AUB 1,485.5 4,951.7
AUA 485.5 4,951.7
AUF 1,850.3 6,167.5
SF 537.2 1,790.7
MFF 1,996.1 6,653.8
MFA 2,579.7 8,599.0
USL 5,059.9 16,866.2
ML 5,643.4 18,811.5
CL 89,385.3 297,951.1
A-7

Table A-7. Fraction Defective, Rotating Devices
ENVIRONMENT FRACTION DEFECTIVE (DEFECTS/10 6 )
GB 5,935.2
GF 11,663.1
GM 30,168.5
MP 27,965.5
NSB 14,967.6
NS 16,289.4
NU 34,574.6
NH 38,980.6
NUU 43,386.7
ARW 56,604.8
AIC 12,544.3
AIT 13,645.8
AIB 15,848.8
AIA 13,645.8
AIF 23,559.4
AUC 14,747.3
AUT 18,051.9
AUB 20,254.9
AUA 18,051.9
AUF 25,762.5
SF 5,935.2
MFF 27,965.5
USL 74,229.1
ML 83,041.2
CL
A-8

Table A-8. Fraction Defective, Relays (Defects/10 6 )
QUALITY LEVEL
ENVIRONMENT MIL-SPEC LOWER
GB 142.5 210.9
GF 231.4 388.8
GM 635.1 1,784.5
MP 1,510.8 4,384.3
NSB 621.4 1,716.0
NS 621.4 1,716.0
NU 1,031.9 2,673.9
NH 2,263.4 6,642.0
NUU 2,400.2 6,915.7
ARW 3,221.2 9,652.3
AIC 450.3 724.0
AIT 484.5 1,100.3
AIB 758.2 1,442.4
AIA 587.2 1,100.3
AIF 758.2 1,784.5
AUC 621.4 1,442.4
AUT 689.8 1,784.5
AUB 1,100.3 2,810.7
AUA 758.2 2,126.5
AUF 1,100.3 3,152.8
SF 142.5 210.9
MFF 1,510.8 4,384.3
MFA 2,058.1 5,684.2
USL 4,315.8 13,073.1
ML 4,931.6 14,441.4
CL N/A N/A
A-9

Table A-9. Fraction Defective, Switches (Defects/10 6 )
QUALITY LEVEL
ENVIRONMENT MIL-SPEC LOWER
GB 1.4 24.4
GF 2.4 44.0
GM 8.8 158.4
NP 12.8 230.6
NSB 5.3 95.5
NS 5.3 95.5
NU 12.2 220.3
NUU 20.3 364.7
ARW 27.1 488A
AIC 5.4 96.6
AIT 5.4 96.6
AIB 9.4 168.8
AIA 9.4 168.8
AIF 12.2 220.3
AUC 6.5 117.2
AUT 6.5 117.2
AUB 12.2 220.3
AUA 12.2 220.3
AUF 15.1 271.9
SF 1.4 24.4
MFF 12.8 230.6
MFA 17.4 313.1
USL 36.9 663.7
ML 41.5 746.2
CL 688.3 12,388.6
A-10

Table A- 10. Fraction Defective, Connectors (Defects/0 6 )
QUALITY LEVEL
ENVIRONMENT MIL-SPEC LOWER
GB 73.7 97.3
GF 83.2 248.1
GM 417.7 1,204.6
MP 427.1 827.7
NSB 219.8 408.3
NS 276.3 544.9
NU 639.2 1,298.9
NH 639.2 1,251.8
NUU 686.3 1,346.0
ARW 921.9 1,770.1
AIC 120.9 497.8
AIT 168.0 497.8
AIB 238.7 733.4
AlA 215.1 733.4
AIF 332.9 969.0
AUC 262.2 733.4
AUT 403.6 733.4
AUB 497.8 969.0
AUA 474.3 969.0
AUF 733.4 1,440.2
SF 73.7 97.3
MFF 427.1 827.7
MFA 592.1 1,157.5
USL 1,204.6 2,382.7
ML 1,393.1 2,759.6
CL 21,335.8 45,733.8
A-11

Table A-Il. Fraction Defective, Printed Wiring Boards (Defects/10 6 )
QUALITY LEVEL
ENVIRONMENT MIL-SPEC LOWER
G8 425.0 4,250.0
GF 690.3 6,903.2
GM 1,792.4 17,925.3
MP 1,629.2 16,291.5
NSB 1,057.7 10,576.9
NS 1,302.6 13,026.0
NU 2,670.0 26,700.3
NH 2,874.1 28,741.2
NUU 3,078.2 30,782.2
ARW 4,098.7 40,986.9
AIC 731.1 7,311.4
AT 1,139.3 11,393.2
AIB 1,853.7 18,536.5
AIA 1,567.9 15,679.2
AIF 2,261.8 22,618.4
AUC 1,751.6 17,516.1
AUT 3,282.3 32,823.1
AUB 5,323.3 53,232.5
AUA 4,302.8 43,027.8
AUF 7,364.2 73,641.9
SF 425.0 4,250.0
MFF 1,996.5 19,965.2
MFA 2,670.0 26,700.3
USL 5,527.3 55,273.5
ML 6,139.6 61,396.3
CL 102,267.9 *
A-12

W' 0 ) -1r - e W 9 0 %)-It~e~o~ C r-o 00Nw 00 0 ClC14 00~C-4 cq -- L-)
W) - O k r- o N % - 1. 'I 0 o ckn n n C C
z w 6. , jc 6r 6.-Ceo o A -A
< - -ce~~ - - -- '
( < -
M -) NM r 2 K0 Ar
C,4
L4
o z
0;
4r0 0..r < - - 0 E00i6666c i6oc c ;oc )6r
-. 4 In r- r-'I 0 c 0 0 m C1 w fl r- "0l
z
0 QQz z z < Z<<
A- 13

APPENDIX BSELECTION OF SOW, DD FORM 1423
AND DATA ITEM DESCRIPTIONS
Based on the previous processes of defect determination-stress type and magnitude determination,
criticality assessment and cost analysis-certain ESS activities are appropriate. For each type ot
stress screen, a narrative requirement must appear in the statement of work, accompanied by an
initial baseline intensity of the stress.
All projects having any ESS elements must have contract requirements for implementation of an
ESS program, preparation of an ESS plan, ESS procedures and ESS performance reports. Other
activities are determined by the types of stress being applied and the amount of funding available.
Thermal cycling requires a thermal survey (i , funding permits) and a requirement of performance of
thermal cycling. Random vibration requires a vibration survey (if funding permits) and a
requirement to perform random vibration at a given intensity.
Any contract requirement for ESS must be accompanied by certain parameters specified by the
procuring activity. The type of stress screens to be performed and the intensity of the stress must be
specified. This includes random vibration frequency range, power spectral density, axis of
vibration, duration of vibration or number of thermal cycles, temperature extremes, temperature
rate-of-change, and other factors that must be evaluated by the procuring activity to generate
effective contract clauses and statements of work.
Table B- I provides a listing of the sample statements of work that can be invoked in hardware
contracts. They are to be tailored to specific needs and may be modified to eliminate redundant
requirements with other quality or reliability statements of work.
B-I
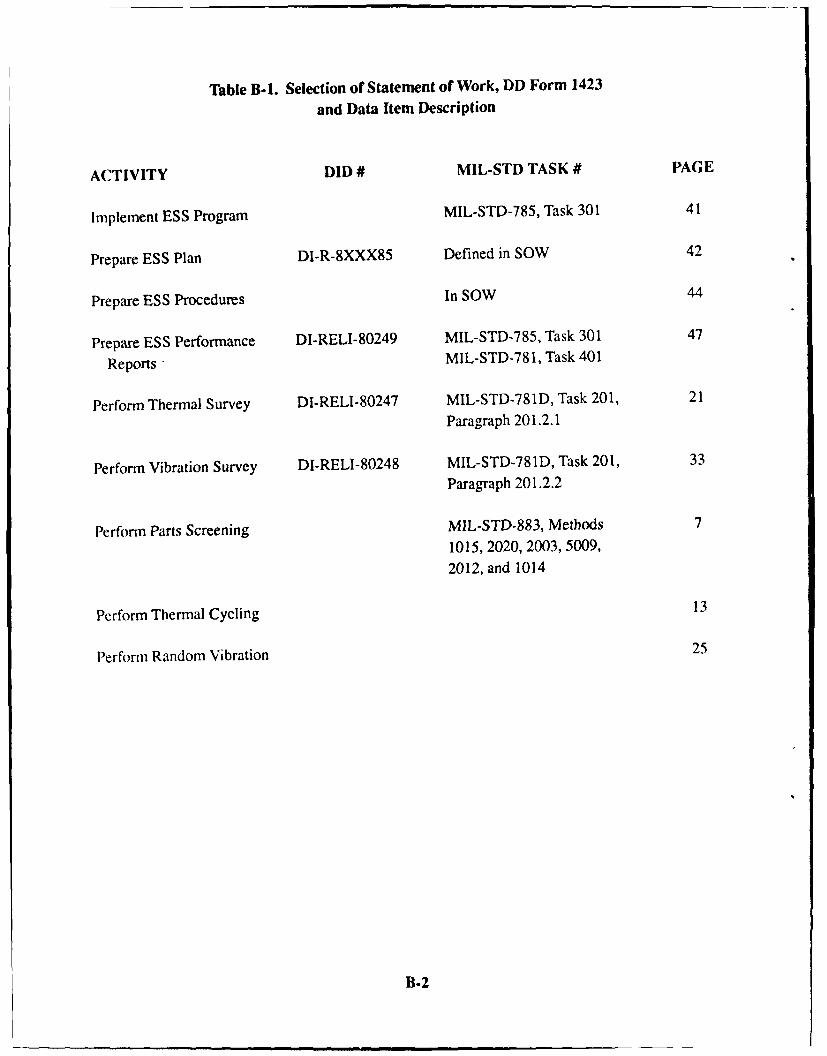
Table B-I. Selection of Statement of Work, DD Form 1423
and Data Item Description
ACTIVITY DID # MIL-STD TASK # PAGE
Implement ESS Program MIL-STD-785, Task 301 41
Prepare ESS Plan DI-R-8XXX85 Defined in SOW 42
Prepare ESS Procedures In SOW 44
Prepare ESS Performance DI-RELI-80249 MIL-STD-785, Task 301 47
Reports • MIL-STD-781, Task 401
Perform Thermal Survey DI-RELI-80247 MIL-STD-781D, Task 201, 21
Paragraph 201.2.1
Perform Vibration Survey DI-RELI-80248 MIL-STD-781D, Task 201, 33
Paragraph 201.2.2
Perform Parts Screening MIL-STD-883, Methods 7
1015, 2020, 2003, 5009,
2012, and 1014
Perform Thermal Cycling 13
Perform Random Vibration 25
B-2

APPENDIX CENVIRONMENTAL STRESS SCREENING COST MODEL
Place the proper amount in the brackets provided after each question. Default values are listed inthe brackets for most of the questions. If you do not wish to use the default value, change it simplyby putting in your value over the existing default value within the brackets. Never leave bracketsempty. If the question does not pertain to your evaluation, place a zero (0) in the brackets. If a wordor phrase is desired by the question, place the appropriate phrase within the brackets.
PART 1
The first part of this cost model allows the user to see the following cost model elements:
. Range of defects per item" Number of defects in lot size according to the incoming defect estimation" Total screening cost for each defect estimation" Scrt ening cost per item for each defect estimation" Screening cost per defect for each defect rate.
1. What is the title you wish to use for this cost model(i.e., item name, company name, etc.) [The BRDEC Cost Model]
The following costs relate to two different screens. Two columns of brackets denote the twoscreens. Default values given here under columns A and B relate to thermal cycling and randomvibration, respectively. Where there is only one set of brackets, the cost for both screens "A" and"B" is the same.
A B2. What are the screen names? [Thermal] [Vibration]
3. What is the cost for the following screening equipment?
-Chamber cost [$40,000] [ $55,000 ]- Monitoring equipment cost [ $4,000 j [ $4,000 J- Support equipment cost [ $0] [$30,000]- Fixture cost [ $500 [ $0]- Facilities cost [ $01 [ $0]- Any other costs $0] [ $01
-Totals- $44,500 $89,000
C-1

A B4. What are the values for the following survey parameters?
- Accelerometer cost [ $0] [ $300 ]- Survey time (hours) [ 24.00 [ 4.00 ]- Technician labor rate ($/hr) [ $50 ] [ $50 1
-Survey Costs- $1,200 $500
A B
5. What are the values for the following item
screening parameters?
- # Items in the lot [ 5,000] [ 5,000]- # Items in one set [ 10) [ 10]-# Hours to load one set [ 0.5] [ 0.5]
- # Hours to manually monitor chamberwhile screening one set 1 0.5] 1 0.2]
- # Hours to unload one set [ 0.2 1 [ 0.2 ]- # Hours to run functional test on one set [ 2 ] [ 2 ]- Technician labor rate ($/hr) $50 ] [ $50 ]- Administrative cost associated with
scrrening one item [ $4] [ $4
-Totals for Screening- $100,000 $92,500-Screening Cost Per Item- $20 $19
C-2

A B6. What are the values for the following failure
parameters?
Analysis Parameters
- Cost for one full failure analysis of anunknown defect ($) [ $1,000
- Percentage of defects found that need a full
analysis to find the cause of failure (decimal) [ 0.20- Range for number of defects estimated per item
(Place the first value of the range in column "A"
and the last value of the range in the range incolumn "B" 0 ] 0.3)
- Estimated defect per item step [ 0.02 1- Percent of total defects that will be uncovered
by screen "A" and screen "B," respectively 0.8 ] [ 0.2
-Failure Cost Per Defect- $200
Repair Parameters
- Average parts cost to repair defective item ($) [ $0 ]- Repair technician labor rate ($/hr) $50]- # Hours to repair one defective item (X.XX) [ 1.00 ]
-Total Repair Cost Per Defect- $50
Rescreening Parameters
(These values may be the same as the screening values. Differences may occur when norescreening is done or the cycles are reduced, hence shortening the monitoring time.)
A B
- # Hours to load one repaired set into fixture (X.XX) [ 0.50 1 0.50 1- # Hours to monitor chamber while screening one
repaired set (X.XX) 1 0.25 1 0.25 1- # Hours to unload one repaired set from
the fixture (X.XX) [ 0.20 1 0.20 1- # Hours to run a functional test on the rescreened
items (X.XX) [ 1.00 [ 1.00
- Administrative cost ($) [ $4] [ $4]
-Rescreening Cost Per Defect- $13.75 $13.00
C-3
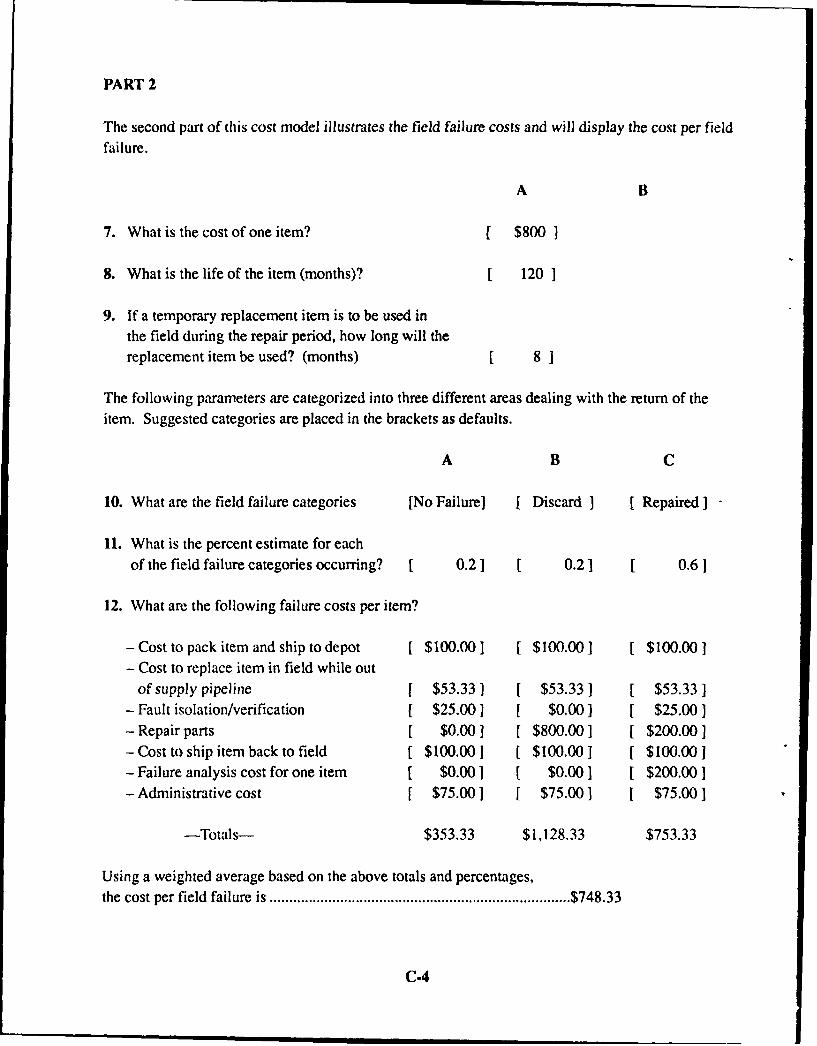
PART 2
The second part of this cost model illustrates the field failure costs and will display the cost per fieldfailure.
A B
7. What is the cost of one item? [ $800 ]
8. What is the life of the item (months)? 120 1
9. If a temporary replacement item is to be used inthe field during the repair period, how long will thereplacement item be used? (months) 8 ]
The following parameters are categorized into three different areas dealing with the return of theitem. Suggested categories are placed in the brackets as defaults.
A B C
10. What are the field failure categories [No Failure] [ Discard ] [ Repaired -
11. What is the percent estimate for eachof the field failure categories occurring? 1 0.2 ] [ 0.2 1 [ 0.6 1
12. What are the following failure costs per item?
-Cost to pack item and ship to depot [ $100.00 ] [ $100.00] [ $100.00]- Cost to replace item in field while out
of supply pipeline [ $53.33] [ $53.33] f $53.33 1- Fault isolation/verification f $25.00 1 [ $0.00] f $25.00]- Repair parts [ $0.00] [ $800.00] [ $200.00]-Cost to ship item back to field [ $100.00] [ $100.00] [ $100.00]- Failure analysis cost for one item f $0.00] [ $0.00] [ $200.00]- Administrative cost [ $75.00] [ $75.00] [ $75.00]
-Totals- $353.33 $1,128.33 $753.33
Using a weighted average based on the above totals and percentages,the cost per field failure is ............................................................................. $748.33
C-4

0 0
IS ±8N)100
c-S

N ONr--6q 6q56)U3 616 06
eq \0m ON N ;t 0 0004 0% o00(
F )8--e 1 a - N0
n %0 t 0 t W nI
WyfqOt6, b! 0)6 3
cn 00 'D
00 r- c t~~0h-
W r C T00 ) r-C)- - -t I~ . I' ei -I
r-:C; 4 0R\0Ci400 - r eC14 00 f)W) 0- -f C
enef e W3C-6*,W
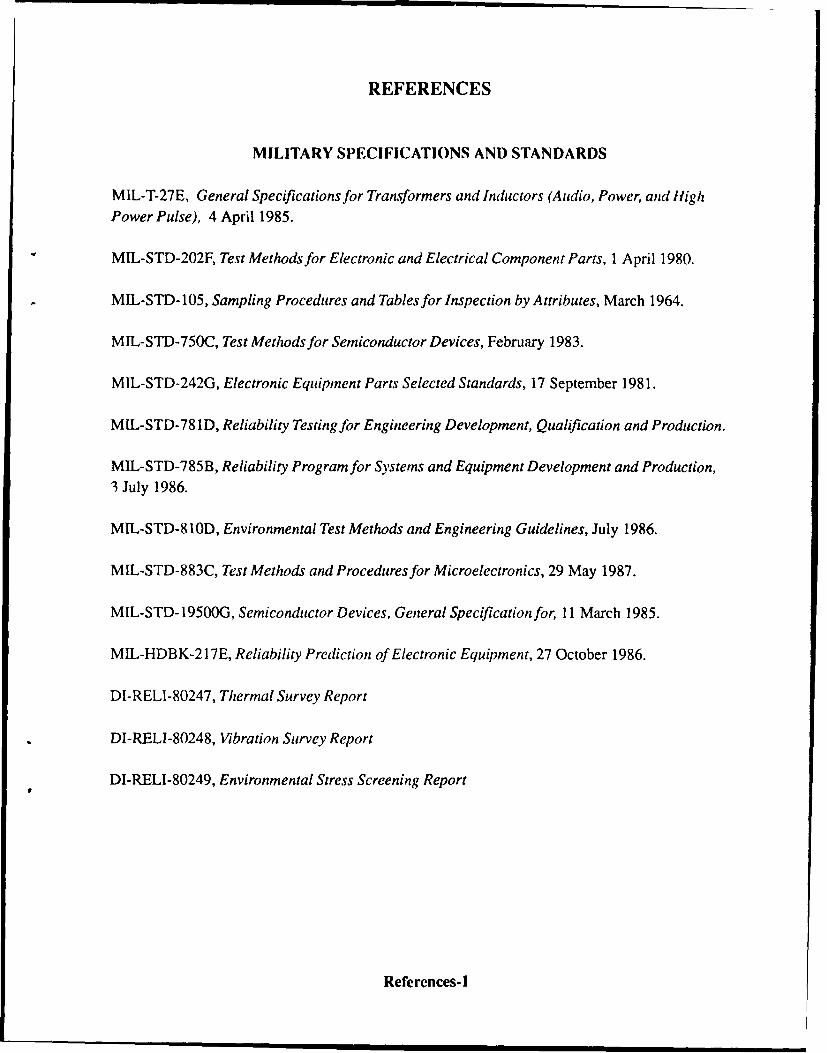
REFERENCES
MILITARY SPECIFICATIONS AND STANDARDS
MIL-T-27E, General Specifications for Transformers and Inductors (Audio, Power, and HighPower Pulse), 4 April 1985.
MIL-STD-202F, Test Methods for Electronic and Electrical Component Parts, 1 April 1980.
MIL-STD-105, Sampling Procedures and Tables for Inspection by Attributes, March 1964.
MIL-STD-750C, Test Methods for Semiconductor Devices, February 1983.
MIL-STD-242G, Electronic Equipment Parts Selected Standards, 17 September 1981.
MIL-STD-78 ID, Reliability Testing for Engineering Development, Qualification and Production.
MIL-STD-785B, Reliability Program for Systems and Equipment Development and Production,3 July 1986.
MIL-STD-810D, Environmental Test Methods and Engineering Guidelines, July 1986.
MIL-STD-883C, Test Methods and Procedures for Microelectronics, 29 May 1987.
MIL-STD-19500G, Semiconductor Devices, General Specification for, 11 March 1985.
MIL-HDBK-217E, Reliability Prediction of Electronic Equipment, 27 October 1986.
DI-RELI-80247, Thermal Survey Report
DI-RELI-80248, Vibration Survey Report
DI-RELI-80249, Environmental Stress Screening Report
References-I

FOOTNOTES
1. "R&M 2000 Enviornmental Stress Screening," IEEE Transactions on Reliability, Vol. R-36,August 1987.
2. "Environmental Stress Screening Guidelines for Assemblies," Institute of EnvironmentalSciences, September 1984.
3. NAVMAT-9492, "Navy Manufacturing Screening Program," Department of the Navy, May 1979.
4. "Random Vibration Screening of Six Militarized Avionic Computers," Journal of the Institute ofEnvironmental Sciences, March-April 1982.
OTHER REFERENCES
AMC-R-702-25, "AMC Environmental Stress Screening Program," 29 May 1987.
RADC TR-87, "Guide to Environmental Stress Screening."
DOD HDBK-344 (USAF), "Environmental Stress Screening (ESS) of Electronic Equipment,"20 October 1986.
References-2

DISTRIBUTION FOR REPORT 2477
No. Copies Addresee No. Copies Addressee
Department of Defense 2 (0bnaandrS .i'rm. \%iation Si,-temn (Gimmand
Director. Technical Information ATTN: .AMSAV-9
Defense Advanced Research Project. Agency 14) Goimlfellow Bh'd
1400 Wilson Blvd St. Lo'ui. M 63120-1798Arlington. VA 22209
1( nommander
Director US Army I)epot System Command
Defense Nuclear Agency ATTN: AMS)D-Q
ATTN: TITL Chamlbersburg. PA 17201-4170
Washington. DC 203052 Commander
12 Defense Technical Infonnation Center US Army Mi.sile Gommand
Cameron station ATTN: AMSMI-Q
Alexandria. VA 22314 Redtone Arsenal. AL 35898-5290
5 Commander 2 Commander
US Army Materiel Command IS Army. Tank-Automotive ,mmandl
ATTN: AMCQA %TTN: AMSTA-Q
5001 Eisenhower Ave Warren. MI 480)90
Alexandria. VA 22333-00012 Commander
2 Commander US Army, Te-t and Evaluation Command
US Army Armament Munitions and ATTN: AMSTE-AD
Chemical Command Aberdeen Proving Ground. MD 2IM)5
ATTN: AMSMC-QADover. NJ 07801-5000 2 Commander
US Army Logistics Management Center
3 Commander ATTN: AMXMC-ACM-MA
US Army Troop Support Command Fort Lee. VA 23801-6042
ATTN: AMSTR-Q4300 Goodfellow Blvd 2 Director
St. Louis. MO 63120 US AMC Intern Training Center
ATTN: AMXMC-ITC
3 Commander Texarkana. TX 75507
US Army Natick RD&E Center
ATTN: STRNC-EP 2 Director
Natick. MA 01760-5014 US Army Management Engineering Training
Activity
2 Commander ATTN: AIXoM-D)
US Army LABCOM Rock Iland. IL 61299-7040
ATTN: AMSLC-PA
Adelphi. MD 20783 1 Chief
Product k4-urance and Te.t Field Activitv
2 Commander ATTN: A.M XQAUS Army Communication Electronics Lexington. KY 44)511-5105
Command
ATTN: AMSEL-PA
Fort Monmouth. NI 07703-5000
Distribution-I

No. Copies Addressee No. Copies Addressee
2 Director I Dir. Repurce Management Dir. STRBE-CUS Arm, Materiel Systems Analysis Agency Dir. Information Management Dir. STRBE-BATTN: AMXSY-R )ir. Facilities and Support Dir. STRBE-WAberdeen Proving Ground. Mi) 21005-5A)71 i)ir. Product A.-surance & Engr Dir.
STRBE-TDepartment of the Army Dir. (4 mbat Engineering I)ir. STRRE-J
)ir. Logistics Support Dir. STRBE-FCommander. HQ TRADOC Dir. Materials. Fuels & Lubricants Lab.ATTN: ATEN-ME STRBE-VFort Monroe, VA 23651
10 PA&E Dir. STRBE-THQDA (DAMA-AOA-M) 50 PA Div, STRBE-TQEWashington. DC 20310 3 Tech Reports Ofc. STRBE-BPG
5 Security Ofe (for liaison officermi. STRBE-SHQDA (DAEN-RDL) 2 Tech Lib. STRBE-BTWashington. DC 20314 I Pubic Affairs Ofe. STRBE-I
I f)fe of Chief Counsel, STRBE-L
HQDA (DAEN-MPE-T)Washington. DC 203014 AMC LIBRARIES
CommanderUS Army Missile Command I US Army Aberdeen Proving Ground
ATTN: DRSMI-RR ATTN: STEAP-IM-AL
Redstone Arsenal, AL 35809 Aberdeen Proving Ground. MD 21005-5001
Director I Director. US Army Ballistic Research Lab
US Arm, Materiel Systems Analysis .Agency ATTN: AMXBR-OD-ST
ATTN: DRXSY-CM Aberdeete Proving Ground. MD 21005-5066Aberdeen Proving Ground, MD 21005
I HQ. US Army TECOM
Director ATTN: AMSTE-TO-FUS Army Ballistic Research Laborotorv Aberdeen Proving Ground. MD 21005-5055
ATTN: DRDAR-TSD-S (STINFO)Aberdeen Proving Ground. MD 21005 1 DIR. US Army Laioratory Comnnand
Materials Technology Laloratory
Commandant ATTN: Sl.(MT-IML
Belvoir Research. Development Watertoin. MA 02172-(X)01and Engineering Center
Fort Belvoir. VA 22060 1 CDR. USA (0,mmunication & Electronic CMDATTN: AMSEL-ME-PSLFt. Miontiouth. NJ 07703-51X)7
Commander. STRBE-ZDeputy Commander. STRBE-ZD I 11Q. US Armyv (ECOIM
Technical Director. STRBE-ZT ATTN: AlSEL-L(;-J k
Asm Tech Dir (E&A), STRBE-ZTE Ft. Monmioutl. NJ 07703-50I0
Assoe Tech Dir (R&D). STRBE-ZTRExecutive Officer. STRBE-ZX I CI)R. US Army %%iation Sv~lcnts Commnnand
Sergeant Major. STRBE-ZM ATTN: ANIS.\-i)Il.Advanced Systems Concepts Dir, STRBE-H BO (;4mIfello% Blld. Ea-t 2
Program Planning Div. STRBE-HP .. IIW. II 63120-1798
Foreign Intelligence Div. STRBE-HFSystems and Concepts Div. STRBE-H I ()R. [S %trn immrllallent. Mutnitions &
:IR(UI.ATF C hemical ( CoinPnaod%TTN: %NISNIC-INIP-I
Rock IWand. I11 61299-UH64M)
Distribution.2

No. Copies Addressee No. Copies Addressee
CDR. U*S Army Mis-ile (Omnmindall (I)R. US Ann% Yuma Proving GromndATTN: A\ISNII-RPR %TTN: STE.YP-I- ATRd-oI.t," Sinlifi hifinrualmiou O r I uma. %Z 85:15 )i-91) 2RHedI.-immi krenllI. %I. "1.898-52 11
S(MI)T. US% S otlmm , Eof ilmm'mrritag, & lAigi.ti's(:I)R. US \r, Mi-,ihl lmmmmmmand ATTN: \MXMC-SEI,-I,ATTN: AMSNMI-YI)L Red River Ann DepeoRedltone Ar enal. AL 35898-55(K) Texarkana. TX 75507-5000)
Director. White Sands Missile Range I CDR. Letterkennv Army DepotATTN: STE'S-TE-TL ATTN: SDSLE-SW'IMWhite Sands Missile Range. NM 88002-5029 Chamlwrslmurg. PA 17201-4150
(:DR. White Sands Missile Range I ()R. New Cumlerlamd. Army DelmtATTN: STEWS-DP-M L ATTN: SDSN-D-DAWhite Sands Missile Range. NM 88002-5039 New Cumlerland. PA 17070-5001
IIQ. US Army Materiel Command (IDR. Seneca A rniy DepotATTN: AMNCDMA-ML ATTN: SDSSE-TR5001 Eisenhower Ave Romulus. NY 1454;-5110Alexandria. VA 22333-0001
I (DR. Sierra Army DeomtCDR. US Armv Tank Authmotie :mmmnanld ATTN: SI)SSI-CSBATTN: AMSTA-TSL Hermmug. (A 9611.3-511 )Warren. MI 48397-5000
S(:DR. Sharpe Army Detmn(DR. Automated Logistics ,gnit Systems A-ti .ATTN: SDSSH-MW-MSA
ATTN: ANIXAL-A.AG Lathrop. CA 95331-5124PO) Box 1578St. Louis. MI) 63188-1578 I CDR. Tobl'hanna Army Demt
ATTN: SDSTO-D.A-TUS Army Armament RD&E Center Tobvhanna. Pa 18466-5099ATTN: SMCA R-TSSBldg 59 1 (DR. Tobyhanna Arnn DepotDover. NJ 07801-5001 ATTN: SDSTO-TM
Tolbyhanna. PA 18466-5097(IDR. USA Aviation Research & Technolohgy ArtyApplied Technology Directorate I CDR. Sacremento .Army DepotATTN: SAVDL-ATL-TSC ATTN: SDSSA-AAD-WBldg 401 Sacramento. CA 95813-5009Ft. Eustis. VA 236014-5577
( I)R. ( ;mrrlmm. ( ;hri-ti \rm l)elhmtUS .Arniv Natiek RI)&E Center ITTN: Si)SS C -- \\R
ATTN: STRNC-ML Corl~mm, Christi. TX 78-19-6020Natick. MA 0176 -50M8
1 US rmlv Fmreign S'ien'e & Technmgy (OrUS .Armv Tank \utomnim ve Commami ATTN: \%lXST-IS3ATTN: .AMST\-TSI, 220 7th St. NEWarren. Ml 48090-50N) Charllte-ville. VA\ 22W4)1-5396
(IDR. US \rm'. \rmament RI)& E CemerBenet Weapons Lal,ATTN: SMCAR-CCIB-TI,Vaterfliet ArsenalWateriliet. NY 12189-5(MMI
Distribution-3

No. copies Addess. No. Copies Addre"e
OTHER ARMY LIBRARIES
DIR. USA TRAI)C: SvStem- 1nah-i, '#-I I)a~id W. Ta~hlor Naal Ship RI)&E (:enter
ATTN: AT %A-SI. TECII LIMI I.ibrar I)i. C le 5220
White Sanids Misile Range. NM 81N2 Retlh-l1a. M) 200)84
US Amiy Aviatin 'hool Lilrary I Naval Air Svtems (unomaII
P(0 Drawer 0 ATTN: Tech Library
Ft. Rucker. AL 36360 Air 00)D4Washington. D( 20361
USMA
ATTN: Wr. Egon Weiss. Librarian Naval Surface Weapmns (:enter
West Point. NY 10996 ATTN: Tech LibraryDahlgren. VA 22448
(ommandant. US Anne Engineer School
ATTN: Library Naval Research lab
Ft. Belvior. VA 22060 ATTN: Tech LibraryWashington. DC 20375
US Army Humphrey's Engr. SuPt -ctivity
ATTN: Library Branch Naval Surface Weapons Center
Ft. Belvoir. VA 22060 %TTN: Tech LibrarySiiker Spring. MD 20910
Engineer Topographic Lab
ATTN: STINF() Naval Sea Systems (Gmnand
Ft. Beliior. VA 22064) Library Iwumnentation Branch
Sea 9661
Pentagon Library Washington. DC 20362
ATTN: Chief. Readers Services Branch
The Pentagon. RM IA518 Naval Ship Systens Engineering Stationl
Washington. DC 20310 Technical LibraryCOle 01 IF
US Army Corps of Engineers Bldg 619
ATTN: DAEN-ASI-Tech Library) Philadelphia. PA 19112
20 Massachusetts Ave. NW
Room 3119 \a al Training Equipment (enter
Washington. DC 20314 XTTN: Technical LibrarI rlando,. Fl. 32813
US Army 0)wrational Test &
Ey-aluation Agency [IQ. USNI(
ATTN: Tech Library \larine Corips Technical Library
5600 Columbia Pike. RM 503 Cole LMA-l
Falls Church. VA 22401 Washingtoll. )C 20314
DOD LIBRARIES I %ir Force Svstevn| CommandIt
Technical Infrinatiom (Center
Naval Mine Warfare Engineering Acty IIQ AFS(J/IPISI,T
Cole 322 %ndreu, AFB. DC 2033-1
Yorktown. VA 23691I IIQ %F Engineering & Serlice( Center
I:C)R. Naval Facilities Engineering I4,onmanl Tech Library Fl. 7050
\TTN: Library Tndall %FB. FL, 3240)3
200 Stovall St
Alexandria. VA 22332
Distribution-4

No. copies Addressee
I l).~Dfeu-e SV,-I1giI, MIaimm.it I sII41
Ft. Bdir. V%~ 220MA)
I Dirretnr. IDeferwe Nuclear.Apa,.'tATTN: TITL
Wa,,hingrton. DO: 20305
OTHER FEDERAL LIBRARIES
I (Geological Survey Laibrary I(;lS)National Center. Stop 9.12201 Sunrise V'alley Drive
ResAton. VA 22092
1 National Bureau .( Standard. tNBSIEOI Adm~inistrationu Build~ing~Washington. DO: 20234
Dep of Tran.-portations LibiraryFOB l0k. %1494-6
800 Indepenilenee Ave. SS'Waishinoo~n. DC 20591
Distribution-5