Embed Size (px)
Citation preview
NATIONAL CENTER FOR EDUCATION STATISTICS
TechnicalIssues in
Large-ScalePerformanceAssessment
Edited byGary W. Phillips
Associate CmunissionerNational Center for Education Statistics
U.S. Department of EducationOffice of Educational Research and Improvement NCES 96-602
U.S. Department of EducationRichard W. RileySecretafy
Office of Educational Research and ImprovementSharon P. RobinsonAssistant Secretay
National Center for Education StatisticsJeanne E. GriffithActing Commissioner
The National Center for Education Statistics (NCES) is the primafy federal entity for collecting,analyzing, and reporting data related to education in the United States and other nations. Itfulfills a congressional mandate to collect, collate, analyze, and repott full and completestatistics on the condition of education in the United States; conduct and publish reports andspecialized analyses of the meaning and significance of such statistics; assist state and localeducation agencies in improving their statistical systems; and review and report on educationactivities in foreign countries.
NCES activities are designed to address high priority education data needs; provide consistent,reliable, complete, and accurate indicators of education status and trends; and report timely,useful, and high quality data to the U.S. Department of Education, the Congress, the states,other education policymakers, practitioners, data users, and the general public.
We strive to make our products available in a variety of formats and in language that isappropriate to a variety of audiences. You, as our customer, are the best judge of our successin communicating information effectively. If you have any comments or suggestions about thisor any other NCES product or report, we would like to hear from you. Please direct yourcomments to:
National Center for Education StatisticsOffice of Educational Research and ImprovementU.S. Department of Education555 New Jersey Avenue NWWashington, DC 20206-5574
April 1996
Contact:Arnold A. Goldstein202-21 %1 741
.
For sale by the U.S. Government Printing Otlice
Superintendent of Owuments, Mail Stop SSOP, Washington, OC 204CT2-9328
ISBN 0-16 -048827-0
ForewordGary W. Phillips
Associate Commissioner ,National Center for Education Statistics
Recently there has been a significant expansion in the use of performance assessment in largescale testing programs. This proliferation has given rise to a range of testing formats such asconstructed-responses, essays, experiments, portfolios, exhibitions, interviews, and directobsewations. Support for this effort comes primarily from curriculum reformers andpolicymakers who feel it only makes good sense to test what we teach, and test the way weteach. Many school districts, state testing programs, and national and international assessmentshave incorporated performance assessments into their programs. Efforts are continuing to usesuch large scale assessments to shed light on the thinking and learning processes of students, andto encourage teachers to focus their teaching based on the content and skills of the test.
Although, there has been significant support from curriculum and policy stakeholders, thetechnical feasibility of large scale performance assessments has remained a question. This reportis intended to contribute to the debate by reviewing some of the technical issues that must bedealt with by any developer of large scale pefiormance assessments. The report is also intendedto surface issues, articulate problems, and where possible, give advice on how to proceed. Thereport is not intended to be a technical or users manual on how to solve technical problems. Thereport is being written at a time in which many of the technical problems of large scaleperformance assessments are just beginning to surface. As these problems are recognized andsolved, the state-of-the-art is expected to change rapidly.
The report is divided into five chapters: Validity, Generalizability, Comparability,Performance Standards and Fairness, Equity, and Bias. Each represents a major technical topicthat developers of large scale performance assessments should expect to encounter. Thefollowing is a brief summary of some of the main points in each chapter.
Validity. This chapter provides a comprehensive view of validity. Validity is defined as notonly the evaluative or evidential ifiormation about score inferences but also itiormation aboutactual as well as potential consequences of score interpretations. It is argued that validity is not aproperty of the test but instead is a property of inferences or interpretations we make from testscores. Messick argues that validity is an essential concept for all types of qualitative as well asquantitative summaries.
The authors argue that since “performance assessments promise potential benefits forteaching and learning, it is important to accrue evidence of such positive consequences as well asevidence that adverse consequences are minimal.” The primary adverse consequence that shouldbe investigated is the potential negative impact on individuals or groups derived from sources ofinvalidity such as construct underrepresentation or construct-irrelevant variance. In the formercase, individuals may be scoring low because the assessment is missing something that bestrepresents the construct. In the latter case, individuals may score low because the measurementprocess contains something irrelevant that interferes with the student’s ability to demonstrateproficiency.
. . .111
Generalizability. This chapter provides an overview of generalizability theory and integratesthe literature on reliability of performance assessment with the conceptual framework ofgeneralizability theory. Generalizability theory is viewed as the product of the marriage betweenclassical test theory and analysis of variance methodology.
The methodological development in this chapter is quite Comprehensive and easy tounderstand. It should be required reading for everyone involved in the development of largescale performance assessments. In addition, the author makes several points that representlessons learned from the literature. Some of these lessons are:
. The number of raters has very little effect on the error variance found in most generaiizabilitystudies. This is probably because the scoring rubrics are generally well defined and the ratersare well trained. The main conclusion from this is that increasing the number of raters doesnot increase test reliability.
. The number of tasks is inversely related to the error variance in most generalizability studies.The fewer the tasks the larger the error variance. One approach to reducing error variancemight be to narrow the domain of tasks so that each is a slight modification of the others. Theother approach is to increase the number of tasks (say to 10 or more) to reduce the error.Although this may be a costly alternative, it often makes more sense than restricting thedomain.
Comparability. In order to provide indicators of trends in academic achievement, large scaleperformance assessments must be comparable across administrations. With multiple-choicetesting this is a relatively easy matter because testing conditions are highly standardized, andlarge numbers of unidimensional items are scored by computer. Performance assessments on theother hand tend to be less standardized, involve fewer tasks, are more multidimensional, and arescored by humans, not computers. These differences make it more difficult to ensurecomparability from one administration to the next.
The authors make the point that the degree of comparability required in performanceassessments depends on the kind of decision being made and the importance of the consequencesattached to those decisions. As the stakes get higher, the requirements for comparability gethigher. The chapter concludes with the observation that strict forms of comparability, such asequating and calibration, may not be possible with many large scale performance assessments.However, weaker forms of comparability, such as statistical and social moderation, areattainable. Finally, the authors observe that many of the problems leading to lack ofcomparability would be mitigated if more precise content specifications for performanceexercises were available.
Perjimnarzce Stamfards. This chapter deals with the setting of performance standards onlarge scale performance assessments. There is much in the literature on setting performancestandards on multiple-choice-based large assessments but there is very little on setting standardsfor large scale performance-based assessments. The authors cite four generalizations from twodecades of research on petiormance standards.
. In almost all cases performance standards are arbitrarily (although not capriciously) set on aperformance continuum.
. Performance standards are method dependent.
iv
● Those who set performance standards can’t objectively evaluate the quality of their standards.
. Widely used performance standing setting methods presume an underlying unidimensionalscale.
The last generalization is particularly out of sync with almost all performance assessmentsthat are ofien explicitly multidimensional. In addition, the authors argue that new methods ofsetting performance standards are needed because most performance assessments are often basedon only a few tasks, each potentially requiring a separate performance standard.
The chapter describes two new approaches to setting performance standards that do not makethe above unidimensionality assumptions. Each of the approaches have been evaluated withinthe context of the National Board for Professional Teaching Standards (NBPTS). The two newapproaches are:
. Iterative, Judgmental Policy Capturing Procedure: In this method panelists respondindependently to graphic profiles of performance for hypothetical students. The panelistsmake judgments as to whether the overall performance (or profile) should be considereddeficient (l), competent (2), accomplished (3), or highly accomplished (4). Various analyticmodel fitting methods were used to assign weights to each dimension of the profile. Theessence of the Iterative, Judgmental Policy Capturing procedure is that the panelists standardsetting policies are inferred from their reactions to the profiles of candidate performancepresented to them.
. Multi-Stage Dominant Profile Procedure: In this method a variety of integrative proceduresare used to get the panelists to formulate explicitly their standard setting policies. Thisinvolves more up front group discussion and reflection. The procedure is different from theprevious one in that the panelists’ standards are generated directly through discussion ratherthan inferred from panelist ratings.
The chapter concludes with several unresolved technical issues that need to be addressed insetting performance standards.
Since performance standards usually involve an artificial dichotomization of a performancecriteria, how do you minimize misclassification near the cut-score?
Since performance standards are method dependent, how do you assess this source of error inyour procedures?
How large should the standard setting panel be?
Who should compose the standard-setting panel (e.g., experts or stakeholder groups)?
In order to ground criterion-referenced performance standards in reality, how do youincorporate the use of normative information?
How much training should standard setting panelists receive?
How do you report the sources of error and any adjustments of the standard settingrecommendations?
Fairness, Equity, and Bias. The authors define fairness as essentially the same thing asdifferential validity. However, they go beyond the narrow psychometric concern of differentialvalidity (bias) to include concerns about the educational and social policy that forms the context
v
for the assessment (equity). It is possible for an assessment to be considered unbiased in atechnical sense, yet be used in the service of a policy that does not promote equity.
The point is made that bias can creep into an assessment at various stages throughout thedevelopment, data collection and scoring of an assessment. In order to minimize bias, testdevelopers need to: (1) make sure there is diversity among the developers of the contentframework, test administrators and the scoring panels; (2) require a sound sensitivity review onall assessment materials for sexist, ethnically insensitive, or stereotypic assessment stimuli; and(3) conduct statistical differential item fimctioning studies on all items or performance tasks.
The authors conclude their chapter by discussing the various ways high-stakes large scaleassessments may have unintended negative consequences for poor and minority students. Themajor culprit is that when the stakes are high, educators tend to focus resources on what is tested.This often leads to a narrowing of the curriculum but rise in test scores. Unfortunately, a rise intest scores does not necessarily mean an improvement in the overall quality of education for thegeneral population. When the stakes are high, educators will do the same thing withperformance-type assessments that they used to do with multiple-choice testing. For example,they might exclude more students with disabilities or limited English proficiency so they will notcount in the aggregate summaries, target instruction to students near the cut-scores and ignorethose at the bottom and top, or encourage low achieving students to drop out. Such practices tendto corrupt performance assessments as an indicator and disproportionately impact poor andminority students.
vi
Acknowledgments
This report would not have been possible without the contributions of a great many people.Arnold A. Goldstein provided many helpful comments on the text and organization of the report,and coordinated its production. Maureen Treaty was instrumental in initiating the report andcoordinating between the various authors.
Several people provided careful and insightfi.d reviews of the text. We would like to thankPat de Vito (Rhode Island Department of Education), Emerson J. Elliott (previous Commissionerof Education Statistics), Thomas Fisher (Florida Department of Education), Wayne Martin(Colorado Department of Education), Andrew Porter (University of Wisconsin), and LynnWinters (University of California at Los Angeles), as well as Susan Ahmed, Robert Burton,Andrew Kolstad, Mary Naifeh, and Mary Rollefson, all members of the National Center forEducation Statistics staff.
The final report was prepared by the Media and Information Services Publications Staff.Sirnone Miranda provided carefid editing, Donna DiToto typeset the document, and Phil Carrdesigned the cover and the overall look of the report.
vii

Contents
Foreword . . . . . . . . . . . . . . . . . . . . . . . . . . . . . . . . . . . . . . . . .. iii
Acknowledgments . . . . . . . . . . . . . . . . . . . . . . . . . . . . . . . . . . . ..vii
Chapterl.
Chapter2.
Chapter3.
Chapter4.
Validity of Performance Assessments . . . . . . . . . . . . . . . . . . . . . . 1
Samuel Messick, Educational Testing Service
Generalizability o f P e r f o r m a n c e A s s e s s m e n t s . . . . . . . . . . . . . . . . . 19
Robert L. Brennan, University oflowa
Comparability . . . . . . . . . . . . . . . . . . . . . . . . . . . . . . . ...59
Edward H. Haertel, Stanford Universi@Robert L. Lirm, University of Colorado
Setting Performance Standards for Performance Assessments:Some Fundamental Issues, Current Practice, and Technical Dilemmas . . . . . . . . 79
Richard M. Jaeger, University of North Carolina, GreensboroIna V. S. Mullis, Boston CollegeMary Lyn Bourque, National Assessment Governing BoardSharif Shakrani, National Center for Education Statistics
Chapter 5. Fairness in Large-Scale Performance Assessment . . . . . . . . . . . . . . .117
Lloyd Bond, University of North Carolina, GreensboroPamela Moss, University ofMichiganPeggy Carr, National Center for Education Statistics
ix

Validity of Performance AssessmentsSamuel Messick
Educational Testing Servic;
Validity is an overall evaluative judgment of the degree to which empirical evidence andtheoretical rationales support the adequacy and appropriateness of interpretations and actionsbased on test scores or other modes of assessment (Messick, 1989). Validity is not a property ofthe test or assessment as such, but rather of the meaning of the test scores. These scores are afunction not only of the items or stimulus conditions, but also of the persons responding as wellas the context of the assessment. In particular, what needs to be valid is the meaning orinterpretation of the scores as well as any implications for action that this meaning entails(Cronbach, 1971). The extent to which score meaning and action implications hold acrosspersons or population groups and across settings or contexts is a persistent and perennialempirical question. This is the main reason that validity is an evolving property and validation acontinuing process.
Because evidence is always incomplete, validation is essentially a matter of making the mostreasonable case to guide both current use of the test and current research to advanceunderstanding of what the test scores mean. In other words, validation is basically a matter ofconstructing a network of evidence supporting (or challenging) the intended purpose of thetesting. This chapter addresses the forms of evidence that this network should reasonablyencompass and highlights the need for persuasive arguments or rationales whenever pertinentevidence is foregone.
Introductory GroundworkThe principles of validity apply not just to interpretive and action inferences derived from
test scores as ordinarily conceived, but also to inferences based on any means of observing ordocumenting consistent behaviors or attributes. Thus, the term “score” is used generically hereinits broadest sense to mean any coding or summarization of observed consistencies orperformance regularities on a test, questionnaire, observation procedure, or other assessmentdevice such as work samples, portfolios, and realistic problem simulations.
The Value of Validity
This general usage subsumes qualitative as well as quantitative summaries. It applies, forexample, to behavior protocols, to clinical appraisals, to computerized verbal score reports, andto behavioral or performance judgments or ratings. Hence, the principles of validity apply to allassessments. These include perfomumce assessments which, because of their promise of positiveconsequences for teaching and learning, are becoming increasingly popular as purportedinstruments of standards-based education reform. Indeed, it is precisely because of thesepolitically salient potential consequences that the validity of performance assessment needs to besystematically addressed, as do other basic measurement issues~uch as reliability, comparability,
and fairness. As applied to performance assessment and standard-setting, these issues takentogether constitute the main concern of the present report.
These issues are critical for performance assessment because validity, reliability,comparability, and fairness are not just measurement principles, they are social values that havemeaning and force outside of measurement whenever evaluative judgments and decisions aremade. As a salient social value, validity assumes both a scientific and a political role that can byno means be fulfilled by a simple correlation coefficient between test scores and a purportedcriterion (i.e., classical criterion validity) or by expert judgments that test content is relevant tothe proposed test use (i.e., traditional content validity).
Indeed, broadly speaking, validity is nothing less than an evaluative summary of both theevidence for and the actual as well as potential consequences of score interpretation and use (i.e.,construct validity conceived comprehensively). This comprehensive view of validity integratesconsiderations of content, criteria, and consequences into a construct framework for empiricallytesting rational hypotheses about score meaning and utility. Fundamentally, then, scorevalidation is empirical evaluation of the meaning and consequences of measurement. As such,validation combines scientific inquiry with rational argument to justify (or nullify) scoreinterpretation and use.
Conceptions of Performance AssessmentWe next attempt to clarifi the meaning of performance assessment, because different
conceptions have distinctly different implications for validation. In essence, a performanceassessment requires the student to execute a task or process and bring it to completion (Wiggins,1993). That is, the student performs, creates, or produces something over a sufficient duration oftime to permit evaluation of either the processor the product, or both. This is in contradistinctionto the impoverished trace or storable record resulting when one merely marks a correct orpreferred option on an answer sheet as in a multiple-choice test, which does not reflect theamount or kind of thinking or effort that may underlie the choice of option. The choice of ananswer may reflect recognition or recall, to be sure, but also a worked-through solution orguessing.
Indeed, with respect to task processing, the boundary between multiple-choice (MC) testsand performance assessments is a fhzzy one because some students on many MC items and moststudents on difilcult MC items execute the solution process as a means of selecting theappropriate option (Traub, 1993). A more critical distinction is that the selected option can onlybe appraised for correctness or goodness with respect to a single criterion. There is no record, asin the typical performance assessment, of an extended process or product that can be scored formultiple aspects of quality.
A further complication is that the contrast between MC items and open-ended performancetasks is not a dichotomy, but a continuum representing different degrees of structure versusopenness in the allowable responses. This continuum is variously described as ranging frommultiple-choice to student-constructed products or presentations (Bennett, 1993), for example, orfrom multiple-choice to demonstrations and portfolios (Snow, 1993). Successive interveningstages include items requiring reordering or rearranging, substitution or correction, simple
2
completion or cloze procedures, short essays or complex completions, problem exercises orproofs, teach-back procedures, and long essays.
Apart from multiple-choice, the remainder of the continuum is referred to as involving“student-constructed responses.” However, not all student-constructed responses-notably thoseinvolving rearranging, substitution, and simple completion-e properly considered to beperformance assessments because they do not yield a storable record of an extended process orproduct.
Prototypical performance assessments occur more toward the unstructured end of theresponse continuum and include such exemplars as portfolios of student work over time, exhibitsor displays of knowledge and skill, open-ended tasks with no single correct approach or answer,and hands-on experimentation. The openness with respect to response possibilities enablesstudents to exhibit skills that are difficult to tap within the predefine structures ofmultiple-choice, such as shaping or restructuring a problem, defining and operationalizingvariables, manipulating conditions, and developing alternative problem approaches.
Evaluations of student achievement on such open-ended tasks usually rely on theprofessional judgment of the assessor, and some proponents view such subjectivity of scoring tobe the hallmark of performance assessment (e.g., Frederiksen & Collins, 1989; Stiggins, 1991).However, this view appears too restrictive because some performance tasks can be objectivelyscored and some scoring judgments are amenable to expert-system computer algorithms (e.g.,Bejar, 1991; Sebrechts, Bennett, & Rock, 1991).
A more likely hallmark of educational performance assessments is their nearly universalfocus on higher-order thinking and problem-solving skills. According to Baker, O’Neil, andLinn (1 993), “virtually all proponents of performance-based assessment intend it to measureaspects of higher-order thinking processes” (p. 1211). Indeed, performance assessments ineducation frequently attempt to tap the complex structuring of multiple skills and knowledge,including basic as well as higher-order skills, embedded in realistic or otherwise rich problemcontexts that require extended or demanding forms of reasoning and judgment. In this regard,Wiggins (1993) views “authentic” pefiorrnance assessments as tapping understanding or theapplication of good judgment in adapting knowledge to fashion performances effectively andcreatively.
This mention of authentic assessments broaches a further distinction. Just as performanceassessments are a more open-ended subset of student-constructed responses, so-called authenticassessments are a more realistic subset of performance assessments. In particular, authenticassessments pose engaging and worthy problems (usually involving multistage tasks) in realisticsettings or close simulations so that the tasks and processes, as well as available time andresources, parallel those in the real world. The assessment challenge of complex performancetasks in general and authentic tasks in particular revolves around issues of scoring, interpretation,and generalizable import of key aspects of the complex performance, especially if the task is notcompleted successfully.
In performance assessment, one might start by clarifying the nature of the higher-ordercompetencies or other constructs to be assessed and then select or construct tasks that wouldoptimally reveal them. Or, contrariwise, one might start with an important task that is worthy ofmastery in its own right and ask what competencies or other constructs this task reveals. This
3
contrast embodies a tension in performance assessment between construct-centered andtask-centered approaches (Messick, 1994). However, what is critical in performance assessmentis not what is operative in the task performance but what is captured in the test score andinterpretation. Hence, the validity of the construct interpretati,on needs to be addressed sooner orlater in either approach, as does the nature of convergent and discriminant evidence needed tosustain that validity.
Construct-Driven Versus Task-Driven Performance AssessmentThe task-centered approach to performance assessment begins by identi~ing a worthy task
and then determining what constructs can be scored and how. Often the mastery of such aworthy task functions as the target of the assessment in its own right, as opposed to serving as avehicle for the assessment of knowledge, skills, or other constructs. This might occur, forexample, in an arts contest or an Olympic figure-skating competition or a science fair. In suchcases, replicability and generalizability are not at issue. All that counts is the quality of theperformance or product submitted for evaluation, and the validation focus is on the judgment ofquality. But note that in this usage of performance assessment as target, inferences are not to bemade about the competencies or other attributes of the pefiormers, that is, inferences fromobserved behavior to constructs such as knowledge and skill underlying that behavior.
Large-scale educational projects such as dissertations are often treated as targets in thismanner, by crediting the complex accomplishment as meeting established standards with norequirement of predictiveness or domain generalizability (Baker et al., 1993). However, actionimplications of such complex assessments usually presume, with little or no specific evidence,that there is a global prediction of future success, that the knowledge and skills exhibited in theassessment will enable the student to accomplish a range of similar or related tasks in broadersettings.
In contrast, such presumptions should be confronted by empirical evidence in theperformance assessment of competencies or other constructs+hat is, where the performance isthe vehicle not the target of assessment. A major form of this evidence bears on generalizabilityand transfer which, as we shall see, represent critical aspects of construct validity. In effect, themeaning of the construct is tied to the range of tasks and situations that it generalizes andtransfers to.
The task-centered approach to performance assessment is in danger of tailoring scoringcriteria and rubrics to properties of the task and of representing any educed constructs intask-dependent ways that might limit generalizability. In contrast, the nature of the constructs inthe construct-centered approach guides the selection or construction of relevant tasks as well asthe rational development of construct-based scoring criteria and rubrics. Focussing on constructsalso alerts one to the possibility of construct-irrelevant variance that might distort either the taskperformance or its scoring, or both (Messick, 1994). The task-centered approach is notcompletely devoid of constructs, of course, because task selection is often influenced by implicitconstruct notions or informal theories of learning and performance. The key issue is the extent towhich the constructs guide scoring and interpretation and are explicitly linked to evidencesupporting that interpretation as well as discounting plausible rival interpretations.
4
Sources of InvalidityConstruct-irrelevant variance is one of the two major threats to validity, the other being
construct underrepresentation. A fundamental feature of construct validity is construc[representation, whereby one attempts to identi~ through cognitive-process analysis thetheoretical mechanisms underlying task performance, primarily by decomposing the task intorequisite component processes and assembling them into a functional model (Embretson, 1983).Relying heavily on the cognitive psychology of information processing, construct representationrefers to the relative dependence of task responses on the processes, strategies, and knowledge(including metacognitive or self-knowledge) that are implicated in task petiorrnance.
In the threat to validity known as “construct underrepresentation,” the assessment is toonarrow and fails to include important dimensions or facets of the construct. In the threat tovalidity known as “construct-irrelevant variance,” the assessment is too broad, containing excessreliable variance that is irrelevant to the interpreted construct. Both threats are operative in allassessment. Hence a primary validation concern is the extent to which the same assessmentmight underrepresent the focal construct while simultaneously contaminating the scores withconstruct-inelevant variance.
There are two basic kinds of construct-fielevant variance. In the language of ability andachievement testing, these might be called “construct-irrelevant difllculty” and“construct-irrelevant easiness.” In the former, aspects of the task that are extraneous to the focalconstruct make the task irrelevantly difficult for some individuals or groups. An example is theintrusion of undue reading-comprehension requirements in a test of subject-matter knowledge. Ingeneral, construct-irrelevant dif!llculty leads to construct scores that are invalidly low for thoseindividuals adversely affected (e.g., knowledge scores of poor readers or of exarninees withlimited English proficiency).
In contrast, construct-irrelevant easiness occurs when extraneous clues in item or taskformats permit some individuals to respond correctly or appropriately in ways irrelevant to theconstruct being assessed. Another instance occurs when the specific test material is highlyfamiliar to some respondents, as when the text of a reading comprehension passage iswell-known to some readers or the musical score for a sight-reading exercise invokes awell-drilled rendition from some performers. Construct-irrelevant easiness leads to scores thatare invalidly high for the affected individuals as reflections of the construct under scrutiny.
The concept of construct-irrelevant variance is important in all educational and psychologicalmeasurement, including petiormance assessments. This is especially true of richlycontextualized assessments and authentic simulations of real-world tasks. This is the casebecause, “paradoxically, the complexity of context is made manageable by contextual clues”(Wiggins, 1993, p. 208). And it matters whether the contextual clues that are responded to areconstruct-relevant or represent construct-irrelevant difficulty or easiness.
However, what constitutes construct-irrelevant variance is a tricky and contentious issue(Messick, 1994). This is especially true of petiorrnance assessments, which typically invokeconstructs that are higher-order and complex in the sense of subsuming or organizing multipleprocesses. For example, skill in communicating mathematical ideas might well be consideredirrelevant variance in the assessment of mathematical knowledge (although not necessarily viceversa). But both communication skill and mathematical knowledge are considered relevant parts
5

of the higher-order construct of mathematical power according to the content standardsdeveloped by the National Council of Teachers of Mathematics. It all depends on howcompelling the evidence and arguments are that the particular source of variance is a relevantpart of the focal construct as opposed to affording a plausible rival hypothesis to account for theobserved performance regularities and relationships with other variables.
Authenticity and Directness As Validity Standards
Two terms that appear frequently, and usually in tandem, in the literature of performanceassessment are “authentic” and “direct” assessment. They are most often used in connection withassessments involving realistic simulations or criterion samples. If authenticity and directness areimportant to consider when evaluating the consequences of assessment for student achievement,they constitute tacit validity standards, so we need to address what the labels “authentic” and“direct” might mean in validity terms.
The major measurement concern of authenticity is that nothing important has been left out ofthe assessment of the focal construct. This is tantamount to the familiar validity standard ofminimal construct underrepresentation (Messick, 1994). However, although authenticity impliesminimal construct underrepresentation, the obverse does not hold. This is the case becauseminimal construct underrepresentation does not necessarily imply the close simulation ofreal-world problems and resources typically associated with authenticity in the current literatureon performance assessment. In any event, convergent and discriminant evidence is needed toappraise the extent to which the ostensibly authentic tasks represent (or underrepresent) theconstructs they are interpreted to assess.
The major measurement concern of directness is that nothing irrelevant has been added thatdistorts or interferes with construct assessment. This is tantamount to the familiar validitystandard of minimal construct-irrelevant variance (Messick, 1994). Incidentally, the term “directassessment” is a misnomer because it always promises too much. In education and psychology,“all measurements are indirect in one sense or another” (Guilford, 1936, p. 3). Measurementalways involves, even if only tacitly, intervening processes of judgment, comparison, orinference. The key issue, then, is not directness per se but the minimizing of construct-irrelevantvariance in performance assessment scores.
Aspects of Construct ValidityThe validity issues of score meaning, relevance, utility, and social consequences are many
faceted and intertwined. They are difficult if not impossible to disentangle empirically, which iswhy validity has come to be viewed as a unified concept (APA, 1985; Messick, 1989). Forexample, social consequences provide evidence contributing to score meaning, and utility is bothvalidity evidence and a value consequence. The essence of unified validity is that theappropriateness, meaningfulness, and usefi.dness of score-based inferences are inseparable andthat the integrative power derives from empirically grounded score interpretation.
However, to speak of validity as a unified concept does not imply that validity cannot beusefully differentiated conceptually into distinct aspects to underscore issues and nuances thatmight otherwise be downplayed or overlooked, such as the social consequences of performanceassessments or the role of score meaning in applied use. The intent of these distinctions is to
6
provide a means of addressing fictional aspects of validity that help disentangle some of thecomplexities inherent in appraising the appropriateness, meaningfulness, and usefulness of scoreinferences.
In particular, six distinguishable aspects of construct validity are highlighted as a means ofaddressing central issues implicit in the notion of validity as awnified concept. These arecontent, substantive, structural, generalizability, external, and consequential aspects of constructvalidity. In effect, these six aspects conjointly function as general validity criteria or standardsfor all educational and psychological measurement (Messick, 1989). However, these six aspectsmust not be viewed as separate and substitutable validity types-as the erstwhile trinity ofcontent, criterion, and construct validities often were~ut rather as interdependent andcomplementary forms of validity evidence. As general validity criteri~ they can be specializedfor apt application to performance assessments+ discussed selectively, for example, by Linn,Baker, and Dunbar (1 991) and by Moss (1992)-but none should be ignored.
A brief characterization of these six aspects is presented next followed by six sectionsdiscussing the validity issues and sources of evidence bearing on each aspect:
●
●
●
●
●
●
The content aspect of construct validity includes evidence of content relevance,representativeness, and technical quality (Lennon, 1956; Messick, 1989).
The substantive aspect refers to theoretical rationales for the observed consistencies in testresponses, including process models of task performance (Embretson, 1983), along withempirical evidence that the theoretical processes are actually engaged by respondents in theassessment tasks.
The structural aspect appraises the fidelity of the scoring structure to the structure of theconstruct domain at issue (Loevinger, 1957).
The generalizability aspect examines the extent to which score properties and interpretationsgeneralize to and across population groups, settings, and tasks (Cook& Campbell, 1979;Shulman, 1970), including validity generalization of test-criterion relationships (Hunter,Schmidt, & Jackson, 1982).
The external aspect includes convergent and discriminant evidence frommultitrait-multimethod comparisons (Campbell & Fiske, 1959), as well as evidence ofcriterion relevance and applied utility (Cronbach & Gleser, 1965).
The consequential aspect appraises the value implications of score interpretation as a basisfor action as well as the actual and potential consequences of test use, e~pecially in regard tosources of invalidity related to issues of bias, fairness, and distributive justice (Messick,1980, 1989).
Content Relevance and Representativeness
A key issue for the content aspect of construct validity is the specification of the boundariesof the construct domain to be assessed-that is, determining the knowledge, skills, and otherattributes to be revealed by the assessment tasks. The boundaries and structure of the constructdomain can be addressed by means of job analysis, task analysis, curriculum analysis, anddomain theory (Messick, 1989). If concern is with the application of domain processes in
7
real-world settings, the techniques of job and task analysis should prove usefi,d both indetermining domain structure and in selecting relevant realistic assessment tasks. If concern iswith the learning of domain processes, analyses of curricula and instruction should prove usefulfor determining the construct domain and for selecting assessment tasks attuned to the level ofdeveloping expertise of the learners. Such considerations are especially germane to authenticassessment because they bear on the issue of “authentic to what?”
Both job and curriculum analysis contribute to the development of domain theory, as doesscientific inquiry into the nature of the domain processes and the ways in which they combine toproduce effects or outcomes. A major goal of domain theory is to understand theconstruct-relevant sources of task difficulty, which then serves as a guide to the rationaldevelopment and scoring of performance tasks. At whatever stage of its development, then,domain theory is a primary basis for specifying the boundaries and structure of the construct tobe assessed.
It is also important to make explicit the relationship between the construct domain and theassessment specifications, by formulating what amounts to a test blueprint indicating whether theassessment is to include all components of the construct domain or only part of them. This isimportant because score inferences should be limited to what can be sustained by the assessmentand not casually generalized to a broader construct domain.
Moreover, the description of the construct domain, as well as the assessment specifications,should distinguish them from other similar or related construct domains. Ideally, the descriptionsshould be clear enough so that test developers or other experts can judge whether a task refers toone construct domain or the other. In any even$ as we shall see in the sections on the substantiveand external aspects of construct validity, discriminant evidence needs to be produced showingthat the focal construct is operative in task performance as opposed to similar or relatedconstructs, that is, evidence to discount plausible rival interpretations,
However, it is not sufficient to select tasks that are relevant to the construct domain. Inaddition, the assessment should assemble tasks that are representative of the domain in somesense. The intent is to insure that all important parts of the construct domain are covered (or atleast those subsets included in the assessment specifications). This is usually described asselecting tasks that sample domain processes in terms of their functional importance, or whatBrunswik ( 1956) called ecological sampling. Functional importance can be considered in termsof what people actually do in the performance domain, as in job analyses, but also in terms ofwhat characterizes and differentiates expertise in the domain, which would usually emphasizedifferent tasks and processes.
Both the content relevance and representativeness of assessment tasks are traditionallyappraised by expert professional judgment, documentation of which serves to address the contentaspect of construct validity. However, as we shall see in the next section on the substantiveaspect, such expert judgment is not sufficient because it is not just domain content that needs tobe represented in assessment tasks but domain processes.
In standards-based education reform, two types of assessment standards have beendistinguished. One type is called “content standards,” which refers to the kinds of things astudent should know and be able to do in a subject area. The other type is called “performancestandards,” which refers to the level of competence a student should attain at key stages of
8
developing expertise in the knowledge and skills specified by the content standards. Performancestandards also circumscribe, either explicitly or tacitly, the form or forms of performance that areappropriate to be evaluated against the standards.
From the discussion thus far, it should be clear that not only the assessment tasks but also thecontent standards themselves should be relevant and representative of the construct domain. Thatis, the content standards should be consistent with domain theory and be reflective of thestructure of the construct domain. This is the issue of the construct validity of content standards.There is also a related issue of the construct validity of performance standards. That is,increasing achievement levels or performance standards (as well as the tasks that benchmarkthese levels) should reflect increases in complexity of the construct under scrutiny and notincreasing sources of construct-irelevant difficulty (Messick, 1996). More extensive coverage ofthese and other issues related to standards-based assessment will appear in the subsequentchapter on standard-setting.
Substantive Theories, Process Models, and Process EngagementThe substantive aspect of construct validity emphasizes the role of substantive theories and
process modeling in identi~ing the domain processes to be revealed in assessment tasks(Embretson, 1983; Messick, 1989). Two important points are involved: One is the need for tasksproviding appropriate sampling of domain processes in addition to traditional coverage ofdomain content; the other is the need to move beyond traditional professional judgment ofcontent to accrue empirical evidence that the ostensibly sampled processes are actually engagedby respondents in task performance.
Thus, the substantive aspect adds to the content aspect of construct validity the need forempirical evidence of response consistencies or performance regularities reflective of domainprocesses (Loevinger, 1957). Such evidence may derive from a variety of sources, for example,from “think-aloud” protocols or eye-movement records during task performance, fromcorrelation patterns among part scores, from consistencies in response times for task segments,or from mathematical or computer modeling of task processes (Messick, 1989, pp. 53-55; Snow& Lehman, 1989). In sum, the issue of domain coverage refers not just to the contentrepresentativeness of the construct measure but also to the process representation of the constructand the degree to which these processes are reflected in construct measurement.
Another issue is the extent to which the assessed task processes correspond to domainprocesses, as opposed to being distorted by sources of irrelevant method variance. This dependson whether the assessment tasks mimic or simulate the domain conditions with sufllcientcomprehensiveness and fidelity to engage the domain processes with minimal distortion, whichis a primary aim of authentic assessment. The point here is that empirical evidence is needed toassure that the higher-order thinking processes that authentic assessments aspire to address areactually operative in task performance. For example, for some individuals the task performancemight not reflect problem solving, but rather a memorized solution. As another instance, a verbalreasoning task might be failed by some respondents because of inadequate verbal knowledgerather than poor inductive inference. The test user is in the best position to evaluate the meaningof individual scores under the specific applied circumstances, that is, to appraise the extent towhich the intended score meaning might have been eroded by contaminating variables operatinglocally.
9
The core concept bridging the content and substantive aspects of construct validity isrepresentativeness. This becomes clear once one recognizes that the term “representative” hastwo distinct meanings, both of which are applicable to performance assessment. One is in thecognitive psychologist’s sense of representation or modeling fSuppes, Pavel, & Falmagne,1994); the other is in the Brunswikian sense of ecological sampling (Brunswik, 1956; Snow,1974). The choice of tasks or contexts in assessment is a representative sampling issue, which iscentral to the content aspect of construct validity. The comprehensiveness and fidelity ofsimulating the construct’s realistic engagement in performance is a representation issue, which iscentral to the substantive aspect. Both issues are important in performance assessment; they arecritical to the very meaning of authentic assessment.
Scoring Models As Reflective of Task and Domain StructureAccording to the structural aspect of construct validity, scoring models should be rationally
consistent with what is known about the structural relations inherent in behavioral manifestationsof the construct in question (Loevinger, 1957; Peak, 1953). That is, the theory of the constructdomain should guide not only the selection or construction of relevant assessment tasks, but alsothe rational development of construct-based scoring criteria and rubrics.
Ideally, the manner in which behavioral instances are combined to produce a score shouldrest on knowledge of how the processes underlying those behaviors combine dynamically toproduce effects. Thus, the internal structure of the assessment (i.e., interrelations among thescored aspects of task and subtask performance) should be consistent with what is known aboutthe internal structure of the construct domain (Messick, 1989). This property of construct-basedrational scoring models is called “structural fidelity” (Loevinger, 1957).
To the extent that different assessments (i.e., those involving different tasks or differentsettings or both) are geared to the same construct domain, using the same scoring model as wellas scoring criteria and rubrics, then the resultant scores are likely to be comparable or can berendered comparable using equating procedures. To the degree that the different assessments donot adhere to the same specifications, then score comparability is jeopardized but can bevariously approximated using calibration, projection, and moderation procedures (Mislevy,1992).
Score comparability is clearly important for normative or accountability purposes wheneverindividuals or groups are being ranked. However, score comparability is also important evenwhen individuals are not being directly compared, but are held to a common standard. Scorecomparability of some type is needed to sustain the claim that two individual performances insome sense meet the same local, regional, national, or international standard. These issues areaddressed more filly in the subsequent chapter on comparability.
Generalizability and the Boundaries of Score Meaning
The concern that a performance assessment should provide representative coverage of thecontent and processes of the construct domain is meant to insure that the score interpretation notbe limited to the sample of assessed tasks but be generalizable to the construct domain morebroadly. Evidence of such generalizability depends on the degree of correlation of the assessedtasks with other tasks representing the construct or aspects of the construct. For example, how
10
well one can generalize from a sample of writing about a particular topic in a particular genre toskill in writing about other topics in the same or different genre depends on the pattern ofcorrelations among different topic and genre scores. This issue of generalizability of scoreinferences across tasks and contexts goes to the very heart of score meaning. Indeed, setting theboundaries of score meaning is precisely what generalizability evidence is meant to address.
However, because of the extensive time required for the typical performance task, there is aconflict in performance assessment between time-intensive depth of examination and the breadthof domain coverage needed for generalizability of construct interpretation. This conflict isusually addressed by means of a variety of trade-offs. For example, one suggestion is to increasethe number of petiormance assessments for each student or to increase the number of tasks ineach assessment. Here the trade-off is between breadth of coverage and nonassessmentinstructional activities that might instead have filled the extended testing time.
Another suggestion is to use a matrix-sampling design with different performance tasksadministered to different samples of students. Here the gain in breadth of coverage comes at theexpense of individual student scores or, at least, of comparable individual scores. Nonetheless,matrix sampling is especially useful when the accountability concern focuses on some aggregatelevel of inference such as the school, district, state, or nation. Another approach is to developassessments that represent a mix of efficient structured exercises broadly tapping multipleaspects of the construct and time-intensive open-ended tasks tapping integral aspects in depth(Messick, 1994), which involves a trade-off between the number of performance tasks and thenumber of brief structured exercises. The internal structure of interrelations among the brieferexercises and performance tasks bears on the substantive and especially the structural aspect ofconstruct validity. Such structures undergird and guide decisions as to how responses should beaggregated into composite or multiple scores to represent the construct.
This conflict between depth and breadth of coverage is often viewed as entailing a trade-offbetween validity and reliability (or generalizability). It might better be depicted as a trade-offbetween the valid description of the specifics of a complex task and the power of constructinterpretation. In any event, as Wiggins (1993) stipulates, such a conflict signals a designproblem that needs to be carefully negotiated in performance assessment.
In addition to generalizability across tasks, the limits of score meaning are also affected bythe degree of generalizability across time or occasions and across observers or raters of the taskperformance. Such sources of measurement error associated with the sampling of tasks,occasions, and scorers underlie traditional reliability concerns; they are examined in more detailin the subsequent chapter on generalizability.
Convergent and Discriminant Correlations with External Variables
The external aspect of construct validity refers to the extent to which the assessment scores’relationships with other measures and nonassessment behaviors reflect the expected high, low,and interactive relations implicit in the theory of the construct being assessed. Thus, the meaningof the scores is substantiated externally by appraising the degree to which empirical relationshipswith other measures, or the lack thereof, is consistent with that meaning. That is, the constructsrepresented in the assessment should rationally account for the external pattern of correlations.
11
The external aspect emphasizes two intertwined sets of relationships for the assessmentscores: one between the task scores and different methods for measuring both the same anddistinct constructs, and the other between measures of the focal construct and exemplars ofdifferent constructs predicted to be variously related to it on $eoretical grounds. Theoretically,expected empirical consistencies in the first set include both convergent and discriminantcorrelation patterns, the convergent pattern indicating a correspondence between measures of thesame construct and the discriminant pattern indicating a distinctness from measures of otherconstructs. These patterns are often displayed in what is called a multitrait-multimethod matrix(Campbell & Fiske, 1959).
Convergent evidence signifies that the measure in question is coherently related to othermeasures of the same construct as well as to other variables that it should relate to on theoreticalgrounds. Discriminant evidence signifies that the measure is not unduly related to exemplars ofother distinct constructs. Discriminant evidence is particularly critical for discounting plausiblerival alternatives to the focal construct interpretation. Both convergent and discriminant evidepceare basic to construct validation.
Theoretically, expected consistencies in the second set of relationships mentioned aboveindicate a Iawfid relatedness between measures of different constructs. This lawful relatednesshas been referred to as “nomological validity” by Campbell (1 960) and as “nomothetic span” byEmbretson (1983). The basic notion of nomological validity is that the theory of the constructbeing addressed provides a rational basis for deriving empirically testable links between theassessment task scores and measures of other constructs. Corroborative evidence helps tovalidate both the assessment and the construct theory. The assessment gains credence to theextent that the score correlations reflect theoretical implications of the construct, while theconstruct theory gains credence to the extent that score data jibe with its predictions.
Among the relationships fhlling within the purview of nomological validity or nomotheticspan are those between the assessment scores and criterion measures pertinent to selection,placement, licensure, program evaluation, or other accountability purposes in applied settings.Once again, the construct theory points to the relevance of potential relationships between theassessment scores and criterion measures, and empirical evidence of such links attests to theutility of the scores for the applied purpose,
The issue of utility is evaluated in terms of the benefits or desired outcomes of theassessment relative to its costs (Cronbach & Gleser, 1965; Messick, 1989). Thus, although thecost of performance assessments in terms of time and resources is an important consideration,the choice among alternative assessment approaches should not be determined solely by cost orefficiency. Rather, such decisions should weigh both the costs and the benefits of the assessment,that is, its utility for the applied purpose.
Consequences as Validity EvidenceBecause performance assessments promise potential benefits for teaching and learning, it is
important to accrue evidence of such positive consequences as well as evidence that adverseconsequences are minimal. In this connection, the consequential aspect of construct validityincludes evidence and rationales for evaluating the intended and unintended consequences ofscore interpretation and use in both the short- and long-term. Particularly prominent is the
12
evaluation of any adverse consequences for individuals and groups, especially gender andracial/ethnic groups, that are associated with bias in scoring and interpretation or with unfairnessin test use. However, this form of evidence should not be viewed in isolation as a separate typeof validity, say, of “consequential validity.” Rather, because the values served in the intendedand unintended outcomes of test interpretation and use both derive from and contribute to themeaning of the test scores, appraisal of social consequences of the testing is also seen to besubsumed as an aspect of construct validity (Messick, 1964, 1975, 1980).
The primary measurement concern with respect to adverse consequences is that any negativeimpact on individuals or groups should not derive from any source of test invalidity such asconstruct underrepresentation or construct-irrelevant variance (Messick, 1989). That is, lowscores should not occur because the assessment is missing something relevant to the focalconstruct that, if present, would have permitted the affected students to display their competence.Moreover, low scores should not occur because the measurement contains something irrelevantthat interferes with the affected students’ demonstration of competence.
However, reducing adverse impact associated with sources of test invalidity does not meanthat there would necessarily be less adverse impact associated with the valid description ofexisting group differences. For example, a possible unintended consequence of performanceassessment in education is increased adverse impact for gender and racial/ethnic groups becauseof short-term misalignments in their educational experiences vis-a-vis authentic testing andteaching. If found, one should monitor the situation to see how short-term it is likely to be andwhat resources are needed to redress the new imbalance. Positive and negative consequences ofassessment, whether intended or unintended, are discussed in more depth in the subsequentchapter on fairness.
Aspects of Validity Specialized for Performance AssessmentSome proponents of performance assessment have proposed specialized validity criteria
tailored for performance tasks (Frederiksen & Collins, 1989; Linn et al, 1991). In effect, thesespecialized criteria emphasize selected issues in some but not all of the six general validityaspects just described as they are applied to performance tasks (Messick, 1994; Moss, 1992).However, a few of these specialized criteria highlight different perspectives that warrant furthercomment. Especially important because it is at the heart of authentic assessment in education iswhat Linn and his colleagues (1991) call “meaningfulness” and what Frederiksen and Collins(1989) call “transparency.” The concern here is that if the assessment itself is to be a worthwhileeducational experience serving to motivate and direct learning, then the problems and tasksposed should be meaningful to the students and communicate clearly what is expected of them.That is, not only should students know what knowledge and skills are being assessed, but thecriteria and standards of good performance should be clear to them, in terms of both how theperformance is to be scored and what steps might be taken to improve performance. In thissense, the criteria and standards of successful performance are transparent or demystified andhence should be more readily internalized by students as self-directive goals (Baron, 1991;Wiggins, 1993).
Evidence needs to be accrued, of course, that the performance tasks are meaningful and thatthe performance standards are understood and facilitate learning, because the meaningfidness ortransparency of performance assessments cannot be taken for granted. Such evidence is also
13
pertinent to the substantive and consequential aspects of construct validity. Moreover, there areimportant instances where transparency may be counterproductive, namely, where noveltyoccurs in the task performance that is not amenable to the transparent standards of goodness.Indeed, the very salience of the transparent standards might hamper the generation of novelty. Insuch cases, the challenge is to transform the standards or to develop new ones. That is,transparency and creativity may be in conflict.
A concept closely related to meaningfulness is what Frederiksen and Collins (1 989) call“systemic validity.” Their point is that as instruments of education reform, pefiormance testsshould “induce curricular and instructional changes in educational systems (and learning strategychanges in students) that foster the development of the cognitive traits that the tests are designedto measure” (p. 27). However, because interpretation of such teaching and learning consequencesas reflective of test validity (or invalidity) assumes that all other aspects of the educationalsystem are working well or are controlled, the use of the label “systemic validi~” is problematic.It might better be called “systemic facilitation” because in practice the issue is not just thesystemic validity of the tests but, rather, the validity of the system as a whole for improvingteaching and learning. In any event, the concept of systemic validity is a specialized instance ofthe consequential aspect of construct validity because it focuses on one type of testingconsequence —indeed, on one type of systemic consequence-among many (Messick, 1989, p.85).
Validity As Integrative SummaryThese six aspects of construct validity apply to all educational and psychological
measurement, including performance assessments. Taken together, along with aspects of validityspecialized for performance assessments such as meaningfulness or transparency, they provide away of addressing the multiple and interrelated validity questions that need to be answered injustifying score interpretation and use. They are highlighted because most score-basedinterpretations and action inferences, as well as the elaborated rationales or arguments thatattempt to legitimize them (Kane, 1992), either invoke these properties or assume them,explicitly or tacitly. That is, most score interpretations refer to relevant content and operativeprocesses, presumed to be reflected in scores that concatenate responses in domain-appropriateways and are generalizable across a range of tasks, settings, and occasions. Furthermore,score-based interpretations and actions are typically extrapolated beyond the test context on thebasis of presumed or documented relationships with nontest behaviors and anticipated outcomesor consequences.
The challenge in test validation is to link these inferences to convergent evidence supportingthem as well as to discriminant evidence discounting plausible rival inferences. Evidencepertinent to all of these aspects needs to be integrated into an overall validity judgment to sustainscore inferences and their action implications, or else provide compelling reasons why not,which is what is meant by validity as a unified concept.
OverviewThe traditional conception of validity divided it into three separate and substitutable
types-namely, content, criterion, and construct validities. This view is fragmented and
14
incomplete, especially in failing to take into account evidence of the value implications of scoremeaning as a basis for action and of the social consequences of score use. The new unifiedconcept of validity interrelates these issues as fundamental aspects of a more comprehensivetheory of construct validity addressing both score meaning and social values in both testinterpretation and test use. That is, unified validity integrates ~onsiderations of content, criteria,and consequences into a construct framework for empirically testing rational hypotheses aboutscore meaning and theoretically relevant relationships, including those of both an applied and ascientific nature. Six distinguishable aspects of construct validity are highlighted as a means ofaddressing central issues implicit in the notion of validity as a unified concept. These arecontent, substantive, structural, generalizability, external, and consequential aspects of constructvalidity. These six aspects are not separate and substitutable validity types, as in the traditionalvalidity conception, but rather are interdependent and complementary forms of evidence in theunified view of validity. In effec~ these six aspects together fhnction as general validity criteriaor standards for all educational and psychological measurement, including performanceassessments.
15
References
American Psychological Association, American Educational Research Association, & NationalCouncil on Measurement in Education. (1985). Standards for educational andpsychologicaltesting. Washington, DC: American Psychological Association.
Aschbacher, P. R. (1991). Performance assessment: State activity, interest, and concerns.Applied Measurement in Education, 4,275-288.
Baker, E. L., O’Neil, H. F., Jr., & Linn, R. L. (1993). Policy and validity prospects forperformance-based assessment. American Psychologist, 48, 1210-1218.
Baron, J. B. (1991). Strategies for the development of effective performance exercises. AppliedMeasurement in Education, 4,305-318.
Bejar, I. I. (1991). A methodology for scoring open-ended architectural design problems.Journal of Applied Psychology, 76,522-532.
Bennett, R.E.(1993). On the meaning of constructed response. In R. E. Bennett & W. C. Ward,Jr. (Eds.), Construction versus choice in cognitive measurement: Issues in constructedresponse, performance testing, andportfolio assessment (pp. 1-27). Hillsdale, NJ: Erlbaum.
Brunswik, E. (1956). Perception and the representative design ofpsychological experiments(2nd cd.). Berkeley, CA: University of California Press.
Campbell, D. T. (1960). Recommendations for APA test standards regarding construct, trait, ordiscriminant validity. American Psychologist, 15,546-553.
Campbell, D. T., & Fiske, D. W. (1959). Convergent and discriminant validation by themultitrait-multimethod matrix. Psychological Bullerin, 56, 81-105.
Cook, T. D., & Campbell, D. T. (1979). Quasi-experimentation: Design and analysis issues forjieldsettings. Chicago: Rand McNally.
Cronbach, L. J. (1971), Test validation. In R. L. Thorndike (Ed.), Educational measurement(2nd cd., pp. 443-507). Washington, DC: American Council on Education.
Cronbach, L. J., & Gleser, G. C. (1965). Psychological tes[s andpersonnel decisions (2nd cd.).Urbana, IL: University of Illinois Press.
Embretson (Whitely), S. (1983). Construct validity: Construct representation versus nomotheticspan. Psychological Bulletin, 93, 179-197.
Frederiksen, J. R., & Collins, A. (1989). A systems approach to educational testing. EducationalResearcher, 18(9), 27-32.
Guilford, J. P. (1936). Psychometric methods. New York: McGraw-Hill.
Hunter, J. E., Schmidt, F. L., & Jackson, C. B. (1982). Advanced meta-analysis: Quantitativemethods of cumulating research findings across studies. San Francisco: Sage.
Kane, M. T. (1992). An argument-based approach to validity. Psychological Bulletin, ]12,527-535.
16
Lennon, R. T. (1956). Assumptions underlying the use of content validity. Educational andPsychological Measurement, 16,294-304.
Linn, R. L., Baker, E. L., & Dunbar, S. B. (1991). Complex, performance-based assessment:Expectations and validation criteria. Educational Researcher, 20(8), 15-21.
Loevinger, J. (1957). Objective tests as instruments of psychological theory. PsychologicalReports, 3,635-694 (Monograph Supplement 9).
Messick, S. (1964). Personality measurement and college performance. Proceedings of the 1963Invitational Conference on Tes[ing Problems (pp. 110-129). Princeton, NJ: EducationalTesting Service. (Reprinted in A. Anastasi (Ed.). (1966). Testingproblems in perspective (pp.557-572). Washington, DC: American Council on Education.)
Messick, S. (1975). The standard problem: Meaning and values in measurement and evaluation.American P~chologist, 30,955-966.
Messick, S. (1980). Test validity and the ethics of assessment. American Psychologist, 35,1012-1027.
Messick,S.(1989). Validity. In R. L, Linn (Ed.), Educational measurement (3rd cd., pp.13-1 03). New York: Macmillan.
Messick, S. (1994). The interplay of evidence and consequences in the validation of performanceassessments. Educational Researcher, 23(2), 13-23.
Messick, S. (1996). Standards-based score interpretation: Establishing valid grounds for validinferences. Proceedings of the joint conference on standard setting for large-scaleassessments, Sponsored by National Assessment Governing Board and The National Centerfor Education Statistics. Washington, DC: Government Printing OffIce.
Mislevy, R. J. (1992). Linking educational assessments: Concepts, issues, methods, andprospects. Princeton, NJ: ETS Policy Information Center.
Moss, P. A. (1992). Shifting conceptions of validity in educational measurement: Implicationsfor performance assessment. Review of Educational Research, 62,229-258.
Peak, H. (1953). Problems of observation. In L. Festinger & D. Katz (Eds.), Research merhodsin the behavioral sciences (pp. 243-299). Hinsdale, IL: Dryden Press.
Sebrechts, M. M., Bennett, R. E., & Rock D. A. (1991). Agreement between expert system andhuman raters’ scores on complex constructed-response quantitative items. Journal of AppliedPsycholo~, 76,856-862.
Shulman, L. S. (1970). Reconstruction of educational research. Review of Educational Research,40,371-396.
Snow, R. E. (1974). Representative and quasi-representative designs for research on teaching.Review of Educational Research, 44,265-291.
Snow, R. E. (1993). Construct validity and constructed response tests. In R. E. Bennett & W. C,Ward, Jr. (Eds.), Construction versus choice in cognitive measurement: Issues in constructedresponse, performance testing, andportfolio assessment (pp. 45-60). Hillsdale, NJ: Erlbaum.
17
Snow, R. E., & Lehman, D. F. (1989). Implications of cognitive psychology for educationalmeasurement. In R. L. Linn (Ed.), Educational measurement (3rd cd., pp. 263-331). NewYork: Macmillan.
Stiggins, R. J. (1991). Facing the challenges of a new era of educational assessment. AppliedMeasurement in Education, 4,263-273.
Suppes, P., Pavel, M., & Falmagne, J-C. (1994). Representations and models in psychology.Annual Review of Psychology, 45,517-544.
Traub, R. E. (1993). On the equivalence of the traits assessed by multiple-choice andconstructed-response tests. In R. E. Bennett & W. C. Ward, Jr. (Eds.), Construction versuschoice in cognitive measurement: Issues in constructed response, performance testing, andpor$olio assessment (pp. 45-60). Hillsdale, NJ: Erlbaum.
Wiggins, G. (1993). Assessment: Authenticity, context, and validity. Phi Delta Kappan, 75,200-214.
18
Generalizability of Performance AssessmentsRobert L. BrennanUniversity of Iowa

Historically, in psychology and education, reliability issues have been addressed
principally using classical test theory, which postulates that an observed score can be
decomposed into a “true” score and a single, undifferentiated random error term, E (see
Feldt & Brennan, 1989). Generalizability theory liberalizes classical theory by providing
models and methods that allow an investigator to disentangle multiple sources of emor
that conrnbute to E. This is accomplished in part through the application of certain
analysis of variance (ANOVA) methods.
The purposes of this chapter are: (a) to provide an overview of those aspects of
the conceptual frame work and methods of generalizability theory that are particularly
relevant to performance assessments; (b) to integrate the current literature on the
reliability of performance assessments into the framework of generalizability theory; and
(c) to aid researchers and practitioners in the assessment of the generalizability of
performance assessments. Reliability/generalizability coefficients are considered as well
as error variances and standard errors of measurement. In addition, the generalizability of
both individual scores and group mean scores is discussed.
Generalizabilitv Theorw Basic Conce~ts
In a sense, classical test theory and ANOVA can be viewed as the parents of
generalizability theory. However, generalizability theory has a unique conceptual
framework. Among the concepts in this framework are universes of admissible
observations and G (Generalizability) studies, as well as universes of generalization and
D (Decision) srudies.
An extensive, in depth explication of the concepts and methods of
generalizability theory is provided by Cronbach, Gleser, Nanda, and Rajaratnam (1972).
Brennan (1992a) provides a somewhat less detailed treatment. Overviews of essential
features of generalizability theory are provided by Feldt and Brennan ( 1989), and
Shavelson and Webb (1991). An introduction is provided by Brennan (1992b). Brennan
and Johnson (1995) use generalizability theoty to treat some of the issues covered in
21
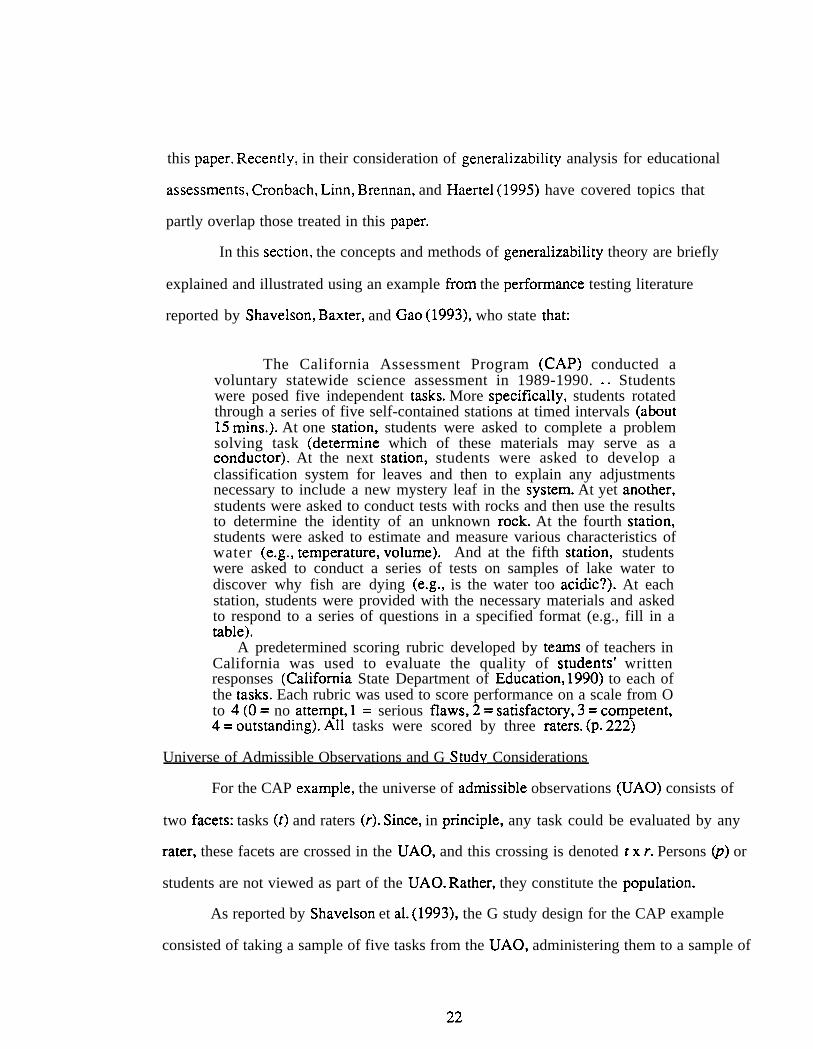
this paper. Recently, in their consideration of generalizability analysis for educational
assessments, Cronbach, Linn, Brennan, and Haertel (1995) have covered topics that
partly overlap those treated in this paper.
In this section, the concepts and methods of generalizability theory are briefly
explained and illustrated using an example horn the performance testing literature
reported by Shavelson, Baxter, and Gao (1993), who state that:
The California Assessment Program (CAP) conducted avoluntary statewide science assessment in 1989-1990. . . Studentswere posed five independent tasks. More specifically, students rotatedthrough a series of five self-contained stations at timed intervals (about15 reins.). At one station, students were asked to complete a problemsolving task (determine which of these materials may serve as aconductor). At the next station, students were asked to develop aclassification system for leaves and then to explain any adjustmentsnecessary to include a new mystery leaf in the system. At yet another,students were asked to conduct tests with rocks and then use the resultsto determine the identity of an unknown rock. At the fourth station,students were asked to estimate and measure various characteristics ofwater (e.g., temperature, volume). And at the fifth station, studentswere asked to conduct a series of tests on samples of lake water todiscover why fish are dying (e.g., is the water too acidic?). At eachstation, students were provided with the necessary materials and askedto respond to a series of questions in a specified format (e.g., fill in atable).
A predetermined scoring rubric developed by teams of teachers inCalifornia was used to evaluate the quality of students’ writtenresponses (California State Department of Education, 1990) to each ofthe tasks. Each rubric was used to score performance on a scale from Oto 4 (O = no attempt, 1 = serious flaws, 2 = satisfactory, 3 = competent,4 = outstanding). All tasks were scored by three raters. (p. 222)
Universe of Admissible Observations and G Studv Considerations
For the CAP example, the universe of admissible observations (UAO) consists of
two facets: tasks (t) and raters (r). Since, in principle, any task could be evaluated by any
rater, these facets are crossed in the UAO, and this crossing is denoted t x r. Persons (p) or
students are not viewed as part of the UAO. Rather, they constitute the population.
As reported by Shavelson et al. (1993), the G study design for the CAP example
consisted of taking a sample of five tasks from the UAO, administering them to a sample of
22
persons, and then hoving three raters evaluate all products/results produced by all persons.
This is a verbal description of a fully crossed G Study p x t x r design.
Strictly speaking, for the CAP example, the G study is a random effects G study
because the authors assumed that the potential set of tasks and raters in the UAO were both
indefinitely large, with the actual tasks and raters in the G study viewed as samples from the
UAO.
G studv variance components. The principal results of a G study are estimated
variance components for each of the effects in a G study design. These estimates are
obtained using analysis of variance procedures (see Brennan, 1992a, for details). For the
CAP example, the estimated variance components are reported in the second column of
Table 1. For example, the estimated variance component for persons is ~ =.298, and the
estimated variance component for the interaction of persons and tasks is Y( =.493.
The variance component for persons can be interpreted in the following manner.
Suppose an investigator could obtain each person’s mean (or expected value) over ~ tasks
and raters in the UAO. The variance of these scores would be ~, which is estimated to be
~ =.298 for the CAP data. Similarly, # =.003 is the estimated variance of rater mean
scores, where each mean (or expected value) is over all persons in the population and all
tasks in the UAO. The estimated variance of task mean scores in the UAO is 6: =.092,
which suggests that tasks differ somewhat in difficulty.
Interaction variance components are somewhat more difficult to interpret. Consider,
for example, ~t in the CAP example. The fact that ~t =.493 is considerably greater than
zero suggests that there is a considerably different rank ordering of person mean scores for
each of the various tasks in the UAO. By contrast, the fact that ~r = O means that the
various raters rank order persons similarly. Also, #t =.002 suggests that the various raters
23
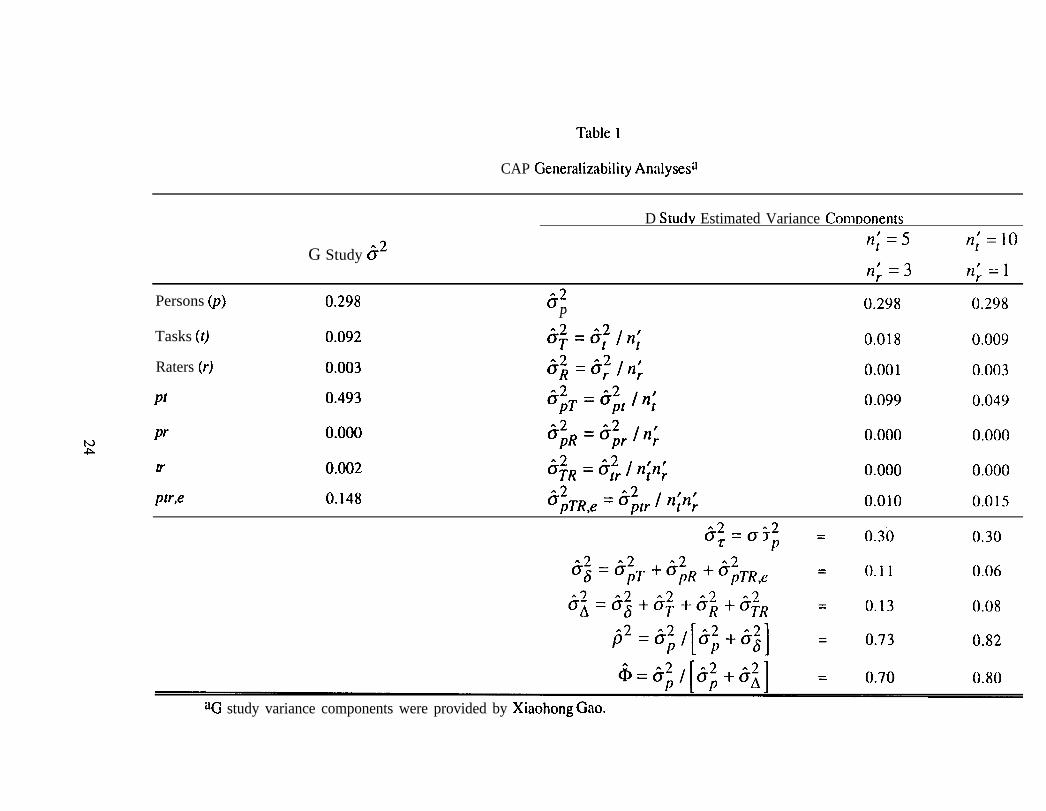
T~ble 1
CAP Generalizability Analysesfl
D Studv Estimated Variance Com~onents
n~=5 n; =10G Study 62
n~=3 nj=l
Persons (p) 0.298 02A
P0.298 0.298
Tasks (t) 0.092 &; =&fJn~ 0.018 0.009
Raters (r) 0.003 ~: =bj!ln~ 0.001 0.003
pl 0.493 0.099 0.049
pr 0.000 &;R =&& /n; 0.000 0.000:
tr 0.002 &;R = iii / n;n~ 0.000 0.000
ptr,e 0.148 6~TR,e = h&. I n~n~ 0.010 0.015
b: “; ==0 ().30 0.30
().()6
().08
0.82
aG study variance components were provided by Xiaohong Gao.
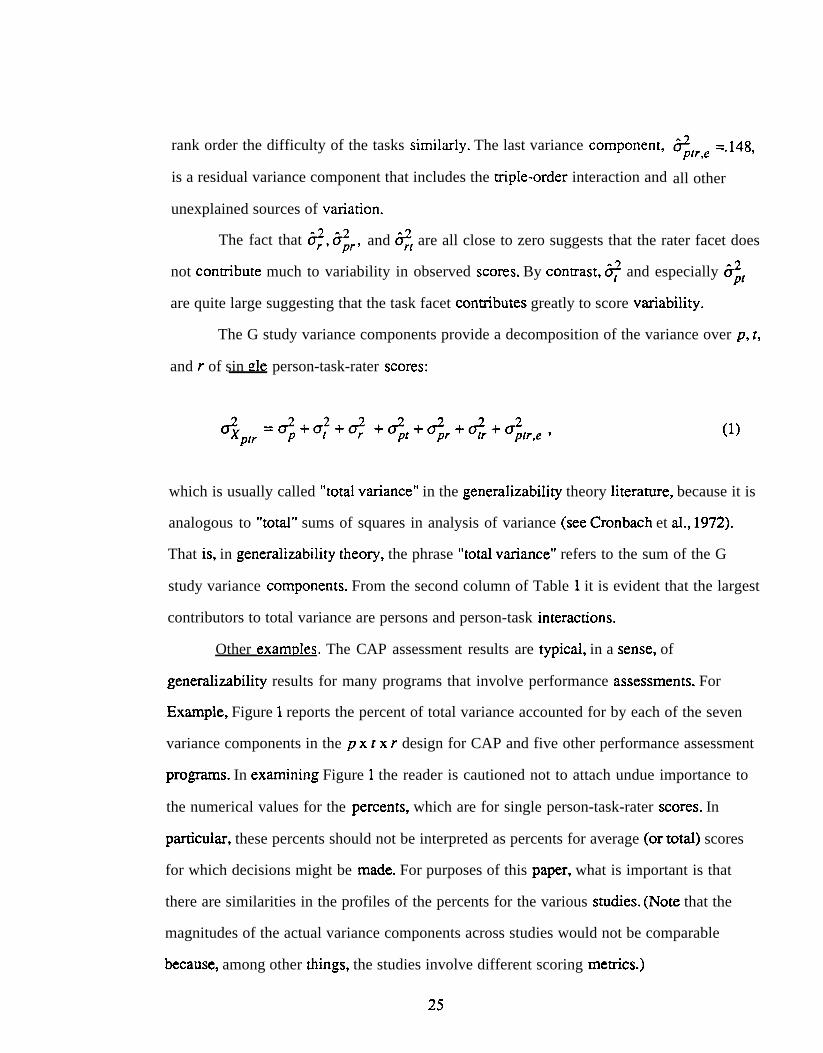
rank order the difficulty of the tasks similady. The last variance component,
is a residual variance component that includes the rnple-order interaction and
unexplained sources of variation.
~,,,, =.148,
all other
The fact that ~, b~r, and ~f are all close to zero suggests that the rater facet does
not conrnbute much to variability in observed scores. By contrast, ~ and especially ~~t
are quite large suggesting that the task facet conrnbutes greatly to score variability.
The G study variance components provide a decomposition of the variance over p, t,
and r of sin de person-task-rater scores:
(1)
which is usually called “total variance” in the generalizability theory literature, because it is
analogous to “total” sums of squares in analysis of variance (see Cronbach et al., 1972).
That is, in generalizability theory, the phrase “total variance” refers to the sum of the G
study variance components. From the second column of Table 1 it is evident that the largest
contributors to total variance are persons and person-task interactions.
Other examrdes. The CAP assessment results are typical, in a sense, of
generalizability results for many programs that involve performance assessments. For
Example, Figure 1 reports the percent of total variance accounted for by each of the seven
variance components in the p x r x r design for CAP and five other performance assessment
programs. In examining Figure 1 the reader is cautioned not to attach undue importance to
the numerical values for the percents, which are for single person-task-rater scores. In
particular, these percents should not be interpreted as percents for average (or total) scores
for which decisions might be made. For purposes of this paper, what is important is that
there are similarities in the profiles of the percents for the various studies. (Note that the
magnitudes of the actual variance components across studies would not be comparable
because, among other things, the studies involve different scoring merncs.)
25
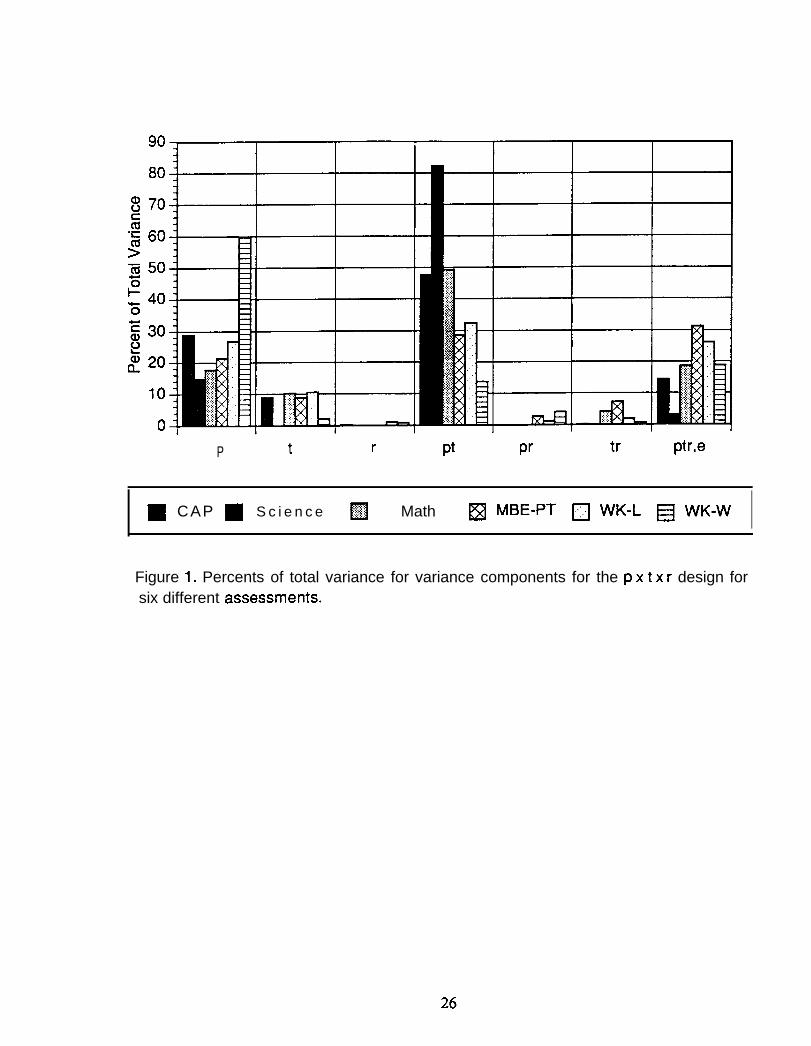
90
80
70
60
50
40
30
20
10
0
P t r pt pr tr ptr,e
■ CAP ❑ S c i e n c e ❑ Math ❑ MBE-PT ❑ WK-L ❑ WK-W IFigure 1. Percents of total variance for variance components for the p x t x r design forsix different assessments.
The science and math assessments are discussed by Shavelson et al. (1993) in the
same article in which CAP is treated. The MBE-PT results are from a generalizability
analysis of performance tasks for possible inclusion in the Multistate Bar Examination
(MBE) used by many states to admit candidates to the practice of law (see Gamache &
Brennan, 1994). The WK-L and WK-W are for Listening (L) and Writing (W) tests for a
new program called Work Keys (WK) being developed by American College Testing (see
Brennan, Gao, & Colton, 1995).
For all programs the rater facet conrnbutes relatively little to total variance for single
person-task-rater observations, as evidenced by the fact that ~~, Y,, and ~r are all
relatively small. It is also evident that for all programs ~ is small suggesting that tasks are
quite similar in average difficulty.
Perhaps most importantly, however, it is clear from Figure 1 that %Pt is larger than
~ for all assessments except WK-W and, indeed, %, is the largest of all the variance
components for CAP, Science, Math, and WK-L. The relatively large magnitude of #pt
suggests that there is only a limited degree of across-task generalizability. A similar
conclusion has been reported for other programs by Baker ( 1992), Dunbar, Koretz, &
Hoover (199 1), Lane, Stone, Ankenmann, and Liu (1992), Linn (1993), Linn and Burton
(1994), van der Vleuton and Swanson (1990), and Welch (1991) among others. 1
For the p x r x r design considered thus far, each rater evaluates all tasks pexformed
by all persons. Sometimes, of course, such a design is not logistically or administratively
feasible. A common alternative is a design in which different raters evaluate each task. For
such a design, raters are nested within task, the design is denoted p x (r:t), and there are five
variance components: o;, $,$.1, ~Pt, and o~yl,e. For example, this design is employed
27
operationally in the writing assessmem component of the EXPLORE Program (ACT, 1994).
For EXPLORE, the average over forms of the estimated variance components is:
~ =.47,@ =.05,~.l =.00,~, =.52, and %,.,,, =.27. Again h~, is the largest variance
component, and the rater facet conrnbutes little to total variance.
Infinite Universe of Generalization and D Studv Considerations
Effectively, Equation 1 states that G study variance components provide a
decomposition of the total observed score variance for sinde person-task-rater scores. Let
nP, nf, and nr be the G study sample sizes for persons, tasks, and raters, respectively. Then,
for the CAP example, the total observed score variance is the variance of the np nt nr
observed scores, each of which could be O, 1, 2, 3, or 4. In practice, of course, decisions
about persons (the objects of measurement) will not likely be made based on persons’ scores
for a sinde task evaluated by a sinde rater. Rather, decisions will be made based on
average scores over multiple tasks andlor raters. Indeed, a typical D (Decision) study
consideration is to identify values of n; and n; (which need not equal nf and nr,
respectively) that result in acceptably small error variance and/or acceptably large
reliability-like coefficients.
Another D study consideration is the specification of a universe of generalization
(UG), which is the universe to which a decision maker wants to generalize. In this section it
will be assumed that the UG mirrors the UAO in the sense that the task and rater facets are
both infinite. Strictly speaking, this means that the UG is a universe of randomlv parallel
forms of the measurement procedure, where each such form consists of a different sample of
tasks and a different sample of raters. (In a subsequent section, a resrncted UG is
considered that is smaller than the infinite UG.) A person’s universe score is his or her mean
(or expected) score over all randomly parallel fotms of the measurement procedure in the
UG. As such, universe score is analogous to true score in classical theory.
An additional D study consideration is the design structure of the D study. In this
section, it will be assumed that the D study design mirrors the G study design in the sense
28
that both are fully crossed, meaning that all persons respond to the same tasks, and the
responses/products of all persons to all tasks are evaluated by the same raters.
D studv variance components. G study variance components Me used to estimate D
study variance components for average scores over n; tasks and n; raters. The process is
very simple. Let da be the G study variance component for ct (e.g., if o~[, a = pr), and
let cr~, be the corresponding D study variance component. If a contains r, then
da, = da / n;; if u contains r, then ~a. = < / n;; and if u contains both t and r, then
#a, = da / n~n~. The resulting equations for the estimated D study variance components
are provided in the third column of Table 1. Note that D study variance components are
designated using upper-case subscripts for R and T to emphasize that these variance
components are for mean scores over n; raters and n; tasks.
The D study variance component dP is the variance of persons’ universe scores for
the infinite UG. As such, it is called universe score variance, which is analogous to true
score variance in classical theory.
D study variance components are used to estimate relative and absolute error
variances, as well as two reliability-like coefficients called generalizability coefficients and
dependability coefficients.
Absolute error variance. Absolute error is simply the difference between a person’s
observed and universe score. The variance over persons of absolute errors is:
~=o; +o; +o;T+$R++R+c;TRe,
(2)
That is, absolute error variance is the sum of all the D study variance components except for
universe score variance. For the CAP data with n; = 5 and n; = 3, Table 1 reports that
~ =.13. The square root is 5A =.36, which is the A - type, or absolute, standard error of
measurement (SEM). Consequently, adding and subtracting .36 to persons’ observed scores
29
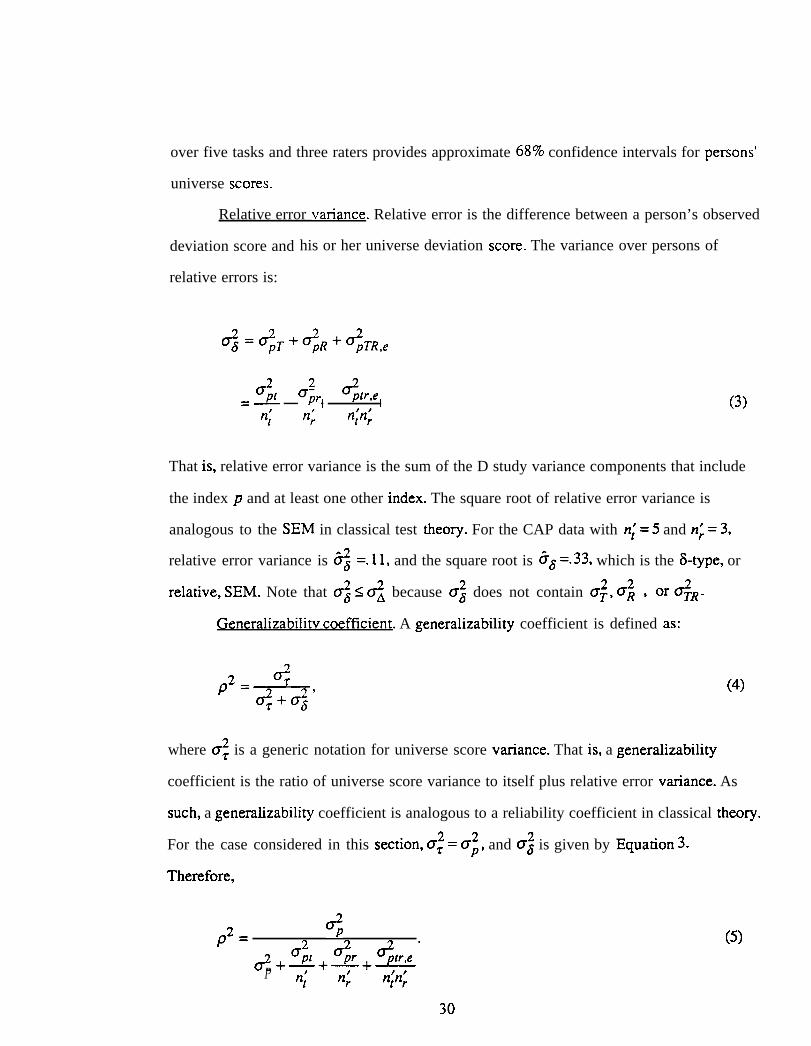
over five tasks and three raters provides approximate 68$Z0 confidence intervals for persons’
universe scores.
Relative error variance. Relative error is the difference between a person’s observed
deviation score and
relative errors is:
his or her universe deviation score. The variance over persons of
. .a&<T+++o&.,
2 2 +,r,e‘Pt ;‘w ~=— (3)% n; +;
That is, relative error variance is the sum of the D study variance components that include
the index p and at least one other index. The square root of relative error variance is
analogous to the SEM in classical test theory. For the CAP data with n; = 5 and nj =3,
relative error variance is ~=. 11, and the square root is ad =.33, which is the ~-type, or
2 2R , orc#..relative, SEM. Note that a: < d~ because a; does not contain CT,
Generalizabilitv coefficient. A generalizability coefficient is defined as:
2or
P2=<+ O:’
where ~ is a generic notation for universe score variance. That is, a generalizability
coefficient is the ratio of universe score variance to itself plus relative error variance. As
such, a generalizability coefficient is analogous to a reliability coefficient in classical theory.
For the case considered in this section, CT; = O;, and o: is given by Equation 3.
Therefore,
$P2 =
~ +<,+ O;r + (s&e “—— —
P i n; w
30
(4)
(5)
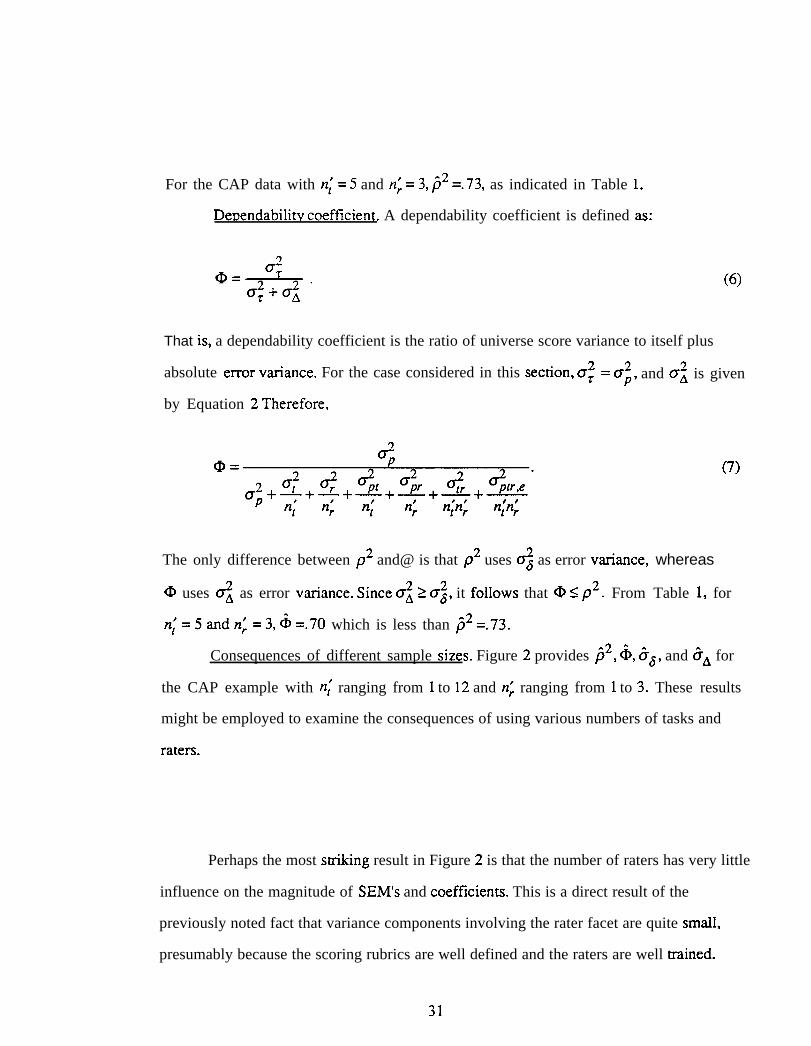
For the CAP data with n;= 5 and n; =3, @2 =.73, as indicated in Table 1.
DeDendabilitv coefficient. A dependability coefficient is defined as:
(6)
That is, a dependability coefficient is the ratio of universe score variance to itself plus
absolute emor variance. For the case considered in this section, O; = O;, and u: is given
by Equation 2 Therefore,
(7)
The only difference between p2 and@ is that p2 uses ~d as error variance, whereas
@ uses #* as error variance. Since a; 2 a;, it follows that @ S p2. From Table 1, for
n~=5andn~= 3, & =.70 which is less than ~2 =.73.
Consequences of different sample sizes. Figure 2 provides ~2, 6, ~a, and 5L for
the CAP example with n; ranging from 1 to 12 and rz~ ranging from 1 to 3. These results
might be employed to examine the consequences of using various numbers of tasks and
raters.
Perhaps the most srnking result in Figure 2 is that the number of raters has very little
influence on the magnitude of SEM’S and coefficients. This is a direct result of the
previously noted fact that variance components involving the rater facet are quite small,
presumably because the scoring rubrics are well defined and the raters are well trained.
31
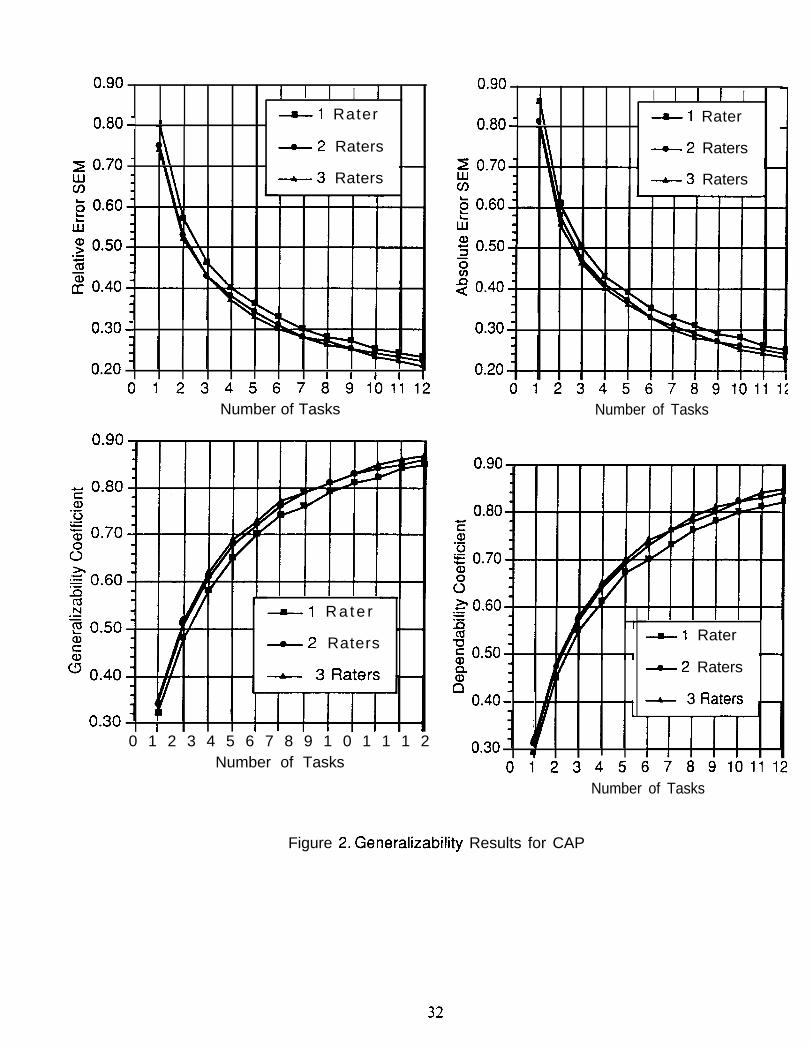
0.90I I I I I
0.80-~ 1 Rater‘
~ 2 Raters~ 0.70 “
+— 3 Raters:~ 0.60Gg 0.50.-5z 0.40
0.30-
0.20 i I I I01234567891011 12
0.90I I 1 I I
0.80- ~ 1 Rater
~ 2 Raters
m —— 3 Raters
~ ().6()G
o
: 0.40
0.30-
0.200123456789101112
0.90
0.30
Number of Tasks
—=— 1 R a t e r
—.— 2 Raters
I0 1 2 3 4 5 6 7 8 9 1 0 1 1 1 2
Number of Tasks
Number of Tasks
0.90
0.80Eal.-g 0.70
s>0.60=.-Dm —m.— 1 Rater: 0.50
~ 2 Raters%o
0.40- —
0.30 T0123456789101112
Number of Tasks
Figure 2. Generalizability Results for CAP
32
Consequently, there seems to be no compelling psychomernc reason to employ more than
One rater.
Another obvious fact from Figure 2 is that increasing the number of tasks has a
dramatic effect on lowering SEM’S and increasing the values of coefficients. With one rater,
nine tasks are required for j2 2.80, and ten tasks are needed for b 2.80 (see also the last
column of Table 1). Developing, administering, and scoring that many tasks obviously
would not be a rnvial undemking.
On the other hand, in some circumstances, an investigator might argue that it is nor
too sensible to choose n; on the basis of the resulting magnitude of j2 or ~, because both
depend on universe score variance. Such an investigator might be satisfied with a somewhat
low value for a coefficient provided individual persons were measured accurately enough.
If so, the investigator would be more interested in the magnitude of SEM’S than coefficients.
To consider this possibility, recall that CAP scores for a single task range from O to 4, which
means that average scores over n; tasks have the same range, but with fractional scores
frequently occurring. Assuming normally disrnbuted observed scores, if the investigator
wanted to be 95?Z0 certain that persons’ observed and universe scores differed by no more
than two points, only three tasks are required with one rater. However, to be 95% certain
that observed and universe scores differ by no more than one point, 12 tasks are required
with one rater, and about 10 tasks are required with three raters !2
When n; = 1, Figure 3 provides 68% and 95% A-type confidence intervals for the
CAP data for examinees with a universe score of ~ = 2, assuming normally disrnbuted
observed scores about ~. For example, when n; =3, there is a 68% probability that
examinees with a true score of 2 will obtain observed scores between 1.5 and 2.5.
33
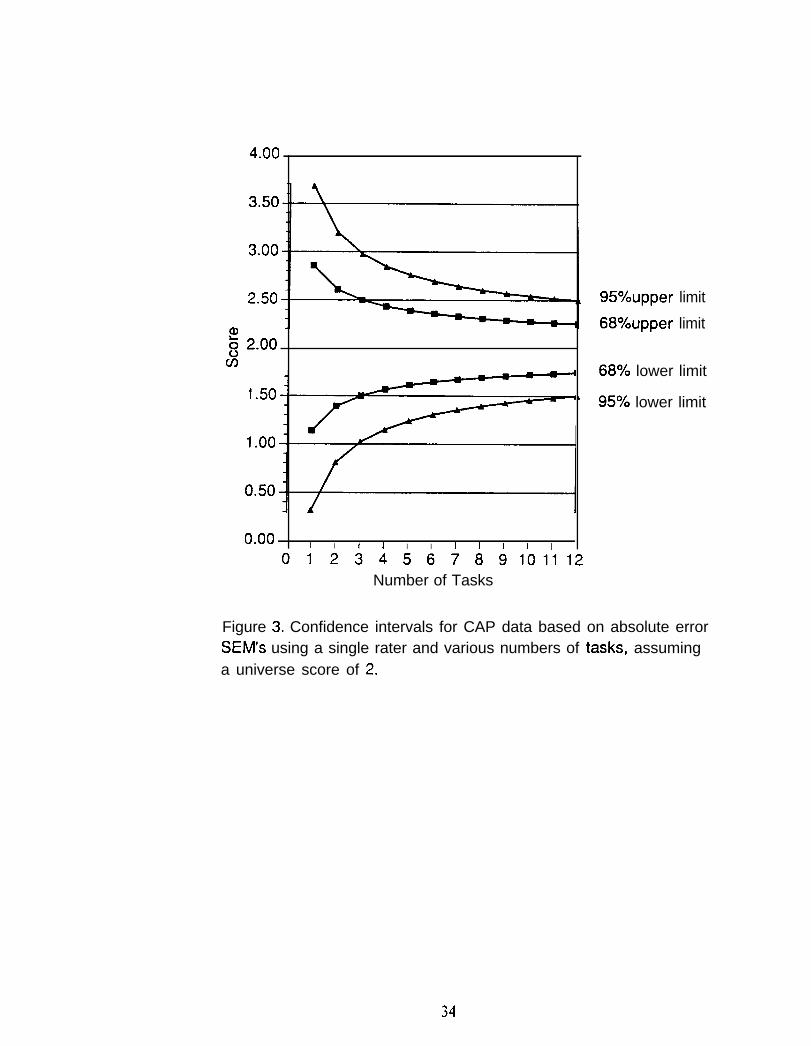
4.00
3.50
3.00
2.50 L 95?’oupper limit
68%upper limita)~ 2.()()u) 68’% lower limit
1.50 b 95% lower limit
1.00
0.50
0.00 [ I I 1 I I I I i I I
0123456789101112Number of Tasks
Figure 3. Confidence intervals for CAP data based on absolute errorSEM’S using a single rater and various numbers of tasks, assuminga universe score of 2.
34
The limits of the confidence intervals in Figure 3 can also be used as minimum
passing and maximum failing scores, as discussed by Linn (1994). For example, from
Figure 3, with n; =8, a minimum passing score of 2.6 and a maximum failing score of 1.4
are required for 95% confidence that correct decisions will be made when the standard is set
at 2.
Conrnbutions of Different Facets
This section gives additional consideration to the influence of rater, task, and other
facets on the measurement precision of performance assessments. In doing so, each facet is
treated somewhat separately. This is done to isolate issues associated with the various
facets, and to facilitate relating traditional results to the types of generalizability results
discussed in the previous section. In practice, of course, generalizability analyses involving
many facets simultaneously are greatly to be preferred.
Generalizing Over Raters
The examples in the previous section suggest that for current performance
assessments the rater facet does not conrnbute much to variability in observed scores.
While these results have been found in a wide range of current performance assessments, it
should not be assumed that such results are necessarily inevitable. For example, Linn
(1993) reports that the classic studies of Starch and Elliott (1912, 1913) on the grading of
high school work in English and mathematics demonstrated an extraordinary range of
grades assigned to written essays and extended responses in geometry. Indeed, the Starch
and Elliott studies provided considerable support to the increased use of objective testing in
the early part of this century. Undoubtedly, lack of trained raters and agreed-upon scoring
rubrics conrnbuted to the Starch and Elliott results.
Until recently, for any measurement procedure involving subjective scoring,
probably the most tlequently discussed measurement issue was inter-rater reliability.
Indeed, if inter-rater reliability was high, it was often assumed that there were no other-.
reliability issues of consequence. Although this narrow perspective no longer
35
predominates, inter-rater reliability is still a very important issue. Indeed, high inter-rater
reliability is viewed by most investigators as a necessary, although not sufficient,
condition for adopting a performance test.
The phrase “inter-rater reliability” may seem to have a self-evident interpretation.
Actually, however, there are at least two general measurement perspectives on inter-rater
reliability. One perspective typically involves inter-rater reliability coefficients. The
other perspective considers error variances or standard errors. Both perspectives involve
observed differences in ratings, but the two perspectives are not isomorphic.
Inter-rater reliability coefficients. In the performance testing literature, two
general conclusions about inter-rater reliability seem to predominate. First, when tasks
are the same for all students and scoring procedures are well-defined, inter-rater
reliability tends to be quite high. Second, when different students respond to different
tasks, choose their own tasks (e.g., select their own essay topics), or produce unique
products, then inter-rater reliability tends to be relatively low. This appears to be
especially true for portfolio assessments (see Gearhart, Herman, Baker, & Whittaker,
1992, and Koretz, Klein, McCaffrey, & Stecher, 1993). Another way to state these
conclusions is to say that when tasks are standardized inter-rater reliability tends to be
high, and when tasks are not standardized it tends to be low.
These conclusions are to be expected based on the manner in which variance
components enter the standardized and non-standardized inter-rater reliability estimates.
The standardized estimate is typically obtained by correlating the ratings of two different
raters to the responses of a group of persons to the same task.3 In terms of the variance
components introduced in the first section, this correlation is approximately equal to the
generrdizability coefficient
(8)
36
The denominator of Equation 8 is identical to the denominator of pz in Equation 5
when n; = n; = 1. For the case considered in this section, n; = 1 because only one task is
involved in the correlation, and n; = 1 because a correl~tion between two raters gives an
estimate of reliability for a single rater.
The numerators of the generalizability coefficients in Equations 5 and 8 differ in
2 When all persons respond to thethat Equation 8 includes not only cr~ but also crpt.
same single task, effectively the single task is hidden and fixed for all persons.
Consequently, the universe of generalization is a restricted universe in which raters
2 being included with a;constitute the only random facet. Statistically this leads to crP(
in the numerator of Equation 8. Because C$l is usually quite large in performance
testing, the numerator of p2 in Equation 8 is likely to be large resulting in a relatively
high value of p2.
Effectively, ~, is part of universe score variance in Equation 8, whereas almost
always C#t is more properly viewed as part of error variance (see Equations 2 and 3).
For this reason (and another reason considered later), almost always inter-rater reliability
coefficients for standardized situations are too big relative to more appropriate estimates
of generalizability for the reported scores on a performance test (see Equation 5).
The non-standardized estimate of inter-rater reliability is typically obtained by
correlating two ratings of a different task or product for each person. In such cases, the
design has tasks or products nested within persons and crossed with raters, [(t.p) x r],
and the comelation is approximately equal to the generalizability coefficient
‘PJ’2=<+cfp+c$+&p,e ‘
and C&e = (7:+ O-&e.
(9)
The non-standardized coefficient in
Equation 9 will be less than the standardized coefficient in Equation 8 for two reasons:
(a) the numerator of the non-standardized coefficient is smaller than the numerator of the
37
standardized coefficient by O;(; and (b) the denominator of the non-standardized
coefficient is larger than the denominator of the standardized coefficient by # + a:,
which conrnbutes to the relative error variance ~ for the non-standardized coefficient.
The variance component ~, does not appear in the numerator of the non-
standardized coefficient in Equation 9 because tasks vary over persons, and therefore
person-task interaction does not conrnbute to universe score variance. Rather ~Pt is
included in ~P and conrnbutes to error variance. The different role that #P[ plays in
Equations 8 and 9 is often the principal reason that the non-standardized inter-rater
reliability coefficient is smaller than the standardized coefficient. In addition, Equation 9
will tend to be smaller than Equation 8 if tasks are unequal in average difficulty (i.e., ~
is relatively large), and/or raters are differentially capable of rating different tasks (i.e.,
~, is relatively large). Either or both of these conditions are probably more likely to
characterize portfolio assessments than other types of performance assessments.
The generalizability coefficients in Equations 8 and 9 approximate the inter-rater
reliability coefficients most frequently reported in the literature. Note, however, that they
are for making decisions based on only ~ rating of only ~ task. This is evident from
the fact that the variance components in Equations 8 and 9 containing r and/or t are all
divided by one. Frequently, inter-rater reliability coefficients are incorrectly interpreted
as estimates of reliability when persons’ scores are the sum or average of two ratings.
Such estimates are easily obtained from Equations 8 and 9 by halving variance
components that contain r. The resulting estimates of generalizability for two ratings are
necessarily larger than those for a single rating.
Standard errors and error variances. In the performance testing literature, issues of
rater reliability are most frequently discussed in terms of inter-rater reliability
coefficients. Sometimes, however, such issues are treated (and perhaps more
appropriately treated) from the perspective of differences in the actual ratings (e.g., a plot
of two ratings for each person). It is intuitively clear that such differences reflect error in
38
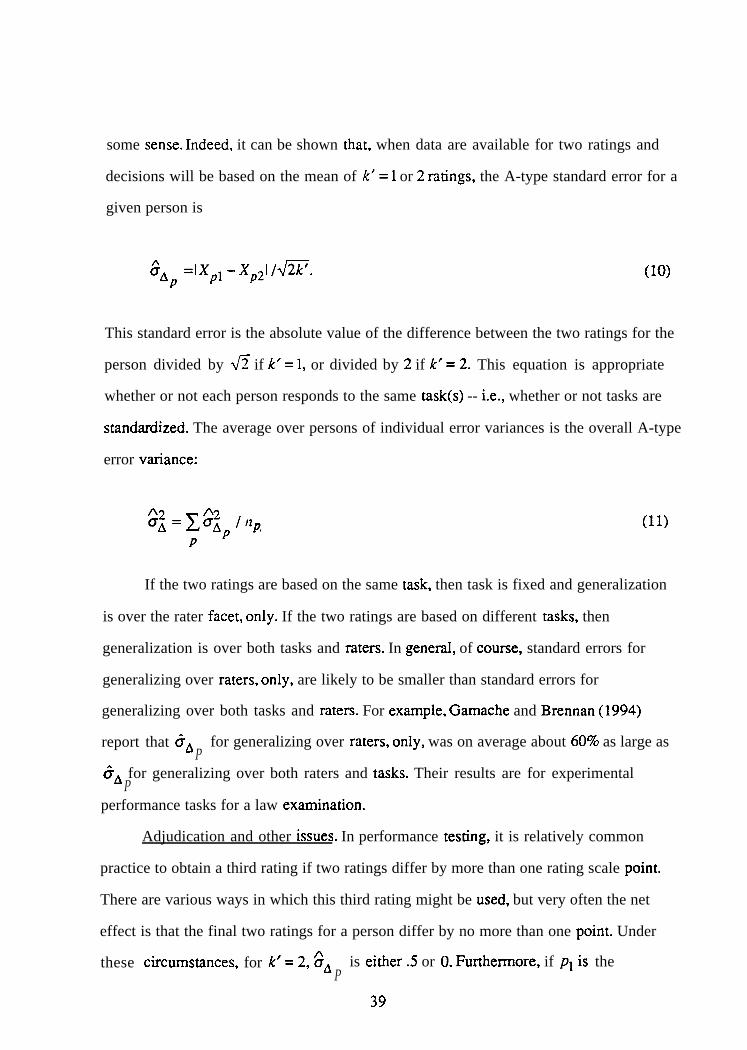
some sense. Indeed, it can be shown that, when data are available for two ratings and
decisions will be based on the mean of k’= 1 or 2 ratings, the A-type standard error for a
given person is
%p =Ixpl - XP21 /w. (lo)
This standard error is the absolute value of the difference between the two ratings for the
person divided by ~ if k’= 1, or divided by 2 if k’ = 2. This equation is appropriate
whether or not each person responds to the same task(s) -- i.e., whether or not tasks are
standardized. The average over persons of individual error variances is the overall A-type
error variance:
(11)
If the two ratings are based on the same task, then task is fixed and generalization
is over the rater facet, only. If the two ratings are based on different tasks, then
generalization is over both tasks and raters. In general, of course, standard errors for
generalizing over raters, only, are likely to be smaller than standard errors for
generalizing over both tasks and raters. For example, Gamache and Brennan (1994)
report that c?~ for generalizing over raters, only, was on average about 60% as large asP
6A for generalizing over both raters and tasks. Their results are for experimentalP
performance tasks for a law examination.
Adjudication and other issues. In performance testing, it is relatively common
practice to obtain a third rating if two ratings differ by more than one rating scale point.
There are various ways in which this third rating might be used, but very often the net
effect is that the final two ratings for a person differ by no more than one point. Under
these circumstances, for k’= 2, $* is either.5 or O. Furthermore, if P1 is theP
39
proportion of persons with a difference score of 1, the overall value of 6A will be . S@
which is likely to be quite small. For example, if pl = .36 then 6A = .30 of a rating scale
point.
In short, whenever some process is used to adjudicate ratings, standard errors of
measurement are likely to be relatively small, and in this sense the ratings will appear
quite reliable. Hence, an adjudication process is beneficial only if it does not distort the
intended construct being rated. Such distortion could occur, for example, if the
adjudicators were systematically influenced by the original ratings, or if the adjudicators
were experts untrained in the scoring rubric.
Carefully constructed scoring rubrics, an intensive training session for raters, and
an adjudication process usually produce ratings with small error variance. However,
small error variance does not guarantee that inter-rater reliability coefficients will be
high. This follows from the fact that universe score variance, ~, is in the numerator of
any inter-rater reliability coefficient, but is absent from error variance. Consequently, if
~ is small relative to error variance, then an inter-rater reliability coefficient could be
small even if error variance is small. This “thought experiment” illustrates that an inter-
rater reliability coefficient encapsulates information about the magnitude of true
differences among person (universe score variance) relative to errors.
If true differences among persons are of no consequence -- as might be the case in
a fully criterion-referenced context -- then inter-rater reliability coefficients may be of
little value. Real world testing contexts are seldom so clear cut, however. In short, error
variances and inter-rater reliability coefficients capture overlapping, but still different,
types of information. Often, therefore, it is sensible to report both. In any case, it is
always advisable to report estimated variance components (see AERA, APA, NCME,
1985, p.19).
Rater vs. Task Reliability
40
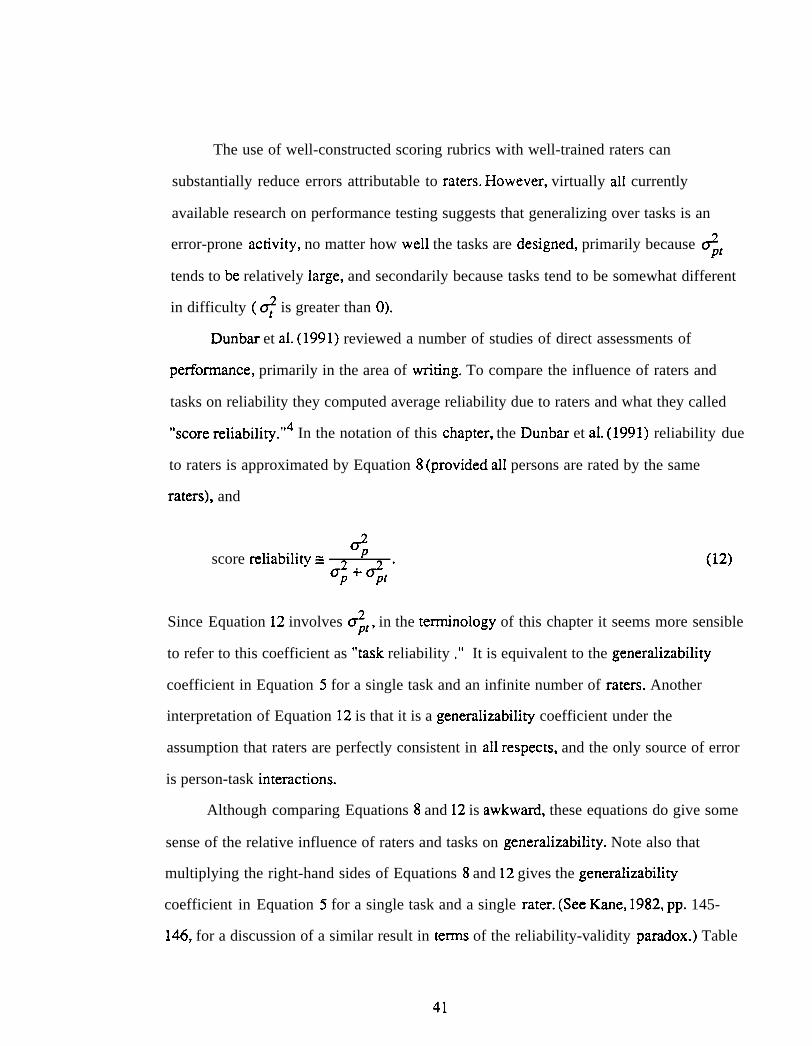
The use of well-constructed scoring rubrics with well-trained raters can
substantially reduce errors attributable to raters. However, virtually all currently
available research on performance testing suggests that generalizing over tasks is an
error-prone activity, no matter how well the tasks are designed, primarily because #P~
tends to be relatively large, and secondarily because tasks tend to be somewhat different
in difficulty ( # is greater than 0),
Dunbar et al. (1991) reviewed a number of studies of direct assessments of
performance, primarily in the area of writing. To compare the influence of raters and
tasks on reliability they computed average reliability due to raters and what they called
“score reliability. “4 In the notation of this chapter, the Dunbar et al. (1991) reliability due
to raters is approximated by Equation 8 (provided all persons are rated by the same
raters), and
<score reliabilitys
G;+<t”(12)
Since Equation 12 involves ~~, in the terminology of this chapter it seems more sensible
to refer to this coefficient as “task reliability .“ It is equivalent to the generalizability
coefficient in Equation 5 for a single task and an infinite number of raters. Another
interpretation of Equation 12 is that it is a generalizability coefficient under the
assumption that raters are perfectly consistent in all respects, and the only source of error
is person-task interactions.
Although comparing Equations 8 and 12 is awkward, these equations do give some
sense of the relative influence of raters and tasks on generalizability. Note also that
multiplying the right-hand sides of Equations 8 and 12 gives the generalizability
coefficient in Equation 5 for a single task and a single rater. (See Kane, 1982, pp. 145-
146, for a discussion of a similar result in terms of the reliability-validity paradox.) Table
41
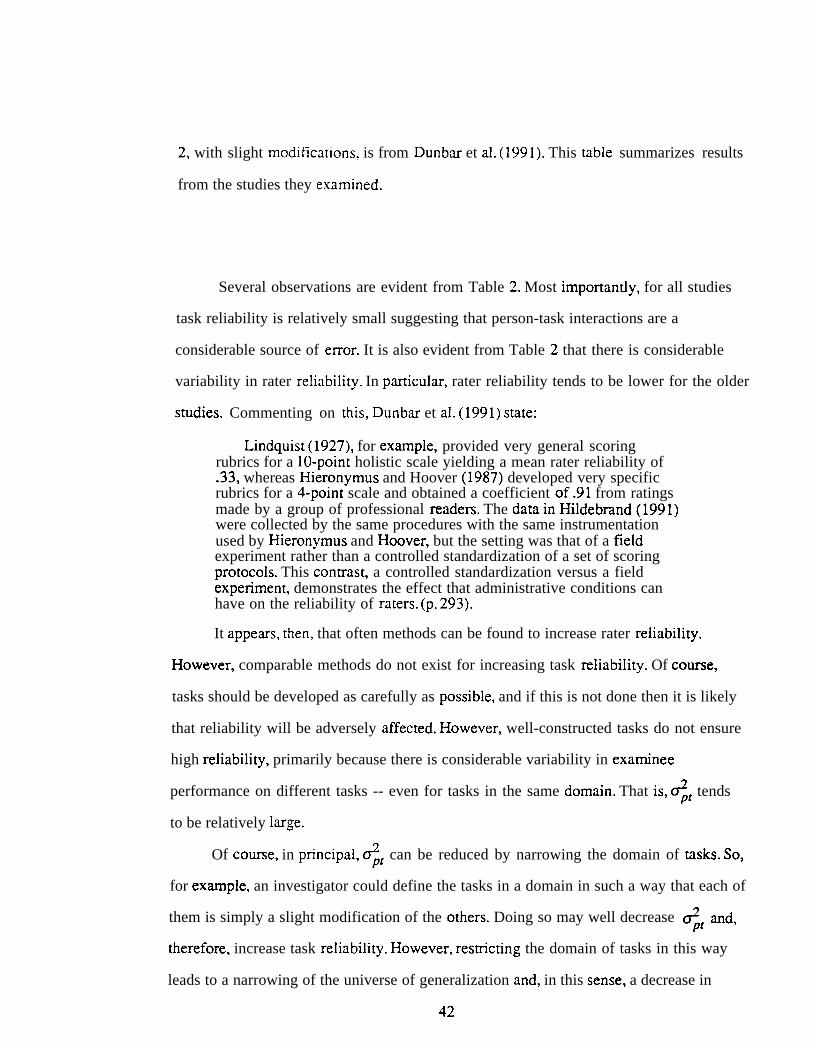
2, with slight modifications, is from Dunbar et al. (1991). This table summarizes results
from the studies they examined.
Several observations are evident from Table 2. Most importantly, for all studies
task reliability is relatively small suggesting that person-task interactions are a
considerable source of error. It is also evident from Table 2 that there is considerable
variability in rater reliability. In particular, rater reliability tends to be lower for the older
studies. Commenting on this, Dunbar et al. (1991) state:
Lindquist (1927), for example, provided very general scoringrubrics for a 10-point holistic scale yielding a mean rater reliability of.33, whereas Hieronymus and Hoover (1987) developed very specificrubrics for a 4-point scale and obtained a coefficient of.91 from ratingsmade by a group of professional readers. The datainHildebrand(1991)were collected by the same procedures with the same instrumentationused by Hieronymus and Hoover, but the setting was that of a fieldexperiment rather than a controlled standardization of a set of scoringprotocols. This contras~ a controlled standardization versus a fieldexperiment, demonstrates the effect that administrative conditions canhave on the reliability of raters. (p. 293).
It appears, then, that often methods can be found to increase rater reliability.
However, comparable methods do not exist for increasing task reliability. Of course,
tasks should be developed as carefully as possible, and if this is not done then it is likely
that reliability will be adversely affected. However, well-constructed tasks do not ensure
high reliability, primarily because there is considerable variability in examinee
performance on different tasks -- even for tasks in the same domain. That is, #Pt tends
to be relatively large.
Of course, in principal, ~t can be reduced by narrowing the domain of tasks. So,
for example, an investigator could define the tasks in a domain in such a way that each of
them is simply a slight modification of the others. Doing so may well decrease <1 and,
therefore, increase task reliability. However, resrncting the domain of tasks in this way
leads to a narrowing of the universe of generalization and, in this sense, a decrease in
42
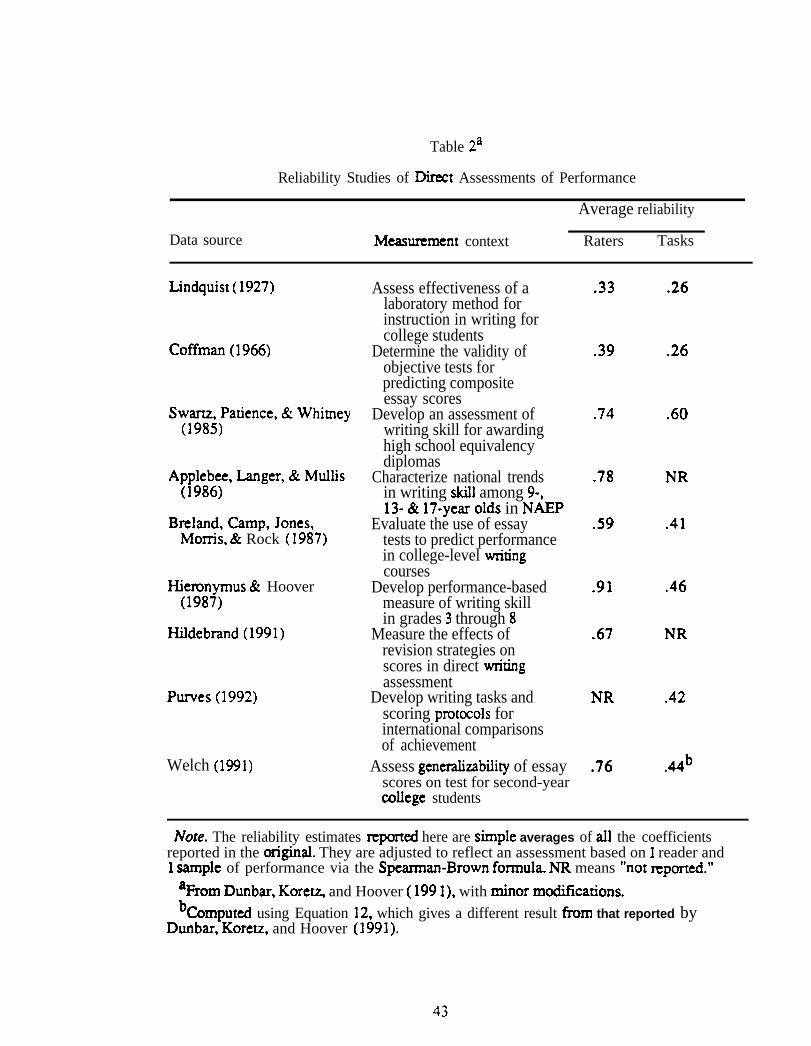
Table 2a
Reliability Studies of Direct Assessments of Performance
Average reliability
Data source Measurement context Raters Tasks
Lindquist ( 1927)
Coffman (1966)
Swam, Patience, & Whimey(1985)
Applebee, Langer, & Mullis(1986)
Breland, Camp, Jones,Morris, & Rock (1987)
Hieronymus & Hoover(1987)
Hildebrand (1991)
Purves (1992)
Welch (1991)
Assess effectiveness of alaboratory method forinstruction in writing forcollege students
Determine the validity ofobjective tests forpredicting compositeessay scores
Develop an assessment ofwriting skill for awardinghigh school equivalencydiplomas
Characterize national trendsin writing skill among 9-,13- & 17-year olds in NAEP
Evaluate the use of essaytests to predict performancein college-level wxitingcourses
Develop performance-basedmeasure of writing skillin grades 3 through 8
Measure the effects ofrevision strategies onscores in direct titingassessment
Develop writing tasks andscoring protmols forinternational comparisonsof achievement
Assess generalizability of essayscores on test for second-yearrxdlege students
.33
.39
.74
.78
.59
.91
.67
NR
.76
.26
.26
.60
NR
.41
.46
NR
.42
.44b
Note. The reliability estimates rqorted here are simple averages of all the coefficientsreported in the original. They are adjusted to reflect an assessment based on 1 reader and1 sample of performance via the Spearman-Brown formula. NR means “not reported.”
aFrom Dunbar, KoretZ and Hoover ( 199 1), with minor mtilcations.bComputed using Equation 12, which gives a different result tim that reported by
Dunbar, Koretz, and Hoover (1991).
43
validity (see Kane, 1982). This is an example of the so-called “reliability-validity
paradox. ” It is generally not advisable to take steps to increase reliability that lead to a
decrease in validity.
One of the most important considerations in the development of a performance test
is a careful specification of the task facet in the universe of generalization. At a
minimum, an investigator should be able to defend the set of tasks in a performance test
as a reasonable representation of the domain of tasks that might have been used.
Otherwise, there is little basis for claiming that performance on the particular tasks in a
performance test can be generalized to a larger universe of tasks. (See Shavelson et al.,
1993, p. 216, for an example of a specification of a domain of tasks.)
The importance of accurate specification of a subject matter domain for
performance assessments has been illustrated by Shavelson, Gao, and Baxter (1996).
For the domain of elementary science they demonstrated that an inappropriately broad
specification of the domain leads to overestimating task variability and underestimating
generalizability. Conversely, an inappropriately narrow specification of the domain will
likely lead to underestimating task variability and overestimating generalizability. Note,
however, that generalizability theory per se does not tell an investigator how narrow or
wide a domain should be. It is the investigator’s responsibility to clearly specify the
domain and defend that specification.
Other Facets
Shavelson et al. (1993) provide the following perspective on relevant facets for
performance assessments:
we view a performance assessment as a sample of studentpe~o~ance drawn from a complex universe defined by a combination ofall possible tasks, occasions, raters, and measurement methods. We viewthe task facet to be representative of the content in a subject-matterdomain. The occasion facet includes all possible occasions on which adecision maker would be equally willing to accept a score on theperformance assessment. We view the rater facet as including all possibleindividuals who could be trained to score performance reliably. These
44
three facets are, traditionally, thought of as sources of unreliability in ameasurement.
In addition, we incorporate a method facet into our definition of theuniverse of generalization. This formulation moves us beyond reliabilityinto a sampling theory of validity (cf. Kane, 1982). Specifically, we viewthe method facet to be all possible methods (e.g., short answer, computersimulation) that a decision maker would be equally willing to interpret asbearing on student achievement.
Occasion as a facet. From a classical perspective, sampling variability due to
occasions most closely corresponds to the notion of test-retest reliability. Also,
variability due to occasions is incorporated in traditional notions of intra-rater reliability,
which reflects variability in ratings for the same raters on two occasions. Ideally, from
the perspective of minimizing error variance, an investigator would like examinee
performance-test products to be minimally changed over occasions during which no
instruction occurred. Similarly, an investigator would like ratings for the same raters to
be stable over occasions.
For at least two reasons, there are very few studies in the performance testing
literature that incorporate more than one occasion. First, doing so is logistically difficult
and quite costly. Second, in operational settings collecting data on two occasions is
usually not an intended part of the testing process. Even so, it is highly desirable that at
least small-scale G studies be conducted that involve occasion as a facet in order to
examine the extent to which an investigator can legitimately claim that scores obtained on
one occasion are generalizable to scores that might be obtained on different, but similar,
occasions.
Ruiz-Frimo, Baxter, and Shavelson (1993) and Shavelson et al. (1993) examined
the stability of several elementary science performance assessments. Their results
suggest that variance attributable to the interaction of persons, tasks, and occasions
( #to) was very large -- indeed, many times larger than universe score variance and also
larger than ~~. However, variance attributable to persons and occasions (to) was
quite small. This means that, over an infinite number of tasks, there was little person-
occasion interaction in their data, but for any single task persons were rank ordered
45
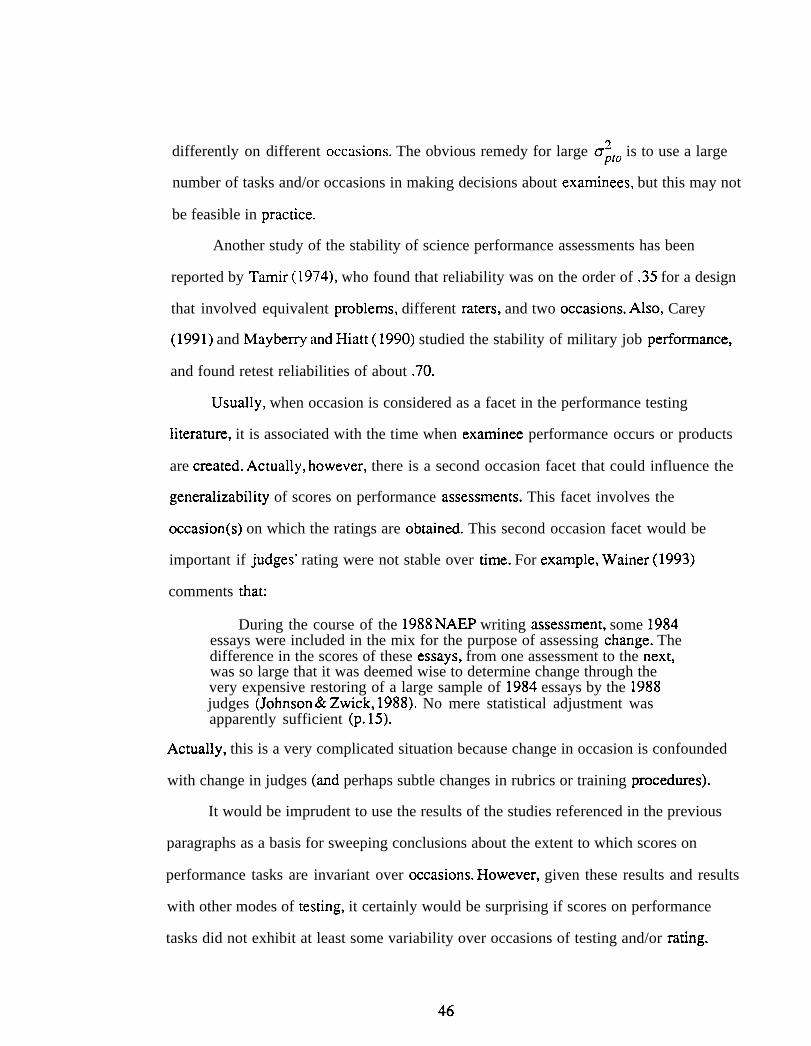
differently on different occasions. The obvious remedy for large cr& is to use a large
number of tasks and/or occasions in making decisions about examinees, but this may not
be feasible in practice.
Another study of the stability of science performance assessments has been
reported by Tamir (1974), who found that reliability was on the order of .35 for a design
that involved equivalent problems, different raters, and two occasions. Also, Carey
(1991) and Maybeny and Hiatt ( 1990) studied the stability of military job performance,
and found retest reliabilities of about .70.
Usually, when occasion is considered as a facet in the performance testing
literature, it is associated with the time when examinee performance occurs or products
are created. Actually, however, there is a second occasion facet that could influence the
generalizability of scores on performance assessments. This facet involves the
occasion(s) on which the ratings are obtained. This second occasion facet would be
important if judges’ rating were not stable over time. For example, Wainer (1993)
comments that:
During the course of the 1988 NAEP writing assessment, some 1984essays were included in the mix for the purpose of assessing change. Thedifference in the scores of these essays, from one assessment to the next,was so large that it was deemed wise to determine change through thevery expensive restoring of a large sample of 1984 essays by the 1988judges (Johnson & Zwick, 1988). No mere statistical adjustment wasapparently sufficient (p. 15).
Actually, this is a very complicated situation because change in occasion is confounded
with change in judges (and perhaps subtle changes in rubrics or training procedures).
It would be imprudent to use the results of the studies referenced in the previous
paragraphs as a basis for sweeping conclusions about the extent to which scores on
performance tasks are invariant over occasions. However, given these results and results
with other modes of testing, it certainly would be surprising if scores on performance
tasks did not exhibit at least some variability over occasions of testing and/or rating.
46
Method as a facet. Cronbach et al. (1972), Brennan (1992a), and Kane (1982) have
all observed that generalizability theory often blurs distinctions between reliability and
validity. This is indeed the case if method or mode of testing (e.g., performance tasks,
multiple-choice items, short-answer questions, etc.) is incorporated as a facet in the
universe of generalization.
If results are invariant over mode of testing, then there is evidence of convergent
validity, and a supportable argument can be made that different modes of testing provide
exchangeable information. If results are not invariant over mode of testing, then different
modes provide different types of information about student performance.
Shavelson et al. (1993) examined mode of testing for two science performance
tasks and four methods (observations of actual performance, notebook reports of steps
employed, computer administration of tasks, and short-answer questions). They
concluded that not all methods converge, and “cenain methods may measure different
aspects of achievement (p. 229). ” Although this is only one study, it seems plausible that
their conclusions will generalize to other settings. This does not mean, however, that one
mode is preferable to another. Such a conclusion can be drawn only through a joint
consideration of psychometric properties, content, context, logistical, and cost
considerations.
Scorinz rubncs/mocedures. Wainer ( 1993, p. 15) suggests that performance
assessments yield acceptable levels of accuracy only when scoring rubrics are rigidly
defined. This may be one reason why most empirical analyses of performance
assessments effectively consider scoring rubrics as fixed in the sense that only one rubric
is used. In principal, however, there may be many rubrics that could be used. This is
another example of blurred distinctions between reliability and validity. If two or more
rubrics are in principal equally acceptable, then the issue is primarily in the realm of
reliability. However, if the acceptable rubrics are not equally preferable, then the matter
47
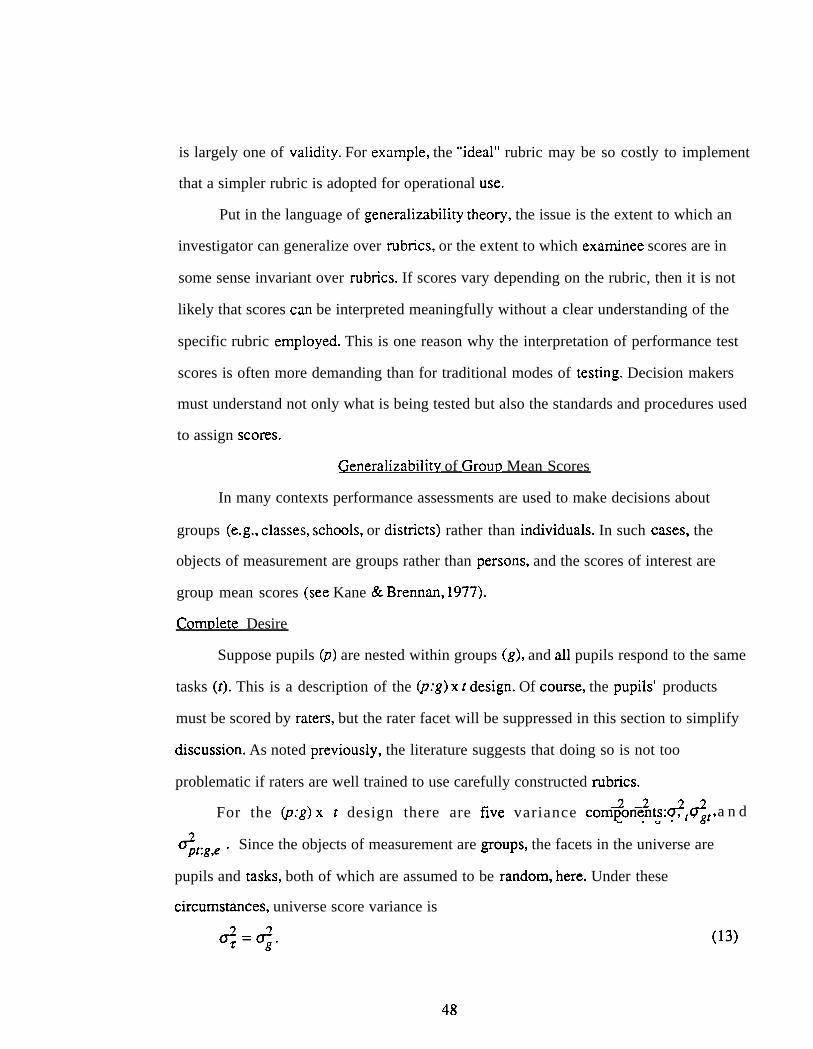
is largely one of validity. For example, the “ideal” rubric may be so costly to implement
that a simpler rubric is adopted for operational use.
Put in the language of generalizability theory, the issue is the extent to which an
investigator can generalize over rubrics, or the extent to which examinee scores are in
some sense invariant over rubrics. If scores vary depending on the rubric, then it is not
likely that scores can be interpreted meaningfully without a clear understanding of the
specific rubric employed. This is one reason why the interpretation of performance test
scores is often more demanding than for traditional modes of testing. Decision makers
must understand not only what is being tested but also the standards and procedures used
to assign scores.
Generalizabilitv of Grouu Mean Scores
In many contexts performance assessments are used to make decisions about
groups (e.g., classes, schools, or districts) rather than individuals. In such cases, the
objects of measurement are groups rather than persons, and the scores of interest are
group mean scores (see Kane & Brennan, 1977).
Comulete Desire
Suppose pupils (p) are nested within groups (g), and all pupils respond to the same
tasks (t). This is a description of the (p:g) x t design. Of course, the pupils’ products
must be scored by raters, but the rater facet will be suppressed in this section to simplify
discussion. As noted previously, the literature suggests that doing so is not too
problematic if raters are well trained to use carefully constructed rubrics.
+,o; g C* O* a n dFor the (p:g) x t design there are five variance components: : , ~ , ~t,
2 Since the objects of measurement are groups, the facets in the universe arept:g,e “
pupils and tasks, both of which are assumed to be random, here. Under these
circumstances, universe score variance is
+<.
48
(13)
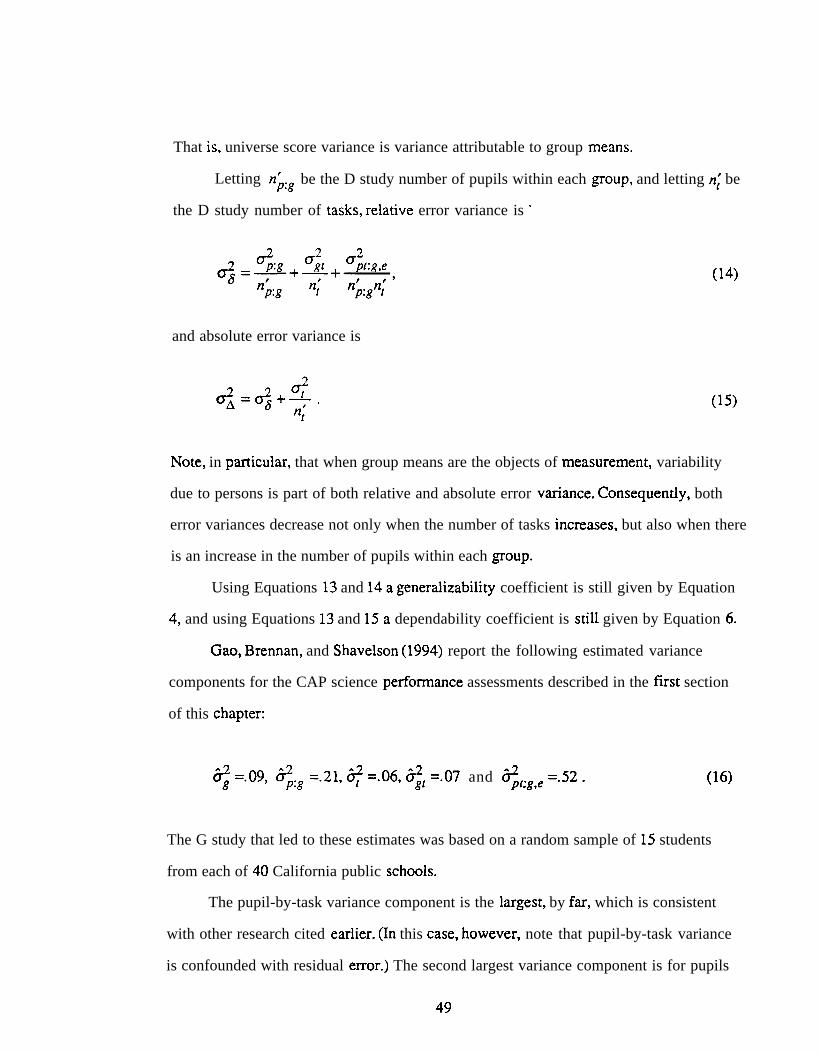
That is, universe score variance is variance attributable to group means.
Letting n~.g be the D study number of pupils within each group, and letting n; be
the D study number of tasks, relative error variance is ‘
(14)
and absolute error variance is
Note, in particular, that when group means are the objects of measurement, variability
due to persons is part of both relative and absolute error variance. Consequently, both
error variances decrease not only when the number of tasks increases, but also when there
is an increase in the number of pupils within each group.
Using Equations 13 and 14a generalizability coefficient is still given by Equation
4, and using Equations 13 and 15a dependability coefficient is still given by Equation 6.
Gao, Brennan, and Shavelson (1994) report the following estimated variance
components for the CAP science performance assessments described in the f~st section
of this chapter:
(% =.09, b;.g =.21, + =.06, %1 =.07 and ~t.g,e =.52 .. (16)
The G study that led to these estimates was based on a random sample of 15 students
from each of 40 California public schools.
The pupil-by-task variance component is the largest, by far, which is consistent
with other research cited earlier. (In this case, however, note that pupil-by-task variance
is confounded with residual error.) The second largest variance component is for pupils
49
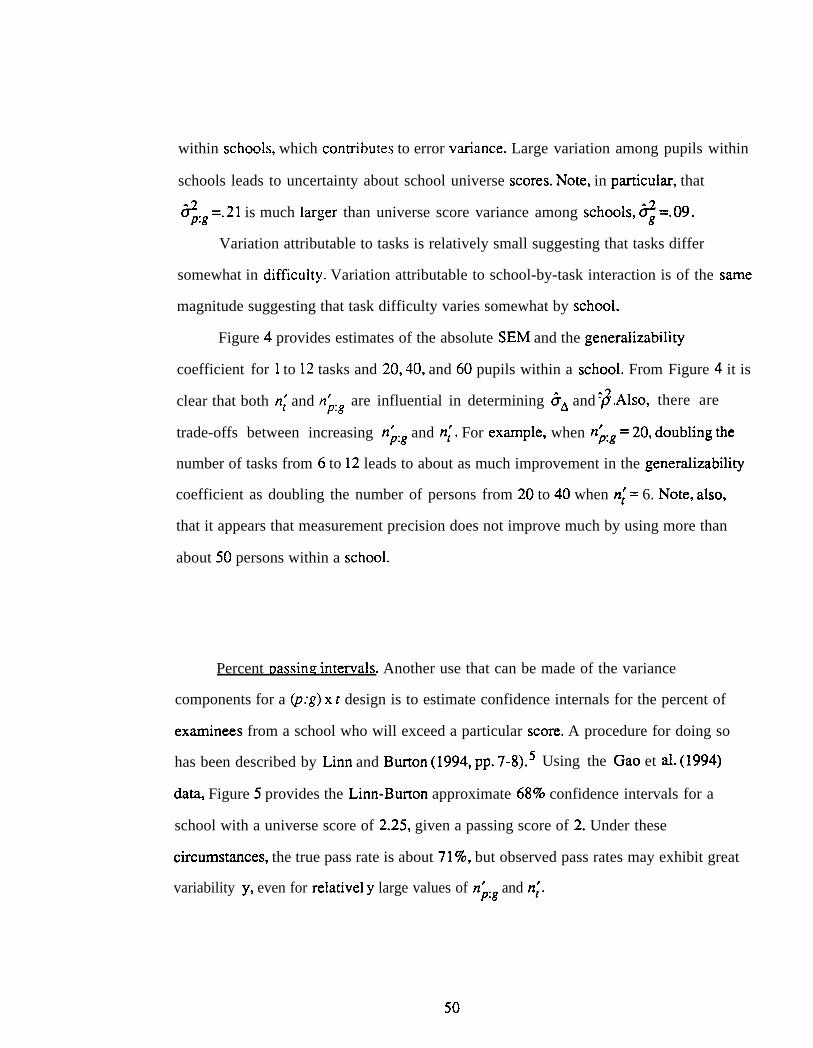
within schools, which conrnbutes to error variance. Large variation among pupils within
schools leads to uncertainty about school universe scores. Note, in particular, that
~.g =.21 is much larger than universe score variance among schools, ~ =.09.
Variation attributable to tasks is relatively small suggesting that tasks differ
somewhat in difficulty. Variation attributable to school-by-task interaction is of the same
magnitude suggesting that task difficulty varies somewhat by school.
Figure 4 provides estimates of the absolute SEM and the generalizability
coefficient for 1 to 12 tasks and 20, 40, and 60 pupils within a school. From Figure 4 it is
‘2 Also, there areclear that both n; and n~.g are influential in determining ~* and p .
trade-offs between increasing n~.g and n;. For example, when n~:g = 20, doubling the
number of tasks from 6 to 12 leads to about as much improvement in the generalizability
coefficient as doubling the number of persons from 20 to 40 when n; = 6. Note, also,
that it appears that measurement precision does not improve much by using more than
about 50 persons within a school.
Percent Dassinst intewals. Another use that can be made of the variance
components for a @:g) x t design is to estimate confidence internals for the percent of
examinees from a school who will exceed a particular score. A procedure for doing so
5 Using the Gao et al. (1994)has been described by Linn and Burton (1994, pp. 7-8).
data, Figure 5 provides the Linn-Burton approximate 68% confidence intervals for a
school with a universe score of 2.25, given a passing score of 2. Under these
circumstances, the true pass rate is about 7170, but observed pass rates may exhibit great
variability y, even for relativel y large values of n~.g and nj.
50
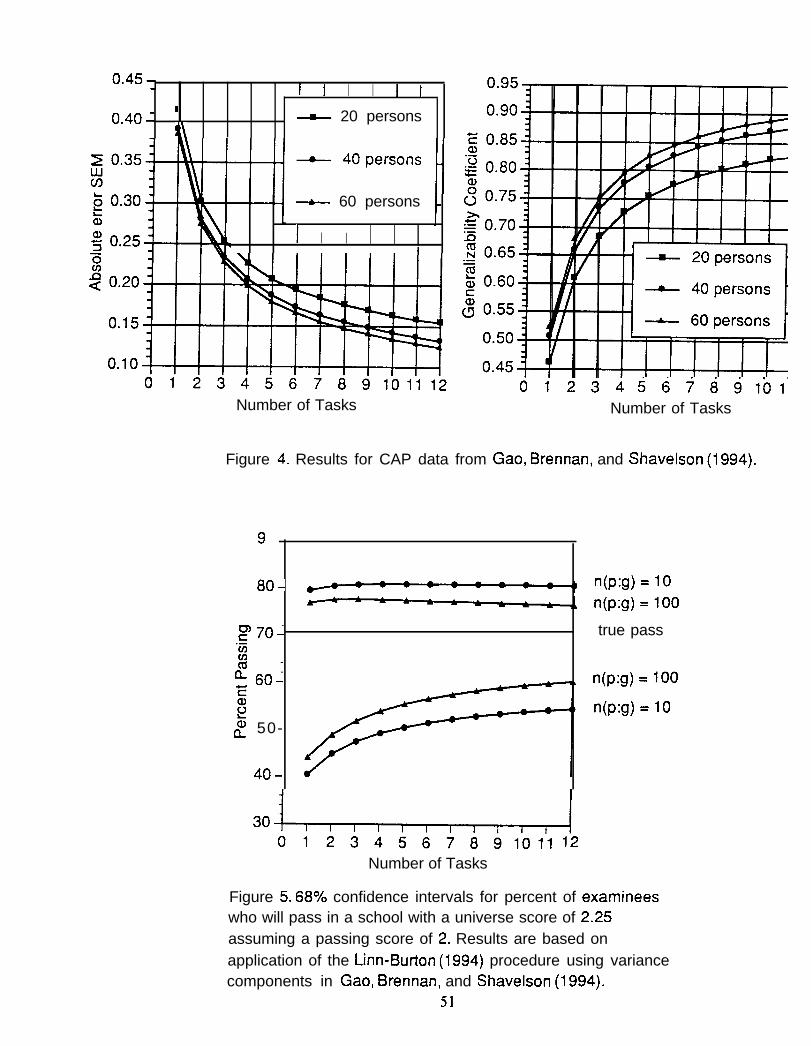
0.45,I I I I I I
0.40-I
—— 20 personst\
~ 60 persons
\ I I I I I I
0123456769101112 01234 !j6789101’1Number of Tasks Number of Tasks
Figure 4. Results for CAP data from Gao, Brennan, and Shavelson (1994).
80- n(p:g) = 10n(p:g) = 100
~70- true pass.-(nW&’ 60- n(p:g) = 100E~ n(p:g) = 10$& 50-
40-
L-—mlnJ01234567891011 12
Number of Tasks
Figure 5. 687. confidence intervals for percent of examineeswho will pass in a school with a universe score of 2.25assuming a passing score of 2. Results are based onapplication of the Linn-Burton (1994) procedure using variancecomponents in Gao, Brennan, and Shavelson (1994).
51
For example, when n; =5, a 68% confidence interval for percent passing covers a
23 percentage point range from 55% to 78%. This means that, over replications (e.g.,
different times of testing) 68% of the time, the observed pass rate (given a passing score
of 2) for a school with a universe score of 2.25 would likely range from 55~0 to 78~0.
Not only is this a very broad range, but also the interval is not symmetric about the true
passing rate of71 %. For these data, it appears that very large numbers of tasks and
persons would be required to obtain narrow intervals.
Violations of “conventional wisdom.” Not infrequently, investigators assume that
reliability for goups is necessarily greater than reliability for persons, and/or error
variance for groups is necessarily less than error variance for persons. Using
generalizability theory, Brennan (1995) has shown that this “conventional wisdom” is
not necessarily true. In particular, violations of this conventional wisdom with respect to
generalizability coefficients are quite likely, especially when variability due to persons
within groups is relatively large, and/or the number of persons within groups is relatively
small.
Brennan (1995) shows that, when pupils (over groups) are the objects of
measurement, a generalizability coefficient is
+ + dp.gP2 = C72 “ <,.g , “
++c$.g+-+ “ ‘n; 4
(17)
In this case, universe score variance involves not only variability due to groups but also
variability due to persons within groups.
Consider, again, the Gao et al. (1994) estimated variance components in Equation
16. Using these estimates in Equation 17 with n;= 5 gives ~2 = .72. Using Equations
13, 14, and 4, it can be shown that when schools are the objects of measurement
~2 < .72 if n~.g < 15. In other words, when n;= 5 and n~.g c 15, school reliability is
less than pupil reliability, which violates the conventional wisdom.
52
Suppose n; = 5 and n~.g = 10. In this case, as noted above, school reliability is
less than pupil reliability. However, school error variance (both relative and absolute) is
less than pupil error variance, in accordance with the conventional wisdom. This paradox
is easily resolved by noting that when scores are aggregated ~ universe score variance
and error variance are likely to decrease, but not necessarily at the same rate. Hence, for
at least some purposes it can be misleading to consider either generalizability coefficients
or error variances in isolation. This is an important consideration given the current trend
towards reporting aggregated scores on performance assessments.
Matrix-Samu]in~ Desians
Historically, matrix sampling designs have been used primarily to estimate
moments (especially the mean) for a distribution of examinee scores. More recently,
such designs have been used in NAEP to estimate entire distributions of examinee scores.
Gao, Shavelson, and Baxter (in press) and Gao et al. (1994) have described how
marnx sampling designs can also be used in performance testing to estimate error
variances and coefficients when schools (or other groups of examinees) are the objects of
measurement. In this approach, each sample of pupils within a school is randomly split
into k sub-samples with each sub-sample taking a different set of tasks. The principal
advantage of this design is that a pupil needs to take only a small number of tasks, but
data are collected for a Iarge number of tasks. This can lead to substantial reductions in
test-taking ame without negatively affecting measurement precision, provided relatively
large numbers of pupils are available. For example, Gao et al. (in press) found that a
marnx sampling design with one hour of testing time per pupil gave a level of
generalizability equal to that of a @:g) x t complete design with 2.5 hours of testing time.
The disadvantages of this design are that large numbers of pupils are required, and
many tasks need to be developed. In many circumstances, however, these disadvantages
may be an acceptable price to pay for the substantial reduction in per-pupil testing time
and the increased content coverage inherent in having many tasks administered.
53
Concludinsz Comment
As this chapter illustrates, from at least some perspectives, scores on performance
assessments are less generalizable than scores on more’ traditional tests. At the same
time, however, the apparent realism (what some call the “authentic” nature) of
performance assessments is intensely appealing to many people. This appeal has led
some researchers and practitioners to down-play the importance of
reliability/generalizabi lity considerations in the evaluation of performance assessments.
That is unfortunate from a technical viewpoint and often unneces.wy from a practical
perspective, as long as excessive claims are not made for performance assessments.
It is undeniably clear that, in most cases, the realism of performance assessments,
as currently conceptualized, is purchased at the price of some limitations on
generalizability. That does not render such assessments undesirable per se. It does
suggest, however, that decision makers need to be cognizant of reasonable restrictions
imposed by budget limitations, student time, and rater availability -- restrictions that
directly or indirectly limit generalizability.
How might the dependability of scores on performance assessments be increased?
When scores are reported for groups only, multiple matrix sampling procedures may help.
Also, for either group-level or individual-level scores, it maybe advisable to supplement
performance assessments with more traditional modes of testing. Another possibility
may be create “small” performance assessments that require less administration time,
thereby permitting a student to respond to a larger number of assessments. When only a
few time-intensive, “large” performance assessments are used, it is probable that in most
circumstances student-level scores will not be very dependable.
54
Footnotes
1S rnctl y speaking, the magnitude of cr~f is influenced by the occasion (o) on which
the data were collected. That is ~Pl reflects not only pt ~nteractions but also pto
interactions. A similar type of “occasion confounding” influences the other variance
components containing p, at least theoretically. By the same line of reasoning, variance
components containing r may be influenced by the occasion on which ratings were obtained.
2Assuming normally distributed observed scores, a 95% confidence interval covers a
width of approximately four SEM’S. Consequently, for the difference between the upper
and 10wer limits to be two points, d* = 2 / 4=.50. For the difference to be one point,
~* = 1 / 4=.25. These values can be used in Figure 1 to obtain the required numbers of
tasks and raters.
3Throughout this section it is assumed that the same two raters are used for all
persons. If different raters were used for each person the reported equations would be
different, but the basic conclusions would be unaffected. Also, the discussion could be
couched in terms of any number of raters. Two raters are assumed here because that is
the most common circumstance.
4Dunbar et al. (1991) employed a procedure discussed by Gulliksen (1950, pp.
212-214) to estimate reliability due to scores -- what Gulliksen called “content
reliability. ” Gulliksen ( 1950) described his coefficient as the “reliability of an essay test
corrected for attenuation due to the inaccuracy of reading (p. 214). ” It can be shown that
Gulliksen’s content reliability is ~ / [ofi + ~t ] , which is called score reliability by
Dunbar et al (1991).
‘The Linn and Burton (1994) procedure makes heavy use of normality
assumptions. For this and other technical reasons, the results should be interpreted
cautiously. Still, such results are likely to aid decision makers in qualifying any
statements about percents of passing examinees.
55
~eference~
American College Testing. (1994). EXPLORE technical manual. Iowa City, IA:Author.
American Educational Research Association, Americ* Psychological Association, &National Council on Measurement in Education. (1985). Standards for educationaland psychological testing. Washington, DC: American Psychological Association.
Applebee, A. N., Langer, J. A., & Mullis, I. V. S. (1986). Writing: Trends across thedecade, 1974-84 (National Assessment of Educational Progress Rep. No. 15-W-01). Princeton, NJ: Educational Testing Semite.
Baker, E. L. (1992). The role of domain specifications in improving the technical qualityof pe@ormance assessment. (Technical Report). Los Angeles, CA: UCLA, Centerfor Research on Evaluation, Standards, and Student Testing.
Brekmd, H. M., Camp, R. Jones, R. J., Morris, M. M. & Reek, D. A. (1987). Assessingwriting skill (Research Monograph No. 11). New York: College EntranceExaminations Board.
Brennan, R. L. (1992a). Elements of generalizability theoq (rev. cd.). Iowa City, IA:American College Testing.
Brennan, R L. ( 1992b). Generalizability theory. Educational Measurement: Issues andPractice, 11(4), 27-34.
Brenmm, R. L. (1995). The conventional wisdom about group mean scores. Jourmd ofEducational Measurement, 14,385-396.
Brennan, R. L., Gao, X., & Colton, D. A. (1995). Generalizability analyses of WorkKeys Listening and Writing tests. Educational and Psychological Measurement.,55, 157-176.
Brennan, R. L., & Johnson, E. G. (1995). GeneralizabiMy of performanceassessments. Educational Measurement: Issues and Practice, 14 (4), 9-12.
Carey, N. B. (1991). Setting standards and diagnosing training needs with surrogate jobperformance measures. Military Psychology, 3(3), 135-150.
Coffman, W. E. (1966). On the validity of essay tests of achievement. Journal ofEducational Measurement, 3, 151-156.
Cronbach, L. J., Gleser, G. C., Nanda, H., & Rajaratnam, N. (1972). The dependabilityof behavioral measurements: Theory of generalizability for scores and profiles.New York: Wiley.
Cronbach, L.J., Linn, R. L., Brennan, R. L., & Haertel, E. (1995, summer).~eneralizabilitv analvsis for educational assessments (Evaluation Comment). LosAngeles: University of California, Center for Research on Evaluation, Standards,and Student Testing.
56
Dunbar, S. B., Koreu, D. M., & Hoover, H. D. (1991). Quality control in thedevelopment and use of performance assessments. Applied Measurement inEducation, 4,289-303.
Feldt, L. S., & Brennan, R. (1989). Reliability. In R. L. Linn (Ed.), EducationalMeasurement (3rd cd., pp. 105- 146). New York: Macmillan.
Gamache, L. M., & Brennan, R. L. (1994, April). Issues of generalizability: Tasks,raters, and contexts for the NCBE-PT. Paper presented at the Annual Meeting ofthe National Council on Measurement in Education, New Orleans.
Gao, X., Brennan, R. L., & Shavelson, R. J. (1994, April). Generalizability of groupmeans for pe~ormance assessments under a matrix sampling design. Paperpresented at the Annual Meeting of the American Educational ResearchAssociation, New Orleans.
Gearhurt, M., Herman, J. L., Baker, E. V., & Whittaker, A K. (1992). Writing portjolioat the eiementaq level: A study of methods for writing assessment. (CSE TechnicalReport 337). Los Angeles: University of California, Center for Research onEvaluation, Standards, and Student Testing.
Gulliksen, H. (1950), Theory of mental tests. New York: Wiley. [Reprinted byLawrence Erlbaum Associates, Hillsdale, NJ, 1987.]
Hieronymus A. N., & Hoover, H. D. (1987). Iowa tests of basic skills: Writingsupplement teacher’s guide. Chicago: Riverside.
Hildebrand, M. R. (1991). Procedural facilitation of young writers’ revisions.Unpublished doctoral dissertation, The University of Iowa.
Johnson, E. G., & Zwick, R. J. (1988). The NAEP technical report. Princeton, NJ:Educational Testing Service.
Kane, M. T. (1982). A sampling model for validity. Applied PsychologicalMeasurement, 6, 125-160.
Kane, M. T., & Brennan, R. L. (1977). The generalizability of class means. Review ofEducational Research, 27,267-292.
Koretz, D., Klein, S., McCaffrey, D., & Stecher, B. (1993). Interim report: Thereliability of Vermont portfolio scores in the 1992-93 school year. (CSE TechnicalReport 370). Los Angeles: University of California, Center for Research onEvaluation, Standards, and Student Testing.
Lane, S., Stone, C. A., Ankenmann, R. D., & Liu, M. (1992, April). Empirical evidencefor the reliability and validity ofperjlormance assessments. Paper presented at theAnnual Meeting of the American Educational Research Association, San Francisco.
Lindquist, E. F. (1927). The laboratory method in freshman English. Unpublisheddoctoral dissertation, The University of Iowa.
Linn, R. L. (1993). Educational assessment: Expanded expectations and challenges.Educational Evaluation and Policy Analyses, 15, 1-16,
57
Linn, R. L., & Burton, E. (1994). Performance-based assessment: Implications of taskspecificity. Educational Measurement: Issues and Practice, 13( 1), 5-15.
Maybemy, P., & Hiatt, C. (1990). Incremental validity of new tests in prediction ofinfant~ pe~ormance (CRM Report No. 90-11 O). Alexandria, VA: Center forNaval Analysis.
Purves, A. C. (1992). Reflection on research and assessment in written composition.Research in the Teaching of English, 26(l), 108-122.
Ruiz-Prime, M. A., Baxter, G. P., & Shavelson, R. J. (1993). On the stability ofperformance assessments. Journal of Educational Measurement, 30,41-53.
Shavelson, R. J., Baxter, G. P., & Gao, X. (1993). Sampling variability of performanceassessments. Journal of Educational Measurement, 30, 215-232.
Shavelson, R. J., Gao, X., & Baxter, G. (1996). On the content validity ofperformance assessments: Centrality of domain specification. In M. Birenbaum&F. J. R. C. Dochy (Eds.), Alternatives in assessment of achievements, learningprocesses, and prior knowledge (pp. 131-141). Boston, MA: IUuwer Academic Publishers.
Shavelson, R. J., & Webb, N. M. (1991). Generalizability theory: A primer. NewburyPark, CA: Sage.
Starch, D., & Elliot, E. C. (1912). Reliability of grading high school work in English.School Review, 20,442-457.
Starch, D., & Elliot, E. C. (1913). Reliability of grading high school work inmathematics. School Review, 21, 254-259.
S wartz, R., Patience, W., & Whitney, D. R. (1985). Adding an essay to the GED writingskills test: Reliabili~ and validity issues (GED Testing Sexvice Research StudiesNo. 7). Washington, DC: American Council on Education.
Tamir, P. (1974). An inquiry oriented laboratory examination. Journal of EducationalMeasurement, 11,25-33.
van der Vleuten, C. P. M., & Swanson, D. B. (1990). Assessment of clinical skills withstandardized patients: The state of the art. Teaching and Learning in Medicine, 2,58-76.
Wainer, H. (1993). Measurement problems. Journal of Educational Measurement, 30,1-21.
Welch, C. (1991, April). Estimating the reliability of a direct measure of writingthrough generalizability theory. Paper presented at the Annual Meeting of theAmerican Educational Research Association, Chicago.
58
ComparabilityEdward H. HaertelS t a n f o r d Universi~ ‘
Robert L. LinnUniversity of Colorado
Large-scale assessment programs are moving away from objective, multiple-choice tests toinclude more “authentic”, “direct”, or “performance-based” assessments. Using these newlyrediscovered assessment formats, students demonstrate what they know or can do by engaging intasks that should be of interest to them. Scores might even be based on records of actualclassroom performance, in the form of student portfolios, projects, or exhibitions. This shift intesting method and rationale raises significant technical and normative issues, several of whichcenter on the problems of assuring that measurements taken at different times, in differentplaces, or using different performance exercises can be validly compared. In this chapter, weattempt to sort out some threats to the comparability of measurements, with special attention toissues that arise with performance assessment. Research and anecdotal evidence are presentedwhen available to inform the likely magnitude of potential problems or to suggest ways torespond, but much of this discussion is necessarily theoretical, Practice is evolving rapidly and todate there are more questions than answers.
With multiple-choice tests, comparability is less problematical. Administration conditions arehighly standardized; test stimuli are limited to self-contained, written materials; students work inisolation from one another; and their mode of responding is tightly controlled. Scoring is analmost perfectly objective, mechanical process. Even with these tests, of course, comparabilityhas been questioned. Are scores from a district’s first year with a new test comparable to scoresthe following year? (see, for example, Linn, Graue & Sanders, 1990). Are scores forlanguage-minority students comparable in meaning to scores from native speakers of standardEnglish? Are scores on different forms of the test comparable? How about scores obtained underhigh-stakes versus low-stakes testing conditions (Madaus, 1988)? How comparable are scoreswith the same name from tests by different publishers?
With performance testing, similar questions and some new ones arise; and findingsatisfactory answers poses greater technical challenges than with more objective tests. This ismainly because most perfommnce tests are less standardized than multiple-choice tests andbecause they almost always contain substantially fewer items. Standardization is weaker becauseadministration and scoring are more complicated and more difficult to control. Many aspects oftesting and scoring may be left to the on-the-spot judgment of administrators, scorers, or eventhe exarninees themselves. Indeed, incorporation of student choice or provision for localadaptation of performance assessments may be touted as a virtue.
The number of independent items on performance tests is usually smaller because each itemis more complex and takes longer to complete. Also, the separate questions students respond towithin a given performance task are oflen interdependent. Again, this is seen as an advantage ofthese tests relative to multiple-choice tests that cover a large number of independent,decontextualized facts or ideas. But, as Yen (1993) has noted, this interdependence can result in
59
an exaggerated impression of the reliability of the measurement. Furthermore, the use of moreitems makes scores more comparable because the effects of students’ individual reactions tospecific items tend to average out when more items are used. One student may have specialknowledge that makes this item easy, or another may have a particular misconception that makesthat item difficult. These sorts of random influences matter less when averaged over more items.Similarly, a larger number of items increases comparability across test forms, because theparticular features of each item matter less when more items are put together. With performancetesting, therefore, because scores are likely to be based on fewer independent items, theidiosyncrasies of items and exarninees have greater influence on the overall score.
The first major section of this chapter addresses the comparability of scores obtained using asingle performance task. This is followed by a section on comparability across performancetasks, focusing especially on tasks intended to be interchangeable or to measure the same areasof knowledge and skill. The third major section takes up comparability at the level of testsincluding more than one performance exercise. In each section, different threats to comparabilityare discussed.
A question that must surely arise is what degree of comparability is necessary for operationaluse of performance assessments. Of course, no simple answer is possible. Different aspects ofcomparability will be more or less relevant in a given situation. As with any psychometricdesiderata, the stringency of comparability requirements will depend on the kind of decisionbeing made (e.g., “absolute” decisions about status with respect to a cutting score versus“relative” decisions about the rank ordering of students or schools); the importance of theconsequences attached to those decisions; the level of aggregation at which scores will bereported and used (individuals versus aggregates like classrooms, schools, or states); the relativecosts of mistakenly passing versus mistakenly failing an individual; the quality of other relevant,available information and how it is combined with performance test information; and the easewith which faulty decisions can be detected and revised. Still other factors include the cost ofadditional testing; the size, importance, and duration of the testing program; and the time andmoney available for further research and development. The psychometric quality of similarperformance assessments elsewhere will also inform expectations. Finally, it is difficult toescape the impression that the level of reliability typical of multiple-choice objective testsrepresents some kind of standard to which tests using other formats maybe held.
Comparability of Scores Obtained Using a Single Performance TaskIn this section we address the comparability of scores obtained using just one performance
exercise with different students or with the same student on more than one occasion. The sectionbegins with comparability of administration conditions, then turns to comparability in scoring,and finally takes up comparability across student populations, examining some studentcharacteristics that may influence the meaning of scores.
Administration Conditions. Imagine a classroom where students are taking a multiple-choicetest. Each works alone, silently attending to his or her own paper. If space permits, students maybe seated at every other desk. All have received identical instructions, read from a scriptprovided for the test administrator. They work from identical sets of printed questions, recordingtheir responses on identical answer sheets. Rules about what student questions the teacher mayanswer (and how they are to be answered), whether calculators may be used, and similar matters
60
are clearly specified. The test is accurately timed. All these administration conditions can bereplicated any time the test is administered.
It is more difficult to predict what the same classroom might look like during a performanceassessment. With some performance tasks, the testing session might look much the same. Forothers, the scene would be entirely different. Students might be working in groups; might beusing nontext equipment or manipulable; might be free to consult whatever reference materialshappened to be available in the classroom, might be flee to ask the teacher questions the taskdesigners never anticipated. The logistics of equipment setup and cleanup might compromise theaccuracy of timing. The number of students in the class, size of the room, and configuration ofdesks or other facilities (e.g., sink, electrical outlets) might all tiect performance and thereforecompromise comparability over classrooms. Even if scripts are provided, the demands made onthe test administrator to maintain order and provide logistical support maybe considerablygreater than with written examinations. Consequently, comparability across test administratorsmay be diminished.
The argument has been made that if petiormance assessments are to drive classroominstruction, and if group activity is a desirable feature of classroom instruction, then performanceassessments ought to involve group activity. Moreover, the argument goes, ability to work ingroups is itself a valued learning outcome and should be assessed. Regardless of the rationale,group activity complicates the comparability of performance assessments. At the individualstudent level, it maybe diflicult to disentangle the contributions of each student to a commonproduct. Even if each student turns in his/her own work, the scores of those placed with more orless able peers may not be comparable. Comparability is also compromised at the aggregatelevel. A teacher’s decision to distribute the most able students across all the groups formed or toplace them in a single group will affect average group-level petiormance. Most important, thecompetencies of individuals cannot be inferred from group-level performances without makingstrong and probably untenable assumptions about the nature of group processes (Webb, 1995).
With portfolio-based assessments, administration problems multiply. The portfolio usuallyconsists of some required and some optional entries representing the student’s best work, culledfrom up to a year or more of classroom instruction. In this context, rules about appropriateversus inappropriate collaboration or coaching are hard to specifi and harder to enforce. A majordeterminant of the quality of portfolios from a given classroom is likely to be the amount of timeand effort the teacher devotes to portfolio-relevant assignments. In addition, the conditions underwhich students create their portfolios may vary substantially from one classroom to another.Research papers written by students with access to well-stocked school libraries versus anincomplete set of encyclopedias are clearly not comparable unless the conditions under whichthey were created can somehow be taken into account— a problem for which there is as yet nosolution.
The context in which a given performance task is administered also encompasses theperceived consequences of successor failure. In some state testing programs, for example,improvement or decline relative to the previous year’s test scores is rewarded or penalized. Asimilar issue may arise for the National Assessment of Educational Progress (NAEP) if it shouldever change from a low-stakes national testing program to an aggregate of potentiallyhigh-stakes state-level testing programs.
61
A final requirement for comparability across administrations relates to test security. In mostlarge-scale assessment programs, comparability over time is of paramount importance. Trendlines are always more informative than isolated results for a single year. Most designs formaintaining comparability over time call for keeping at least some items secure so that they canbe readministered under comparable (secure) conditions. With performance exercises,maintaining security may be considerably more difficult than with the simpler, briefer, morenumerous items used in the past. Just by virtue of their novelty, performance exercises may bemore memorable. Beyond that, the use of a smaller number of such tasks, requirements forspecial equipment, and even the virtue of greater student interest and involvement may all workagainst test security, encouraging students to remember what they have done and talk about itwith their peers. For low-stakes testing applications in which the focus is on overall trends asopposed to measurement of individuals, one solution might be to administer an exercise todifferent, randomly equivalent, groups of examinees in successive years.
A counter argument has been advanced (e.g., Frederiksen & Collins, 1989) that performanceassessments ought to be public, that students and teachers should know exactly what standards ofexcellence are, and what is expected. In performance assessments like diving or a skater’scompulsory figures, the argument is compelling. But in schools, performing an assessment taskis usually interpreted less as an end in itself than as an indicator of some broader capability withrespect to a construct domain the task is intended to represent. When the intended inference is tosome broader domain, there is a serious risk that teaching directly to a specific task will changethe skills it requires and undermine its validity (Madaus, 1988). Nonetheless, at least in theory, asolution to the problem of noncomparability between secure and compromised administrationsmight be to publicize a large number of performance exercises, from which those on the test areto be selected, well in advance of the first administration.
Comparability in Scoring. In large-scale testing programs, scoring usually follows a modelthat has evolved over the past decade or more out of experience with performance assessmentsof students’ writing. A scoring rubric is developed and anchor papers are chosen to exemplifieach performance level, or sometimes the boundaries between successive levels. Raters aretrained in the use of the rubric and must attain a criterion level of accuracy in scoring a set ofbenchmark papers. During operational scoring, raters are organized into small groups (“tables”),each with a more experienced “table leader” who can answer specific questions as they arise.Some previously scored papers are seeded throughout those being scored for the first time so thateach rater’s accuracy can be monitored continually. This helps to keep raters’ standards fromdrifting over the course of a scoring session. If an individual rater appears to be performingbelow standard, the table leader may “read behind” that rater, monitoring his or her performancemore closely until the problem is corrected. By these methods, with some care and effort,relatively high levels of scorer consistency can usually be attained (see, for example, Dunbar,Koretz, & Hoover, 1991; Shavelson, Baxter, & Gao, 1993). Even with rigorous training andfrequent calibration checks, however, scorers still contribute a source of uncertainty and therebyincrease the overall measurement error. Moreover, open-ended responses are more complex andtime consuming to score than selected responses; interrater reliability must be examined for eachnew assessment.
Performance assessment scoring may be viewed as a social process in which a group ofindividuals negotiates meanings and comes to consensus about the interpretation of scoringrubrics. Rules for handling unusual responses may be formulated on-the-fly and communicated
62
verbally to members of the group. If the entire scoring process is replicated later, the emergentconsensus may not be quite the same. This especially threatens the comparability of scores fromyear to year. If it is possible to seed some papers from the previous year along with new papersto be scored, any drill in standards maybe estimated. But if writing prompts or other aspects ofassessments have changed from year to year, it may not be possible to have raters makeequivalent judgments of responses to different tasks, nor to conceal the year each responserepresents.
Photocopying of students’ papers, sometimes entailed by the logistics of restoring, may alsoaffect comparability. A study of score reliability for student performance data from the KentuckyInstructional Results Information System (KIRIS) found a significant effect of scoringphotocopies versus originals at one but not another grade level (Richard Hill, personalcommunication, January 14, 1994).
Finally, perhaps making a virtue of necessity, most state-level performance assessmentsystems rely on classroom teachers for much of the work of scoring and in some designs,teachers may score their own students’ work. It is reasonable to assume that in some cases,teachers’ scorings of their own students’ work may not be comparable to scores assigned byother raters, especially if teachers are aware of the identity of the students. 1
Comparability Across Student Populations. Every test is designed with some targetpopulation in mind. Decisions about content, format, layout, timing, and instructions are allconditioned by the age, language, and culture of the intended exarninees. This is in part becausethe curriculum’s intended learning outcomes differ according to students’ ages and othercharacteristics, but also because any assessment task requires skills beyond those it is intended tomeasure. Successful performance typically depends on exarninees’ understanding that theyshould show their best work; their willingness to do so; their ability to understand the taskrequirements; and their mastery of the communication skills necessary to produce storableresponses. These and other attitudes or capabilities not explicitly part of what is to be measuredbut nonetheless necessary for successfid test performance maybe referred to as the test’sancillary or enabling skill requirements. If some examinees are deficient in a test’s ancillaryabilities, then it is biased against them. They will not score as well as other examinees equallyproficient with respect to the knowledge or skills the test was designed to assess. Variation inscores of otherwise equally capable exarninees due to differences in their ancillary abilities givesrise to construct-irrelevant variance in test scores.
The ancillary skill requirements of performance assessments are likely to exceed those ofmore conventional tests, although, as with any test, they may be minimized through careful testdesign. The materials and instructions provided are more complex and varied and the requiredmodes of responding are more demanding. Perhaps the most obvious threat to the validity ofmost performance assessments is their dependence on reading and writing. Scores for nativespeakers of standard English may not be comparable to scores of students for whom standardEnglish is a second language or dialect. Consider a performance assessment in mathematics, say,that calls for students to explain their approach to a problem. Even if communicating aboutmathematics is explicitly included in the knowledge and skills to be assessed, scores are likely tobe interpreted as reflecting primarily mathematics proficiency. Clearly, when the exarninees arelanguage-minority students, that interpretation must be made wi_@ considerable caution. At the
63
very least, the relative contributions of different abilities to the construct measured will varyfrom one language group to another.
In addition to language, comparability across student groups maybe limited by differences inmotivation (or understanding of and compliance with the demand characteristics of the testingsituation). The rhetoric of performance assessment sometime’s suggests that students will almostinevitably find these new forms of testing activities stimulating and engaging. There is anoften-repeated story of a fifth grader in California asking, after a performance test in science,“Can we take the test again tomorrow?” But children do not always take to the activities adultsthink they should, and other anecdotes suggest that students’ favorite assessments may be thoserequiring the least effort, especially the least writing. Low motivation may distort the scores ofall students and may be especially problematical for students who must struggle with writing.
Developers of performance assessments must also remain alert to the impact of a range ofdisabilities that might be irrelevant in more traditional testing situations. Difficulties with finemotor coordination, physical handicaps, or color blindness may threaten the comparability ofscores for individual students.
Finally, a major determinant of performance test scores maybe students’ previous exposureto similar tasks, given either as performance assessments or in the course of regular classroominstruction. (Students are less likely to be familiar with novel testing formats.) If performanceassessments become routine in the business of teaching and testing, then differences in exposureto novel task formats may no longer threaten score comparability. But at least for the nextseveral years, students’ uneven experience with pefiormance testing may be a consideration.Initial dramatic year-to-year improvements in scores may have more to do with students’acquisition of ancillary skills than of target skills.
Comparability Across Performance TasksThe previous section described threats to comparability that may arise even when the
assessment task itself is held constant. In this section, we add a layer of complexity, focusing onthe comparability of scores from different performance tasks. Following this discussion, the thirdmajor section of the chapter examines comparability of scores born entire tests. It will be seenthere that aggregating across a number of performance exercises can mitigate noncomparabilitiesat the level of individual tasks, although careful test design, empirical studies, and usually,statistical adjustments will still be required to assure adequate comparability in large-scaletesting programs.
The comparability of entire tests depends strongly on the comparability of single items, butitem-level comparability is also of interest in its own right. Consider the case of a state-leveltesting program that administers different sets of items to different students in order to improveschool-level achievement estimates, but which also produces individual-level scores. Unlessstudents’ scores are based solely on items administered to all of them in common, some degreeof comparability must be assumed across the items given to different students. (There is adilemma here. The more comparable the matrix-sampled items are, the less matrix samplingimproves content coverage.) Item-level comparability is also implied when benchmarkproficiency levels are illustrated with items drawn from an exercise pool. The interpretability ofproficiency scales is only enhanced to the extent that the illustrative exercises are trulyrepresentative of all those at the corresponding proficiency level.
64
Measurement intents, ancillary requirements, and error variance. In analyzing thecomparability of single performance tasks, it is helpfid to think of scores as having three distinctcomponents. First is the intent of the measurement-the construct-relevant knowledge, skills, or
2 Second is the set of ancillarydispositions the task is designed to measure .requirements-additional construct-irrelevant knowledge, skills, or dispositions required for tasksuccess, including but not limited to familiarity with task instructions, motivation to show one’sbest work, and test: wiseness. Language proficiency and other communication skills may fallwithin a measurement’s intent or within its ancillary requirements, as discussed in the previoussection. Finally, scores inevitably include a component of error—A complex mixture of bothrandom and idiosyncratic influences on scores. The comparability of performance tasks is afi.mction of the similarities and differences among their intents, their ancillary requirements, andtheir error structures. Thus, it is usefid to distinguish these components even though it may notbe possible to separate them or to determine in which of these three respects two assessment:tasks actually differ.
This section next turns to comparability when all three of these components are the same andthen when error structures, ancillary abilities, or both diverge. The comparability of performancetasks with different intents is then briefly considered. The section concludes with a brieftreatment of additional issues raised by assessment designs permitting student or teacher choice.
Comparability among tasks with the same intent, the same ancillary requirements, and thesame error structure. If tasks require the same ancillary and intended abilities and if the scoresthey yield are equally accurate for students at any given level of those abilities, then the scoresthey yield should be comparable. Such tasks satisfy the requirements for equating, the strongestform of linkage identified by Mislevy (1992a) and Linn (1993). In principle, given any two suchtasks, say X and Y, it should be possible to fmd a single equating function that could be used totransform scores on task X to equivalent Y-scores or conversely. Note that even in this idealcase, it would not necessarily be appropriate to use the tasks interchangeably without applyingsome statistical adjustment. One task’s scoring rubric might be more stringent than the other’s,for example, in which case the raw scores from the two tasks would not be on the same scale,Note also that statistical equating methods might be difllcult to apply if scores on the two taskstook on only a few discrete values (e.g. 1- 6).
The most important question about this ideal case of common intents, ancillary requirements,and error structures is the degree to which it can be approximated in practice. An ongoingNSF-sponsored project being carried out by the RAND Corporation in collaboration withseveral other institutions is examining the comparability of science performance assessmentsdesigned to have varying degrees of parallelism. In one comparison, two tenth-grade scienceperformance assessments were constructed, called Rate of Cooling (ROC) and Radiation (RAD).In ROC, students compare three fabrics to see which is the best insulator; and in RAD theycompare three paint colors to see which absorbs the least radiant heat energy. Each experimentincluded three trials, one for each material, in which temperature was measured at specified timeintervals. Temperature changes were recorded and graphed, and parallel or identical questionswere posed about temperature change, heat energy, and the concept of rate of change. Despitethe formal similarity of the two tasks, observations during pilot studies suggested significantdifferences in the accuracy of students’ measurement, the time required for the two tasks, thedifficulty of manipulating the equipment, and the kinds of errors students made. This study
65
highlights the importance of attention to ancillary requirements of tasks as well as to the abilitiesthey are intended to measure.
Shavelson, Gao, and Baxter (in press) report another study that shows how different levels oftask comparability affect generalizability. The study underscores the importance of clearlyspecifying the domain of generalization. Three experimental tasks involving the choice behaviorof sow bugs were administered to a sample of fiflh and sixth grade students. Task 1 requiredstudents to design an experiment to determine if the bugs would choose a light or darkenvironment. Task 2 called for an experiment to determine if they would choose a wet or dryenvironment. Task 3 asked students to determine what combination of conditions from the firsttwo experiments (wet and dark, wet and light, dry and dark, or dry and light) the bugs wouldchoose.
The generalizability coefficient for a single experiment was .51 when the data from all threetasks were analyzed together. When the third task was excluded from the analysis, however, thegeneralizability coefficient increased to .62, showing that the first two tasks were more nearlyequivalent to each other than either was to the third experiment. The third experiment involvedthe crossing of two factors rather than the consideration of a single factor, and as Shavelson,Gao, and Baxter (in press) noted, such designs were not part of the elementary sciencecurriculum. Here, the first two tasks more nearly approximated the ideal of common intents,ancillary requirements, and error structures than did the set of all three tasks.
Few generalizability studies have clearly distinguished between tasks intended to beinterchangeable and those intended to measure different aspects of the subject-matter domain.Results such as those presented by Shavelson, Gao, and Baxter illustrate the importance of thisdistinction for the design of performance-based assessments and for the evaluation of theircomparability. They also suggest that greater use might be made of multivariate generalizabilitymodels in analyzing performance test data.
Comparability among tasks with the same intent, the same ancillary requirements, butdl~ferent error structures. If two tasks measure the same abilities but with different degrees ofprecision, they satisfi the requirements for calibration, Mislevy’s (1992a) andLinn’s(1993)second strongest form of linking. Large-scale testing programs rarely examine differences inprecision at the level of single tasks, but it is clear from a consideration of the calibration modelthat such differences could be important. Consider, for example, a writing assessment in whichresponses to two different writing prompts, X and Y, are scored using prompt-specific rubricsderived from the same “generic” scoring rubric. Suppose the correlation between students’ scoreson the two tasks is .64. It would be typical to treat the two tasks as parallel (in particular, equallyreliable) and to assume that each correlates .80 with the same underlying true score. But supposeprompt X is a little more ambiguous than Y, or its rubric is not as clear, or that anchor papers forX are not as well chosen. The correlation of .64 between the two tasks could equally well implythat Tasks X and Y correlate .750 and .853 with the true score, respectively. Following the logicof Linn’s (1993) discussion of calibration, if scoring rubrics are constructed so that comparableproportions of students are classified at each score level, the most able students would then havea better chance of receiving the highest classification using Task Y and weaker students wouldhave a better chance using Task X. Likewise, schools with the highest-achieving students wouldhave a relative advantage on Task Y and conversely.
66
Evidence about differences in error variances across tasks could be obtained in several ways.In the example above, differences between X and Y due to the anchor papers or rubrics used inscoring could be detected by comparing the interrater reliabilities for the two tasks. Differencesdue to the prompts themselves could be estimated from the correlations of Tasks X and Y withthose on a third prompt, say Z. Further evidence might be obtained by comparing patterns ofcorrelations of Task X versus Y with other variables, although any differences might reflectdiscrepancies in the tasks’ ability requirements as well as their error structures.
Comparability among tasks with the same intent, dljjjerent anci[lary requirement, and thesame error structures. If assessment tasks differ in their ancillary requirements, then scores onthose tasks will be comparable only if each is given to students in full command of the ancillaryabilities it requires. Conversely, any single task that relies on ancillary abilities that one group ofstudents possesses and another does not will be biased in favor of the fwst group. In particular,tasks with different ancillary requirements may be needed for comparisons across languagegroups or groups of students with different instructional histories. An example maybe helpfi,d.Consider the case of cross-national assessments where tests must be administered in severallanguages. The designers of such tests try to avoid knowledge or conventions that maybeunfamiliar in some countries, unless that knowledge is specifically what an item is intended tomeasure. Items are translated and back-translated to assure that the meanings of questions posedin different languages are as near to identical as possible. The goal of these efforts is a set of testsdiffering only in certain of their ancillary requirements. Ideally, all of the students taking a giventest would have fill command of the language in which it was written, so that apart from randomerror, score differences would reflect only what the tests were intended to measure. If amathematics test written in French, say, were given to students in France and the United States,it would be biased against U.S. students who lacked (ancillary) language abilities. Likewise, atest written in English would be biased against the French students. Matching the ancillaryrequirements of the test forms to those of the student populations greatly improvescomparability, although the absolute level of comparability attained is difficult to ascertain.
An analogous problem arises in trying to measure complex reasoning abilities amongstudents who have studied different topics in a given content area. Thinking must be aboutsomething. If the intent is to measure complex thinking processes, the content knowledge towhich those processes are applied may be regarded as ancillary to the intent of the measurement.Take as an example the idea of a food chain. In one classroom, children who have studied theecology of a meadow might construct a food chain with foxes, mice, and grass seeds. In anotherclassroom, children who have studied the ocean might construct a food chain with baleenwhales, krill, and phytoplankton. Some biology students may be able to discuss the relation ofstructure and fimction in the crayfish and others in the frog. Some students maybe able todiscuss number patterns in Diophantine equations and others in continued fractions. In each case,even if the reasoning processes are the same, those processes are applied to different knowledgestructures. An assessment tied to any particular curriculum will be biased against students whohave studied some other curriculum.
One response would be to attempt to construct a “curriculum-fair” test, with items sampledfrom a lot of different curricula, but that is not likely to be practical, especially not withperformance tests. Another approach would be to build items equally unfamiliar to all students,but that is likely to change the nature of what is measured, resulting in a test that depends moreon ‘G,’ or general mental ability. Moreover, the logic and rhetoric of performance testing call for
67
closer ties to the curriculum. Even if irrelevant, decontextualized items were fair to everyone,they would be rejected on other grounds. The most popular solution. is to offer students andteachers some degree of choice among alternative performance tasks intended to measure thesame thing, but as discussed below, such student or teacher choice brings its own complications.
As difficult as it is to approach comparability among tests written in different languages, thatproblem seems almost trivial compared to building comparable tests of higher-order thinkingthat reflect different curricula. At present, the best that can be hoped for appears to be linkage atthe level ofMislevy’s(1992a) orLinn’s(1993) moderation. Either human judges will have toreach consensus that alternative assessments reflect the same abstract petiorrnance standards(“social moderation”) or adjustments will have to be imposed based on the correlations ofdifferent assessments with some common anchor test (“statistical moderation”). As Linn andMislevy both discuss, linkages established in this way will require frequent reexamination. Theyare unlikely to remain stable over time or to be consistent across different groups of exarninees.
Comparability among tasks with the same intent, dij’jferent ancillary requirements, andd&Jerent error structures. Even tasks intended to be interchangeable are at best onlyapproximately parallel. It will be some time before our cumulative experience with performanceassessment is sufllcient to develop “rules of thumb” about the fictional exchangeability of tasksconstructed in different ways. Work like that of Shavelson, Gao, and Baxter, discussed earlier, isillustrative of the kinds of studies that will be required.
A more extreme case of assessments with the same intent but different ancillary requirementsand different reliabilities is a comparison of performance assessments, simulations, and writtenexaminations by Shavelson, Baxter, and Pine (1992). In this study, direct observations ofstudents performing hands-on science tasks were compared with a scoring of their notebooks,with their responses to computer simulations, with short-answer questions, and withmultiple-choice questions, all designed to measure the same content. The authors found that insome cases, computer simulations were fairly good surrogates for hands-on tasks, but thatpaper-and-pencil tests did not appear to measure the same capabilities. Correlations betweenhands-on and written task versions were only moderate. Hands-on performance was better forstudents who had received more innovative science instruction than for those who had not,whereas paper-and-pencil test scores did not differ for the two instructional groups. However,paper-and-pencil tests correlated more highly with standardized achievement tests than did thehands-on tests. Taken together, these results suggest that hands-on versus paper-and-pencil testsmeasure different things. In particular, hands-on tasks measured some abilities developedespecially through innovative science instruction (presumably part of the intent of themeasurement), whereas paper-and-pencil test scores were more influenced by (presumablyancillary) ability requirements that they had in common with the standardized achievement tests.
Comparability among tasks with dijferent measurement intents. If comparability is viewedas a purely technical problem, then the best that can be hoped for by way of linkage among taskswith different intents is projection or moderation (Linn, 1993; Mislevy, 1992a). Comparabilityamong single performance exercises designed to measure different abilities is problematical atbest, which may be one reason why generalizability studies of pefiormance exercises tend toshow such large person-by-task interactions. As noted earlier, ongoing research at the RANDCorporation and elsewhere should help to inform the levels of generalizability that can beachieved with tighter control over performance exercise content. One strong implication of this
68
analysis is that complex assessment tasks incorporating student or teacher choice should bedesigned to assure that whatever specific materials or questions are selected, some common setof target skills is engaged.
An alternative perspective on comparability among tasks with different measurement intentswould focus not on the adequacy of generalization to a common universe, but rather on the valueplaced on the disparate performances represented by the separate tasks themselves. Theperformance of student A on task X and of student B on task Y might be considered comparableif they represent distinct, nonexchangeable, even incommensurable, attainments that arenonetheless regarded in some sense as being of equal worth. TMs normative component is rarelymade explicit (Wiley & Haertel, in press). Even though the rhetoric of educational reform oftenstresses individualization, the theory and practice of educational measurement is almostexclusively concerned with the comparison of different students’ attainments with respect to acommon construct domain or intended learning outcome. In particular, some testing programs(e.g., portfolio-based assessments) offer teachers or students significant latitude in determiningwhat assessment tasks they will undertake or what work they will submit for evaluation. Whencommon scoring rubrics are applied to the resulting range of different performances, theyeffectively assign scores representing the value placed on a student’s attainment, as opposed todescribing the attainment itself (i.e., the score alone tells how good the student’s work was, butnot what the student did). There is a need for further development of both technical andphilosophical bases for making such judgments explicit and for reaching consensus about themeaning of such scores.
Student or teacher choice. In classroom testing, it has long been popular to include sets ofquestions among which students choose a specified number to answer, omitting the remainder.This practice is generally discouraged by measurement specialists because it muddies thegeneralization from the sample of tasks administered to the domain they represent. If studentsare free to choose, they will probably avoid questions to which they do not know the answer.Thus, one cannot ifier that a student who answers 80 percent of the attempted questionscorrectly would have about an 80 percent chance on another question randomly chosen from thedomain. Choice also reduces comparabili~ because the scorer must judge the relative quality ofstudents’ answers to different questions and because students will differ in their ability to choosethe subset of questions they can answer to best advantage. Thus, test wiseness looms largeramong the constructs actually measured. Despite these disadvantages, as explained in the lastsection, comparability could in principle be improved if students or teachers could select tasksrequiring ancillary skills that matched their own capabilities from among a set of tasks havingthe same measurement intent. Thus, for example, some students might choose a food-chainassessment based on the ecology of a meadow, and others a food-chain assessment based on theecology of the ocean.
Performance assessments in some large-scale testing programs have given students orteachers choices among alternative texts. Students may be offered a choice of what to read, toincrease their motivation or to provide a context for studying their ability to offer reasonedjustifications for such choices. Teachers might be offered choices in the materials used withyounger children so that they can make allowances for differences in their interests or levels ofreading ability.
69
The NAEP began to experiment with student choice in the 1992 Reading Assessment.Students at grades 8 and 12 were given paperback anthologies containing seven stories of about1,000 words each, selected from various sources of authentic young-adult publications, bydifferent authors and featuring a range of cultures. During the 50-minute testing period, studentswere to select and read one story and then answer twelve questions about why they chose thestory they did, how they liked it, and about plot, theme, character, setting, and any personalrelevance the story might have had to themselves. Clearly, allowing students to choose a storyreduces comparability because the stories might not be equally difficult or the questions askedmight not apply equally well to all of them. Most problematical, student choice in this contextcomplicates generalization about the entire eighth or twelfth grade population’s performance onany specific story. Further research in subsequent NAEP Reading Assessments should help togauge the magnitude of these potential effects. NAEP Readers are to be given to nationallyrepresentative samples under a condition in which a specific story is assigned as well as underthe choice condition. It should thus be possible to learn how students perform on a story theyhave chosen versus one randomly assigned.
In the matrix sampling situation where students respond to different matrixed tasks, it isreasonable to assume that each task would be answered similarly if administered to a different,randomly equivalent sample. Hence, the data may be treated statistically as resembling a set ofresponses to a long test (formed from all of the alternate test forms together), with data missingat random. Where students choose which task to complete, the problem is complicated becausethe missing data are no longer random. Consequently, one may no longer assume that onaverage, each task would be answered in the same way by those examinees who did not respondto it as by those who did. As discussed by Allen, Holland, andThayer(1993) and Wainer, Wang,and Thissen (1994), equating tests where examinees choose which problems to attempt dependson strong, usually untestable assumptions. Furthermore, recent experimental evidence presentedby Wang, Wainer, and Thissen (1 995) raises serious doubts about the viability of thoseassumptions.
The 1991-92 administration of the Standard Assessment Tasks (SATS) to 7-year-old childrenin England illustrates some potential problems when teachers are offered choices. A task wasincluded at Level 2 that asked children to read aloud from one of 20 specified books (Gipps,1993). The teacher could select any of the 20 books for any given child. As a result, somechildren were asked to read from a book that was new to them while others were asked to readfrom a book with which they were quite familiar. As noted by Gipps, “obviously for somechildren the task was much easier since they already knew the story and had practiced reading it”(p. 11). Reading aloud from an unfamiliar book and reading aloud from a book after havingpracticed the reading may both be skills worthy of assessment, but tasks calling for one or theother should not be considered interchangeable. Such variability in assessment conditionsseriously undermines the comparability of children’s performances.
In current student portfolio systems, even “required” entries offer considerable latitude forstudent choice. One required entry from the 1991-92 Kentucky Instructional Results ItiorrnationSystem (Kill IS) writing portfolio, for example, was “A personal response to a cultural event,public exhibit, sports event, media presentation, or to a book, current issue, math problem, orscientific phenomenon”. Such broad specifications reflect the tension between instructional andaccountability purposes for portfolios. Considerable value is placed on giving students theopportunity to choose what they consider their best work, but comparability is necessarily
70
compromised. Less standardized entries are more difficult to compare and opportunities forsavvy students or teachers to make strategic choices are increased.
Comparability of Tests Including Performance ExercisesThis last major section moves from the level of individual exercises to entire tests or exercise
pools. Even though current assessment programs still rely primarily upon objective writtenquestions, the discussion focuses on a hypothetical assessment comprising performanceassessments only. The section begins by discussing the importance of clear contentspecifications for any assessment, and then argues that in order to assure comparability overtime, assessments using performance exercises may require more detailed and more fine-grainedcontent specifications than are typical of current assessment programs.
The importance of content specljlcations in large-scale assessments. A major goal of mostlarge-scale assessment programs is to provide scores that are comparable over time. In principle,such comparability requires that the content assessed remain the same. Mislevy(1992b, p.200)for example, acknowledges that despite the appropriate and successful use of unidimensionalstatistical models to scale NAEP data, the NAEP exercise pools are not really unidimensional.He likens the exercise pool to the standard market basket of goods used to calculate theConsumer Price Index. If the NAEP’s “market basket of skills” is changed, then the meaning ofNAEP scale scores is changed.
That being said, for large-scale assessments that rely almost exclusively on brief, objectivetest questions, close attention to the precise content assessed does not seem to be very important.A large number of items are used, so that each specific item has only a small influence onaggregate score distributions. Moreover, most items are retained from one assessment cycle tothe next, so that even if items added to the pool are somewhat different from those removed, theoverall content mix changes only slowly. Finally, in assessments using item-response theory(IRT) methods, the difficulty of each new item is automatically accounted for as it is added tothe pool, and items measuring abilities less highly correlated with the major dimension assessedby the entire pool maybe assigned lower discriminations and thereby receive less weight.
IRT equating and gradual replacement of exercises notwithstanding, as ideas aboutcurriculum and instruction have evolved and curriculum frameworks have been revised, therehave at times been significant shifts in the kinds of content tested. Turning once again to NAEP,Baldwin (1989) and Pandey (1 989) documented substantial shifts over time in the proportions ofreading and mathematics exercises classified into different content categories. Even trends overadjacent time intervals have been based on quite different content mixes.
Minor shifts in content from year to year are tolerated in any assessment program, as someexercises are retired due to technical flaws, because they have been published as illustrativeitems or because some aspect of their content has become dated. The new items created toreplace such retired items rarely measure the identical skills. Nonetheless, major shifts in contentmay require the introduction of a new scale and the start of a new trend line. The shifis in theNAEP content frameworks and assessments, for example, were judged to be too great for the1990 mathematics assessments and the 1992 reading assessment to continue the same scale andtrends. As was stated in the 1992 reading assessment report, “the changes in the 1992 readingframework and assessment activities preclude any comparisons between the results of this reportand those for previous NAEP reading assessments” (Mullis, Campbell, & Farstrup, 1993, pp.
71
2-3). Comparisons to prior assessments are accomplished by “readministering the long-termreading assessment” (p. 3) to special trend samples. Thus, for a period of time after a major shiftin the exercise pool, NAEP actually maintains two trend lines reflecting the old and the newhrneworks and assessment activities.
Content speczjicationsfor assessments based on performance exercises. With performanceexercises, careful and detailed specifications become much more important. Not only themeasurement intents but the exercise format, ancillary content, and other characteristics mayneed to be specified, possibly down to the level of individual exercises. This is because relativelyfew performance exercises can be used and each is generally designed to measure somethingdifferent from all the others. Detailed content specifications also take on greater importance withperformance exercises because on the whole, they are more heterogeneous in format (andtherefore ancillary requirements) than objective written test questions. More detailedspecifications are called for because there is more to specifi. Timing, materials, specificadministration instructions and conditions, and other aspects of performance exercises are morevariable than for multiple-choice questions.
It is no surprise that in general, the performance exercises included in large-scale assessmentseach measure a distinct learning outcome. Because of their cost in development, administrationtime, scoring time, and other resources, relatively few performance tasks can be included in anassessment. At the same time, most assessments must sample broad content domains, defined byambitious, inclusive documents like the NAEP content Ikuneworks or state curriculumfi-ameworks often covering a year or more of instruction. Every exercise has to contribute asmuch as possible. The information gained by adding a task covering some new curriculumelement is greater than that gained by adding redundant measures of content-and-processcategories already sampled.
The facts that performance exercises are fewer in number and more distinctive imply thatthey must be sampled with greater care than multiple-choice items if the “market basket” ofknowledge and skills assessed is to remain stable over time. Rather than treating a successiveyear’s tasks as another random sample from a broad content domain, new exercises could beconstructed such that each was closely parallel to the specific exercise it was intended to replace.Such a detailed sampling plan would permit the more fme-grained psychometric analysisdescribed below.
Evacuating comparability ofperformance-based assessments. Statistical analyses of testsare largely divorced from content analyses. Although factor analysis may be used to establishthat a heterogeneous collection of items is “sufficiently unidimensional” to justify IRT scaling, itis common to ignore finer content distinctions when items are scaled. In test design, itemselection is often aimed primarily at assuring sufficient precision throughout the measurementrange, with content representativeness being treated merely as a constraint, (i.e., a certainnumber of items must come from each content category). Analytical methods that wereappropriate for tests comprising many brief items are proving inadequate for tests comprising asmaller number of more costly items, more carefi.dly chosen. New statistical methods may beinvented (e.g., Haertel & Wiley, 1993), but in the meantime, it maybe possible to do a better jobwith current statistical tools.
Consider a test or exercise pool comprising ten performance exercises. All ten might beadministered to each examinee to obtain an individual score, or the ten exercises might be
72
administered to distinct random samples of students in a school in order to obtain a school-levelestimate of overall achievement. Under the analysis proposed, detailed specifications would beprepared for each of the ten separate exercises, each specification describing a sfrarum that thecorresponding exercise represented. Then another, corresponding set often exercises would bewritten, closely parallel to the first ten. There would now be two exercises in each stratum. Thepurpose of this finer stratification of the exercise domain and the additional exercise constructionwould be to unconfound random and task-specific variance from that attributable to the distinctmeasurement intents of different exercises (each different intent corresponding to its ownstratum). It is, of course, an unanswered empirical question what degree of error reduction wouldbe possible. The answer would depend on the relative magnitudes of within-stratum andbetween-stratum variation. (See Cronbach, Linn, Brennan, & Haertel, 1995, for furtherdiscussion).
In a series often separate generalizability studies, each pair of parallel exercises would beadministered to a sample of examinees to assess within-stratum generalizability, and the resultsof these analyses would be used to estimate the precision of a composite score treating exercisewithin stratum as random, but stratum as fixed. Error variances calculated in this way might beconsiderably less than the those calculated under the assumption that the ten tasks are allrandomly sampled from a single, undifferentiated pool.
This model is not without its difficulties. To begin with, most performance exercises appearto be unique. It would be no easy task to define what each was measuring in a way that wassufficiently specific to realize the benefits of tighter control on assessment design and at thesame time sufilciently general to permit the creation of one or more parallel forms. And a.fler thespecifications were written, the work of creating additional exercises and carrying out all those Gstudies would still remain. Perhaps most serious, in a typical assessment the ten carefullyspecified strata would encompass only a small fraction of the content the assessment wasintended to represent. The idea of fielding assessments year tier year that amounted to minorvariations on the same ten exercises would seem unappealing. If the assessment werehigh-stakes, instruction would soon focus on those ten strata, and the validity of the assessmentas a measure of the original, broader domain would erode.
In fact, there would be no need to limit the evolution of the test through time, Rather, itwould be accepted that part of the work of developing a petiormance exercise was at the sametime to speci@ its “shell,” that is, its stratum definition, and, at least for purposes of analysis, toconstruct a second exercise conforming to the same shell. Comparisons over time would bebased only on common shells, but during each assessment cycle some new shells could beintroduced. Data could be analyzed both to give precise estimates of status and trends withrespect to a particular “market basket of skills” and also to obtain more honest estimates ofgeneralizability to broader universes (see Kane, 1982, for tier relevant discussion). Over time,the cumulation of studies focusing on domains in different content areas, defined in differentways and at different levels of specificity, would lead to steady improvements in the technologyof performance assessment.
SummaryComparability of performance exercises is a complex topic, encompassing multiple concerns
of greater or lesser importance in any given situation. This chapter’s discussion is somewhat
73
theoretical due to the paucity of empirical studies on performance tasks constructed followingspecific, replicable procedures. Although most of the specific threats to comparability ofperformance assessments also pertain to brief, objective, written test questions, their magnitudeis greater for performance exercises because fewer such items are used in a typical test andbecause standardization is often considerably weaker for these types of items. In this chapter, wefirst examined the comparability of scores obtained using a single assessment task. Even holdingthe task constant, comparability may be limited due to uncontrolled variation in administrationconditions, inclusion of group activities in the assessment, or task definitions that incorporatestudent or teacher choice concerning the specific tasks attempted or materials used. Also, testsecurity may be more difficult to maintain for performance exercises, threatening comparabilityif tasks are reused with the same students or with different classes in the same school duringseveral periods of the school day. Additional issues include consistency in scoring and the use ofperfommnce exercises with different student populations, especially students from differentlanguage groups, with handicapping conditions, or with different instructional histories.
Occasions often arise when scores on two or more different performance exercises must becompared, most notably when students or teachers are offered a degree of choice in theperformance exercises selected. The chapter next turned to comparability across performanceexercises, considering first the case of two exercises intended to measure the same knowledge,skills, or dispositions (same measurement intent); requiring the same additional, enabling skills(common ancillary requirement@ to respond to the performance task itself and having equallevels of accuracy (common error structures). Two such exercises satis~ the requirements forstatistical equa[ing, and present minimal problems of comparability.
The next case considered was that of common intents and ancillary requirements but differenterror structures. Tasks with this degree of similarity satisfy the requirements for statisticalcalibration, a weaker form of Iihkage than equating. For some purposes, one would want scoringrubrics for two such tasks to classi~ examinees in such a way that scores on the less reliable taskhad higher variance, and for other purposes, one would want the variances to be the same.Information on reliability at the level of specific tasks is rarely reported, but would not beespecially difficult to obtain, and would be helpful in making decisions about categoryboundaries in scoring rubrics and other aspects of data analysis.
The case of common intents, different ancillary requirements, and common error structuresarises when performance exercises are translated into different languages (as in cross-nationalassessments) or when higher-order thinking is compared for students studying different curriculaby having each group reason about the material they have studied. As a practical matter, it islikely that the highest level of comparability attainable across curriculum-specific assessmentswill be that of statistical or social moderation.
Tasks intended to measure the same learning outcomes but having different ancillaryrequirements and error structures might include pefiormance tests versus paper-and-pencil“surrogates.” Here again, linkage at the level of statistical or social moderation is probably thebest that can be attained. The same is true a fortiori of tasks with different intents.
The third major section of the chapter turned to comparability at the level of entire tests.Here, many of the concerns of the previous chapter are somewhat mitigated because the specificqualities of each item count for less in a composite score. It is argued that imprecision could bereduced and that the remaining imprecision could be evaluated more accurately if content
74
specifications for perfonmmce exercises were prepared in greater detail and tests wereconstructed as purposively weighted collections of tasks sampled from narrow content domains.Some practical implications of such test design strategy were considered. It maybe hoped thatover time, the cumulation of studies on methods of domain definition and performance taskconstruction will lead to better assessment technology to improve educational practice.
75
Notes1 This may be 1v“ewed as a threat to comparability, but Moss, Beck, Ebbs, Matson,
Muchmore, Steele, Taylor, andHerter(1992) offer another interpretation. They argue thatclassroom teachers are privileged observers, able to bring a richer interpretive context to bear inevaluating their own students’ work: “The central interpretation will be the classroom teacher’sinterpretation, and it will be based not only on the portfolios but also on extensive knowledge ofthe students, their goals, and their instructional opportunities... .This approach . . . acknowledgesthe singular value of the teacher’s knowledge base in making interpretations, which cannot beduplicated by outside readers” (Moss, et al., 1992, p. 19). It might be added by way of rejoinder,however, that privileged observers can also be biased observers.
‘In using the term “intent, “ we do not mean to imply that intentions are sufficient. Todisentangle these components and determine the extent to which each is reflected in actual testscores would require supportive evidence from empirical research.
3Large person-by-task interactions may also be reported because variance componentsrepresenting the person-by-task interaction and the person-by-task-by-occasion interaction areconfounded. The latter, three-way interaction represents the instability across a singleindividual’s (hypothetical) repeated trials on the same task. The total of these two variancecomponents is often labeled “person-by-task interaction.”
76
References
Allen, N. L., Holland, P. W., & Thayer, D. T. (1993). The optional essay problem andhypotheses of equal dr~culty (ETS Technical Report No. F@-93-40). Princeton, NJ:Educational Testing Service.
Baldwin, J. (1989). Reading trend data from the National Assessment of Educational Progress:An Evaluation. In National Center for Education Statistics, Report of the NAEP TechnicalReview Panel on the 1986 Reading Anomaly, the Accuracy of NAEP Trenak, and IssuesRaised by State-Level NAEP Comparisons (Report No. CS 89-499, pp. 85-94). Washington,DC: U.S. Department of Education, Office of Educational Research and Improvement.
Cronbach, L. J., Gleser, G. C., Nanda, H., & Rajaratnam, N. (1972). The dependability ofbehavioral measurements: Theory of generalizability for scores andprojiles. New York:Wiley.
Cronbach, L. J., Linn, R. L., Brennan, R. L., & Haertel, E. H. (1995). Generalizability analysis foreducational assessments. Evaluation Comment (Summer 1995, whole issue). Los Angeles,CA.: Center for the Study of Evaluation&National Center for Research on Evaluation,Standards, and Student Testing, University of California at Los Angeles.
Dunbar, S. B., Koretz, D. M., & Hoover, H.D. (1991). Quality control in the development anduse of performance assessments. Applied Measurement in Education 4,289-303.
Frederiksen, J. R., & Collins, A. (1989). A Systems Approach to Educational Testing.Educational Researcher, 18(9), 27-32.
Gipps, C. V. (1993, April). Reliability, validity, and manageability in large-scale performanceassessment. Paper presented at the Annual Meeting of the American Educational ResearchAssociation, Atlanta, GA.
Haertel, E. H., & Wiley, D. E. (1993). Representations of ability structures: Implications fortesting. In N. Frederiksen, R. J. Mislevy, &I. Bejar (Eds.), Test theory for a new generationof tests (pp. 359-384). Hillsdale, NJ: Erlbaum.
Kane, M. T. (1982) . A sampling model for validity. Applied Psychological Measurement, 6,125-160.
Linn, R. L. (1993). Linking results of distinct assessments. Applied Psychological Measurement,6, 83-102.
Linn, R. L., Graue, M. E., &: Sanders, N. M. (1990). Comparing state and district test results tonational norms: The validity of claims that “everyone is above average”. EducationalMeasurement: Issues and Practice, 9 (3), 5-14.
Madaus, G. F. (1988). The influence of testing on the curriculum. In L. N. Tanner (Ed.), Criticalissues in curriculum (Eighty-seventh yearbook of the National Society for the Study ofEducation, part 1, pp. 83-121). Chicago: University of Chicago Press.
Mislevy, R. J. (1992a). Linking Educational Assessments: Concepts, Issues, Methods, andProspects. Princeton, NJ: Educational Testing Service, Policy Information Center.
77
Mislevy, R. J. (1992b) Scaling procedures. In E.G. Johnson& N.L. Allen (Eds), The NAEP 1990Technical Reporl (Report No. 21 -TR-20, pp 199-213). Washington, DC: National Center forEducation Statistics, Office of Educational Research and Improvement, U.S. Department ofEducation.
Moss, P. A., Beck, J. S., Ebbs, C., Matson, B., Muchmore, J., Steele, D., Taylor, C., & Herter, R.(1992). Portfolios, accountability, and an interpretive approach to validity. EducationalMeasurement: Issues and Practice, 11(3), 12-21.
Mullis, I. V, S., Campbell, J. R., & Farstrup, A. E. (1993). NAEP 1992 Reading Report Cardforthe Nation and the States. Report No. 23 ST06. Washington, DC: National Center forEducation Statistics, U. S. Department of Education.
Pandey, T. (1989). Mathematics trends in NAEP: A comparison with other data sources. InNational Center for Education Statistics, Report of the NAEP Technical Review Panel on the1986 Reading Anomaly, the Accuracy of NAEP Trena%, and Issues Raised by State-LevelNAEP Comparisons (Report No. CS 89-499, pp. 95-108). Washington, DC: U.S. Departmentof Education, Office of Educational Research and Improvement.
Shavelson, R. J., Baxter, G. P., & Gao, X. (1993). Sampling variability of performanceassessments. Journal of Educational Measurement, 30, 215-232.
Shavelson, R. J., Baxter, G. P., & Pine, J. (1992). Petiormance assessments: Political rhetoricand measurement reality. Educational Measurement, 21(4), 22-27.
Shavelson, R. J., Gao,X. & Baxter, G. P. (in press). On the content validity of performanceassessments: Centrality of domain specification. In M. Birenbaum, R Dochy, & D. VanAalsvoort (Eds.), European innovations in assessment and evaluation. NorWell, MA: Kluwer.
Wainer, H. Wang, X-B., & Thissen, D. (1994). How well can we compare scores on test formsthat are constructed by examinees’ choice? Journal of Educational Measurement, 31,183-199.
Wang, X-B, Wainer, H., & Thissen, D. (1995). On the viability of some untestable assumptionsin equating exams that allow examinee choice, Applied Measurement in Education, 8,211-225.
Webb, N.M. (1995). Group collaboration in assessment: Multiple objectives, processes, andoutcomes. Educational Evaluation and Policy Analysis, 17,239-261.
Wiley, D. E., & Haertel, E. H. (in press). Extended assessment tasks: Purposes, definitions,scoring, and accuracy. In R. Mitchell (Ed), Implementing Performance Assessment:Promises,, Problems, and Challenges. Hillsdale, NJ: Erlbaum.
Yen, W. M. (1993). Scaling petiormance assessments: Strategies for managing local itemdependence. Journal of Educational Measurement, 30, 187-213.
78
Setting Performance Standards for PerformanceAssessments: Some Fundamental Issues, Current
Practice, and Technical DilemmasRichard M. Jaeger
Universi@ of North Carolina, Greensboro
Ina V. S. MullisBoston College
Mary Lyn BourqueNational Assessment Governing Board
Sharif ShakraniNational Center for Education Statistics
Since the turn of the century, with the pioneering work of Binet, human cognitive abilitieshave been broadly assessed by administering selected-response, pencil-and-paper tests thatpurport to measure various achievements, aptitudes, and knowledge that are held to be indicativeof success in school and of schooling, prerequisite to effective performance in academic pursuits,essential to success in a wide variety of careers, and predictive of performance on the job.Selected-response tests that require the darkening of small bubbles with number 2 pencils havegrown to be a cultural universal in schools, when seeking employment, and when seekingprofessional licensure and certification.
Just in the past few years, the validity of selected-response, pencil-and-paper measures ofschool achievement and skill-based knowledge has been widely challenged. The use ofselected-response tests of students’ subject-matter achievement in every state in the Union hasexposed the “Lake Wobegon Effect,” wherein the average achievement of every state, and ofmost large school systems, was found to be above the national average (Cannell, 1987). Studiesof the consequential validity of standardized tests of student achievement (cf., Smith, 1989 andShepard, 1990), have shown that such tests drive curricula and instruction in the nation’sschools. Lorrie Shepard (1990), Lauren Resnick (1990) and others have demonstrated thatcurrently-used standardized achievement tests are grounded in the cognitive psychology of the1970’s, where it was assumed (falsely) that hierarchical learning of basic skills was prerequisiteto students’ acquisition of the higher-order analytic skills that are the real objective of formaleducation.
A new day has arrived in the testing of students. At the national level, through the NewStandards Project (Resnick & Resnick, 1992) and the National Assessment of EducationalProgress (NAEP; cf., Applebee, Langer, Mullis, Latham & Gentile, 1993), and in a number ofstates (e.g., California, Vermont, Maryland; cf. Aschbacher, 1991), test-like devices that attemptto measure students’ skills and abilities to pefiorrn various tasks directly are under developmentor in use. These “performance assessment” measures are changing@e landscape of studentassessment. Rather than presenting students with printed multiple-choice questions that require
79
selection of a correct option from among those presented, performance assessments requirestudents to construct responses to a wide range of problems. Performance assessments have beentermed “authentic assessments, ” since they often provide tasks that require problem-solvingskills, and present challenges that are thought to model realistic applications that students willface later in life.
IntroductionIn the enthusiasm that surrounds the new assessment methodologies, it must be realized that
the demands of sound educational and psychological measurement are ever-present.Assessments of students’ abilities must satisfi professional measurement standards, asexemplified in the 1985 Standards for Educational and Psychological Testing, regardless of thetesting and measurement method used. If the potential of performance assessments of students isto be realized, such assessments must be demonstrated to yield measurements that(1) aresufficiently reliable to support the selection or classification of individuals or the evaluation ofaggregates of students at local, state, or national levels, (2) validly support inferences concerningthe achievements, aptitudes, and performance capabilities of those assessed, (3) fairly, and in anunbiased way, reflect the abilities of those assessed without regard to gender, race, ethnic groupmembership, or economic circumstance, and (4) when performance standards must be set,support the classification of exarninees into decision-relevant categories (e.g., worthy ofadmission, certification, licensure, graduation, etc.) or their labeling as “basic,” “proficient,”“advanced,” etc.
Unfortunately, much of the available methodology for assessing the psychometric quality ofmeasurement instruments was developed with selected-response tests in mind. In large part, theapplicability of this methodology to performance assessment measures is either obviouslylimited, questionable, or untested. For example, currently-used methods for establishingperformance standards on tests either demand pencil-and-paper, multiple-choice test items(Nedelsky, 1954) or presume the use of selected-response achievement test items (Angoff, 1971;Ebel, 1972; Jaeger, 1982).
This chapter is concerned with one component of the psychometrics of performanceassessment: methods for setting performance standards on large-scale performance assessmentsof students. This topic is essentially unexplored in the educational and psychological testingliterature although some practice-based experience has been accumulated in conjunction withNAEP, the teacher assessment program of the National Board for Professional TeachingStandards, and some statewide assessments of students. Even though methodology for settingperformance standards on performance assessments is embryonic, we attempt in this chapter todefine critical issues, review what is known and being done, and define a research agenda thatcan guide fhture inquiry. As the reader of this chapter will learn, the state of the art is far from astate of grace. Much work remains to be done.
Performance standard-setting is a judgmental process. Its results are therefore subjective bydefinition. Of necessity, the outcomes of any performance standard-setting process are arbitrarybut they need not be capricious. Effective standard setting requires that qualified persons makereasoned judgments in response to questions that are understandable and within their ability tojudge, following well-structured efforts to inform them about the nature and consequences of thealternatives they face.
80
Many of the conclusions derived from two decades of research on performance-standardsetting for selected-response tests can be expected to generalize to performance assessments.First, performance standards rarely occur naturally (one relatively rare exception is in someperformance assessments in the military, where correct completion of a task; e.g., cleaning a riflecorrectly, is directly observable and can be scored “pass” or “fail”). Far more oflen, the boundarybetween performances judged to warrant classification as a passing performance or eligibility forvalued rewards, and those that do not, result from a process of negotiation or arbitration.Performances judged acceptable or worthy will most often differ in magnitude, rather than kind,from performances judged to be unacceptable or inadequate. It is this conclusion, as much as anyother, that has led some to label all standard-setting processes as capricious (cf., Glass, 1978).
Second, pefiormance standards are method-dependent. Specification of performance thatwarrants graduation, certification, classification as proficient, etc. depends to a substantial degreeon the method used to elicit judgments from those who set performance standards (for asummary of literature on this point, see Jaeger, 1989).
Third, those who set performance standards cannot be assumed to be trustworthy judges ofthe quality of the methods they have used. Virtually all surveys of panelists who set performancestandards have concluded that such panelists are “somewhat confident” to “very confident” aboutthe quality of their resulting standards, regardless of method they have used and subsequentempirical evidence concerning the coherence and consistency of the performance standards theyhave set.
Finally, widely-used performance-standard-setting methods presume the existence of anunderlying interval scale of performance on the test or assessment for which standards are to beset. This conclusion follows from the first (above), from the typical practice of averaging thestandard-setting recommendations of members of standard-setting panels, and from the use ofparametric statistical procedures in evaluating the precision, consistency, and coherence ofpefiormance standards. As will be noted below, performance assessment exercises are typicallymultidimensional in their measurement characteristics, are rarely exchangeable, and are,therefore, far less likely to satis@ the local independence assumptions of unidimensional scalingmodels. Such exercises violate the assumptions that underlie typical performance-standard-setting methods.
The Structure of This ChapterThe balance of this chapter consists of three major sections and a summary. In the next
section, under the heading “Some Fundamental Issues in Performance Standard-Setting,” wedescribe typical institutional and individual applications of pefiormance standard-setting so as todelineate the contexts in which new methods of setting performance standards for performanceassessments would be used. We also build the case that the performance-standard-settingmethodology of the past is not applicable to a wide range of performance assessments in thesecontexts.
In the third section of the chapter we provide prominent examples of early efforts to establishperformance standards for performance assessments. These examples include the NationalAssessment of Educational Progress, the assessment of highly accomplished teachers by theNational Board for Professional Teaching Standards, and a variety of statewide assessments ofstudents.
81
The fourth section of the chapter, under the heading “Some Technical Dilemmas,” addressessuch issues as the artificial polytomization of the performance continua to which standard-settingmethods must be applied, the method-dependent nature of performance assessments, and a hostof other technical issues that must be addressed in setting performance standards on performanceassessments.
In our summary and conclusion we indicate important methodological and procedural issuesthat are yet to be addressed by the known methodology of setting performance standards forlarge-scale performance assessments, thus providing a rudimentary road map to needed research.
Some Fundamental Issues in Performance Standard-SettingAmong the various reform movements affecting our Nation’s schools, two thrusts in
particular have major implications for the tests used in student assessments, First, the educationcommunity, including teachers and curriculum specialists as well as politicians and educationalpolicy makers are diligently working to develop standards-for discipline-oriented curricula, forassessment, and for the delivery of educational services. Greatest attention to date has focused onthe curriculum standards speci~ing what students must know and be able to do to be consideredproficient in various subject-matter areas. The first such standards were released by the NationalCouncil of Teachers of Mathematics in 1989. Since that time, at least a half-dozen otherprofessional organizations and collaborative have made substantial progress toward similardocuments for other academic disciplines. Currently, curriculum standards in civics, geography,history, foreign languages, science, social studies, and the arts have been released. However, fewof these documents contain formal performance standards, although some provide a fewillustrations.
Simultaneously, there has been growing concern that assessments should directly addressmore complex types of learning than those measured by conventional tests (National Council onEducation Standards and Testing, 1992). In addition, assessments should require applications ofknowledge and skills to “real-world” situations faced by individuals at work, in their own lives,and as citizens of a community. These more “authentic” forms of assessment require taskperformance in contexts that reflect the realities of everyday life, rather than simply providingisolated bits of information or knowledge (Wiggins, 1993). Taken together, these two reformthrusts signal the need for assessments that emphasize how well students can perform particulartasks vis-a-vis subject-matter standards. Further, the more that such performance assessmentsfocus on the complexities of problem-solving and reasoning rather than declarative knowledge,comprehension, or routine application skills, the more consistent they will be with the goals setforth in the current curriculum standards.
If performance assessments are to be used in accountability-based strategies for promotingsystemic educational reform, the issue of designing methods for setting perfommnce standardson performance assessments must be addressed. A number of national and local assessmententerprises are beginning to examine this issue, notwithstanding the inherent complexitiesassociated with developing curriculum standards, with developing performance assessments thataccurately measure proficiency on those standards, and with establishing clear and concreteunderstandings of what evidence students should provide to show that they have met thestandards.
82
How Performance Standards Are UsedBefore tackling the numerous challenging technical and procedural issues implicit in this
dramatic change in educational testing approaches, it is important to understand the variouspurposes of educational testing and potential uses for the itiormation provided by performancestandards. For this discussion, we have identified two broad classes of applications: thosepertaining to institutions and those pertaining to individuals.
The two applications can differ considerably regarding the amount of detail required for anindividual. The needs for information about institutional quality generally are more global innature, because such data typically are used for making relatively long-term as compared today-to-day decisions. Sampling of individuals can be used in assessing institutions, given that itis not necessaxy to obtain broad-based information about the performance of each individual. Byassessing different aspects of curricuhun standards for various representative groups of students,information can be aggregated across the different groups to develop a picture of educationalperformance for an entire institution or system.
In contrast, itiormation for making decisions about individuals often needs to becomprehensive and timely because it may directly influence an important andrelatively-immediate decision about selection or placement of the individual into an educationalprogram or institution.
There are similarities in the ways that institutional and individual performance assessmentresults can be used. Both types of assessments can be used for formative or summative purposes.Feedback about success with particular aspects of curriculum can be used on an ongoing basis tomake adjustments in an institutional program or pedagogical approach, or to develop specificremedial steps for individual students. Beyond such formative uses, assessments or tests alsocan provide the basis for final decisions about institutions, programs, or individuals. Forexample, schools or school systems may participate in summative evaluations to receiveaccreditation and students may need to pass a test to graduate from high school, or becomelicensed in a profession.
Institutional Applications of Performance Standard-SettingDescription for Public Information. Foremost among the uses of petiormance
standard-setting is the public’s right to know about the quality of our educational system and itsproducts. Society as a whole has a vested interest in knowing whether today’s graduates have theknowledge and understanding necessary to contribute to an Mormed citizenry and whether theycan be relied upon to set enlightened policy for the future. Employers deserve to know whetherstudents have the knowledge and skills required to meet daily production needs or for our nationto compete in a global economy. Parents want to know that their children are receiving ahigh-quality education, and students themselves should be interested in whether they arebecoming well-prepared for adult life.
Public Accountability. Beyond the basic right to know, those responsible for funding andproviding oversight for various aspects of the nation’s education system need information tomonitor schools’ performance. Whether for the nation, a school-distric~ or a school building,student achievement results can be used to provide guidance on how resources invested ineducation might be augmented or used differently. Information ab’out students’ competencies can
83
also be used in formulating approaches to improving education. With the publication of theNational Commission on Excellence in Education report, A Na/ion at Risk, and generaldiscontent from employers and parents about the effectiveness of America’s schools, the call foraccountability information has been growing for more than a decade. In fact, this widespreadconcern has contributed directly to the movement toward a standards-based education system,including assessments to monitor students’ progress in attaining performance standards. The roleof assessments increasingly includes helping to define and guide instruction to make it moreeffective. The content of assessments impresses on students, school staff, and parents theimportance of tested subject matter and associated expectations for learning.
Program Evaluation. One particular kind of accountability information concernsassessments about special programs designed to address the needs of particular groups ofstudents. For example, special programs have been developed for students with limitedproficiency in English, students determined to be at increased risk of academic failure due todisadvantaged socioeconomic backgrounds (e.g., ESEA, Chapter 1), or to provide specialopportunities for high-achieving and talented students. Information needs about particularprograms relate to decisions about sets of practices or groups of students within the educationsystem, school district, or school.
Individual Applications of Performance Standard-Setting
Selection. One of the better known uses of educational testing in the United States is forselection for college entrance, with many high school students taking either the SAT or ACT aspart of the college admission process. However, students may also take tests to be admitted tospecial programs or schools, such as those designed for students with special aptitudes in scienceor the performing arts. Although neither the ACT nor the SAT program recommends the use offixed performance standards for college admission, the practice is, unfortunately, widespread.
Classz@ation. Sometimes related to selection, the major purposes of classificationassessments are to match students’ performance levels against pre-set criteria to assign studentsor apportion them to different treatments, curricula, or programs. For example, a student mightreceive compensatory education, be placed in an advanced mathematics program, or be retainedat the same grade level based, in part, on test results. Such assessments can document accuratelyeach student’s progress at the end of an extended period of instruction. These data can be used toprofile students’ strengths and weaknesses in particular areas, serving a diagnostic as well as aplacement fhnction.
Certification. Certification serves a public function, enabling individuals to demonstrate toothers that a certain standard of performance has been met or that a certain set of skills has beenmastered. That is, the individual who has been certified will be known to have completed aparticular course of study and to have demonstrated a specified criterion of performance. Thepublic then expects the individual to be able to perform particular tasks or fimctions. Althoughthe Advanced Placement program involves testing for the receipt of credit for particularfirst-year college courses and some school districts test students to certifj levels of minimalcompetence as part of receiving a high school diploma, certification is used less as part of thepublic education system in the United States than in some other countries (e.g., the FrenchBaccalaureate, the Abitur in Germany, and the British Public Examinations). Test-basedcertification, however, is widely used as a professional endorsement of candidates’
84
employability in the United States. For example, licensing or certification occurs for nurses,accountants, architects, lawyers, and in many other occupations and professions. Also, theNational Board for Professional Teaching Standards is developing procedures for advancedteacher certification. Currently, efforts are underway to develop standards for many moreoccupations, and employers have suggested certification as part of the public education process.
In Learning a Living, the Commission on Achieving Necessary Skills (SCANS) for effectivejob performance recommended that students should develop a cumulative re.wud containinginformation about courses taken, projects completed, and assessment results. As students met thestandards set for specific skills, that mastery would be noted on their r&.un& When students hadmet the standards across courses and SCANS competencies, their rt%wrnd would show that theyhad been awarded the Certificate of Initial Mastery (CIM).
Why New Methods Are Needed for Setting Performance Standards on Perform-ance Assessments
Because standard-setting permeates many aspects of life, including the occupational licensingand certification processes referenced above, the difficulties associated with applying suchprocedures to educational uses may not be apparent. For example, standards are very much partof athletics (e.g., pefiorrnance ratings for the Olympics, life-saving badges in swimming,certification for the ski-patrol, or a black-belt in the martial arts), and they are central to guidingaspects of daily life such as transportation (e.g., the stiety of aircraft) and regulation of food anddrugs (e.g., classifications of over-the-counter drugs, standards for safe fish or meat, and evenclassifications of the “hotness” of canned chili peppers.)
Although, as is discussed in the next section, experience with performance standard-settingcan be gained from these efforts as well as initial attempts in educational contexts, manychallenges remain. Generally, problems arise from attempts to make decisions based on very fewtasks that often measure very diverse and discrete accomplishments. Consensus has not beenreached on how to best aggregate performance information across those tasks to make an overalljudgment either for individuals or institutions.
Making Judgmen& Based on Few Tasks. This issue relates to the breadth of materialcovered by a content standard and the number of performances required to make confidentjudgments about students’ mastery of the material (i.e., to classi~ a performance, based on aperformance standard). For example, to determine whether students can use addition of wholenumbers in appropriate contexts they could be given several problems to solve involving variousapplications of whole-number addition. Perhaps after successfully completing 10 or so suchproblems (provided they presented diverse stimuli within the definition of whole-numberaddition), some coflldence could be achieved in generalizing to the domain and judging thestudents’ proficiency in applying whole-number addition to real-world problems.
Unfortunately, however, performance standards eventually will need to address far largerdomains, such as geometry, algebra, or even mathematics as a whole. To date, the work insetting curriculum standards has defined each domain as a vast and diverse network ofknowledge, skills, and understandings. Also, especially as students grow older, tasks need to befar more complex, encompassing students’ abilities to select among a repertoire of approaches,apply an effective strategy, and reach an appropriate solution (such-as, actually building amachine that works). These two goals-4he need for large numbers of tasks in order to assess
85
students reliably and the need for broad tasks, so as to sample a domain adequately-are difficultto reconcile, in that a broader array of performance tasks would yield far greater confidence indetermining students’ success in reaching a performance standard. Yet, the complexities ofperformance tasks, in terms of resources and time, preclude administering large numbers of themto individual students.
Performance tasks consume more resources to develop, administer, and evaluate, and requiremore energy and time on the part of the students participating in assessments. While educatorsmay be more receptive to devoting fiscal resources as well as students’ and teachers’ time forparticipating in realistic assessments, there are reasonable limits. Performance assessmentsgenerally contain relatively few, complex exercises. Educators are often appropriately reticent tomake high-stakes decisions about students’ educational careers based on a limited number ofdata points.
Each Performance Typically Entails Degrees of Success. Also, assuming for the momentacurriculum standard and agreement about a performance task measuring it, students willundoubtedly demonstrate differing degrees of success in accomplishing the task. For example,drawing on national, state, and school-district experiences across the past several decades inmoving from multiple-choice to direct writing assessment, students’ essays generally are notevaluated as “right” or “wrong.” Usually, a rating scale is employed whereby each essay isclassified as more or less successfid according to categories on an established scale. Summarizedacross students, performance can be described at various levels of the rating scale. Sometimes,there is a cut-point on the scale indicating that minimal competence has been reached, or thatpefiormances on the essays demonstrate higher-level writing proficiency, or both. Often,however, performance results are reported in terms of a scale, without making judgments aboutthe performance in relation to a performance standard. Such polytomous results often arecomplicated to aggregate. First, decisions may need to be made for each task about whatconstitutes “minimal” or “excellent” work, as well as what level of response is required to meetthe standard being measured. It is interesting that work across states, conducted by The NewStandards Project, showed considerable agreement in ranking students’ work, but far lessunanimity in where cut-points fell (Linn, et al., 1991).
Historically, often because of resource limits, writing assessments only contained one taskand student classification decisions were therefore difficult to make. More recently, however,research is showing that generalizability among performance tasks is very tenuous, and thisunderscores the importance of including a number of tasks. As previously stressed, one of theproblems with performance assessments is including enough tasks for adequate domaincoverage. The aim is to increase the number of tasks so as to increase the likelihood ofaccurately measuring performance across a domain of interest. This, then, leads to the problemof aggregating performance information across tasks. Because tasks measure differentaccomplishments, it may be likely that exarninees’ scores across tasks will be diverse. While aprofile can lead to better understanding of student performance for diagnostic purposes, it wouldcomplicate making an absolute judgment about students’ overall performances.
To be judged proficient in a domain, do students need to be proficient on each performancetask? Or perhaps, is it sufficient to be proficient on most but not all of the tasks? Or should theoverall judgment be based on an average across tasks? Each of these options requires a differentapproach to performance standard-setting.
86
Lack of Score Transferability. Finally, given the complexities of the tasks used inperformance assessments and the difficulty of evaluating students’ performances on the tasks, itis not surprising that developing equivalence across tasks is a problem. Not only will anindividual’s performances differ from task to task, but some tasks simply will be more difficultthan others. One reason for having petiormance standards is to attempt to establish comparabilityamong the perfommnces of students in different jurisdictions. That is, theoretically, parents ofstudents in one state and school district could compare their children’s performances to students’achievements in another state or country, or employers and colleges could make comparisonsacross students. Further, the nation and school systems could monitor trends across time inattaining curriculum standards. Yet, a score on one task often means little in predicting the scoreon a second, seemingly related, but different task, either for individuals or for groups of students.
Developing comparable standards across performance assessments appears to be the mostproblematic venture of all. There is, fust, the problem of designing appropriate performancetasks in terms of content standards, and identi~ing student work on the tasks that exemplifiessuccess in meeting the standards. Implementing such assessments under consistent conditionsand evaluating resulting performances reliably pose enormous operational challenges.Subsequently, difficulties arise in generalizing from performances on a few tasks to performancein an entire domain of content and in aggregating results across tasks in defensible ways.
Prominent Examples of Current PracticeAlthough the modem metamorphosis of performance assessment has only recently come on
the scene, a number of such programs are operated in contexts that require the establishment ofperformance standards. Here we review a few prominent examples of pefiormance assessmentprograms and describe methods that have been used to set performance standards. In providingthese descriptions, we are not necessarily endorsing the practices they represent. As we havealready noted, the problem of setting performance standards for complex performanceassessments is challenging, and current solutions may not withstand careful scrutiny.Nonetheless, it is usefil to see where we are before setting out on a new journey.
How Performance Standards Are Set for NAEPThe 1992 NAEP national and trial state assessments in reading, mathematics, and writing
included a variety of exercise formats. Standard-setting activities were modified to accommodatevarious scoring procedures used in NAEP, and these depended on item format. Table 1summarizes exercise format types by subject and grade. Multiple-choice (MC) items as well asmost short constructed-response (SCR) items were scored dichotomously, that is, ‘ 1 = right’ and‘O= wrong’. However, extended constructed-response (ECR) items were scored using rubricsappropriate to the item or prompt, on an ordered scale, generally from ‘ 1‘ to ‘4’ or ‘ 1‘ to ‘6’,with higher scores representing progressively better pefiormance.
In the case of dichotomously-scored exercises NAEP employed a znodZjiedArzgofl(Angoff,1971) procedure for establishing cut-scores. Since the policy fiarnework for standard settingrequired three standards for each grade level, Basic, Proficient, and Advance&, abroadly-representative group of judges was asked to estimate the probability of a correctresponse at the three levels for each of the dichotomously-scored items. The probabilityestimates were averaged over items and judges, and then multiplied by 100, to yield an estimatedprobability in the percent-correct metric for each achievement level.
87
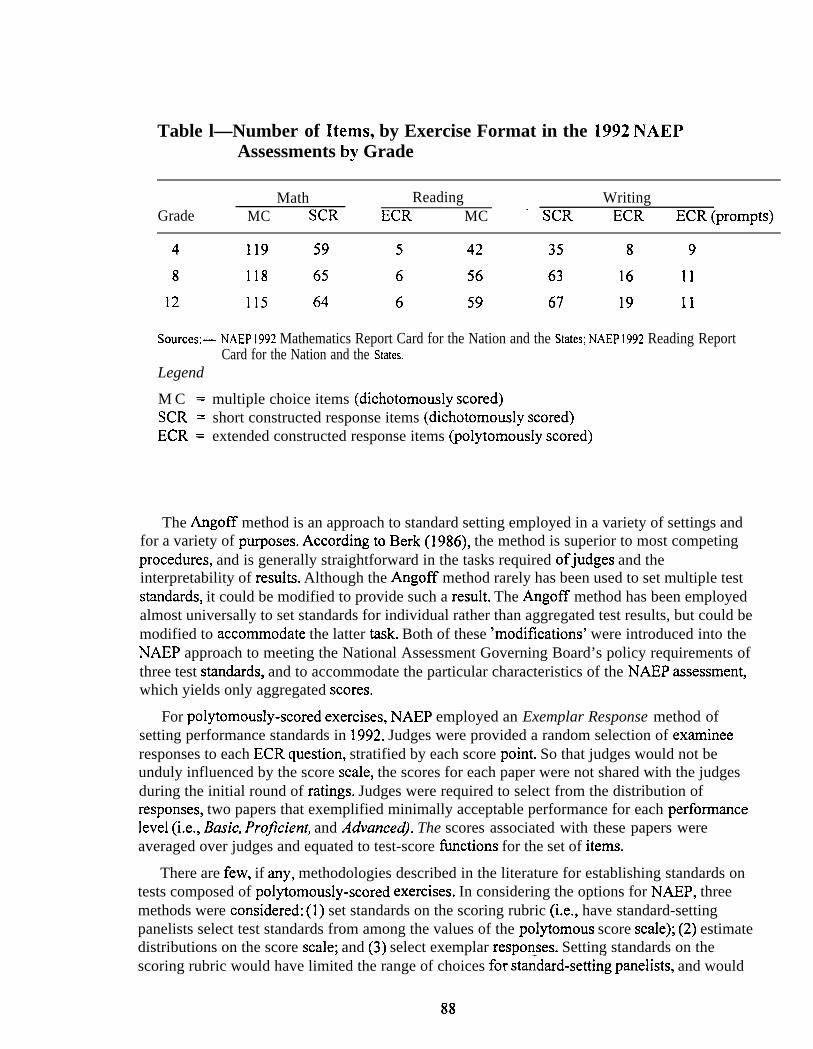
Table l—Number of Items, by Exercise Format in the 1992 NAEPAssessments by Grade
Math Reading WritingGrade MC SCR ECR MC ‘ SCR ECR ECR (prompts)
4 119 59 5 42 35 8 9
8 118 65 6 56 63 16 11
12 115 64 6 59 67 19 11
Sources:— NAEP 1992 Mathematics Report Card for the Nation and the States; NAEP 1992 Reading Report
Legend
M C =SCR =ECR =
Card for the Nation and the States.
multiple choice items (dichotomously scored)short constructed response items (dichotomously scored)extended constructed response items (polytomously scored)
The Angoff method is an approach to standard setting employed in a variety of settings andfor a variety of purposes. AccordingtoBerk(1986), the method is superior to most competingprocedures, and is generally straightforward in the tasks required ofjudges and theinterpretability of results. Although the Angoff method rarely has been used to set multiple teststandards, it could be modified to provide such a result. The Angoff method has been employedalmost universally to set standards for individual rather than aggregated test results, but could bemodified to accommodate the latter task. Both of these ‘modifications’ were introduced into theNAEP approach to meeting the National Assessment Governing Board’s policy requirements ofthree test standards, and to accommodate the particular characteristics of the NAEP assessment,which yields only aggregated scores.
For polytomousiy-scored exercises, NAEP employed an Exemplar Response method ofsetting performance standards in 1992. Judges were provided a random selection of exarnineeresponses to each ECR question, stratified by each score point. So that judges would not beunduly influenced by the score scale, the scores for each paper were not shared with the judgesduring the initial round of ratings. Judges were required to select from the distribution ofresponses, two papers that exemplified minimally acceptable performance for each performancelevel (i.e., Basic, Proficient, and Advanced). The scores associated with these papers wereaveraged over judges and equated to test-score fhnctions for the set of items.
There are few, if any, methodologies described in the literature for establishing standards ontests composed of polytomously-scored exercises. In considering the options for NAEP, threemethods were considered: (1) set standards on the scoring rubric (i.e., have standard-settingpanelists select test standards from among the values of the polytomous score scale); (2) estimatedistributions on the score scale; and (3) select exemplar responses. Setting standards on thescoring rubric would have limited the range of choices for stm-dard-setting panelists, and would
88
have linked the standards to what students can do and less to what students should do (the latterwere an integral part of the NAGB’s policy definitions). There was also a concern that, ifselecting among score-scale values, panelists would be less likely to take differences inprompt-difficulty into account. The second option, estimating distributions on the score scale,was not used because it was feared that this task might be too difficult for panelists to complete.Therefore, the most viable option seemed to be the exemplar response method, which preservedthe desirable features of(1) being less normative in its orientation, (2) not being bounded by thevalues on the score scale, and (3) minimizing potential systematic bias that clearly could becomean issue if panelists’ selected standards from among score-scale values. In reading andmathematics, judges’ estimates from the dichotomous and polytomous exercises were combinedusing an information weighting procedure (Luecht, 1993b) before mapping the final estimatesonto the NAEP scale. In the NAEP writing assessment, the judges’ proposed standards weremapped directly to the NAEP scale.
The State of Technical DebateA host of technical issues came to light during the NAEP standard-setting process. The
remainder of this section will attempt to describe several of these issues and offer some plausibleexplanations.
Discrepancy in Cut-scores. Early in 1992, a standard-setting pilot study was conducted toexplore various aspects of the process, including selection and training of panelists,programming and on-site data analysis, impact of feedback on panelists, achieving inter-raterand intra-rater consistency, and the standard-setting task itself. The 1992 reading assessment wasselected for the pilot study because it employed three item formats, multiple-choice, shortconstructed-response, and extended constructed-response exercises. The first two weredichotomously scored, the third was scored using a rating scale from’1‘ to ‘4’ (polytomousscoring). In order to examine the standard-setting approaches used with both scoring procedures,a separate standard was estimated for each. Figure 1 displays the results for the reading pilotstudy.
It is clear that performance standards for the polytomous exercises were set substantiallyhigher than were standards for the dichotomous exercises. There was no empirical evidence tosuggest why this was the case. And since it came to light only after the standard-setting meetingswere over, it was not possible to interview panelists to ascertain why this happened. However,several plausible explanations were offered by the technical advisors to the project.
First, panelists were given a limited set of exemplar responses(16) from which to make theirselections of papers that best represented performances at the thresholds of Basic, Proficient, andAdvanced. In addition, the papers represented a rectangular distribution of responses, withroughly equal numbers at each score point. It is possible that there were no papers in the set atthe threshold of each level, which had the effect of forcing the selection of higher test standards,A second plausible explanation revolves around the guessing factor. Guessing was virtuallyimpossible on the polytomous exercises, and panelists were not instructed to take guessing intoaccount in making their probability estimates on the dichotomous items (thus reducing theirproposed standard on the dichotomous items). A third explanation offered was method effect.The task required of panelists on the polytomous exercises was very different from that requiredin the modified Angoff procedure applied to the dichotomous items. A fourth hypothesis was
89
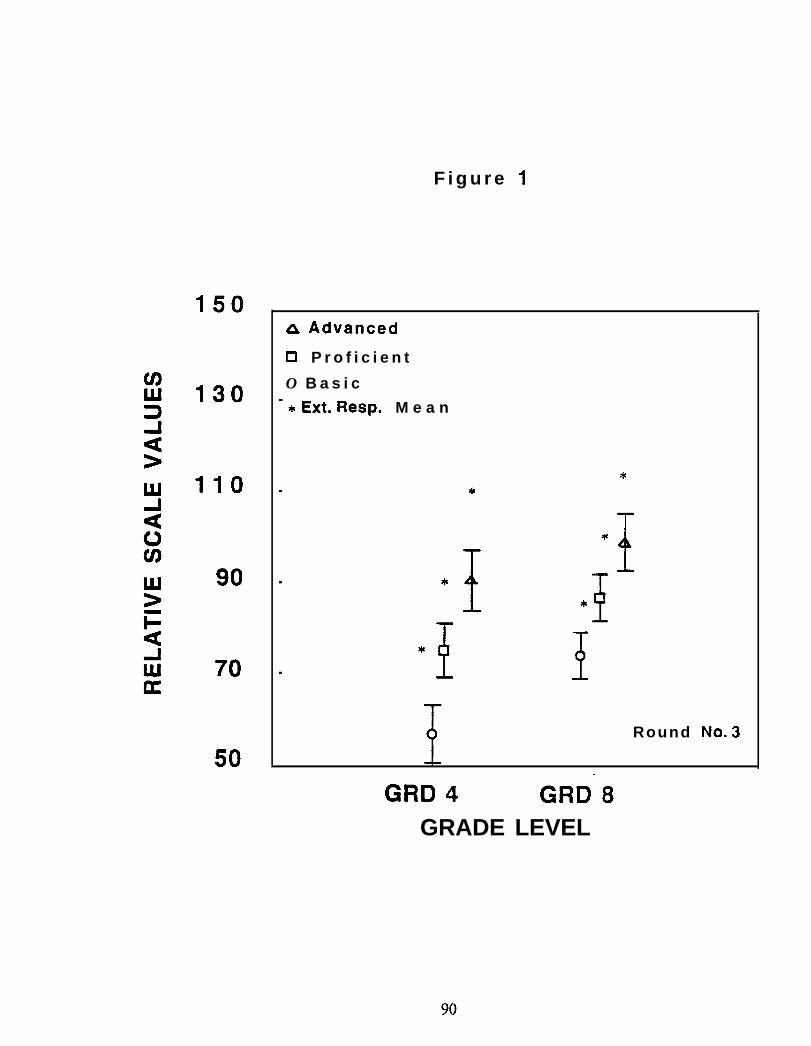
F i g u r e 1
150
130
110
90
70
50
A Advanced
❑ P r o f i c i e n t
O B a s i c
‘* Ext. Resp. M e a n
**
Round No. 3
GRD 4 GRD- 8GRADE LEVEL
that examinees simply don’t try as hard to do well on the polytomous exercises as they might onthe dichotomous items. Students are less motivated to respond when an exercise presents aproduction task. Therefore, panelists’ estimates were not ‘off target’, but instead, examineeswere not behaving the same way toward the polytomous exercises as the dichotomous items.Finally, the observed differences may be due to the possibility that the polytomous exercises (orat least as they are perceived by panelists) are assessing a different dimension of reading skills(or math or writing skills), in which case the multidimensional nature of the data is not beingtaken into account through the unidimensional IRT scaling used in NAEP.
Although these hypotheses remain untested due to lack of data, the concern is serious sinceNAEP continues to evolve and move toward more ‘authentic’ item types. The results suggestthat more research is needed before adopting any particular methodology for setting standards onpolytomous exercises. In 1992, this discrepancy in performance standards had minimal impacton the overall standards adopted by NAEP in mathematics, since the item pool contained alimited number of extended constructed-response exercises. The impact was slightly greater forreading, since about 15 percent of the item pool consisted of ECR items. In writing, however, theimpact was so great that the achievement levels reported here were not officially adopted by theNational Assessment Governing Board (Applebee, et al., 1994).
Alternative Methods for PoZytomons Exercises. Luecht,(1993c) has done some work in thearea of polytomous-item standard-setting simulations. A series of simulations was conducted tocompare three methodologies for setting standards on polytomous exercises: Pol’-Ango@,Po@Ango@, and the Exemplar Response approach that had been used on the 1992 NAEP.Although other methods could have been devised, these three were selected for firther researchbecause they appeared to hold some potential for improving on the modified Angoff procedureused with dichotomous items. The simulations were also used to demonstrate the effect ofvarious mapping procedures (discussed below).
The Poly-Angofl method asked panelists to estimate the percent of examinees at the Basiclevel who would score at each score point on a polytomous-item score scale (i.e., from ‘ 1‘ to‘6’). The Po/y-Ango@ method generated petiorrnance standards by summing the Poly-Angojlpercentage ratings for any score greater than or equal to ‘2’, since a score of’1‘ was alwaysincorrect, and a score of ‘2’ or higher was always at least partially correct. (This method wasalso pilot tested during the standard-setting meetings in 1992.) According to Luecht(1993c), thePoly-Angofl ratings were found to be slightly more robust than those resulting from thePof’y-Angoj2 method. The Poly-Angoffl method, the Exemplar Response method, and a hybridmethod that combined elements of both were explored during the 1994 standard-setting pilottests for NAEP,
Mapping Panelists’ Ratings to the NAEP Scale. In reading and mathematics, mappingpanelists’ estimates (in the percent-correct metric) to the NAEP scale was a fairlystraightforward procedure. After the panelists’ estimates were aggregated across exercises, themeans were numerically mapped to the NAEP test characteristic curve (TCC). This procedure,called the TCC method, resulted in a NAEP scale score for each of the nine performancestandards mapped. The TCC procedure was also employed in determining the writing cut scoresin 1992. These are shown in table 2.
For purposes of comparison, and at the urging of technical advisors to the NAEPstandard-setting project, a second method was also used to determine the writing cut scores. This
91
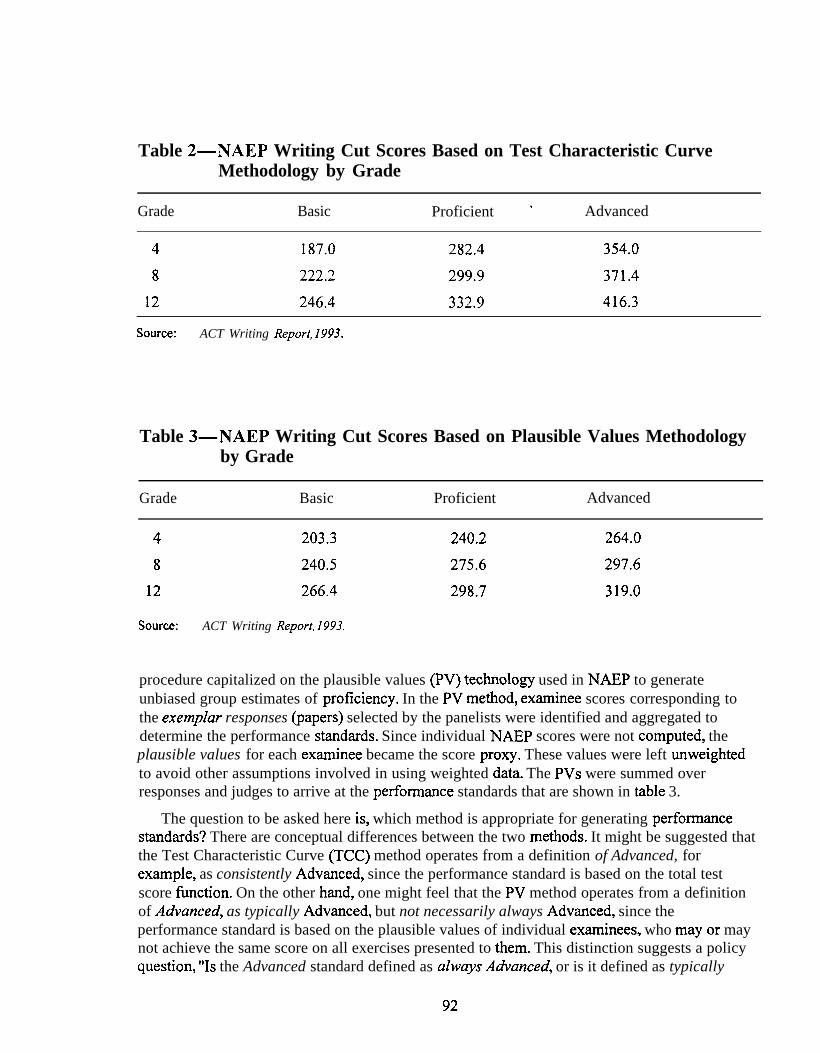
Table 2—NAEP Writing Cut Scores Based on Test Characteristic CurveMethodology by Grade
Grade Basic Proficient ‘ Advanced
4 187.0 282.4 354.0
8 222.2 299.9 371.4
12 246.4 332.9 416.3
Source: ACT Writing Report, 1993.
Table 3—NAEP Writing Cut Scores Based on Plausible Values Methodologyby Grade
Grade Basic Proficient Advanced
4 203.3 240.2 264.0
8 240.5 275.6 297.6
12 266.4 298.7 319.0
Source: ACT Writing Report, 1993,
procedure capitalized on the plausible values (PV) technology used in NAEP to generateunbiased group estimates of proficiency. In the PV method, examinee scores corresponding tothe exemp)ar responses (papers) selected by the panelists were identified and aggregated todetermine the performance standards. Since individual NAEP scores were not computed, theplausible values for each examinee became the score proxy. These values were left unweighedto avoid other assumptions involved in using weighted data. The PVS were summed overresponses and judges to arrive at the performance standards that are shown in table 3.
The question to be asked here is, which method is appropriate for generating perllormancestandards? There are conceptual differences between the two methods. It might be suggested thatthe Test Characteristic Curve (TCC) method operates from a definition of Advanced, forexample, as consistently Advanced, since the performance standard is based on the total testscore fiction. On the other hand, one might feel that the PV method operates from a definitionof Advanced, as typically Advanced, but not necessarily always Advanced, since theperformance standard is based on the plausible values of individual exa.minces, who mayor maynot achieve the same score on all exercises presented to them. This distinction suggests a policyquestion, “Is the Advanced standard defined as always Advanced, or is it defined as typically
92
Advanced?” Perhaps the same distinction could be made at the Proficient and Basic levels aswell. Would this suggest lower performance standards instead of higher ones?
From a technical perspective, there is evidence to suggest that the apparent differences in theperformance standards resulting from the TCC and PV methods shown in tables 2 and 3 arelargely a fimction of regression bias, overpredicting in some iases, and underpredicting in others(Luecht, 1993a). However, consensus has not been reached on this point, and more research isneeded.
Finally, it must be mentioned that a National Academy of Education Panel on the NAEPTrial State Assessment has suggested more-fundamental flaws in the methods used to setperfommnce standards on NAEP. The Panel holds that item-or exercise-based procedures forsetting performance standards produce invalid results, and that methods based on judgments ofthe quality and adequacy of entire test booklets are needed (The National Academy ofEducation, 1993). Commissioned critiques of the National Academy of Education report byCizek (1 993) and Kane (1 993) dissent from these conclusions as well as the policyrecommendations contained in the report. Here again, debate continues.
How Performance Standards Are Set by the National Board for ProfessionalTeaching Standards
The National Board for Professional Teaching Standards (NBPTS) is developingperformance assessments that are used to identi~ classroom teachers who have achievedadvanced levels of accomplishment in their profession. These teachers are eligible to receiveNational Board Certification. The performance exercises used by NBPTS elicit complexresponses from teachers, including written evaluations of the videotaped classroom performanceof another teacher; submission of selected samples of the work of the teachers’ students, togetherwith reflective analyses of the quality of that work and the link between the teachers’ instructionand the students’ performances; videotapes of the teachers engaged in specified activities withtheir students, coupled to descriptions of plans and objectives and self-evaluative analyses ofinstructional success; written responses to problems involving appropriate structuring ofcurriculum; and demonstrations of effective use of instructional resources, among others.
Teachers’ responses to exercises are scored by trained assessors using highly-structuredrubrics and scales that yield scores ranging from “ 1 -“ to “4+” for each exercise. Training ofassessors is extensive, and includes demonstrations of scoring competence and consistency.
Two approaches to performance standard-setting have been evaluated by NBPTS. The first,termed Itera[ive, Judgmental Policy Capturing, elicits panelists’ implicit standard-settingpolicies by fitting mathematical models to their responses to profiles of the performances ofhypothetical candidates for certification on a set of exercises. The second, termed theA4ulli-stage Dominant Profile Procedure, elicits panelists’ explicit standard-setting policies.These procedures are described in turn.
93
The Iterative, Judgmental Policy Capturing Procedure. In this procedure, standard-settingpanelists receive extensive training on the nature of the exercises that compose an assessmentand on the meaning of each possible score level associated with the scoring of each exercise. Indistinct contrast to the standard-setting methods described earlier for NAEP, the methods used
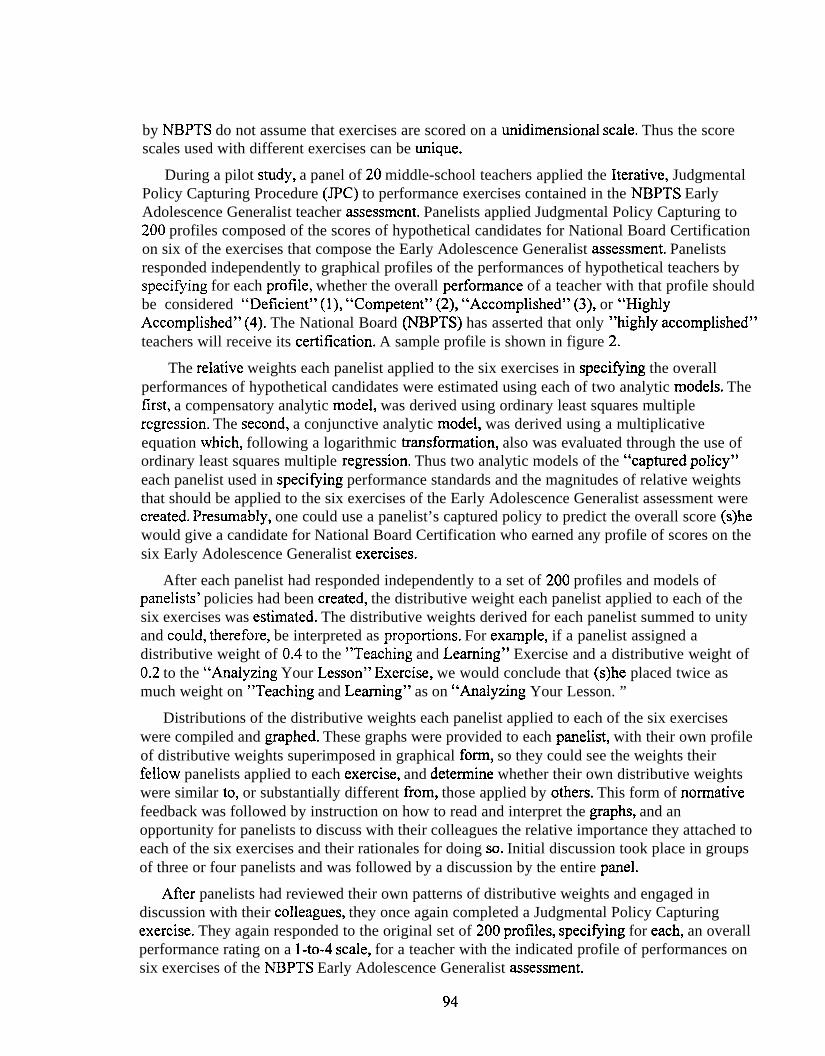
by NBPTS do not assume that exercises are scored on a unidimensional scale. Thus the scorescales used with different exercises can be unique.
During a pilot study, a panel of 20 middle-school teachers applied the Iterative, JudgmentalPolicy Capturing Procedure (JPC) to performance exercises contained in the NBPTS EarlyAdolescence Generalist teacher assessment. Panelists applied Judgmental Policy Capturing to200 profiles composed of the scores of hypothetical candidates for National Board Certificationon six of the exercises that compose the Early Adolescence Generalist assessment. Panelistsresponded independently to graphical profiles of the performances of hypothetical teachers byspeci~ing for each profile, whether the overall perfommnce of a teacher with that profile shouldbe considered “Deficient” (l), “Competent” (2), “Accomplished” (3), or “HighlyAccomplished” (4). The National Board (NBPTS) has asserted that only “highly accomplished”teachers will receive its certification. A sample profile is shown in figure 2.
The relative weights each panelist applied to the six exercises in specif@g the overallperformances of hypothetical candidates were estimated using each of two analytic models. Thefirst, a compensatory analytic model, was derived using ordinary least squares multipleregression. The second, a conjunctive analytic model, was derived using a multiplicativeequation which, following a logarithmic transformation, also was evaluated through the use ofordinary least squares multiple regression. Thus two analytic models of the “captured policy”each panelist used in speci@ing performance standards and the magnitudes of relative weightsthat should be applied to the six exercises of the Early Adolescence Generalist assessment werecreated. Presumably, one could use a panelist’s captured policy to predict the overall score (s)hewould give a candidate for National Board Certification who earned any profile of scores on thesix Early Adolescence Generalist exercises.
After each panelist had responded independently to a set of 200 profiles and models ofpanelists’ policies had been created, the distributive weight each panelist applied to each of thesix exercises was estimated. The distributive weights derived for each panelist summed to unityand could, therefore, be interpreted as proportions. For example, if a panelist assigned adistributive weight of 0.4 to the “Teaching and Learning” Exercise and a distributive weight of0.2 to the “Analyzing Your Lesson” Exercise, we would conclude that (s)he placed twice asmuch weight on “Teaching and Learning” as on “Analyzing Your Lesson. ”
Distributions of the distributive weights each panelist applied to each of the six exerciseswere compiled and graphed. These graphs were provided to each panelist, with their own profileof distributive weights superimposed in graphical form, so they could see the weights theirfellow panelists applied to each exercise, and determine whether their own distributive weightswere similar to, or substantially different from, those applied by others. This form of normativefeedback was followed by instruction on how to read and interpret the graphs, and anopportunity for panelists to discuss with their colleagues the relative importance they attached toeach of the six exercises and their rationales for doing so. Initial discussion took place in groupsof three or four panelists and was followed by a discussion by the entire panel.
Afler panelists had reviewed their own patterns of distributive weights and engaged indiscussion with their colleagues, they once again completed a Judgmental Policy Capturingexercise. They again responded to the original set of 200 profiles, speci~ing for each, an overallperformance rating on a 1-to-4 scale, for a teacher with the indicated profile of performances onsix exercises of the NBPTS Early Adolescence Generalist assessment.
94
Figure 2. Simulated Profile of a Candidate’s Performances on Six Early Adolescence Generalist Assessment Exercises
4
3
2
m ■ * ■ ■
■ ■ ■ ■ ■ IProfoaaional Teaching Analyzing Instructional Exploring Instructional
Davolopmont 6 & Loarnlng Your Looaon Analyaia Curriculum RoaourcoaSorvlco Isauos
OverallEvaluation
of Candidate“Wmwlz!zl
L
Fill the appropriate bubble (A, B, C or D) on the bubble sheet to indicate your judgment.(above)
The model-fitting analyses described earlier were applied to the judgments panelists recordedin their second round of Judgmental Policy Capturing. The results of this new model fitting wereused to estimate a new set of distributive weights for each panelist and, in addition, a table foreach panelist that indicated the outcome of applying that panelist’s captured policy to 114hypothetical profiles of candidate performance. For each profile of performances on the sixexercises, a panelist was able to see whether the application of her/his policy would result in thecandidate being certified by the National Board or being denied certification.
Prior to a final round of Judgmental Policy Capturing, the results of which were analyzed asdescribed earlier, panelists were once again given an opportunity to compare their profiles ofdistributive weights to graphically-presented distributions of the weights applied by their fellowpanelists. They were also given an opportunity to discuss with fellow panelists, their rationalesfor applying greater weight to some exercises than to others.
Since an objective of the standard-setting study was to produce equations that wouldrepresent the judgments of all panelists, weighted averages of individual panelists’ regressionweights were computed to form a single, integrative equation. Again, separate equations wereproduced using each of two analytic models.
Some Results. Distributions of distributive weights that resulted from applying acompensatory analytic model to panelists’ judgments elicited during the third round ofJudgmental Policy Capturing are shown in figure 3. Extreme values, the first and ninth deciles,and the quartiles of the distributions are portrayed in box-and-whisker charts. Results obtainedusing a conjunctive analytic model were so similar to those obtained with a compensatory modelthat little would be gained from displaying them. They are, therefore, not shown.
The results of Judgmental Policy Capturing indicate that panelists assigned great weight tocandidates’ performances on the “Teaching and Learning” exercise in setting an overallperformance standard (see figure 3). In contrast to traditional standard-setting procedures, whichset a unidimensional test standard that is based on a simple or transformed sum of candidates’performances on all assessment exercises, JPC acknowledges the multidimensional nature ofcandidates’ performances, It bases an assessment standard on profiles of candidates’performances.
A critical issue in the use of Judgmental Policy Capturing concerns the reasonableness ofrepresenting the captured policies of a group of panelists through a single policy that representsthe central tendency of their distribution. At issue is the assumption that the policies ofindividual panelists can be regarded as randomly-differing observations drawn from a singledistribution. To explore this issue, the vectors of weights that composed the 20 panelists’policies were subjected to nonmetric multidimensional scaling analyses (Schiffman, Reynolds &Young, 198 1). In addition, the matrix of correlations among overall performance scores assignedby the panelists to the 200 profiles of exercise scores were factor analyzed, using panelists asvariables (Cattell, 1966).
The multidimensional scaling results did not reveal the presence of definable clusters ofpanelists, suggesting instead, a single distribution of distributive weights across all panelists. Theresults of factor analyzing the 20-by-20 matrix of correlations among panelists’ overall ratings ofprofiles of exercise scores clearly demonstrated that their policies could be considered random
96
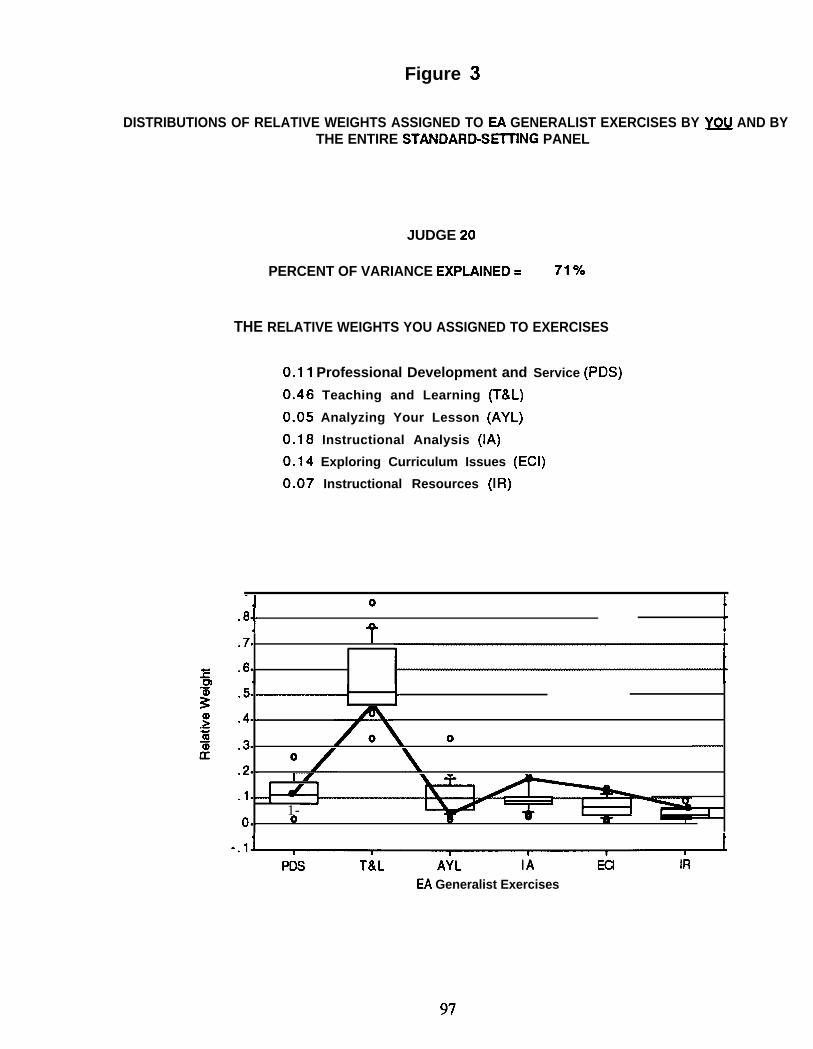
Figure 3
DISTRIBUTIONS OF RELATIVE WEIGHTS ASSIGNED TO EA GENERALIST EXERCISES BY ~ AND BYTHE ENTIRE STANDARD-SEITING PANEL
JUDGE 20
PERCENT OF VARIANCE EXPLAINED= 71%
THE RELATIVE WEIGHTS YOU ASSIGNED TO EXERCISES
0.11 Professional Development and Service (PDS)
0.46 Teaching and Learning (T&L)
0.05 Analyzing Your Lesson (AYL)
0.18 Instructional Analysis (1A)
0.14 Exploring Curriculum Issues (ECI)
0.07 Instructional Resources (IR)
‘1 o 1. 8i 1
+ 1.7. I
.6. ~*
.5.}
.4. “
.3. o0
.2. . 1/
.1. ~
1-0. ~ 0 [
PDs T&L AYL 1A Ea IR
EA Generalist Exercises
97
observations from a single distribution. A principal components analysis resulted in single factorthat accounted for approximately 82 percent of the variance among panelists’ policies.
These results were used to justify the derivation of a single standard-setting policy for theentire panel of 20 teachers. Analytically, the compensatory policy equations derived forindividual panelists were combined through a weighted averaging procedure. The weights usedwere the inverses of estimated variances of estimates of corresponding regression coefficients.Through this procedure, more-precise estimates of regression coefficients were given greaterweight than were less-precise estimates. Following the computation of a weighted averageregression question, a linear transformation was applied so that a profile containing scores offour on each of the six exercises of the Early Adolescence Generalist assessment would yield anestimated performance score of four and a profile containing scores of one on each of the sixexercises of the Early Adolescence Generalist assessment would yield an estimated performancescore of one. This transformation was consistent with the desired result that perfect scoreperformance on all exercises, should, with certainty, lead to National Board Certification.
In light of the scale definition noted earlier, the transformed JPC model is interpreted asfollows: Any candidate with a predicted overall score, following transformation, that equals orexceeds 3.5 would receive National Board Certification. Candidates with lower predicted overallscores would not be certified. When this rule was applied to the Round 3 results of judgmentalpolicy capturing, it was found that candidates who scored well on the “Teaching and Learning”Exercise would be certified, even though they performed less well on several other exercises inthe assessment. For example, a candidate who earned scores of four on the “Teaching andLearning” Exercise, and the “Professional Development and Service” Exercise, but scores ofthree on the other four exercises would be certified, as would candidates who earned scores offour on the “Teaching and Learning” Exercise, the “Professional Development and Service”Exercise and the “Instructional Analysis” Exercise, scores of three on the “ExploringCurriculum Issues” Exercise and the “Instructional Resources” exercise, and a score of two onthe “Analyzing Your Lesson” Exercise.
The pilot study demonstrated the feasibility of using Judgmental Policy Capturing as amethod for setting performance standards on assessments composed of complex, multiply-scoredperformance-based exercises. The results of the study indicated (1) that the Judgmental PolicyCapturing procedure and associated instructions used could be applied readily by panelistsfollowing a short period of instruction, (2) that panelists could provide judgments in response toas many as 200 six-dimensional profiles in a reasonably short time without undue fatigue (onaverage, panelists required 41 minutes to respond to 200 profiles), (3) that most panelists couldachieve high levels of consistency in their responses to profiles, as reflected in coefficients ofmultiple determination between 0.70 and 0.87 (median of 0.79), and (4) that iterative use ofJudgmental Policy Capturing reduces the variability among the captured policies ofstandard-setting panelists and leads to a reasonable degree of consensus around a collectivepolicy. The results of the study also confirm that panelists applied differential importanceweights to the exercises that composed the NBPTS Early Adolescence Generalist assessmentpackage. Thus differential weighting of exercises in determining a performance standard (at leaston the NBPTS assessment) appears to be essential.
The Multi-stage Dominant Proji[e Procedure. The Multi-Stage Dominant Profile procedureconsists of four stages: individual policy creation, revision of individual policies following
98
discussion and reconsideration, application of individual policies to profiles of candidateperformance (administered through a tailored Judgmental Policy Capturing procedure), andreaction to summarized policies created through detailed analyses of the application of individualpolicies to profiles of performance on an assessment. Whereas the Judgmental Policy Capturingprocedure requires panelists to react to profiles of candidate performance that are presented tothem so that their standard-setting policies can be inferred, the Multi-stage Dominant Profileprocedure requires panelists to formulate and state the “bottom-line” standard-setting policiesthey would apply in screening candidates for some valued reward, such as National BoardCertification. Panelists’ policy statements are then refined through discussion, and by analyzingtheir application to profiles of performance that challenge or confirm panelists’ initial policies. Amore-detailed description of the procedure follows. This procedure was applied in a recent pilotstudy conducted on behalf of the National Board for Professional Teaching Standards. Twentymiddle-school teachers applied the procedure to six performance assessment exercises from theNational Board’s Early Adolescence Generalist teacher assessment.
Policy Creation. During the first stage of the Multi-Stage Dominant Profile procedure,individual panelists stated policies that defined the lowest levels of performance on the sixexercises that, in their view, warranted National Board Certification. Depending on the nature oftheir policies, panelists constructed one or more profiles of petiormance that, in their view,characterized the pefiormance of a “just barely certifiable” Early Adolescence Generalistteacher. Following extensive instruction on the exercises for which performance standards wereto be set, the meaning of each possible score on each exercise, and the nature of compensatoryand conjunctive standard-setting policies, panelists were given ten blank profile forms on whichto convey their “bottom-line” profiles. Panelists were told that only one profile would benecessary to convey a strictly conjunctive standard-setting policy, but that many “bottom-line”profiles could exemplifi a compensatory policy. Panelists were asked to use as many profileforms as they needed to illustrate their standard-setting policy, and to write a paragraph thatexplained their policy.
Dzkcussion and Reflection. Following their initial specification, panelists were invited todescribe and discuss their standard-setting policies. Each panelist was provided with anopportunity to present her/his policy to the standard-setting panel and to describe the rationaleunderlying the presented policy. Stated policies were summarized on an overhead projector sothat all could note how their own standard-setting policies compared to those of their colleagues.Panelists were then asked to reconsider their initial standard-setting policies in light of thediscussion and what they had learned about their fellow panelists’ recommendations andrationales.
Panelists then worked independently, just as they had originally, to speci~ and illustrate theirown standard-setting policies. Panelists completed as many illustrative profile forms as theyneeded (ten blank forms were given to each panelist, and no panelist used all ten) and againwrote one or two paragraphs describing their standard-setting policies.
Construction of Confirmatory and “Challenge” Profiles, and Summary Policies.Immediately following the standard-setting session, panelists’ policies were analyzed to identifiareas of agreement and disagreement. Many panelists provided one or more illustrative profiles,and all prepared brief descriptive statements of their policies. Content analysis of panelists’written policy statements and their accompanying profiles revealed several sophisticated policies
99
for determining candidates’ qualifications for National Board Certification. These policiesreflected what panelists had learned during their engagement in the Judgmental Policy Capturingprocedure.
Using analyses of candidates’ stated and illustrated policies, 105 profiles of performance onthe six exercises that composed the NBPTS Early Adolescence Generalist assessment wereconstructed. These performance profiles either conformed to the “bottom-line” standard-settingpolicies that one or more panelists had specified or “challenged” those policies in the sense ofconforming to all but one or two policy specifications. For example, if a panelist had specified ina “bottom-line” policy that, to be certified, a candidate could earn no more than two scores oftwo, must earn a score of four on a particular exercise, and must earn scores of three or more onthe remaining exercises, a profile that contained three scores of tsvo but otherwise conformed tothe policy specifications was constructed. These profiles were used to examine the consistencywith which panelists applied their “bottom-line” policies to the profiles of performance ofhypothetical candidates. Panelists were sent the 105 profiles one week following thestandard-setting session and were asked to state for each profile, whether a candidate with theindicated profile of performance should, or should not, receive National Board Certification asan Early Adolescence Generalist teacher.
Panelists were also sent three policy statements that represented the standard-setting policiesof major subgroups of the standard-setting panel. They were asked, for each statement, whetheror not they would accept the adoption of the statement as the National Board’s standard-settingpolicy for certi~ing Early Adolescence Generalist teachers.
Some Results. Three standard-setting policies reflected the judgments of almost all panelists.These policies combined compensatory and conjunctive elements, in that panelists specifiedthreshold levels of performance for some exercises, but allowed high scores on other exercises tocompensate for lower-levels of performance on the balance of the assessment. When askedwhether they would accept the adoption of these standard-setting policies by the National Board,15 of 20 panelists endorsed a single policy, and four more endorsed minor variants of themajority policy. The final panelist created an entirely new policy that was at substantial variancewith the judgments held by the balance of the panel.
Analyses of the responses of panelists to the 105 profiles of candidate performance created toconfirm or challenge their policies revealed some variation in the consistency of panelists’application of their stated policies. However, on average, panelists were 77 percent consistent.
The results of the pilot study of standard-setting were very encouraging. The JudgmentalPolicy Capturing procedure was regarded by panelists as an important and helpfil learningexperience and as a useful strategy for eliciting their standard-setting policies. Following theJudgmental Policy Capturing procedure with the Multi-Stage Dominant Profile procedurepermitted panelists to create explicit policies that accurately conveyed their judgments and to testand revise those policies when confronted with the ideas of their fellow panelists and withexplicit profiles of candidate performance. The convergence of 75 percent of the panelistsaround a single standard-setting policy was a particularly encouraging result.
100
How Standards Were Set for the Maryland Statewide AssessmentEducators in Maryland have developed descriptions of what students should know and be
able to do by the year 20004. These descriptions together are called the Maryland LearningOutcomes. Content areas include reading, mathematics, science, social studies, writing andlanguage usage.
The State of Maryland also developed a new test, the Maryland School PerformanceAssessment Program (MSPAP) to assess the ability of students to master the Maryland LearningOutcomes. The MSPAP is one element in Maryland’s School Performance Program reforminitiative. The test is designed to measure students’ ability to apply what they have learned toreal-world problems, and to relate and use knowledge from different subject areas.
Administered in grades 3,5, and 8, the MSPAP measures critical thinking andproblem-solving abilities. MSPAP standards are set for satisfactory and excellent levels ofperformance. By the 1996 MSPAP test, 70 percent of students in each school are expected tomeet satisfactory standards.
The Standard-Setting Process. MSPAP standards were set through a process that relied onthe professional judgment of expert educators. The standards were reviewed and refined by acouncil that included representatives of business, educational organizations, and the legislature.Opportunity for comment was provided for the public at large.
In May 1993, a MSPAP Standards Committee was convened to set proficiency levels forsatisfactory and excellent performance. The Standards Committee consisted of 17 content areaand assessment experts from 11 school systems within Maryland and the Maryland StateDepartment of Education. The Committee reviewed background material on the MSPAPassessments, including the learning outcomes that are assessed in MSPAP; examples of actualtest questions, scoring criteria, and student responses; and 1992 MSPAP school performanceresults.
MSPAP scores fall into five levels of proficiency, with Level 1 the highest. The StandardsCommittee selected proficiency Level 3 or higher as the standard for satisfactory performance,and proficiency Level 2 or higher as the standard for excellent performance in each of thecontent areas/grade levels. The Standards Committee recommended a percentage range ofstudents that must meet these levels by 1996. These ranges are: satisfactory-70 percent to 80percent; excellent—20 to 30 percent.
The standards proposed by the Standards Committee were reviewed by the MSPAPStandards Council, including 12 persons from local boards of education, the Maryland StateTeachers’ Association, the Maryland Business Roundtable, the business community, students,parents, and the State Legislature. This council set specific goals for schools, within the rangesrecommended by the Standards Committee, as to the percentage of students expected to meet thesatisfactory and excellent levels of performance. The Standards Council recommended that by1996 at least 70 percent of students should perform at the satisfactory level and 25 percentshould perform at the excellent level. By 2000, 95 percent of students should perform at thesatisfactory level in each content area, and 50 percent should perform at the excellent level.These standards will be reviewed afler the !996 test to see if adjustments are needed.
101
The State Superintendent of Schools reviewed the recommendations of the StandardsCouncil and briefed local superintendents. The State Board of Education reviewed theSuperintendent’s recommendations toward the end of May. Regional meetings for the publicwere held in June and July, 1993, and the State Board of Education included the new MSPAPstandards in the regulations covering public school standards in July, 1993.
Use of MSPAP Results. The main purpose of MSPAP is to assess school performance, notthe performance of individual students. Individual students’ scores, however, are available to beused in conjunction with other information to inform parents of their child’s performance inparticular content areas.
How Standards Were Set for the Kentucky Instructional Results InformationSystem
In 1990, Kentucky’s General Assembly adopted the Kentucky Education Reform Act(KER4)5. KER4 established goals for the educational system and provided a procedure forassessing progress toward the goals.
One of the six education goals is:
“Develop students’ ability to:
1. Use basic communication and mathematics skills;
2. Apply core concepts and principles from mathematics, the sciences, the arts, thehumanities, social studies, and practical living to situations they will encounterthroughout their lives;
3. Become self-sufficient individuals;
4. Become responsible members of a fhrnily, work group, or community;
5. Think and solve problems in a variety of situations; and
6. Connect and integrate experiences and knowledge from all subject- matter fields.”
A Council on School Performance Standards was created to tirther define these cognitivegoals. The Council developed 75 performance goals, or “valued outcomes,” which the StateBoard of Education approved.
Kentucky proceeded to develop a new assessment program to measure students’ performanceon the valued outcomes. The assessment program was to include multiple-choice andopen-ended items, performance tasks that can be administered in one class period, and longertasks or projects that can be placed in a student’s portfolio. The valued outcomes were to be thefoundation for new models of school curricula. NAEP frameworks were also used to supplementthe valued outcomes where needed. KERA stipulated that a transitional assessment would occurat Grades 4, 8, and 12 in 1991-92, with a fill-scale, primarily performance-based assessment tobe implemented soon thereafter. Information on development of the tests, transition toperformance-based assessment, and the mechanics of test administration is available in aTechnical Report.
Setting Performance Standardk. It was decided to set four levels of performance standards,termed “novice,” “apprentice,” “proficient,” and “distinguished.” Considerable thought went
102
into deciding the appropriate number of levels as well as their names. Too many levels wouldmake differences between adjacent categories somewhat trivial and would be hard tocommunicate, Too few levels would result in setting the standard for minimum competency at avery low threshold, removing the motivation for improvement.
Standard setting for writing portfolios was completed first by a Writing Advisory Committeeconsisting of approximately 10 teachers per grade level (Grades 4, 8, and 12), staff from theKentucky Writing Project, university faculty, and members of the Kentucky Department ofEducation. The committee reviewed student portfolios, selected sample portfolios thatexemplified the standards, and completed the scoring guide to operationalize the standards.These were incorporated into a set of training materials distributed to teachers statewide.
The first year’s test was transitional in nature, containing common questions (given to allexaminees) and matrix-sampled questions (each examinee is tested on only some of the items).Standards were set first on the common items; standards for the matrix-sampled questions werederived from data describing the relationship between the two types of questions.
For the common items, standard-setting was done for performance (open-ended) items only,and was based on examining actual student work. Scores for performance items ranged from Ofor no response or an irrelevant response, to 4 for a “complete, insightful, strongly supportedresponse, demonstrating in-depth understanding of relevant concepts and processes. ”
Scoring guides for performance items were translated into standards. Standard-settingpanelists were first trained on the writing scoring guides. Aller training, they were provided withseveral examples of scored writing samples. The committee members were then given severalpapers that had already been assigned scores. For each question, they independently decidedwhich score reflected each level of performance. They then debated their decisions as a group,and reconsidered their decisions until consensus was reached. They arrived at a decision thatscores of O and 1 “generally indicated Novice work,” 2 was Novice, 3 was Proficient, and 4 wasDistinguished.
Committee members were given several papers at the upper and lower ends of the range foreach of the above score values, to discuss whether these papers cast doubt on theirscore-to-standard translation scheme. Their decision rules remained unchanged following thisdiscussion. Finally, the committees were given information about the percentage of studentsattaining each performance level, so they could see that very small percentages of studentsachieved the Proficient or Distinguished levels. In spite of this, they decided not to change theiroriginal decision rules.
Standards for the matrix-sampled questions were derived from those established on thecommon items by using a regression approach. The methodology is filly explained in theTechnical Reporr. The procedure resulted in 60 predicted performance-level scores. Cutoffs foreach performance level were then determined so that the distribution of students classified intothe various performance levels on the matrix-sampled items was as similar as possible to thedistribution of students classified on the common items. Once cutoff points were established,each student was assigned to a pefiorrnance level based on his/her score on the matrix-sampleditems.
Standards were set for performance events by assuming that the distribution of scores acrosslevels would be as close as possible to those obtained for the common items. Regression analysis
103
was not used for these events, however. Students with the highest scores on the performanceevents were placed in the Distinguished category until the percent of students at this levelapproximately equaled the percentage of students classified as Distinguished on the commonitems. Students with lower scores on performance events were subsequently placed in theProficient, Apprentice, and Novice categories in approximately the same percentages as with thecommon items.
Use ofAssessnzent Results. Assessment results were used to determine the percentage ofstudents in each school whose scores warranted placement in each of the four categories—Novice, Apprentice, Proficient, and Distinguished. Schools received rewards or sanctions basedupon their improvement or failure to improve over time. The 1991-92 test established eachschool’s baseline, from which targets for future improvement were determined. Test resultscollected during the 1992-93 and 1993-94 school years were used to measure each school’sprogress toward its target and to establish a new baseline for fiture performance targets.
Some Technical Dilemmas and Procedural IssuesAlthough constructive work on setting performance standards for assessments containing
performance exercises is ongoing, and some progress has clearly been made, many dilemmasand procedural concerns remain. In this section we review some troubling issues and unresolveddilemmas, thus, by implication, defining a research agenda for the coming years.
Artificial Dichotomization (Polytomization) of Performance ContinuaThe central problem in setting cut-points or standards for levels of performance is that they
establish artificial dichotomies on a continuum of proficiency (Shepard, 1984). Proficiency in apopulation does not occur at discrete, easily recognizable levels. It is, rather, a matter of degree.The problem is how to treat the gray areas around the cut-points, since a certain proportion ofexarninees just above or just below a cut-point will almost inevitably be misclassified due tomeasurement error.
Most judgmental methods of setting performance standards begin with the concept of aminimally competent examinee to assist in establishing a passing threshold for a test. Judgesmust either decide which of the response categories in a multiple-choice item the minimallycompetent examinee would reject (Nedelsky, 1954), which items he/she would answer correctly(Jaeger, 1982), or the probability, for each item (or parcel of similar items), that he/she wouldgive the correct answer (Angoff, 1971). These methods result in an itiorrned but arbitrary (i. e.,determined by judgment) performance standard. Exarninees achieving a score above thisstandard are classified as competent; those below are classified as incompetent. The problemarises in the cases of false positives and false negatives (i. e., those persons who are misclassifiedon the basis of the test versus their actual abilities). Taking measurement error into account inestablishing a performance standard can partially diminish the likelihood of committing one kindof error or the other.
Other methods combine judgment with empirical data on actual test performance. Theborderline-group method furnishes judges with information on the actual performance of a groupof examinees believed to be on the borderline of minimal competence. The median score of thisgroup is adopted as the standard. In the contrasting-groups method, groups of “masters” and“non masters” are identified and given the test. Frequency polygons are developed for the scores
104
of each group. The standard for passing the test is set at the score where the frequency polygonscross. If it is found that an unreasonably high percentage of examinees fail the test, the thresholdcan be lowered. The degree to which the threshold is lowered can be based on how high thestakes are for a test. For example, if the test is used to qualifi examinees for promotion to thenext grade, or for professional licensing, the cost to examinees who fail even though they aretruly qualified is high. The passing threshold should be lowered accordingly, but not so muchthat it is no longer a standard of minimally acceptable performance.
Ways to minimize the misclassification problem include:
. Consideration of the examinee population, not only the test items, in setting standards;
● Supplementing judgments with empirical data (e.g., whether the test actually distinguishesthe competent from the incompetent);
. Use of mathematical models for adjusting cut points to minimize classification errors. Suchmodels include the binomial error model developed by Subkoviak, Huynh’s beta-binomialmodel, Bayesian decision-theoretic models, and linear loss models;
. Pilot tests of examinations, with revision of performance standards as appropriate; and
. Occasional review of performance standards as conditions change (e.g., when curriculumchanges).
Shepard recommends seeking insight from several models of standard-setting. Evidence fromdifferent approaches, combined with normative evidence (actual performance), should be used toestablish a range of plausible performance standards.
Performance Standards Tend To Be Method-Dependent
It is widely agreed that different methods of setting performance standards yield differentresults. The problem seems thus far to be intractable. The inconsistencies are inherent in the wayjudgments are made according to the various methods, as well as in the composition of panels ofjudges. In a review of research, Jaeger (cited in Phillips, 1993) summarized the results of 32comparisons culled from 12 separate studies. He found that almost six times as many studentswould fail when using one standard-setting method rather than another. Inconsistencies aroseeven when different methods were used under seemingly identical conditions.
As already suggested, the results of several methods should be used in any given study, andthese should be tempered with statistical techniques, use of empirical data, and knowledge of theexarninees. Consideration of the use to which the performance standard will be put should alsohave weight in setting the cut- point(s). Shepard comments, “It is important to see that it is thenature of the problem rather than lack of effort which prevents us from finding the preferredmodel for standard setting” (Shepard, 1984, p. 187).
How Large Should a Standard-Setting Panel Be?Although we hold no belief that performance standards are population parameters waiting to
be discovered, we recognize that any standard-setting panel is composed of a sample ofindividuals, selected from a population of persons who might have been invited to serve. Wealso recognize that a second panel, selected using the same procedures as the first and presentedwith identical instructions and stimulus materials, would likely recommend a somewhat different
105
performance standard. Examinees whose performance is in the region bounded by theperformance standards recommended by two different panels are victims of the process used toselect a panel. They would have received some valued reward (admission, certification,classification as “advanced” learners, etc.) had their performances been judged against theperformance standard specified by one panel, but denied those rewards ifjudged against theperformance standard of the second.
Determining the number of panelists who should recommend a perfommnce standard is notunlike other sample size problems. The larger the number of panelists, the more stable will bethe resulting performance standard across samples of panelists. Since all popular standard-settingprocedures have as a final step, computing the central tendency of a distribution ofrecommendations provided by individual panelists, the standard error of the final performancestandard will vary inversely as the square root of the number of panelists. A seeminglyreasonable criterion for determining the number of panelists to be sampled would be to producea standard error of the mean recommended standard that was small, compared to the standarderror of measurement of the assessment for which a standard was sought. Since variation in therecommended performance standard and measurement error variance contribute additively toerrors of examinee classification, the size of the standard-setting panel should be such that thestandard error of the mean (or median) recommended performance standard does not addappreciably to the overall standard error. Jaeger (1990) noted that if the standard error of themean recommended performance standard is no more than a fourth as large as the standard errorof measurement of the assessment, the overall standard deviation of errors due to sampling ofpanelists and the unreliability of the assessment would only be 3 percent larger than the standarderror of measurement alone. By this criterion, random error due to sampling of panelists wouldcontribute minimally to errors of classification of examinees. To apply this criterion in practice,both the standard error of measurement of the assessment for which a standard is sought, and thestandard deviation of panelists’ recommended performance standards must be known. Standarderrors of measurement are readily estimable. As experience with setting performance standardson assessments composed of performance exercises is gained, typical standard errors ofrecommended performance standards should become available as well.
Who Should Compose a Standard-Setting Panel?Most professionals in the performance testing arena recommend that a standard-setting panel
should be representative of a broad range of interested and informed groups. Broadrepresentation avoids the selective bias that might result if only one concerned group (e.g., onlymembers of the business community or only school administrators) constituted a standard-settingpanel. It is important to identi& the relevant groups from which judges should be chosen, and tosample the judges from these groups in such a way that they are representative of the relevantpopulation. However, drawing on research concerning the nature of expertise (Chi, Glaser d%Farr, 1988; Minsky& Papert, 1974; Chi, Glaser & Rees, 1982; Glaser, 1987), Jaeger (1991)argued that judges who recommend or set performance standards should be experts in thedomain assessed by the test and in the roles sought by successful examinees. He recommendedthe use of standard-setting panels that were composed of experts, and not necessarilyrepresentative of stakeholder populations.
The issue here is quite important. Democratic values support the argument that aperformance standards should be set through a process of negotiation that involves all
106
constituencies having an interest in the qualifications of those who would “pass” the test orassessment on the basis of the performance standard set. In the case of achievement testing,those constituencies would likely include parents, students, teachers, school administrators,potential employers of students, civic leaders, university admissions officers, and so on.
The principal counterargument is based on the contention that standard-setting panels shouldbe restricted to those with solid understanding of (1) the test or assessment for which a standardis to be set, (2) the cognitive demands imposed by the assessment, and (3) the capabilities ofexaminees, given the opportunities they have been provided to learn the material tested. Lackingfirm understanding of these issues, a standard-setting panel could readily set performancestandards that were unrealistic, unfair to students and educators, and unlikely to influenceinstructional improvement. The 1985 Standards for Educational and Psychological Testingrequire that the qualifications of standard-setting panelists be documented (Standard 6.9). Thisrequirement suggests that legitimate interest alone should not determine the composition ofstandard-setting panels; expertise should be required as well.
There are some standard-setting initiatives where the term “expert” has been broadly definedto include not only those who have expertise in the content area (typically gained through formalacademic preparation), but additionally, members of the non-academic community who use theskills and knowledge of the content area in their trade or profession. When perfommncestandards were set for the National Assessment of Educational Progress, “expertise” was definedvery broadly. The National Assessment Governing Board regularly has included, and now bystatute (P. L.. 103-382, 1994) must include on its standard-setting panels, school administrators,parents, and concerned members of the general public.
The Appropriate Uses of Normative InformationThe desire for criterion-referencedper formance standardk. The nation’s governors and two
Presidents have reached a consensus that there should be high expectations of what studentsshould know and be able to do, and clear indicators of how students’ actual performancesmeasure up to these expectations. In other words, it is no longer enough to find out what studentsknow and can do; new public policy demands an assessment of whether students’ performance is“good enough.” Therefore, criteria are needed for deciding what is “good enough,” in the sensethat students know what they should and are able to do what is expected of them.
In many applications of performance assessment, attempts are made to set absolute standardsof performance, quite apart from current norm distributions of performance. The work of theNational Board for Professional Teaching Standards is a case in point. The National Board hasdefined standards of “accomplished performance” in the teaching profession for more than adozen teaching fields and will eventually define such standards for more than 30 teaching fields.These standards represent the National Board’s vision of accomplished teaching performanceand are not grounded in typical current practice. In no sense are these performance standardsnormatively based.
The need to groundperformance standards in reality. The dilemma arises when it isrecognized that standard-setting panelists must make use of normative anchors if they are to setperformance standards at levels that are practical and defensible. Much of our judgment in life isnormatively grounded, and it is difficult to establish absolute standards apart from our normativeexperience. For example, we regard men who are over 78-inches tall as “very tall” not because of
107
any absolute sense of the accumulation of inches of height that warrant that appellation, butbecause, in our normative experience, very few men achieve that height.
Normative data are essential in the standard-setting process for ensuring that performancestandards will be appropriate to the population for which they are being set. Setting aperformance standard in a vacuum, without reference to actual performance, could easily lead tothresholds that result in large classification errors. This would be particularly harmfid in the caseof high-stakes tests in which large numbers of exarninees could be disqualified even though theyare competent in the skills being tested. Even in group assessments, however, the standardswould lack credibility if they did not reflect actual abilities. Such a situation could arise, forexample, on a mathematics assessment if it was found that examinees who scored at an“advanced” level were actually poor mathematics students.
It was noted earlier that different methods of deriving pefiormance standards yield different,sometimes widely divergent standards. A standard-setting process that used several methods aswell as incorporating normative feedback to judges should result in more stable and realisticperformance standards. Such normative data would help judges decide whether a particularstandard actually separates examinees according to relevant skill levels, as desired. Judgesshould be given an opportunity to revise standards in light of empirical consequences. Thisiterative process might be repeated several times with more or different types of feedback. AsShepard observed, “The standard we are groping to express is a psychological construct in thejudges’ minds rather than in the methods . . . Normative expectations are always the starting point,because norms are the source of validity evidence and ultimately determine our psychologicalabsolutes” (Shepard, 1984, p. 188).
So the dilemma of wanting to set absolute standards coupled with the reality of knowingfrom experience that totally unrealistic standards may result remains. It seems best, in light ofresearch on the effects of normative feedback on performance standards (cf., Busch& Jaeger,1990) to temper the desire for absolutes with the reality that normative feedback tostandard-setting panelists provides.
Essential Training of Standard-Setting PanelistsDefining minimally acceptable performance. Methods of setting performance standards
often require panelists to formulate some idea of a minimally acceptable examinee. Then foreach test item or exercise, panelists must estimate whether that hypothetical examinee wouldgive the correct answer, or must estimate the percentage of such exarninees who would answerthe item correctly. In setting multi-level standards, panelists must repeat this process for eachperformance level. Some methods use an iterative process in which panelists are given empiricalinformation on the difficulty of each item or exercise and/or share each others’ ratings in theprevious round.
These classical approaches to standard-setting are most usefid when items are dichotomouslyscored rather than being scored along a polytomous scale. As noted earlier, petiormanceassessments in which essays, portfolios, and extended constructed responses are used do not lendthemselves to classical standard-setting methods. Further, some assessments now include bothmultiple-choice and pefiormance items, resulting in differential standards being set. The pictureis fhrther complicated by the multidimensionality of performance items, in which more than oneskill or area of knowledge is integrated. The task becomes overwhelming for judges, who must
108
keep the test frameworks in mind while minimizing the role of personal experience and intuitionin their judgments.
The difficulty in employing methods centered on defining minimally acceptable performanceunderscores the advisability of incorporating empirical evidence of the validity of standards. Thecontrasting-groups and borderline-group methods described above may be helpfil in validatingstandards that are derived through other methods (in the sense of providing convergentevidence). Bootstrapping is another recently-developed method, in which the performancestandard is set at the point at which it has been empirically determined that exarninees who scoreabove the standard will, with high probability, succeed in the task being measured.Benchmarking is a variant of this approach. In benchmarking, the standard-setter attempts to findexamples of high performance as an aid in setting the standard, as, for example, the scoresattained by high-performing math students in other countries.
Training on the nature of the standard-setting task. It is very important that panelists beadequately trained in the process of setting standards that they are expected to use. They mustunderstand fully, and internalize, the test or assessment framework before rating items orexercises as to what they measure and their levels of difficulty. Panelists must have cleardefinitions of the knowledge and skills expected of minimally acceptable examinees, or ofexarninees at each of multiple performance standards. Panelists must also understand fully thecontent domain to be assessed. Because performance standards are based on judgment, a finaldecision necessarily will be arbitrary. With the requisite training, however, the performancestandard will not be capricious.
Sources of Error and “Adjustment” of Standard-Setting RecommendationsIf a performance standard is set to the value recommended by a standard-setting panel, half
of the examinees whose true performance level is precisely equal to the standard will fail theassessment, and half the examinees whose true performance level is minutely below the standardwill pass the assessment. This is true because errors of measurement influence the observedperformances of exarninees and sampling errors in the selection of panelists influence theperformance standard. These sources of error are independent of each other.
It is possible to adjust recommended performance standards for either or both of thesesources of error, but doing so requires conscious consideration of the relative costs offalse-positive and false-negative classification errors. An adjustment for both sources of errorcan be made by calculating the standard error of measurement of the assessment and the standarderror of the mean recommended pefiormance standard. These standard errors must then besquared and summed, and the square root of the sum of squares must be calculated. We will callthis result the “total standard error.”
If the recommended performance standard were to be increased by one total standard error,the percent of examinees with true perfiorrnance just below the original performance standardwho would pass, due to these errors, would be reduced from 50 percent to 16 percent (assumingnormally-distributed errors). Thus the rate of false-positive errors would be reducedsubstantially. However, the rate of false-negative errors for those whose true performance wasequal to the original standard would be increased to 84 percent. Lowering the originalperformance standard by one total standard error would have precisely the opposite effect. The
109
rate of false-negative errors would be diminished substantially, but the rate of false-positiveerrors would be similarly increased.
Whether performance standards should be adjusted to compensate for errors of measurementand sampling errors, and if so, in which direction, is a policy matter. Alerting policy-makers tothe existence of the errors and to potential adjustments of performance standards that could beused to address the errors is the responsibility of professionals who recommend performancestandards.
110
SummaryThe need to establish performance standards is unlikely to diminish in the coming years.
Education policy at the federal and state levels is firmly grounded in the notion that students andteachers should be held to high standards and that they should demonstrate their achievement ofsuch standards. As long as policy-makers express the need for standardized evidence of studentand teacher performance in terms of pre-established expectations and define public informationneeds similarly, those who establish performance standards will busily ply their trade.
In this chapter we have described the myriad ways performance standards are used and haveaddressed the need for new methods of establishing such standards for performance assessmentsof students and teachers. We have reviewed some strategies employed by those who haveheretofore encountered the problem of setting performance standards on assessments thatincorporate performance exercises+ literature that is principally fugitive and an area of inquirythat is embryonic. Finally, we have concluded with a review of technical dilemmas andprocedural issues that plague all attempts to set performance standards, but are particularlyimportant when standards are set for performance assessments. We hope that this latter sectionwill be regarded as a challenge to those who would advance this important line of inquiry.
111
Notes1 The word arbitrary is used here in accordance with the second meaning provided in the
Oxford English Dictionary (1970 1): “Relating to, or dependent on the discretion of the arbiter,arbitrator, or other Iegall y-recognized authority; discretionary? not fixed (p. 107). ” Even thoughjudges used to recommend test standards rarely have legal authority to do so, those who setstandards of performance typically have statutory authority to establish education policy. In thecase of the National Assessment of Educational Progress, for example, the National AssessmentGoverning Board has exercised authority provided in the NAEP authorization to adoptperformance standards that were recommended by a standard-setting panel and its contractor.
2The word capricious also used in accordance with the second meaning provided in theOxford English Dictionary (1971): “Full of, subject to, or characterized by caprice; guided bywhim or fancy rather than by judgment or settled purpose; whimsical, hurnoursome (p. 335).”Although the words arbitrary and capricious are sometimes used interchangeably, theirconnotative meanings are quite different. Reflective consideration and a well-defined judgmentprocess often underlies arbitrariness, but never capriciousness. This distinction is central to thecontrast made here.
3Proficient is defined as competency over challenging subject matter, Basic as partialmastery, and Advanced as superior performance.
4The following information about Maryland’s MSPAP is taken ffom a Memorandum of July27, 1993 from Nancy S. Grasmick, State Superintendent of Schools, to Members of the StateBoard of Education, and appendices.
‘Information about Kentucky’s performance assessment standards is derived from KentuckyInstructional Results Information System. 1991-1992 Technical Report, Kentucky Department ofEducation, Frankfort, KY, January 1993.
112
References
American Psychological Association (1985). Standards for educational andpsychological[eslirzg. Washington, DC: Author.
Angoff, W. H. (1 971). Scales, norms, and equivalent scores. In R. L. Thorndike (Ed.),Educational measurement (2nd. cd.). Washington, DC: American Council on Education.
Applebee, A.N., Langer, J. A., Mullis, I. V. S., Latham, A. S., & Gentile, C.A. (1 994). NAEP 1992Writing Report Card. Washington, DC: National Center for Education Statistics.
Aschbacher, P. R. (1991). Performance assessment: State activity, interest, and concerns.Applied Measurement in Education, 4, 275-288.
Berk, R. A. (1986). A consumer’s guide to setting petiormance standards on criterion-referencedtests. Review of Educational Research, 56, 137-172.
Busch, J. C. & Jaeger, R. M. (1990). Influence of type of judge, normative ifiormation, anddiscussion on standards recommended for the National Teacher Examinations. Journal ofEducational Measurement, 27, 145-163.
Cannell, J. J. (1987). Nationally normed achievement testing in America ‘spublic schools: Howall fijly states are above the national average (2nd cd.). Daniels, W: Friends for Education.
Cattell, R. B. (1966). The data box: Its ordering of total resources in terms of possible relationalsystems. In R. B. Cattell (Ed.), Handbook of multivariate experimental psychology. Chicago,Rand-McNally.
Chi, M., Glaser, R.,&Farr,M.(1988). 7?ze nature of expertise. Hillsdale, NJ: LawrenceErlbaum.
Chi, M., Glaser, R., & Rees, F. (1982). Advances in the psycholo~ of human intelligence, vol. I(pp. 17-76). Hillsdale, NJ: Lawrence Erlbaum.
Cizek, G. (1993). Reactions to National Academy report, “Setting Performance Standards forStudent Achievement.” Washington, D. C.: National Assessment Governing Board.
Ebel,R.L.(1972). Essentials of educational measurement. Englewood Cliffs, NJ: Prentice-Hall.
Glaser, R. (1987). Thoughts on expertise. In C. Schooler & W. Schaie (Eds.), Cognitive$imctioning and social structure over the lijie course (pp. 81-94). Norwood, NJ: Ablex.
Glass, G.V(1978). Standards and criteria. Journal of Educational Measurement, 1..5, 237-261.
Jaeger, R. M. (1982). An iterative structured judgment process for establishing standards oncompetency tests: Theory and application. Educational Evaluation and Policy Analysis, 4,461-475.
Jaeger, R. M. (1989). Certification of student competence. In R. L. Linn (Ed.), Educationalmeasurement (3rd. cd.). New York: American Council on Education/Macmillan.
Jaeger, R. M. (1990). Setting standards on teacher certification tests. In J. Millman & L.Darling-Hammond (Eds.), Zke new handbook of teacher evaluation: assessing elementa~and secondary school teachers. Newbury Park, CA: Sage Publications.
113
Jaeger, R. M. (1991). Selection of judges for standard setting. Educational Measurement: Issuesand Practice, 10, 3-6,10,14.
Kane, M. (1993). Comments on the NAE Evaluation of the NAGB Achievement Levels.Washington, D. C.: National Assessment Governing Board.
Linn, R. L., Kiplinger, V. L., Chapman, C. W., and LeMahieu, P. G. (1991, December).Cross-State Comparability of Judgments of Student Writing: Results from the New StandardsProject.
Luecht, R.M. (1993a). Some Technical Issues and Results of the 1992 Scaling of theAchievement Levels in Writing.” In Setting achievement levels on the 1992 NationalAssessment of Educational Progress in Writing: afinal report. Iowa City, IA: AmericanCollege Testing.
Luecht, R.M. (1993b). Interpolating theta for the partial credit model. In Setting achievementlevels on the 1992 National Assessment of Educational Progress in mathematics, reading,and writing. A technical report on reliabilip and validity. Iowa City, IA: American CollegeTesting.
Luecht, R.M. (1993c). Using IRT to improve the standard setting process for dichotomous andpolytomous items. Paper presented at the annual meeting of the National Council forMeasurement in Education, Atlanta, GA.
Minsky, M. & Papert, S. (1974). Artzjicial intelligence. Eugene, OR: State System of HigherEducation.
National Academy of Education (1 993). Setting performance standards for student achievement-A report of the National Academy of Education Panel on the Evaluation of the NAEP TrialState Assessment: An Evaluation of the 1992 Achievement Levels. Stanford, CA: TheNational Academy of Education.
National Academy of Education ( 1993). Setting performance standards for student achievement:Background studies. Stanford, CA: The National Academy of Education.
National Council on Education Standards and Testing (1 992). Raising Standards for AmericanEducation. Washington, DC: (author).
National Council of Teachers of Mathematics (1989). Curriculum and Evaluation Standards forSchool Mathematics.. Reston, VA: (author).
Nedelsky, L. (1954). Absolute grading standards for objective tests. Educational andPsychological Measurement, 14, 3-19.
Office of Technology Assessment (1 992). Testing in American Schools: Asking the RightQuestions (Washington, DC: (author).
Phillips, G. (1993). Methods and issues in settingperformance standards. Washington, DC:National Center for Education Statistics, unpublished.
Public Law 103-182. (1994). Improving American’s Schools Act of 1994. Washington, D.C.
Resnick, L. (1990, April). Psychometrician’ beliefs about learning: Discussion. Presented at theannual meeting of the American Educational Research Association, Boston.
114
Resnick, L. B. & Resnick, D. P. (1992). Assessing the thinking curriculum: New tools foreducation reform. In B. R. Gifford & M. C. O’Connor (Eds.). Fu/ure Assessments: ChangingViews of Aptitude, Achievement, and Instruction. Boston: Kluwer.
Schiffman, S. S., Reynolds, M. L.& Young, F. W. (1981). Introduction to multidimensionalscaling. Orlando, FL: Academic Press
Shepard, L. A. (1990). Psychometrician’ beliefs about learning. Presented at the annual meetingof the American Educational Research Association, Boston.
Smith, M. L. (1989), The Role of External Testing in Elementary Schools. Los Angeles: Centerfor Research on Evaluation, Standards, and Student Testing, UCLA.
The Secretary’s Commission on Achieving Necessary Skills (1992). Learning A Living: ABlueprint for High Performance. Washington, DC: U. S. Department of Labor.
U. S. General AccountingOffIce(1993). Education achievement standards: NAGB’s approachyields misleading interpretations. Report No. GAO/PEMD-93-12. Washington, DC: U. S.General Accounting Office.
Wiggins, G. (1993). Assessment: Authenticity, Context, and Validity, Phi Delta Kappan,November 1993.
115

Fairness in Large-Scale Performance Assessment]
Lloyd BondUniversity of North Carolina, Greensboro
Pamela MossUniversi~ of Michigan
Peggy CarrNational Center for Education Statistics
Defining FairnessIn the context of assessment, fairness is integrally related to the concept of validity, Concerns
about fairness are, in large part, concerns about the “differential validity” (Cole and Moss, 1989)of an assessment for any person or group of concern. However, concerns about fairness extendbeyond the consensual boundaries of validity, which encompass the soundness of anassessment-based interpretation or action, to include concerns about the soundness of theeducational or social policy of which the assessment is a part. In this chapter, we consider thesetwo broad aspects of fairness: those focusing on the validity of an assessment, which wecharacterize as concerns about bias, and those focusing on the soundness of the educational orsocial policy to which the assessment contributes, which we characterize as concerns aboutequity.
Fairness is a concern with respect to all persons who are assessed, whether considered asindividuals or as members of some definable group. Much of the relevant research has focusedon fairness with respect to groups defined by social background: typically race/ethnicity, primarylanguage, gender, and handicapping conditions, although any relevant grouping might bestudied, for example, based on age, curriculum experienced, type of school attended, and so on.No validity research can warrant the validity of an interpretation or action for a particularindividual unless it is carefilly evaluated in the context of other relevant information about thatindividual. The 1985 Standards for Educational and Psychological Testing and the Code of FairTesting Practice, jointly prepared by AERA, APA, and NCME, delineate obligations for testsusers and for assessment development professionals to those who are assessed. Our focus here isprimarily on studying issues of bias and equity across groups differing in social background.
Bias, like validity, refers to the soundness of an interpretation or action based on a testscore—not to the assessment instrument itself. An assessment may be biased for some purposesbut not for others. So, bias must always be evaluated in the context of the way in which anassessment instrument is interpreted and used. Validity refers to the extent to which the availableevidence supports the intended interpretation and action over alternative interpretations andactions given the intended purpose. Bias refers to the extent to which there is evidence ofdzflerential validity for any relevant subgroup of persons assessed. For every validity issue raisedin the chapter by Messick and colleagues, there is a related bias issue that may be raised withrespect to a group of concern. An assessment-based interpretation or action is biased when it isnot equally valid for all relevant subgroups.
117
Concerns about equity spill over the consensual bounds of validity and bias to includequestions about the fairness of the educational system in which the assessment was used. It ispossible for an assessment to be considered unbiased in a technical sense—in the sense that theintended interpretation is equally valid across various groups of concern-and yet be used inservice of a policy that fails to promote equity. Clearly, equal access to a high quality educationis a minimum requirement of a fair educational system, although, as we will discuss below, themeans of documenting and eliminating inequalities in the opportunity to learn are complex andproblematic. In addition, differences in educational outcomes are also relevant indicators offairness-there should be evidence that students are benefiting from their education. Ideally, in afair system, the average achievement is high and social distribution of achievement is equivalentfor all groups of concern (Lee and Bryk, 1989). The same might be said for the range of othervalued outcomes of schooling, such as self-esteem, citizenship, or access to employment orhigher education. Where differences exist between socially-defined groups, there is an on-goingeffort to understand the reasons for the difference and to implement policies that move in thedirection of closing the gap and raising the overall level of success. The question for assessmentevaluators is whether an assessment is contributing to or detracting from the fairness of theeducational system of which it is a part.
The fairness of an assessment system must always be evaluated in light of the purpose it isintended to serve and the way in which the results are interpreted and used. An assessment maybe “fair” for some purposes, but patently unfair for others. For instance, if an assessment is usedfor instructional planning, evidence that students have had the opportunity to learn the materialassessed is not necessary, although it may be usefil; however, if the same assessment is used toinform decision about promotion or certification for graduation, such information is crucial.Moreover, simple differences in summary statistics between socially defined groups are not, inand of themselves, indicators of bias or inequity; they do, however, highlight the necessity of acareful search for additional evidence, in light of the purpose of assessment, to explain thesource of the differences and to inform decisions about the appropriateness of the assessmentsystem and the policy that surrounds it. Our intent is to offer readers a framework for studyingfairness-collecting and evaluating evidence to inform conclusions about bias and equity+md,where existing research permits, to offer suggestions for designing and using assessments inways that enhance fairness.
In the section entitled “Fairness and Bias,” we offer suggestions for minimizing bias duringassessment development, administration, and evaluation. In the section entitled “Fairness andEquity,” we cover three interrelated sets of issues. First, we summarize evidence on differencesin performance between groups differing in social background and offer recommendations forresponsible reporting of such differences. Second, we highlight the importance of understandingdifferential performance in light of the differences in antecedent conditions, especially theopportunity to learn. Here, we emphasize the legal and ethical importance of ensuringopportunity to learn when students are held accountable for their performance as in cases ofdecisions about promotion or graduation. We close with a consideration of the potential fordifferential consequences of performance assessments across socially defined groups,highlighting the need for on-going critical dialogue among all stakeholders in the assessmentprocess.
118
Fairness and BiasAs mentioned earlier, the term bias will be used hereto refer to the extent to which a test
score and test use are valid for all intended individuals and groups. As such, if an assessmentresults in scores that systematically underestimate the status of members of a particular group onthe construct in question, then the testis biased against members of that group. An assessment isalso biased if it purports to measure a single construct across groups, but in fact measuresdifferent constructs in different groups. To take a familiar extreme example, an assessment, inEnglish, of quantitative reasoning administered to two groups of students who differsignificantly in English proficiency, may be a relatively pure measure of quantitative reasoningin English-proficient group, but probably reflects a mixture of knowledge of English andquantitative reasoning in the less English-proficient group.
The term bias will also be used hereto apply to situations where an assessment isdifferentially valid in selecting individuals for favored treatment (e.g., employment or collegeadmissions) and in predicting some fiture criterion. We should note in passing that bias inselection and prediction is by no means a straightforward matter, and competing models ofselection and prediction bias are still being debated (see Hartigan & Wigdor, 1989; and Journalof Educational Measurement, Special Issue on Bias in Selection, Vol. 13, 1976).
Finally, it is worth repeating that what counts as “bias” ultimately depends upon the purpose,intended interpretations, and context of the assessment. Assessment exercises on NAEP, forexample, have no consequences for individuals, schools, or districts (at least not yet!) and arevery different from assessments for individual certification or placement, and lead to differentconcerns of the what constitutes bias and the nature of that bias.
With these caveats, we may ask, what specific factors affect bias in performance assessmentand what procedures can be undertaken to minimize their effects? Biases in performanceassessment may be conceived as falling under two broad rubrics. The first, biases emanatingfrom internal sources, encompasses the actual content and administration of the assessmentitself. The second, exlernal sources of bias, refer to the relationship between the assessment andsome outside criterion of practical or theoretical interest.
Internal Sources of Bias in Performance Assessment
In virtually all aspects of the assessment situation, internal biases can enter the assessment.Biases may be present in the specification of the content framework, in the development ofactual tasks and exercises, in the selection and training of scorers, and in the actual scoringrubrics. Moreover, performance assessments do not follow a compensatory model. Poorlyconceived exercises that draw heavily upon construct-inelevant abilities cannot be rescued byhigh quality scorer training. A well-thought-out and comprehensive content framework can benegated by exercises that do not reflect the framework, or by an inadequate scoring scheme.Performance assessment is a good illustration of the old saw that a chain is only as strong as itsweakest link.
Diversity of development and scoring panels. First, diversity among the experts selected tospeci$ the content framework, to develop and evaluate candidate exercises, and to devise validand reliable scoring schemes is critical. This is especially true for those subject areas wheredifferences in the skill required for successful performance vary as a fhnction of context. The
119
conduct of an arts assessment is a good example. Individuals of different racial, ethnic, or gendergroups will probably vary substantially in their opinions about what range of content should beincluded for an arts assessment; what performance tasks should be included; and how the scoringshould be developed and applied. The problems associated with a lack of diversity amongexperts are of particular concern with performance assessments, as there is far more room forsubjective judgment with open-ended and extended response questions than with traditionalmultiple choice or true or false questions. Hence, it is particularly critical that a fill array ofopinions from experts of different cultures, ethnic, and social backgrounds be reflected in theprocess of test development for performance assessment.
Speczjjying the conierztframework. The first source of possible bias in assessment is in thespecification of the content framework. If the initial conceptualization of what constitutesunderstanding of geometric concepts, for example, is flawed, then the tasks devised to assess thatunderstanding will in all probability be similarly flawed. Even if the specification of the contentframework is sufficiently rich and diverse to encompass a wide variety of original and creativedemonstrations of understanding, the exercises designed to reflect that understanding maycontain sources of irrelevant difficulty that disadvantage members of subgroups of thepopulation. To continue with the above example, the understanding of a concept in geometry,and the ability to use that concept in problem solving, can be distinguished from the ability towrite reflective y about one’s understanding. Much of performance assessment, however, isdominated by precisely this kind of expressive and reflective ability. (To be sure, such abilitiesare important in their own right, but to the extent possible they should be distinguished fromother abilities.) A given teacher can often write eloquently about what she or he wants studentsto learn and about “constructivist approaches” to teaching, but the actual behavior before theclassroom may belie this eloquence. The opposite is also true. In a research project co-directedby the first author involving the development of expertise in aircrafi engine mechanics, therecognized shop aces were often unable to explain an assembly or tear-town procedures awayfrom the shop. They insisted upon going to the job site and demonstrating the procedure in -question.
In some subject matters, specification of the content framework would appear to be arelatively straightforward, if time-consuming, matter. The disciplinary consensus achieved inNational Council of Teachers of Mathematics Standards is a case in point. These standardsrepresent the work of an incredibly diverse set of individuals from a variety of philosophical,social, and ethnic backgrounds who teach in widely different cultural, social, and economic
the
contexts. Yet consensus on what constitutes desired mathematical competencies in students anddesired practices in teaching mathematics was achieved. Whether a similar consensus will beachieved in other disciplines remains to be seen. History and social studies, to take what areperhaps the most obvious examples, are largely “constructive” enterprises, involving matters ofinterpretation that will va.xy as a function of ethnicity, gender, and social class. Consensusregarding what constitutes the very “stuff’ of history and social studies is problematical, not tomention what constitutes evidence of “understanding” social and historical phenomena. Torepeat, it is important to ensure that a diversity of viewpoints be represented in the initialspecification of the content framework.
Selection o~tasks and exercises. The unidimensionality of most paper-and-pencil measuresof cognitive ability constitute both a strength and, ironically, an essential weakness. On the onehand, unidimensionality facilitates test use and the interpretation of test results. Whether the test
120
model underlying performance is classically-based or based upon item-response-theory, personswith the same “observed score” or “theta” are presumed to be approximately equal in the abilitybeing measured. In performance assessment, however, the situation is fi.mdarnentally different.Generalizability studies in a wide variety of contexts indicate that the variance components dueto exercises and the exercise-by-examinee interaction constitute significant portions of the totalvariance in performance. The situation is exacerbated by the fact that the number of exercises areusually much smaller in typical performance assessments than in standardized multiple-choicegroup tests. Thus, even if a “general factor” in complex performance could emerge, it is unlikelythat it would be reliable given the number of exercises involved.
The multidimensionality of performance assessments stems not only from the inherentcomplexity of such assessments, but also from the very real effects of context. Posing a task oneway, as opposed to another, or in one context as opposed to another, can result in surprisinglydifferent results. Horizontally presented addition problems turn out to be significantly moredifficult for young children than the same problems presented vertically. This finding is no doubttraceable in part to instruction, but it highlights the fact that early knowledge is precarious,seemingly trivial, surface differences in exercise formats can have substantial effects onperformance.
One implication of the relatively large variance components due to exercises and the
and
exercise-by-candidate interaction in performance assessment is that which exercises are includedin an assessment, and the wording and context of those exercises, becomes important and hasperhaps more implications for fairness and equity than would be the case in standardized grouptests.
Sensitivity Review. Assessment stimuli must, of necessity, be about something. Whether theassessment is a writing sample, an extended response to a practical problem in mathematics, or aportfolio entry, the actual exercise will contain words that describe situations encountered in ourculture. Sound testing practice, not to mention simple common sense, requires that assessmentmaterials not include wording, references, or situations that are offensive and insensitive totest-takers. “Sensitivity review” is a generic term for set procedures for ensuring (1) that stimulusmaterials used in assessment reflect the diversity in our society and the diversity of contributionsto our culture, and (2) that the assessment stimuli are free of wording and/or situations that aresexist, ethnically insensitive, stereotypic, or otherwise offensive to subgroups of the population.Sensitivity review is becoming a routine part of many large-scale test development agencies.Ramsey (1993) provides an excellent review of sensitivity review procedures at ETS, a leader inthis area.
Selection and training of administrators and scorers. Sound administration and scoring ofperformance assessments are much more difficult to achieve in performance assessment than inmultiple-choice tests. In the latter, standardization of instructions in administering the test ispresumed to be a part of the definition of fairness, and standardized scoring is assured by amachine. In performance assessment, however, the selection and training of administrators andscorers are critical features of the overall validity of the assessment. The necessity for a diversegroup of administrators and scorers has already been mentioned. In addition, however, closeattention must be paid to administrators and scorers, and their biases.
The objective of assessment should be not so much the standardization of instructions, asensuring that examinees have a common understanding of the tasks involved. Because
121
performance assessment is, or can be, richly interactive, it is vitally important that administratorsnot only understand the constructs being assessed, but it is essential that they know how todiscern when an exarninee does not understand what is being asked and what kinds of additionalexplanation is needed. Regarding scorers, it is surprising how many people continue, even aftertraining, to equate and confuse “writing ability” with “understanding.” Many people findmisspellings so annoying that it is impossible for them fairly to ignore this construct-irrelevantability in essays where the intent is understanding a discipline, rather than spelling, per se. It is,moreover, often impossible to “train out” personal biases some persons hold about the abilitiesof boys vs. girls, or blacks vs. whites.
The emphasis in training should not be restricted solely to eliminating sources ofconstruct-irrelevant difficulty for minority group members. It may also happen that assessmentexercises contain construct-irrelevant elements that specifically advantage certain individuals.The “neatness” and visual attractiveness of a portfolio, for example, are related to the resourcesavailable to a student or teacher, but are typically unrelated to the ability being measured. Yet,despite training, these factors oilen figure unconsciously in scoring. The bottom line is that oftenthe thought and hard work that go into the specification of the content framework and into theconstruction of high quality exercises that are tied to that fiarnework, can be rendered useless bypoorly chosen or inadequately trained scorers.
Bias in perJonnance exercises. The sophisticated statistical machinery that has beendeveloped for the identification of biased items in paper-and-pencil tests cannot unfortunately beapplied in a straightforward manner to performance assessment. For example, all of thetechniques for identifying differentially fimctioning items by subgroups using item responsetheory (Holland & Wainer, 1993) require large numbers of exarninees and more items than aretypically found in petiormance assessment. The same applies to Gassically-based proceduressuch as the Mantel-Haenszel technique (Holland & Thayer, 1988), and the standardizationmethod (Dorans & Holland, 1988).
A repeated and rather baffling finding in studies that attempt to identi~ patterns of DIF instandardized aptitude and achievement measures is that items identified as functioningdifferentially do not appear to differ in any discernible way from items not so identified. O.Neilland McPeek (1993) have attempted to summarized patterns of DIF for the Scholastic AptitudeTest, and although some of their conclusions are encouraging, the general rule is that patterns ofDIF traceable to substantive characteristics of the items or item-formats are diflicult to come by.Moreover, the connection between DIF (as a technical characteristic of test items defined byreference to internal properties of the test), and test bias (a much larger issue involving theopportunity to learn, among other things) is not at all clear. Space does not allow athoroughgoing discussion of this complex issue. For an incisive discussion of the relationbetween item bias (a term that predated DIF by some 35 years), DIF, and test bias broadlyconceived, see Camilli Shepard (1994).
Absent any agreed-upon methodology for the systematic examination of sources of bias inperformance assessment, we must rely upon expert judgment and a close adherence to soundassessment practices. One of the significant promises of performance assessment is that thesources of any biases in the assessment, as well as the sources of any genuine deficiencies ofexaminees, are more likely to be discovered. Unlike multiple choice test, where the only
122
permanent record is a series of blackened ovals by the examinee, performance assessment allowsat least some insight into an exarninee’s thinking.
External Sources of Bias in Performance Assessment
In many applied uses of tests, the relationship between test performance and some externalcriterion is crucial, and the extent to which test scores of various social groups are dzflerentiallyrelated to the external criterion becomes a potential source of bias.
The behaviors elicited by traditional group-administered paper-and-pencil tests are oftendifferent from the behaviors the test is intended to predict. The differences are quite apparent insuch applications as certification and licensure and in employment contexts. In the performanceof their professional legal and accounting duties, for example, lawyers and accountants arevirtually never required to perform the kinds of tasks typically found on group administeredmultiple-choice. Nor are the circumstances under which the tests are administered reflective ofthe circumstances under which their actual duties are performed. (Most lawyers, for example,would never decide on a specific legal strategy without extensive prior research).
In the context of student assessment, much of the criticism of traditional paper-and-pencilmeasures of academic achievement derives from the impoverished, decontextualized nature ofthe stimulus questions. Their predictive validity for future academic performancenotwithstanding, verbal analogies are not what teachers of English Language Arts should beabout. It is entirely likely that excellent instruction in English Arts instruction coupled withperformance assessment (which properly viewed are complementary) would result in studentswho do well on verbal analogies, but that is a derivative side effect, rather than an object ofinstruction. One point appears certain: to the extent that instruction and assessment becomemerged into one coherent process, performance assessment has the potential to remove onemajor criticism of current testing practice, to wit, that biases in the prediction of external criteriaare more likely when the relationship between teaching, testing, and later performance is onlyimplicit.
An unbiased
Fairness and Equityassessment+ne that is equally valid for all relevant subgroups—is, of course,
a minimal requirement for fairness. Here we move beyond questions of bias and validity to raisequestions about the fairness of the educational system in which the assessment is used. Many ofthe state and national assessment-based reform efforts reflect high expectations about the extentto which assessments can facilitate excellence and equity in education. These expectations mustbe carefi.dly and continually evaluated as assessments are designed and implemented. Here, wewill focus on differences between groups varying in social background~ifferences inperformance on the assessments, differences in opportunity to learn the material assessed as wellas other valued goals of education, and difference in the consequences of assessment use. Inparticular, we focus on differences between underserved minority groups and the majority groupto which they are compared. By underserved minority groups, we refer to students from poorcommunities and from black, Hispanic, and American Indian racial/ethnic backgrounds. Wecharacterize these groups as underserved because of the large body of evidence (e.g., Oakes,Gamoran and Page, 1992) that documents inequalities in access to-high quality education+issue to which we will return in the section on opportunity to learn.
123
Differential Performance
A large body of evidence shows that, on the average, students from undersexed minoritygroups-those from poor communities and from black, Hispanic, and American Indianracial/ethnic backgrounds-have scored lower than students from the relevant majoritycomparison group on multiple choice tests across a wide range of assessment purposes involvingstudents in elementary, secondary, post-secondary and vocational education (NationalCommission on Testing and Public Policy, 1991). This difference in performance betweensocially defined groups is often referred to as the “achievement gap. ” Some educators havetheorized that performance assessments will narrow the achievement gap because they sample abroader range of capabilities, provide examinees with the opportunity to explain their responses,permit them more latitude in choosing tasks that best represent their capabilities, and, in the caseof hands on assessment, rely less heavily on language skills (see Office of TechnologyAssessment, 1991; Hambleton and Murphy, 1992). Others raise concerns that these unfamiliarassessment formats may disadvantage students when compared to the more familiar multiplechoice format (see Badger, in press; Office of Technology Assessment, 1991). Theseexpectations must be carefhlly evaluated.
Relevant evidence is scanty and mixed. (Baker and O’Neill, in press; Bond, 1992, OffIce ofTechnology Assessment, 1991; Darling-Hammond, 1994; Linn, 1993; Linn, Baker, and Dunbar,1991; Madaus and Kelleghan, 1992; Madaus, 1994; in press; National Commission on Testingand Public Policy, 1990; Nettles, in press; Wirdleld and Woodard, 1994.) Typically, differencesin performance between groups are compared for traditional and alternative assessments in termsof effect size or by comparing the proportions passing (or scoring above or below some cutscore). Effect sizes are computed by subtracting the mean for the minority group of concernfrom the mean for the majority comparison group and dividing by the standard deviation of themajority comparison group. A narrowing of the “achievement gap” would be indicated by asmaller effect size or greater equivalence across groups in proportions passing whenperformance assessments are compared to more traditional assessments.
Some studies have found no difference in the achievement gap between performanceassessments and more traditional assessments. For instance, Linn, Baker andDunbar(1991 ),using results from the 1988 NAEP, found that differences in achievement between black andwhite students in grades 4, 8 and 12 were essentially the same for the open-ended essay items inthe writing assessment and the primarily multiple choice items in the reading assessment. Otherstudies have found a narrowing of the achievement gap. For instance, Badger (in press), usingresults on open-ended and multiple choice items from the Massachusetts testing program foundsmaller performance gaps for open-ended items when comparing students in low- and high-SESschools, and when comparing black and Hispanic students to white and Asian students. Herresults were consistent across grades and subject areas. A comparison of the magnitude ofdifferences between black and white military personnel on paper and pencil (Armed ServicesVocational Aptitude Battery (ASVAB) and other job knowledge tests) versus hands on testsresulted in smaller differences for the hands on tests (Wigdor & Green, 1991). Others have foundan increase in the achievement gap. Elliott (1993), comparing differences in performance forwhite and Asian students to those for black and Hispanic students on multiple choice andconstructed response items for the 1992 NAEP in mathematics found a larger gap forconstructed response items. LeMahieu (1992) reported larger differences between black andwhite students when portfolio scores, reflecting self-selected pieces of writing, were compared to
124
an independent measure of writing. LeMahieu attributes the differences to self-selection: blackstudents did not choose material from their writing folders that best represented their writing.
Given the existing evidence, there is no reason to believe that differences observed withtraditional assessments between underserved minority groups and the majority comparison groupwill necessarily diminish with performance-based assessment. To offer any other generalizationbased on the existing evidence would be inappropriate. The studies differ widely in terms of thepurposes of assessment, the constructs assessed, the format in which performances are presentedand evaluated, the antecedent instructional conditions, and the social and academiccharacteristics of the students assessed. The only appropriate advice is to highlight the crucialimportance of investigating and then attempting to understand the reason for group differencesfor each context of assessment.
Careful attention must be given to the way in which group differences are reported andinterpreted. Reporting simple differences in performance between schools or districts, betweenracial/ethnic groups, between students from poor and wealthier families, without additionalinformation to assist in explaining the differences, may result in serious misinterpretations. Forinstance, changes in assessment scores from year to year may simply reflect changes in thestudent population (dropouts or transfers, for instance) rather than changes in the capabilities ofstudents. Differences in assessment scores across ethnic groups may reflect differences insocioeconomic status of the communities in which they live. Differences in assessment scoresfrom school to school may reflect differences in resources and activities such as the qualificationof teachers or the number of advanced course offerings. Of most serious concern here is thepotential misinterpretation of differences between racial/ethnic groups. Lee cautions (personalcommunication, April 14, 1994) that providing racial breakdowns may “overestimate theimportance of racial differences in academic achievement . . . because they are confounded withuncontrolled social class differences”; this risks misinforming the nation by “allowing people toconclude that it is only race (and not poverty) which is driving these differences”. Haertel (1989)similarly notes that controls for socio-economic status reduce apparent disparities based onrace/ethnicity. Moreover, differences in achievement between underserved minority and majoritygroups (whether defined by race/ethnicity or socio-economic status) can be substantiallyexplained by differences in access to high quality education (Darling-Hammond, 1994; Barr andDreeben, 1983; Lee and Bryk, 1988, 1989; Oakes, 1985; Oakes, Garnoran, and Page, 1992). AsDarling-Hammond and Ascher (1 991) note, “comparisons of test scores that ignore these factorshold little promise of directing policy makers’ attention to the real sources of the problem, sothat it can be rectified” (p. 16). This is the issue to which we turn next.
Opportunity to Learn and Other Antecedent Conditions
All of the policy research we reviewed appropriately places a high premium on providing a“level playing field” for students and schools. In the context of assessment, there are at least fourreasons why it is important to provide information about opportunity to learn. First, whenassessments are used for high stakes decisions, such as promotion for graduation, it is a legal andethical responsibility to ensure that students have had the opportunity to acquire the capabilitiesfor which they are held accountable. Second, regardless of whether the stakes of assessment arehigh or low, such information is essential both for understanding the results and for directingattention to needed reforms in policy and practice. Third, it must be recognized that assessmentsnot only document the success of learning opportunities, they constrain and enable fiture
125
learning opportunities (an issue to which we will return in the section on differentialconsequences). And so, when assessments are introduced into the system, it is essential to studyboth the antecedent and consequent conditions of their use. Finally, the issue of “opportunity tolearn” is no longer solely a measurement or even an ethical one, but a matter of legal precedent.The most directly relevant case law is, of course, Debra P. vst Burlington (730 F. 2d 1401 lthCir. 1984), in which the court held that a state’s minimum level of performance on astandardized competency test as a prerequisite for a high school diploma is proper only if theassessment tested what was actually taught in the schools. The Due Process Clause of the FifthAmendment, Title VI of the Civil Rights Act of 1964, Title IX of the Education Amendments of1972, and Section 504 of the Rehabilitation Act of 1973 are implied if student assessments havean adverse impact on students because of their race, national origin, gender, or disability. If, forexample, a test results in substantially different rates of eligibility for educational benefits orservices on the basis of a student’s group membership, then the use of that test may be inviolation of civil rights laws and statutes.
Unquestionably, differential learning opportunities play a major role in determining studentachievement (Barr and Dreeben, 1983; Gamoran, 1987; Lee and Bryk, 1988, 1989; Oakes, 1985;Oakes, Garnoran, and Page, 1992). Moreover, there is evidence of socialstratification-differences attributable to race/ethnicity and socioeconomic status-in thelearning opportunities available to students and consequently in educational outcomes.Differences in access to high quality education occur within schools, in course taking patterns,for instance, as well as between schools in the resources they have available. Oakes, Garnoran,and Page (1992), summarizing literature on curriculum differentiation, report that“disproportionate percentages of poor and minority students (principally black and Hispanic) arefound in curricula designed for low ability or non-college bound students . . ..Further. minoritystudents are consistently underrepresented in programs for the giiled and talented . . .. Although itseems clear that consistently lower performance on tests by non-Asian minorities under girdsthis pattern, the result is that curriculum differentiation leads to considerable race and classseparation and race- and class-linked differences in opportunities to learn” (p. 58x, 590).Darling-Hammond (1994) summarizing evidence on the social distribution of qualified teachersnotes that “because teacher salaries and working conditions are inadequate to ensure a steadysupply of qualified teachers in poor districts, low-income and minority students are routinelytaught by the least experienced and least prepared teachers” (Darling-Hamrnond, 1994, p. 16).
No consequential decision about individual students or educational programs should be madeon the basis of a single assessment. With respect to individuals, additional information about thestudent’s achievement and past experience should be considered. As Haertel (1989) notes in hispaper for the National Commission on Testing and Public Policy, “simplistic policies, whereaction is triggered by scores above or below a cutting point on a single test. . . are contrary tothe consensus of professional practice in testing.” (p. 32). At the program level, assessmentscores should be part of a comprehensive system of indicators, that includes information aboutstudent characteristics and about school activities and resources over which policymakers havesome control.
While it is beyond the scope of this chapter to provide specific advice about how to design aninformative and equitable indicator system, we highlight some general guidelines fi-om policyresearchers and direct readers to the original articles for more specific advice about how tooperationalize their suggestions. We note, as does Oakes (1989), that there are many obstacles to
126
overcome in developing standards and indicators of opportunity to learn, including insufficientmeasurement technology and feasibility. Porter (1993) raises the question of whether schooldelivery standards should be intended to inspire and to provide a vision for educators, students,parents, and the public of what good practice might be, or whether delivery standards shouldprovide prescriptions of required practice that can be used to police the action of teachers, schooladministrators, and public ofllcials. He suggests distinguishing between school processstandards, which would provide the vision, and school performance standards, which wouldsupport school monitoring, thus meeting accountability requirements for ethical and legalpurposes. Our goal here is simply to suggest some possible frameworks for studying theseissues.
Some of the advice on documenting opportunity to learn focuses on whether students havehad the opportunity to learn the material on which [hey are rested. Mehrens and Popham (1 992),focusing on legal defensibility, suggest gathering the following evidence regarding studentsopportunity to learn the material covered by a particular test or assessment:
(1) Self report from teachers regarding the extent to which instruction for testedcontent was supplied....(2) Self reports from students regarding whether the students havebeen taught ‘how to answer the illustrated kinds of test questions....(3) Analysis ofrequired textbooks to determine if test content is addressed....(4) Analyses of curriculardocuments such as course syllabi to establish whether tested content is supposed to beaddressed by teachers....(5) Analyses of teacher’s classroom tests to discern if the contentcontained in the high-stakes examination is also addressed in teachers’ routine classroomtests. (p. 275-276).
They advise against use of classroom observation because the expense and the difficulty ofobtaining an adequately representative sample to permit inferences about all the tested material.While this advice addresses the opportunity to learn the tested material, it does not address thequality of education more broadly nor, with the possible exception of examining teachers tests,does it address the way in which the material is taught-an issue crucial to performanceassessments that encourage students to interpret and evaluate material for themselves. (SeePullin, 1994, for a more extensive review of the legal issues involved in current nationaleducational reform proposals.)
Moving beyond the content of tested material, the recently passed goals 2000 legislationoffers the following guidelines for elements to be included in voluntary national opportunity tolearn standards
. the quality and availability to all students of curricul~ instructional materials, andtechnologies, including distance learning;
. the capability of teachers to provide high-quality instruction to meet diverse learning needs ineach content area to all students;
. the extent to which teachers, principals, and administrators have ready and continuing accessto professional development, including the best knowledge about teaching, learning, andschool improvement;
. the extent to which curriculum, instructional practices, and assessments are aligned tovoluntary national content standards;
127

. the extent to which school facilities provide a safe and secure environment for learning andinstruction and have the requisite libraries, laboratories, and other resources necessary toprovide an opportunity-to-learn; and
. the extent to which schools utilize policies, curricula, and instructional practices whichensure nondiscrimination on the basis of gender. (Goals 2000 Legislation, Sec.2 13(c)(2)(A-F)).
Factors that effect opportunity to learn occur at a variety of levels. At the school level, factorssuch as financial resources, qualification of teachers, curriculum offerings, teachers’work loads,materials resources such as libraries, laboratories, and computers, and so on, should beinvestigated. However, equality of opportunity cannot be adequately addressed by simplylooking at school level resources and assuming the students within schools have equal access tothose resources. Substantial variation in access to resources exists within schools and evenwithin classes that school level indicators can’t observe (e.g., Barr and Dreeben, 1983; Lee andBryk, 1989; Oakes, 1989; Porter, 1993).
Oakes (1 989) notes that school resources are mediated by organization policies and structuresas well as by the school culture that is reflected in norms and relationships.
Even though we do not filly understand how schools produce the results we want,context information may provide clues to policymakers about why we get the outcomeswe do. Measures of what goes on in schools can add important information to thepolitical discussion about how to improve them (Oakes, 1989, p. 182).
Similarly, Porter (1993) notes that evidence of opportunity to learn must include evidence ofeffective pedagogy. With performance assessment, this covers instructional strategies such as “aneed for instruction to emphasize active student learning, where students take responsibility forconstructing knowledge through writing, discussion, lab work, manipulative, and computersimulations” (p. 26). Moreover, knowledge of school resources, such as libraries and labs mustbe accompanied by evidence of course specific resources indicating access for all students in allsubjects.
Oakes (1 989) suggests gathering itiormation about the following sets of “context indicators”to monitor schooling resources and processes. Access/o knowledge refers to the “extent to whichschools provide students with opportunities to learn various domains of knowledge and skills”(p. 186) . Indicators might include: teacher qualifications, instructional time, course offerings,class grouping practices, materials/laboratories/equipment, academic support programs,enrichment activities, parent involvement, staff development, and faculty beliefs. Press forachievement refers to the “pressure which the school exerts to get students to work hard andachieve” (p. 186). Possible indicators include: focus on academics, graduation requirements,graduation rates, enrollment in rigorous programs, recognition of academic accomplishments,academic expectations for students, uninterrupted class instruction, administrative involvementin academics, quantity and type of homework, and teacher evaluation emphasizing learning.Professional teaching conditions are the “conditions that can empower or constrain teachers andadministrators as they attempt to create and implement instruction programs” p. 186). Here,potential indicators include teacher salaries, pupil load/class size, teacher time for planningcollegial work, teacher involvement in decision making, teacher certainty, teacherautonomy/flexibility, administrative support for innovation, and clerical support. Clearly, to
128
address the equity question, these indicators must be examined to see whether they are equallydistributed across all groups of concern.
Factors that exist outside of school influence students readiness to take advantage of theopportunities school affords them. These include factors such as health, nutrition, livingconditions, family support for education, educational resources in the home, and so on (Lee andCroninger, in press; Madaus, 1994, in press; Koretz, et al., 1992). Also of concern aredifferences between the cultural context of the home and the school, which are too oflen viewedas deficits rather than differences (Garcia and Pearson, 1994; O’Comor, 1989; LaCelle-Petersonand Rivers, 1994). Darling-Hammond (1994), speaking in the context of assessment, notes, “thechoice of items, responses deemed appropriate, and content deemed important are the product ofculturally and contextually determined judgments, as well as the privileging of certain ways ofknowing and modes of performance over others. (p. 17; See also, Garcia& Pearson, 1994;Gardener, 1983; O’Connor, 1989; Steinberg, 1985),” (Darling-Hammond, 1994, p. 17) Gordon,while affirming his commitment to standards of competence that are the same for allpopulations, highlights the importance of allowing differential indicators of progress towardthose standards: “The task is to find assessment probes which measure the same criterion fromdifferent contexts and perspectives which reflect the life space and values of the learner . . ..Thusoptions and choice become critical features in any assessment system created to be responsive toequity” (Gordon, 1992, pp. 5-6). These issues concerning potential disjunctions among culturalcontexts are equally relevant to any school-based learning or assessment activity.
Frameworks for more comprehensive indicator systems that tie together backgroundinformation, information about school context and processes, and itiorrnation about valuedlearning outcomes have been suggested by Darling-Hammond and Ascher (1991), Porter (1991,1993) and Bryk and Hermanson (1993). Porter, drawing on Shavelson (1987, in Porter, 1991),suggests a comprehensive model organized around inputs, processes, and outputs of education.Inputs include fiscal and other resources, teacher quality, student background, andparental/community norms. Processes are divided into organizational and instructionalcharacteristics of schooling. Organization characteristics of schooling include national, state,district, and school quality; instructional characteristics include general curricuh.udcontent andteaching/pedagogy quality, student nonacademic activities, course specific teacher quality, andcourse specific resources. Outputs include achievement, participation, and attitudes andaspirations.
Bryk andHermanson(1993), drawing on the work of the Special Study Panel on EducationIndicators (NCES, 1991, in Bryk and Hermanson, 1993), caution that inputs-processes-outputsmodels risk conveying a false sense of control based upon external manipulation. They suggestthat a comprehensive indicator system should focus on the following “enduring concerns” ineducation, the purpose of which is to inform public discourse about the means and ends ofeducation:
Clearly the system must focus on student learning and the quality of its educationalinstitutions. The system should, as well, report on the larger social context that alsoeducates. This implied a concern for children’s readiness to learn as they enter the formaleducational system and, in more general terms, societal suppor~-for learning. It must alsoinform us about the broader aspirations we hold for education in a modem democratic
129
society. This meant a dual focus on educational equi~ and the contributions of educationto economic productivity. (Bryk and Hermanson, 1993, p. 468).
They goon to suggest that the system should use a number of different reporting and datacollection levels.
As a trend in a particular indicator engages our attention, it should naturally lead tomore detailed statistical information, including in-depth studies and case analyses thatmight illumine some of the forces at work . . . . The system should have a strong conceptualorganization, capturing both established means-ends generalizations from social scienceand the best clinical expertise. (p. 468),
As a comparison of these more comprehensive indicators systems suggest, one of the majorissues underlying assessment-based reform efforts is the way in which information is expected(and intended) to influence the educational system. That is the issue to which we turn next.
Differential Consequences
It is widely hoped that performance assessments will not only permit valid inferences aboutthe quality of education but serve as instruments of reform by raising standards for all students,thus promoting excellence and equity. Given our past experience with high stakes assessmentand the current state of our knowledge about the construct validity of performance assessments,this anticipation is optimistic at best—the assumptions about the quality of information and theconsequences of the assessment must be carefilly evaluated. In understanding and evaluatingconsequences, it is important to look not just at the format of the assessment (e.g., multiplechoice versus performance based) but also at the way in which the assessment is used to promotereform.
A growing body of evidence indicates that when assessments are visible and haveconsequences for individuals or programs, they alter educational practice, sending anunequivocal message to teachers and students about what is important to teach and learn (e.g.,Johnston, Weiss, and Afflerbach, 1990; National Commission on Testing and Public Policy,1989; Resnick and Resnick, 1992; Smith, 1991 ). In a review of literature on the impact ofclassroom evaluation on students, Crooks (1988) concluded assessment not only affectsstudents’ judgments about what is important to learn, but also their motivation, perceptions ofcompetence, approaches to personal study, and development of enduring learning strategies.Similar conclusions have been drawn about the impact of district and state mandated assessmenton the judgment, perceptions, and instructional strategies of teachers. The salience of thisinfluence seems to be directly related to the importance of the consequences of testing tostudents and teachers and to the administrative and supervisory practices of a school or district.In a paper prepared for the National Commission on Testing and Public Policy, Resnick andResnick concluded that “when the stakes are high—when schools’ ratings and budgets orteachers’ salaries depend on test scores+fforts to improve performance on a particularassessment seem to drive out most other educational concerns” and “to progressively restrictcurricular attention to the objectives that are tested and even the particular item forms that willappear on the test. ” (1992, p. 58).
Evidence suggests that the narrowing of the curriculum associated with high stakesstandardized assessment may be falling disproportionately on certain groups of students for
130
whom concerns about equality of education have been most salient. Neill and Medina ( 1989)found that standardized testing was more prevalent in large urban school systems. Madaus, West,Harmon, Lomax, andViator(1992, in Madaus, in press) report national survey results showingthat teachers with greater than 60 percent minority students in their classrooms were more likelyto teach to standardized tests, to spend time in direct test preparation, and to spend more of theirclass time on these activities than were teachers in predominately white classrooms. Similarresults were found for teachers of students in Chapter 1 programs. Herman and colleagues(Herman and Golan, 1993; Dorr-Bremme and Herman, 1986), using teachers’ and principals’self-reports, found that in low income communities, teachers felt a greater need to spend timepreparing students for tests and principals felt that tests counted fhr more in decisions such asplanning curriculum, making class assignments, allocating fimds, and reporting to districtofficials and the community. To the extent that testing undergirds decisions about educationalplacement, studies on the effects of tracking reviewed by Oakes, Gamoran, and Page (1 992) alsosupport concerns about the differential impact of testing on underserved minority students. Theyreport that qualitative differences exist in the educational experiences provided students indifferent tracks, with lower track students progressing more slowly through the curriculum,having less experience with inquiry skills, problem solving, and autonomy in their work, andlosing more educational time to classroom managemen~ that the achievement gap betweenstudents in higher and lower tracks increases over years of schooling; and that track placementcan have a long lasting impact on the life chances of students after high school. Taken togetherwith our knowledge about the impact of high stakes testing on the curriculum, these observationsraise substantial concerns about differential access to knowledge for students from underservedminority groups.
It is anticipated that performance assessment can overcome such influences by providingtargets toward which we want teachers to teach. Clearly, providing a broader range of valuededucational outcomes is essential to address concerns about narrowing the curriculum, as mostadvocates of performance assessment have argued, as is a carefi.d consideration of whatoutcomes remain unaddressed. However, past experience with high stakes uses of multiplechoice tests suggests the need for caution. Although high-stakes testing programs frequentlyresult in improved test scores, such improvement does not necessarily imply a rise in the qualityof education or a better educated student population (Darling-Hammond and Snyder, 1992;Haertel, 1989; National Commission on Testing and Public Policy, 1990; Shepard, 1992). Atbest, test scores can reflect only a small subset of valued education goals. When educators focustheir attention on improving test scores, they not only narrow the curriculum, they undermine thevalidity of the tests as indicators of a broader range of achievements (Shepard, 1992). Koretz,Linn, Dunbar, and Shepard (1 991, in Linn, 1993) showed evidence of test score inflationcomparing performance in two districts between the district mandated tests in reading and mathand tests constructed to cover the same content objectives. Students in the high-sta!!es testingdistricts scored considerably lower on the alternative tests in reading for both districts and inmathematics for one district. When particular tests become targets for instruction they becomeless valid indicators of the broader capabilities they were intended to tap. As Madaus (in press)notes, “there is no evidence to support the belief that performance-based measures will not be ascorruptible as any multiple choice measure when used in the context of measurement driveninstruction” (p. 41).
131
Further, evidence suggests that test driven reforms may undermine attempts at genuineeducational reform by diverting attention from fimdarnental educational problems. Ellwein,Glass, and Smith (1989) conducted extended case studies of five competency testing programs atthe state and district level. They concluded that competency tests and standards served more assymbolic and political gestures rather than as instrumental reforms-focusing attention on thetests themselves rather than on their impac~ utility, or value. Similarly, Corbett and Wilson(1992), who studied competency testing programs in two states, focusing on six districts perstate, found that the pressure to do well on tests did not encourage fhndarnental consideration ofthe structures, processes, or purposes of education, rather it caused “knee-jerk” reactionsdesigned to improve test scores quickly+ctions which many of the educators involvedconsidered counter-productive.
When performance is tied to rewards and sanctions, including public disclosure, the systemsometimes results in peculiar and counter-productive incentives to improve the appearance ofprogress, such as retaining students so that their scores will be compared with a younger cohort,placing students in special education programs so that their scores don’t count, targetinginstruction at those closest to the passing level and ignoring the needs of students unlikely topass the exam, or failing to discourage low-scoring students from dropping out. (e.g., Haertel,1989, Madaus, in press; Slavin and Madden, 1991). Such practices exacerbate inequities ineducational opportunity.
Some suggest reporting information in ways that will minimize the negative effects ofhigh-stakes standardized assessments. Haertel (1989) suggests preparing reports that attend tothe entire distribution of achievement (e.g., including the 25th, 50th, and 75th percentiles) so thatprogress is not just defined in terms of increases in measures of central tendency. He alsosuggests tracking the population of students+ounting dropouts and transfers-and, wherepossible, looking at the progress of individual students. Aggregate indices of individual growthare better indicators of program effectiveness than are differences in average scores which maysimply reflect differences in the population of students. Moreover, they are less likely toconfound program effectiveness with incoming capabilities of students. Lee (personalcommunication, April 14, 1994) notes that even in the absence of longitudinal achievement data,it is possible to control for academic background using proxy measures such as self reports ofstudents’ previous grades and whether or not students had repeated or skipped a grade level,And, as we noted before, interpreting educational outcomes in light of school resources andprocesses is important in controlling misinterpretations leading to counter-productive policies.(Darling-Hammond and Ascher, 1991; Darling-Hammond and Snyder, 1992; Haertel, 1989;Oakes, 1989; Porter, 1991, 1993).
However, some researchers argue that simply changing the format and reportingrequirements of assessments is insufficient; rather, what is needed is a change in the wayassessments are used to promote reform (Bryk and Hermanson, 1993; Darling-Hammond, 1994;Madaus, 1993, 1994, in press). Darling-Hammond (1 994) raises the concern that, “ifperformance assessments are used in the same fmhion as current externally developed andmandated tests are used, they are likely to highlight differences in students’ learning even morekeenly, but they will be unlikely to help teachers revamp their teaching or schools rethink theirways of operating” (p. 19). She contrasts two different approaches to assessment reform, whichreflect different theories of organizational change and different views of educational purposes.One view seeks to induce change through extrinsic rewards and sanctions for both schools and
132
students . . . . . The other view seeks to induce change by building knowledge among schoolpractitioners and parents about alternative methods and by stimulating organization rethinkingthrough opportunities to work together on the design of teachi,lg and schooling and toexperiment with new approaches. (Darling-Hammond, in press, p. 114).
,The recently passed Goals 2000 legislation suggests purposes for assessment that appear
intended to increase the control of externally imposed assessments on teaching and learning. Itsauthors indicate that among the appropriate purposes for state assessments are “measuring andmotivating individual students, schools, districts, state, and the nation to improve educationalperformance” (Sec. 213, (f) (1) (B) (iv)) and that rifler a period of five years, such assessmentsmay be used “to make decisions regarding graduation, grade promotion, or retention of students”(Sec. 213, (f) (1) (C) (II)). In contrast, Darling-Hammond describes proposals in states like NewYork, Vermont, Connecticut, and California, where assessments used for policy purposes aredistinct from those used for individual students.
“These states envision carefully targeted state assessments at a few key developmental pointsthat will provide data for informing policy makers about program successes and needs, areaswhere assistance and investment are needed, and assessment models for local schools.Meanwhile, locally implemented assessment systems—including portfolios, projects,performance tasks, and structured teachers observations of learning-will provide the multipleforms of evidence about student learning needed to make sound judgments about instruction.”(Darling Hammond, 1994, p. 20)
As research into the consequences of high stakes assessment suggests, choices made indesigning assessment systems not only impact the nature of teaching and learning (in bothintended and unintended ways) but also the nature of the discourse about the purposes andprocesses of education. Bryk andHermanson(1993) offer a useful distinction between twodifferent views of the ways in which indicators enter and influence the discourse and practice ofeducational reform: an “instrumental use” model and an “enlightenment” model. In “theinstrumental use” model, the goals are: to develop a comprehensive set of outcome measures; toexamine the relationship between these outcomes and indicators of school resources andprocesses; and, based upon that generalized knowledge, to control schools through allocation ofresources, rewards and sanctions, and regulation so as to maximize petiormance on theoutcomes. As they note, the instrumental use model characterizes much of the current rhetoricabout the potential of indicators to improve schools. In criticizing this conceptualization, theyargue first that there are many valued outcomes for which available measures do not exist. Asour past experience suggests, any model which attempts to maximize measurable outcomes islikely to result in a variety of unintended, possibly undesirable, effects, including theundermining of progress in areas not addressed. More fundamentally, the instrumental usemodel, with its reliance on generalizations about the relationship between processes andoutcomes, under-represents the complexity of schools. While “external policy-making andadministrative action shape schools’ structure and fi.mction” (p 453), the “behavior, attitudes,and beliefs of actors inside the school-professional staff, parents, and students-influence itsoperations” (p. 453). “Schools are places where personal meaning and human intentionalitymatter. ” (p. 457) An “enlightenment model” reflects a view of schools where interaction amongindividuals is fundamental and reform requires “changing the values and tacit understandingsthat ground these interactions”. From this perspective, the goal oi%n indicator system is not tomanipulate such interactions through external controls, but rather to “enrich and encourage
133

sustained conversation about education, its institutions, and its processes in order ultimately toimprove them” @ 467).
134
Notes‘The authors took responsibility for different aspects of the paper. Bond and Carr drafted the
section on “Fairness and Bias;” Carr provided a discussion of legal issues that informed bothsections of the paper; Moss drafted the introduction and the section on “Fairness and Equity;”and Bond coordinated the paper.
2This section draws heavily on Moss (in press).
135
References
Badger, E. (in press). The role of assumptions in a statewide testing program: Lessons fromMassachusetts. In M. T. Nettles (Ed.), Equity and excellence in educational testing andassessment (pp. 329-3 72). Boston: Kluwer Academic Publishers.
Baker, E. L., & O’Neil, Jr., H. F. (in press). Diversity, assessment, and equity in educationalreform. In M. T. Nettles (Ed.), Equity and excellence in educational testing and assessment(pp.77-94). Boston: Kluwer Academic Publishers.
Barr, R., & Dreeben, R. (1983). How schools work. Chicago: The University of Chicago Press.
Bond, L. (1989). The effects of special preparation on measures of scholastic ability. In R. L.Linn (Ed.), Educational Measurement (3rd cd.), 429-444. New York: American Council onEducation/MacMillan
Bond, L. (1993). Making innovative assessments fair and valid. Whar we can learnfiomperformance assessment for the professions, Proceedings of the 1993 ETS InvitationalConference, Princeton, NJ: Educational Testing Service.
Bryk, A. S., & Hermanson, K. L. (1993). Educational indicator systems: Observations on theirstructure, interpretation, and use. Review of Research in Education, 19,451-484.
Carnilli, G. & Shepard, L. (1987). Inadequacy of ANOVA for detecting test bias. Journal ofEducational Statistics, 12, 87-89.
Carnilli, G., & Shepard, L. A. (1994). Methods for identifying biased test items.
Cole, N. S., & Moss, P. A. (1989). Bias in test use. In R. L. Linn (Ed.), EducationalMeasurement (pp. 201-2 19). Washington, DC: The American Council on Education and theNational Council on Measurement in Education.
Congress of the United States, Office of Technology Assessment. (1992, February). Testing inAmerican schools: Asking the right questions (OTA-SET-5 19). Washington, DC: U.S.Government Printing Office.
Corbett, H. D., & Wilson, B. L. (1991). Testing, reform, and rebellion. Norwood, NJ: AblexPublishing Corporation.
Crooks, T.J.(1988). The impact of classroom evaluation practices on students. Review ofEducational Research, 8.5(4), 438-481.
Darling-Hammond, L. (1994). Performance-based assessment and educational equity. HarvardEducational Review, 64(l), 5-30.
Darling-Hammond, L. (in press). Equity issues in performance-based assessment. In M. T.Nettles (Ed.), Equity and excellence in educational testing and assessment (pp. 97-121).Boston: Kluwer Academic Publishers.
Darling-Hammond, L., &Ascher,C.(1991). Accountability in Urban Schools. New York:National Center for Restructuring Education, Schools, and Teaching, Teachers College,Columbia and ERIC Clearinghouse on Urban Education.
136
Darling-Hammond, L,, & Snyder, J. (1992). Reframing accountability: Creating learner-centeredschools. In A. Lieberrnan (Ed.), The changing contexts of teaching: Nine@--rst Yearbook ofthe National Society for the Study of Education (pp. 11-36). Chicago: University of ChicagoPress,
Darling-Hammond (in press)
Dorans, N., & Holland, P. W. (1993). DIF detection and description: Mantel-Haenszel andstandardization. In P. Holland &H. Wainer (Eds.) Dzflerential Item Functioning, (pp. 35-66).Hillsdale, NJ: Lawrence Erlbaum Associates.
Dorans, N. J., & Holland, P. W. (1988). DIF detection and description: Mantel-Heanszel andstandardization. In H. Wainer & H. Braun (Eds.), Test Validity (pp. 35-66). Hillsdale, NJ:Lawrence Erlbaum Associates.
Dorr-Bremme, D. W., & Herman,J.L.(1986). Assessing student achievement: A profile ofclassroom practices. University of California, Center for the study of Evaluation, LosAngeles, CA.
Elliott, E. (in press). National testing and assessment strategies: Equity implications of leadingproposals for national examinations. In M. T. Nettles (Ed.), Equity and excellence ineducational testing and assessment (pp. 415-424). Boston: Kluwer Academic Publishers.
Ellwein, M. C., Glass, G. V., & Smith, M. L. (1988). Standards of competence: Propositions onthe nature of testing reforms, Educational Researcher, 17(8),4-9,
Gamoran,A.(1987). The stratification of high school learning opportunities. Sociology ofEducation, 60, 135-155.
Garcia, G. E., & Peterson, P. D. ( 1994). Assessment and diversity. Review of Research inEducation, 20,337-391.
Gardner, H. (1983). Frames of mind. New York: Basic Books.
Gee, J. P. (1990). Social linguistics and literacies: Ideology in discourses. London: The FalmerPress.
Gordon, E. W. (1992). Implications of diversity in human characteristics for authenticassessment (CSE Technical Report 341). National Center for Research on Evaluation,Standards, and Student Testing (CRESST), University of California Graduate School ofEducation, Los Angeles, CA.
Haertel, E. (1989). Student achievement tests as tools of educational policy: Practices andconsequences. In B. R. Gifford (Ed.), Test policy and test performance: Education, language,and culture (pp. 25-50). Boston: Kluwer Academic Publishers.
Harnbleton, R. K., & Murphy, E. (1992). A psychometric perspective on authentic measurement,Applied Measurement in Education, 5(l), 1-16.
Herrnan, J. L., & Golan, S. (1993). The effects of standardized testing on teaching and schools.Educational Measurement: Issues and Practices, 12(4), 20-25,41-42.
137
Holland, P. W., & Thayer, D. T. (1986). Differential item performance and the Mantel-Heanszelprocedure. In H. Wainer & H. Braun (Eds.), Test Validi@. pp. 147-169, Hillsdale, NJ:Lawrence Erlbaum Associates.
Holland, P. W., & Thayer, D. T. (1988). Differential item performance and the Mantel Haenszelprocedure. In H. Wainer & H. Braun (Eds.), Tes/ Validity (pp. 129-145). Hillsdale, NJ:Lawrence Erlbaum Associates.
Johnston, P. H., Weiss, P., and Afflerbach, P. (1990) Teachers’ evaluation of the teaching andlearning in literacy and literature (Report Series 3.4). Albany, NY: Center for the Learningand Teaching of Literature, State University of New York at Albany.
Joint Committee on Testing Practices. (1988). Code offair testing practices in education.Washington, DC: Joint Committee on Testing Practices, American PsychologicalAssociation.
Koretz, D. M., Madaus, G. F., Haertel, E., & Beaton, A. E. (1992). National educationalstandards and testing: A response to the recommendations of the National Council onEducation Standards and Testing (Congressional testimony). Santa Monica, CA: RandInstitute on Education and Training,
LaCelle-Peterson, M. W., & Rivera, C. (1994). Is it real for all kids? A framework for equitableassessment policies for English language learners. Harvard Educational Review, 64(l),55-75.
Lee, V. E., & Bryk, A. S. (1988). Curriculum tracking as mediating the social distribution ofhigh school achievement. Sociology of Education, 6(2), 78-94.
Lee, V. E., & Bryk, A. S. (1989). A multilevel model of the social distribution of high schoolachievement. Sociology of Education, 62, 172-192.
Lee, V. E., & Croninger, R. G. (in press). The relative importance of home and school in thedevelopment of literacy skills for middle-grade students. American Journal of Education.
LeMahieu, P., Eresh, J. T., & Wallace, R. C. (1992). Using student portfolios for publicaccounting. Paper presented at the conference Diverszfjing student assessment.” From visionto practice. Center for Testing, Evaluation and Educational Policy, Boston College.
Linn, R. L. (1993). Educational assessment: Expanded expectations and challenges. EducationalEvaluation and Policy Analysis, 15(1), 1-16.
Lirm, R. L., Baker, E. L., & Dunbar, S. B. (1991). Complex, performance-based assessment:Expectations and validation criteria. Educational Researcher, 20(8), 15-21.
Madaus, G. F. (1993, October). Assessment issues around there-authorization of Chapter 1.Paper presented to the National Academy of Education, University of Michigan, School ofEducation, Ann Arbor, MI.
Madaus, G. F. (1994). A technological and historical consideration of equity issues associatedwith proposals to change the nation’s testing policy. Harvard Educational Review, 64(l),76-95.
Madaus, G. F. (in press). A technological and historical consideration of equity issues associatedwith proposal to change the nation’s testing policy. In M. T. Nettles (Ed.), Equity and
138
excellence in educational testing and assessment @p. 27-74). Boston: Kluwer AcademicPublishers.
Madaus, G. F., & Kelleghan, (1992). Curriculum evaluation and assessment. In P. W. Jackson(Ed.), Handbook of research on curriculum (pp. 119-154). New York: Macmillan PublishingCompany.
Mehrens, W. A., & Popharn, W. J. (1992). How to evaluate the legal defensibility of high-stakestests. Applied Measurement in Education, 5(3), 265-283.
O’Neill, K. A., & McPeek, W. M. (1993). Item and test characteristics that are associated withdifferential item fimctioning. In P. W. Holland&H. Wainer (Eds.) Dlflerential itemfunctioning. Hillsdale, NJ: Lawrence Erlbaum Associates.
Moss, P. A. (in press). Validity in high stakes writing assessment: Problems and possibilities,Writing Assessment.
National Commission on Testing and Public Policy. (1990). From gatekeeper to geteway:Transforming testing in America. Chestnut Hill, MA: Author.
Neil, D. M., & Medina, N. J. (1989). (1989, May). Standardized testing: Harmful to educationalhealth. Phi Delta Kappan, pp. 688-697.
Nettles, M. T. (Ed.). Equity and excellence in educational testing and assessment. Ann Arbor,MI: University of Michigan, School of Education.
O’Connor, M. C. (1989). Aspects of differential performance by minorities on standardized test:Linguistic and sociocultural factors. In B. R. Gifford (Ed.), Test policy and test performance:Education, language, and culture (pp. 129-1 81). Boston: Kluwer Academic Publishers.
Oakes, J. (1985). Keeping track: How schools structure inequality. New Haven, CT: YaleUniversity Press.
Oakes, J. (1989). What educational indicators? The case of assessing the school context.Educational Evaluation and Policy Analysis, 11(2), 181-199.
Oakes, J., Gamoran, A., & Page, R.N. (1992). Curriculum, differentiation: Opportunities,outcomes, and meaning. In P. W. Jackson (Ed.), Handbook of research on curriculum: Aproject of the American Educational Research Association op. 570-608). New York:Macmillan Publishing Company.
Office of Technology Assessment. (1992). Testing in American schools: Asking the rightquestions (OTA--SET-520). Washington, DC: Congress of the United States.
O’Neill, K. A. & McPeek, W. M. (1993). Item and test characteristics that are associated withdifferential item functioning. In P. Holland &H. Wainer (Eds.) Dl&erential ItemFunctioning, (255-276). Hillsdale, NJ: Lawrence Erlbaum Associates.
Porter, A. C. (1991). Creating a system of school process indicators. Educational Evaluation andPolicy Analysis, 13(1), 13-29,
Porter, A. C. (1993). School delivery standards. Educational Researcher, 22(5), 24-30.
Pullin, D. C. (1994). Learning to work: The impact of curriculum and assessment standards oneducational opportunity. Harvard Educational Review, 64(l), 31-54.
139
Ramsey, P. A. (1993). Sensivity review: The ETS experience as a case study. In P. W. Holland&H. Wainer (Eds.), D@erential Item Functioning @p. 367-388). Hillsdale, NJ: LawrenceErlbaum Associates.
Resnick, L. B., & Resnick, D. (1992). Assessing the thinking curriculum: New tools foreducational reform. In B. R. Gifford & M. C. O’Connor (Eds.), Changing assessments:Alternative views of aptitude, achievement and instruction (pp. 301-328), Boston: KluwerAcademic Publishers.
Shepard, L. A. (1992). What policy makers who mandate tests should know about the newpsychology of intellectual ability and learning. In B. R. Gifford & M. C. O’Connor (Eds.),Changing assessments: Alternative views of aptitude, achievement and instruction (pp.301 -328). Boston: Kluwer Academic Publishers.
Slavin, R. E., & Madden, N. A. (1991). Modi@ing Chapter 1 program improvement guidelinesto reward appropriate practices. Educational Evaluation and Policy Analysis, 13(4), 369-379.
Smith, M. L. (1991 ). Put to the test: The effects of external testing on teachers. EducationalResearcher, 20(5), 8-11.
Sternberg, R. J. (1985). Beyond IQ. New York: Cambridge University Press.
Wigdor, A., & Green, B. F., Jr. (1991). Performance assessment for the workplace. (Vol.1). Washington, DC: National Academy Press
Winfield, L. F., & Woodard, M. D. (1994). Assessment, equity, and diversity in reformingAmerica’s schools (CSE Technical Report 372). National Center for Research on Evaluation,Standards, and Student Testing (CRESST), University of California Graduate School ofEducation, Los Angeles.
“U.S. Government Printing cMce 1996- 409-949/50264
140