Embed Size (px)
Citation preview
TechnicalInformation
<Int> <Rev>
ExaplogEvent Analysis PackageAnalytical Examples
TI 36J06A20-01E
TI 36J06A20-01E©Copyright Sep. 1999 (YK)1st Edition Sep. 1999 (YK)
Yokogawa Electric Corporation2-9-32, Nakacho, Musashino-shi, Tokyo, 180-8750 JapanTel.: 81-422-52-8067 Fax.: 81-422-52-9802

Blank Page

<Toc> <Rev> <Introduction> i
TI 36J06A20-01E 1st Edition : Sep.01,1999-00
IntroductionThis document contains actual examples of how Exaplog is used for process analysis.
For an overview of the concepts and special features of Exaplog, refer to the separate“Exaplog Event Analysis Package Overview”, TI 36J06A10-01E.
For specifications, see NTPS100 Exaplog Event Analysis Package GS 36J06A10-01E.
Media No. TI 36J06A20-01E (MO) 1st Edition : Sep. 1999 (YK)All Rights Reserved Copyright © 1999, Yokogawa Electric Corporation

Blank Page
<Int> <Rev> Toc-1
TI 36J06A20-01E 1st Edition : Sep.01,1999-00
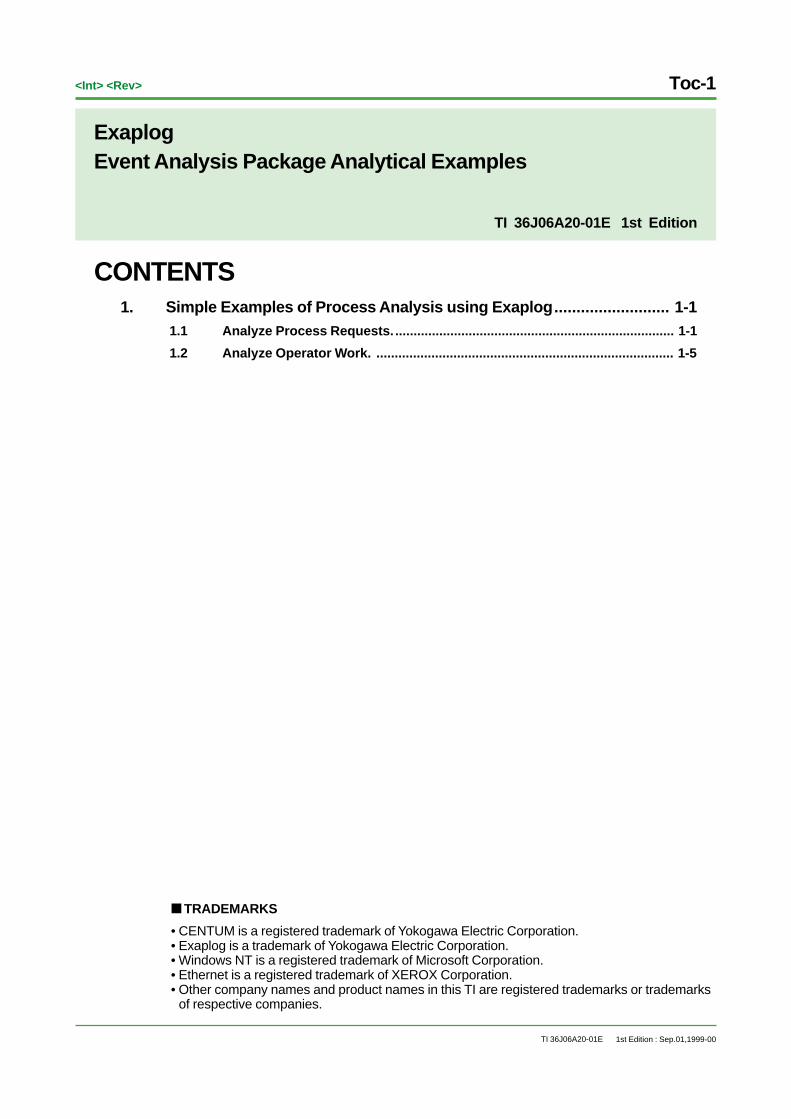
CONTENTS
■ TRADEMARKS
• CENTUM is a registered trademark of Yokogawa Electric Corporation.• Exaplog is a trademark of Yokogawa Electric Corporation.• Windows NT is a registered trademark of Microsoft Corporation.• Ethernet is a registered trademark of XEROX Corporation.• Other company names and product names in this TI are registered trademarks or trademarks
of respective companies.
ExaplogEvent Analysis Package Analytical Examples
1. Simple Examples of Process Analysis using Exaplog .......................... 1-11.1 Analyze Process Requests. ............................................................................ 1-1
1.2 Analyze Operator Work. ................................................................................. 1-5
TI 36J06A20-01E 1st Edition

Blank Page
<Toc> <1. Simple Examples of Process Analysis using Exaplog> 1-1
TI 36J06A20-01E 1st Edition : Sep.01,1999-00
1. Simple Examples of Process Analysisusing ExaplogThis TI contains simple examples of the procedures for analyzing actual event data from achemical plant.
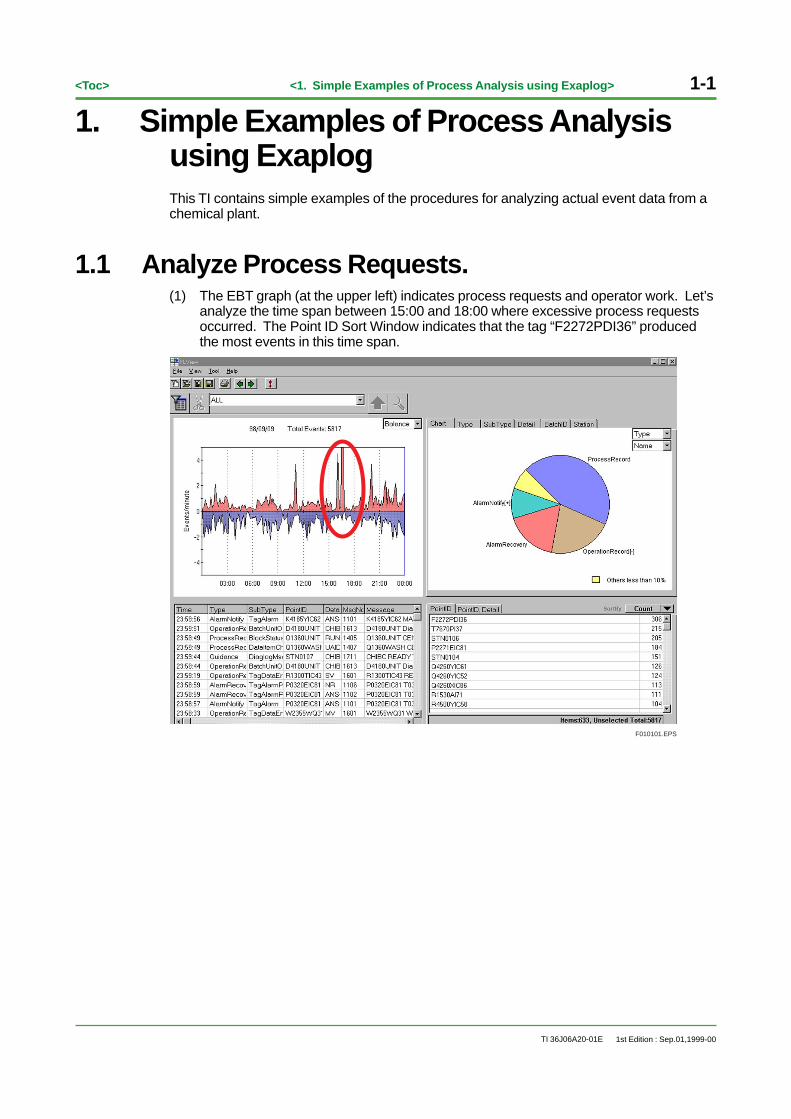
1.1 Analyze Process Requests.(1) The EBT graph (at the upper left) indicates process requests and operator work. Let’s
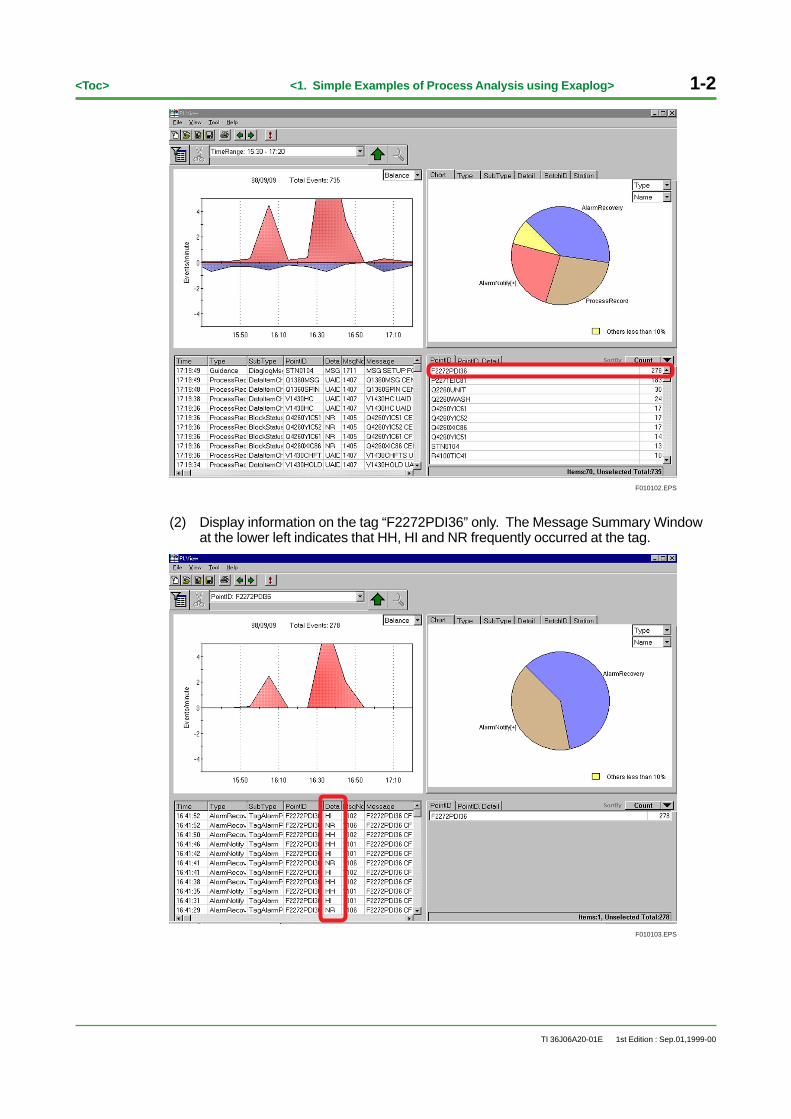
analyze the time span between 15:00 and 18:00 where excessive process requestsoccurred. The Point ID Sort Window indicates that the tag “F2272PDI36” producedthe most events in this time span.
F010101.EPS
1-2<Toc> <1. Simple Examples of Process Analysis using Exaplog>
TI 36J06A20-01E 1st Edition : Sep.01,1999-00
F010102.EPS
(2) Display information on the tag “F2272PDI36” only. The Message Summary Windowat the lower left indicates that HH, HI and NR frequently occurred at the tag.
F010103.EPS
<Toc> <1. Simple Examples of Process Analysis using Exaplog> 1-3
TI 36J06A20-01E 1st Edition : Sep.01,1999-00
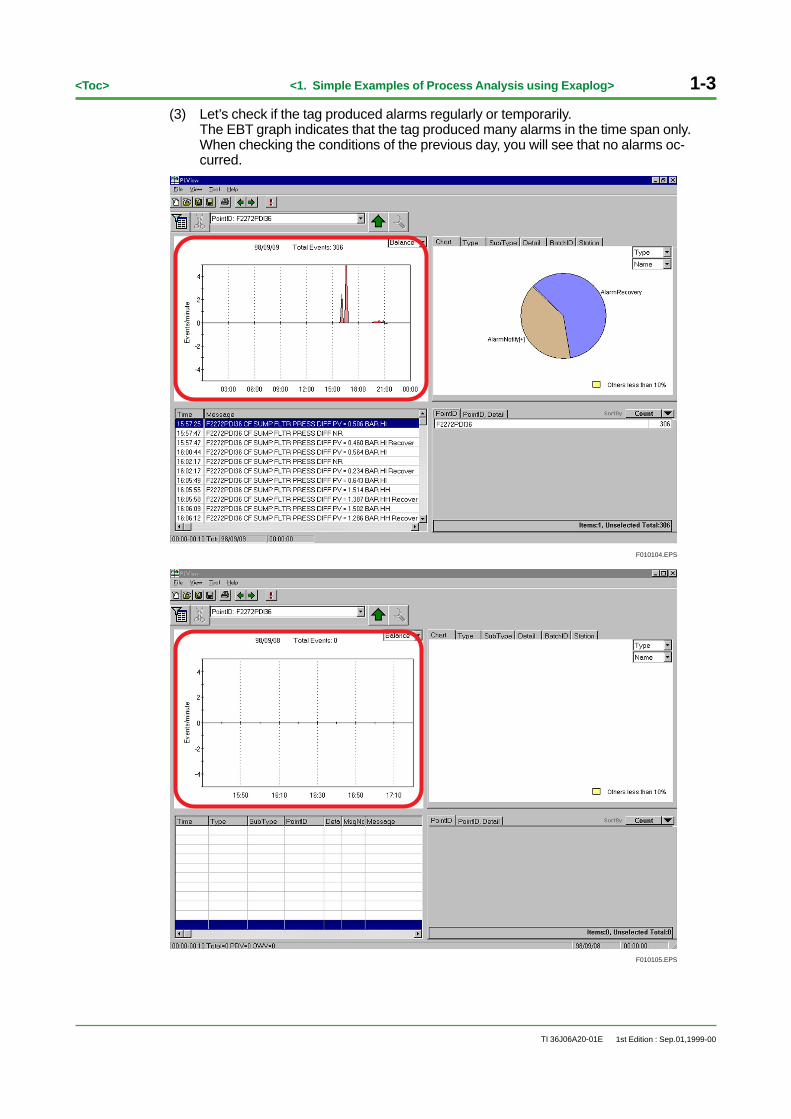
(3) Let’s check if the tag produced alarms regularly or temporarily.The EBT graph indicates that the tag produced many alarms in the time span only.When checking the conditions of the previous day, you will see that no alarms oc-curred.
F010104.EPS
F010105.EPS
1-4<Toc> <1. Simple Examples of Process Analysis using Exaplog>
TI 36J06A20-01E
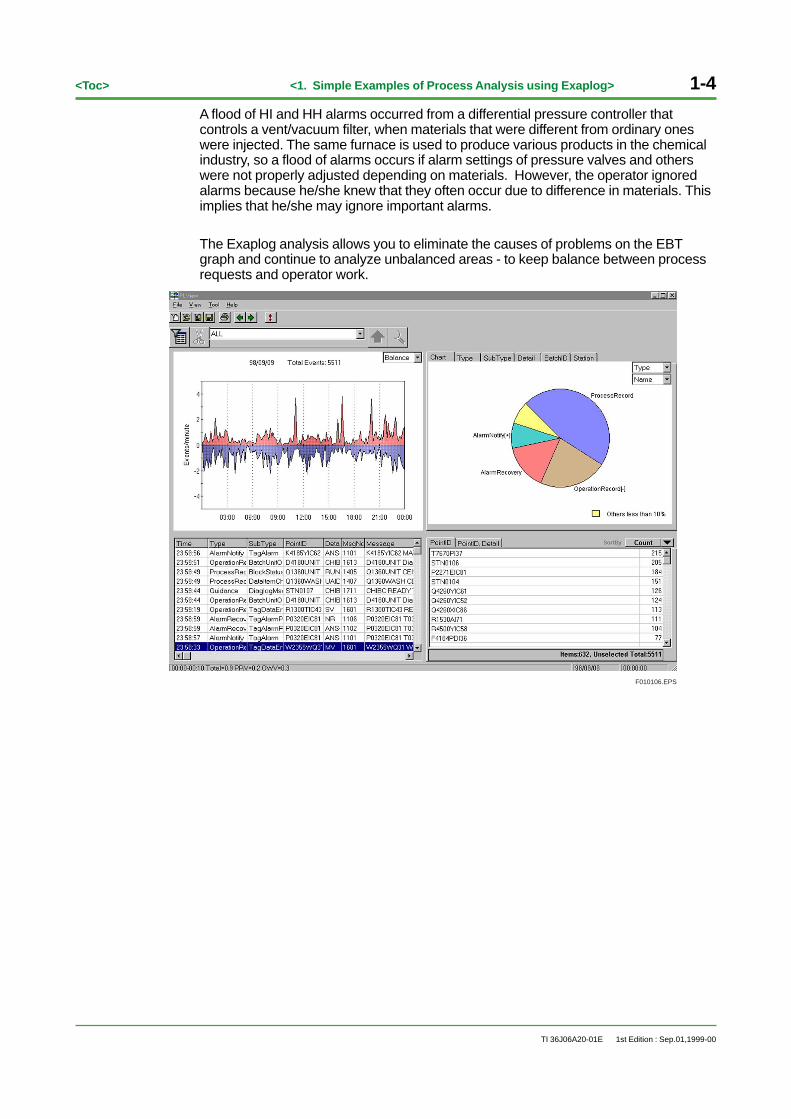
A flood of HI and HH alarms occurred from a differential pressure controller thatcontrols a vent/vacuum filter, when materials that were different from ordinary oneswere injected. The same furnace is used to produce various products in the chemicalindustry, so a flood of alarms occurs if alarm settings of pressure valves and otherswere not properly adjusted depending on materials. However, the operator ignoredalarms because he/she knew that they often occur due to difference in materials. Thisimplies that he/she may ignore important alarms.
The Exaplog analysis allows you to eliminate the causes of problems on the EBTgraph and continue to analyze unbalanced areas - to keep balance between processrequests and operator work.
F010106.EPS
1st Edition : Sep.01,1999-00
<Toc> <1. Simple Examples of Process Analysis using Exaplog> 1-5
TI 36J06A20-01E
1.2 Analyze Operator Work.(1) The EBT graph (at the upper left) indicates process requests and operator work. Let’s
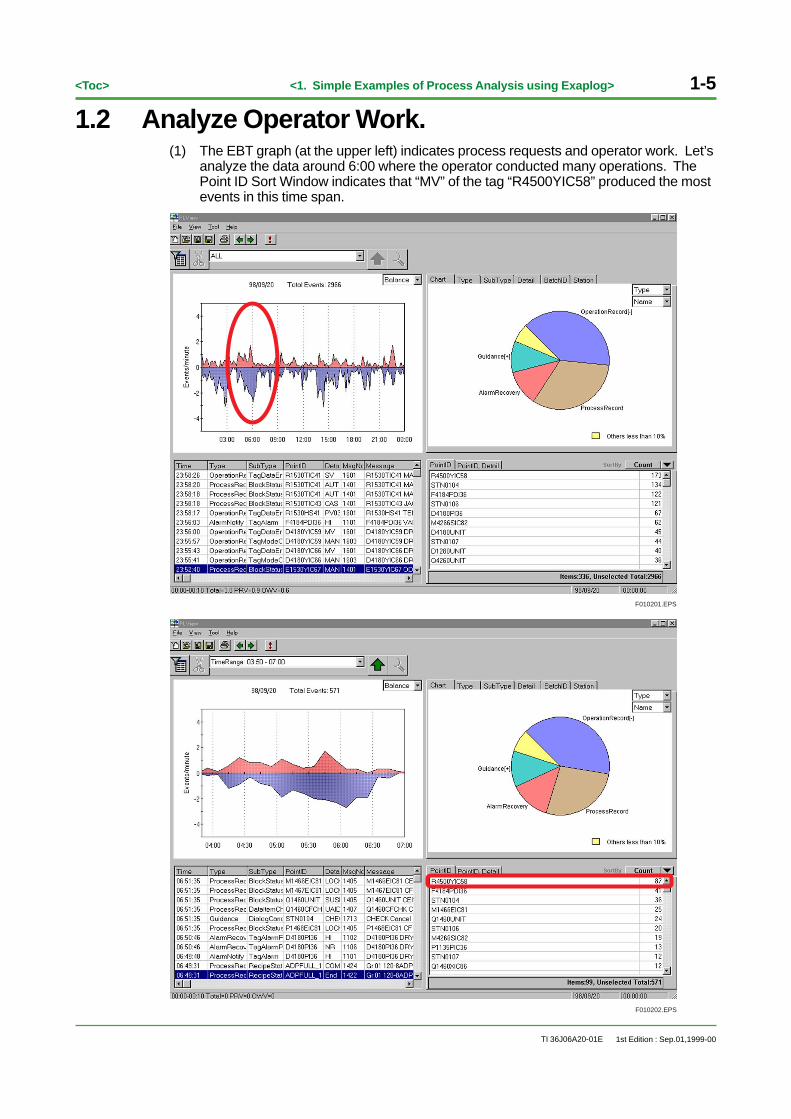
analyze the data around 6:00 where the operator conducted many operations. ThePoint ID Sort Window indicates that “MV” of the tag “R4500YIC58” produced the mostevents in this time span.
F010201.EPS
F010202.EPS
1st Edition : Sep.01,1999-00
1-6<Toc> <1. Simple Examples of Process Analysis using Exaplog>
TI 36J06A20-01E
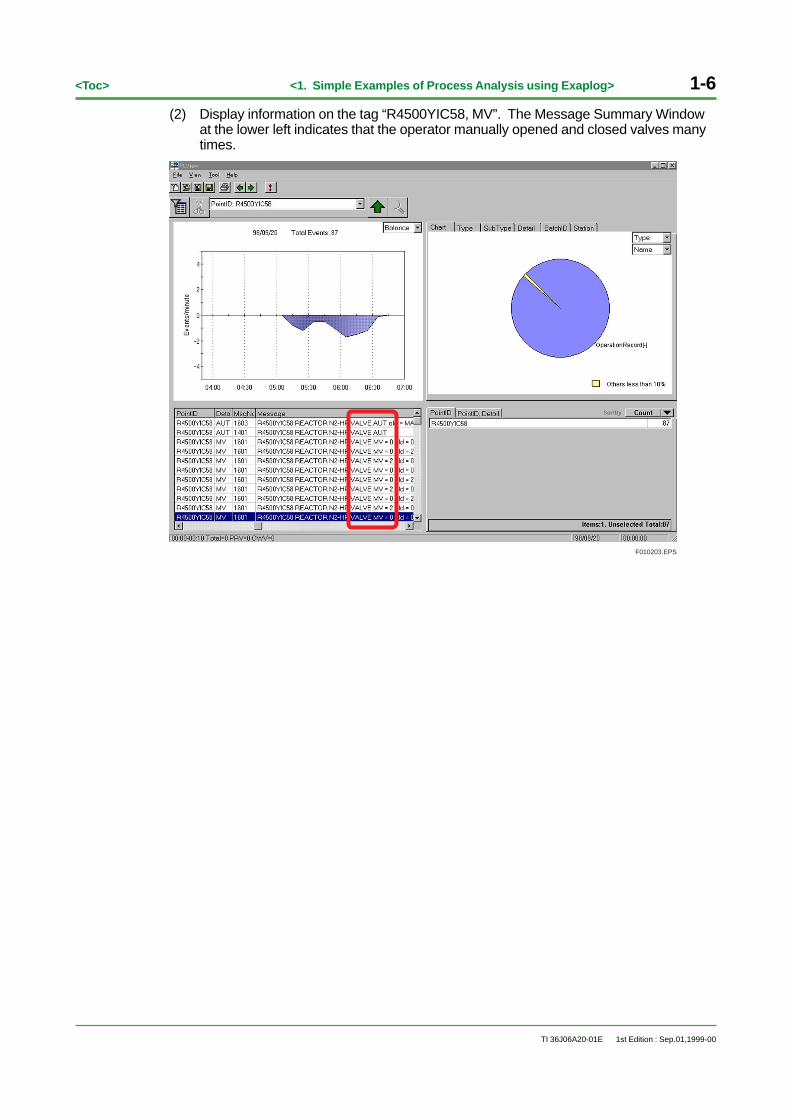
(2) Display information on the tag “R4500YIC58, MV”. The Message Summary Windowat the lower left indicates that the operator manually opened and closed valves manytimes.
F010203.EPS
1st Edition : Sep.01,1999-00
<Toc> <1. Simple Examples of Process Analysis using Exaplog> 1-7
TI 36J06A20-01E
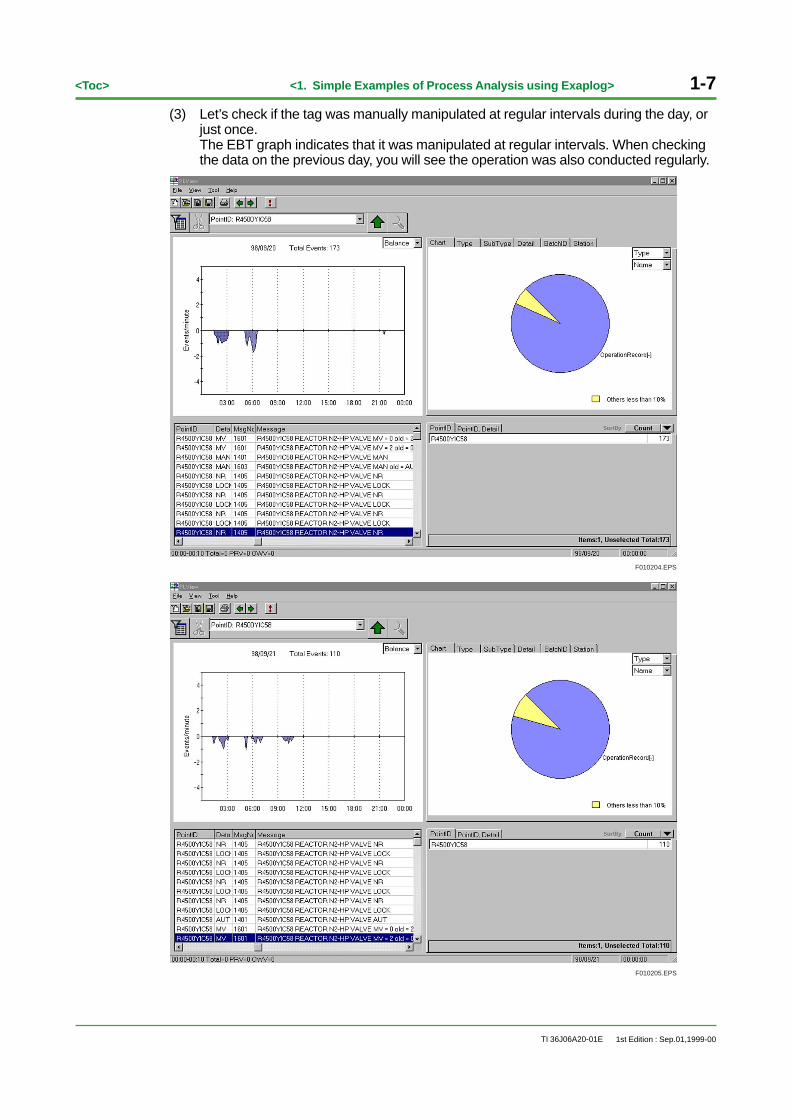
(3) Let’s check if the tag was manually manipulated at regular intervals during the day, orjust once.The EBT graph indicates that it was manipulated at regular intervals. When checkingthe data on the previous day, you will see the operation was also conducted regularly.
F010204.EPS
F010205.EPS
1st Edition : Sep.01,1999-00
1-8<Toc> <1. Simple Examples of Process Analysis using Exaplog>
TI 36J06A20-01E
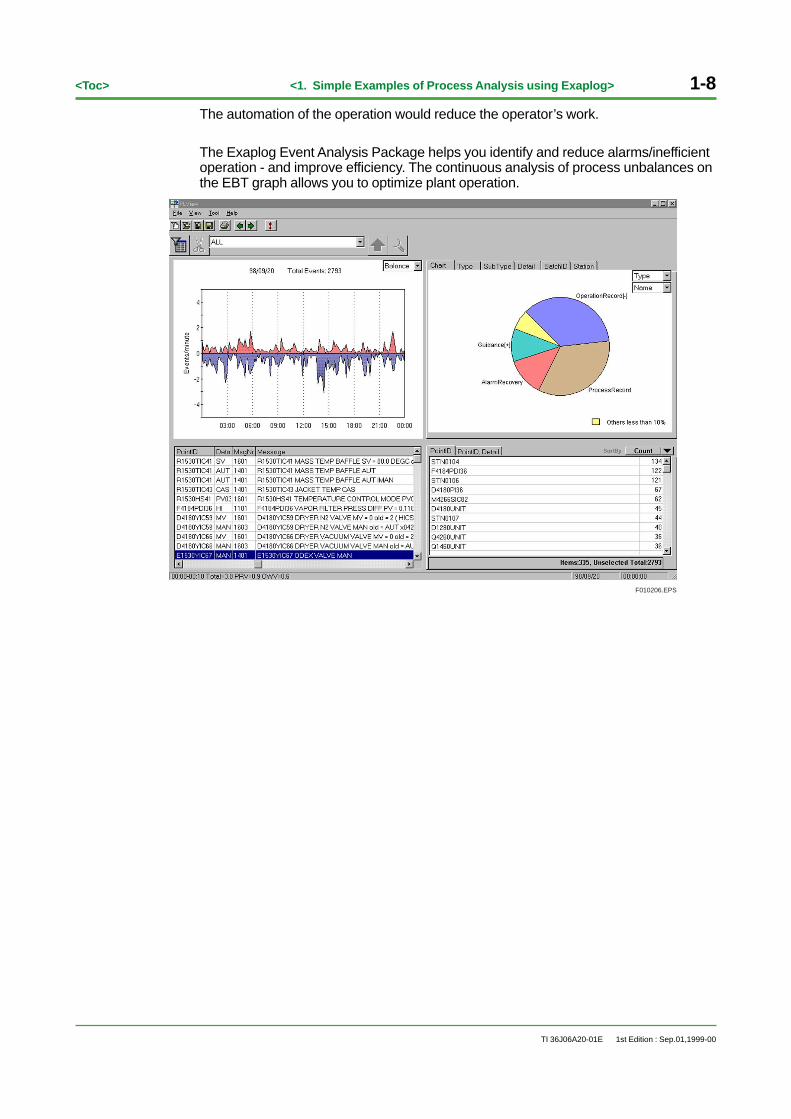
The automation of the operation would reduce the operator’s work.
The Exaplog Event Analysis Package helps you identify and reduce alarms/inefficientoperation - and improve efficiency. The continuous analysis of process unbalances onthe EBT graph allows you to optimize plant operation.
F010206.EPS
1st Edition : Sep.01,1999-00

<Int> <Toc> i
TI 36J06A20-01E 1st Edition : Sep.01,1999-00
Revision Information● Title : Exaplog Event Analysis Package Analytical Examples
● Manual No. : TI 36J06A20-01E
Sep. 1999/1st EditionNewly published
Written by Process Information System CenterIndustrial Automation Systems Business Div.Yokogawa Electric Corporation
Published by Yokogawa Electric Corporation2-9-32 Nakacho, Musashino-shi, Tokyo 180-8750, JAPAN
Printed by Yokogawa Graphic Arts Co., Ltd.
Subject to change without notice.


![Final Event Package 2020[2] - Jackson's Steakhouse](https://img.pdfslide.us/doc/110x75/61c280907d7e51202a4e403e/final-event-package-20202-jacksons-steakhouse.jpg)