Embed Size (px)
Citation preview
Project funded by the South Carolina State Department of Education through contract with the Office of Program Evaluation, College of Education,
University of South Carolina
TECHNICAL DOCUMENTATION FOR THE
SOUTH CAROLINA ARTS ASSESSMENT PROJECT (SCAAP)
YEAR 1:
4th-GRADE MUSIC AND VISUAL ARTS ASSESSMENTS
A report submitted to
Deborah Smith Hoffman, Ph.D. Education Associate for the Visual and Performing Arts
South Carolina State Department of Education
2003
Prepared by:
Ching Ching Yap, Research Assistant
Christina Schneider, Research Assistant
Robert L. Johnson, Associate Professor
Dawn Mazzie, Research Assistant
Sameano Porchea, Research Assistant
Office of Program Evaluation, College of Education
University of South Carolina
TABLE OF CONTENTS I INTRODUCTION .................................................................................................. 1
Visual and Performing Arts Standards ................................................................... 1 SCAAP Objectives...................................................................................... 1 Resources .................................................................................................... 2
II DEVELOPMENT................................................................................................... 4
Framework .............................................................................................................. 4 Arts Advisory Committee/Curriculum Review Committee ....................... 4 Item Writing................................................................................................ 4 Stimulus Material Development ................................................................. 6 Item Review and Revision .......................................................................... 6 Web-Based Item Submission...................................................................... 6
Music Assessment................................................................................................... 6 Test Specifications: Content and Achievement Standards ......................... 6 Item Types and Scoring System ............................................................... 10 Field Test Format...................................................................................... 10
Visual Arts Assessment ........................................................................................ 11 Test Specifications: Content and Achievement Standards ....................... 11 Item Types and Scoring System ............................................................... 13 Field Test Format...................................................................................... 14
III FIELD-TESTING ................................................................................................. 15
Sample................................................................................................................... 15 Training Test Administrators................................................................................ 15 Testing Procedure ................................................................................................. 15
IV SCORING............................................................................................................. 17
Multiple-Choice Items .......................................................................................... 17 Performance Tasks Items...................................................................................... 17
Benchmarking Performance Tasks ........................................................... 17 Rating Performance Tasks ........................................................................ 20
V RESULTS ............................................................................................................. 21
Multiple-Choice Test Forms ................................................................................. 21 Reliability.................................................................................................. 21 Descriptive Statistics................................................................................. 22 Technical Characteristics of Items............................................................ 22
Performance Tasks................................................................................................ 29 Descriptive Statistics................................................................................. 29 Reliability of Performance Tasks.............................................................. 30 Correlations............................................................................................... 34
i
VI TEACHER/TEST ADMINISTRATOR FEEDBACK ......................................... 37 Music..................................................................................................................... 37 Visual Arts ............................................................................................................ 38 General comments ................................................................................................ 38
VII DISCUSSIONS AND RECOMMENDATIONS ................................................ 39
Revision of Items and Forms ................................................................................ 39 Test Administration .............................................................................................. 39 Web-Based Administration................................................................................... 39
VIII APPENDICES ...................................................................................................... 40 APPENDIX A: Item Analysis Results for Music Form 1 ................................................ 40 APPENDIX B: Item Analysis Results for Music Form 2................................................. 41 APPENDIX C: Item Analysis Results for Music Form 3................................................. 42 APPENDIX D: Item Analysis Results for Visual Arts Form 1 ........................................ 43 APPENDIX E: Item Analysis Results for Visual Arts Form 2 ........................................ 44 APPENDIX F: Item Analysis Results for Visual Arts Form 3......................................... 45 APPENDIX G: Item P-Values for Music Test Forms by Gender .................................... 46 APPENDIX H: Item P-Values for Music Test Forms by Ethnicity ................................. 47 APPENDIX I: Item P-Values for Visual Arts Test Forms by Gender.............................. 48 APPENDIX J: Item P-Values for Visual Arts Forms by Ethnicity .................................. 49 APPENDIX K: Teacher Feedback Form.......................................................................... 50
Visual Arts Multiple-Choice Section.................................................................... 50 Music Performance Assessment Section .............................................................. 51 South Carolina Visual Arts and Music Assessment ............................................. 51
IX REFERENCES .................................................................................................... 52
ii
LIST OF TABLES AND FIGURES Table 2.1: Table of Specification for Music Content Standards......................................... 7 Table 2.2: Music Assessment Test Specification ............................................................... 7 Table 2.3: Number of Items in Each Part of the Music Test Forms ................................. 10 Table 2.4: Table of Specification for Visual Arts Content Standards .............................. 11 Table 2.5: Visual Arts Assessment Test Specification ..................................................... 12 Table 4.1: Rubric for Music Performance Task 1............................................................. 18 Table 4.2: Rubric for Music Performance Task 2............................................................. 18 Table 4.3: Rubric for Visual Arts Performance Task 1 .................................................... 19 Table 4.4: Rubric for Visual Arts Performance Task 2a .................................................. 19 Table 4.5: Rubric for Visual Arts Performance Task 2b .................................................. 20 Table 5.1: Classical Reliability Indices for Multiple-Choice Items Based on Raw Scores
for the SCAAP 2002 Field Test ...................................................................... 21 Table 5.2: Descriptive Statistics for Music and Visual Arts Test Forms.......................... 22 Table 5.3: Ranges of P-values and Discrimination Indices of Test Forms....................... 23 Table 5.4: Number of Items with Low and Negative Discrimination Indices.................. 24 Table 5.5: Summary of DIF Classification for Multiple-Choice Test Forms................... 26 Table 5.6: Descriptive Statistics of Test Scores by Gender.............................................. 27 Table 5.7: Descriptive Statistics of Test Scores by Ethnicity........................................... 28 Table 5.8: Ranges of P-values of Test Forms by Gender and Ethnic Groups .................. 29 Table 5.9: Descriptive Statistics for Music and Visual Arts Performance Tasks............. 30 Table 5.10: Inter-Rater Reliability of Music Performance Tasks..................................... 31 Table 5.11: Inter-Rater Reliability of Visual Arts Performance Tasks ............................ 32 Table 5.12: Reliability of Music Performance Tasks without Music Multiple-Choice Test
Items................................................................................................................ 33 Table 5.13: Reliability of Visual Arts Performance Tasks without Visual Arts Multiple-
Choice Test Items ........................................................................................... 34 Table 5.14: Correlation between Music Performance Tasks and Music Total Scores ..... 35 Table 5.15: Correlation between Visual Arts Performance Tasks and Visual Arts Total
Score ............................................................................................................... 35
iii
I INTRODUCTION
Visual and Performing Arts Standards
In 1999, the South Carolina Department of Education (SDE) adopted the South Carolina Visual and Performing Arts Curriculum Standards. The adoption of these standards represented a major step in the evolution of statewide standards-based arts education that began in 1993 with the adoption of the South Carolina Framework for the Visual and Performing Arts. In the fall of 2001, a panel of public school and higher education arts teachers began revision of the South Carolina Visual and Performing Arts Standards. The document contains curriculum standards for students by grade bands. Its purpose is to provide guidelines for teachers so that they may align their curriculum and instruction to state standards and to set high expectations for students in South Carolina in the arts. In addition, the revision process also worked to align the South Carolina Visual and Performing Arts Standards with the national standards in the arts. In 2001, the SDE, in collaboration with the Educational Oversight Committee and professional organizations in the four arts areas (i.e., dance, music, theatre, and the visual arts), addressed the South Carolina Educational Accountability Act by including the arts as one indicator of overall school performance on school report cards. The current arts indicator addresses areas of arts opportunities rather than arts achievement. Arts educators, policymakers, and assessment consultants involved in the selection of the arts indicator agreed that using arts opportunity as an indicator of progress in the arts is a temporary solution that should be replaced by a student achievement indicator when such an indicator becomes available. They indicated that the present lack of an arts assessment in South Carolina devalues the importance of arts standards, encourages wide variability in instructional objectives that are incorporated in arts classrooms throughout the state, and does not allow teachers to assess their students’ level of achievement in relation to the arts components and curriculum standards. As a result, the SDE began funding the South Carolina Arts Assessment Project (SCAAP) in 2000 to develop a standards-based assessment for the visual and performing arts. SCAAP Objectives The long-term objective of the SCAAP is to develop four separate arts assessments (i.e., dance, music, theatre, and visual arts) that will be available for statewide use at several grade levels, K-12. The SCAAP assessment may also be used as a national and state model of arts assessment construction to measure and improve programs in subject areas that are traditionally not tested by state exams, but are areas that are important contributors to a holistic education that places emphasis on higher-order thinking skills. The objective of the first year of the SCAAP was to develop and field-test fourth-grade music and visual arts assessment items. Music and visual arts assessments were selected as the immediate focus of development because a majority of South Carolina elementary schools offer music and visual arts programs for fourth-grade students, whereas a
1
minority of elementary schools offer dance and theatre programs. In addition, the technology components required to assess student achievements in dance and theatre will create a need for additional fiscal resources. Resources The SCAAP is a collaborative effort among (a) the SDE (b) the Office of Program Evaluation (OPE) in the College of Education at the University of South Carolina (USC), and (c) experienced arts educators. In the collaboration, the SDE funds the project and provides the vision; the OPE provides faculty members and students in education measurement, assessment, and computer programming to facilitate the test development; and arts educators provide their expertise in each arts area to develop the assessment. Specifically, in the first year, the SCAAP was (a) supervised by Dr. Deborah Hoffman, Education Associate for the Visual and Performing Arts at the SDE, (b) led and facilitated by Dr. Robert Johnson, Associate Professor of applied measurement at USC, (c) coordinated and managed by Ms. Christina Schneider, Research Assistant with the assistance of other staff members at the OPE, and (d) advised and supported by the Arts Curriculum Advisory Board of experienced arts educators in music and the visual arts. Most of the arts educators who participated in the first year of SCAAP were also participants of the Curriculum Leadership Institute of the Arts (CLIA) and the Arts Assessment Institute (AAI). In addition to arts educators in public schools, faculty members from several universities and colleges in South Carolina were also actively involved in the SCAAP item and test development process. For the visual arts assessment, the Columbia Museum of Art kindly allowed the following five pieces of artwork from their collection to be included in the assessment.
1. Allesandro di Mariano Filipepi (called Botticelli) Italian (Florentine), 1444-1510 The Nativity, 1475-1480 Fresco transferred to canvas Collection of the Columbia Museum of Art, Gift of the Samuel H. Kress Foundation CMA 1954.29
2. Maurer, Alfred Henry
American, 1968-1932 Head, c. 1929 Oil on composition board Collection of the Columbia Museum of Art, Gift of Hudson D. Walker CMA 1957.11
2
3. Nahl, Charles Christian American, 1818-1878 Buffalo Hunt, 1865 Oil on canvas Collection of the Columbia Museum of Art, Gift of Mrs. Sigmund W. Stoudenmere in memory of Mrs. Benjamin B. Kirkland CMA 1960.10
4. Nattier, Jean-Marc French, 1683-1766 Percy Wyndham O’Brien, 1744 Oil on canvas Collection of the Columbia Museum of Art, Museum Purchase through a gift of the Charles Ulrick and Josephine Bay Foundation, Inc. CMA 1960.23
5. Anna Heyward Taylor
American, 1979-1956 Macrophylla (Wild Magnolia), 1938 Four color woodcut Collection of the Columbia Museum of Art, Gift of Mrs. Howard Taylor Manning CMA 1967.26
The members of the Arts in Basic Curriculum (ABC) Project also provided assistance in enlisting elementary schools from the ABC Project participating schools to field test the music and visual arts assessments. The ABC Project schools were selected because of their strong commitment to arts education.
3
II DEVELOPMENT
Framework In the development of the arts assessments, advisory committees were formed to determine the test specifications for each arts area. The test specifications provide a framework for the development of the test to guide item writers about the types of questions that are appropriate for the assessment. The OPE personnel coordinated the formation of advisory committees and facilitated the framework development process. Moreover, the OPE personnel also facilitated an item writing training session for the arts educators, established an item writing submission system, and convened item review sessions with the Arts Curriculum Review Committee members. Arts Advisory Committee/Curriculum Review Committee The SCAAP advisory committee was composed of statewide leaders in music and visual arts education. Most of the members were elementary music and visual arts educators who were involved in the revision of the South Carolina Visual and Performing Arts Curriculum Standards and who had completed the one-week summer workshop in arts assessment (i.e., Arts Assessment Institute [AAI] conducted by Dr. Robert Johnson at the University of South Carolina). Also, on the committee were Dr. Deborah Hoffman, the SDE Education Associate for the Visual and Performing Arts, and assessment specialists. The committee members met and determined the percentage of items that were necessary on each test form. They also selected content standards and achievement standards appropriate for large-scale assessment and the most suitable type of assessment for each standard. Members from the Arts Advisory Committee, and participants in the AAI, were selected to be the Arts Curriculum Review members. The review committee members were responsible for reviewing and finalizing submitted items. Following is the list of core members of the Arts Advisory Committee for music and visual arts.
1. Connie Boleman (Visual Arts) 2. Pamela Gowan (Music) 3. Scot Hockman (Visual Arts) 4. Mark Hodges(Music) 5. Velita Jones (Music) 6. Laura McFadden (Visual Arts)
Item Writing Arts educators were hired to develop multiple-choice items. Those arts educators selected were teachers who had participated in the AAI. Establishment of this cadre of art teachers also served as continued professional development in the context of practical assessment construction. In November of 2001, a training session was held for item writers. Music and visual arts educators in South Carolina who served as item writers for the SCAAP attended. At the session, test specifications for each arts area were addressed. Because the Advisory Committee members determined that all questions should be on the 3rd-grade reading level, item writers were given a list of 3rd-grade
4
reading level words that were previously used in the Basic Skills Assessment Program (BSAP)1. In addition, item format and item writing guidelines were addressed. Following are the item writing guidelines given to the educators during the training session.
1. The item relates directly to a specific standard. 2. When beyond the knowledge level, the item requires students to use higher-order
thinking skills such as • comprehending an important concept or information, • applying a concept/skill to a different situation, • forming an interpretation/drawing a conclusion, • comparing/contrasting concepts or information, and • analyzing and/or evaluating a claim or generalization.
3. The stem is a complete, direct question or incomplete statement; the wording is simple and clear.
4. Information in the stem does not cue the answer. 5. Negative stems are avoided. 6. There is only one clear correct answer. 7. The position of the answer is varied, while short to long option and “abc” order
are applied when appropriate. 8. Each alternative is plausible to student who lacks the targeted knowledge. 9. Overlapping alternatives are avoided; each alternative is independent and
mutually exclusive. 10. Alternatives are parallel in concept, language structure, grammar, and appearance. 11. Alternatives are equal or nearly equal length. 12. Alternatives avoid repeated words that are better suited in the stem. 13. Language usage and grammar in the stem and options are correct. 14. Superfluous wording in the stem and options is avoided. 15. The use of “all of the above” and “none of the above” as options is avoided.
In submission of an item, writers designated its level in Bloom’s Taxonomy, the content standard it addressed, and the achievement standard it addressed. Item writers were instructed that each item should have four options and that items could include visual or audio stimulus material. Items were submitted via the secure Web site (see paragraph on Web-Based Item Submission) or hand delivered. The OPE personnel converted printed copies into electronic files. A three day item-writing session was organized by the OPE and the SDE in March, 2002. During that session, members of the arts advisory committee developed multiple-choice items and finalized the number and types of performance tasks for both music and visual arts.
1 BSAP is the former state-mandated large-scale assessment program for the state of South Carolina.
5
Stimulus Material Development Stimulus material or prompts are visual or audio stimuli, such as artwork, reprints, music notation or music pieces that are used in arts assessment items. Four music pieces were created by a local composer and recorded so that students could answer items related to music they heard. Five visual arts prompts were provided by the Columbia Museum of Art. Additional visual arts prompts were created by item writers. Item Review and Revision After a sufficient number of items were submitted, the Arts Curriculum Review Committee convened a meeting to review and edit items. Items were also reviewed for bias and developmental appropriateness. Web-Based Item Submission OPE initially developed a secure Website for item submission. The site is located at <http://edpsych.ed.sc.edu/scaap>. In June of 2002, the OPE and the SDE contracted with E-Business Solution (formerly i2Media) to refine the Website. The initial secure Website allowed item writers to enter and review items they submitted using individual usernames and passwords. The updated Website allows item writers to load electronic versions of visual and audio prompts and store them in a prompt library for use by other item writers. In addition, it allows assessment specialists at the OPE to
1. review and edit items as they are submitted, 2. view and change item writer status, 3. approve uploaded stimulus material, and 4. arrange and finalized submitted items for inclusion in the final test form.
Additional features were also added to allow the future development of a Web-based assessment. The OPE computer specialists are currently improving and updating the Website to allow optimal use.
Music Assessment The music assessment was developed to assess music achievement based on the 2002 Revised South Carolina Visual and Performing Arts Curriculum Standards. Because not all music achievement standards are appropriate for large-scale assessment, the SDE associate and the Arts Advisory Committee for music convened a meeting to decide the music standards to be assessed, types of items to be used, and final music assessment format. The Arts Advisory Committee determined that the standard “playing instruments alone and with others” should not be included in the 4th-grade assessment due to concerns of equitable access to instruments used in general music programs across the state. The standards included will be updated when the final version of the standards are available. Test Specifications: Content and Achievement Standards The music advisory committee developed a table of specifications that presented the percentage of items for each content standard to be assessed. Following is the table of specifications for music (Table 2.1).
6
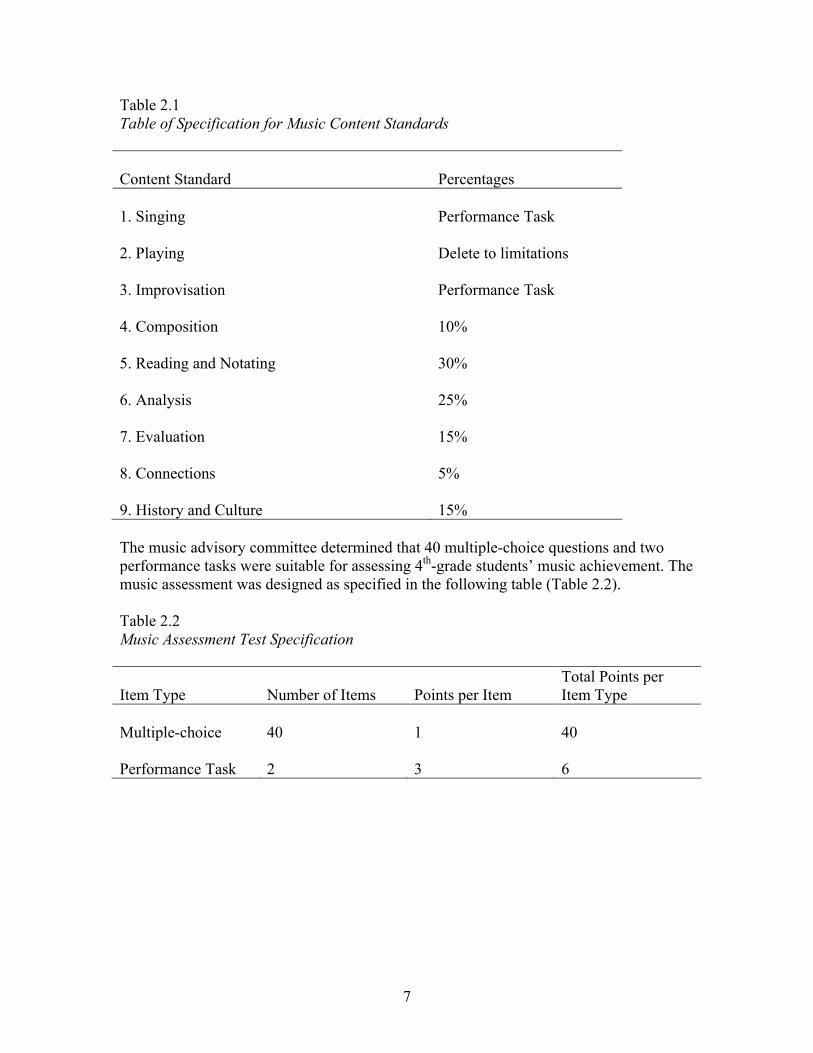
Table 2.1 Table of Specification for Music Content Standards Content Standard
Percentages
1. Singing Performance Task 2. Playing Delete to limitations 3. Improvisation Performance Task 4. Composition 10% 5. Reading and Notating 30% 6. Analysis 25% 7. Evaluation 15% 8. Connections 5% 9. History and Culture 15% The music advisory committee determined that 40 multiple-choice questions and two performance tasks were suitable for assessing 4th-grade students’ music achievement. The music assessment was designed as specified in the following table (Table 2.2). Table 2.2 Music Assessment Test Specification
Item Type Number of Items Points per Item Total Points per Item Type
Multiple-choice 40 1 40 Performance Task 2 3 6
7
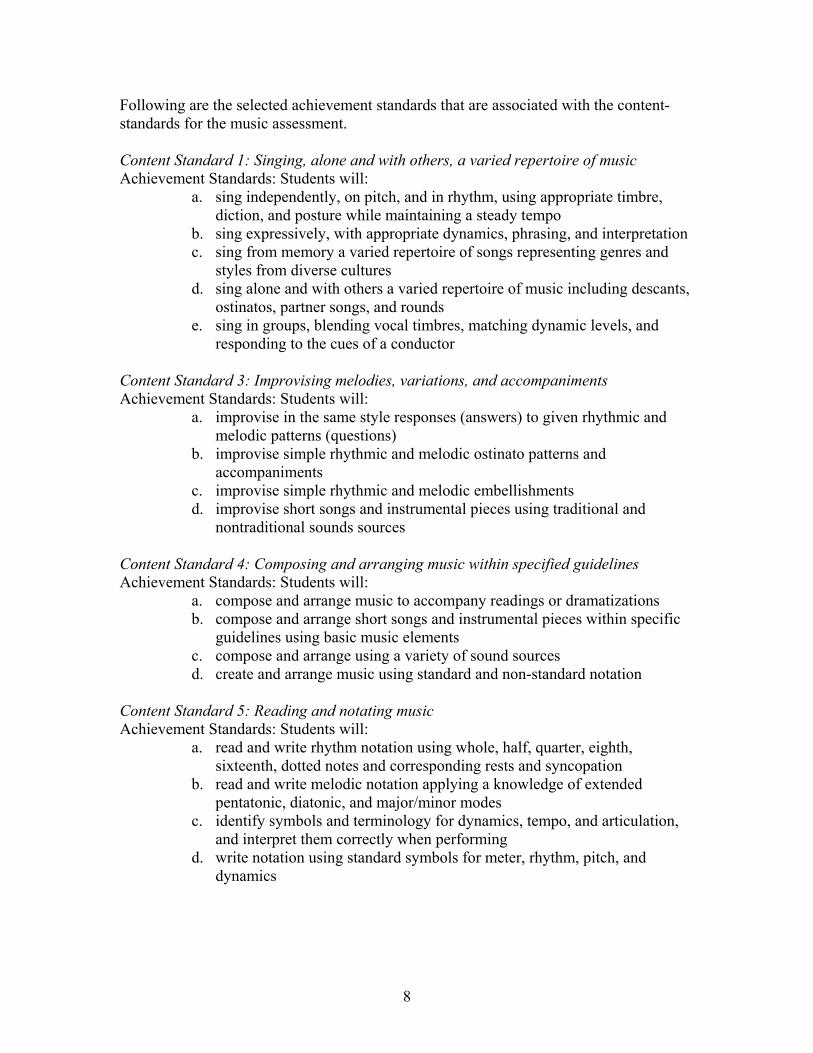
Following are the selected achievement standards that are associated with the content-standards for the music assessment. Content Standard 1: Singing, alone and with others, a varied repertoire of music Achievement Standards: Students will:
a. sing independently, on pitch, and in rhythm, using appropriate timbre, diction, and posture while maintaining a steady tempo
b. sing expressively, with appropriate dynamics, phrasing, and interpretation c. sing from memory a varied repertoire of songs representing genres and
styles from diverse cultures d. sing alone and with others a varied repertoire of music including descants,
ostinatos, partner songs, and rounds e. sing in groups, blending vocal timbres, matching dynamic levels, and
responding to the cues of a conductor Content Standard 3: Improvising melodies, variations, and accompaniments Achievement Standards: Students will:
a. improvise in the same style responses (answers) to given rhythmic and melodic patterns (questions)
b. improvise simple rhythmic and melodic ostinato patterns and accompaniments
c. improvise simple rhythmic and melodic embellishments d. improvise short songs and instrumental pieces using traditional and
nontraditional sounds sources Content Standard 4: Composing and arranging music within specified guidelines Achievement Standards: Students will:
a. compose and arrange music to accompany readings or dramatizations b. compose and arrange short songs and instrumental pieces within specific
guidelines using basic music elements c. compose and arrange using a variety of sound sources d. create and arrange music using standard and non-standard notation
Content Standard 5: Reading and notating music Achievement Standards: Students will:
a. read and write rhythm notation using whole, half, quarter, eighth, sixteenth, dotted notes and corresponding rests and syncopation
b. read and write melodic notation applying a knowledge of extended pentatonic, diatonic, and major/minor modes
c. identify symbols and terminology for dynamics, tempo, and articulation, and interpret them correctly when performing
d. write notation using standard symbols for meter, rhythm, pitch, and dynamics
8
Content Standard 6: Listening to, analyzing, and describing music Achievement Standards: Students will:
a. identify examples of music forms including motive to phrase, 4-bar phrase, canon, rondo, AABA, 12-bar blues, and theme and variation
b. demonstrate perceptual skills by moving, by answering questions about, and by describing aural examples of music of various styles representing diverse cultures
c. use appropriate terminology in explaining music, music notation, music instrument and voices, and music performances
d. identify by sight and sound a variety of instruments, including orchestra, band, multicultural, and digital
e. demonstrate movement and emotional response to prominent music characteristics while listening
Content Standard 7: Evaluating music and music performances Achievement Standards: Students will:
a. devise criteria for evaluating performances and compositions based on musical concepts, ideas, and values
b. explain, using appropriate music terminology, personal preferences for specific musical works and styles
c. explain music using appropriate terminology for pitch, notation, meter, chords, voices, instruments, and performances
Content Standard 8: Understanding relationships between music, the other arts, and disciplines outside the arts Achievement Standards: Students will:
a. explain the role of music in life experiences, celebrations, community functions, and special events
b. identify ways in which the principles and subject matter of other disciplines taught in the school are interrelated with those of music
Content Standard 9: Understanding music in relation to history and culture Achievement Standards: Students will:
a. listen to and identify by genre or style aural examples of music from various historical periods and world cultures
b. describe how elements of music are used in music examples from various cultures of the world
c. identify various uses of music in their daily life experiences and describe characteristics that make certain music suitable for each use
d. identify and describe roles of musicians in various music settings and world cultures
e. demonstrate audience behavior appropriate for the context and style of music performed
9
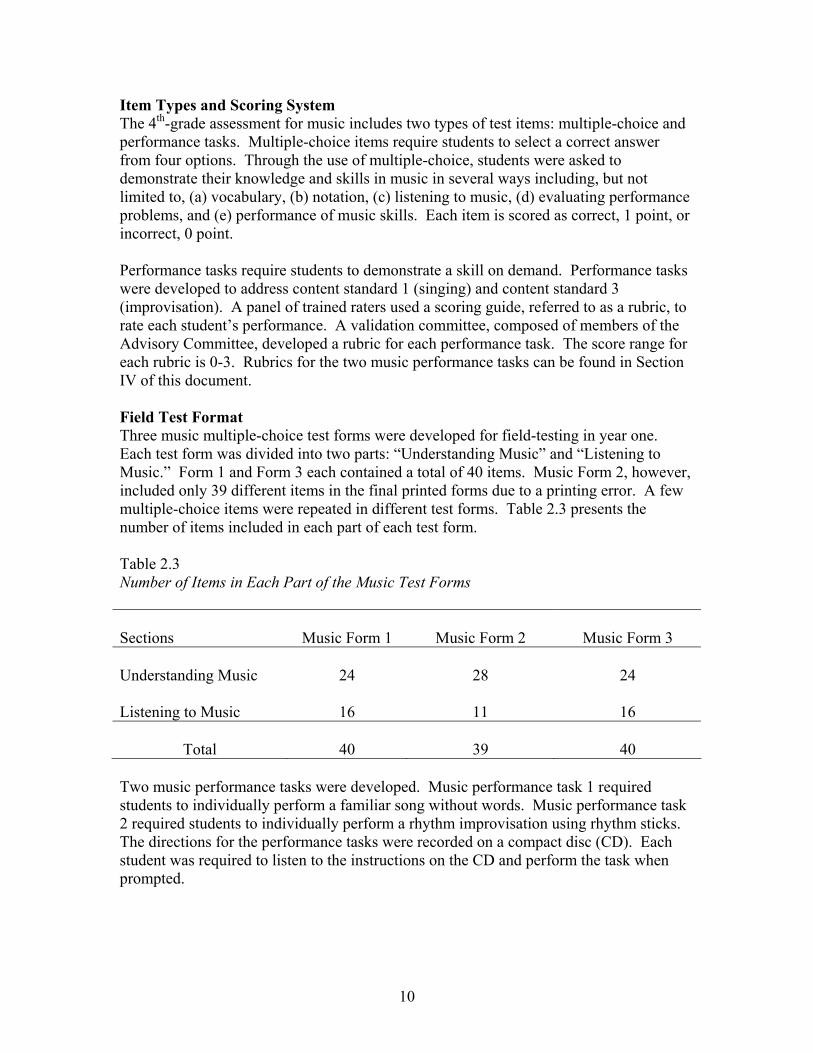
Item Types and Scoring System The 4th-grade assessment for music includes two types of test items: multiple-choice and performance tasks. Multiple-choice items require students to select a correct answer from four options. Through the use of multiple-choice, students were asked to demonstrate their knowledge and skills in music in several ways including, but not limited to, (a) vocabulary, (b) notation, (c) listening to music, (d) evaluating performance problems, and (e) performance of music skills. Each item is scored as correct, 1 point, or incorrect, 0 point. Performance tasks require students to demonstrate a skill on demand. Performance tasks were developed to address content standard 1 (singing) and content standard 3 (improvisation). A panel of trained raters used a scoring guide, referred to as a rubric, to rate each student’s performance. A validation committee, composed of members of the Advisory Committee, developed a rubric for each performance task. The score range for each rubric is 0-3. Rubrics for the two music performance tasks can be found in Section IV of this document. Field Test Format Three music multiple-choice test forms were developed for field-testing in year one. Each test form was divided into two parts: “Understanding Music” and “Listening to Music.” Form 1 and Form 3 each contained a total of 40 items. Music Form 2, however, included only 39 different items in the final printed forms due to a printing error. A few multiple-choice items were repeated in different test forms. Table 2.3 presents the number of items included in each part of each test form. Table 2.3 Number of Items in Each Part of the Music Test Forms Sections
Music Form 1 Music Form 2 Music Form 3
Understanding Music 24 28 24 Listening to Music 16 11 16
Total 40 39 40 Two music performance tasks were developed. Music performance task 1 required students to individually perform a familiar song without words. Music performance task 2 required students to individually perform a rhythm improvisation using rhythm sticks. The directions for the performance tasks were recorded on a compact disc (CD). Each student was required to listen to the instructions on the CD and perform the task when prompted.
10
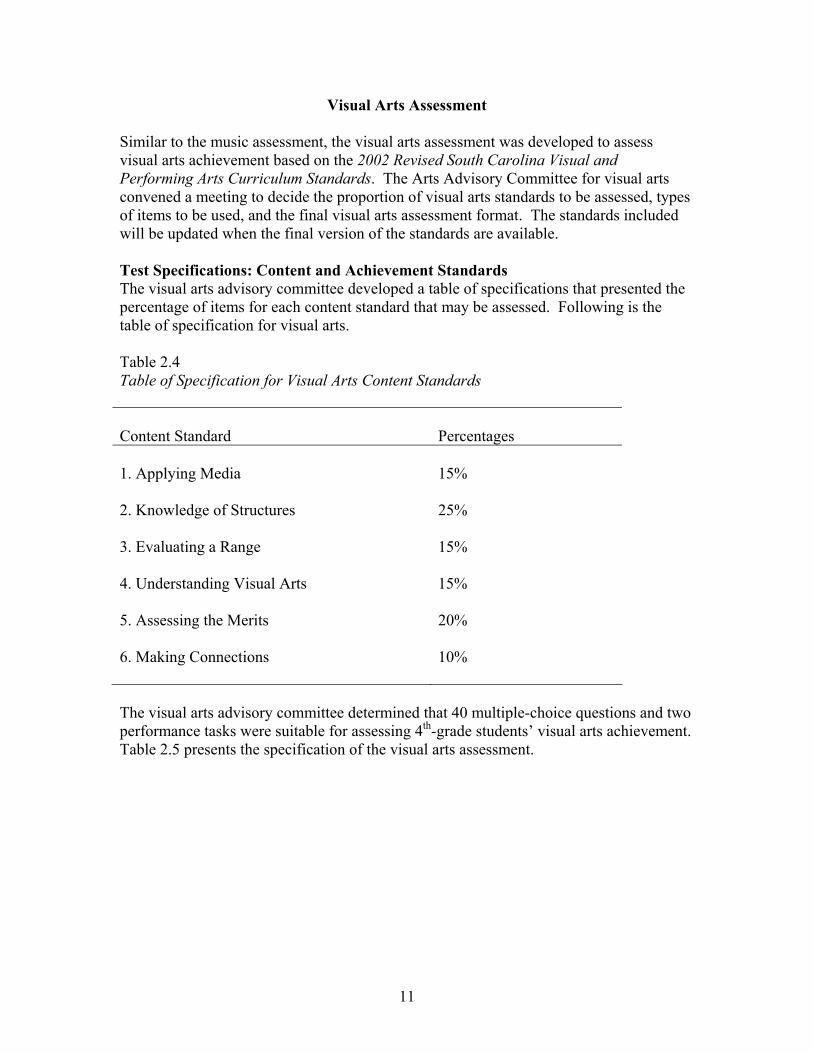
Visual Arts Assessment Similar to the music assessment, the visual arts assessment was developed to assess visual arts achievement based on the 2002 Revised South Carolina Visual and Performing Arts Curriculum Standards. The Arts Advisory Committee for visual arts convened a meeting to decide the proportion of visual arts standards to be assessed, types of items to be used, and the final visual arts assessment format. The standards included will be updated when the final version of the standards are available. Test Specifications: Content and Achievement Standards The visual arts advisory committee developed a table of specifications that presented the percentage of items for each content standard that may be assessed. Following is the table of specification for visual arts. Table 2.4 Table of Specification for Visual Arts Content Standards Content Standard
Percentages
1. Applying Media 15% 2. Knowledge of Structures 25% 3. Evaluating a Range 15% 4. Understanding Visual Arts 15% 5. Assessing the Merits 20% 6. Making Connections
10%
The visual arts advisory committee determined that 40 multiple-choice questions and two performance tasks were suitable for assessing 4th-grade students’ visual arts achievement. Table 2.5 presents the specification of the visual arts assessment.
11
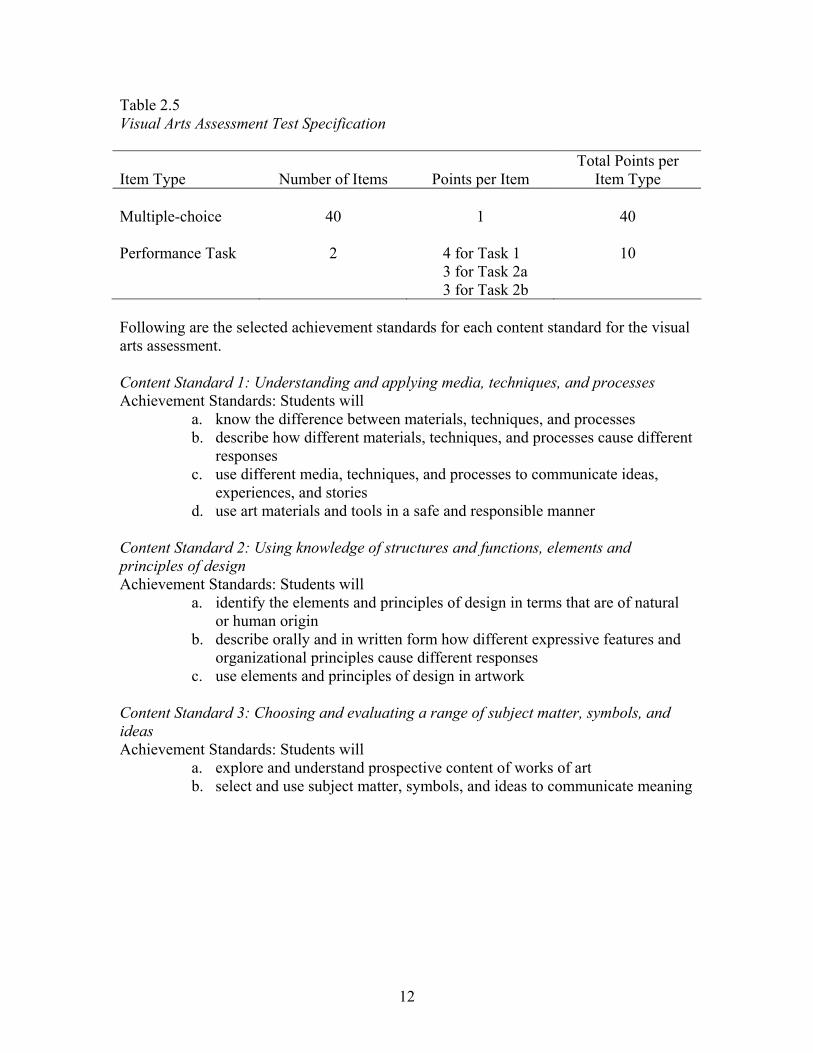
Table 2.5 Visual Arts Assessment Test Specification
Item Type
Number of Items
Points per Item Total Points per
Item Type Multiple-choice
40
1
40
Performance Task
2
4 for Task 1 3 for Task 2a 3 for Task 2b
10
Following are the selected achievement standards for each content standard for the visual arts assessment. Content Standard 1: Understanding and applying media, techniques, and processes Achievement Standards: Students will
a. know the difference between materials, techniques, and processes b. describe how different materials, techniques, and processes cause different
responses c. use different media, techniques, and processes to communicate ideas,
experiences, and stories d. use art materials and tools in a safe and responsible manner
Content Standard 2: Using knowledge of structures and functions, elements and principles of design Achievement Standards: Students will
a. identify the elements and principles of design in terms that are of natural or human origin
b. describe orally and in written form how different expressive features and organizational principles cause different responses
c. use elements and principles of design in artwork Content Standard 3: Choosing and evaluating a range of subject matter, symbols, and ideas Achievement Standards: Students will
a. explore and understand prospective content of works of art b. select and use subject matter, symbols, and ideas to communicate meaning
12
Content Standard 4: Understanding the visual arts in relation to history and cultures Achievement Standards: Students will
a. know that the visual arts have both a history and specific relationships to various cultures
b. identify specific works of art and styles as belonging to particular cultures, times, and places
c. demonstrate how history, culture, and the visual arts can influence each other in making and studying works of art
d. identify a variety of art objects, artists, and resources specific to South Carolina
Content Standard 5: Reflecting upon and assessing the characteristics and merits of their work and the work of others Achievement Standards: Students will
a. understand there are various purposes for creating works of visual art b. describe how people's experiences influence the development of specific
artworks c. understand there are different responses to specific artworks
Content Standard 6: Making connections between visual arts and other disciplines Achievement Standards: Students will
a. understand and use similarities and differences between characteristics of the visual arts and other arts disciplines
b. identify connections between the visual arts and other disciplines in the curriculum
c. distinguish between utilitarian and non-utilitarian art d. recognize the role of artists in the community
Item Types and Scoring System The 4th-grade assessment for visual arts includes two types of test items: multiple-choice and performance tasks. Multiple-choice items require students to select a correct answer from four options. Through the use of multiple-choice, students were asked to demonstrate their knowledge and skills in the visual arts in several ways including, but not limited to, (a) vocabulary, (b) types of art media, and (c) evaluating artworks. Each item is scored as correct for 1 point or as incorrect for 0 point. Performance tasks require students to perform a skill on demand. Two performance tasks were developed to address several visual arts content standards. Task 1 requires students to use the art terms in a word bank to compare two paintings. Task 2 of the visual arts assessment has two separate sections that require each student to draw a figure (task 2a) and to evaluate his or her own drawing using art terms by answering three guiding questions (task 2b). A panel of trained raters used rubrics to score each student’s performance. A validation committee, composed of members of the Advisory Committee, developed a rubric for each visual arts performance task. A 5-point rubric was developed for visual arts
13
performance task 1 and two 4-point rubrics were developed for the 2 sections of the second visual arts performance task. Rubrics for the visual arts performance task can be found in section IV of this document. Field Test Format Three visual arts multiple-choice test forms were developed for field-testing in year one. Each visual arts multiple-choice test form included 40 items and two performance tasks.
14
III FIELD-TESTING
Sample The advisory committee determined that schools with a strong commitment to the arts would be invited to participate in the field-testing of the music and visual arts assessments. Several elementary schools involved in the Arts in Basic Curriculum (ABC) Project were selected to participate. Eleven elementary schools from around the state accepted the invitation. Another arts project in the OPE, the Arts Education Research Project, funded by the Arts Commission and the SDE, later requested to include three additional schools in the arts assessment field-testing. A total of 14 ABC Project schools with 1,853 4th-grade students participated in the field tests.
Training Test Administrators In late April, at least one representative from each participating elementary school attended the Test Administration Training Session to learn how to administer both the music and visual arts assessments. In that session, each representative was trained in the procedures for filling out the scantron forms for students. Instructions for completion of scantrons addressed the need to “bubble in” students’ identification codes, the school code, and the test form code prior to test administration. Test administrators also were informed about the administration of the performance assessments for visual arts and music. All representatives were given a test administration handbook for each 4th-grade teacher in his/her school and the representative was responsible for training any additional test administrators in their school. The representatives also received packages of testing materials for their school. The school administrators were allowed to determine the SCAAP administration dates in their school. Each representative was also informed of the date to return the testing materials. All information regarding testing procedures can also be found in the test administration handbook.
Testing Procedure Each 4th-grade class was randomly assigned one of the three forms in music and one of three forms in visual arts. The assignment of test forms to each class was recorded. Schools were allowed to determine whether the multiple-choice test forms were administered in regular classrooms or arts classrooms. Sixty minutes were allocated for completing the music multiple-choice test form and the visual arts multiple-choice test form. Students in the participating schools took both the music and the visual arts assessments. For the “Understanding Music” section, students were able to answer questions at their own pace. The second section, “Listening to Music,” required the students to listen to stimulus material and to answer questions based on that material. The stimulus material was recorded onto a CD along with the
15
corresponding item and options. Each recording was performed for students two twice at 15 second intervals. Each item and option was also read twice. All students who took the visual arts multiple-choice tests also completed the visual arts performance tasks. Schools were allowed to determine whether the visual arts performance tasks were administered in regular or art classrooms. A maximum of 90 minutes was allowed to complete the visual arts performance tasks. Each test administrator was requested to assist students in writing their names, identification codes, and school codes on the cover page of the performance tasks form. Students were only required to use pencil for the drawings. No colored drawing materials were required for the visual arts performance tasks. Not all students who took music multiple-choice tests completed the music performance tasks due to limited funding and time for administration. The OPE personnel randomly selected two classes in each school to participate in the music performance tasks. The instructions for each performance task were recorded on a CD and could also be found in the test administrator’s handbook. Each school was lent a cassette recorder, a microphone, and 2 pre coded empty cassette tapes for each participating class for test administration. The test administrator was instructed to give each performance task to individual students using the provided recording materials. It was estimated that each student would require 10 minutes to complete both music performance tasks. Some teachers, however, reported that it required longer than 10 minutes to complete each student’s music performance task. During the testing session for each student, the test administrator used a CD player to play the pre-recorded instructions. The test administrator then recorded on the cassette recorder (a) each student’s identification code, (b) the part of the instructions that included the prompts for the students to perform each task, and (c) each student’s performance of each task. The music performance task 1 and task 2 were consecutively administered to each student and recorded on different cassette-tapes, (i.e., one tape included performance task 1 from all students and the other tape included performance task 2 from all students.)
16
IV SCORING
Multiple-Choice Items Students recorded their answers to the multiple-choice items on scantrons. OPE personnel reviewed scantrons to determine if information was complete and to clean extraneous marks. Scantrons then were submitted to the University Computer Service for scanning. Electronic copies of the results were provided to the OPE personnel. The electronic results were doubled checked by hand to confirm the accuracy of scanning. Final copies of the result data set were then used for further statistical analysis.
Performance Tasks Items The scoring of the performance tasks was an involved process. For music performance tasks, the OPE personnel first converted the audiocassette tape recordings of each class to electronic files. Electronic files of student performances were necessary to enable random assignment of those files to CDs so that the raters would not hear an entire class at the same time. Edits were made to some students’ performances when their names were included in the recording. Not all student performances were included in the final rating sessions. In some cases, the recording occurred at a slow speed, which made them unusable. In addition, some of the performances were not turned in by the rating session date; therefore the OPE was not able to include those students’ music performances. The OPE personnel prepared six CDs with random assignment of students’ performances. Similarly, the OPE personnel sorted and prepared student’s works for the visual arts performance tasks for the rating sessions. Benchmarking Performance Tasks The rating of performance tasks required that a benchmarking session with a validation committee occur prior to actual scoring. Three music specialists and three visual arts specialists formed the validation committees in music and visual arts. Benchmarking of performances requires the validation committee members to select anchor responses for music and visual arts based on the performance levels described in the rubrics. During the process, the validation committee first refined and finalized the rubrics for each performance task. The finalized rubrics used for each performance task are presented in Tables 4.1 to 4.5. Each committee was required to find 9-12 anchor responses for each performance task, 16-20 training responses, and 12-15 seed responses for each performance task. Anchor responses are student responses that provide concrete examples of performances as described by each rating category in each rubric. The anchor responses were used to train raters to evaluate student work in a manner consistent with the rubric. Training responses are used to allow raters to practice scoring a set of student performances. Seed responses are not used in the training of the raters. Instead, these student performances are mixed in (i.e., seeded) with other unscored student performances and used to examine the consistency of each rater with the expectations of the validation committee.
17
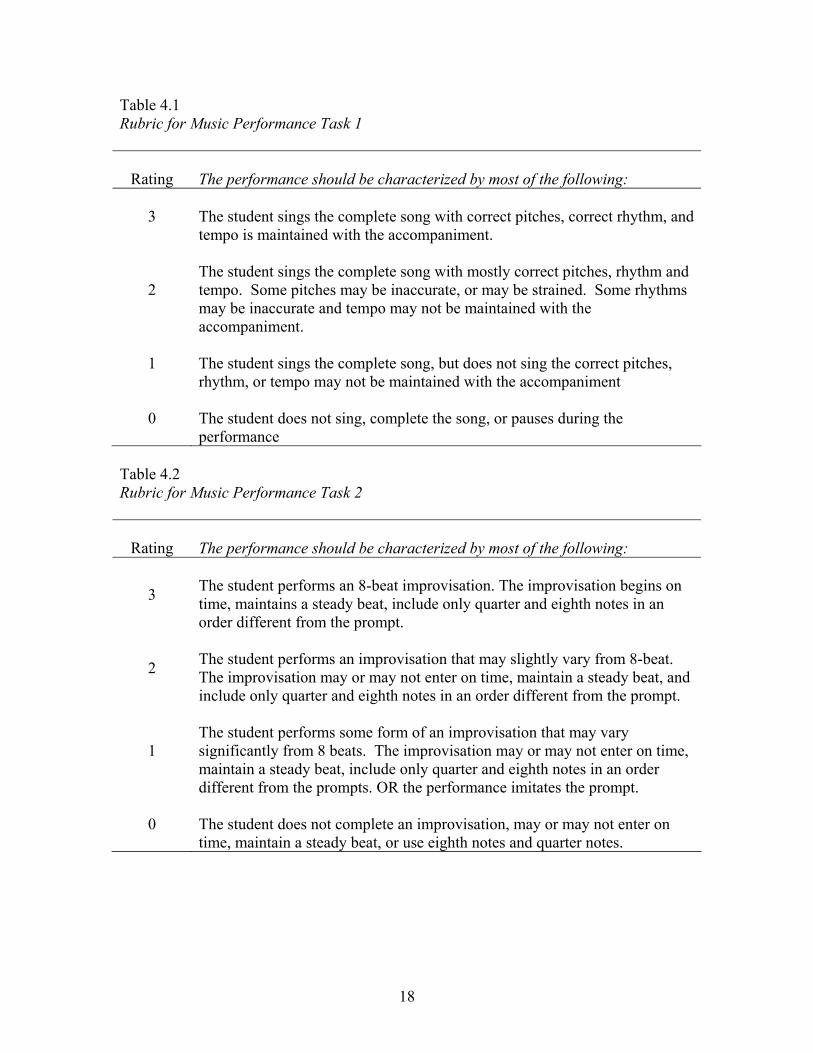
Table 4.1 Rubric for Music Performance Task 1
Rating
The performance should be characterized by most of the following:
3 The student sings the complete song with correct pitches, correct rhythm, and tempo is maintained with the accompaniment.
2
The student sings the complete song with mostly correct pitches, rhythm and tempo. Some pitches may be inaccurate, or may be strained. Some rhythms may be inaccurate and tempo may not be maintained with the accompaniment.
1 The student sings the complete song, but does not sing the correct pitches, rhythm, or tempo may not be maintained with the accompaniment
0 The student does not sing, complete the song, or pauses during the performance
Table 4.2 Rubric for Music Performance Task 2
Rating
The performance should be characterized by most of the following:
3
The student performs an 8-beat improvisation. The improvisation begins on time, maintains a steady beat, include only quarter and eighth notes in an order different from the prompt.
2
The student performs an improvisation that may slightly vary from 8-beat. The improvisation may or may not enter on time, maintain a steady beat, and include only quarter and eighth notes in an order different from the prompt.
1
The student performs some form of an improvisation that may vary significantly from 8 beats. The improvisation may or may not enter on time, maintain a steady beat, include only quarter and eighth notes in an order different from the prompts. OR the performance imitates the prompt.
0 The student does not complete an improvisation, may or may not enter on time, maintain a steady beat, or use eighth notes and quarter notes.
18
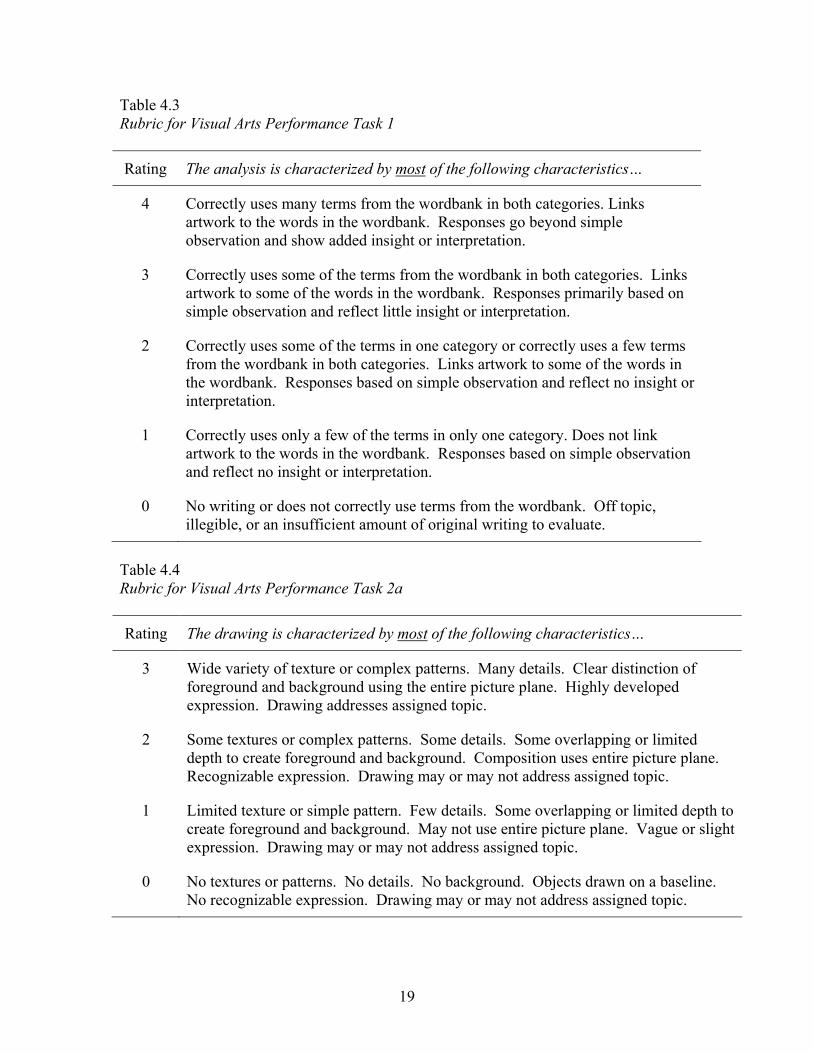
Table 4.3 Rubric for Visual Arts Performance Task 1
Rating The analysis is characterized by most of the following characteristics…
4 Correctly uses many terms from the wordbank in both categories. Links artwork to the words in the wordbank. Responses go beyond simple observation and show added insight or interpretation.
3 Correctly uses some of the terms from the wordbank in both categories. Links artwork to some of the words in the wordbank. Responses primarily based on simple observation and reflect little insight or interpretation.
2 Correctly uses some of the terms in one category or correctly uses a few terms from the wordbank in both categories. Links artwork to some of the words in the wordbank. Responses based on simple observation and reflect no insight or interpretation.
1 Correctly uses only a few of the terms in only one category. Does not link artwork to the words in the wordbank. Responses based on simple observation and reflect no insight or interpretation.
0 No writing or does not correctly use terms from the wordbank. Off topic, illegible, or an insufficient amount of original writing to evaluate.
Table 4.4 Rubric for Visual Arts Performance Task 2a
Rating The drawing is characterized by most of the following characteristics…
3 Wide variety of texture or complex patterns. Many details. Clear distinction of foreground and background using the entire picture plane. Highly developed expression. Drawing addresses assigned topic.
2 Some textures or complex patterns. Some details. Some overlapping or limited depth to create foreground and background. Composition uses entire picture plane. Recognizable expression. Drawing may or may not address assigned topic.
1 Limited texture or simple pattern. Few details. Some overlapping or limited depth to create foreground and background. May not use entire picture plane. Vague or slight expression. Drawing may or may not address assigned topic.
0 No textures or patterns. No details. No background. Objects drawn on a baseline. No recognizable expression. Drawing may or may not address assigned topic.
19
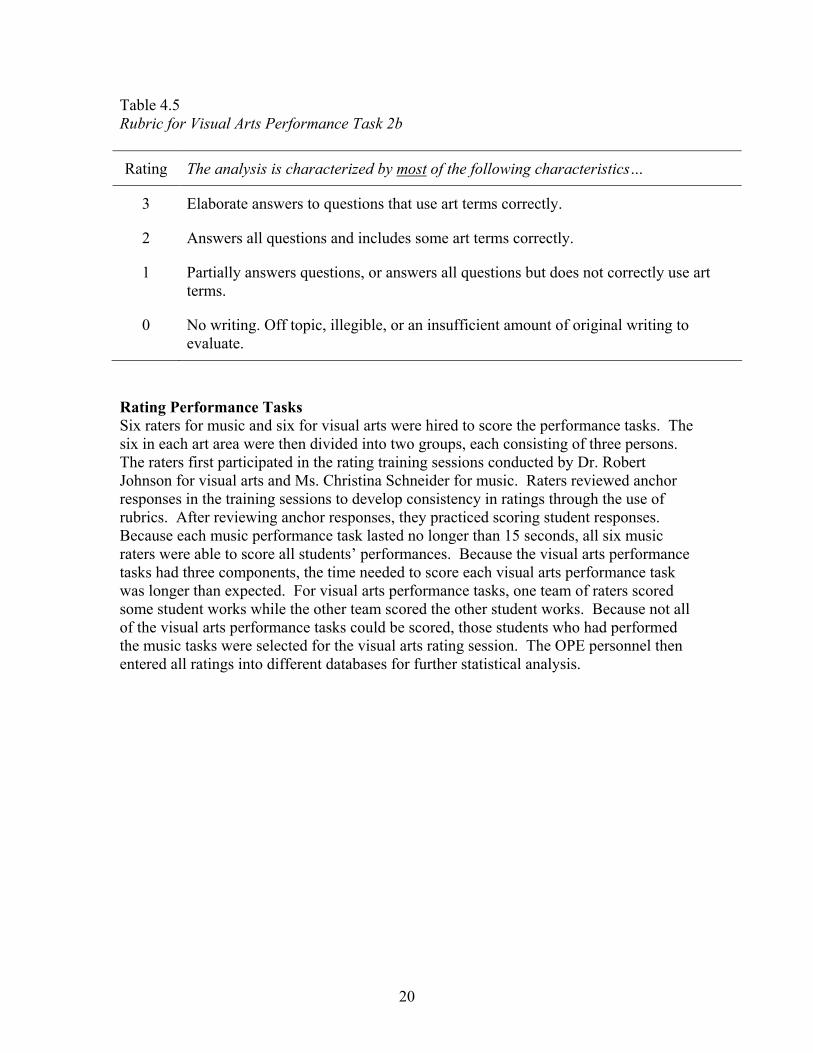
Table 4.5 Rubric for Visual Arts Performance Task 2b
Rating The analysis is characterized by most of the following characteristics…
3 Elaborate answers to questions that use art terms correctly.
2 Answers all questions and includes some art terms correctly.
1 Partially answers questions, or answers all questions but does not correctly use art terms.
0 No writing. Off topic, illegible, or an insufficient amount of original writing to evaluate.
Rating Performance Tasks Six raters for music and six for visual arts were hired to score the performance tasks. The six in each art area were then divided into two groups, each consisting of three persons. The raters first participated in the rating training sessions conducted by Dr. Robert Johnson for visual arts and Ms. Christina Schneider for music. Raters reviewed anchor responses in the training sessions to develop consistency in ratings through the use of rubrics. After reviewing anchor responses, they practiced scoring student responses. Because each music performance task lasted no longer than 15 seconds, all six music raters were able to score all students’ performances. Because the visual arts performance tasks had three components, the time needed to score each visual arts performance task was longer than expected. For visual arts performance tasks, one team of raters scored some student works while the other team scored the other student works. Because not all of the visual arts performance tasks could be scored, those students who had performed the music tasks were selected for the visual arts rating session. The OPE personnel then entered all ratings into different databases for further statistical analysis.
20
V RESULTS
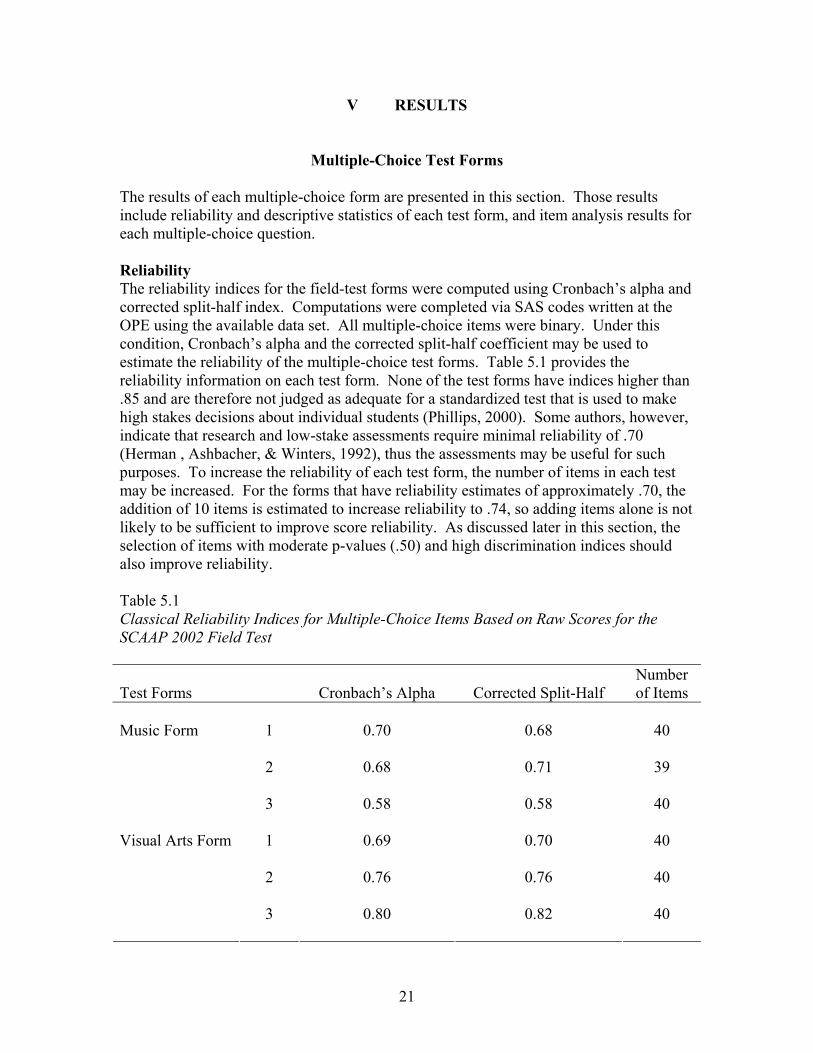
Multiple-Choice Test Forms The results of each multiple-choice form are presented in this section. Those results include reliability and descriptive statistics of each test form, and item analysis results for each multiple-choice question. Reliability The reliability indices for the field-test forms were computed using Cronbach’s alpha and corrected split-half index. Computations were completed via SAS codes written at the OPE using the available data set. All multiple-choice items were binary. Under this condition, Cronbach’s alpha and the corrected split-half coefficient may be used to estimate the reliability of the multiple-choice test forms. Table 5.1 provides the reliability information on each test form. None of the test forms have indices higher than .85 and are therefore not judged as adequate for a standardized test that is used to make high stakes decisions about individual students (Phillips, 2000). Some authors, however, indicate that research and low-stake assessments require minimal reliability of .70 (Herman , Ashbacher, & Winters, 1992), thus the assessments may be useful for such purposes. To increase the reliability of each test form, the number of items in each test may be increased. For the forms that have reliability estimates of approximately .70, the addition of 10 items is estimated to increase reliability to .74, so adding items alone is not likely to be sufficient to improve score reliability. As discussed later in this section, the selection of items with moderate p-values (.50) and high discrimination indices should also improve reliability. Table 5.1 Classical Reliability Indices for Multiple-Choice Items Based on Raw Scores for the SCAAP 2002 Field Test Test Forms
Cronbach’s Alpha
Corrected Split-Half
Number of Items
1
0.70
0.68 40
2
0.68
0.71 39
Music Form
3
0.58
0.58 40
1
0.69
0.70 40
2
0.76
0.76 40
Visual Arts Form
3
0.80
0.82
40
21
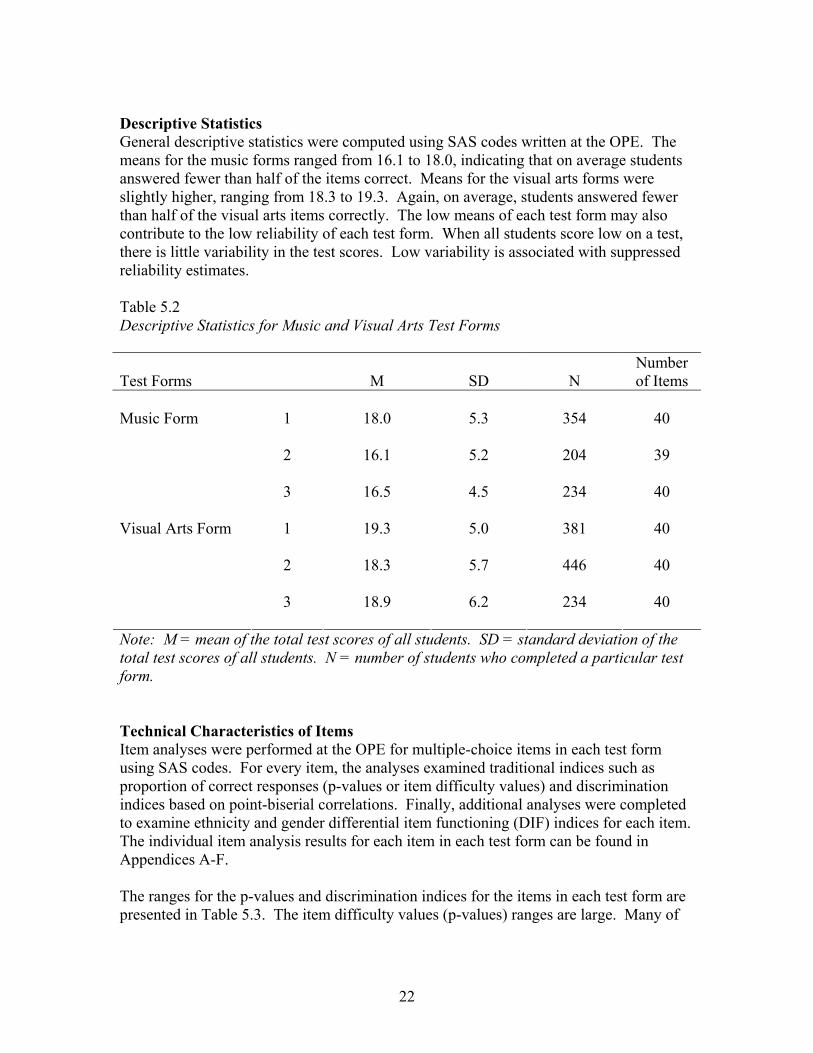
Descriptive Statistics General descriptive statistics were computed using SAS codes written at the OPE. The means for the music forms ranged from 16.1 to 18.0, indicating that on average students answered fewer than half of the items correct. Means for the visual arts forms were slightly higher, ranging from 18.3 to 19.3. Again, on average, students answered fewer than half of the visual arts items correctly. The low means of each test form may also contribute to the low reliability of each test form. When all students score low on a test, there is little variability in the test scores. Low variability is associated with suppressed reliability estimates. Table 5.2 Descriptive Statistics for Music and Visual Arts Test Forms Test Forms
M
SD
N
Number of Items
1
18.0
5.3
354 40
2
16.1
5.2
204 39
Music Form
3
16.5
4.5
234 40
1
19.3
5.0
381 40
2
18.3
5.7
446 40
Visual Arts Form
3
18.9
6.2
234
40
Note: M = mean of the total test scores of all students. SD = standard deviation of the total test scores of all students. N = number of students who completed a particular test form. Technical Characteristics of Items Item analyses were performed at the OPE for multiple-choice items in each test form using SAS codes. For every item, the analyses examined traditional indices such as proportion of correct responses (p-values or item difficulty values) and discrimination indices based on point-biserial correlations. Finally, additional analyses were completed to examine ethnicity and gender differential item functioning (DIF) indices for each item. The individual item analysis results for each item in each test form can be found in Appendices A-F. The ranges for the p-values and discrimination indices for the items in each test form are presented in Table 5.3. The item difficulty values (p-values) ranges are large. Many of
22
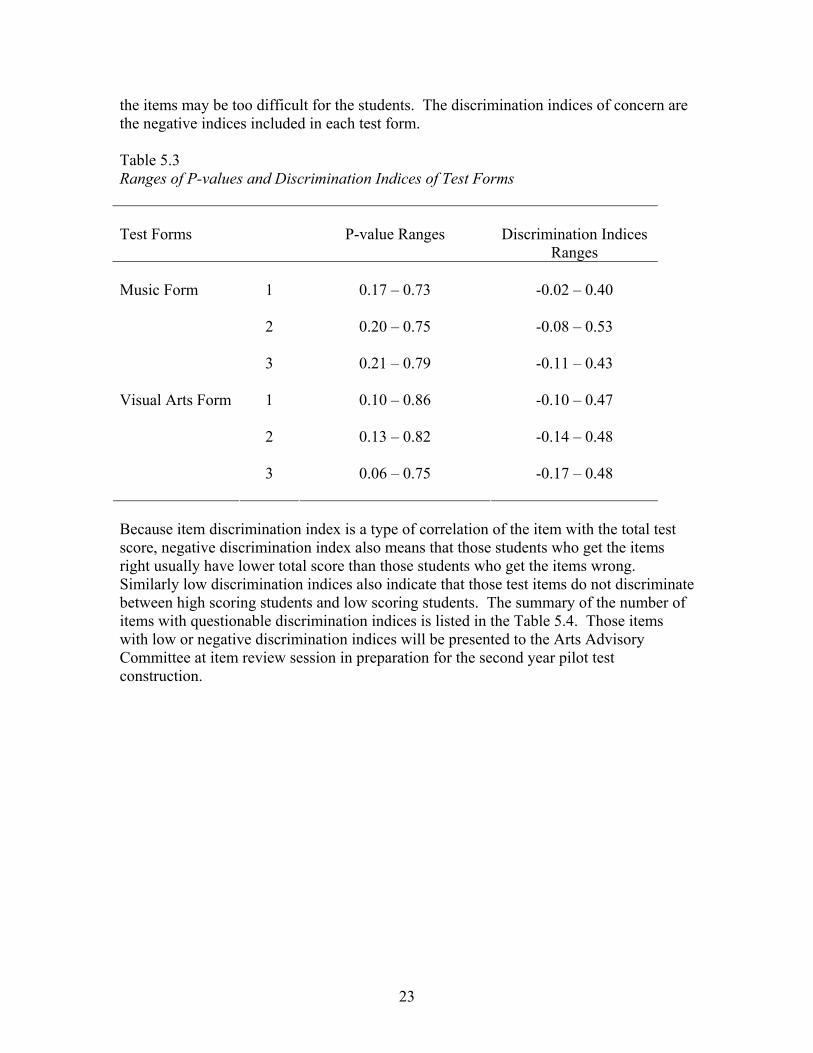
the items may be too difficult for the students. The discrimination indices of concern are the negative indices included in each test form. Table 5.3 Ranges of P-values and Discrimination Indices of Test Forms Test Forms
P-value Ranges
Discrimination Indices
Ranges 1
0.17 – 0.73
-0.02 – 0.40
2
0.20 – 0.75
-0.08 – 0.53
Music Form
3
0.21 – 0.79
-0.11 – 0.43
1
0.10 – 0.86
-0.10 – 0.47
2
0.13 – 0.82
-0.14 – 0.48
Visual Arts Form
3
0.06 – 0.75
-0.17 – 0.48
Because item discrimination index is a type of correlation of the item with the total test score, negative discrimination index also means that those students who get the items right usually have lower total score than those students who get the items wrong. Similarly low discrimination indices also indicate that those test items do not discriminate between high scoring students and low scoring students. The summary of the number of items with questionable discrimination indices is listed in the Table 5.4. Those items with low or negative discrimination indices will be presented to the Arts Advisory Committee at item review session in preparation for the second year pilot test construction.
23
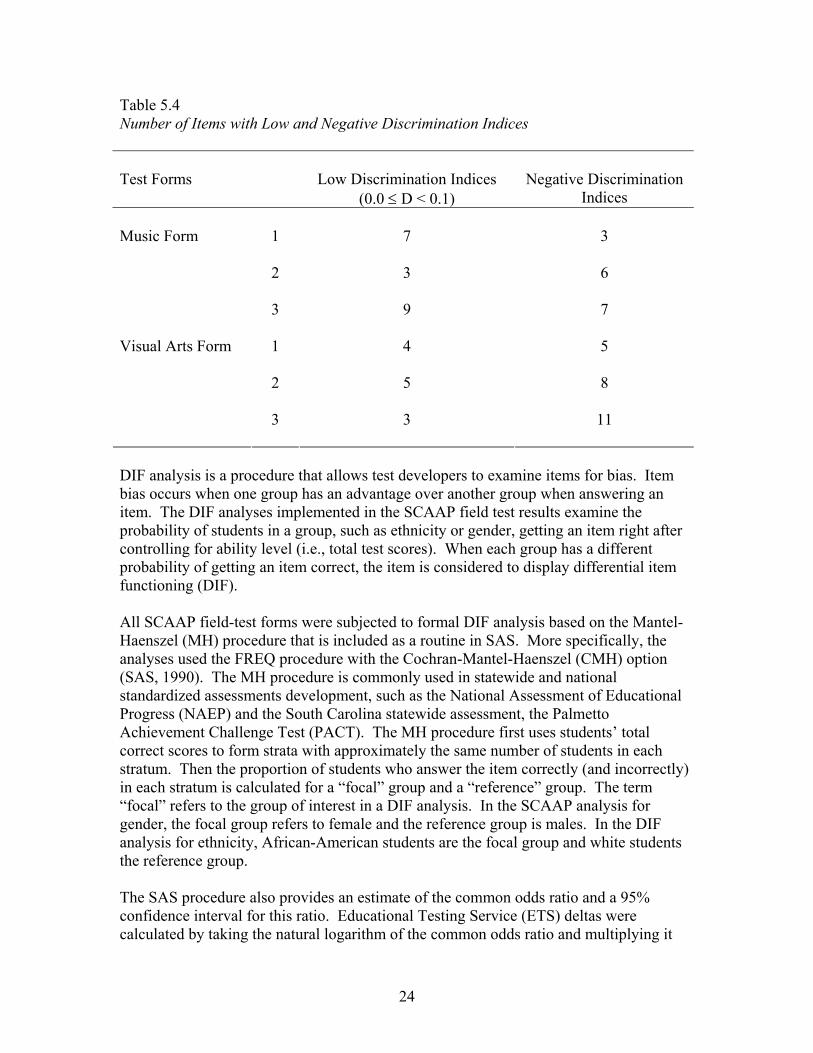
Table 5.4 Number of Items with Low and Negative Discrimination Indices Test Forms
Low Discrimination Indices
(0.0 ≤ D < 0.1)
Negative Discrimination
Indices 1
7
3
2
3
6
Music Form
3
9
7
1
4
5
2
5
8
Visual Arts Form
3
3
11
DIF analysis is a procedure that allows test developers to examine items for bias. Item bias occurs when one group has an advantage over another group when answering an item. The DIF analyses implemented in the SCAAP field test results examine the probability of students in a group, such as ethnicity or gender, getting an item right after controlling for ability level (i.e., total test scores). When each group has a different probability of getting an item correct, the item is considered to display differential item functioning (DIF). All SCAAP field-test forms were subjected to formal DIF analysis based on the Mantel-Haenszel (MH) procedure that is included as a routine in SAS. More specifically, the analyses used the FREQ procedure with the Cochran-Mantel-Haenszel (CMH) option (SAS, 1990). The MH procedure is commonly used in statewide and national standardized assessments development, such as the National Assessment of Educational Progress (NAEP) and the South Carolina statewide assessment, the Palmetto Achievement Challenge Test (PACT). The MH procedure first uses students’ total correct scores to form strata with approximately the same number of students in each stratum. Then the proportion of students who answer the item correctly (and incorrectly) in each stratum is calculated for a “focal” group and a “reference” group. The term “focal” refers to the group of interest in a DIF analysis. In the SCAAP analysis for gender, the focal group refers to female and the reference group is males. In the DIF analysis for ethnicity, African-American students are the focal group and white students the reference group. The SAS procedure also provides an estimate of the common odds ratio and a 95% confidence interval for this ratio. Educational Testing Service (ETS) deltas were calculated by taking the natural logarithm of the common odds ratio and multiplying it
24
with a constant –2.35. The following rules were developed by ETS to interpret the delta values (Zwick & Ercikan, 1989).
• “A” items are those items with absolute value of ETS delta less than 1 and MH odds ratio not significantly different from zero (α = .05)
• “B” items are those items with absolute value of ETS delta either (a) at least 1 but less than 1.5, or (b) at least 1 but not significantly greater than 1 (α = .05).
• “C” items are those with ETS delta greater than 1.5 and significantly greater than 1 (α =.05).
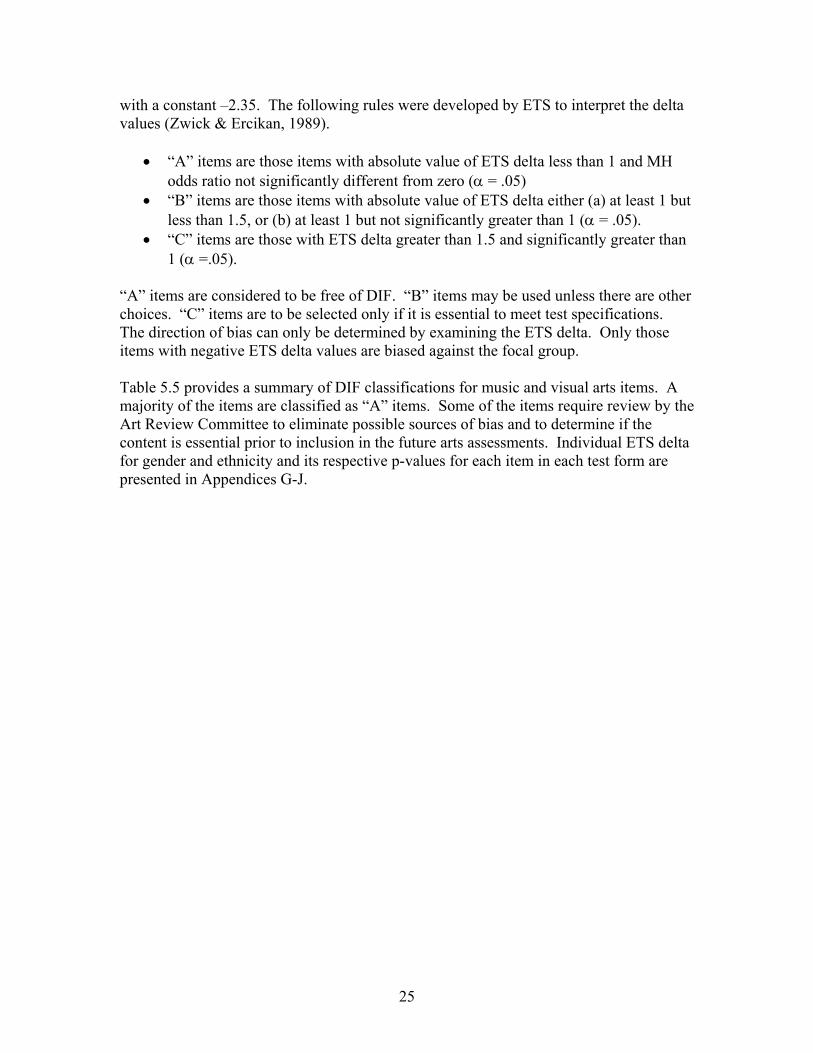
“A” items are considered to be free of DIF. “B” items may be used unless there are other choices. “C” items are to be selected only if it is essential to meet test specifications. The direction of bias can only be determined by examining the ETS delta. Only those items with negative ETS delta values are biased against the focal group. Table 5.5 provides a summary of DIF classifications for music and visual arts items. A majority of the items are classified as “A” items. Some of the items require review by the Art Review Committee to eliminate possible sources of bias and to determine if the content is essential prior to inclusion in the future arts assessments. Individual ETS delta for gender and ethnicity and its respective p-values for each item in each test form are presented in Appendices G-J.
25
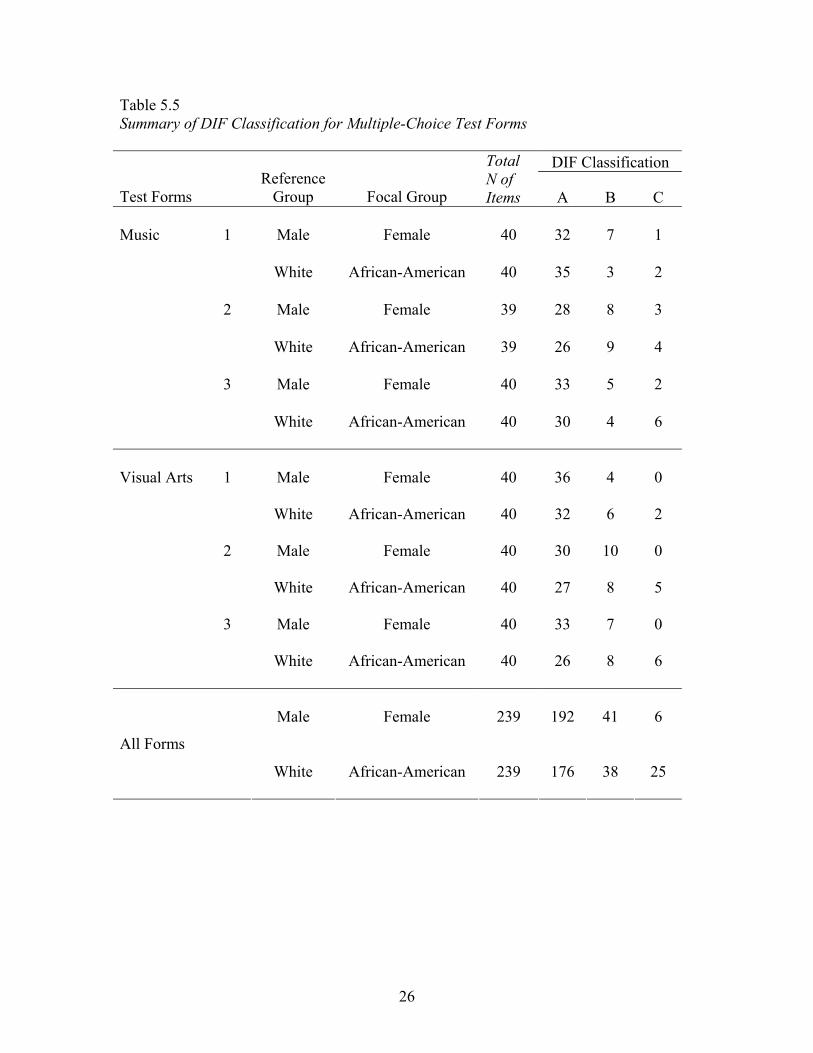
Table 5.5 Summary of DIF Classification for Multiple-Choice Test Forms
DIF Classification
Test Forms Reference
Group Focal Group
Total N of Items A B C
1 Male Female 40 32 7 1 White African-American 40 35 3 2 2 Male Female 39 28 8 3 White African-American 39 26 9 4 3 Male Female 40 33 5 2
Music
White
African-American
40
30
4
6
1 Male Female 40 36 4 0 White African-American 40 32 6 2 2 Male Female 40 30 10 0 White African-American 40 27 8 5 3 Male Female 40 33 7 0
Visual Arts
White
African-American
40
26
8
6
Male
Female
239
192
41
6 All Forms
White
African-American
239
176
38
25
26
Descriptive statistics by gender are presented in Table 5.6. Females scored higher than males on both the music and visual arts tests. Music scores for females ranged from 16.5 to 18.5 and for males ranged from 15.6 to 17.8. Visual arts scores for females ranged from 19.1 to 19.9 and for males ranged from 17.4 to 18.9. Table 5.6 Descriptive Statistics of Test Scores by Gender
Gender
Female
Male Test Forms
M
SD
n
M
SD
n
1
18.5
4.8
177
17.8
5.2
174
2
16.5
5.5
107
15.6
4.7
96
Music Form
3
16.7
4.2
123
16.3
4.7
109
1
19.9
4.53
194
18.9
4.82
184
2
19.1
5.7
245
17.4
5.5
198
Visual Arts Form
3
19.4
5.7
115
18.7
6.5
116
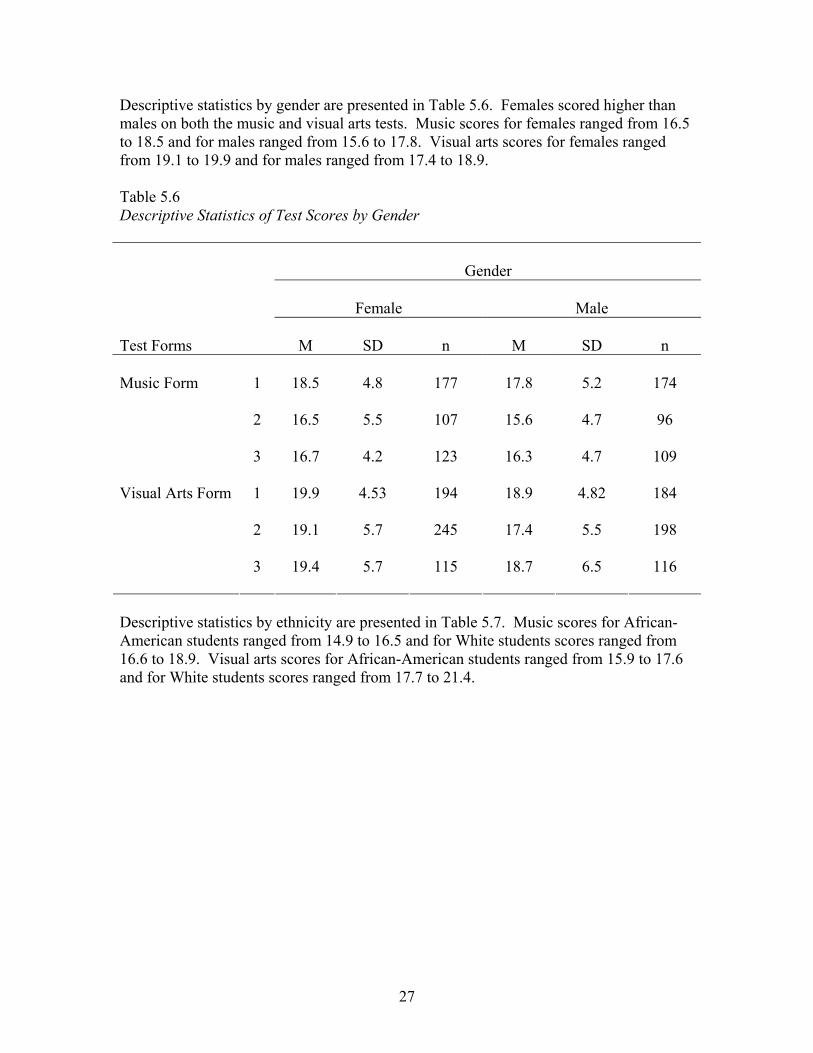
Descriptive statistics by ethnicity are presented in Table 5.7. Music scores for African-American students ranged from 14.9 to 16.5 and for White students scores ranged from 16.6 to 18.9. Visual arts scores for African-American students ranged from 15.9 to 17.6 and for White students scores ranged from 17.7 to 21.4.
27
Table 5.7 Descriptive Statistics of Test Scores by Ethnicity
Ethnicity
African-American
White Test Forms
M
SD
n
M
SD
n
1
16.5
5.0
128
18.9
4.9
205
2
14.9
4.3
62
16.6
5.5
135
Music Form
3
16.2
4.1
112
16.9
4.8
101
1
17.6
5.0
136
20.5
4.6
223
2
16.4
4.6
250
21.4
5.7
167
Visual Arts Form
3
15.9
4.7
68
17.7
5.1
160
The ranges of p-values of each test form are presented in Table 5.8 for the different ethnic and gender groups. Form 1 of music had the lowest p-values for each group. In the visual arts, the lowest p-values were associated with Form 3.
28
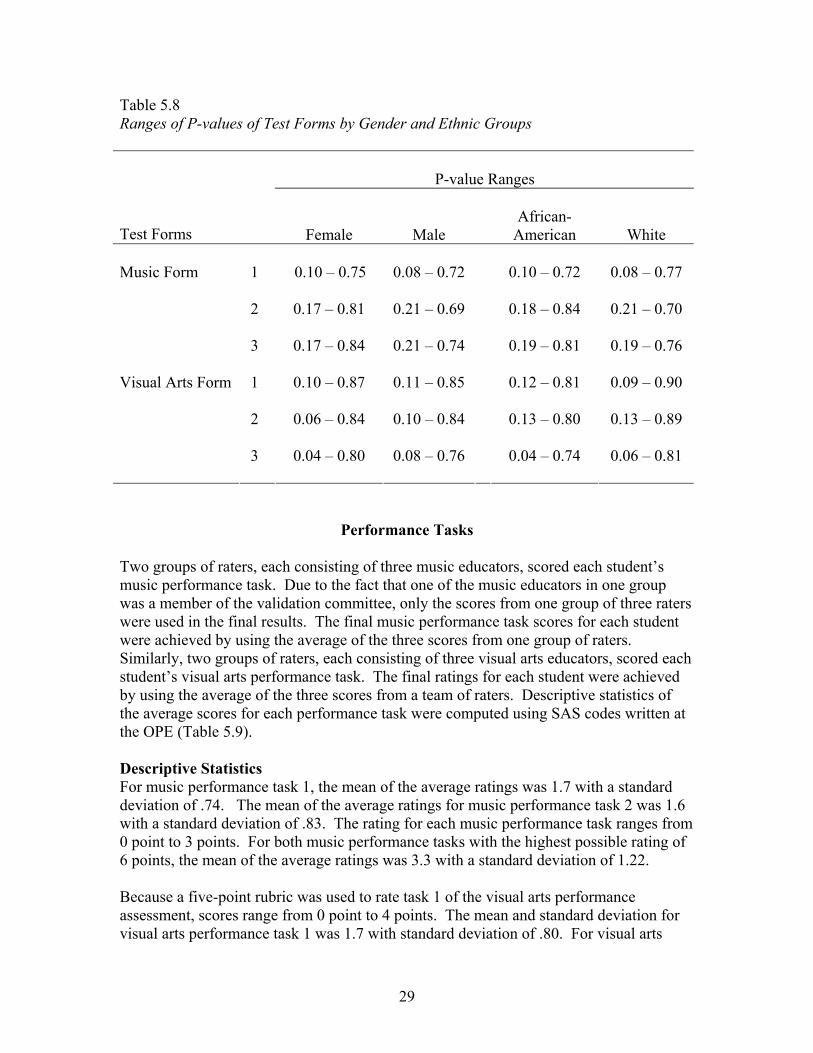
Table 5.8 Ranges of P-values of Test Forms by Gender and Ethnic Groups
P-value Ranges
Test Forms
Female
Male
African-
American
White 1
0.10 – 0.75
0.08 – 0.72
0.10 – 0.72
0.08 – 0.77
2
0.17 – 0.81
0.21 – 0.69
0.18 – 0.84
0.21 – 0.70
Music Form
3
0.17 – 0.84
0.21 – 0.74
0.19 – 0.81
0.19 – 0.76
1
0.10 – 0.87
0.11 – 0.85
0.12 – 0.81
0.09 – 0.90
2
0.06 – 0.84
0.10 – 0.84
0.13 – 0.80
0.13 – 0.89
Visual Arts Form
3
0.04 – 0.80
0.08 – 0.76
0.04 – 0.74
0.06 – 0.81
Performance Tasks Two groups of raters, each consisting of three music educators, scored each student’s music performance task. Due to the fact that one of the music educators in one group was a member of the validation committee, only the scores from one group of three raters were used in the final results. The final music performance task scores for each student were achieved by using the average of the three scores from one group of raters. Similarly, two groups of raters, each consisting of three visual arts educators, scored each student’s visual arts performance task. The final ratings for each student were achieved by using the average of the three scores from a team of raters. Descriptive statistics of the average scores for each performance task were computed using SAS codes written at the OPE (Table 5.9). Descriptive Statistics For music performance task 1, the mean of the average ratings was 1.7 with a standard deviation of .74. The mean of the average ratings for music performance task 2 was 1.6 with a standard deviation of .83. The rating for each music performance task ranges from 0 point to 3 points. For both music performance tasks with the highest possible rating of 6 points, the mean of the average ratings was 3.3 with a standard deviation of 1.22. Because a five-point rubric was used to rate task 1 of the visual arts performance assessment, scores range from 0 point to 4 points. The mean and standard deviation for visual arts performance task 1 was 1.7 with standard deviation of .80. For visual arts
29
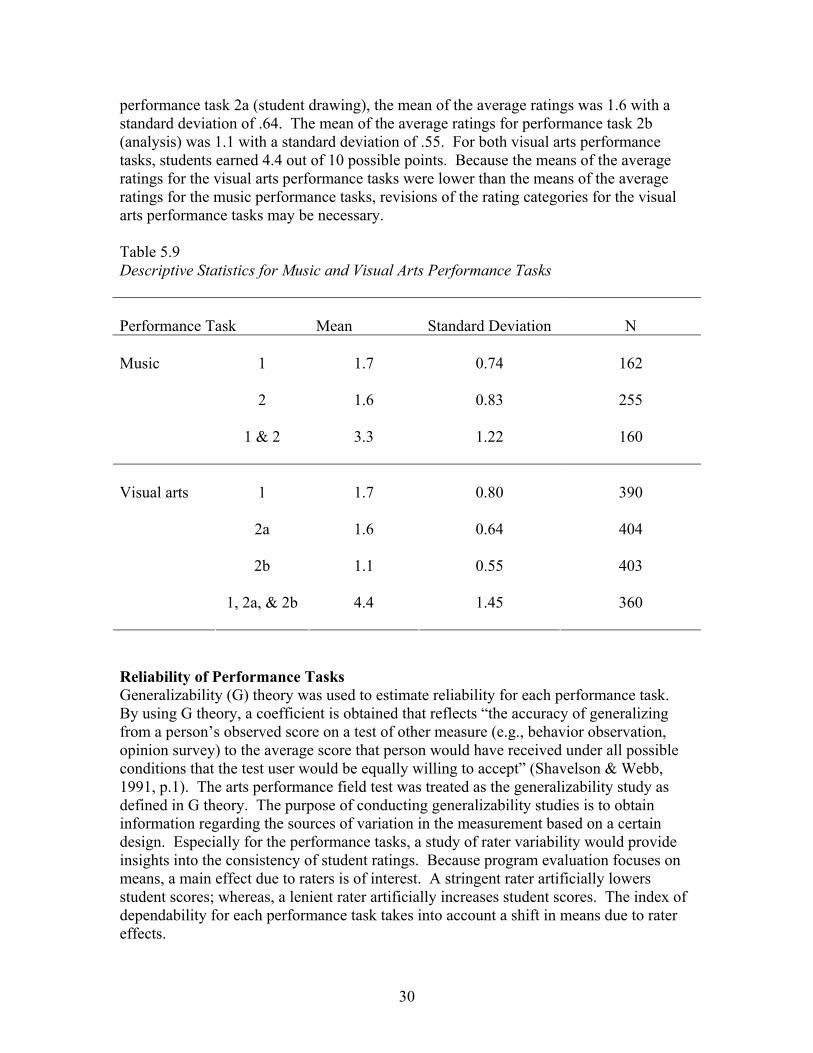
performance task 2a (student drawing), the mean of the average ratings was 1.6 with a standard deviation of .64. The mean of the average ratings for performance task 2b (analysis) was 1.1 with a standard deviation of .55. For both visual arts performance tasks, students earned 4.4 out of 10 possible points. Because the means of the average ratings for the visual arts performance tasks were lower than the means of the average ratings for the music performance tasks, revisions of the rating categories for the visual arts performance tasks may be necessary. Table 5.9 Descriptive Statistics for Music and Visual Arts Performance Tasks Performance Task Mean Standard Deviation N
1 1.7 0.74 162 2 1.6 0.83 255
Music
1 & 2
3.3
1.22
160
1 1.7 0.80 390
2a 1.6 0.64 404
2b 1.1 0.55 403
Visual arts
1, 2a, & 2b
4.4
1.45
360
Reliability of Performance Tasks Generalizability (G) theory was used to estimate reliability for each performance task. By using G theory, a coefficient is obtained that reflects “the accuracy of generalizing from a person’s observed score on a test of other measure (e.g., behavior observation, opinion survey) to the average score that person would have received under all possible conditions that the test user would be equally willing to accept” (Shavelson & Webb, 1991, p.1). The arts performance field test was treated as the generalizability study as defined in G theory. The purpose of conducting generalizability studies is to obtain information regarding the sources of variation in the measurement based on a certain design. Especially for the performance tasks, a study of rater variability would provide insights into the consistency of student ratings. Because program evaluation focuses on means, a main effect due to raters is of interest. A stringent rater artificially lowers student scores; whereas, a lenient rater artificially increases student scores. The index of dependability for each performance task takes into account a shift in means due to rater effects.
30
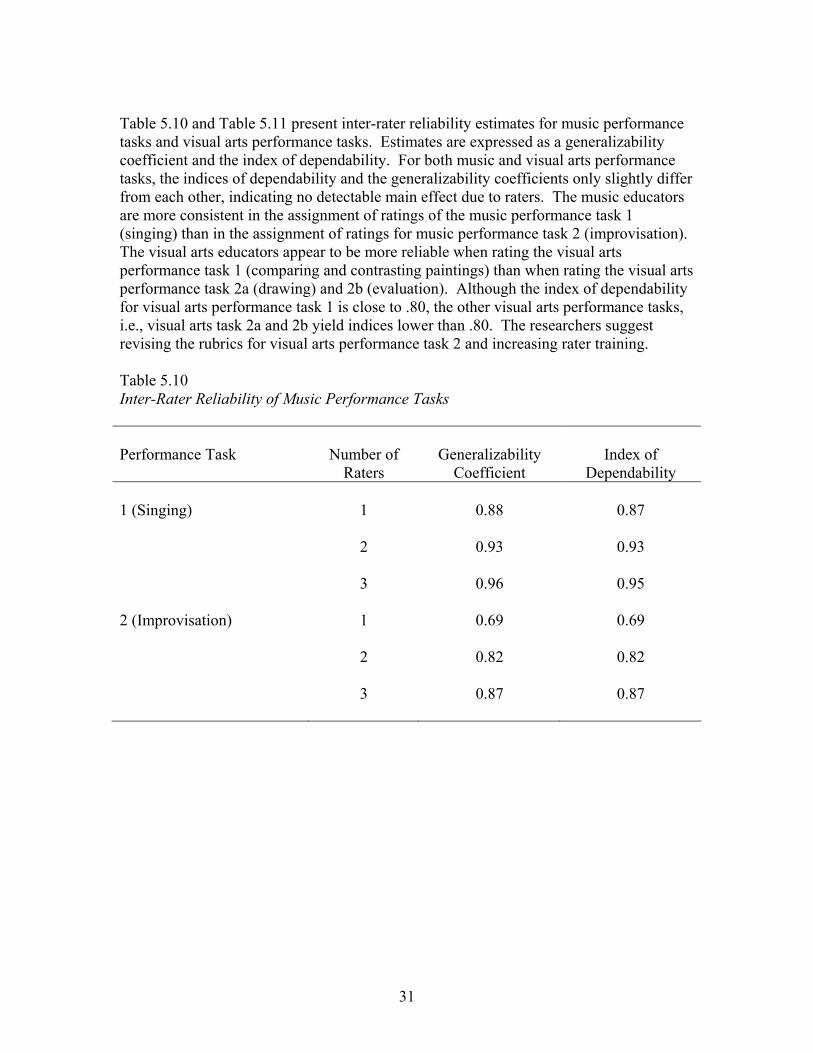
Table 5.10 and Table 5.11 present inter-rater reliability estimates for music performance tasks and visual arts performance tasks. Estimates are expressed as a generalizability coefficient and the index of dependability. For both music and visual arts performance tasks, the indices of dependability and the generalizability coefficients only slightly differ from each other, indicating no detectable main effect due to raters. The music educators are more consistent in the assignment of ratings of the music performance task 1 (singing) than in the assignment of ratings for music performance task 2 (improvisation). The visual arts educators appear to be more reliable when rating the visual arts performance task 1 (comparing and contrasting paintings) than when rating the visual arts performance task 2a (drawing) and 2b (evaluation). Although the index of dependability for visual arts performance task 1 is close to .80, the other visual arts performance tasks, i.e., visual arts task 2a and 2b yield indices lower than .80. The researchers suggest revising the rubrics for visual arts performance task 2 and increasing rater training. Table 5.10 Inter-Rater Reliability of Music Performance Tasks Performance Task
Number of
Raters
Generalizability
Coefficient
Index of
Dependability 1 (Singing)
1
0.88
0.87
2
0.93
0.93
3
0.96
0.95
2 (Improvisation)
1
0.69
0.69
2
0.82
0.82
3
0.87
0.87
31
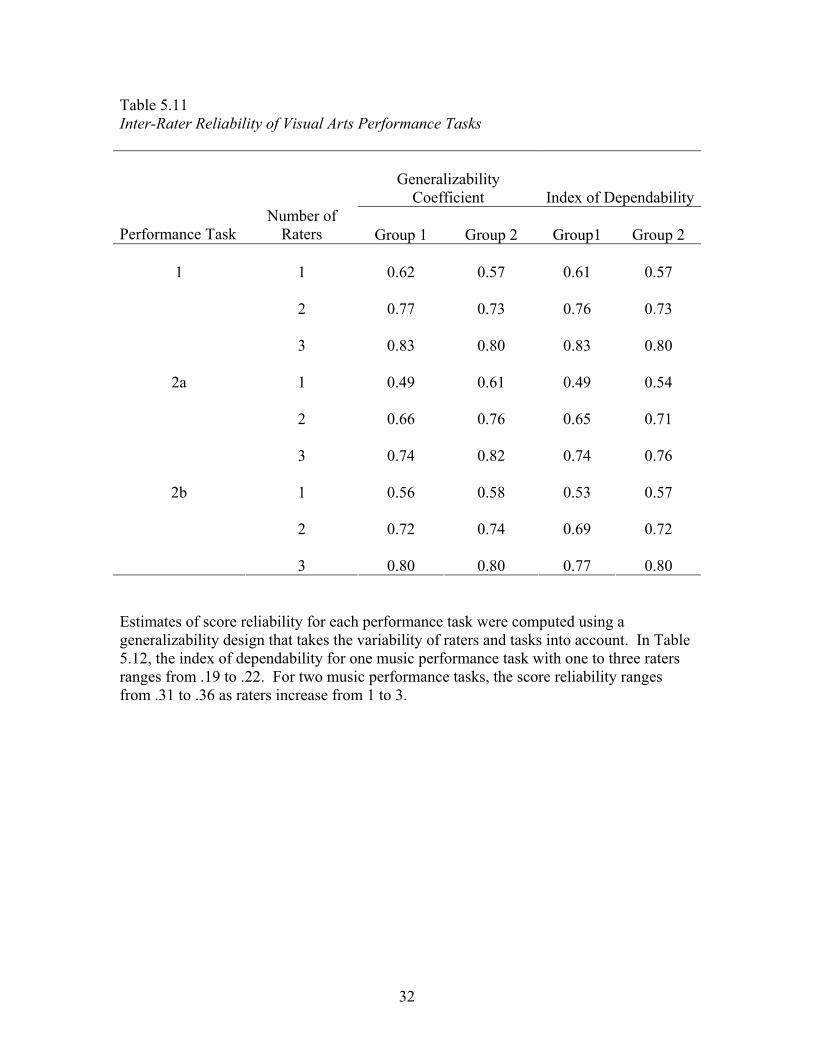
Table 5.11 Inter-Rater Reliability of Visual Arts Performance Tasks
Generalizability
Coefficient
Index of Dependability
Performance Task Number of
Raters
Group 1
Group 2
Group1
Group 2 1
0.62
0.57
0.61
0.57
2
0.77
0.73
0.76
0.73
1
3
0.83
0.80
0.83
0.80
1
0.49
0.61
0.49
0.54
2
0.66
0.76
0.65
0.71
2a
3
0.74
0.82
0.74
0.76
1
0.56
0.58
0.53
0.57
2
0.72
0.74
0.69
0.72
2b
3
0.80
0.80
0.77
0.80
Estimates of score reliability for each performance task were computed using a generalizability design that takes the variability of raters and tasks into account. In Table 5.12, the index of dependability for one music performance task with one to three raters ranges from .19 to .22. For two music performance tasks, the score reliability ranges from .31 to .36 as raters increase from 1 to 3.
32
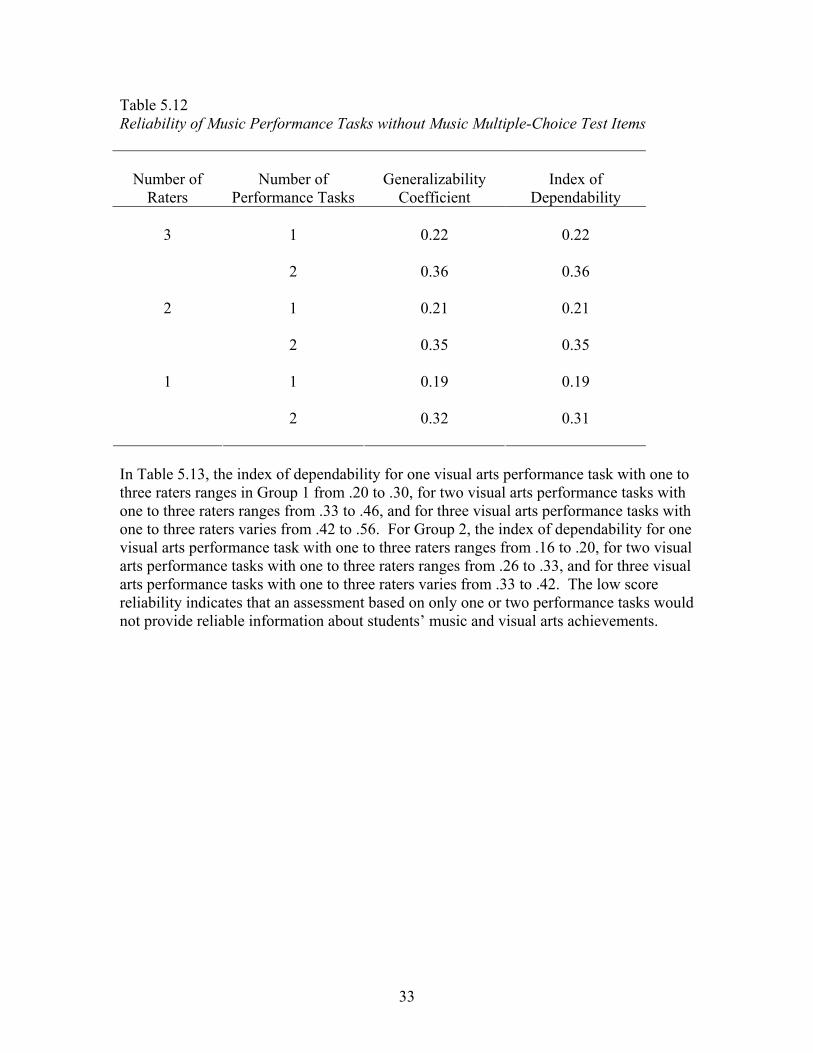
Table 5.12 Reliability of Music Performance Tasks without Music Multiple-Choice Test Items
Number of
Raters
Number of
Performance Tasks
Generalizability
Coefficient
Index of
Dependability 1
0.22
0.22
3
2
0.36
0.36
1
0.21
0.21
2
2
0.35
0.35
1
0.19
0.19
1
2
0.32
0.31
In Table 5.13, the index of dependability for one visual arts performance task with one to three raters ranges in Group 1 from .20 to .30, for two visual arts performance tasks with one to three raters ranges from .33 to .46, and for three visual arts performance tasks with one to three raters varies from .42 to .56. For Group 2, the index of dependability for one visual arts performance task with one to three raters ranges from .16 to .20, for two visual arts performance tasks with one to three raters ranges from .26 to .33, and for three visual arts performance tasks with one to three raters varies from .33 to .42. The low score reliability indicates that an assessment based on only one or two performance tasks would not provide reliable information about students’ music and visual arts achievements.
33
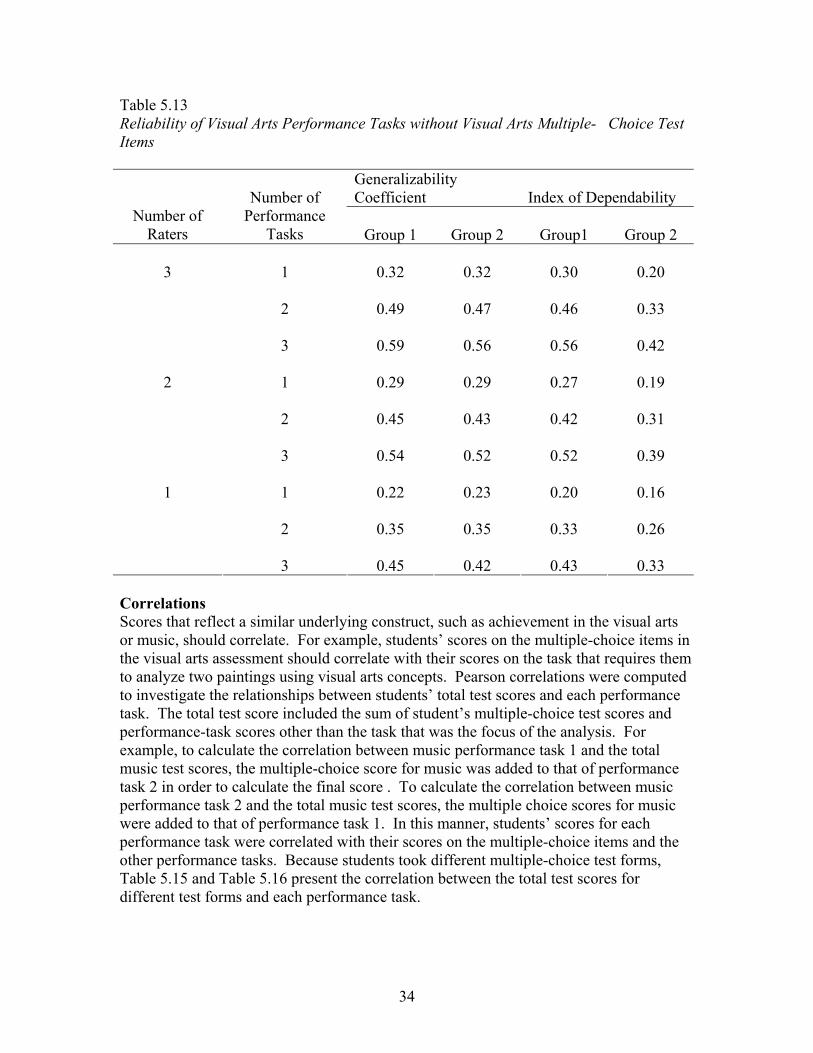
Table 5.13 Reliability of Visual Arts Performance Tasks without Visual Arts Multiple- Choice Test Items
Generalizability Coefficient Index of Dependability
Number of Raters
Number of Performance
Tasks
Group 1
Group 2
Group1
Group 2 1
0.32
0.32
0.30
0.20
2
0.49
0.47
0.46
0.33
3
3
0.59
0.56
0.56
0.42
1
0.29
0.29
0.27
0.19
2
0.45
0.43
0.42
0.31
2
3
0.54
0.52
0.52
0.39
1
0.22
0.23
0.20
0.16
2
0.35
0.35
0.33
0.26
1
3
0.45
0.42
0.43
0.33
Correlations Scores that reflect a similar underlying construct, such as achievement in the visual arts or music, should correlate. For example, students’ scores on the multiple-choice items in the visual arts assessment should correlate with their scores on the task that requires them to analyze two paintings using visual arts concepts. Pearson correlations were computed to investigate the relationships between students’ total test scores and each performance task. The total test score included the sum of student’s multiple-choice test scores and performance-task scores other than the task that was the focus of the analysis. For example, to calculate the correlation between music performance task 1 and the total music test scores, the multiple-choice score for music was added to that of performance task 2 in order to calculate the final score . To calculate the correlation between music performance task 2 and the total music test scores, the multiple choice scores for music were added to that of performance task 1. In this manner, students’ scores for each performance task were correlated with their scores on the multiple-choice items and the other performance tasks. Because students took different multiple-choice test forms, Table 5.15 and Table 5.16 present the correlation between the total test scores for different test forms and each performance task.
34
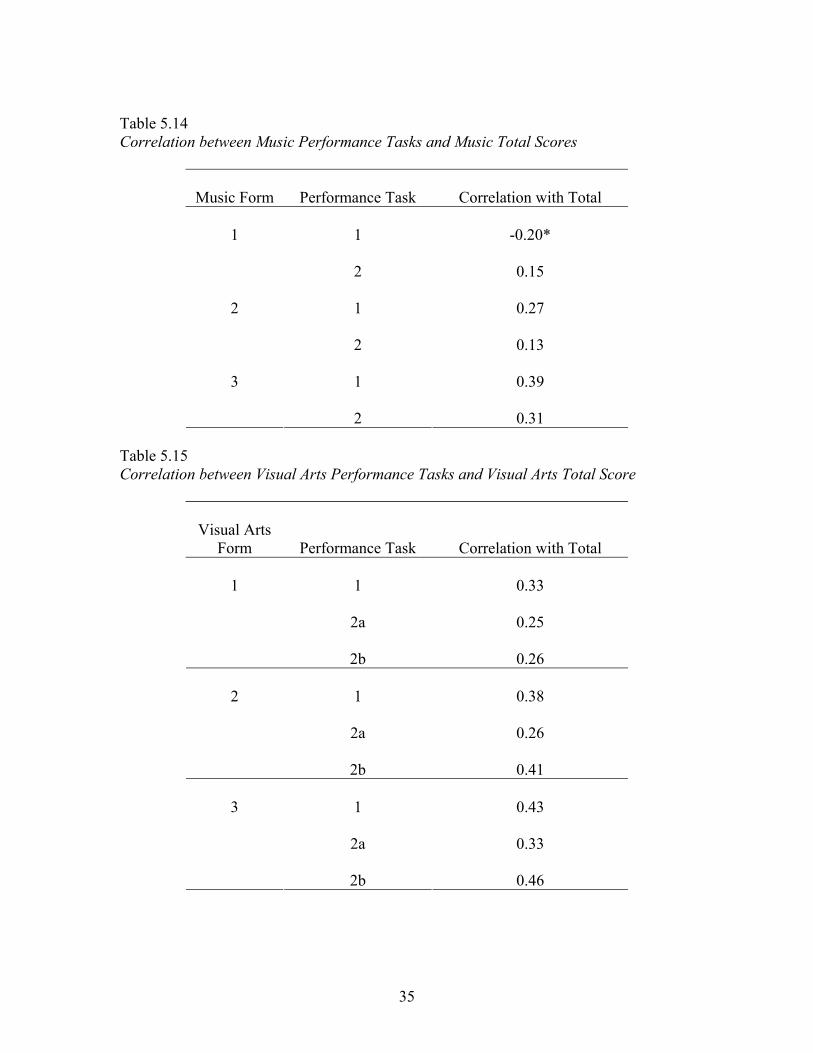
Table 5.14 Correlation between Music Performance Tasks and Music Total Scores
Music Form
Performance Task
Correlation with Total
1
-0.20*
1
2
0.15
1
0.27
2
2
0.13
1
0.39
3
2
0.31
Table 5.15 Correlation between Visual Arts Performance Tasks and Visual Arts Total Score
Visual Arts
Form
Performance Task Correlation with Total 1
0.33
2a
0.25
1
2b
0.26
1
0.38
2a
0.26
2
2b
0.41
1
0.43
2a
0.33
3
2b
0.46
35
Other than the negative correlation between form 1 and music performance task 1, all other correlations found between the total test scores and the performance task scores were positive. The correlations were also not too high, illustrating that the inclusion of performance tasks provides additional information about students’ arts achievement. In other words, if the correlation between the total test scores and one performance task is too high, that performance task may not provide additional information regarding students’ arts achievement and, hence, may be omitted. Because the correlation between total test scores using music multiple-choice test form one and performance task 1 was negative, further study of form 1 is needed.
36
VI TEACHER/TEST ADMINISTRATOR FEEDBACK A teacher/test administrator feedback form (Appendix K) was included in the test administrator package given to each school. In that form, teachers were requested to report the testing time required for multiple-choice test forms and performance tasks, testing procedure difficulties, errors in test questions, and other general comments. Each comment was examined and coded. Although some teachers indicated misprints and word errors in the printed test forms, most items could not be found due to lack of sufficient information provided by the teachers. That report, however alerts the OPE personnel and the Arts Review Committee to ensure the accuracy of the printing copies. Following is a summary of teachers’ feedback in each arts area. The concerns and suggestions included will be further discussed with the Arts Review Committee members.
Music Seventeen test administrators for the music assessments responded to the survey. They reported that the time needed to administer one multiple choice test form for each class varied from 15 to 60 minutes. Most teachers commented that the instructions for the listening section that were recorded on a CD did not use the exact wordings that were printed on the test forms. A few teachers indicated the lack of information about the option to read directions to students in the test administrator manual. One teacher mentioned that students revealed the correct answer to other students by changing their facial expressions. Some teachers stated that some questions are too difficult and not realistic in regard to students’ achievement due to the amount of time they have for music within a school year. One teacher suggested beginning the listening tasks, (i.e., section 2) first so that students have more flexibility in completing the written-only task, (i.e., section 1). For the music performance tasks, test administrators reported the time needed to administer both tasks to each student varied from 4 to 10 minutes. The time needed to administer both tasks to each class, however, varied from 1 hour and 30 minutes to a whole school day. Most teachers indicated that the direction “ready sing” was repeated too many times in the instructions for the first performance task. Some teachers felt that the instructions for the performance tasks were too long. Individual teachers suggested different alternatives for the “ready sing” direction, such as “ready go,” or non-verbal cues. A few teachers suggested using words to sing the song in the first performance task. One teacher suggested that the second music performance task (i.e., the improvisation) could be described as a “call and response” activity so that students will understand that their responses should be different from the given rhythm pattern. One teacher recommended including explanations for the tempo clicking sounds during the second performance task. Some test administrators reported problems and difficulties using the tape recorder. One teacher suggested that the performance tasks format should be practiced prior to the testing sessions. In addition, the teacher questioned the lack of instructions to deal with a student’s unsatisfactory first performance that did not reveal the student’s true ability.
37
Teachers indicated that solutions to deal with difficulties (e.g., test administrator’s errors in recording, speed change due to frequent use of pause button, interruption during testing, and defective tapes) were not addressed in the test administrator manual. Due to scheduling difficulties, one teacher suggested that the assessment not include performance tasks.
Visual Arts Thirteen visual arts test administrators completed the feedback surveys. They reported that the time needed to administer one multiple-choice form to each class varied from 20 to 60 minutes. Some teachers reported that some of the questions included different directions for the teachers and the students. A few teachers commented that the questions included in the multiple-choice test forms were either too difficult for their students or unclearly stated. Other teachers mentioned that students experienced difficulty in using the scantrons to mark their answers. For the performance tasks, test administrators reported that the time needed to administer both performance tasks varied from 30 to 90 minutes. Most teachers expressed satisfaction with the first performance task, (i.e., use visual arts related words to compare and contrast two artworks). Some teachers suggested that the writing tasks should be included in the multiple-choice test form and not in the performance tasks. Some also indicated that instructions for the second performance task (i.e., the drawing and analysis) should be on the same page as the students’ response sheet. A few teachers recommended the use of colored pencil or other media for the drawings so that students could fully express their individual uniqueness in visual arts.
General comments In general, most test administrators recommended changing the testing time. Several teachers felt that students were too exhausted after the PACT testing sessions. Others felt that students were ready to have fun as April was the last month of school. A few expressed difficulty in scheduling testing times because field trips and other activities were originally planned for students after PACT testing sessions. One teacher suggested that the test administration time should be the same for all students. A few teachers felt that information regarding the packing and sending of the completed test forms should be more explicit. One teacher also indicated the lack of instructions to deal with absentees and make-up test sessions. The teacher also suggested that test administrators should check completed answer sheets for proper “bubbling” after testing session.
38
VII DISCUSSIONS AND RECOMMENDATIONS
Revision of Items and Forms The current assessment specification with 40 items and 2 performance tasks may not be sufficient to provide reliable results regarding students’ arts achievement. Additional items in the multiple-choice test forms may be necessary to achieve acceptable reliability for those forms. Meetings with the Arts Review Committee should be held to revise items. The items that needed revisions are those with (a) negative and low discriminations, (b) a high percentage of students choosing the incorrect options, and (c) DIF categories of C. New test forms should be created with revised and functioning items. Also, new items would most probably be necessary as the current item bank based on the field test items may not be sufficient for creating new test forms.
Test Administration
Based on anecdotal responses, and those on the teacher feedback forms, changing of test administration time is necessary. Most teachers reported that the month of April is too busy for students as it is also the PACT testing time. Furthermore, information regarding ways to manage extraneous circumstances such as external disruptions during testing process, non-functioning equipment, and absentees or make-up test sessions should be provided to each test administrator.
Web-Based Administration
To eliminate some of the difficulties in test administration, a web-based prototype is planned to be administered to a few schools in the near future. One difficulty in creating the arts assessments is that some art forms do not have still images. For example, music can only be heard in that instance when it is played. In a traditional assessment format, the test administrator plays the recording to all students at the same time. However, those students whose attention drifted may have missed the critical part of the music that provides the information to correctly answer the question. By using a web-based assessment, a student may choose to repeat a piece of music if necessary. Moreover, web-based assessment will also facilitate the scoring of the assessment. Students’ scores will be provided in electronic format and no conversion process from paper or other format to electronic format will be necessary. Currently, the SCAAP Web site is capable of creating one multiple-choice test form at a time. Specific issues related to the web-based test administration process, however, are yet to be explored by the Arts Advisory Committee and the OPE personnel. Finally, schools with web-based test administration facility need to be identified for field-testing the prototype.
39
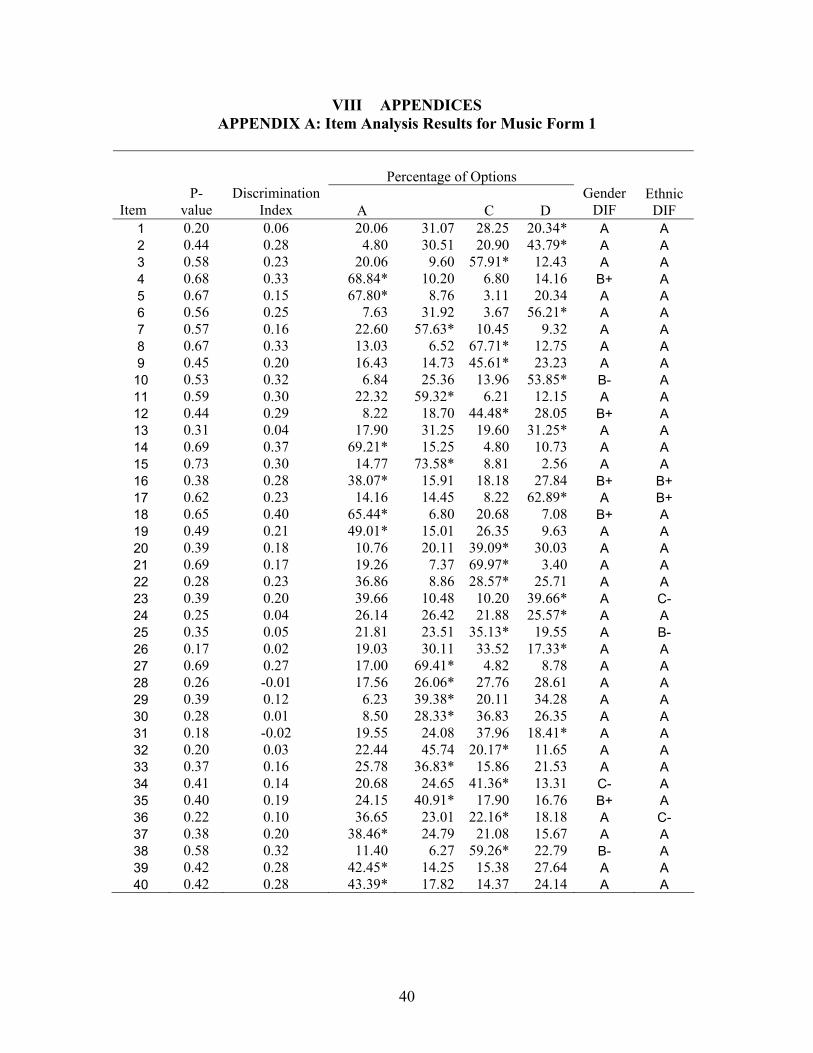
VIII APPENDICES APPENDIX A: Item Analysis Results for Music Form 1
Percentage of Options P-
value Discrimination
Index A C D Gender
DIF
Ethnic DIF
1 0.06 20.06 31.07 28.25 20.34* A A 2
Item 0.20 0.44 0.28 4.80 30.51 20.90 43.79* A A
3 0.58 0.23 57.91* 12.43 A A 4 0.68 0.33 68.84* 10.20 6.80 14.16 A 5 0.67 0.15 67.80* 8.76 3.11 20.34 A 6 0.56 0.25 7.63 31.92 3.67 56.21* A A 7 0.57 0.16 22.60 57.63* 10.45 9.32 A A
0.67 0.33 13.03 6.52 67.71* 12.75 A A 9 0.20
20.06 9.60 B+
A
8 0.45 16.43 14.73 45.61* 23.23 A A
10 0.53 0.32 6.84 25.36 13.96 53.85* B- A 11 0.59 0.30 22.32 59.32* 6.21 12.15 A A 12 0.44 0.29 8.22 18.70 44.48* 28.05 B+ A 13 0.31 0.04 17.90 31.25 19.60 31.25* A A 14 0.69 0.37 69.21* 15.25 4.80 10.73 A A 15 0.73 0.30 14.77 73.58* 8.81 2.56 A A 16 0.38 0.28 38.07* 15.91 18.18 27.84 B+ B+ 17 0.62 0.23 14.16 14.45 8.22 62.89* A B+ 18 0.65 0.40 65.44* 6.80 20.68 7.08 B+ A 19 0.49 0.21 49.01* 15.01 26.35 9.63 A A 20 0.39 0.18 10.76 20.11 39.09* 30.03 A A 21 0.69 0.17 19.26 7.37 69.97* 3.40 A A 22 0.28 0.23 36.86 8.86 28.57* 25.71 A A 23 0.39 0.20 39.66 10.48 10.20 39.66* A C- 24 0.25 0.04 26.14 26.42 21.88 25.57* A A 25 0.35 0.05 21.81 23.51 35.13* 19.55 A B- 26 0.17 0.02 19.03 30.11 33.52 17.33* A A 27 0.69 0.27 17.00 69.41* 4.82 8.78 A A 28 0.26 -0.01 17.56 26.06* 27.76 28.61 A A 29 0.39 0.12 6.23 39.38* 20.11 34.28 A A 30 0.28 0.01 8.50 28.33* 36.83 26.35 A A 31 0.18 -0.02 19.55 24.08 37.96 18.41* A A 32 0.20 0.03 22.44 45.74 20.17* 11.65 A A 33 0.37 0.16 25.78 36.83* 15.86 21.53 A A 34 0.41 0.14 20.68 24.65 41.36* 13.31 C- A 35 0.40 0.19 24.15 40.91* 17.90 16.76 B+ A 36 0.22 0.10 36.65 23.01 22.16* 18.18 A C- 37 0.38 0.20 38.46* 24.79 21.08 15.67 A A 38 0.58 0.32 11.40 6.27 59.26* 22.79 B- A 39 0.42 0.28 42.45* 14.25 15.38 27.64 A A 40 0.42 0.28 43.39* 17.82 14.37 24.14 A A
40
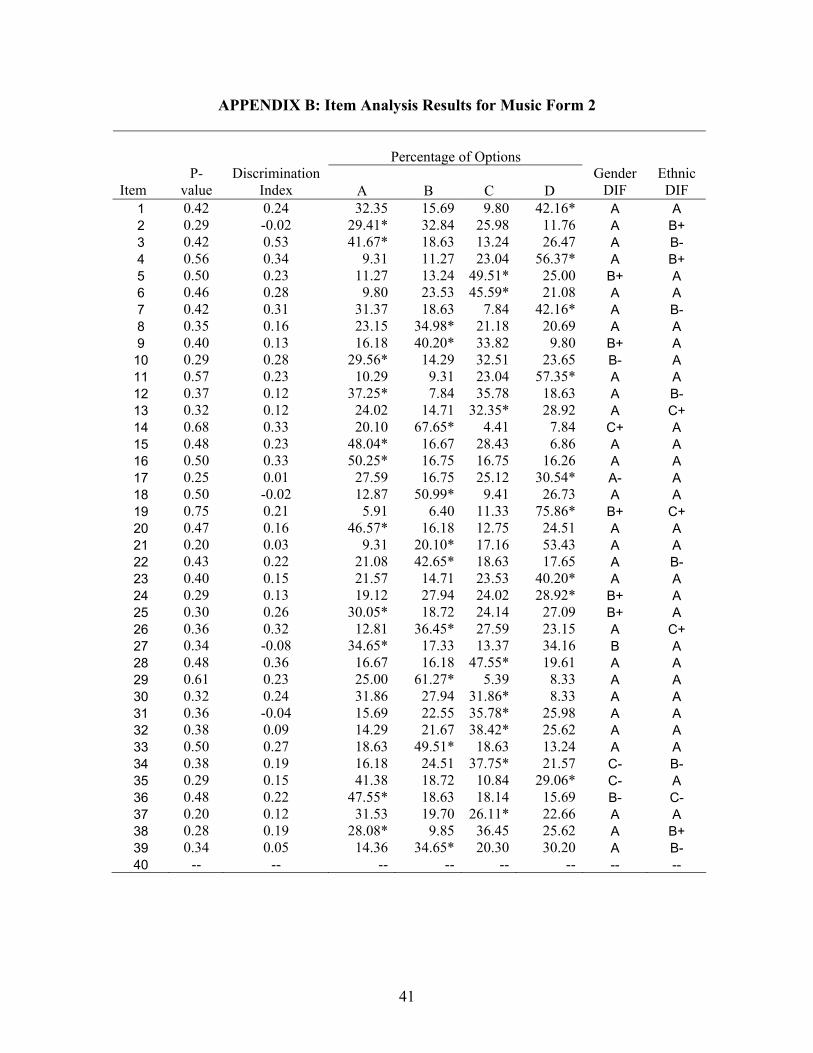
APPENDIX B: Item Analysis Results for Music Form 2
Percentage of Options Item
P-value
Discrimination Index A B C D
Gender DIF
Ethnic DIF
1 0.42 0.24 32.35 15.69 9.80 42.16* A A 2 0.29 -0.02 29.41* 32.84 25.98 11.76 A B+ 3 0.42 0.53 41.67* 18.63 13.24 26.47 A B- 4 0.56 0.34 9.31 11.27 23.04 56.37* A B+ 5 0.50 0.23 11.27 13.24 49.51* 25.00 B+ A 6 0.46 0.28 9.80 23.53 45.59* 21.08 A A 7 0.42 0.31 31.37 18.63 7.84 42.16* A B- 8 0.35 0.16 23.15 34.98* 21.18 20.69 A A 9 0.40 0.13 16.18 40.20* 33.82 9.80 B+ A
10 0.29 0.28 29.56* 14.29 32.51 23.65 B- A 11 0.57 0.23 10.29 9.31 23.04 57.35* A A 12 0.37 0.12 37.25* 7.84 35.78 18.63 A B- 13 0.32 0.12 24.02 14.71 32.35* 28.92 A C+ 14 0.68 0.33 20.10 67.65* 4.41 7.84 C+ A 15 0.48 0.23 48.04* 16.67 28.43 6.86 A A 16 0.50 0.33 50.25* 16.75 16.75 16.26 A A 17 0.25 0.01 27.59 16.75 25.12 30.54* A- A 18 0.50 -0.02 12.87 50.99* 9.41 26.73 A A 19 0.75 0.21 5.91 6.40 11.33 75.86* B+ C+ 20 0.47 0.16 46.57* 16.18 12.75 24.51 A A 21 0.20 0.03 9.31 20.10* 17.16 53.43 A A 22 0.43 0.22 21.08 42.65* 18.63 17.65 A B- 23 0.40 0.15 21.57 14.71 23.53 40.20* A A 24 0.29 0.13 19.12 27.94 24.02 28.92* B+ A 25 0.30 0.26 30.05* 18.72 24.14 27.09 B+ A 26 0.36 0.32 12.81 36.45* 27.59 23.15 A C+ 27 0.34 -0.08 34.65* 17.33 13.37 34.16 B A 28 0.48 0.36 16.67 16.18 47.55* 19.61 A A 29 0.61 0.23 25.00 61.27* 5.39 8.33 A A 30 0.32 0.24 31.86 27.94 31.86* 8.33 A A 31 0.36 -0.04 15.69 22.55 35.78* 25.98 A A 32 0.38 0.09 14.29 21.67 38.42* 25.62 A A 33 0.50 0.27 18.63 49.51* 18.63 13.24 A A 34 0.38 0.19 16.18 24.51 37.75* 21.57 C- B- 35 0.29 0.15 41.38 18.72 10.84 29.06* C- A 36 0.48 0.22 47.55* 18.63 18.14 15.69 B- C- 37 0.20 0.12 31.53 19.70 26.11* 22.66 A A 38 0.28 0.19 28.08* 9.85 36.45 25.62 A B+ 39 0.34 0.05 14.36 34.65* 20.30 30.20 A B- 40 -- -- -- -- -- -- -- --
41
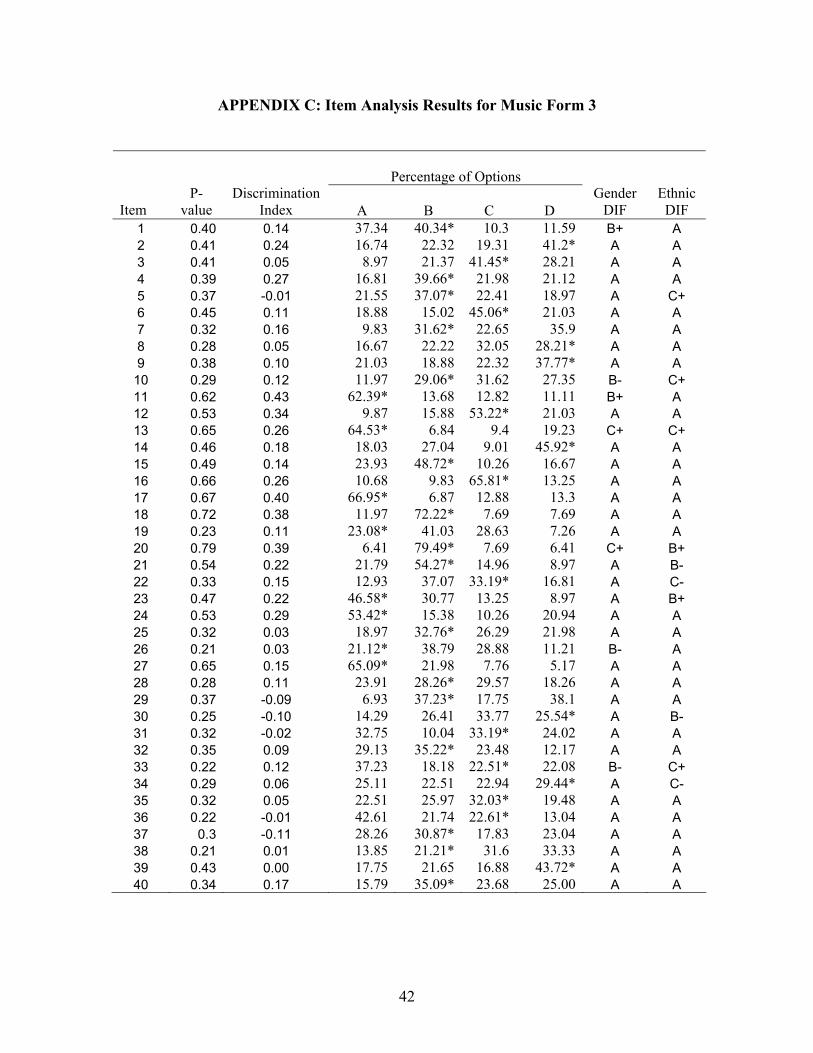
APPENDIX C: Item Analysis Results for Music Form 3
Percentage of Options Item
P-value
Discrimination Index A B C D
Gender DIF
Ethnic DIF
1 0.40 0.14 37.34 40.34* 10.3 11.59 B+ A 2 0.41 0.24 16.74 22.32 19.31 41.2* A A 3 0.41 0.05 8.97 21.37 41.45* 28.21 A A 4 0.39 0.27 16.81 39.66* 21.98 21.12 A A 5 0.37 -0.01 21.55 37.07* 22.41 18.97 A C+ 6 0.45 0.11 18.88 15.02 45.06* 21.03 A A 7 0.32 0.16 9.83 31.62* 22.65 35.9 A A 8 0.28 0.05 16.67 22.22 32.05 28.21* A A 9 0.38 0.10 21.03 18.88 22.32 37.77* A A
10 0.29 0.12 11.97 29.06* 31.62 27.35 B- C+ 11 0.62 0.43 62.39* 13.68 12.82 11.11 B+ A 12 0.53 0.34 9.87 15.88 53.22* 21.03 A A 13 0.65 0.26 64.53* 6.84 9.4 19.23 C+ C+ 14 0.46 0.18 18.03 27.04 9.01 45.92* A A 15 0.49 0.14 23.93 48.72* 10.26 16.67 A A 16 0.66 0.26 10.68 9.83 65.81* 13.25 A A 17 0.67 0.40 66.95* 6.87 12.88 13.3 A A 18 0.72 0.38 11.97 72.22* 7.69 7.69 A A 19 0.23 0.11 23.08* 41.03 28.63 7.26 A A 20 0.79 0.39 6.41 79.49* 7.69 6.41 C+ B+ 21 0.54 0.22 21.79 54.27* 14.96 8.97 A B- 22 0.33 0.15 12.93 37.07 33.19* 16.81 A C- 23 0.47 0.22 46.58* 30.77 13.25 8.97 A B+ 24 0.53 0.29 53.42* 15.38 10.26 20.94 A A 25 0.32 0.03 18.97 32.76* 26.29 21.98 A A 26 0.21 0.03 21.12* 38.79 28.88 11.21 B- A 27 0.65 0.15 65.09* 21.98 7.76 5.17 A A 28 0.28 0.11 23.91 28.26* 29.57 18.26 A A 29 0.37 -0.09 6.93 37.23* 17.75 38.1 A A 30 0.25 -0.10 14.29 26.41 33.77 25.54* A B- 31 0.32 -0.02 32.75 10.04 33.19* 24.02 A A 32 0.35 0.09 29.13 35.22* 23.48 12.17 A A 33 0.22 0.12 37.23 18.18 22.51* 22.08 B- C+ 34 0.29 0.06 25.11 22.51 22.94 29.44* A C- 35 0.32 0.05 22.51 25.97 32.03* 19.48 A A 36 0.22 -0.01 42.61 21.74 22.61* 13.04 A A 37 0.3 -0.11 28.26 30.87* 17.83 23.04 A A 38 0.21 0.01 13.85 21.21* 31.6 33.33 A A 39 0.43 0.00 17.75 21.65 16.88 43.72* A A 40 0.34 0.17 15.79 35.09* 23.68 25.00 A A
42
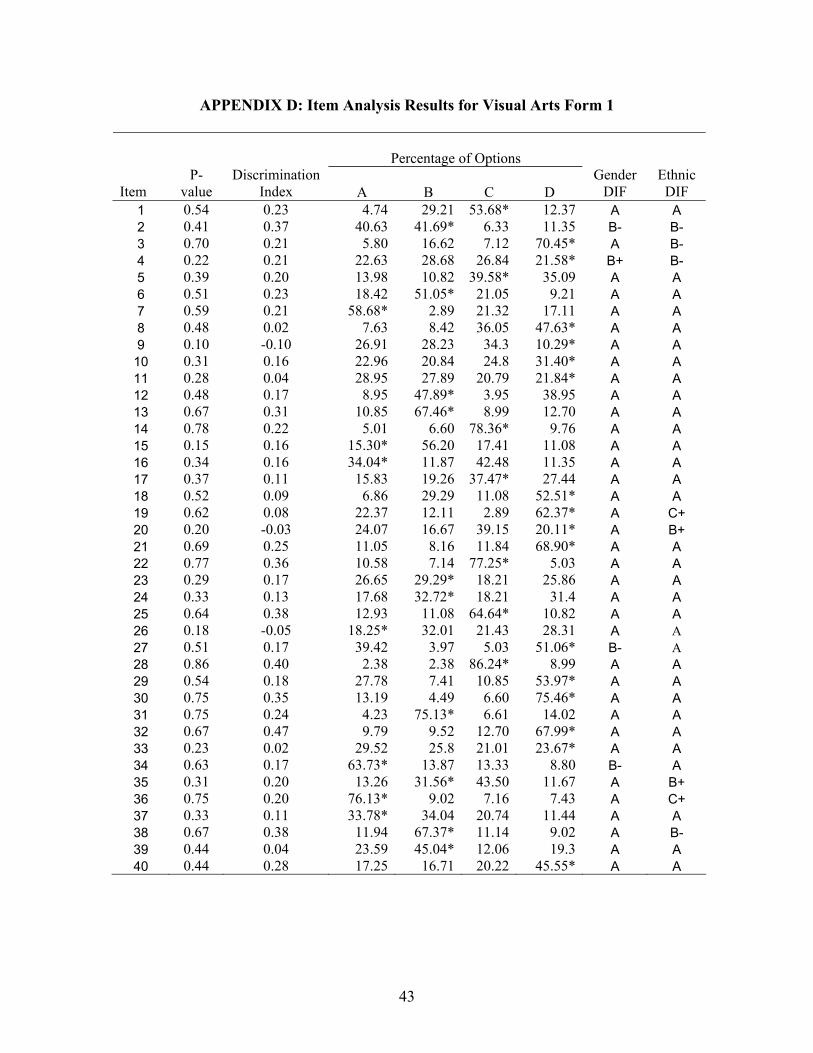
APPENDIX D: Item Analysis Results for Visual Arts Form 1
Percentage of Options Item
P-value
Discrimination Index A B C D
Gender DIF
Ethnic DIF
1 0.54 0.23 4.74 29.21 53.68* 12.37 A A 2 0.41 0.37 40.63 41.69* 6.33 11.35 B- B- 3 0.70 0.21 5.80 16.62 7.12 70.45* A B- 4 0.22 0.21 22.63 28.68 26.84 21.58* B+ B- 5 0.39 0.20 13.98 10.82 39.58* 35.09 A A 6 0.51 0.23 18.42 51.05* 21.05 9.21 A A 7 0.59 0.21 58.68* 2.89 21.32 17.11 A A 8 0.48 0.02 7.63 8.42 36.05 47.63* A A 9 0.10 -0.10 26.91 28.23 34.3 10.29* A A
10 0.31 0.16 22.96 20.84 24.8 31.40* A A 11 0.28 0.04 28.95 27.89 20.79 21.84* A A 12 0.48 0.17 8.95 47.89* 3.95 38.95 A A 13 0.67 0.31 10.85 67.46* 8.99 12.70 A A 14 0.78 0.22 5.01 6.60 78.36* 9.76 A A 15 0.15 0.16 15.30* 56.20 17.41 11.08 A A 16 0.34 0.16 34.04* 11.87 42.48 11.35 A A 17 0.37 0.11 15.83 19.26 37.47* 27.44 A A 18 0.52 0.09 6.86 29.29 11.08 52.51* A A 19 0.62 0.08 22.37 12.11 2.89 62.37* A C+ 20 0.20 -0.03 24.07 16.67 39.15 20.11* A B+ 21 0.69 0.25 11.05 8.16 11.84 68.90* A A 22 0.77 0.36 10.58 7.14 77.25* 5.03 A A 23 0.29 0.17 26.65 29.29* 18.21 25.86 A A 24 0.33 0.13 17.68 32.72* 18.21 31.4 A A 25 0.64 0.38 12.93 11.08 64.64* 10.82 A A 26 0.18 -0.05 18.25* 32.01 21.43 28.31 A A 27 0.51 0.17 39.42 3.97 5.03 51.06* B- A 28 0.86 0.40 2.38 2.38 86.24* 8.99 A A 29 0.54 0.18 27.78 7.41 10.85 53.97* A A 30 0.75 0.35 13.19 4.49 6.60 75.46* A A 31 0.75 0.24 4.23 75.13* 6.61 14.02 A A 32 0.67 0.47 9.79 9.52 12.70 67.99* A A 33 0.23 0.02 29.52 25.8 21.01 23.67* A A 34 0.63 0.17 63.73* 13.87 13.33 8.80 B- A 35 0.31 0.20 13.26 31.56* 43.50 11.67 A B+ 36 0.75 0.20 76.13* 9.02 7.16 7.43 A C+ 37 0.33 0.11 33.78* 34.04 20.74 11.44 A A 38 0.67 0.38 11.94 67.37* 11.14 9.02 A B- 39 0.44 0.04 23.59 45.04* 12.06 19.3 A A 40 0.44 0.28 17.25 16.71 20.22 45.55* A A
43
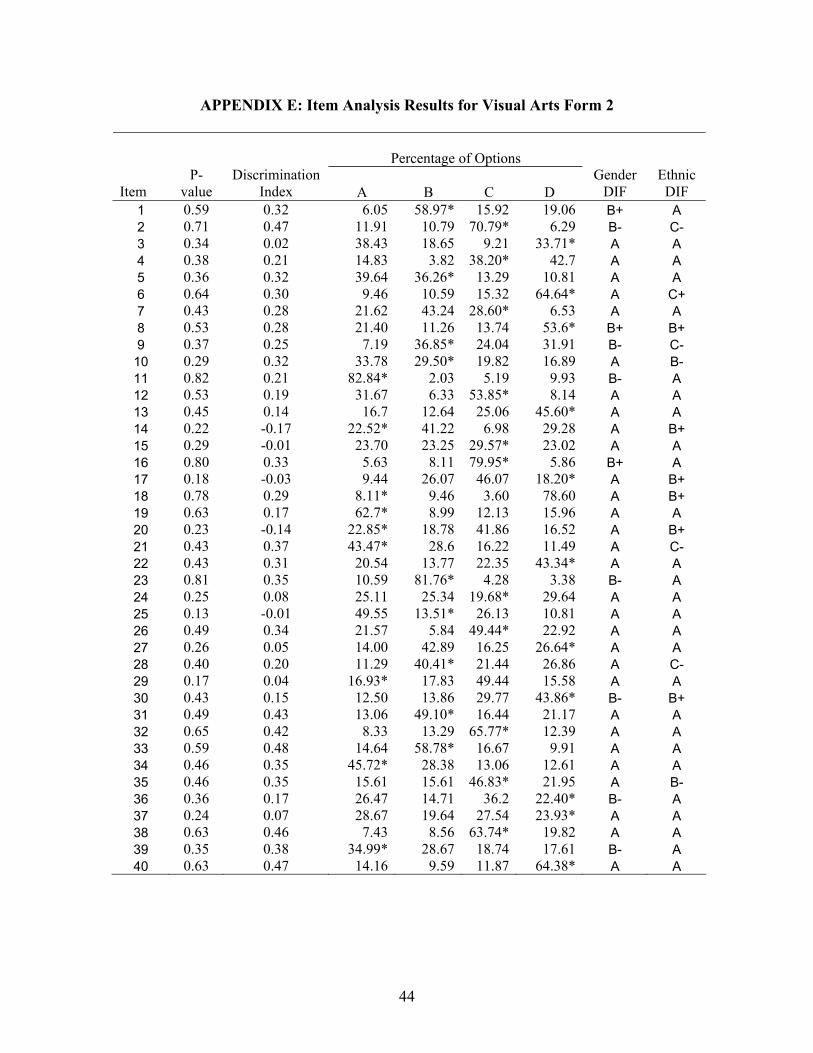
APPENDIX E: Item Analysis Results for Visual Arts Form 2
Percentage of Options Item
P-value
Discrimination Index A B C D
Gender DIF
Ethnic DIF
1 0.59 0.32 6.05 58.97* 15.92 19.06 B+ A 2 0.71 0.47 11.91 10.79 70.79* 6.29 B- C- 3 0.34 0.02 38.43 18.65 9.21 33.71* A A 4 0.38 0.21 14.83 3.82 38.20* 42.7 A A 5 0.36 0.32 39.64 36.26* 13.29 10.81 A A 6 0.64 0.30 9.46 10.59 15.32 64.64* A C+ 7 0.43 0.28 21.62 43.24 28.60* 6.53 A A 8 0.53 0.28 21.40 11.26 13.74 53.6* B+ B+ 9 0.37 0.25 7.19 36.85* 24.04 31.91 B- C-
10 0.29 0.32 33.78 29.50* 19.82 16.89 A B- 11 0.82 0.21 82.84* 2.03 5.19 9.93 B- A 12 0.53 0.19 31.67 6.33 53.85* 8.14 A A 13 0.45 0.14 16.7 12.64 25.06 45.60* A A 14 0.22 -0.17 22.52* 41.22 6.98 29.28 A B+ 15 0.29 -0.01 23.70 23.25 29.57* 23.02 A A 16 0.80 0.33 5.63 8.11 79.95* 5.86 B+ A 17 0.18 -0.03 9.44 26.07 46.07 18.20* A B+ 18 0.78 0.29 8.11* 9.46 3.60 78.60 A B+ 19 0.63 0.17 62.7* 8.99 12.13 15.96 A A 20 0.23 -0.14 22.85* 18.78 41.86 16.52 A B+ 21 0.43 0.37 43.47* 28.6 16.22 11.49 A C- 22 0.43 0.31 20.54 13.77 22.35 43.34* A A 23 0.81 0.35 10.59 81.76* 4.28 3.38 B- A 24 0.25 0.08 25.11 25.34 19.68* 29.64 A A 25 0.13 -0.01 49.55 13.51* 26.13 10.81 A A 26 0.49 0.34 21.57 5.84 49.44* 22.92 A A 27 0.26 0.05 14.00 42.89 16.25 26.64* A A 28 0.40 0.20 11.29 40.41* 21.44 26.86 A C- 29 0.17 0.04 16.93* 17.83 49.44 15.58 A A 30 0.43 0.15 12.50 13.86 29.77 43.86* B- B+ 31 0.49 0.43 13.06 49.10* 16.44 21.17 A A 32 0.65 0.42 8.33 13.29 65.77* 12.39 A A 33 0.59 0.48 14.64 58.78* 16.67 9.91 A A 34 0.46 0.35 45.72* 28.38 13.06 12.61 A A 35 0.46 0.35 15.61 15.61 46.83* 21.95 A B- 36 0.36 0.17 26.47 14.71 36.2 22.40* B- A 37 0.24 0.07 28.67 19.64 27.54 23.93* A A 38 0.63 0.46 7.43 8.56 63.74* 19.82 A A 39 0.35 0.38 34.99* 28.67 18.74 17.61 B- A 40 0.63 0.47 14.16 9.59 11.87 64.38* A A
44
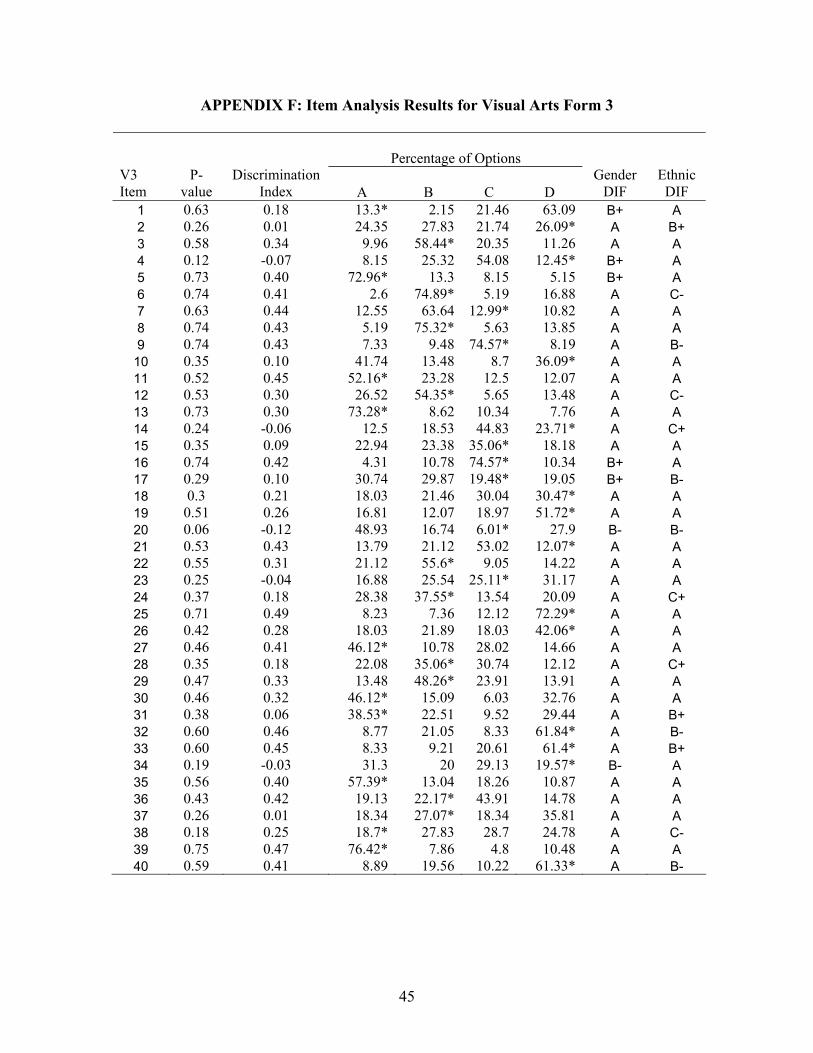
APPENDIX F: Item Analysis Results for Visual Arts Form 3
Percentage of Options V3 Item
P-value
Discrimination Index A B C D
Gender DIF
Ethnic DIF
1 0.63 0.18 13.3* 2.15 21.46 63.09 B+ A 2 0.26 0.01 24.35 27.83 21.74 26.09* A B+ 3 0.58 0.34 9.96 58.44* 20.35 11.26 A A 4 0.12 -0.07 8.15 25.32 54.08 12.45* B+ A 5 0.73 0.40 72.96* 13.3 8.15 5.15 B+ A 6 0.74 0.41 2.6 74.89* 5.19 16.88 A C- 7 0.63 0.44 12.55 63.64 12.99* 10.82 A A 8 0.74 0.43 5.19 75.32* 5.63 13.85 A A 9 0.74 0.43 7.33 9.48 74.57* 8.19 A B-
10 0.35 0.10 41.74 13.48 8.7 36.09* A A 11 0.52 0.45 52.16* 23.28 12.5 12.07 A A 12 0.53 0.30 26.52 54.35* 5.65 13.48 A C- 13 0.73 0.30 73.28* 8.62 10.34 7.76 A A 14 0.24 -0.06 12.5 18.53 44.83 23.71* A C+ 15 0.35 0.09 22.94 23.38 35.06* 18.18 A A 16 0.74 0.42 4.31 10.78 74.57* 10.34 B+ A 17 0.29 0.10 30.74 29.87 19.48* 19.05 B+ B- 18 0.3 0.21 18.03 21.46 30.04 30.47* A A 19 0.51 0.26 16.81 12.07 18.97 51.72* A A 20 0.06 -0.12 48.93 16.74 6.01* 27.9 B- B- 21 0.53 0.43 13.79 21.12 53.02 12.07* A A 22 0.55 0.31 21.12 55.6* 9.05 14.22 A A 23 0.25 -0.04 16.88 25.54 25.11* 31.17 A A 24 0.37 0.18 28.38 37.55* 13.54 20.09 A C+ 25 0.71 0.49 8.23 7.36 12.12 72.29* A A 26 0.42 0.28 18.03 21.89 18.03 42.06* A A 27 0.46 0.41 46.12* 10.78 28.02 14.66 A A 28 0.35 0.18 22.08 35.06* 30.74 12.12 A C+ 29 0.47 0.33 13.48 48.26* 23.91 13.91 A A 30 0.46 0.32 46.12* 15.09 6.03 32.76 A A 31 0.38 0.06 38.53* 22.51 9.52 29.44 A B+ 32 0.60 0.46 8.77 21.05 8.33 61.84* A B- 33 0.60 0.45 8.33 9.21 20.61 61.4* A B+ 34 0.19 -0.03 31.3 20 29.13 19.57* B- A 35 0.56 0.40 57.39* 13.04 18.26 10.87 A A 36 0.43 0.42 19.13 22.17* 43.91 14.78 A A 37 0.26 0.01 18.34 27.07* 18.34 35.81 A A 38 0.18 0.25 18.7* 27.83 28.7 24.78 A C- 39 0.75 0.47 76.42* 7.86 4.8 10.48 A A 40 0.59 0.41 8.89 19.56 10.22 61.33* A B-
45
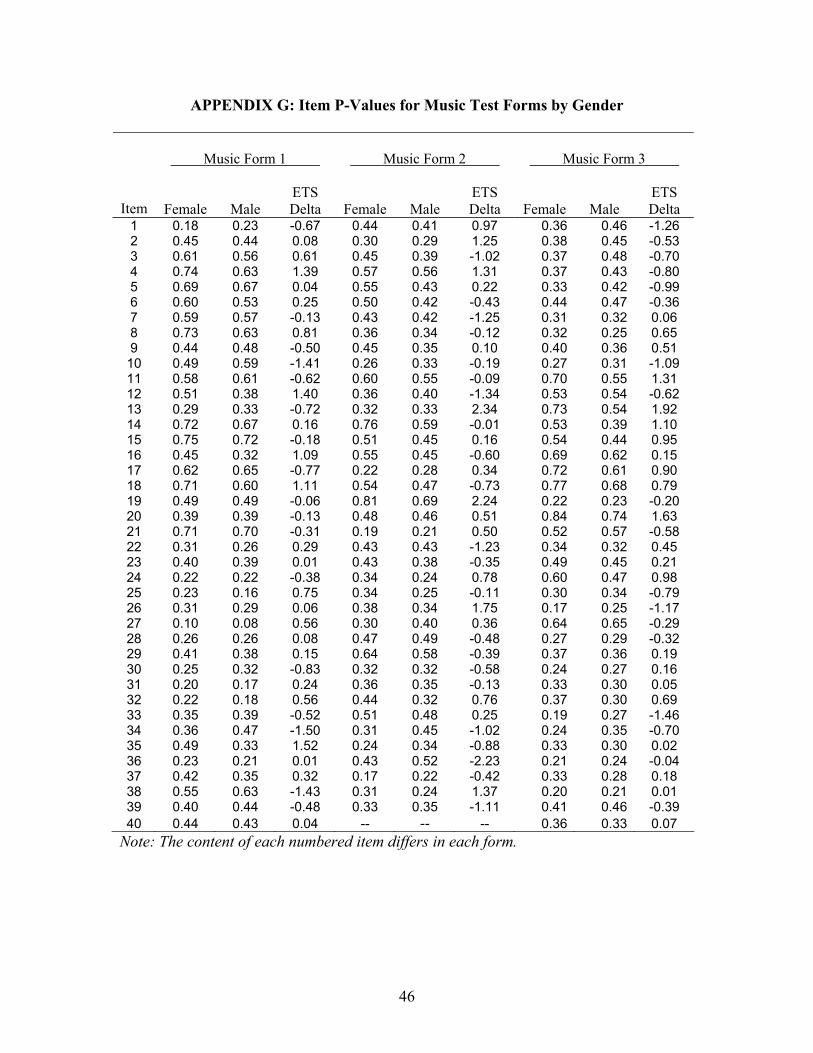
APPENDIX G: Item P-Values for Music Test Forms by Gender
Music Form 1 . Music Form 2 . Music Form 3 .
Item Female Male
ETS Delta Female Male
ETS Delta Female Male
ETS Delta
1 0.18 0.23 -0.67 0.44 0.41 0.97 0.36 0.46 -1.26 2 0.45 0.44 0.08 0.30 0.29 1.25 0.38 0.45 -0.53 3 0.61 0.56 0.61 0.45 0.39 -1.02 0.37 0.48 -0.70 4 0.74 0.63 1.39 0.57 0.56 1.31 0.37 0.43 -0.80 5 0.69 0.67 0.04 0.55 0.43 0.22 0.33 0.42 -0.99 6 0.60 0.53 0.25 0.50 0.42 -0.43 0.44 0.47 -0.36 7 0.59 0.57 -0.13 0.43 0.42 -1.25 0.31 0.32 0.06 8 0.73 0.63 0.81 0.36 0.34 -0.12 0.32 0.25 0.65 9 0.44 0.48 -0.50 0.45 0.35 0.10 0.40 0.36 0.51 10 0.49 0.59 -1.41 0.26 0.33 -0.19 0.27 0.31 -1.09 11 0.58 0.61 -0.62 0.60 0.55 -0.09 0.70 0.55 1.31 12 0.51 0.38 1.40 0.36 0.40 -1.34 0.53 0.54 -0.62 13 0.29 0.33 -0.72 0.32 0.33 2.34 0.73 0.54 1.92 14 0.72 0.67 0.16 0.76 0.59 -0.01 0.53 0.39 1.10 15 0.75 0.72 -0.18 0.51 0.45 0.16 0.54 0.44 0.95 16 0.45 0.32 1.09 0.55 0.45 -0.60 0.69 0.62 0.15 17 0.62 0.65 -0.77 0.22 0.28 0.34 0.72 0.61 0.90 18 0.71 0.60 1.11 0.54 0.47 -0.73 0.77 0.68 0.79 19 0.49 0.49 -0.06 0.81 0.69 2.24 0.22 0.23 -0.20 20 0.39 0.39 -0.13 0.48 0.46 0.51 0.84 0.74 1.63 21 0.71 0.70 -0.31 0.19 0.21 0.50 0.52 0.57 -0.58 22 0.31 0.26 0.29 0.43 0.43 -1.23 0.34 0.32 0.45 23 0.40 0.39 0.01 0.43 0.38 -0.35 0.49 0.45 0.21 24 0.22 0.22 -0.38 0.34 0.24 0.78 0.60 0.47 0.98 25 0.23 0.16 0.75 0.34 0.25 -0.11 0.30 0.34 -0.79 26 0.31 0.29 0.06 0.38 0.34 1.75 0.17 0.25 -1.17 27 0.10 0.08 0.56 0.30 0.40 0.36 0.64 0.65 -0.29 28 0.26 0.26 0.08 0.47 0.49 -0.48 0.27 0.29 -0.32 29 0.41 0.38 0.15 0.64 0.58 -0.39 0.37 0.36 0.19 30 0.25 0.32 -0.83 0.32 0.32 -0.58 0.24 0.27 0.16 31 0.20 0.17 0.24 0.36 0.35 -0.13 0.33 0.30 0.05 32 0.22 0.18 0.56 0.44 0.32 0.76 0.37 0.30 0.69 33 0.35 0.39 -0.52 0.51 0.48 0.25 0.19 0.27 -1.46 34 0.36 0.47 -1.50 0.31 0.45 -1.02 0.24 0.35 -0.70 35 0.49 0.33 1.52 0.24 0.34 -0.88 0.33 0.30 0.02 36 0.23 0.21 0.01 0.43 0.52 -2.23 0.21 0.24 -0.04 37 0.42 0.35 0.32 0.17 0.22 -0.42 0.33 0.28 0.18 38 0.55 0.63 -1.43 0.31 0.24 1.37 0.20 0.21 0.01 39 0.40 0.44 -0.48 0.33 0.35 -1.11 0.41 0.46 -0.39 40 0.44 0.43 0.04 -- -- -- 0.36 0.33 0.07
Note: The content of each numbered item differs in each form.
46
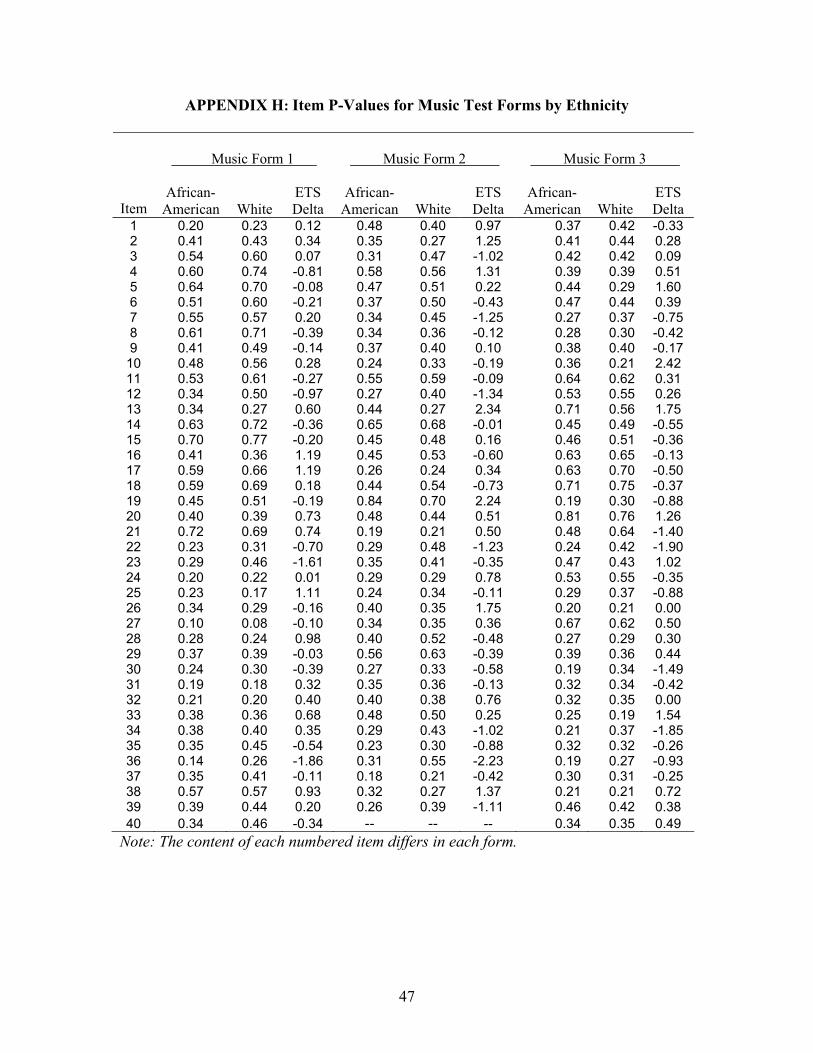
APPENDIX H: Item P-Values for Music Test Forms by Ethnicity
Music Form 1 . Music Form 2 . Music Form 3 .
Item African-
American White
ETS Delta
African-American White
ETS Delta
African-American White
ETS Delta
1 0.20 0.23 0.12 0.48 0.40 0.97 0.37 0.42 -0.33 2 0.41 0.43 0.34 0.35 0.27 1.25 0.41 0.44 0.28 3 0.54 0.60 0.07 0.31 0.47 -1.02 0.42 0.42 0.09 4 0.60 0.74 -0.81 0.58 0.56 1.31 0.39 0.39 0.51 5 0.64 0.70 -0.08 0.47 0.51 0.22 0.44 0.29 1.60 6 0.51 0.60 -0.21 0.37 0.50 -0.43 0.47 0.44 0.39 7 0.55 0.57 0.20 0.34 0.45 -1.25 0.27 0.37 -0.75 8 0.61 0.71 -0.39 0.34 0.36 -0.12 0.28 0.30 -0.42 9 0.41 0.49 -0.14 0.37 0.40 0.10 0.38 0.40 -0.17
10 0.48 0.56 0.28 0.24 0.33 -0.19 0.36 0.21 2.42 11 0.53 0.61 -0.27 0.55 0.59 -0.09 0.64 0.62 0.31 12 0.34 0.50 -0.97 0.27 0.40 -1.34 0.53 0.55 0.26 13 0.34 0.27 0.60 0.44 0.27 2.34 0.71 0.56 1.75 14 0.63 0.72 -0.36 0.65 0.68 -0.01 0.45 0.49 -0.55 15 0.70 0.77 -0.20 0.45 0.48 0.16 0.46 0.51 -0.36 16 0.41 0.36 1.19 0.45 0.53 -0.60 0.63 0.65 -0.13 17 0.59 0.66 1.19 0.26 0.24 0.34 0.63 0.70 -0.50 18 0.59 0.69 0.18 0.44 0.54 -0.73 0.71 0.75 -0.37 19 0.45 0.51 -0.19 0.84 0.70 2.24 0.19 0.30 -0.88 20 0.40 0.39 0.73 0.48 0.44 0.51 0.81 0.76 1.26 21 0.72 0.69 0.74 0.19 0.21 0.50 0.48 0.64 -1.40 22 0.23 0.31 -0.70 0.29 0.48 -1.23 0.24 0.42 -1.90 23 0.29 0.46 -1.61 0.35 0.41 -0.35 0.47 0.43 1.02 24 0.20 0.22 0.01 0.29 0.29 0.78 0.53 0.55 -0.35 25 0.23 0.17 1.11 0.24 0.34 -0.11 0.29 0.37 -0.88 26 0.34 0.29 -0.16 0.40 0.35 1.75 0.20 0.21 0.00 27 0.10 0.08 -0.10 0.34 0.35 0.36 0.67 0.62 0.50 28 0.28 0.24 0.98 0.40 0.52 -0.48 0.27 0.29 0.30 29 0.37 0.39 -0.03 0.56 0.63 -0.39 0.39 0.36 0.44 30 0.24 0.30 -0.39 0.27 0.33 -0.58 0.19 0.34 -1.49 31 0.19 0.18 0.32 0.35 0.36 -0.13 0.32 0.34 -0.42 32 0.21 0.20 0.40 0.40 0.38 0.76 0.32 0.35 0.00 33 0.38 0.36 0.68 0.48 0.50 0.25 0.25 0.19 1.54 34 0.38 0.40 0.35 0.29 0.43 -1.02 0.21 0.37 -1.85 35 0.35 0.45 -0.54 0.23 0.30 -0.88 0.32 0.32 -0.26 36 0.14 0.26 -1.86 0.31 0.55 -2.23 0.19 0.27 -0.93 37 0.35 0.41 -0.11 0.18 0.21 -0.42 0.30 0.31 -0.25 38 0.57 0.57 0.93 0.32 0.27 1.37 0.21 0.21 0.72 39 0.39 0.44 0.20 0.26 0.39 -1.11 0.46 0.42 0.38 40 0.34 0.46 -0.34 -- -- -- 0.34 0.35 0.49
Note: The content of each numbered item differs in each form.
47
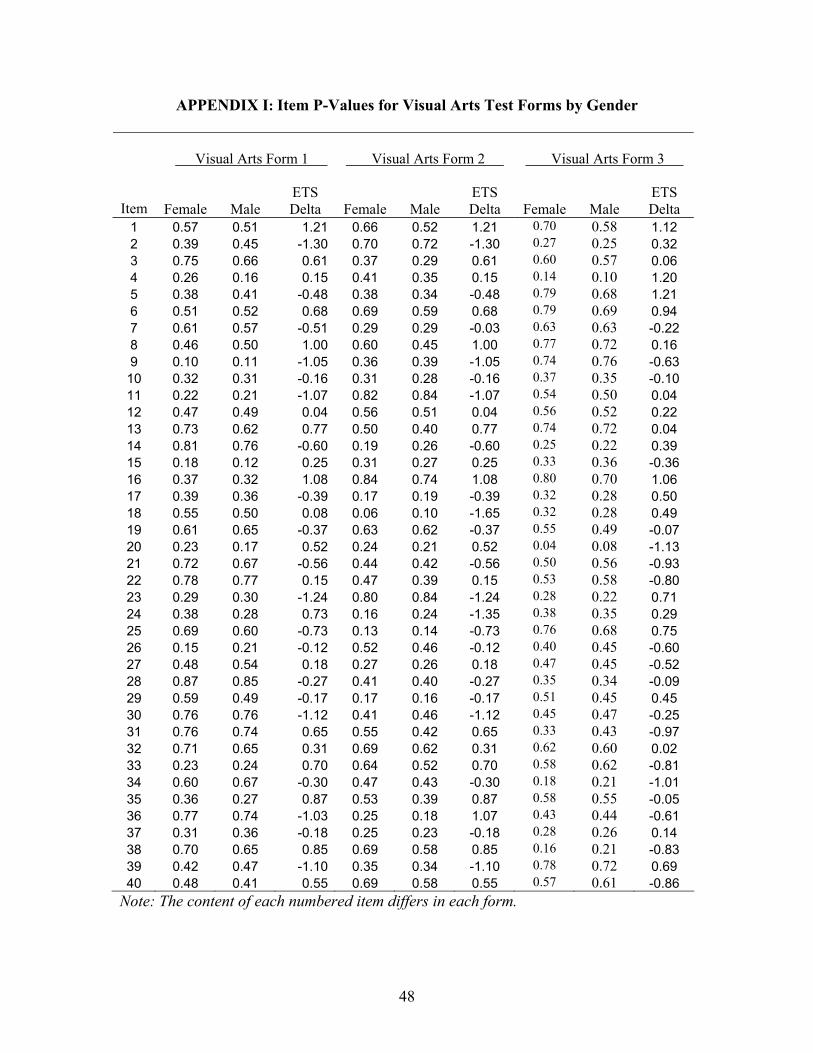
APPENDIX I: Item P-Values for Visual Arts Test Forms by Gender
Visual Arts Form 1 . Visual Arts Form 2 . Visual Arts Form 3 .
Item Female Male
ETS Delta Female Male
ETS Delta Female Male
ETS Delta
1 0.57 0.51 1.21 0.66 0.52 1.21 0.70 0.58 1.12 2 0.39 0.45 -1.30 0.70 0.72 -1.30 0.27 0.25 0.32 3 0.75 0.66 0.61 0.37 0.29 0.61 0.60 0.57 0.06 4 0.26 0.16 0.15 0.41 0.35 0.15 0.14 0.10 1.20 5 0.38 0.41 -0.48 0.38 0.34 -0.48 0.79 0.68 1.21 6 0.51 0.52 0.68 0.69 0.59 0.68 0.79 0.69 0.94 7 0.61 0.57 -0.51 0.29 0.29 -0.03 0.63 0.63 -0.22 8 0.46 0.50 1.00 0.60 0.45 1.00 0.77 0.72 0.16 9 0.10 0.11 -1.05 0.36 0.39 -1.05 0.74 0.76 -0.63 10 0.32 0.31 -0.16 0.31 0.28 -0.16 0.37 0.35 -0.10 11 0.22 0.21 -1.07 0.82 0.84 -1.07 0.54 0.50 0.04 12 0.47 0.49 0.04 0.56 0.51 0.04 0.56 0.52 0.22 13 0.73 0.62 0.77 0.50 0.40 0.77 0.74 0.72 0.04 14 0.81 0.76 -0.60 0.19 0.26 -0.60 0.25 0.22 0.39 15 0.18 0.12 0.25 0.31 0.27 0.25 0.33 0.36 -0.36 16 0.37 0.32 1.08 0.84 0.74 1.08 0.80 0.70 1.06 17 0.39 0.36 -0.39 0.17 0.19 -0.39 0.32 0.28 0.50 18 0.55 0.50 0.08 0.06 0.10 -1.65 0.32 0.28 0.49 19 0.61 0.65 -0.37 0.63 0.62 -0.37 0.55 0.49 -0.07 20 0.23 0.17 0.52 0.24 0.21 0.52 0.04 0.08 -1.13 21 0.72 0.67 -0.56 0.44 0.42 -0.56 0.50 0.56 -0.93 22 0.78 0.77 0.15 0.47 0.39 0.15 0.53 0.58 -0.80 23 0.29 0.30 -1.24 0.80 0.84 -1.24 0.28 0.22 0.71 24 0.38 0.28 0.73 0.16 0.24 -1.35 0.38 0.35 0.29 25 0.69 0.60 -0.73 0.13 0.14 -0.73 0.76 0.68 0.75 26 0.15 0.21 -0.12 0.52 0.46 -0.12 0.40 0.45 -0.60 27 0.48 0.54 0.18 0.27 0.26 0.18 0.47 0.45 -0.52 28 0.87 0.85 -0.27 0.41 0.40 -0.27 0.35 0.34 -0.09 29 0.59 0.49 -0.17 0.17 0.16 -0.17 0.51 0.45 0.45 30 0.76 0.76 -1.12 0.41 0.46 -1.12 0.45 0.47 -0.25 31 0.76 0.74 0.65 0.55 0.42 0.65 0.33 0.43 -0.97 32 0.71 0.65 0.31 0.69 0.62 0.31 0.62 0.60 0.02 33 0.23 0.24 0.70 0.64 0.52 0.70 0.58 0.62 -0.81 34 0.60 0.67 -0.30 0.47 0.43 -0.30 0.18 0.21 -1.01 35 0.36 0.27 0.87 0.53 0.39 0.87 0.58 0.55 -0.05 36 0.77 0.74 -1.03 0.25 0.18 1.07 0.43 0.44 -0.61 37 0.31 0.36 -0.18 0.25 0.23 -0.18 0.28 0.26 0.14 38 0.70 0.65 0.85 0.69 0.58 0.85 0.16 0.21 -0.83 39 0.42 0.47 -1.10 0.35 0.34 -1.10 0.78 0.72 0.69 40 0.48 0.41 0.55 0.69 0.58 0.55 0.57 0.61 -0.86
Note: The content of each numbered item differs in each form.
48
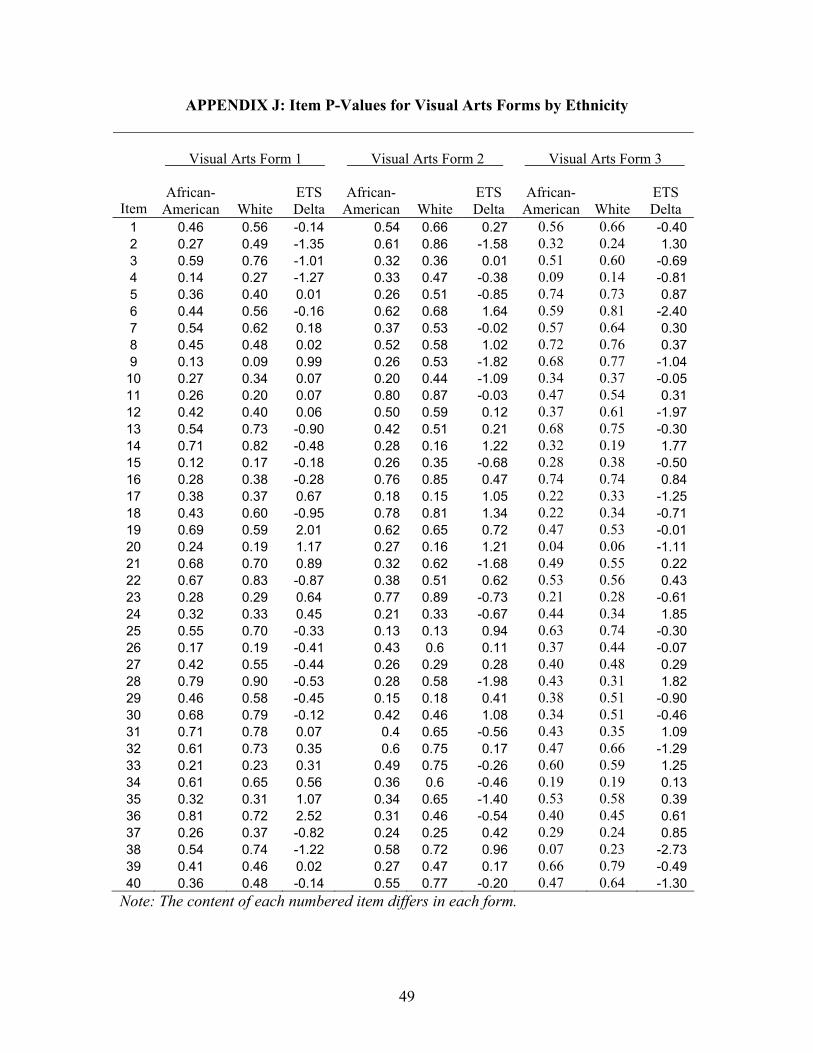
APPENDIX J: Item P-Values for Visual Arts Forms by Ethnicity
Visual Arts Form 1 . Visual Arts Form 2 . Visual Arts Form 3 .
Item
African-
American White ETS Delta
African-American White
ETS Delta
African-American White
ETS Delta
1 0.46 0.56 -0.14 0.54 0.66 0.27 0.56 0.66 -0.402 0.27 0.49 -1.35 0.61 0.86 -1.58 0.32 0.24 1.303 0.59 0.76 -1.01 0.32 0.36 0.01 0.51 0.60 -0.694 0.14 0.27 -1.27 0.33 0.47 -0.38 0.09 0.14 -0.815 0.36 0.40 0.01 0.26 0.51 -0.85 0.74 0.73 0.876 0.44 0.56 -0.16 0.62 0.68 1.64 0.59 0.81 -2.407 0.54 0.62 0.18 0.37 0.53 -0.02 0.57 0.64 0.308 0.45 0.48 0.02 0.52 0.58 1.02 0.72 0.76 0.379 0.13 0.09 0.99 0.26 0.53 -1.82 0.68 0.77 -1.04
10 0.27 0.34 0.07 0.20 0.44 -1.09 0.34 0.37 -0.0511 0.26 0.20 0.07 0.80 0.87 -0.03 0.47 0.54 0.3112 0.42 0.40 0.06 0.50 0.59 0.12 0.37 0.61 -1.9713 0.54 0.73 -0.90 0.42 0.51 0.21 0.68 0.75 -0.3014 0.71 0.82 -0.48 0.28 0.16 1.22 0.32 0.19 1.7715 0.12 0.17 -0.18 0.26 0.35 -0.68 0.28 0.38 -0.5016 0.28 0.38 -0.28 0.76 0.85 0.47 0.74 0.74 0.8417 0.38 0.37 0.67 0.18 0.15 1.05 0.22 0.33 -1.2518 0.43 0.60 -0.95 0.78 0.81 1.34 0.22 0.34 -0.7119 0.69 0.59 2.01 0.62 0.65 0.72 0.47 0.53 -0.0120 0.24 0.19 1.17 0.27 0.16 1.21 0.04 0.06 -1.1121 0.68 0.70 0.89 0.32 0.62 -1.68 0.49 0.55 0.2222 0.67 0.83 -0.87 0.38 0.51 0.62 0.53 0.56 0.4323 0.28 0.29 0.64 0.77 0.89 -0.73 0.21 0.28 -0.6124 0.32 0.33 0.45 0.21 0.33 -0.67 0.44 0.34 1.8525 0.55 0.70 -0.33 0.13 0.13 0.94 0.63 0.74 -0.3026 0.17 0.19 -0.41 0.43 0.6 0.11 0.37 0.44 -0.0727 0.42 0.55 -0.44 0.26 0.29 0.28 0.40 0.48 0.2928 0.79 0.90 -0.53 0.28 0.58 -1.98 0.43 0.31 1.8229 0.46 0.58 -0.45 0.15 0.18 0.41 0.38 0.51 -0.9030 0.68 0.79 -0.12 0.42 0.46 1.08 0.34 0.51 -0.4631 0.71 0.78 0.07 0.4 0.65 -0.56 0.43 0.35 1.0932 0.61 0.73 0.35 0.6 0.75 0.17 0.47 0.66 -1.2933 0.21 0.23 0.31 0.49 0.75 -0.26 0.60 0.59 1.2534 0.61 0.65 0.56 0.36 0.6 -0.46 0.19 0.19 0.1335 0.32 0.31 1.07 0.34 0.65 -1.40 0.53 0.58 0.3936 0.81 0.72 2.52 0.31 0.46 -0.54 0.40 0.45 0.6137 0.26 0.37 -0.82 0.24 0.25 0.42 0.29 0.24 0.8538 0.54 0.74 -1.22 0.58 0.72 0.96 0.07 0.23 -2.7339 0.41 0.46 0.02 0.27 0.47 0.17 0.66 0.79 -0.4940 0.36 0.48 -0.14 0.55 0.77 -0.20 0.47 0.64 -1.30
Note: The content of each numbered item differs in each form.
49
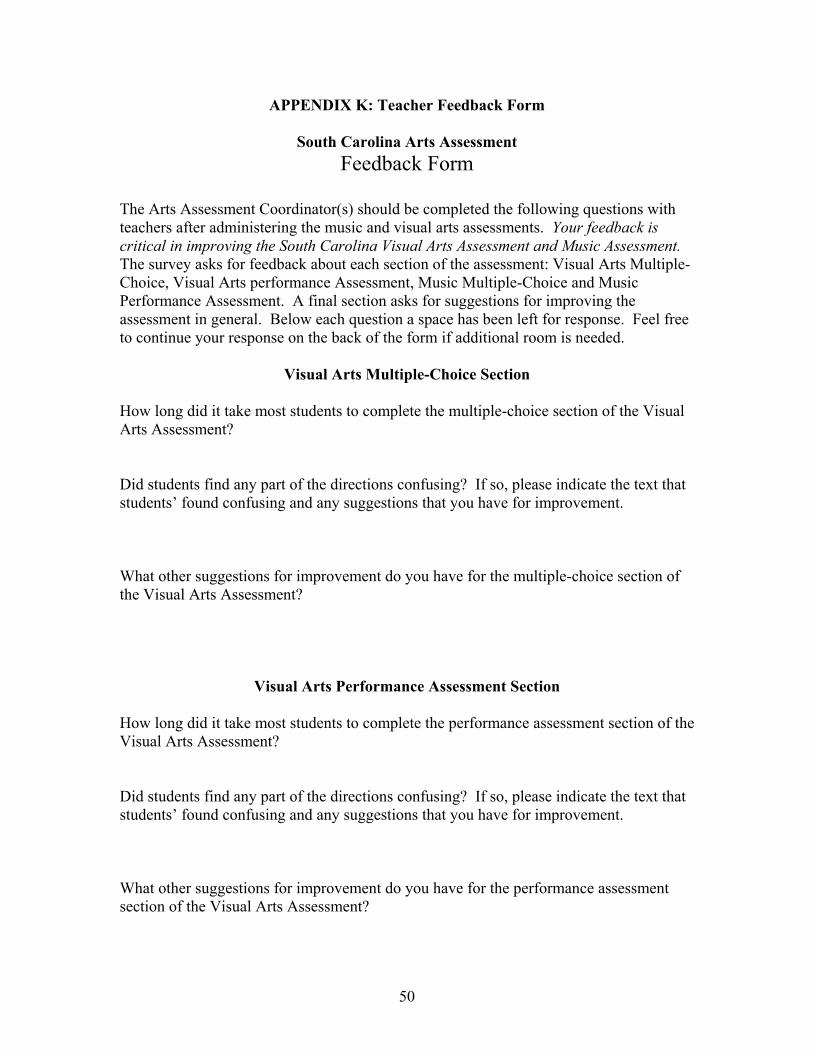
APPENDIX K: Teacher Feedback Form
South Carolina Arts Assessment Feedback Form
The Arts Assessment Coordinator(s) should be completed the following questions with teachers after administering the music and visual arts assessments. Your feedback is critical in improving the South Carolina Visual Arts Assessment and Music Assessment. The survey asks for feedback about each section of the assessment: Visual Arts Multiple-Choice, Visual Arts performance Assessment, Music Multiple-Choice and Music Performance Assessment. A final section asks for suggestions for improving the assessment in general. Below each question a space has been left for response. Feel free to continue your response on the back of the form if additional room is needed.
Visual Arts Multiple-Choice Section How long did it take most students to complete the multiple-choice section of the Visual Arts Assessment? Did students find any part of the directions confusing? If so, please indicate the text that students’ found confusing and any suggestions that you have for improvement. What other suggestions for improvement do you have for the multiple-choice section of the Visual Arts Assessment?
Visual Arts Performance Assessment Section
How long did it take most students to complete the performance assessment section of the Visual Arts Assessment? Did students find any part of the directions confusing? If so, please indicate the text that students’ found confusing and any suggestions that you have for improvement. What other suggestions for improvement do you have for the performance assessment section of the Visual Arts Assessment?
50
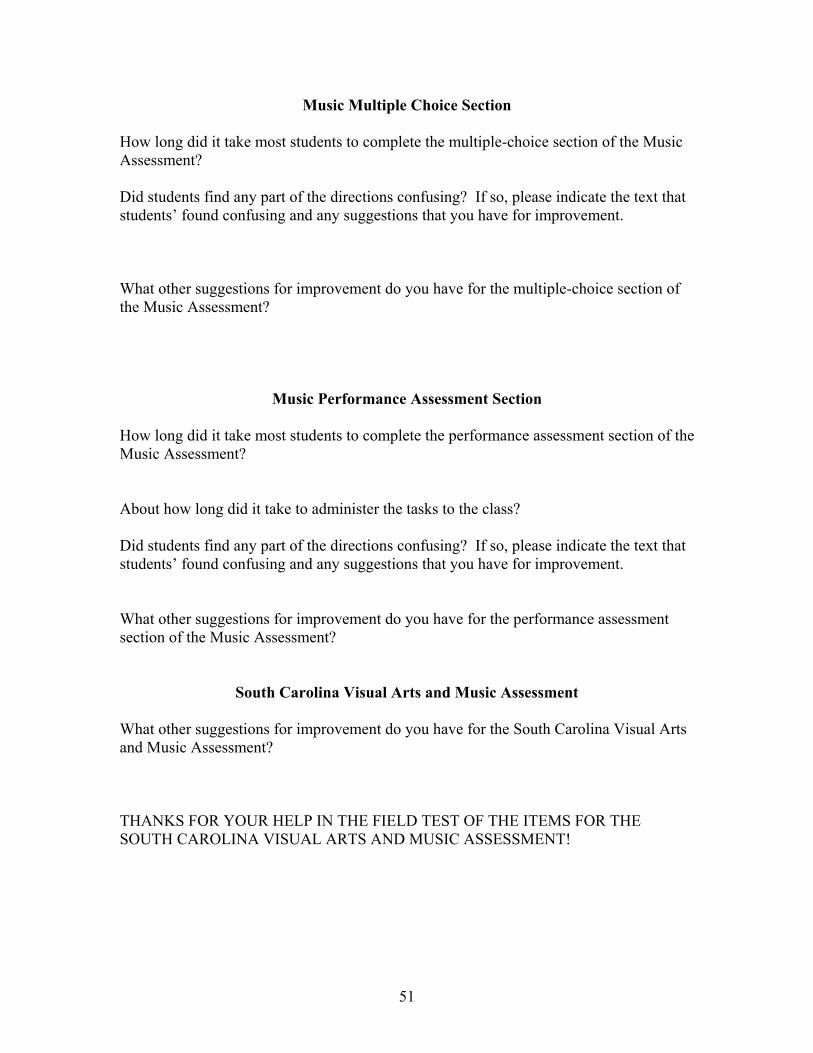
Music Multiple Choice Section How long did it take most students to complete the multiple-choice section of the Music Assessment? Did students find any part of the directions confusing? If so, please indicate the text that students’ found confusing and any suggestions that you have for improvement. What other suggestions for improvement do you have for the multiple-choice section of the Music Assessment?
Music Performance Assessment Section How long did it take most students to complete the performance assessment section of the Music Assessment? About how long did it take to administer the tasks to the class? Did students find any part of the directions confusing? If so, please indicate the text that students’ found confusing and any suggestions that you have for improvement. What other suggestions for improvement do you have for the performance assessment section of the Music Assessment?
South Carolina Visual Arts and Music Assessment What other suggestions for improvement do you have for the South Carolina Visual Arts and Music Assessment? THANKS FOR YOUR HELP IN THE FIELD TEST OF THE ITEMS FOR THE SOUTH CAROLINA VISUAL ARTS AND MUSIC ASSESSMENT!
51
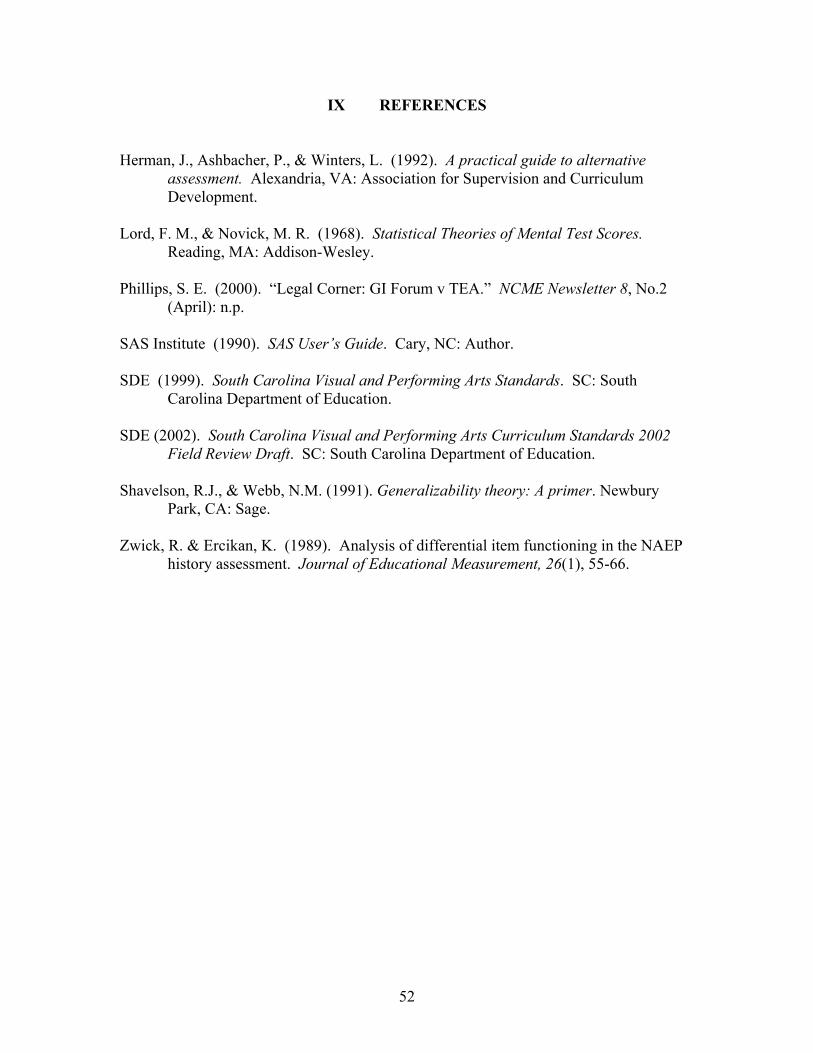
52
IX REFERENCES Herman, J., Ashbacher, P., & Winters, L. (1992). A practical guide to alternative
assessment. Alexandria, VA: Association for Supervision and Curriculum Development.
Lord, F. M., & Novick, M. R. (1968). Statistical Theories of Mental Test Scores.
Reading, MA: Addison-Wesley. Phillips, S. E. (2000). “Legal Corner: GI Forum v TEA.” NCME Newsletter 8, No.2
(April): n.p. SAS Institute (1990). SAS User’s Guide. Cary, NC: Author. SDE (1999). South Carolina Visual and Performing Arts Standards. SC: South
Carolina Department of Education. SDE (2002). South Carolina Visual and Performing Arts Curriculum Standards 2002
Field Review Draft. SC: South Carolina Department of Education. Shavelson, R.J., & Webb, N.M. (1991). Generalizability theory: A primer. Newbury
Park, CA: Sage. Zwick, R. & Ercikan, K. (1989). Analysis of differential item functioning in the NAEP
history assessment. Journal of Educational Measurement, 26(1), 55-66.